
The Effect of Magnitude Mw and Distance Rrup on the Fragility Assessment of a Multistory RC Frame Due to Earthquake-Induced Structural Pounding

Abstract
:1. Introduction
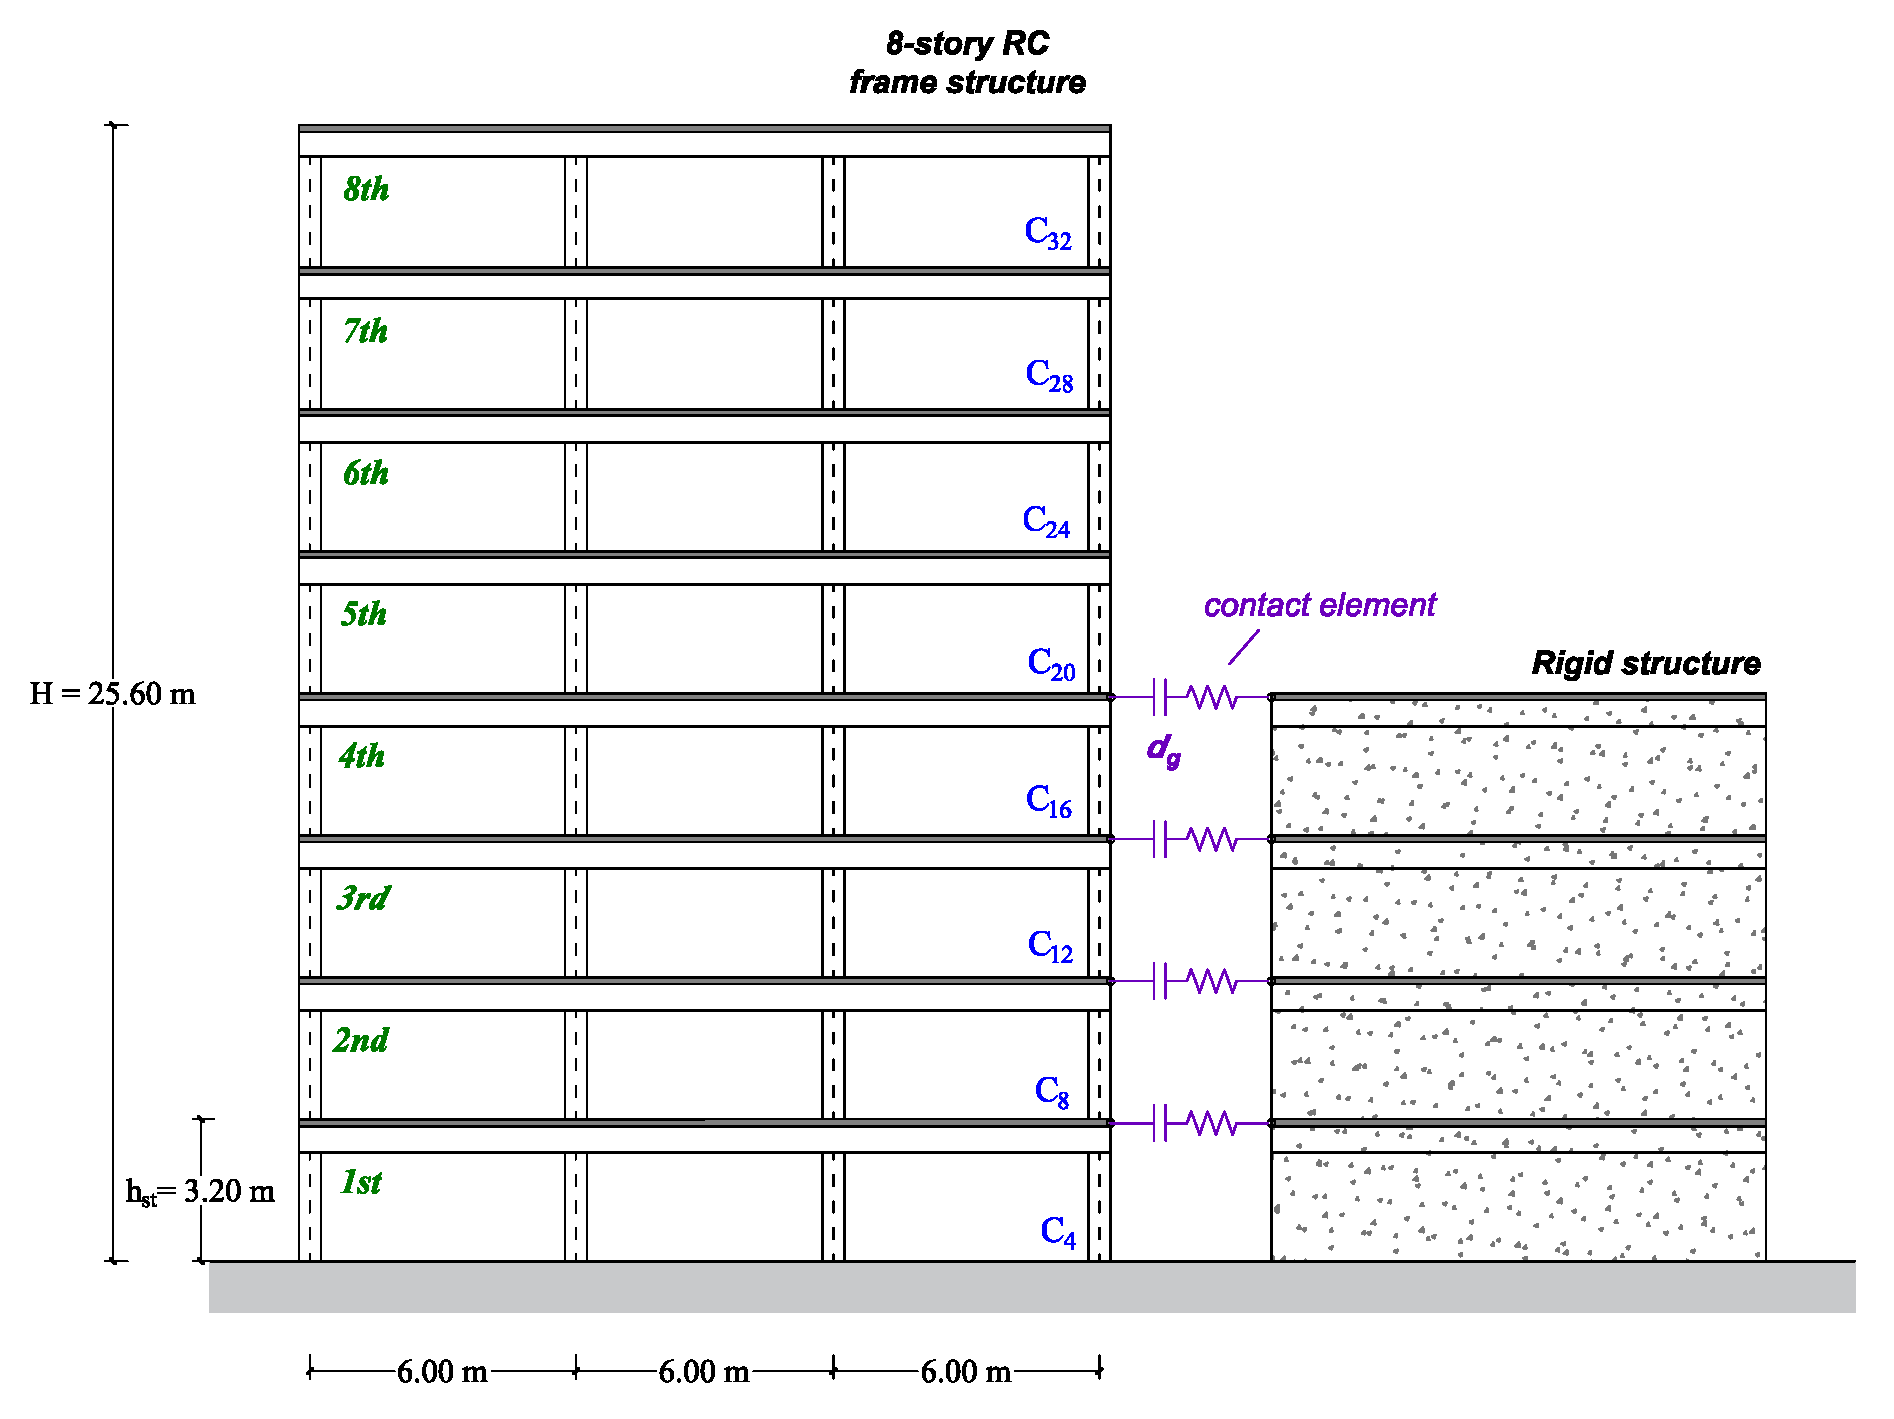
2. Case Study
3. Ground Motions and Intensity Measures
4. IMs’ Efficiency and Sufficiency Properties
5. Probabilistic Seismic Demand Model for Developing a Fragility Curve
6. Results
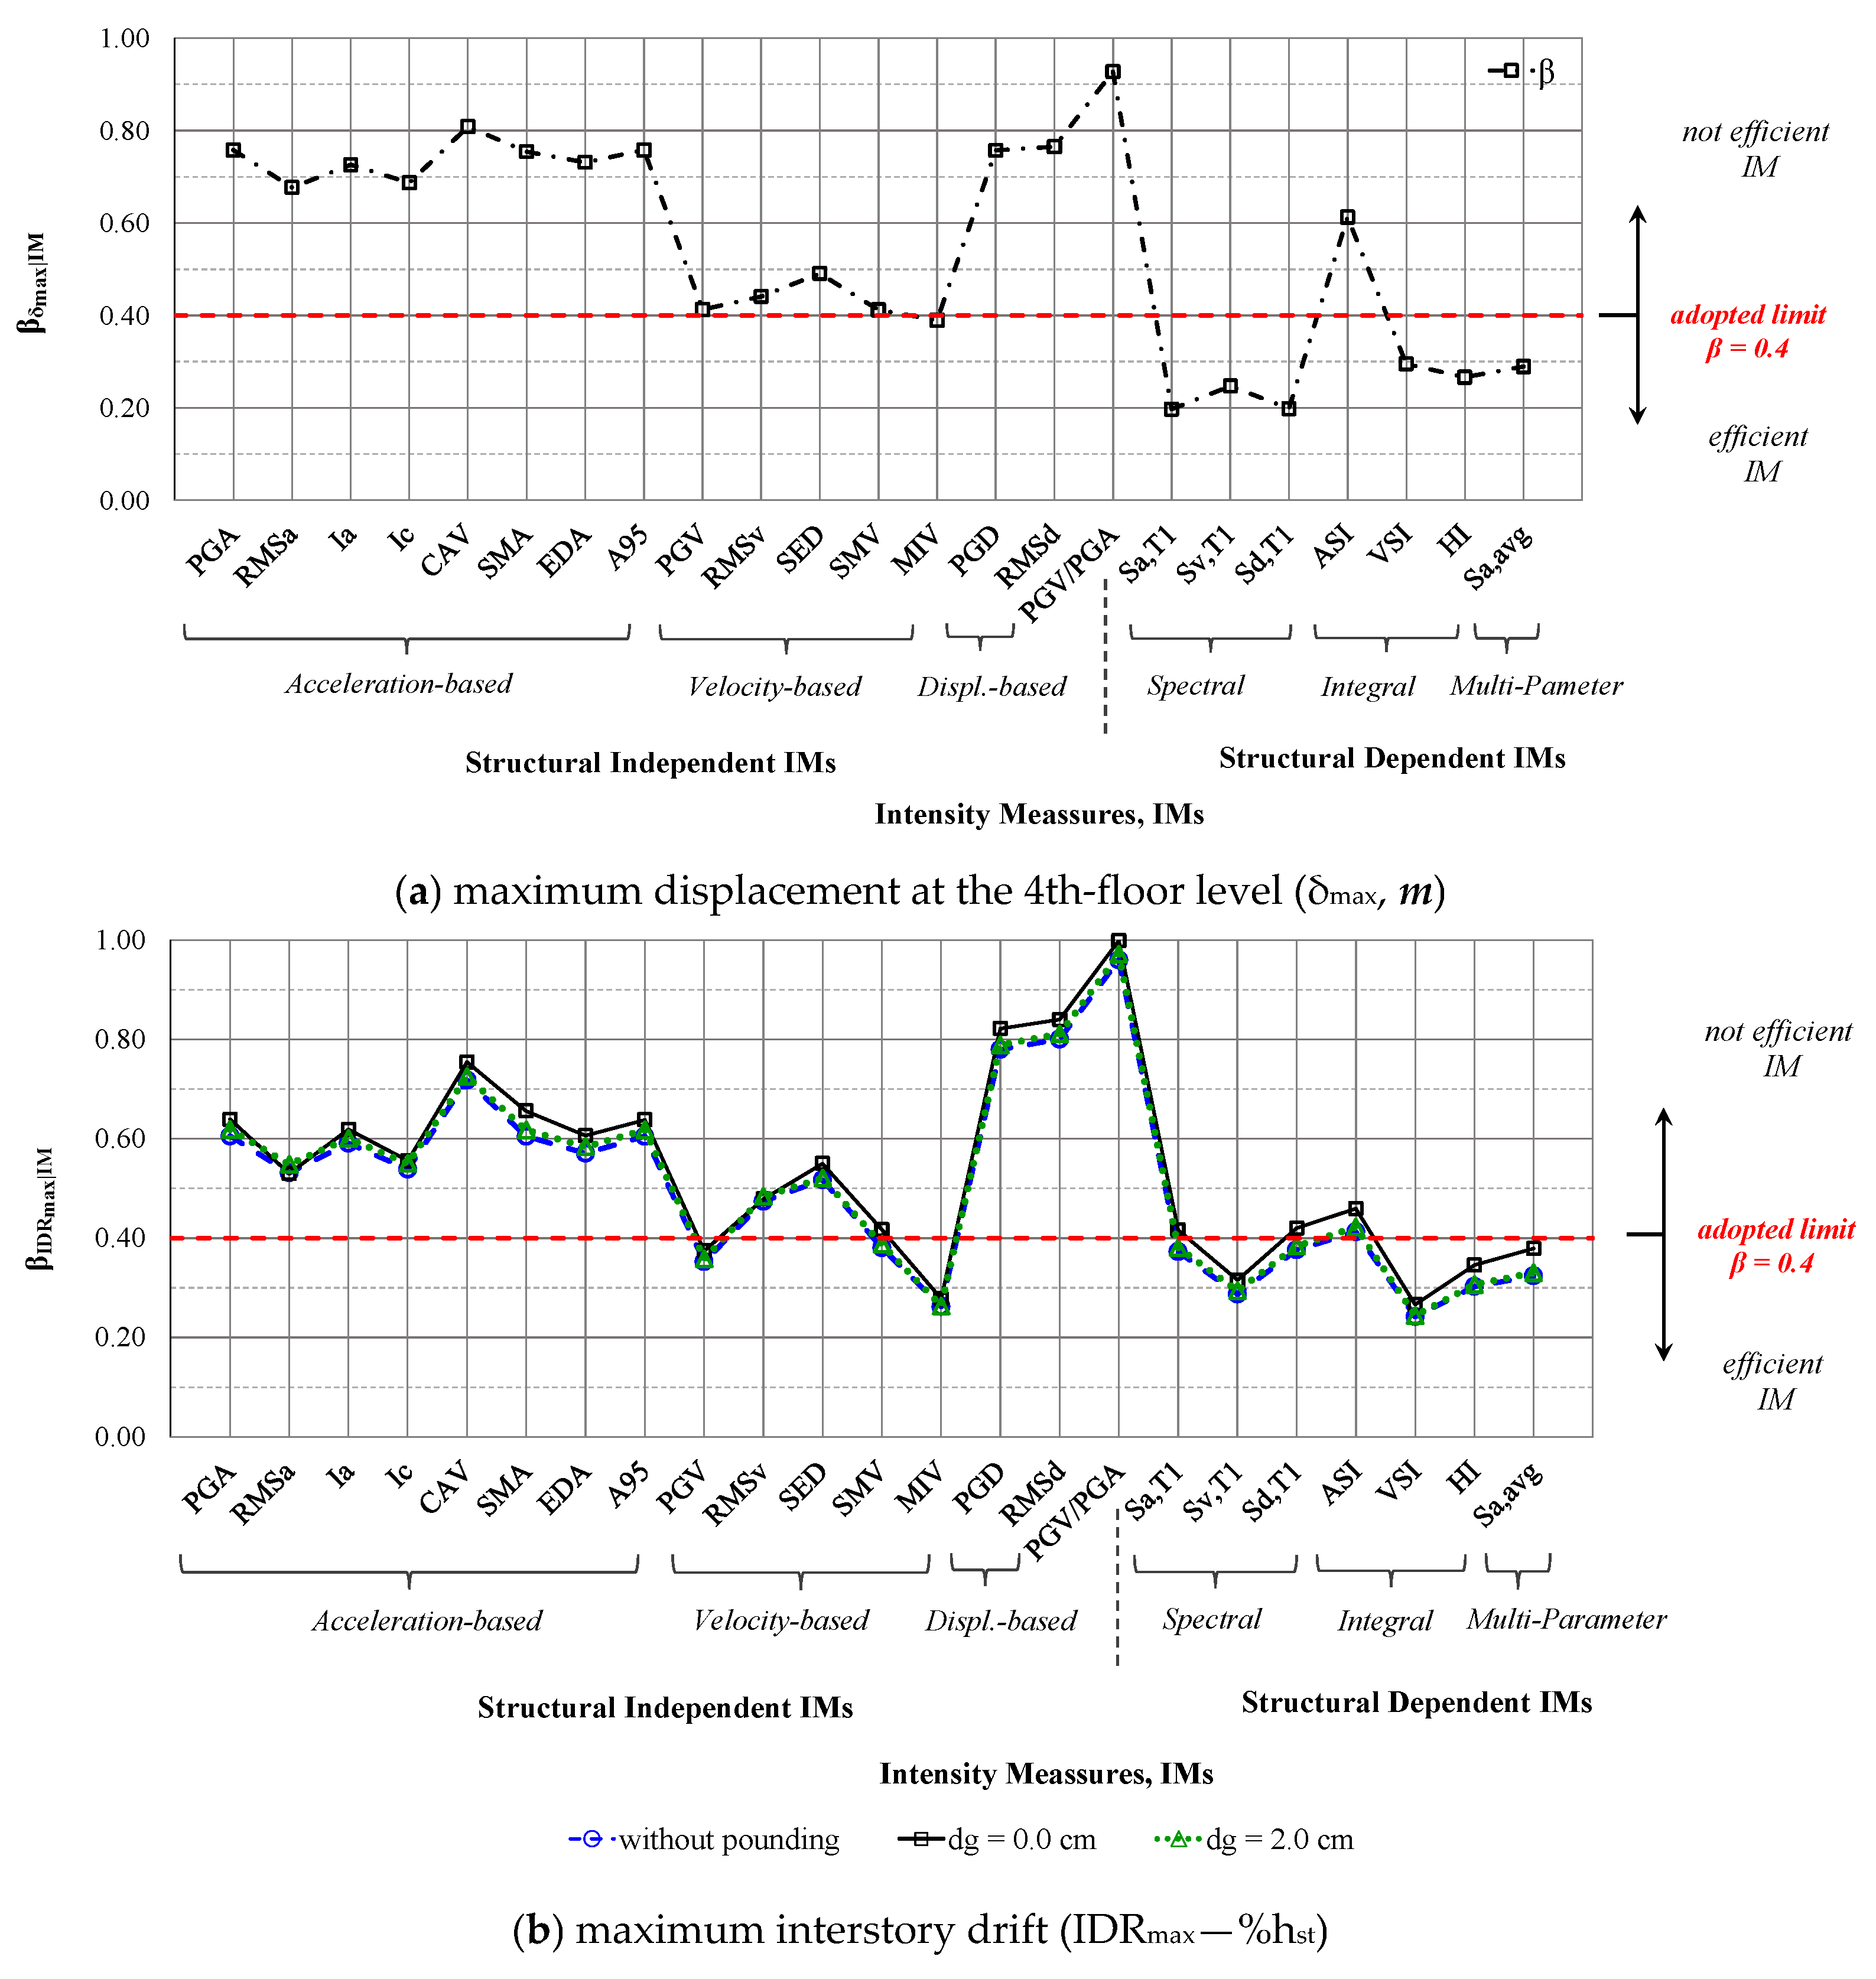
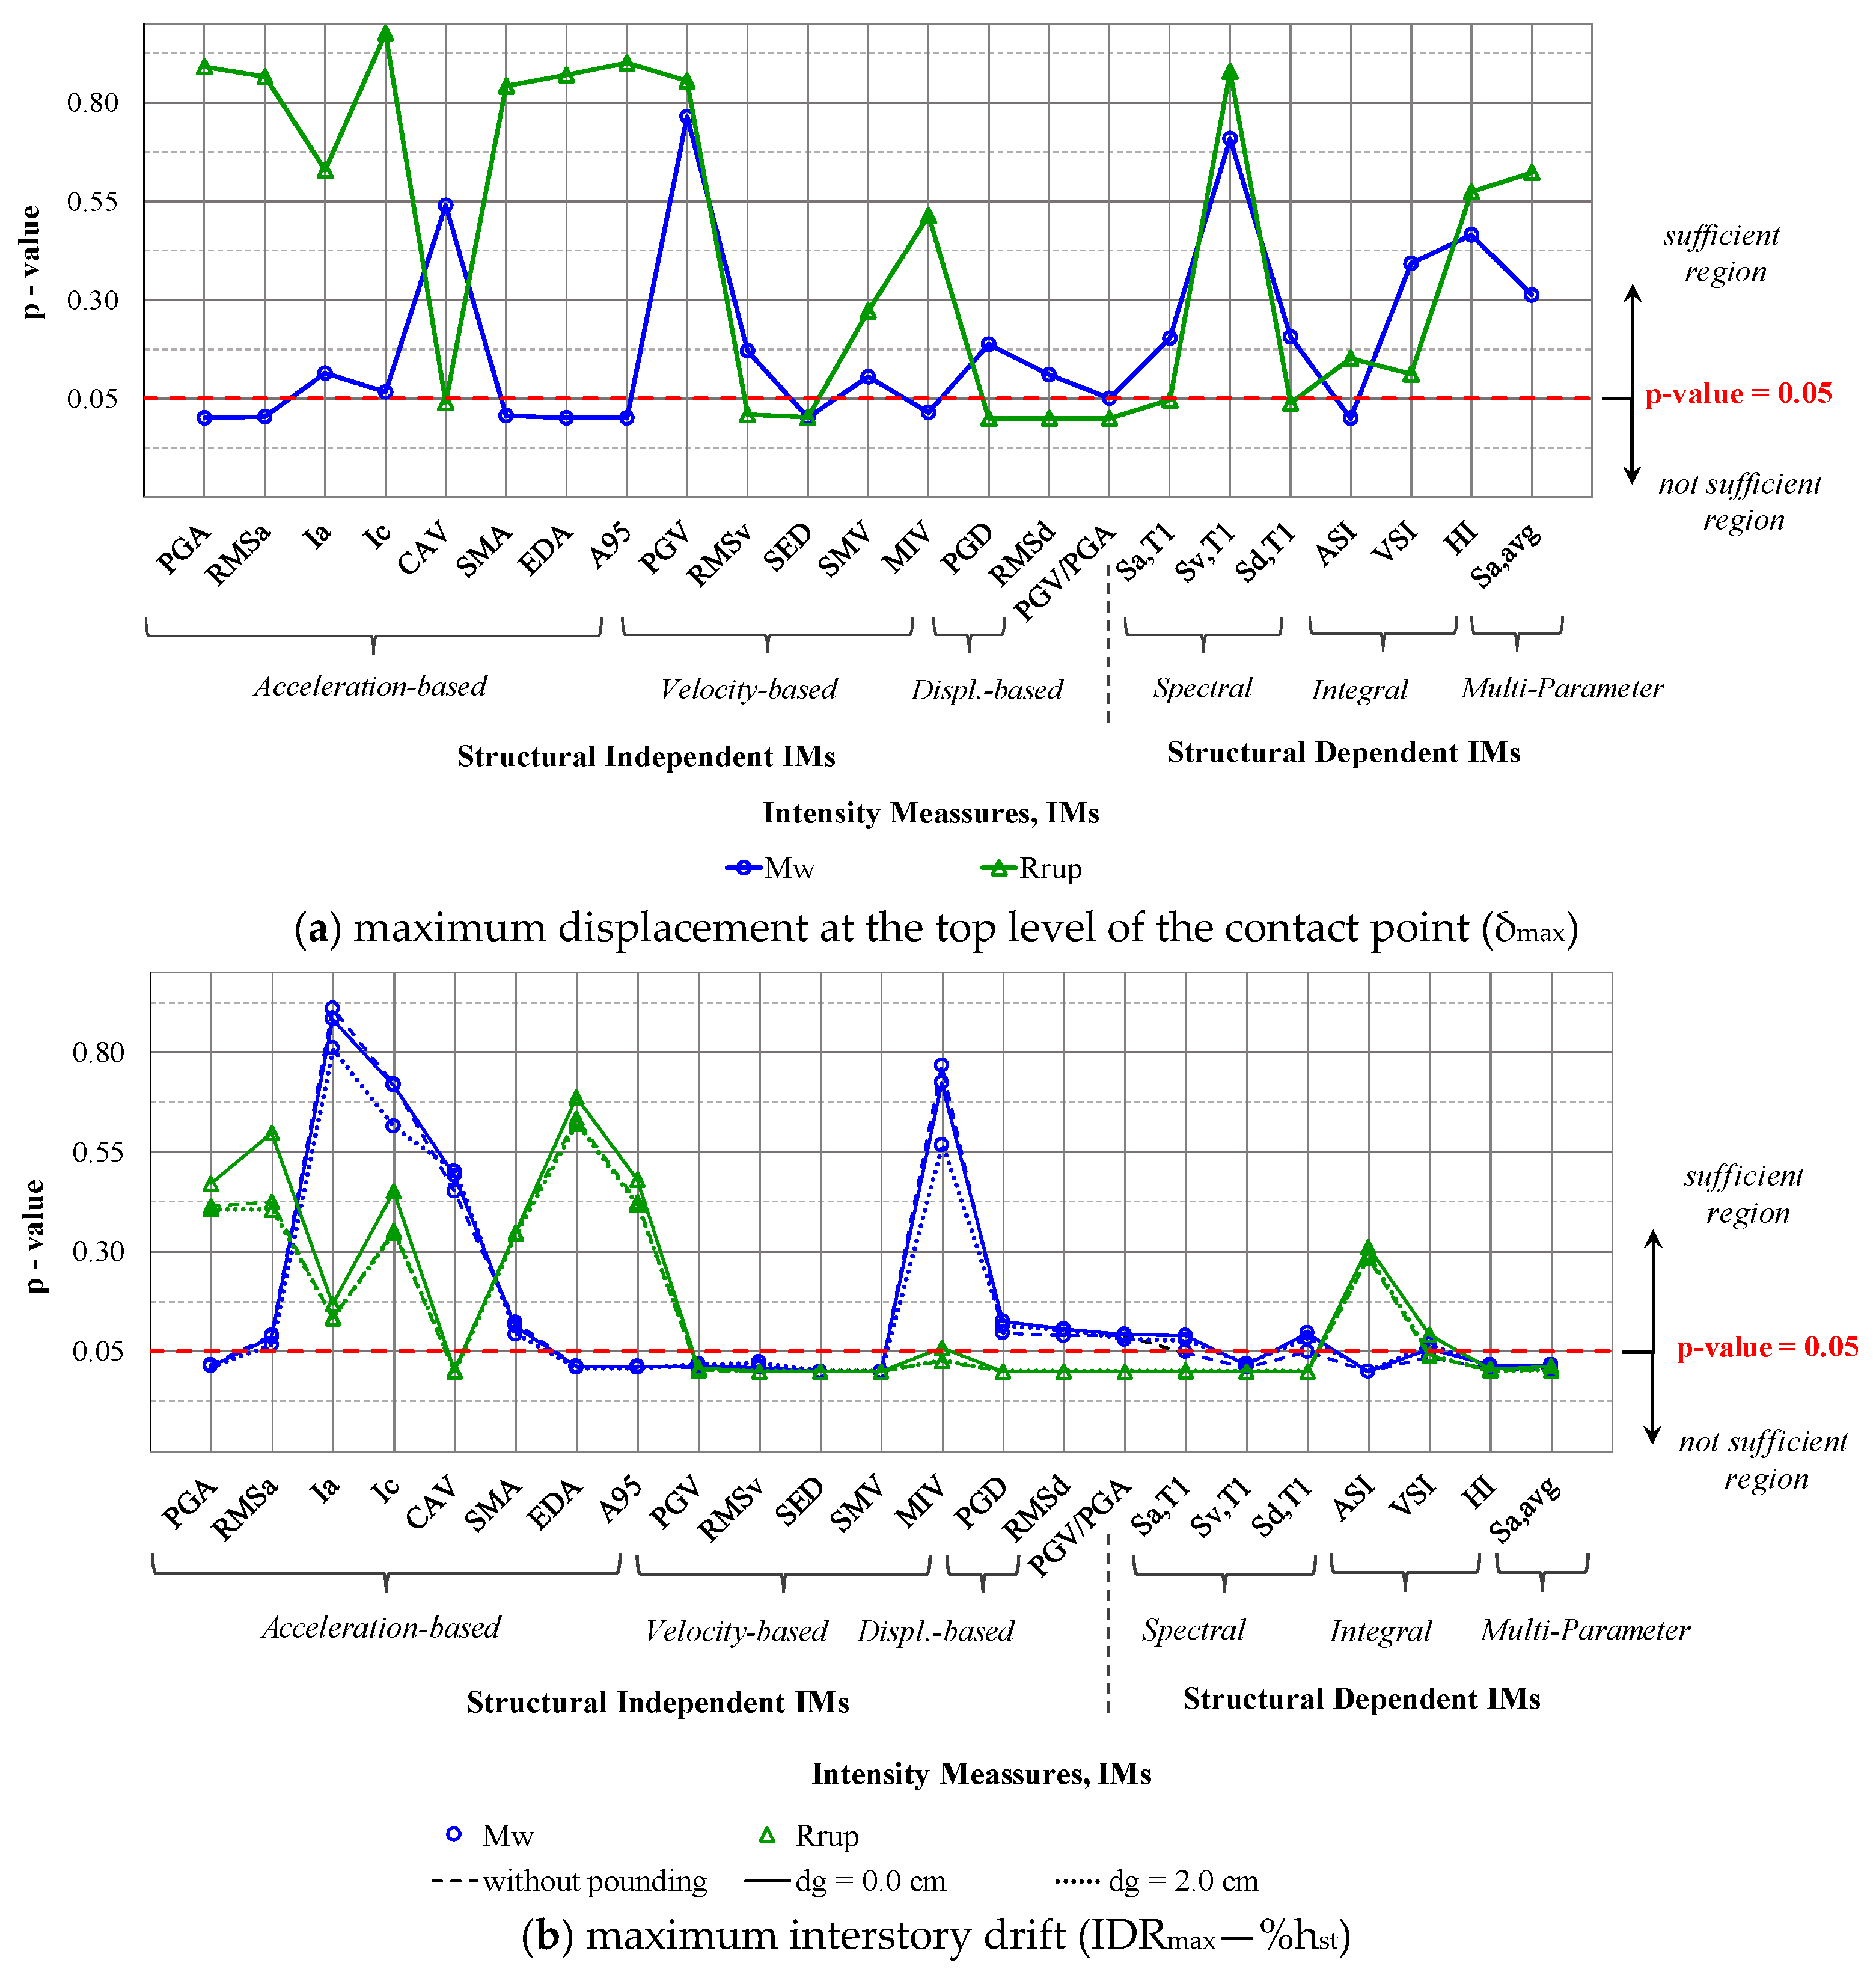
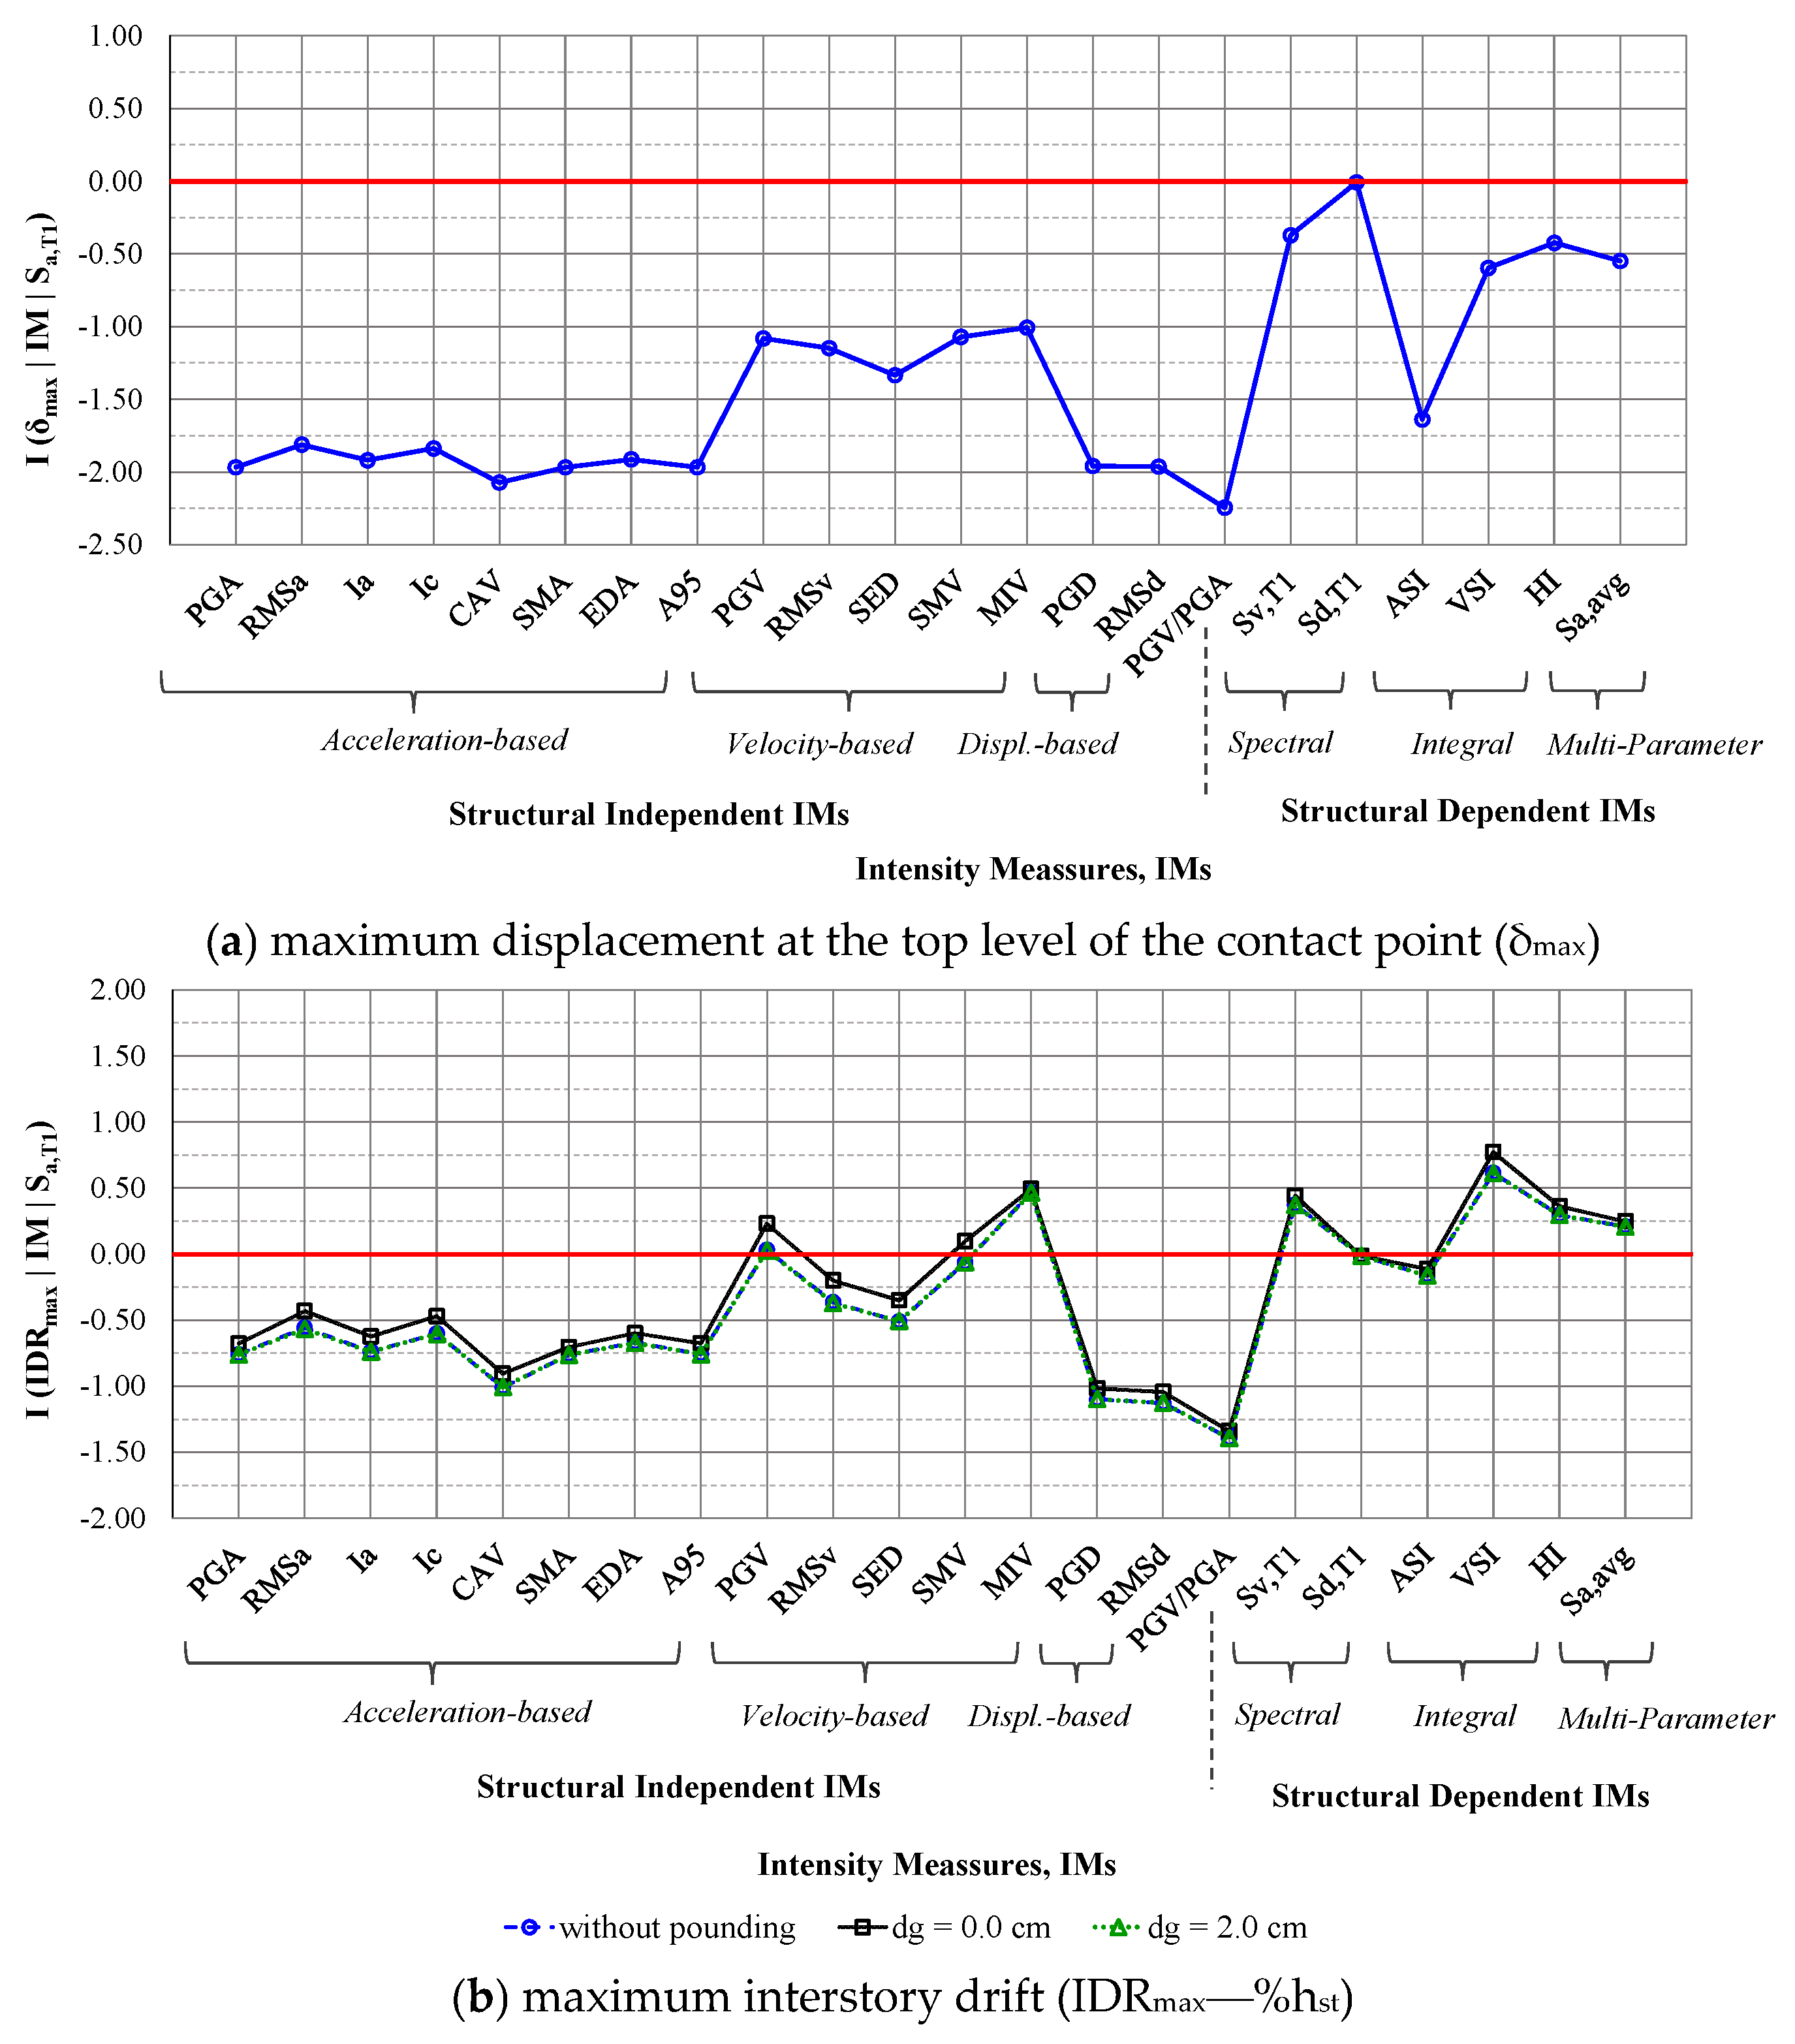
6.1. Verification of IMs’ Properties
6.2. Probabilistic Assessment of Structural Pounding
7. Conclusions
- The structural dependent IMs are more efficient in predicting the seismic demands of the eight-story RC structure. However, an optimal IM that simultaneously satisfies the criteria of efficiency and sufficiency is difficult to be defined. IMs’ efficiency or sufficiency properties seem not to be affected when structural pounding is involved.
- The scalar IM of Sa,T1 passes the criteria of efficiency, while p-values are shifted close to 0.05 in all the examined cases. Also, based on the RSM method, the superiority of Sa,T1 among the other IMs is justified.
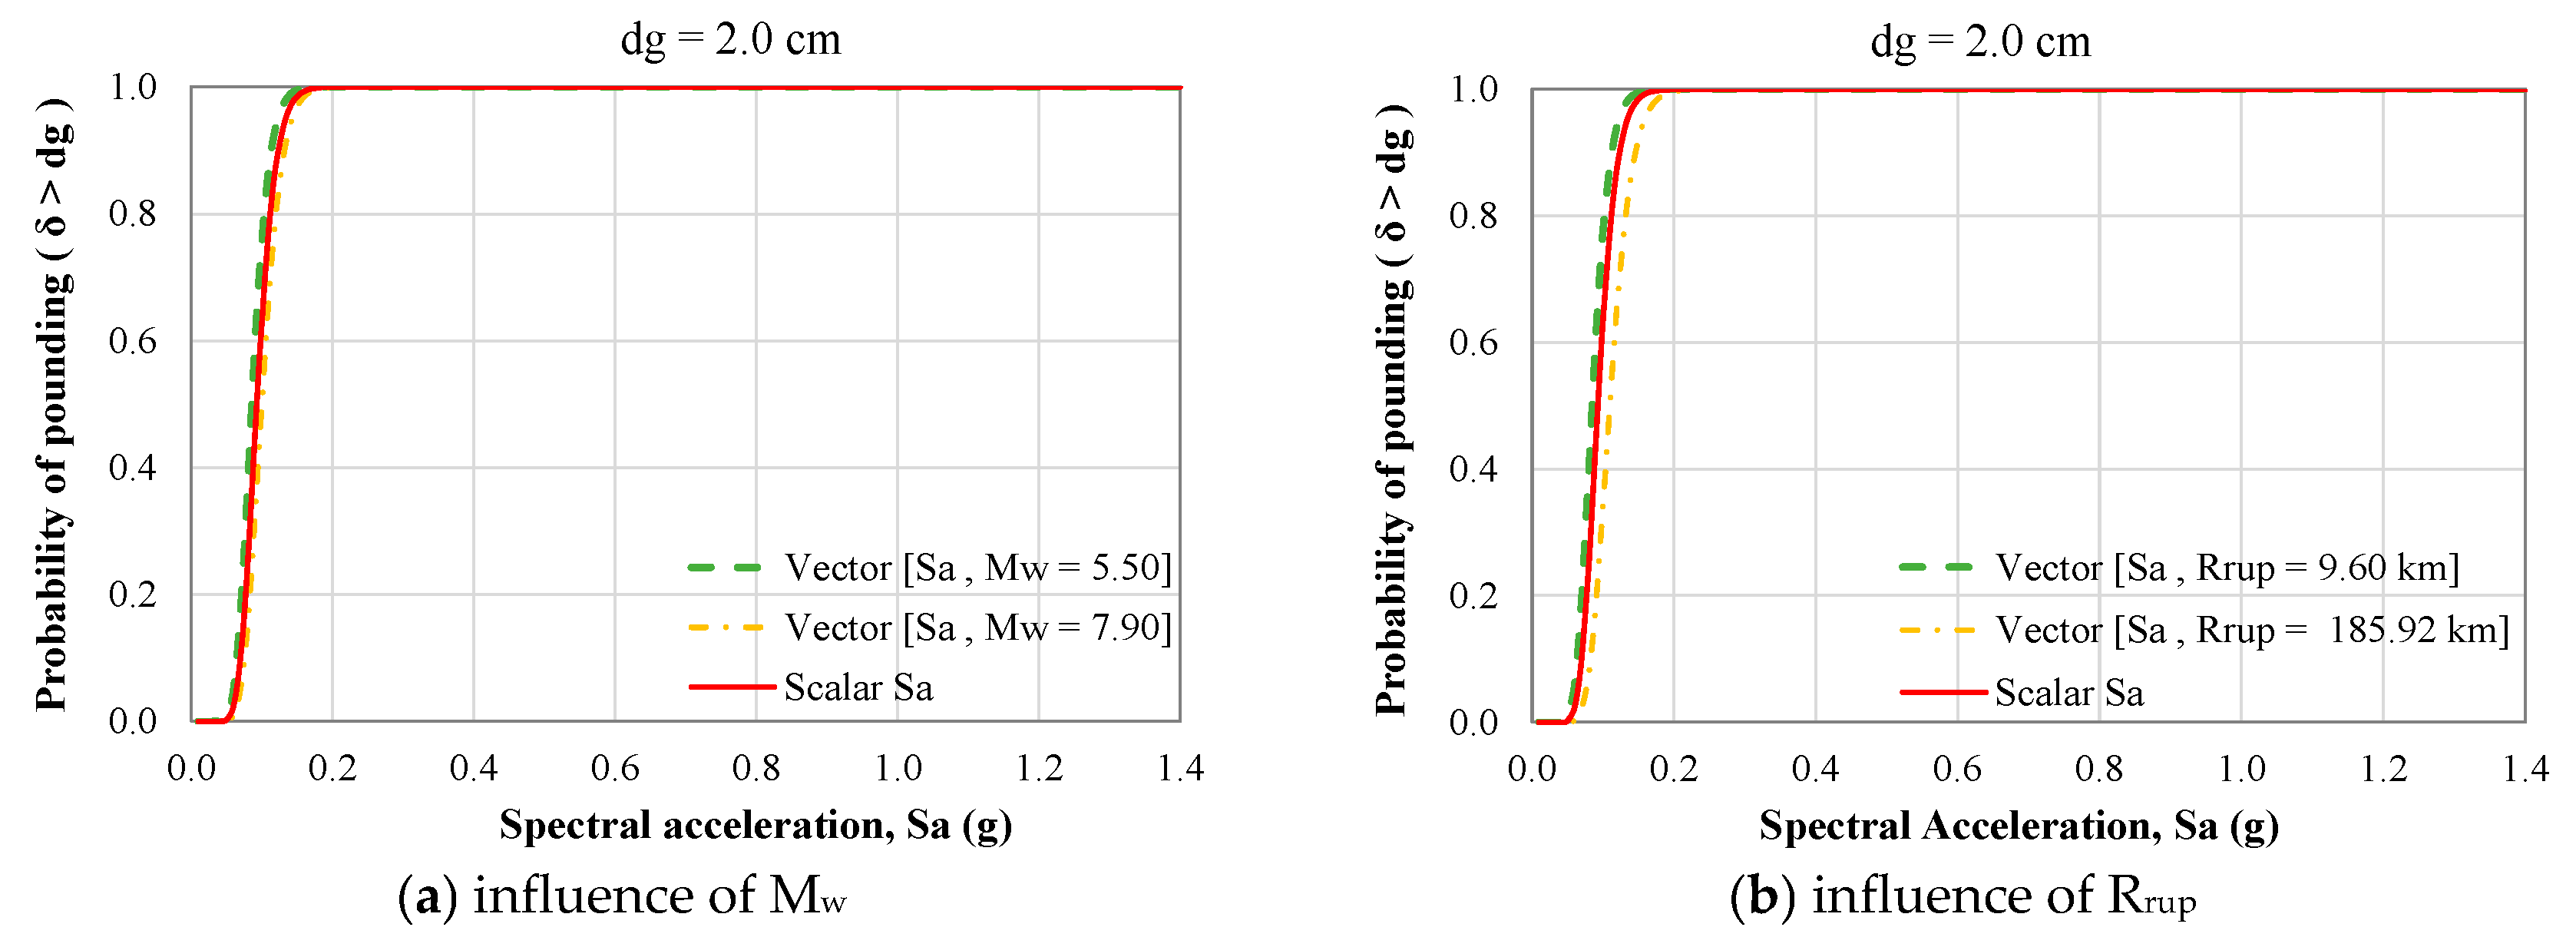
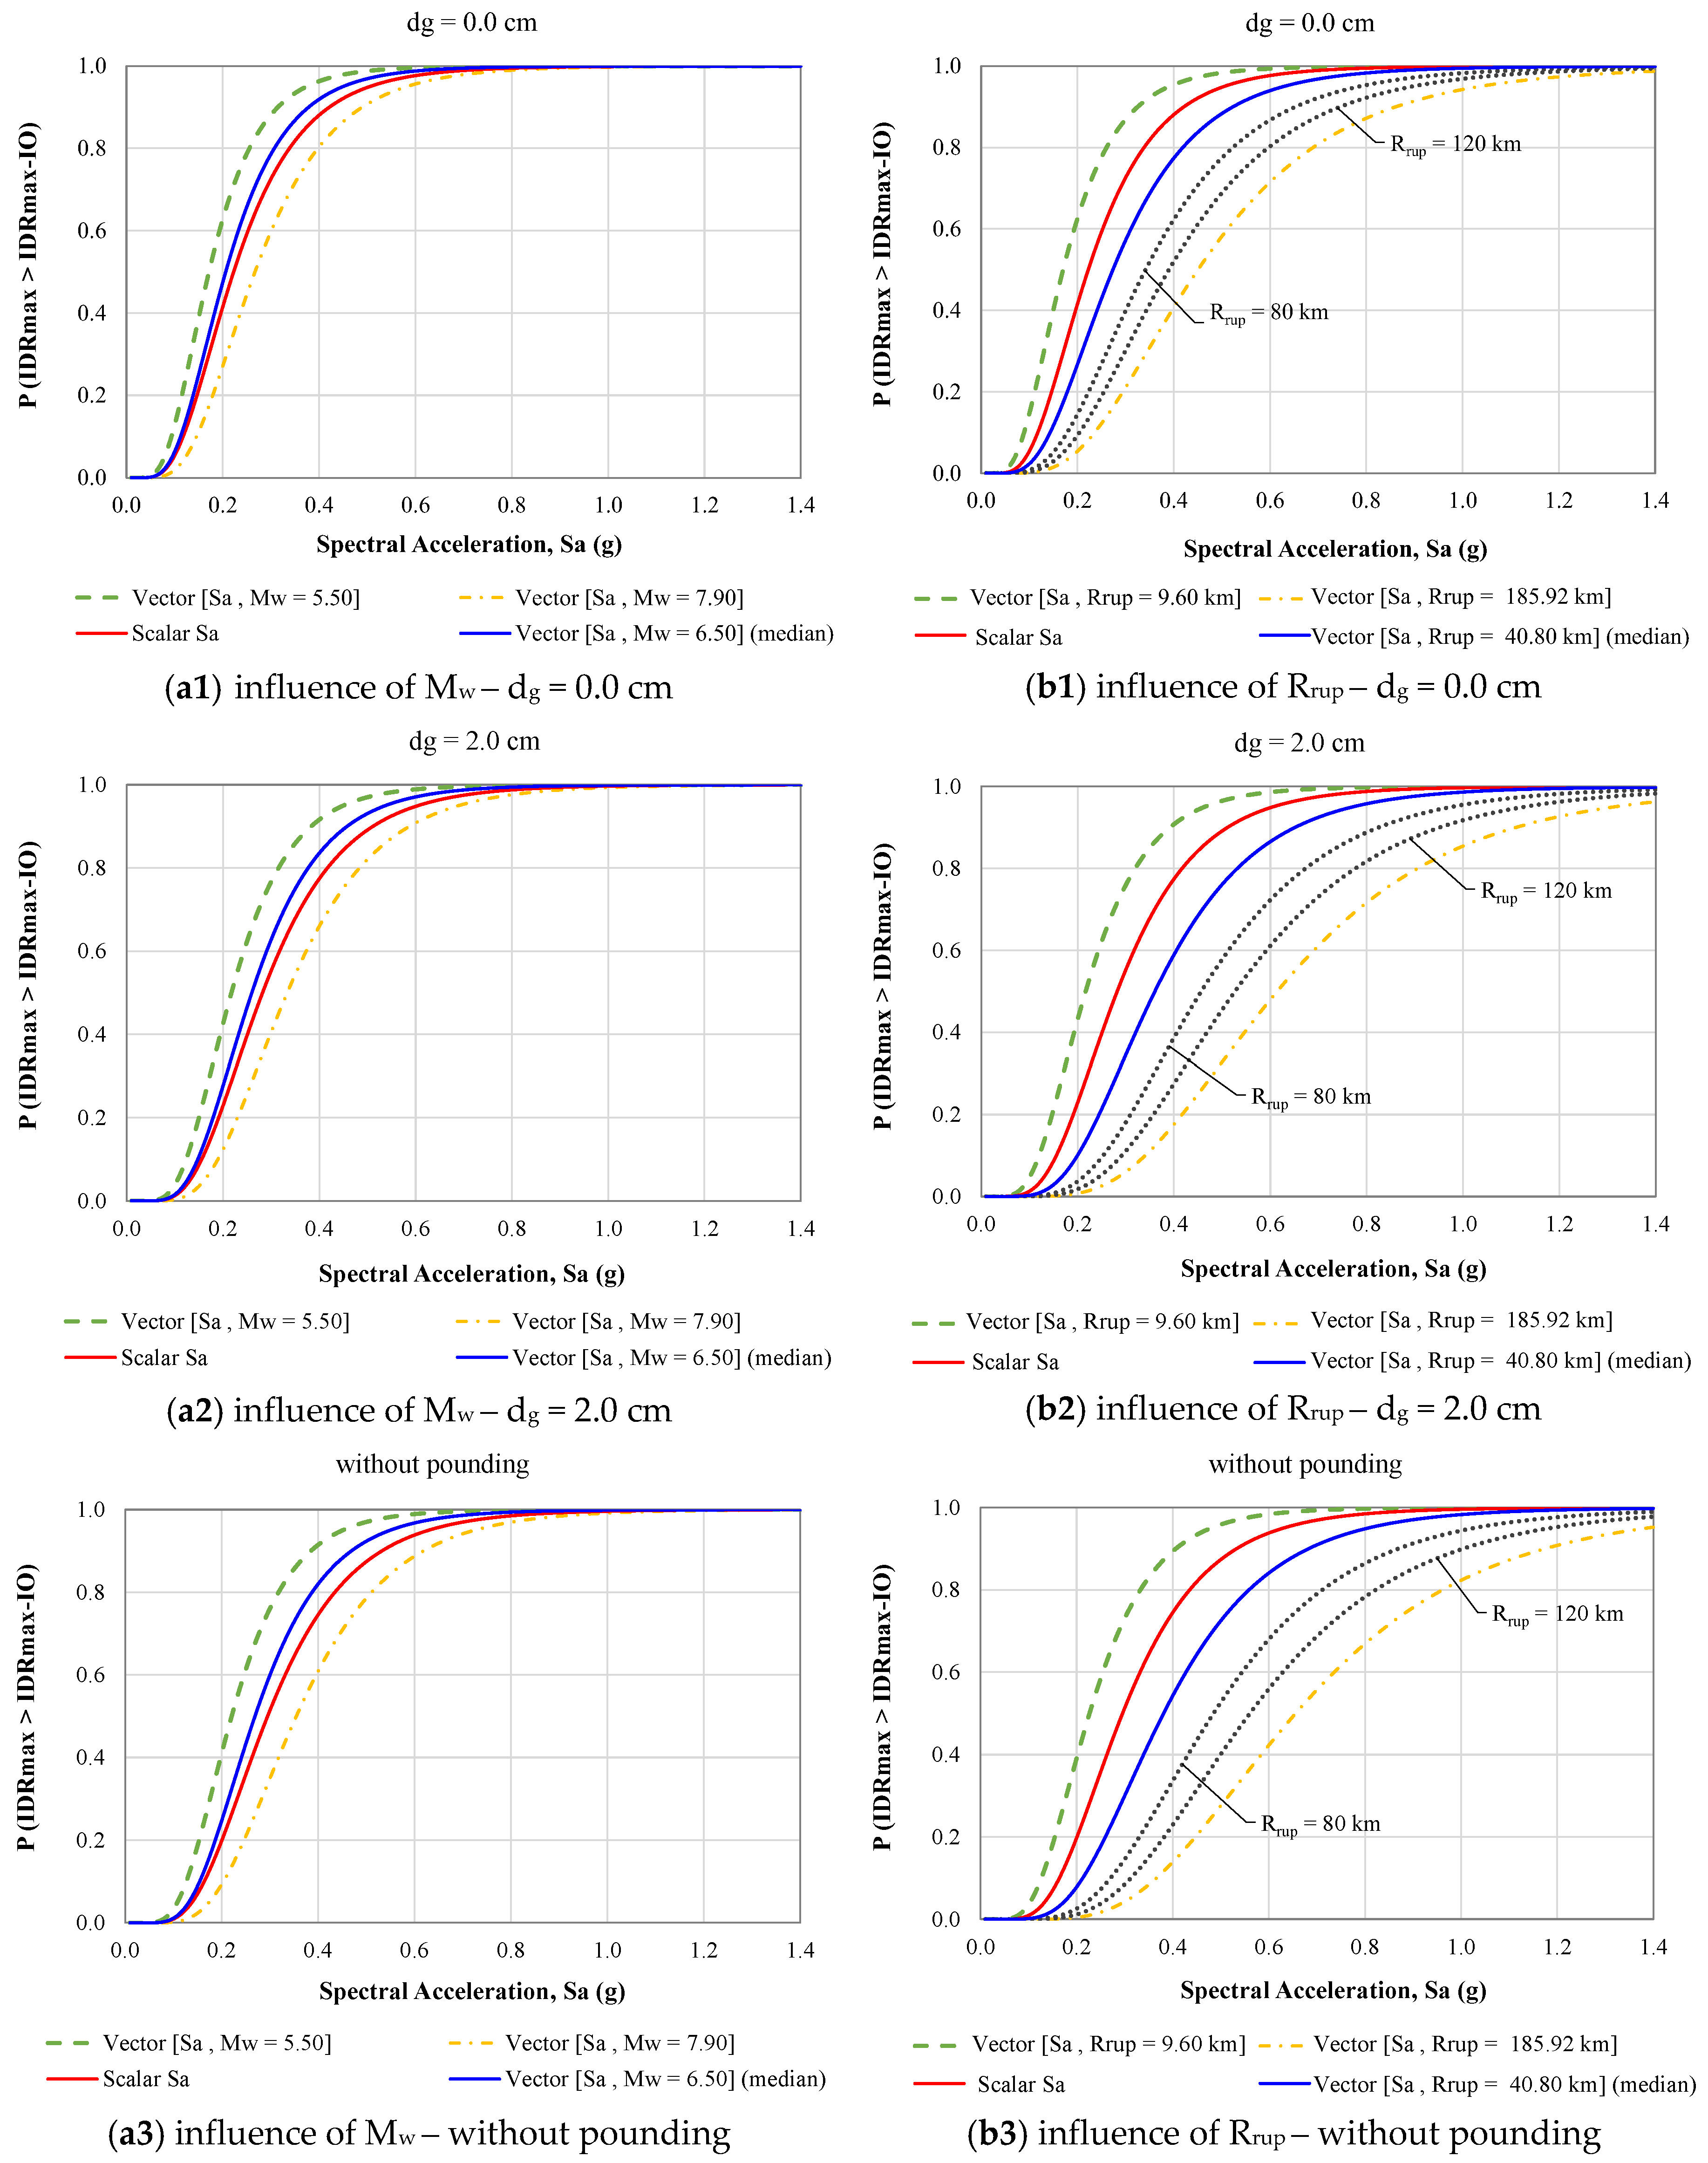
- The variation in Mw and Rrup alters the results of the assessment against structural pounding. Once Mw or Rrup is increased, fragility curves are shifted to greater values of IM, and the probability of exceedance of a certain performance level is reduced. Nevertheless, the variation in the results of the fragility analysis is more pronounced when Rrup is involved.
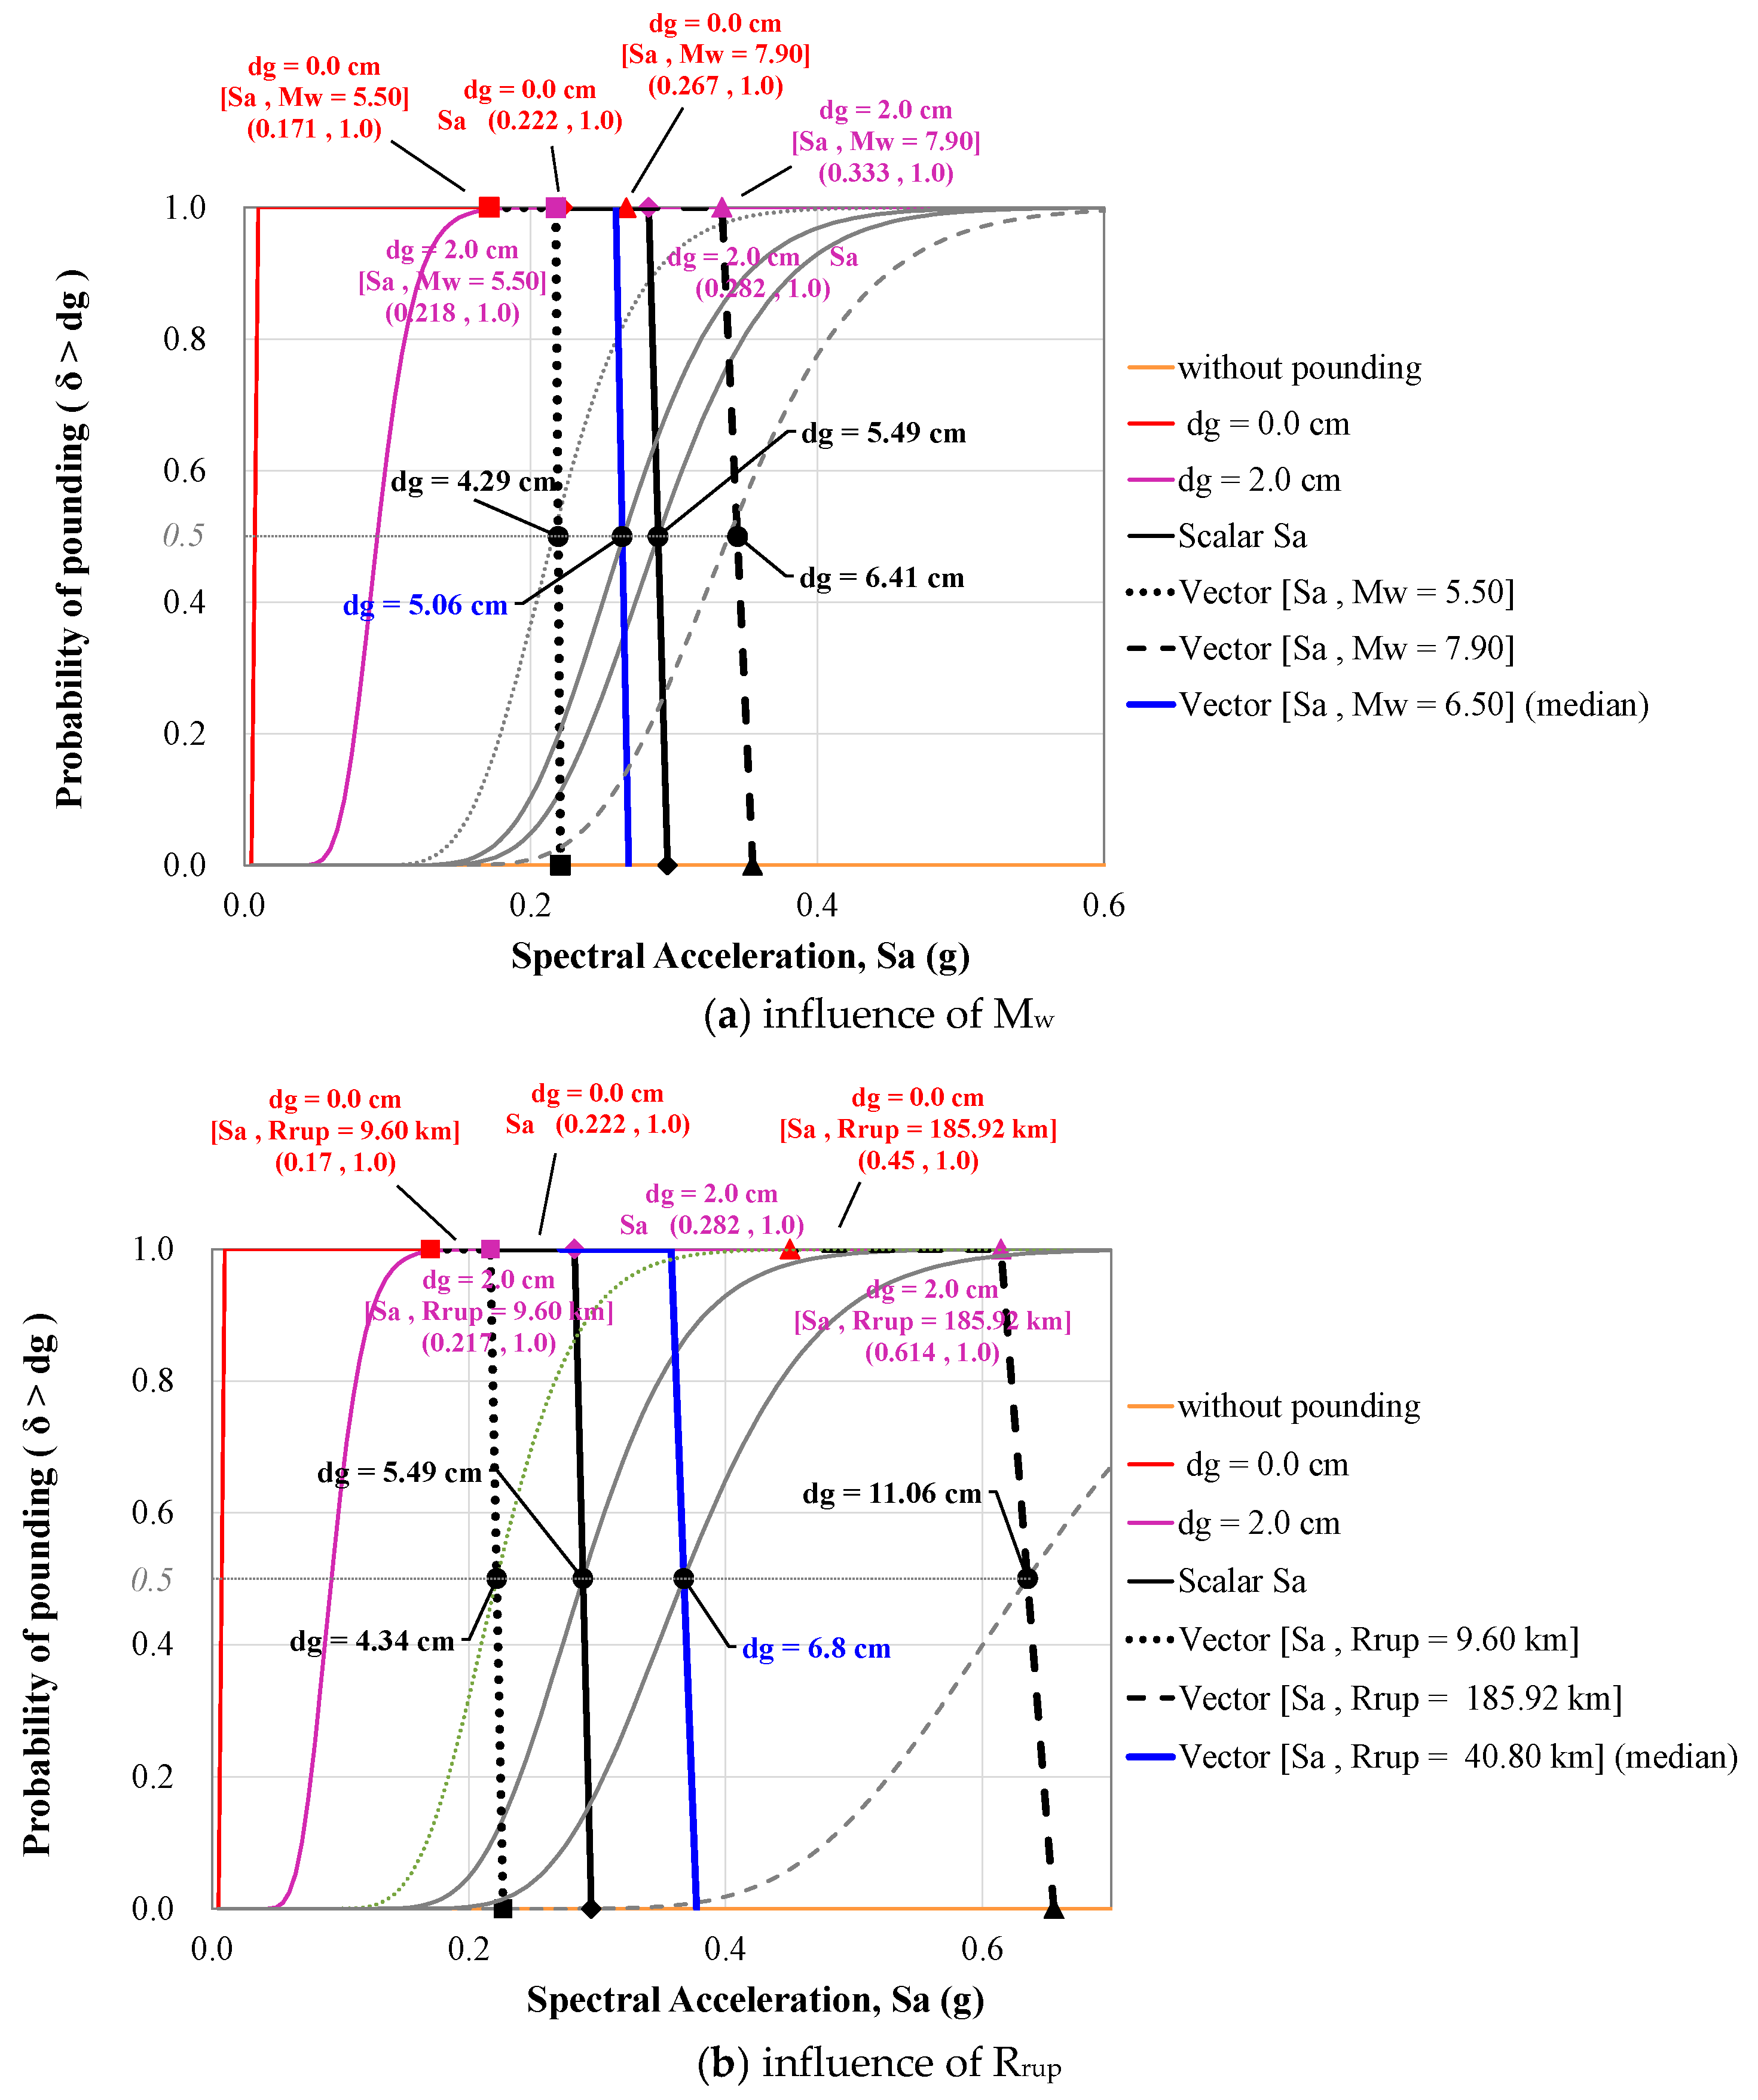
- The variation in Mw and Rrup generates different demand solutions for the adequate separation gap distance dg between the adjacent structures, which in some cases also leads to premature exceedance of a certain capacity level of the structure.
Author Contributions
Funding
Data Availability Statement
Conflicts of Interest
References
- Flenga, M.G.; Favvata, M.J. Probabilistic seismic assessment of the pounding risk based on the local demands of a multistory RC frame structure. Eng. Struct. 2021, 245, 112789. [Google Scholar] [CrossRef]
- Rayegani, A.; Nouri, G. Seismic collapse probability and life cycle cost assessment of isolated structures subjected to pounding with smart hybrid isolation system using a modified fuzzy based controller. Structures 2022, 44, 30–41. [Google Scholar] [CrossRef]
- Cornell, C.A.; Jalayer, F.; Hamburger, R.O.; Foutch, D.A. Probabilistic Basis for 2000 SAC Federal Emergency Management Agency Steel Moment Frame Guidelines. J. Struct. Eng. 2002, 128, 526–533. [Google Scholar] [CrossRef] [Green Version]
- Shome, N. Probabilistic Seismic Demand Analysis of Nonlinear Structures. Ph.D. Thesis, Department of Civil Engineering, Stanford University, Stanford, CA, USA, 1999. [Google Scholar]
- Luco, N.; Cornell, C.A. Structure-specific scalar intensity measures for near-source and ordinary earthquake ground motions. Earthq. Spectra 2007, 23, 357–392. [Google Scholar] [CrossRef] [Green Version]
- Padgett, J.E.; Nielson, B.G.; DesRoches, R. Selection of optimal intensity measures in probabilistic seismic demand models of highway bridge portfolios. Earthq. Eng. Struct. Dyn. 2008, 37, 711–725. [Google Scholar] [CrossRef]
- Giovenale, P.; Cornell, C.A.; Esteva, L. Comparing the adequacy of alternative ground motion intensity measures for the estimation of structural responses. Earthq. Eng. Struct. Dyn. 2004, 33, 951–979. [Google Scholar] [CrossRef]
- Ebrahimian, H.; Jalayer, F.; Lucchini, A.; Mollaioli, F.; Manfredi, G. Preliminary ranking of alternative scalar and vector intensity measures of ground shaking. Bull. Earthq. Eng. 2015, 13, 2805–2840. [Google Scholar] [CrossRef]
- Mollaioli, F.; Lucchini, A.; Cheng, Y.; Monti, G. Intensity measures for the seismic response prediction of base-isolated buildings. Bull. Earthq. Eng. 2013, 11, 1841–1866. [Google Scholar] [CrossRef]
- Kostinakis, Κ.; Athanatopoulou, A.; Morfidis, Κ. Correlation between ground motion intensity measures and seismic damage of 3D R/C buildings. Eng. Struct. 2014, 82, 151–167. [Google Scholar] [CrossRef]
- Elenas, A.; Meskouris, K. Correlation study between seismic acceleration parameters and damage indices of structure. Eng. Struct. 2001, 23, 698–704. [Google Scholar] [CrossRef]
- Tubaldi, E.; Freddi, F.; Barbato, M. Probabilistic seismic demand and fragility assessment for evaluating the separation distance between adjacent buildings. In Proceedings of the 11st International Conference on Structural Safety and Reliability (ICOSSAR 2013), New York, NY, USA, 16–20 June 2013; pp. 1–8. [Google Scholar]
- Tubaldi, E.; Freddi, F.; Barbato, M. Probabilistic seismic demand model for pounding risk assessment. Earthq. Eng. Struct. Dyn. 2016, 45, 1743–1758. [Google Scholar] [CrossRef]
- Flegga, M.G.; Favvata, M.J. Global and local performance levels on the probabilistic evaluation of the structural pounding effect between adjacent rc structures. In Proceedings of the 11st International conference on structural dynamics (EURODYN 2020), Athens, Greece, 23–26 November 2020; pp. 3762–3779. [Google Scholar]
- Flenga, M.G.; Favvata, M.J. Fragility assessment of the inter-story pounding risk between adjacent reinforced concrete structures based on probabilistic seismic demand models. In Proceedings of the 13th International Conference on Earthquake Resistant Engineering Structures (ERES 2021), Online, 26–28 May 2021; pp. 3–13. [Google Scholar]
- Flenga, M.G.; Favvata, M.J. Fragility Curves and Probabilistic Seismic Demand Models on the Seismic Assessment of RC Frames Subjected to Structural Pounding. Appl. Sci. 2021, 11, 8253. [Google Scholar] [CrossRef]
- Langlade, T.; Bertrand, D.; Grange, S.; Candia, G.; Llera, J. Intensity measures properties and selection for risk analysis on structures subjected to earthquake induced building pounding with a non-smooth contact dynamics method. In Proceedings of the 8th ECCOMAS Thematic Conference on Computational Methods in Structural Dynamics and Earthquake Engineering (COMPDYN 2021), Athens, Greece, 28–30 June 2021; pp. 4621–4632. [Google Scholar]
- Nazri, F.M.; Miari, M.; Kassem, M.M.; Tan, C.G.; Farsangi, E.N. Probabilistic Evaluation of Structural Pounding Between Adjacent Buildings Subjected to Repeated Seismic Excitations. Arab. J. Sci. Eng. 2018, 44, 4931–4945. [Google Scholar] [CrossRef]
- Kazemi, F.; Miari, M.; Jankowski, R. Investigating the effects of structural pounding on the seismic performance of adjacent RC and steel MRFs. Bull. Earthq. Eng. 2021, 19, 317–343. [Google Scholar] [CrossRef]
- Baker, J.W.; Cornell, C.A. A vector-valued ground motion intensity measure consisting of spectral acceleration and epsilon. Earthq. Eng. Struct. Dyn. 2005, 34, 1193–1217. [Google Scholar] [CrossRef]
- Baker, J.W. Probabilistic structural response assessment using vector-valued intensity measures. Earthq. Eng. Struct. Dyn. 2007, 36, 1861–1883. [Google Scholar] [CrossRef]
- Alembagheri, M. Investigating efficiency of vector-valued intensity measures in seismic demand assessment of concrete dams. Adv. Civ. Eng. 2018, 2018, 5675032. [Google Scholar] [CrossRef] [Green Version]
- Chen, X.; Xiang, N.; Guan, Z.; Li, J. Seismic vulnerability assessment of tall pier bridges under mainshock-aftershock-like earthquake sequences using vector-valued intensity measure. Eng. Struct. 2022, 253, 113732. [Google Scholar] [CrossRef]
- Saha, A.; Mishra, S.K. Synthesis of a vector-valued intensity measure for improved prediction of seismic demands in Inter-Story-Isolated (ISI) buildings subjected to near fault ground motions. Eng. Struct. 2021, 248, 113241. [Google Scholar] [CrossRef]
- Sun, B.; Zhang, G.; Xue, B.; Kou, L.; Hu, L.; Liu, W. The analysis of the optimal scalar and vector intensity measurements for seismic performance assessment of deep-buried hydraulic arched tunnels. Undergr. Space 2023, 9, 218–233. [Google Scholar] [CrossRef]
- Favvata, M.J. Minimum required separation gap for adjacent RC frames with potential inter-story seismic pounding. Eng. Struct. 2017, 152, 643–659. [Google Scholar] [CrossRef]
- Prakash, V.; Powell, G.H.; Gampbell, S. DRAIN-2DX Base Program Description and User’s Guide, UCB/SEMM; Report No. 17/93; University of California: Orkland, CA, USA, 1993. [Google Scholar]
- PEER Ground Motion Database. 2011. Available online: https://peer.berkeley.edu/peer-strong-ground-motion-databases (accessed on 10 October 2017).
- ESM Database. Available online: https://esm-db.eu/#/home (accessed on 20 April 2020).
- Rayegani, A.; Nouri, G. Application of smart dampers for prevention of seismic pounding in isolated structures subjected to near-fault earthquakes. J. Earthq. Eng. 2022, 26, 4069–4084. [Google Scholar] [CrossRef]
- Kramer, S.L. Geotechnical Earthquake Engineering, 1st ed.; Prentice Hall: Upper Saddle River, NJ, USA, 1996. [Google Scholar]
- Reed, J.W.; Anderson, N.; Chokshi, N.C.; Kennedy, R.P.; Metevia, W.J.; Ostrom, D.K.; Stevenson, J.D. A Criterion for Determining Exceedance of the Operating Basis Earthquake; EPRI Report NP-5930; Electric Power Research Institute: Palo Alto, CA, USA, 1988; Volume 18, pp. 805–810. [Google Scholar]
- Nuttli, O.W. The Relation of Sustained Maximum Ground Acceleration and Velocity to Earthquake Intensity and Magnitude; Paper S-71-1, Report 16; U.S. Army Corps of Engineers, Waterways Experiment Station: Vicksburg, MS, USA, 1979. [Google Scholar]
- Housner, G.W.; Jennings, P.C. Generation of Artificial Earthquakes. ASCE J. Eng. Mech. 1964, 90, 113–150. [Google Scholar] [CrossRef]
- Arias, A. Arias, A. A measure of earthquake intensity. In Seismic Design for Nuclear Power Plants; Hansen, R.J., Ed.; MIT Press: Cambridge MA, USA, 1970; pp. 438–483. [Google Scholar]
- Park, Y.J.; Ang, A.H.S.; Wen, Y.K. Seismic damage analysis of reinforced concrete buildings. ASCE J. Struct. Eng. 1985, 111, 740–757. [Google Scholar] [CrossRef]
- Anderson, J.C.; Bertero, V.V. Uncertainties in Establishing Design Earthquakes. ASCE J. Struct. Eng. 1987, 113, 1709–1724. [Google Scholar] [CrossRef]
- Sarma, S.K.; Yang, K.S. An evaluation of strong motion records and a new parameter A95. Earthq. Eng. Struct. Dyn. 1987, 15, 119–132. [Google Scholar] [CrossRef]
- Von Thun, J.L.; Rochim, L.H.; Scott, G.A.; Wilson, J.A. Earthquake ground motions for design and analysis of dams. In Earthquake Engineering and Soil Dynamics II—Recent Advances in Ground-Motion Evaluation. In Proceedings of the Specialty Conference, Park City, UT, USA, 27–30 June 1988; Volume 20, pp. 463–481. [Google Scholar]
- Dimitrakopoulos, E.; Kappos, A.; Makris, N. Dimensional analysis of yielding and pounding structures for records without distinct pulses. Soil Dyn. Earthq. Eng. 2009, 29, 1170–1180. [Google Scholar] [CrossRef] [Green Version]
- Housner, G.W. Spectrum Intensities of Strong Motion Earthquakes; Symposium on Earthquake and Blast Effects on Structures: Los Angeles, CA, USA, 1952. [Google Scholar]
- Bianchini, M.; Diotallevi, P.P.; Baker, J.W. Prediction of Inelastic Structural Response Using an Average of Spectral Accelerations. In Proceedings of the 10th International Conference on Structural Safety and Reliability (ICOSSAR 2009), Osaka, Japan, 13–17 September 2009; pp. 1–8. [Google Scholar]
- Jalayer, F.; Beck, J.; Zareian, F. Analyzing the Sufficiency of Alternative Scalar and Vector Intensity Measures of Ground Shaking Based on Information Theory. ASCE J. Eng. Mech. 2012, 138, 307–316. [Google Scholar] [CrossRef]


| No. | Earthquake ID | Earthquake Name | Station Name | Magnitude Mw | Distance Rrup (km) | Duration (s) | No. | Earthquake ID | Earthquake Name | Station Name | Magnitude Mw | Distance Rrup (km) | Duration (s) |
|---|---|---|---|---|---|---|---|---|---|---|---|---|---|
| 1 | RSN 643 | Whittier Narrows-01 | LA—Wonderland Ave | 5.99 | 27.64 | 18.14 | 26 | EMSC-20161030_0000029 | Central Italy | Teramo | 6.50 | 27.87 | 61.38 |
| 2 | RSN 4312 | Umbria-03, Italy | Gubbio | 5.60 | 15.72 | 17.99 | 27 | ME-1979-0003 | Northwestern Balkan Peninsula | Hercegnovi Novi-O.S.D. Pavicic School | 6.90 | 24.00 | 47.96 |
| 3 | IT-2009-0009 | L’ Aquila | Montereale | 6.10 | 17.11 | 99.99 | 28 | RSN 5618 | Iwate, Japan | IWT010 | 6.90 | 16.27 | 237.99 |
| 4 | EMSC-20160824_0000006 | Central Italy | Teramo | 6.00 | 22.12 | 78.61 | 29 | RSN 1091 | Northridge-01 | Vasquez Rocks Park | 6.69 | 23.64 | 39.98 |
| 5 | IT-1984-0004 | Lazio Abruzzo | Atina | 5.90 | 16.32 | 30.68 | 30 | RSN 3954 | Tottori, Japan | SMNH10 | 6.61 | 15.59 | 299.99 |
| 6 | RSN 680 | Whittier Narrows-01 | Pasadena—CIT Kresge Lab | 5.99 | 18.12 | 39.99 | 31 | EMSC-20161030_0000029 | Central Italy | Reggiano | 6.50 | 21.27 | 61.38 |
| 7 | GR-1999-0001 | Greece | (ATH4) | 5.90 | 16.79 | 42.35 | 32 | ME-1979-0003 | Northwestern Balkan Peninsula | Dubrovnik-Pomorska Skola | 6.90 | 64.87 | 33.57 |
| 8 | IT-2009-0009 | L’ Aquila | Antrodoco | 6.10 | 23.18 | 120.00 | 33 | RSN 284 | Iprinia, Italy | Auletta | 6.90 | 9.60 | 34.00 |
| 9 | EMSC-20170118_0000034 | Central Italy | Leonessa | 5.50 | 22.40 | 59.90 | 34 | RSN 5006 | ChuetsuJapan | FKSH07 | 6.80 | 79.54 | 158.99 |
| 10 | IT-1997-0006 | Umbria March | Monte Fiegni | 6.00 | 21.98 | 34.75 | 35 | RSN 5993 | El Mayor-Cucapah | El Monte County Park | 7.20 | 104.9 | 154.84 |
| 11 | RSN 4438 | Molise-02, Italy | Sannicandro | 5.70 | 51.32 | 36.28 | 36 | RSN 3799 | Hector Mine | LA—Griffith Park Observatory | 7.13 | 185.92 | 56.99 |
| 12 | RSN 1649 | Sierra Madre | Vasquez Rocks Park | 5.61 | 39.81 | 39.98 | 37 | RSN 788 | Loma Prieta | Piedmont Jr High School Grounds | 6.93 | 73.00 | 39.99 |
| 13 | IT-2012-0008 | Emilia 1st shock | S Zeno Di Montagna | 6.10 | 77.86 | 200.00 | 38 | RSN 4167 | Niigata, Japan | FKSH07 | 6.63 | 52.3 | 179.99 |
| 14 | EMSC-20161026_0000095 | Central Italy | Monte Murano | 5.90 | 48.95 | 124.81 | 39 | RSN 804 | Loma Prieta | So. San Francisco, Sierra Pt. | 6.90 | 63.10 | 25.00 |
| 15 | RSN 2805 | Chi-Chi Taiwan-04 | KAU003 | 6.20 | 116.20 | 60.00 | 40 | RSN 59 | San Fernando | Cedar Springs, Allen Ranch | 6.60 | 89.70 | 14.00 |
| 16 | ME-1979-0012 | Northwestern Balkan Peninsula | Hercegnovi Novi-O.S.D. Pavicic School | 6.20 | 30.7 | 24.58 | 41 | RSN 283 | Iprinia, Italy | Arienzo | 6.90 | 52.90 | 24.00 |
| 17 | RSN8168 | Parkfield-02, CA | Diablo Canyon Power Plant | 6.00 | 78.32 | 39.67 | 42 | RSN 5363 | Chuetsu-oki, Japan | TCGH17 | 6.80 | 102.41 | 237.99 |
| 18 | GR-1997-0019 | Ionean Sea | Kyparissia | 6.40 | 104.34 | 27.80 | 43 | RSN 6041 | El Mayor-Cucapah | San Diego Road Dept | 7.20 | 110.95 | 163.68 |
| 19 | IT-2012-0008 | Emilia 1st shock | Tregnago | 6.10 | 63.89 | 160.18 | 44 | RSN 5483 | Iwate, Japan | AKTH05 | 6.90 | 39.41 | 177.99 |
| 20 | EMSC-20161026_0000095 | Central Italy | Teramo | 5.90 | 41.70 | 187.49 | 45 | RSN 8167 | San Simeon, CA | Diablo Canyon Power Plant | 6.52 | 37.92 | 29.44 |
| 21 | RSN 3479 | Chi-Chi Taiwan-06 | TCU085 | 6.30 | 83.40 | 42.00 | 46 | RSN 4248 | Niigata, Japan | TCGH17 | 6.63 | 77.50 | 295.99 |
| 22 | RSN 2508 | Chi-Chi Taiwan-03 | CHY102 | 6.20 | 60.36 | 60.99 | 47 | RSN 1245 | Chi-Chi, Taiwan | CHY102 | 7.62 | 37.22 | 89.99 |
| 23 | RSN 80 | San Fernando | Pasadena—Old Seismo Lab | 6.61 | 21.50 | 101.10 | 48 | RSN 1257 | Chi-Chi, Taiwan | HWA003 | 7.62 | 56.14 | 64.99 |
| 24 | RSN 1011 | Northridge-01 | LA—Wonderland Ave | 6.69 | 20.29 | 29.98 | 49 | RSN 2107 | Denali, Alaska | Carlo (temp) | 7.90 | 50.90 | 60.00 |
| 25 | RSN 3925 | Tottori, Japan | OKYH07 | 6.61 | 15.23 | 299.99 |
| IMs | Units | Name | Formula | Ref. | |
|---|---|---|---|---|---|
| Structural Independent IMs | |||||
| Acceleration-based | PGA | [m/s2] | Peak Ground Acceleration | [31] | |
| RMSa | [m/s2] | Root-Mean-Square of Acceleration | [34] | ||
| Ia | [m/s] | Arias Intensity | [35] | ||
| Ic | - | Characteristic Intensity | [36] | ||
| CAV | [m/s] | Cumulative Absolute Velocity | [32] | ||
| SMA | [m/s2] | Sustained Maximum Acceleration | 3rd largest peak in acceleration time history | [33] | |
| EDA | [m/s2] | Effective Design Acceleration | Peak acceleration value after filtering out time history above 9 Hz | [32] | |
| A95 | [m/s2] | A95 Parameter | The acceleration level below which 95% of the total Arias intensity is contained | [38] | |
| Velocity-based | PGV | [m/s] | Peak Ground Velocity | [31] | |
| RMSv | [m/s] | Root-Mean-Square of Velocity | [34] | ||
| SED | [m/s2] | Specific Energy Density | [31] | ||
| SMV | [m/s] | Sustained Maximum Velocity | 3rd largest peak in velocity time history | [33] | |
| MIV | [m/s] | Maximum Incremental Velocity | Maximum area under the acceleration curve between two zero crossings of the accelerogram | [37] | |
| Displacement-based | PGD | [m] | Peak Ground Displacement | [31] | |
| RMSd | [m] | Root-Mean-Square of Displacement | [34] | ||
| PGV/PGA | [s] | Peak velocity to acceleration ratio | [31] | ||
| Structural Dependent IMs | |||||
| Spectral | Sa,T1 | [m/s2] | Spectral Acceleration Sa at the fundamental period T1 of the structure | [31] | |
| Sv,T1 | [m/s] | Spectral Velocity Sv at the fundamental period T1 of the structure | [31] | ||
| Sd,T1 | [m] | Spectral Displacement Sd at the fundamental period T1 of the structure | [31] | ||
| Integral | ASI | [m/s] | Acceleration Spectrum Intensity | [39] | |
| VSI | [m] | Velocity Spectrum Intensity | [39] | ||
| HI | [m] | Housner Intensity | [41] | ||
| Multi param. | Sa,avg | [m/s2] | Average Spectral Acceleration | [42] | |
| EDP|IM | dg (1) [cm] | ΙΜ (2) | βEDP|IM | |
|---|---|---|---|---|
| 0.0 | Scalar | 0.416 | ||
| Vector-valued | 0.410 | |||
| 0.387 | ||||
| 2.0 | Scalar | 0.381 | ||
| Vector-valued | 0.375 | |||
| 0.345 | ||||
| WP (3) | Scalar | 0.373 | ||
| Vector-valued | 0.365 | |||
| 0.335 | ||||
| WP (3) | Scalar | 0.197 | ||
| Vector-valued | 0.196 | |||
| 0.192 |
Disclaimer/Publisher’s Note: The statements, opinions and data contained in all publications are solely those of the individual author(s) and contributor(s) and not of MDPI and/or the editor(s). MDPI and/or the editor(s) disclaim responsibility for any injury to people or property resulting from any ideas, methods, instructions or products referred to in the content. |
© 2023 by the authors. Licensee MDPI, Basel, Switzerland. This article is an open access article distributed under the terms and conditions of the Creative Commons Attribution (CC BY) license (https://creativecommons.org/licenses/by/4.0/).
Share and Cite
Flenga, M.G.; Favvata, M.J. The Effect of Magnitude Mw and Distance Rrup on the Fragility Assessment of a Multistory RC Frame Due to Earthquake-Induced Structural Pounding. Buildings 2023, 13, 1832. https://doi.org/10.3390/buildings13071832
Flenga MG, Favvata MJ. The Effect of Magnitude Mw and Distance Rrup on the Fragility Assessment of a Multistory RC Frame Due to Earthquake-Induced Structural Pounding. Buildings. 2023; 13(7):1832. https://doi.org/10.3390/buildings13071832
Chicago/Turabian StyleFlenga, Maria G., and Maria J. Favvata. 2023. "The Effect of Magnitude Mw and Distance Rrup on the Fragility Assessment of a Multistory RC Frame Due to Earthquake-Induced Structural Pounding" Buildings 13, no. 7: 1832. https://doi.org/10.3390/buildings13071832