Article

A Fourier Series-Based Multi-Point Excitation Model for Crowd Jumping Loads

1
School of Hydraulic and Civil Engineering, Zhengzhou University, Zhengzhou 450001, China
2
Shenxian Yellow River Bureau, Liaocheng Yellow River Bureau, Shenxian, Liaocheng 252400, China
3
Henan Urban Planning Institute and Corporation, Zhengzhou 450044, China
4
Shaanxi Public Resources Trading Center, Xi’an 710000, China
5
College of Geography and Environmental Science, Henan University, Kaifeng 475004, China
*
Author to whom correspondence should be addressed.
Buildings 2023, 13(7), 1782; https://doi.org/10.3390/buildings13071782
Submission received: 9 June 2023 / Revised: 3 July 2023 / Accepted: 11 July 2023 / Published: 13 July 2023
(This article belongs to the Special Issue Advances and Applications in Geotechnical and Structural Engineering)

Abstract

:
Crowd jumping loads are often simplified to a single-point excitation in the existing Fourier series-based models, most of which lack the data support of crowd jumping experiments. A Fourier series-based multi-point excitation model for crowd jumping loads is herein developed, where two parameters, the jumping frequency, and the time lag shift, are selected to quantify the crowd synchronization. After the verification of 3D motion capture technology, the probability distributions of the jumping frequency and the time lag shift are modeled based on the crowd jumping experiment, in which the trajectories of the reflective markers of 48 test subjects were simultaneously recorded by 3D motion capture technology. Through repeated sampling, the jumping load of each person in a crowd is simulated. This model could offer a useful method for evaluating the vibration performance of assembly structures like grandstands, gymnasiums, and concert venues.

1. Introduction

Modern assembly structures, such as long-span floors, pedestrian bridges, and grandstands, have been distinguished by their low natural frequencies and damping ratios owing to the extensive use of lightweight and high-strength building materials [1,2,3,4]. Consequently, issues with safety and structural vibration serviceability due to crowd activities are becoming more evident, which could lead to significant financial loss [5] and even fatalities in rare instances [6]. One notorious instance of this occurred on the London Millennium Bridge in 2000, in which pedestrians caused severe lateral vibrations to the bridge [7]. The bridge was shut down for three days after its official opening, and five million pounds were spent on fixing the vibration problem. During a football game held in Corsica in 1992, a grandstand collapsed due to the rhythmic activities of the audience, with 18 people killed and more than 2500 injured [8]. Compared with other common activities, the action of jumping, which is considered to produce the most significant vertical loads [9,10], particularly when the crowd is coordinated by music and slogans, is the subject of interest in this paper.
A load model is necessary to evaluate the vibration performance of a structure subjected to a jumping activity, either in the design stage or the as-built stage [11]. Plenty of studies on individual jumping loads have been conducted, and the load models have been well established accordingly [12,13,14,15,16]. However, practical engineering structures are usually faced with crowd-jumping loads. When a crowd jumps to a music beat, perfect synchronization is unlikely to be achieved [17], which attenuates the action of the crowd jumping and consequently structural responses. Therefore, only individual jumping load models can satisfy the assessment of structural vibration performance induced by a crowd jumping activity.
Different jumping persons are located at different positions of a structure, so crowd jumping loads belong to multi-point excitations [18]. Research on crowd jumping loads is still limited since the modeling of multi-point excitations is complicated and the experiment for a large crowd is quite difficult to carry out. Considering that a jumping activity is approximate and periodic, a Fourier series model is commonly adopted to represent crowd jumping loads [19,20,21,22]. These models consist of a Fourier series to represent individual jumping loads and a coordination factor to represent crowd synchronization, which is related to the jumping frequency and crowd size. The coordination factor essentially characterizes the average of each jumping load in a crowd, which simplifies a multi-point excitation to a single-point excitation. Consequently, the modal value of each person cannot be considered in the calculation of structural responses, which could result in errors, especially for structures with complex vibration shapes. Moreover, most of the models lack the data support of a large crowd jumping experiment [19,20,21].
As for the modeling of other multi-point dynamic excitations in civil engineering, such as seismic ground motion fields [23,24] and fluctuating wind fields [25], multi-point excitation models are established to reflect the space-time variation of the excitation. These models are used to simulate the time history of the excitation at each site. Therefore, a Fourier series-based multi-point excitation model for crowd jumping loads is established in this study so that the modal value of each person is accurately considered in the calculation of the structural response. In the proposed model, the jumping frequency and the time lag shift are selected instead of the coordination factor to quantify crowd synchronization. This model could be adopted to simulate the jumping load of each person in a crowd instead of the average of the crowd’s jumping loads. Moreover, the rapid development of computer vision technology provides an alternative way to conduct the crowd jumping experiment [26,27,28], in which human-induced loads are indirectly measured by recording the displacements of a body’s certain nodes. Therefore, 3D motion capture technology (MCT), a common computer vision-based testing method, is introduced in this study to record crowd-jumping loads. The paper begins with the arrangement of the verification experiment for 3D MCT and the crowd jumping experiment using 3D MCT. This is followed by the mathematical representation of the Fourier series-based multi-point excitation model and the procedure for obtaining the probability distributions of the key parameters. Afterward, the procedure for simulating crowd jumping loads is summarized, and the simulation is compared with the models in current design codes.

2. Experimental Arrangement

Three-dimensional MCT is a computer vision technology. Its advantage is that it can simultaneously record the load time history of each person in a large-scale jumping crowd. In this study, 18 high-speed infrared cameras were used to record the time histories of 48 jumping people. As for force plates, due to their high price, it is difficult to carry out large-scale crowd load tests. Therefore, this study uses 3D MCT to carry out crowd loading tests.

2.1. Verification Experiment for 3D MCT

In the crowd jumping experiment using 3D MCT, reflective markers are attached to the skin of a body’s certain nodes, and the displacements of the reflective markers are captured by multiple high-speed infrared cameras. Then, the assumption of the rigid body model is introduced to convert these displacements into jumping loads. Therefore, the verification experiment was conducted to prove the applicability of 3D MCT. The experiment was conducted in a gait analysis laboratory in Shanghai, which is equipped with a motion analysis system (Vicon Motion Systems Ltd., Yarnton, UK), involving ten high-speed infrared cameras (Vicon T40, Oxford, UK) and four force plates (AMTI OR6-7 2000, Washington, DC, USA). Two test subjects were asked to jump at four different frequencies: 1.5, 2.0, 2.67, and 3.5 Hz, guided by a metronome. As shown in Figure 1, one reflective marker was attached to the clavicle of each test subject. The trajectories of the reflective markers and the jumping forces of two test subjects were simultaneously recorded by the motion analysis system at a sampling interval of 0.01 s. More details about the experiment can be found in [29].
The weight-normalized jumping load F ¯ t could be yielded by both force plates and 3D MCT, as calculated by Equations (1) and (2), respectively.
F ¯ t = F grf t / G
where F grf t is the ground reaction force recorded by the force plate, and G is the body weight.
F ¯ t = F ma t / g + 1
where F ma t is the acceleration of the reflective marker, and g is the gravity acceleration. F ¯ t obtained by these two methods are compared in Figure 2, in which it is observed that the amplitudes F ¯ t are inconsistent. Consequently, accurate crowd jumping loads cannot be obtained by 3D MCT due to the introduction of the rigid body assumption. Nevertheless, consistent phases could be obtained by these two methods, such as the start time and the end time of each jumping impulse, which are the keys to crowd synchronization. The feasibility of 3D MCT will be further verified in Section 3.2 according to the established model of crowd jump loads.

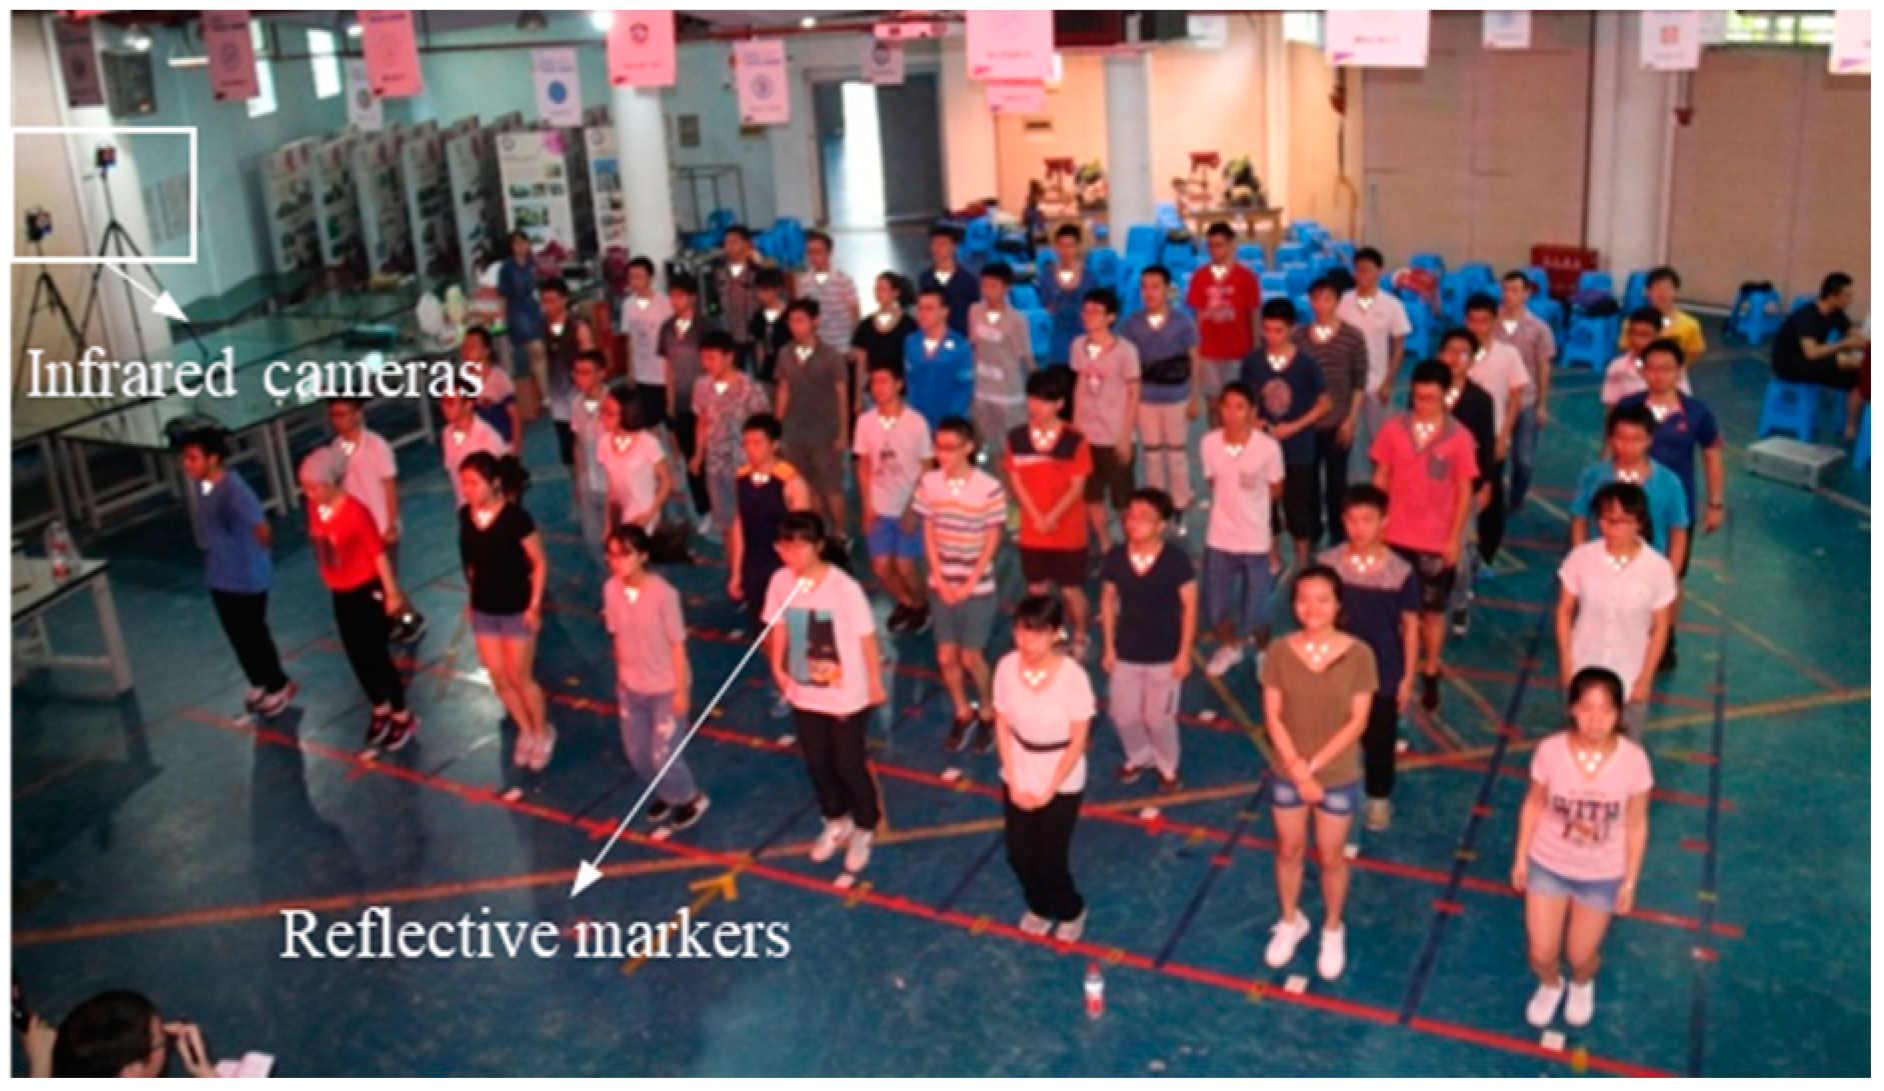
2.2. Crowd Jumping Experiment

A crowd jumping experiment using 3D MCT was conducted on the rigid ground, and a motion analysis system (Vicon Motion Systems Ltd., Yarnton, UK) was installed at the site, involving 18 high-speed infrared cameras (Vicon T160, Oxford, UK). A total of 96 test subjects who passed a preliminary fitness test participated in the experiment. The test was conducted for two days with 48 test subjects each day. With a spacing of 1 m in both directions, the participants were set up in six rows and eight columns. (see Figure 3). The crowd was asked to jump together to a metronome-guided frequency, which was randomly selected from 1.5 to 3.5 Hz with an interval of 0.1 Hz, i.e., 21 metronome frequencies were tested in total. Three to five iterations of the same beat frequency test were conducted, in which each crowd jumping activity lasted about 30 s. During the test, three reflective markers were attached to the clavicle of each test subject, and the trajectories of all the reflective markers were simultaneously recorded by the motion analysis system at a sampling interval of 0.01 s. More details about the experiment can be found in [29].
The vertical acceleration of the reflective marker is adopted to obtain F ¯ t of each test subject using Equation (2). The three reflective markers of the same test subject were all attached to his/her clavicle, so F ¯ t obtained by these reflective markers are consistent. In addition, the reflective markers might be blocked during the test. Therefore, the average of F ¯ t from all available reflective markers is calculated and employed as a representative F ¯ t of the test subject. Then, the weight-normalized crowd jumping loads of each test case are obtained, as displayed in Figure 4. To make it clear, the first 4-s duration is plotted with the global mean (the average value of the jump load time history of all the people) as a thick, solid line.

3. Development of the Crowd Jumping Load Model

3.1. Mathematical Representation

Generally, a Fourier series-based model for individual jumping loads is expressed as
F ( t ) = G 1 + i = 1 m r i sin 2 i π f j t + φ i
where G is the body weight, ri, and φi are the dynamic load factor (DLF) and the phase angle of the ith harmonic, fj is the jumping frequency, and m is the number of the Fourier terms considered.
Different people are not perfectly synchronized in a jumping crowd. Kasperski and Agu [20] employed the impact factor, the contact ratio, the jumping frequency, and the phase difference in crowd jumping load simulation. The impact factor and the contact ratio mainly affect ri and φi, and the jumping frequency and the phase difference of different people mainly affect crowd synchronization. Similarly, Ellis and Ji [19] considered the variations of the contact ratio, the jumping frequency, and the relative phase in the determination of ri, φi and the coordination factor. They proposed to include a further phase difference ψ describing the time history of different people’s jumping loads in the crowd jumping load model.
F ( t ) = G 1 + i = 1 m r i sin 2 i π f j t + φ i + i ψ
Moreover, ψ could be further transformed into the time lag shift Δt by
Δ t = ψ 2 π f j
Considering the variation of ri, φi, fj and Δt for different jumping people, a Fourier series-based multi-point excitation model for crowd jumping loads F 1 ( t ) , F 2 ( t ) , , F n ( t ) is expressed as
F k ( t ) = G k 1 + i = 1 m r i , k sin 2 i π f j , k t + Δ t k + φ i , k k = 1 , 2 , , n
where the subscript k represents the kth jumping person, and n is the crowd size, i.e., the number of jumping people. The value of Gk could refer to the statistics of the body weight of local residents. The values of ri,k, and φi,k could be found in existing literature, such as those provided by Ellis and Ji [12,19], Parkhouse and Ewins [21], BRE Digest 2004 [30], and ISO 10137 2007 [31]. Thus, the experimental data on crowd jumping load in Section 2.2 will be analyzed to obtain the values of f j , 1 , f j , 2 , , f j , n and Δ t 1 , Δ t 2 , , Δ t n .

3.2. Verification for 3D MCT

Before the analysis of the experimental data of crowd jumping loads, verification of whether accurate samples of f j , 1 , f j , 2 , , f j , n and Δ t 1 , Δ t 2 , , Δ t n could be obtained by 3D MCT is required. Therefore, the jumping frequency and the time difference obtained by force plates are compared with their counterparts obtained by 3D MCT using the experimental data in Section 2.1.
The dominant frequency fj of a recorded jumping load is obtained from its auto-power spectral density (PSD) by identifying the location of the maximum value of the auto-PSD, as illustrated in Figure 5.
The time difference between any two people in a jumping crowd is the basis for obtaining the crowd’s time lag shift Δ t 1 , Δ t 2 , , Δ t n . The time difference Δtkl between the kth person’s jumping load F k t and the lth person’s jumping load F l t is identified from their cross-correlation function c k l τ ,
c k l τ = E F k t F l t + τ = E F k t F k t + τ Δ t k l = c k k τ Δ t k l
where c k k τ Δ t k l reaches its maximum value when τ = Δ t k l . Therefore, τ corresponding to the maximum value of c k l τ is identified as the time difference Δtkl. Then, Δtkl and fj are identified for all the test cases in the verification experiment. The results are listed in Table 1, where the superscripts # and ^ denote the results from force plates and 3D MCT, respectively. It is noted that the values of Δtkl and fj between force plates and 3D MCT are almost identical, which demonstrates that crowd jumping loads recorded by 3D MCT could be adopted in the determination of Δ t 1 , Δ t 2 , , Δ t n and f j , 1 , f j , 2 , , f j , n in Equation (6).

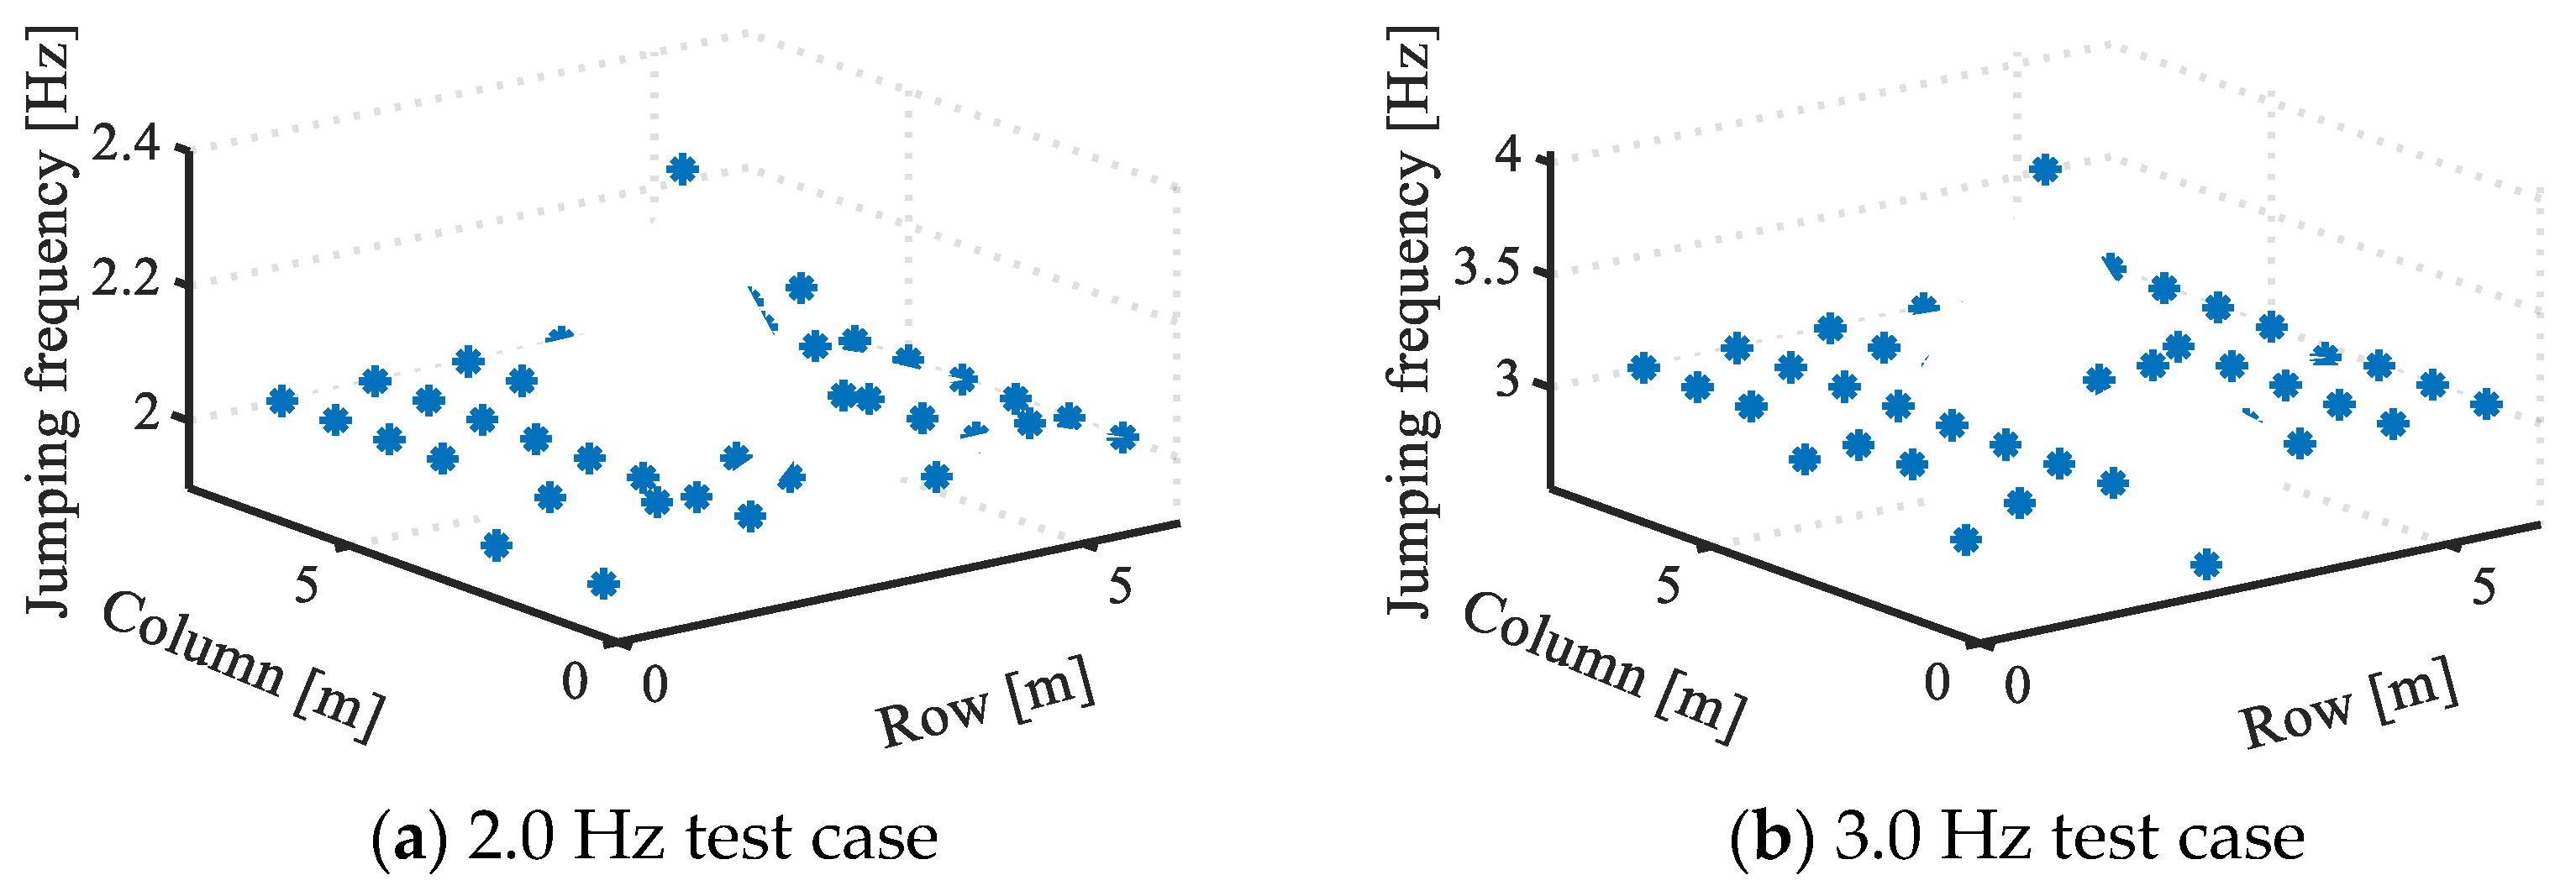
3.3. Jumping Frequency
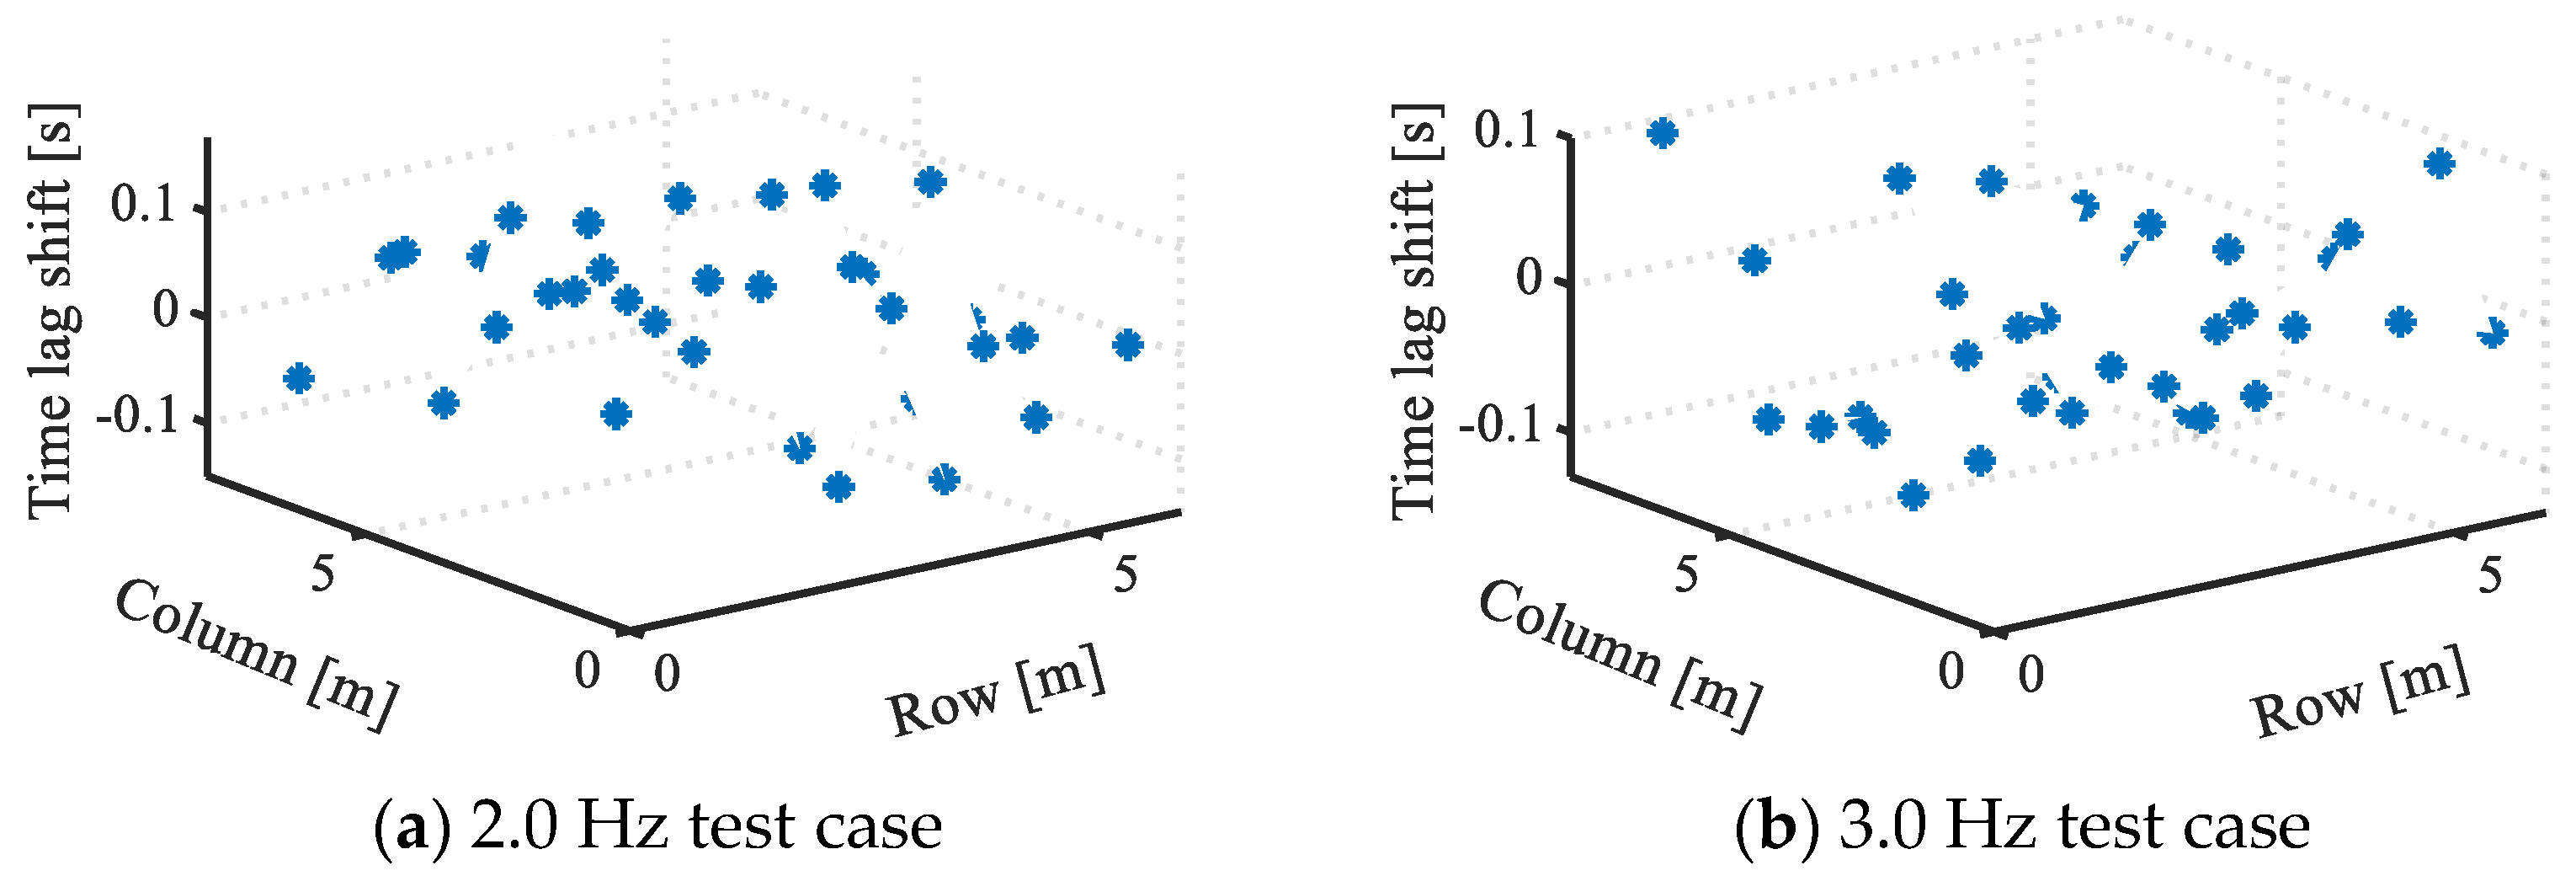
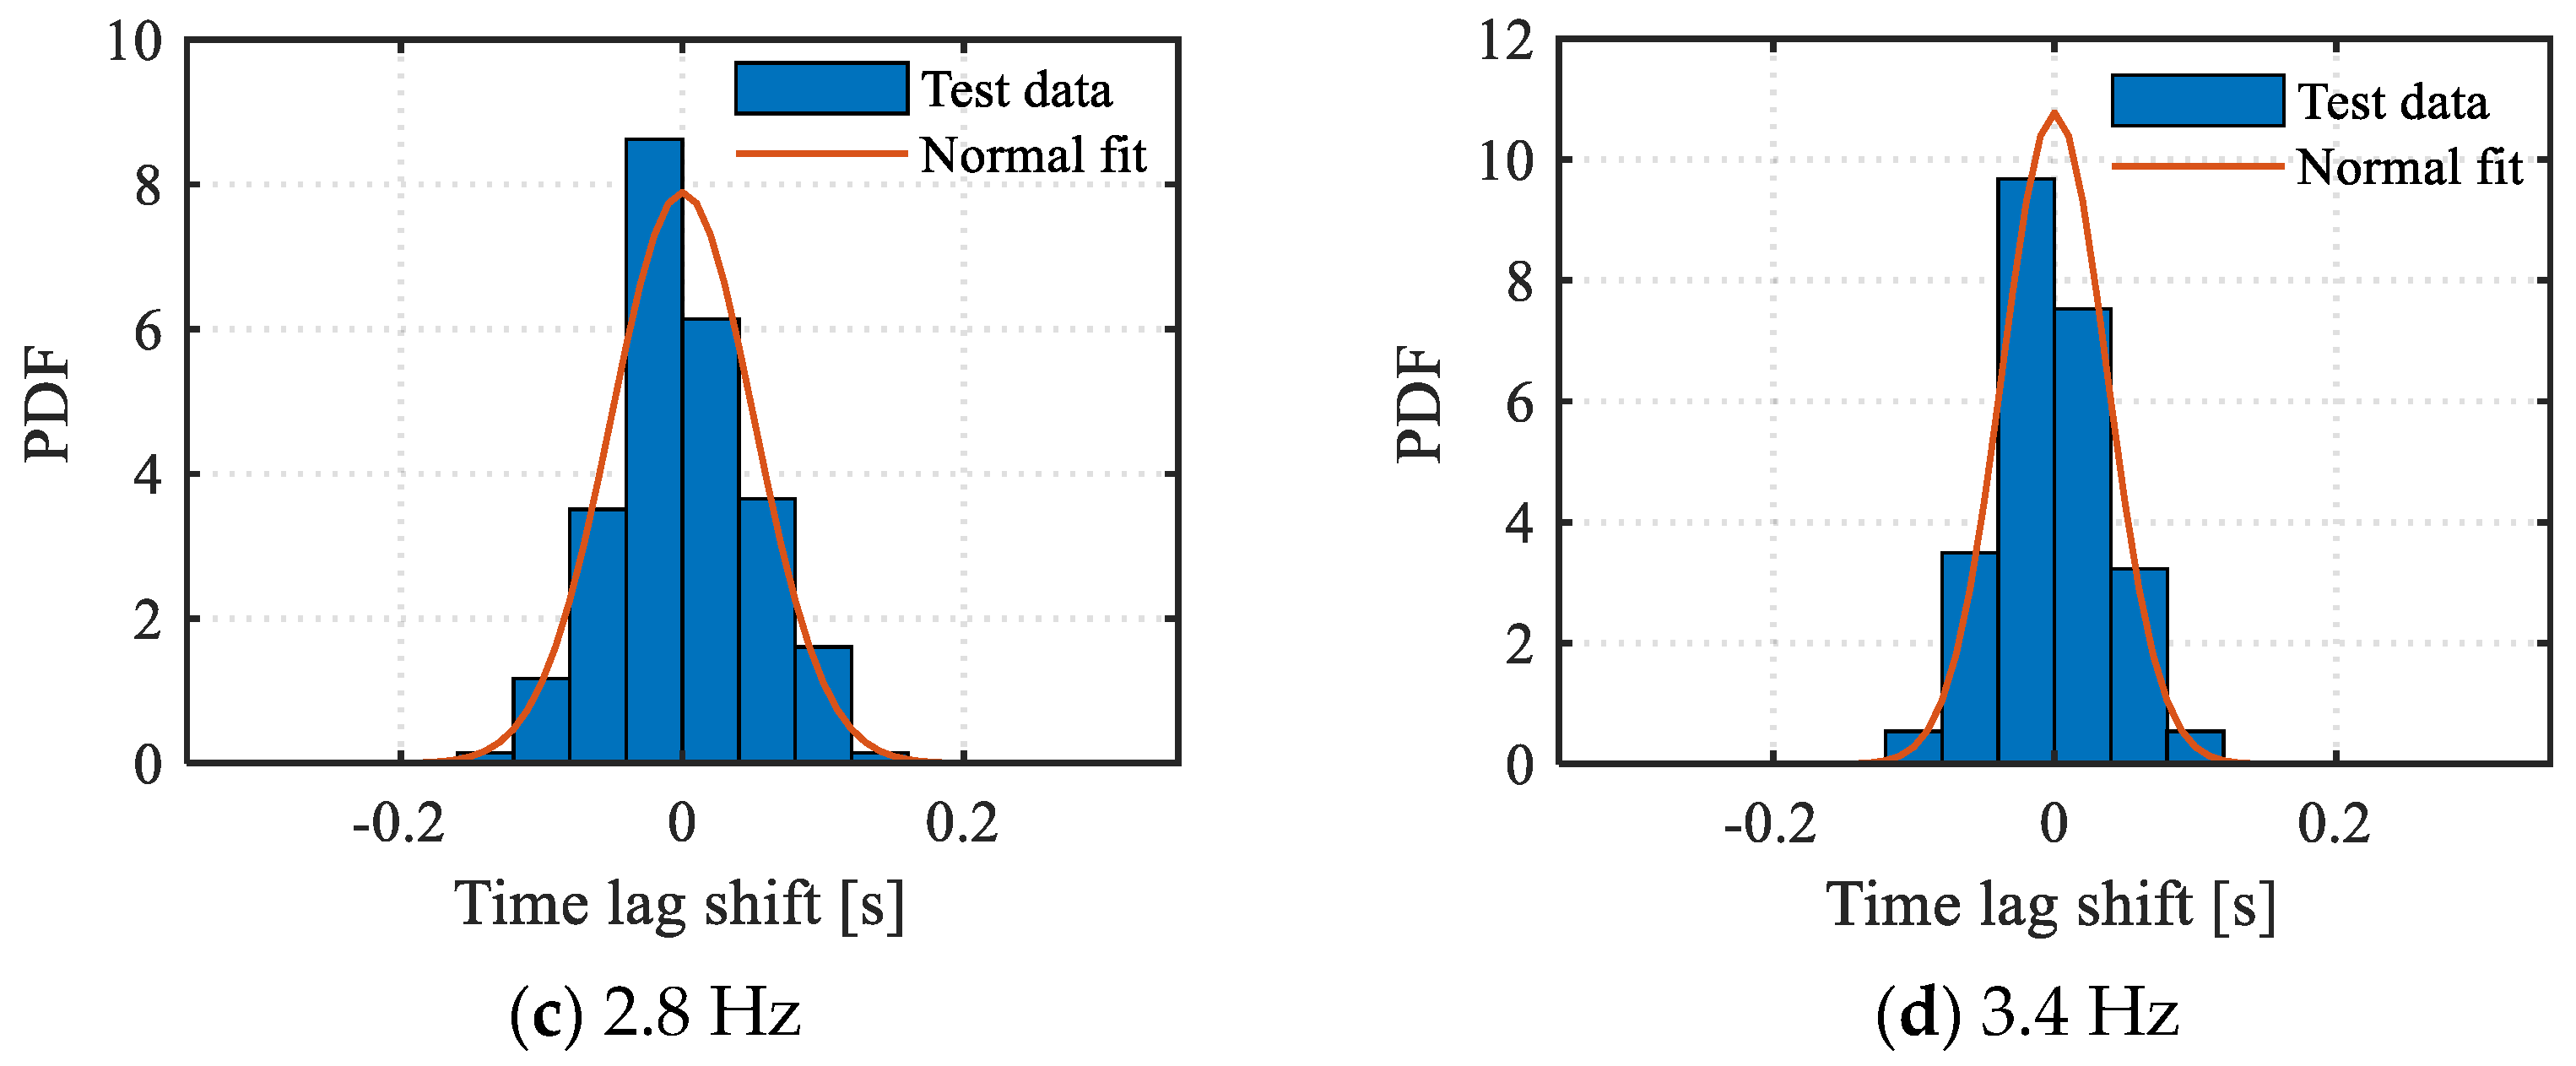
Because everyone’s sense of rhythm differs, it happens frequently that some people who jump can keep up with the beat while others cannot. An examination of the experimental data also reveals that not all of the test subjects were able to jump at the metronome’s guided frequency. The jumping frequency fj of each test subject is identified through the corresponding auto-PSD, as detailed in Figure 5. The plots showing the location and fj of each test subject in one jump are displayed in Figure 6, in which no clear pattern is observed. Hence, the current experimental records are not enough to identify the relationship between location and fj. Moreover, crowd synchronization depends on the dispersion degree of fj. Hence, fj with the same metronome frequency is statistically analyzed to determine the probability distribution of fj.
The histograms of fj for four typical metronome frequencies are displayed in Figure 7, where it is observed that these histograms do not closely resemble well-known probability distribution functions. Hence, Gaussian kernel density estimation [32] is adopted to establish the probability distribution for fj, as illustrated in Figure 7. These probability distributions will be employed in Section 4.1 to simulate fj in a jumping crowd.
To further quantify the sense of rhythm in a jumping crowd intuitively, the average f ¯ j and the standard deviation σj of fj are provided in Table 2. Moreover, to better describe experimental results, metronome frequency fs within 1.8–3.0 Hz is labeled as easy guidance, and fs outside 1.8–3.0 Hz is labeled as difficult guidance. The difference between f ¯ j and fs for difficult guidance is larger than that for easy guidance, and σj for difficult guidance is also larger than that for easy guidance. It indicates that it is difficult for a jumping crowd to keep up with the beat for difficult guidance, and better synchronization could be achieved for easy guidance.

3.4. Time Lag Shift

As detailed in Section 3.3, not all jumping people could keep up with the guidance, and the time lag shift Δ t 1 , Δ t 2 , , Δ t n of a crowd is correlated to fj. Therefore, the load records collected in Section 2.2 are filtered to remove those whose fj is outside fs ± 0.025 Hz. Then, Δ t 1 , Δ t 2 , , Δ t n is obtained by the time difference Δtkl of any two persons in a jumping crowd:
Δ t k l = Δ t k l Δ t k 1 k = 1 , 2 , , n , l = 1 , 2 , , n
Δ t l = 1 n k = 1 n Δ t k l l = 1 , 2 , , n
where Δtkl is calculated by Equation (7). It is hypothesized that Δtkl holds on the closure property for one jump, i.e., the following relation holds true algebraically:
Δ t k l = Δ t k p + Δ t p l
Consequently, each row of the matrix Δ t k l formed by Δ t k l is a set of Δ t 1 , Δ t 2 , , Δ t n for one jump, and all the rows of Δ t k l should be equal due to the closure property. Then, each column of Δ t k l is averaged to obtain the representative Δ t 1 , Δ t 2 , , Δ t n of the jump, as instructed by Equation (9). Moreover, to further verify the closure property, the closure errors Δ t ¯ e for all test cases are calculated by Equations (11) and (12), and the results are listed in Table 3. It is observed that Δ t ¯ e for most of the test cases, the sampling interval is less than 0.01 s, verifying the closure property of Δtkl.
Δ t k l e = Δ t k l Δ t l ( k = 1 , 2 , , n , l = 1 , 2 , , n )
Δ t ¯ e = 1 n 2 k = 1 n l = 1 n Δ t k l e
The plots showing the location and Δt of each test subject are displayed in Figure 8, in which no clear pattern is observed. Therefore, it is hard to identify the relationship between the location and Δt using current experimental records. Moreover, the synchronization of the jumping crowd depends on the dispersion degree of Δt. Hence, the average Δ t 1 , Δ t 2 , , Δ t n for each jump is changed to zero, and Δt of the same fj is statistically analyzed to determine the probability distribution of Δt. As illustrated in Figure 9, Δt follows a normal distribution (0, σ t 2 ), and a power function is employed to establish the relation between σt and fj:
σ t = 0.3691 × f j 3.802 + 0.0388
To further quantify the synchronization of jumping crowds intuitively, σt and the standard deviation σψ of the phase difference ψ are listed in Table 4, in which it is observed that σψ for difficult guidance is larger than that for easy guidance. It indicates better synchronization is achieved for easy guidance.

4. Crowd Jumping Load Simulation

4.1. Procedure for Simulating Crowd Jumping Loads

So far, the mathematical models of crowd jumping loads as well as the probability distributions of the jumping frequency and the time lag shift have been developed in Section 3. Then, crowd-jumping loads could be simulated by the flow chart in Figure 10. Commonly, it is assumed that the metronome frequency is equal to the natural frequency of a certain vibration mode of the structure to capture the resonance mode.

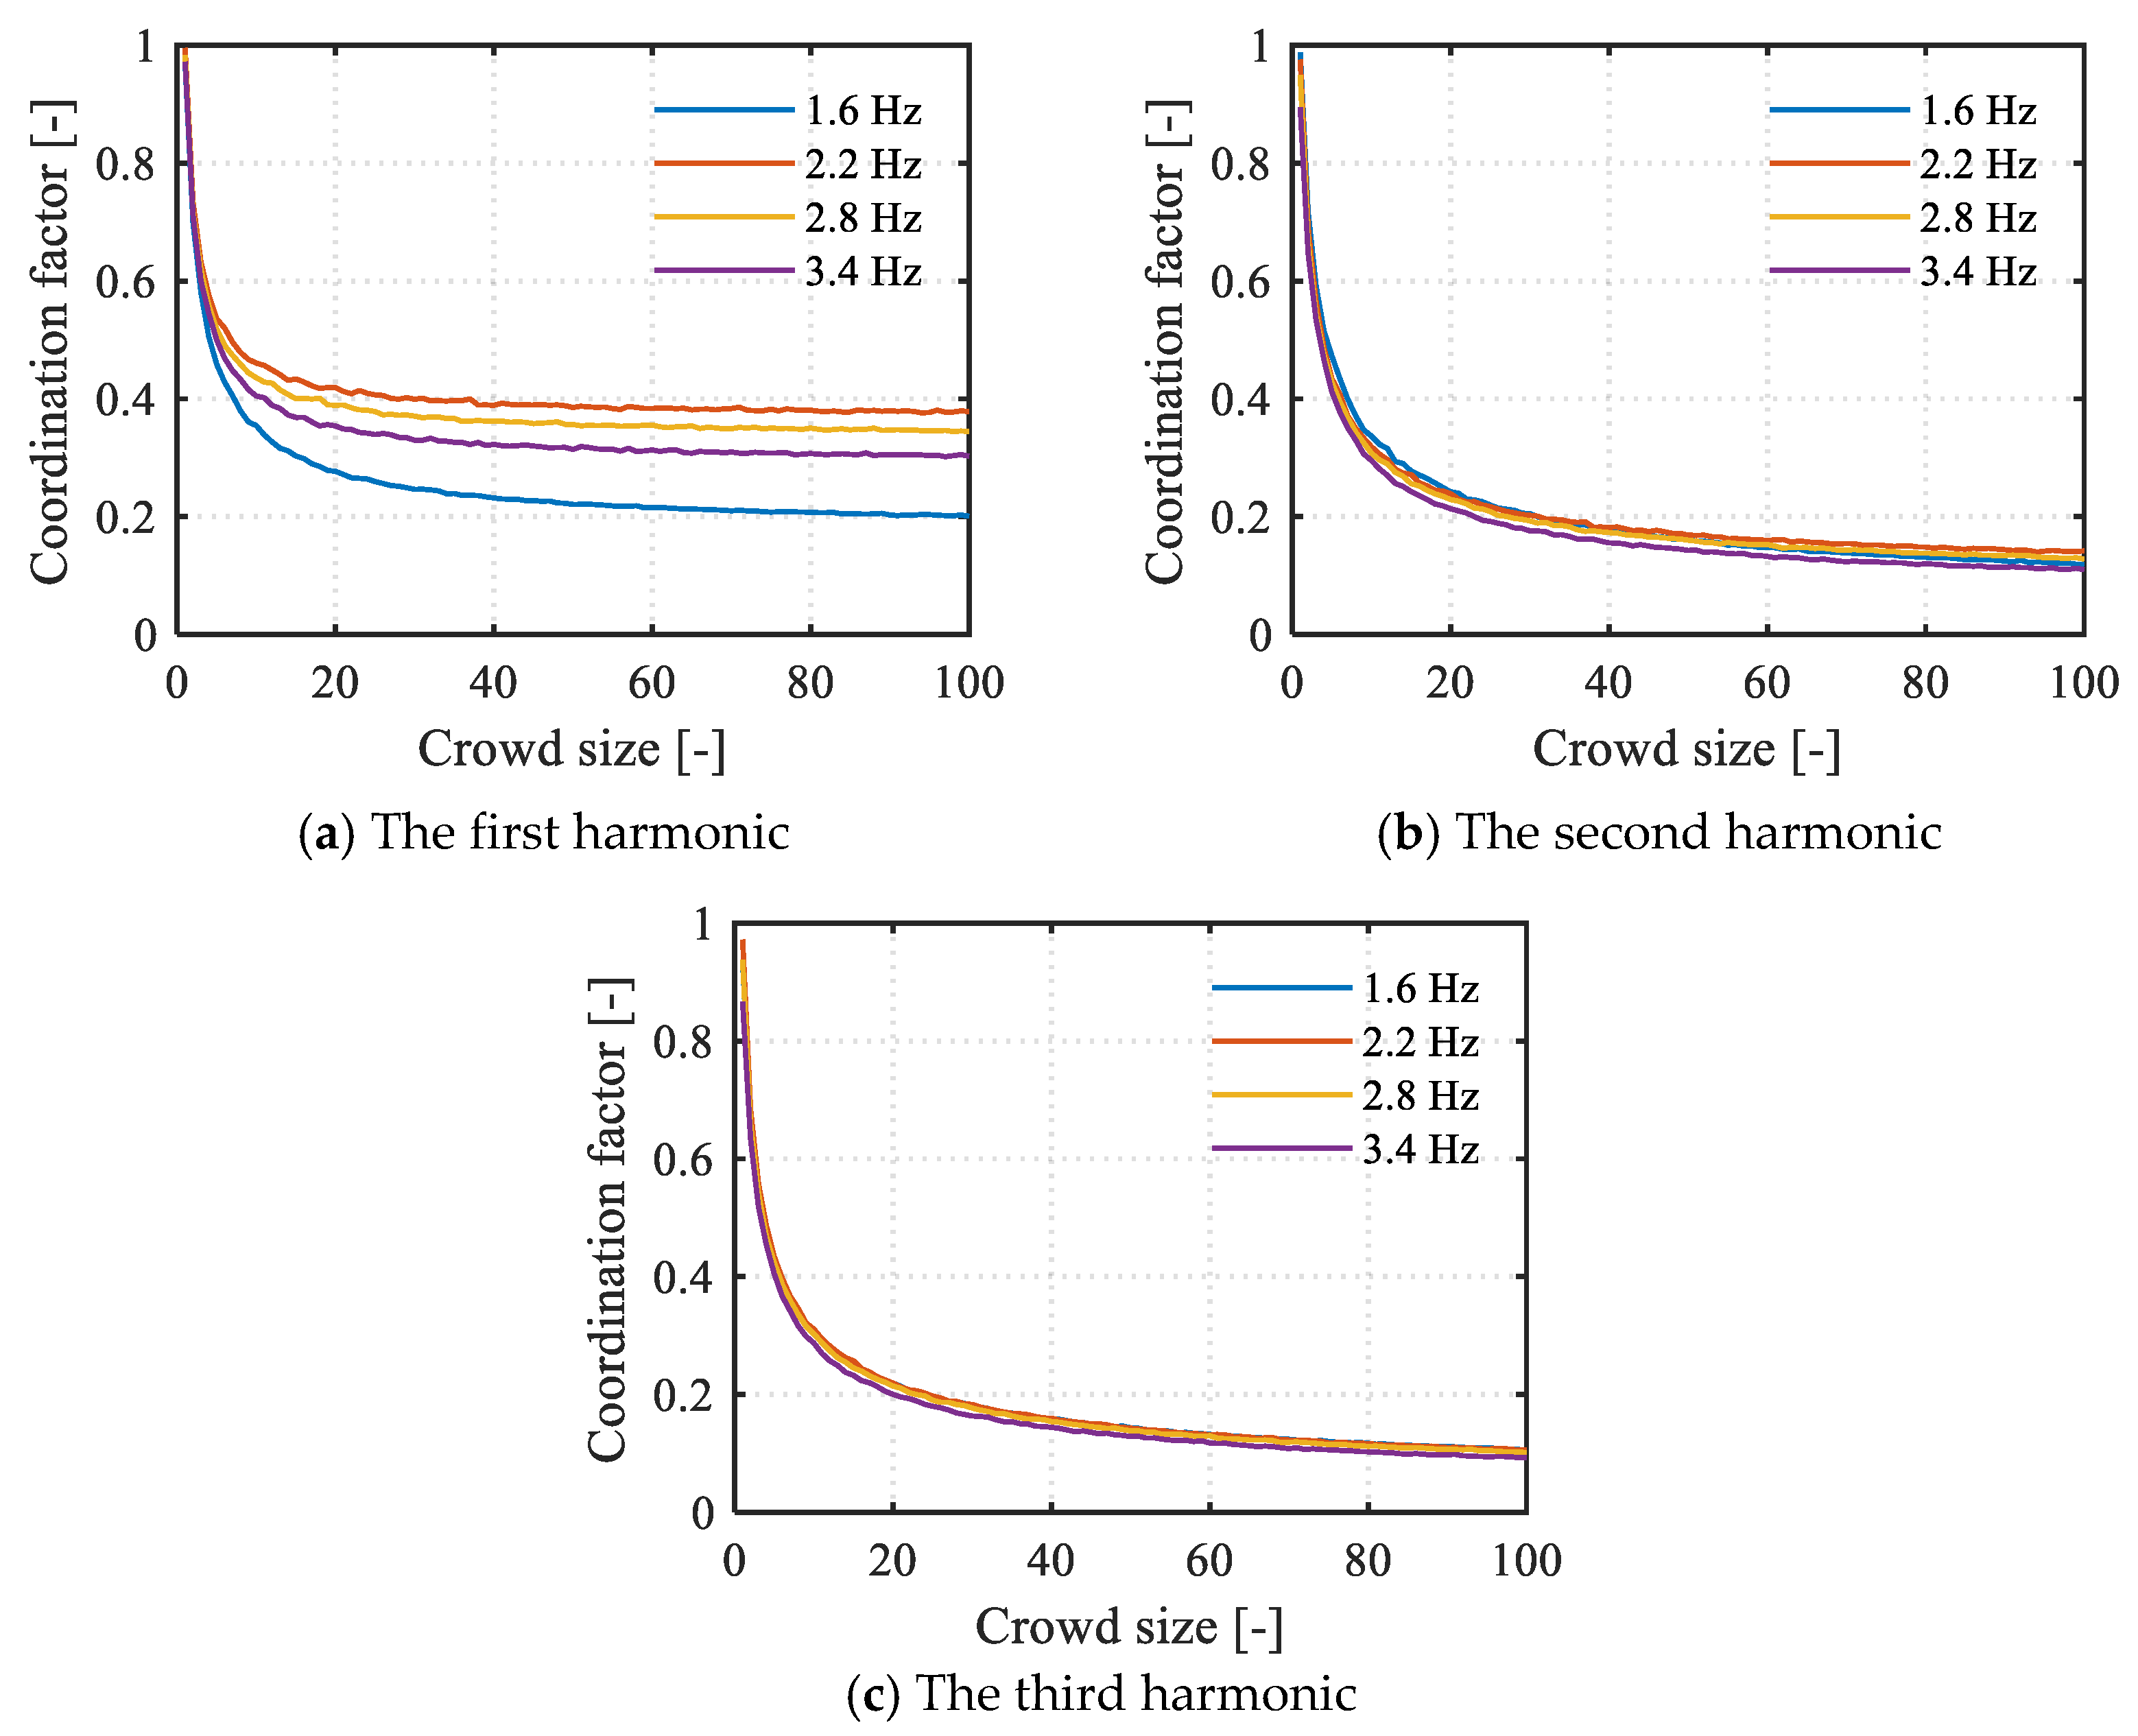
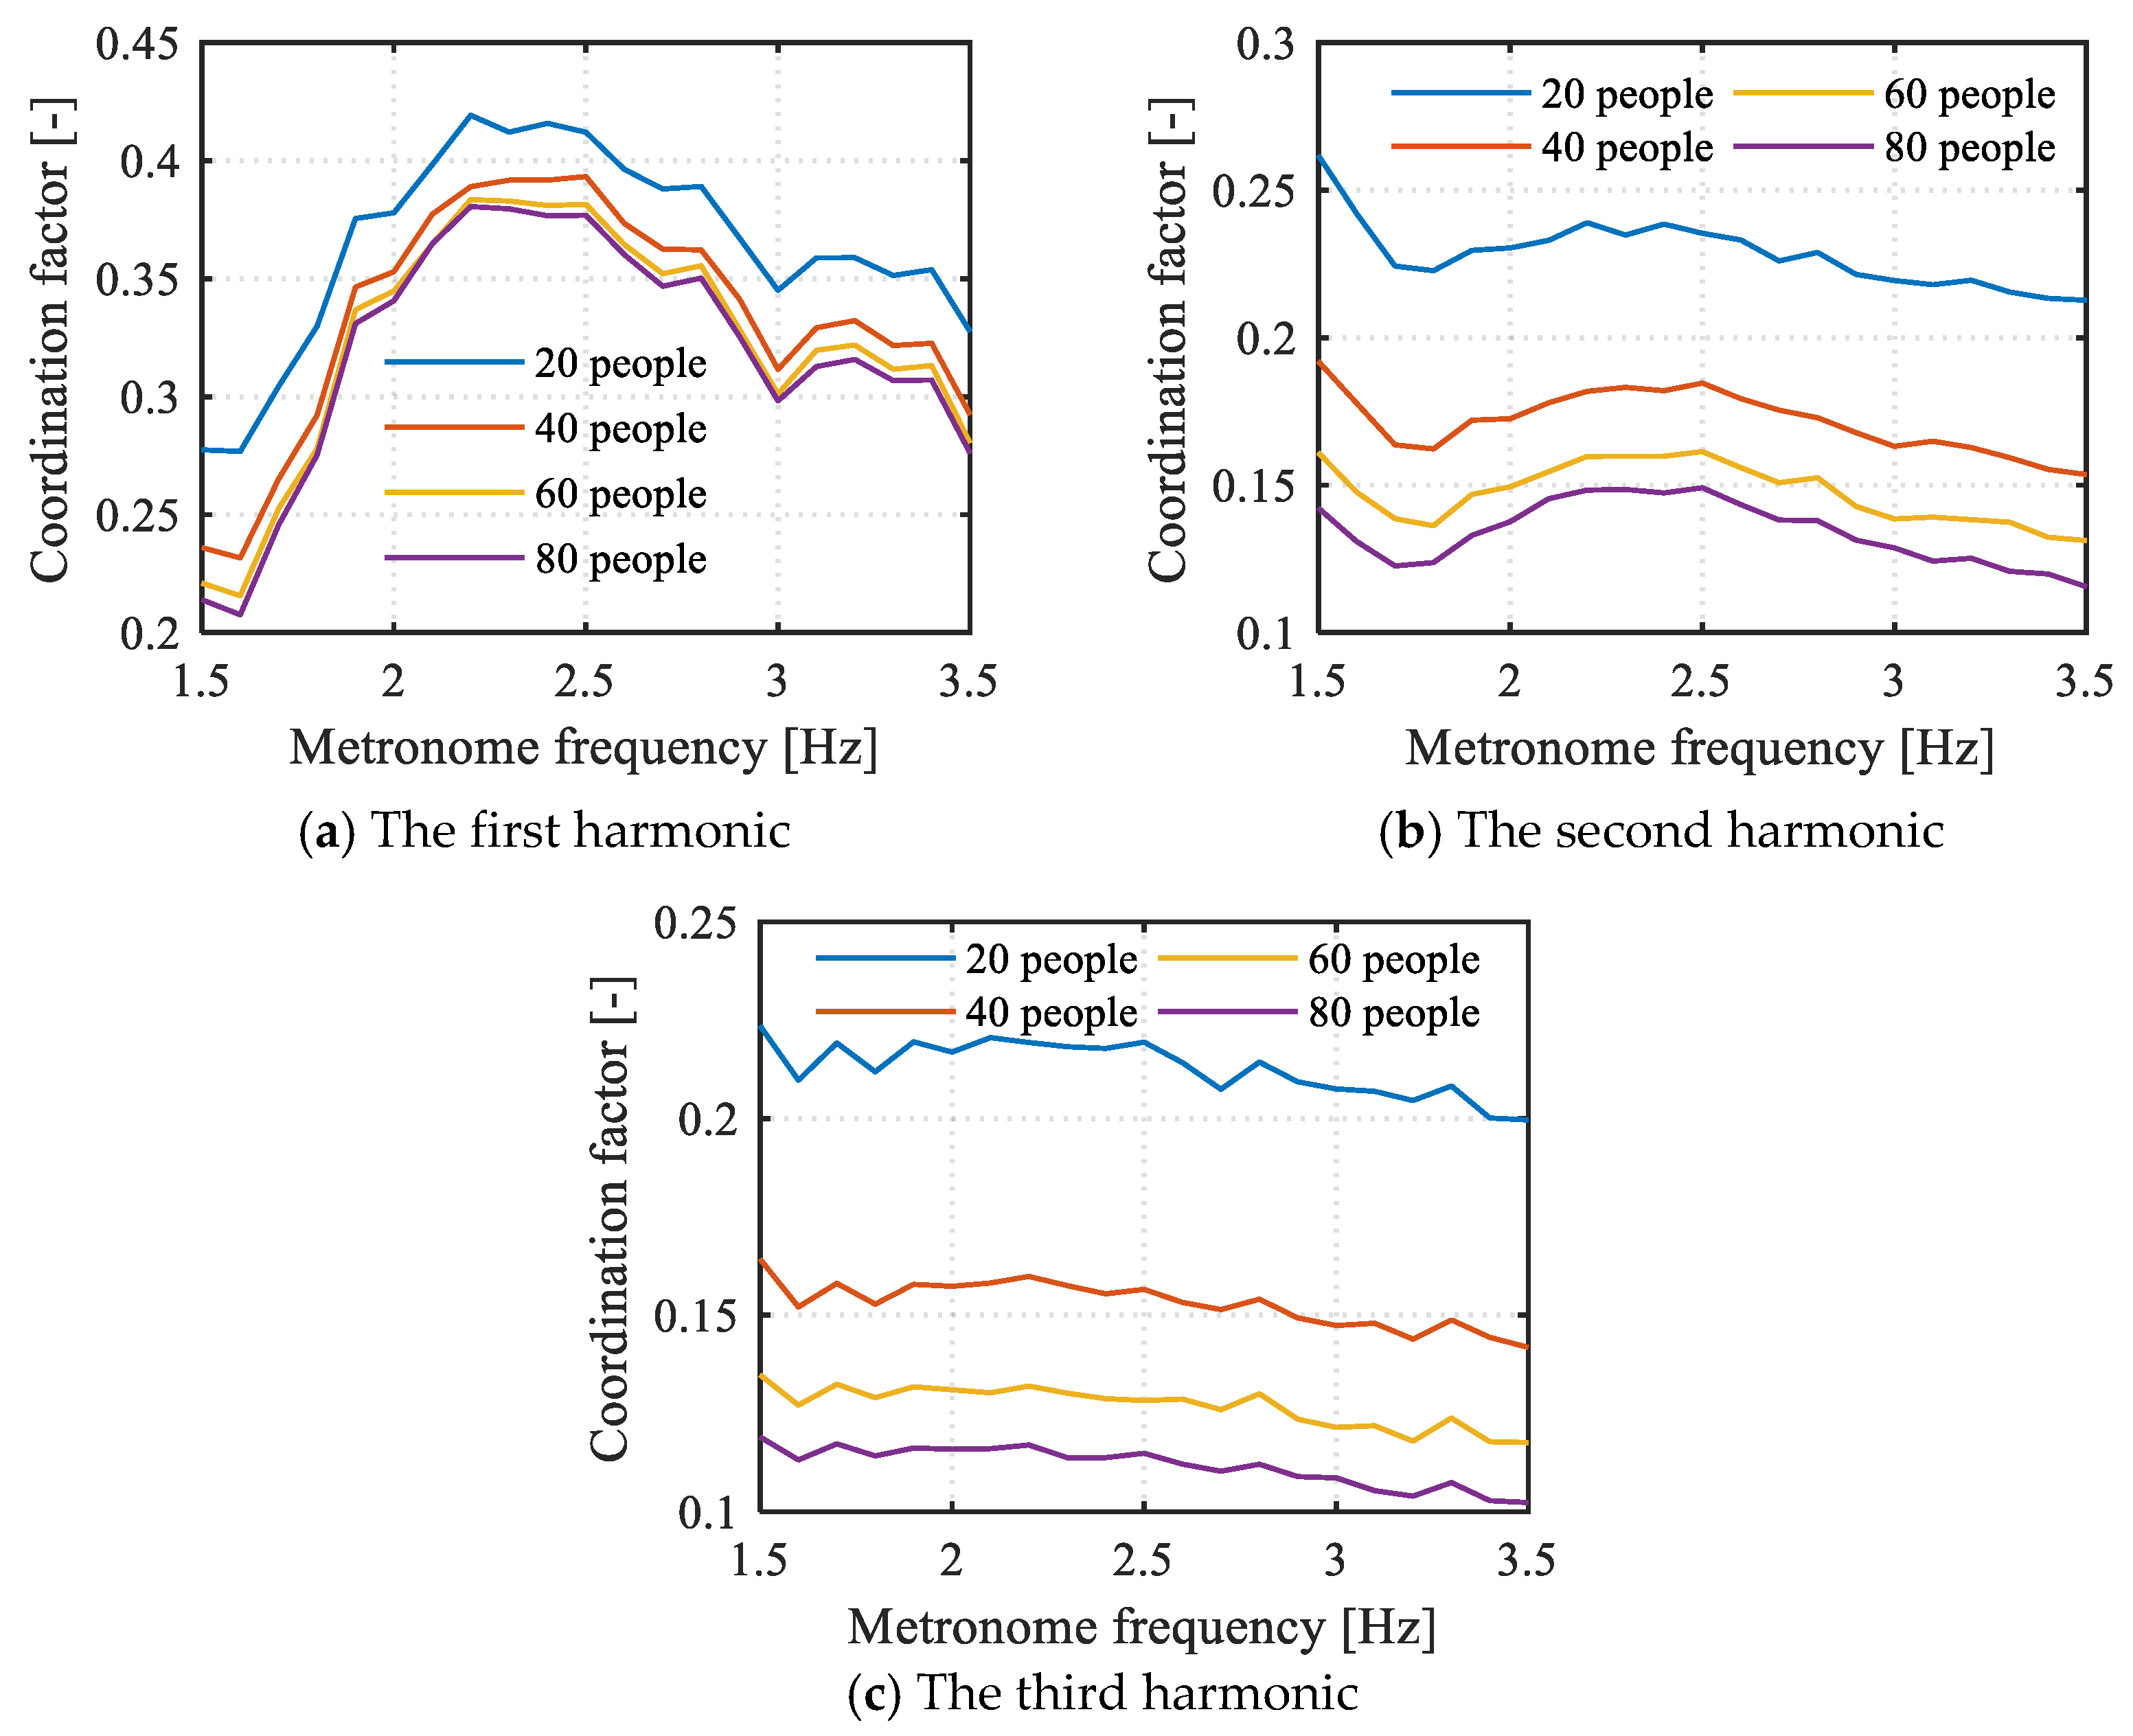
4.2. Coordination Factor of Simulated Crowd Jumping Loads

To further intuitively yield crowd synchronization, crowd jumping loads simulated by the procedure in Section 4.1 are adopted to obtain the coordination factor ci:
c i = r ¯ i r i
where the subscript i represents the ith harmonic, r ¯ i is the DLF for the average of crowd jumping loads, and ri is the DLF for individual jumping loads. Only the first three harmonics of crowd jumping loads are considered in simulation, i.e., i = 1, 2, 3, because the load energy of the rest harmonics is negligible [33]. Coordination factor ci tends to be a constant when crowd size n is beyond 50. Therefore, n takes 1–100 with an interval of 1 in simulation to fully demonstrate the synchronization of the jumping crowd. In addition, metronome frequency fs takes 1.5–3.5 Hz with an interval of 0.1 Hz, as suggested by ISO 10137 2007 [31]. Then, 10,000 samples of crowd jumping loads are simulated for each fs and n, in which r1, r2, r3, φ1, φ2 and φ3 of each person adopt 1.61, 0.94, 0.44, π/6, −π/6 and −π/2, respectively, as suggested by BRE Digest 2004 [30]. Hereafter, ci is calculated by Equation (14), and the average of 10,000 simulated ci is displayed in Figure 11, Figure 12 and Figure 13.
It is found from Figure 11 and Figure 12 that c1, c2, and c3 all decrease as n increases, and c1, c2, and c3 tend to be constants when n is beyond 50. Besides, c1 is obviously larger than c2 and c3, and c2 is slightly larger than c3. Furthermore, c1 is strongly correlated to fs, while c2 and c3 are slightly correlated to fs.
Figure 13 also indicates that only c1 is strongly correlated to fs. Furthermore, c1 for easy guidance is greater than that for difficult guidance. It demonstrates that better synchronization is achieved for easy guidance, which could also be proved by the probability distributions of the jumping frequency and the time lag shift.

4.3. Comparison with BRE Digest 2004 and ISO 10137 2007

Currently, there are two design codes, i.e., BRE Digest 2004 [30] and ISO 10137 2007 [31], which provide a detailed model for crowd-jumping loads. The frequency range and the coordination factor in the aforementioned two codes are compared with their counterparts obtained by the simulation in Section 4.2.
Load models in BRE Digest 2004 aim to reproduce observed results, while load models in ISO 10137 2007 are applied to the serviceability limit state. Therefore, there is a difference in the frequency range of these two codes. In BRE Digest 2004, the frequency range for an individual jumping load is 1.5–3.5 Hz; however, for a crowd, it is considered 1.5–2.8 Hz because the higher frequency jumping cannot be sustained. In this study, it is observed from Table 2 and Figure 13 that some jumping people cannot keep up with the beat for high-frequency guidance, and poor synchronization is achieved. Therefore, it is reasonable to set an upper limit of 2.8 Hz for the frequency range from the perspective of reproducing the observed results. Besides, poor synchronization is also achieved for low-frequency guidance, so a lower limit should also be set for the frequency range. The frequency range in ISO 10137 2007 is suggested as 1.5–3.5 Hz, which is more conservative than that in BRE Digest 2004 because this code is applied to the serviceability limit state.
The average of simulated ci corresponds to the reproduction of observed results, i.e., the load model in BRE Digest 2004. The load model in ISO 10137 2007 should correspond to a certain quantile of simulated ci, because this code is applied to the serviceability limit state. The mathematical relation between the failure probability p1 in one test case and pk accumulated after k test cases is given as follows:
p 1 = 1 1 p k 1 k
where pk for serviceability limit states is recommended as 0.05 in the Eurocode [20], and k is the expected number of events with dynamic crowd behavior. Here, k is adopted as 200 to calculate p1 and ci for serviceability limit states.
The change from ci to fs is overlooked in both codes. In BRE Digest 2004, ci is obtained by fitting the observed values from the experiment on two real floors. Test subjects were asked to jump at 1.83 Hz and 2.15 Hz, and their jumping loads were identified through structural responses. Therefore, ci in BRE Digest 2004 is considered to be most suitable for 2.0-Hz test cases. In ISO 10137 2007, ci is divided into three categories depending on whether crowds are well trained. The low coordination means that only some individuals are well trained, and most individuals are not experienced in coordinating the jumping motion in a crowd, which is consistent with the experimental setup in Section 2.2. Therefore, the average of simulated ci for 2.0-Hz test cases, the serviceability limit values of simulated ci for 2.0-Hz test cases, the ci suggested by BRE Digest 2004, and the ci of low coordination suggested by ISO 10137 2007 are compared in Figure 14.
As for the first harmonic, it is observed from Figure 14a that c1 in ISO 10137 2007 is close to the serviceability limit values of simulated c1. Nevertheless, c1 in BRE Digest 2004 is much larger than the average of simulated c1. Even so, it is greater than the serviceability limit values. It is speculated that crowd synchronization strongly depends on the individual rhythmic abilities of the crowd members, and most of the participants in BRE Digest 2004 might be well trained and experienced to coordinate the jumping motion in a crowd.
Similar comparison results are obtained for the second harmonic and the third harmonic, so the results of the second harmonic are taken as an example for explanation. It is found from Figure 14b that c2 in BRE Digest 2004 is still larger than the average of simulated c2 due to the gap in individual rhythmic abilities. Unlike c1, the coordination factor of the second harmonic c2 in ISO 10137 2007 is larger than the serviceability limit values of simulated c2. It is observed from both the simulations in Section 4.2 and the models in BRE Digest 2004 that c1 is obviously greater than c2. However, c1 is slightly larger than c2 in ISO 10137 2007, implying that conservative models are adopted for c2 in ISO 10137 2007.

5. Discussion

This paper’s primary contribution is to establish a Fourier series-based multi-point excitation model for crowd jumping loads. Probability distributions of the jumping frequency and the time lag shift are introduced to quantify crowd synchronization. It changes the modeling paradigm of conventional approaches [19,20,21,22], in which crowd jumping loads are simplified as a single-point excitation by employing a coordination factor to represent crowd synchronization. This multi-point excitation model overcomes the shortcoming that the existing single-point excitation models are not applicable for floors with complex vibration modes. Consequently, a comprehensive and precise vibration performance assessment could be conducted for a structure subjected to crowd-jumping loads. Yet due to the quantitative restrictions on test conditions, some limitations can be mainly manifested in the following two points:
(1) The crowd jumping experiment is done on stiff ground, which neglects how crowd synchronization is affected by structural vibrations. Consequently, the model might not be applicable for estimating structural responses that are too perceptible to jumping crowds, which might influence the crowds’ jumping motions. In further investigation, an experiment will be performed on flexible structures to study the influence of structural vibrations on crowd synchronization.
(2) Only some test subjects in the crowd jumping experiment are well trained, and most of them are not experienced in coordinating the jumping motion in a crowd. Therefore, the model may underestimate the structural responses if more individuals are well trained. In the future study, individuals who are well trained will be invited to participate in the crowd-jumping experiment. Then, crowd synchronization in different scenarios can be investigated.

6. Conclusions

This paper presents a Fourier series-based multi-point excitation model for crowd-jumping loads. Probability distributions of the jumping frequency and the time lag shift in the model are established based on the crowd jumping experiment using 3D MCT, which involves 96 test subjects. A flow chart for simulating crowd jumping loads is provided, and the simulation is compared with two current design codes. The statistics of the jumping frequency, the time lag shift, and the simulated coordination factor demonstrate that the crowd synchronization is strongly correlated to the metronome frequency, and better synchronization could be achieved for easy guidance. The comparison of two current design codes implies that crowd synchronization depends on the individual rhythmic abilities of the crowd members. The proposed crowd jumping load model can be adopted to assess vibration performance for various structures, such as grandstands, concert halls, and gymnasiums.

Author Contributions

Conceptualization, J.X.; Methodology, J.X. and S.D.; Software, B.C.; Validation, B.C.; Writing—Original Draft Preparation, J.X.; Writing—Review and Editing, J.X., Z.C. and C.L.; Supervision, H.Q. and Z.C.; Funding Acquisition, J.X., S.D. and H.Q. All authors have read and agreed to the published version of the manuscript.

Funding

This work was supported by the National Natural Science Foundation of China (Grant Nos. 52008376, 51909241, and 52279114) and the Program for Innovative Research Team (in Science and Technology) at the University of Henan Province (23IRTSTHN006).

Data Availability Statement

In this research, new data were created or analyzed. Data will be shared upon request and consideration by the authors.

Conflicts of Interest

The authors declare no conflict of interest.

References

  1. Zeng, D.; Wang, H.; Chen, J. Dynamic reliability analysis of large-span structures under crowd bouncing excitation. Buildings 2022, 12, 332. [Google Scholar] [CrossRef]
  2. Xiong, J.; Duan, S.; Qian, H.; Pan, Z. Equivalent dynamic load factor of different non-exceedance probability for crowd jumping loads. Buildings 2022, 12, 450. [Google Scholar] [CrossRef]
  3. Živanovic, S.; Lin, B.; Dang, H.V.; Zhang, S.; Cosic, M.; Caprani, C.; Zhang, Q. Evaluation of inverted-pendulum-with-rigid-legs walking locomotion models for civil engineering applications. Buildings 2022, 12, 1216. [Google Scholar] [CrossRef]
  4. Wang, Z.; Song, L.; Cheng, Z.; Yang, H.; Wen, J.; Qi, M. Finite element model for vibration serviceability evaluation of a suspended floor with and without tuned mass dampers. Buildings 2023, 13, 309. [Google Scholar] [CrossRef]
  5. Lee, S.H.; Lee, K.K.; Woo, S.S.; Cho, S.H. Global vertical mode vibrations due to human group rhythmic movement in a 39 story building structure. Eng. Struct. 2013, 57, 296–305. [Google Scholar] [CrossRef]
  6. Wolmuth, B.; Surtees, J. Crowd-related failure of bridges. Proc. ICE Civ. Eng. 2003, 156, 116–123. [Google Scholar] [CrossRef]
  7. Dallard, P.; Flint, A.; le Bourva, S.; Low, A.; Smith, R.M.R.; Willford, M. The London Millenium Footbridge. Struct. Eng. 2001, 79, 17–35. [Google Scholar] [CrossRef]
  8. de Brito, V.L.; Pimentel, R.L. Cases of collapse of demountable grandstands. J. Perform. Constr. Facil. 2009, 23, 151–159. [Google Scholar] [CrossRef]
  9. Sim, J.; Blakeborough, A.; Williams, M.S.; Parkhouse, G. Statistical model of crowd jumping loads. J. Struct. Eng. 2008, 134, 1852–1861. [Google Scholar] [CrossRef]
  10. Xiong, J.; Chen, J. Open access and updated human-induced load data set. J. Struct. Eng. 2021, 147, 4720003. [Google Scholar] [CrossRef]
  11. Jones, C.A.; Reynolds, P.; Pavic, A. Vibration serviceability of stadia structures subjected to dynamic crowd loads: A literature review. J. Sound Vib. 2011, 330, 1531–1566. [Google Scholar] [CrossRef]
  12. Ji, T.; Ellis, B.R. Floor vibration induced by dance-type loads: Theory. Struct. Eng. 1994, 72, 37–44. [Google Scholar]
  13. Duan, S.; Xiong, J.; Qian, H. Generative adversarial networks-based stochastic approach to the modeling of individual jumping loads. Int. J. Struct. Stab. Dyn. 2021, 21, 2150047. [Google Scholar] [CrossRef]
  14. Chen, J.; Wang, H.; Wang, L. Experimental investigation on single person’s jumping load model. Earthq. Eng. Eng. Vib. 2015, 14, 703–714. [Google Scholar] [CrossRef]
  15. Racic, V.; Pavic, A. Stochastic approach to modelling of near-periodic jumping loads. Mech. Syst. Signal Process. 2010, 24, 3037–3059. [Google Scholar] [CrossRef]
  16. Martínez, J.F.; Hermanns, L.; de Lerma, A.F.; Álvarez, E.A. Jumping load models applied on a gymnasium floor. Eng. Struct. 2016, 125, 26–38. [Google Scholar] [CrossRef]
  17. Živanovic, S.; Pavic, A.; Reynolds, P. Vibration serviceability of footbridges under human-induced excitation: A literature review. J. Sound Vib. 2005, 279, 1–74. [Google Scholar] [CrossRef] [Green Version]
  18. Chen, J.; Li, G.; Racic, V. A data-driven wavelet-based approach for generating jumping loads. Mech. Syst. Signal Process. 2018, 106, 49–61. [Google Scholar] [CrossRef]
  19. Ellis, B.R.; Ji, T. Loads generated by jumping crowds: Numerical modelling. Struct. Eng. 2004, 82, 35–40. [Google Scholar]
  20. Kasperski, M.; Agu, E. Prediction of crowd-induced vibrations via simulation. In Proceedings of the 23rd International Modal Analysis Conference, Orlando, FL, USA, 31 January–3 February 2005. [Google Scholar]
  21. Parkhouse, J.G.; Ewins, D.J. Crowd-induced rhythmic loading. Struct. Build. 2006, 159, 247–259. [Google Scholar] [CrossRef]
  22. Li, G.; Ji, T.; Chen, J. Determination of the dynamic load factors for crowd jumping using motion capture technique. Eng. Struct. 2018, 174, 1–9. [Google Scholar] [CrossRef]
  23. Shen, J.; Ren, X.; Chen, J. Effects of spatial variability of ground motions on collapse behaviour of buildings. Soil Dyn. Earthq. Eng. 2021, 144, 106668. [Google Scholar] [CrossRef]
  24. Shen, J.; Chen, J.; Ding, G. Random field model of sequential ground motions. Bull. Earthq. Eng. 2020, 18, 5119–5141. [Google Scholar] [CrossRef]
  25. Krenk, S. Wind field coherence and dynamic wind forces. In Proceedings of the IUTAM Symposium on Advances in Nonlinear Stochastic Mechanics, Trondheim, Norway, 3–7 July 1995. [Google Scholar] [CrossRef]
  26. Racic, V.; Brownjohn, J.M.W.; Pavic, A. Reproduction and application of human bouncing and jumping forces from visual marker data. J. Sound Vib. 2010, 329, 3397–3416. [Google Scholar] [CrossRef]
  27. Mazzoleni, P.; Zappa, E. Vision-based estimation of vertical dynamic loading induced by jumping and bobbing crowds on civil structures. Mech. Syst. Signal. Process. 2012, 33, 1–12. [Google Scholar] [CrossRef]
  28. Celik, O.; Dong, C.Z.; Catbas, F.N. A computer vision approach for the load time history estimation of lively individuals and crowds. Comput. Struct. 2018, 200, 32–52. [Google Scholar] [CrossRef]
  29. Xiong, J.; Chen, J. Random field model for crowd jumping loads. Struct. Saf. 2019, 76, 197–209. [Google Scholar] [CrossRef]
  30. Ellis, B.R.; Ji, T. The Response of Structures to Dynamic Crowd Loads; BRE Digest 426: Manchester, UK, 2004. [Google Scholar]
  31. ISO 10137:2007; Bases for Design of Structures—Serviceability of Buildings and Walkways against Vibration. ISO: Geneva, Switzerland, 2007.
  32. Larsen, R.J.; Marx, M.L. An Introduction to Mathematical Statistics and Its Applications; Pearson: New York, NY, USA, 2017. [Google Scholar]
  33. Xiong, J.; Chen, J. Power spectral density function for individual jumping load. Int. J. Struct. Stab. Dyn. 2018, 18, 1850023. [Google Scholar] [CrossRef]
Figure 1. The setup for the verification experiment.
Buildings 13 01782 g001
Figure 2. Weight-normalized jumping loads of two test subjects (T1 and T2) obtained by force plates (FP) and 3D MCT.
Buildings 13 01782 g002
Figure 3. The setup for the crowd-jumping experiment.
Buildings 13 01782 g003
Figure 4. Crowd jumping loads (thin lines) and the global mean (thick line) of a 2.0-Hz test case.
Buildings 13 01782 g004
Figure 5. Auto-PSD obtained by force plates and 3D MCT of a 2.0-Hz test case.
Buildings 13 01782 g005
Figure 6. Jumping frequency of each test subject in one jump.
Buildings 13 01782 g006
Figure 7. Probability density function of the jumping frequency for different metronome frequencies.
Buildings 13 01782 g007
Figure 8. Time lag shifts for all test subjects in one jump.
Buildings 13 01782 g008
Figure 9. Probability density function of the time lag shift.
Buildings 13 01782 g009aBuildings 13 01782 g009b
Figure 10. Flow chart of crowd jumping load simulation.
Buildings 13 01782 g010
Figure 11. The change in coordination factor with metronome frequency and crowd size.
Buildings 13 01782 g011
Figure 12. The change in coordination factor with crowd size.
Buildings 13 01782 g012
Figure 13. The change in coordination factor with metronome frequency.
Buildings 13 01782 g013
Figure 14. The comparison of the coordination factor.
Buildings 13 01782 g014
Table 1. Values of Δtkl and fj in the verification experiment.
Test Case [Hz]3.513.523.531.512.012.022.032.6712.6722.673
Δ t 12 # [s] 0.070.090.04−0.040.020.020.00−0.010.040.02
Δ t 12 ^ [s] 0.060.090.04−0.040.020.010.00−0.010.030.02
f j , 1 # [Hz] 3.53.53.51.52.02.02.02.672.672.67
f j , 1 ^ [Hz] 3.53.53.51.52.02.02.02.672.672.67
f j , 2 # [Hz] 3.53.53.51.52.02.02.02.672.672.67
f j , 2 ^ [Hz] 3.53.53.51.52.02.02.02.672.672.67
3.5i denotes the ith test case of 3.5 Hz.
Table 2. The average and the standard deviation of the jumping frequency.
Metronome Frequency [Hz]Jumping Frequency [Hz]
AverageStandard Deviation
1.51.590.25
1.61.700.21
1.71.760.17
1.81.850.10
1.91.920.07
2.02.020.09
2.12.110.06
2.22.200.06
2.32.300.07
2.42.400.08
2.52.480.06
2.62.580.08
2.72.670.11
2.82.780.12
2.92.880.14
3.02.990.13
3.13.080.16
3.23.170.15
3.33.270.16
3.43.370.17
3.53.450.20
Table 3. Closure errors for all test cases.
Test Case [Hz]Closure Errors [×10−2 s]
1st Time2nd Time3rd Time4th Time5th Time
1.50.960.650.221.87\
1.60.462.030.231.93\
1.70.390.861.080.340.51
1.80.711.311.080.59\
1.90.880.290.790.260.78
2.00.040.440.280.220.62
2.10.650.550.911.25\
2.20.790.370.640.30\
2.30.380.390.120.17\
2.40.210.210.570.34\
2.50.140.120.901.070.23
2.61.130.170.130.141.29
2.70.550.060.311.020.59
2.80.170.150.150.140.12
2.90.020.510.020.14\
3.00.450.330.220.29\
3.10.080.550.15\\
3.20.740.120.13\\
3.30.310.290.41\\
3.40.080.080.19\\
3.50.190.190.13\\
Table 4. The standard deviation of Δt and ψ.
Jumping Frequency [Hz]Standard Deviation
Δt [s]ψ [-]
1.50.1251.181
1.60.0830.835
1.70.0951.016
1.80.0810.921
1.90.0680.823
2.00.0710.898
2.10.0580.767
2.20.0510.715
2.30.0560.809
2.40.0520.790
2.50.0420.671
2.60.0510.836
2.70.0510.867
2.80.0500.889
2.90.0480.892
3.00.0480.918
3.10.0430.844
3.20.0410.837
3.30.0410.859
3.40.0370.790
3.50.0390.873
Disclaimer/Publisher’s Note: The statements, opinions and data contained in all publications are solely those of the individual author(s) and contributor(s) and not of MDPI and/or the editor(s). MDPI and/or the editor(s) disclaim responsibility for any injury to people or property resulting from any ideas, methods, instructions or products referred to in the content.

