Article

Evolutionary Mechanism of Government Green Development Behavior in Construction and Demolition Waste Recycling Projects: A Perspective of Ecological Compensation

College of Architecture and Urban-Rural Planning, Sichuan Agricultural University, Chengdu 611830, China
*
Author to whom correspondence should be addressed.
Buildings 2023, 13(7), 1762; https://doi.org/10.3390/buildings13071762
Submission received: 14 June 2023 / Revised: 6 July 2023 / Accepted: 9 July 2023 / Published: 11 July 2023
(This article belongs to the Special Issue Green Building Project Management)

Abstract

:
Although construction and demolition waste (CDW) recycling projects have received increasing attention from national and regional governments, the mechanisms for the evolution of government green development behavior in such projects are not yet clear. From the perspective of ecological compensation for the cross-regional disposal of CDW, this study aims to reveal the evolutionary mechanism of government green development behavior through externality theory. The main findings are as follows. First, the initial probability of government adoption of green development behavior does not affect the final stable state of the system. Second, there is heterogeneity in the effects of the allocation coefficient of ecological benefits and the ecological compensation coefficient on different government green development behavior. Finally, ecological benefits can encourage the government to actively adopt green development behavior. This study introduces for the first time an ecological compensation perspective into the study of CDW project management, which not only enriches the knowledge system of the government green development behavior on project management but also provides a reference for the government to participate in the process of cross-regional disposal of CDW in favor of ecological compensation.

1. Introduction

According to statistics, construction and demolition waste (CDW) accounts for approximately 36–40% of the world’s total solid waste generation [1]. The large amount of CDW generation causes problems such as soil pollution, global warming, and deterioration of public health [2,3]. As an effective way to address CDW, CDW recycling has a positive impact on the sustainable development of the economy and environment [4,5]. However, the limited CDW treatment capacity still makes CDW management a great challenge [6], and CDW has become a global environmental issue [7].
Government green development behavior is an important initiative to address environmental management challenges, which mainly include incentive green development behavior and mandatory green development behavior [8]. Among them, incentives for green development behaviors include granting environmental subsidies and issuing tax breaks [9], promoting green consumption [10], etc. In contrast, strict regulation of the market and the issuance of mandatory and catalog regulations are mandatory green development behaviors [11]. Research shows that government green development behaviors are important for promoting regional environmental quality improvement [12]. By 2022, the Chinese government reduced domestic carbon emission intensity by 34.4% compared to a decade ago through green development behaviors such as environmental legislation and environmental supervision, reversing the undesirable trend of rapid growth of CO2 emissions [13]. Therefore, as a concrete form of environmental management, the government green development behavior is also of great significance to CDW management.
How to effectively manage the large amount of CDW generated has become an important challenge for local governments [14]. Restricted by the limited regional disposal capacity, cross-regional disposal of CDW is considered a feasible strategy to alleviate the pressure of regional CDW management. In particular, CDW cross-regional disposal not only reduces resource consumption but also has significant ecological benefits [6]. Under the coordination of the higher government, the process of cross-regional CDW disposal mainly involves two subjects: The CDW-generating district government and the CDW disposal district government. The CDW disposal district government is responsible for accepting and distributing CDW to the corresponding disposal enterprises, while CDW disposal enterprises have two types of CDW disposal: direct landfill and resource utilization [15]. Compared with direct landfill disposal, CDW disposal by resource utilization not only saves land resources and transportation costs but also generates substantial environmental advantages [16]. However, most CDW is still disposed of directly into landfills [17]. It should be noted that the environmental pollution caused by the direct landfilling of CDW will inevitably generate negative externalities for neighboring areas due to the existence of environmental pollution spillover effects [18].
To improve CDW management and achieve sustainable green development in the region, CDW disposal district governments can adopt legislation [19], financial support [20], and other green development behaviors to urge enterprises to carry out CDW resource treatment. In addition, the environmental benefits generated by the governments of CDW disposal districts through development behaviors have significant positive externalities. Specifically, the CDW-generating district government can benefit from the environmental benefits generated by the green development behaviors of the CDW disposal district governments and promote their regional green development. It should be noted that to internalize positive environmental externalities, the beneficiary government should pay ecological compensation to the protector government. Ecological compensation can not only adjust the relationship between ecological protectors and ecological beneficiaries but also further promote the coordinated development of energy, the economy, and the environment [21]. It can be seen that there are green development behaviors between CDW-generating district governments and CDW-disposal district governments in the process of CDW disposal. Unfortunately, existing research lacks an investigation of government green development behaviors in the context of CDW recycling projects by using ecological compensation as a research perspective. Therefore, this paper aims to reveal the evolutionary mechanism of governmental green development behavior through externality theory under the perspective of ecological compensation in CDW cross-regional disposal.
This paper focuses on answering the following scientific question. How does ecological compensation affect the evolution of government green development behavior in the context of the cross-regional disposal of CDW? To answer this scientific question, this paper first constructs a game model of government green development behavior consisting of both governments of CDW cross-regional disposal using externality theory. Second, the stability of the equilibrium point is analyzed using the evolutionary game method, and the evolutionary stabilization strategies under different situations are determined. Finally, the effects of the initial probability, allocation coefficient of ecological benefits, ecological compensation coefficient, and ecological benefits on the evolutionary path of government green development behavior were analyzed by numerical simulation.
The main contributions of this paper are as follows: (1) studying the green development behavior of the government in the cross-regional collaborative management of CDW from the perspective of ecological compensation not only enriches the relevant studies on the green development behavior of the government but also provides a theoretical basis for the adoption of green development behavior by the government; (2) creatively introducing externality theory into the study of the green development behavior of the government, revealing the evolution mechanism of the green development behavior of the government considering the ecological compensation mechanism, which provides new evidence for the implementation of ecological compensation for CDW cross-regional disposal.
In summary, this paper shows important significance in theory and practice. On the one hand, this study not only enriches the relevant research in the field of CDW management from the perspective of government green development behavior but also provides new evidence from CDW cross-regional disposal for the study of ecological compensation mechanisms. On the other hand, in the context of CDW cross-regional disposal, this paper not only provides a reference for the government to formulate ecological compensation-related policies but also provides new ideas to promote the cross-regional collaborative management of CDW.
The rest of this paper is structured as follows. Section 2 provides a review of the relevant literature. Section 3 constructs an evolutionary game model of the government green development behavior under the perspective of ecological compensation for the cross-regional disposal of CDW. Section 4 analyzes the stability of each equilibrium point and discusses the evolutionary stabilization strategies under different situations. Section 5 conducts numerical simulations of key parameters and analyzes the influence of relevant parameters on the evolutionary path of the game subjects. Section 6 draws conclusions and management implications and summarizes the limitations of this paper.

2. Literature Review

This section reviews the relevant literature in three parts: externality theory, government green development behavior, and ecological compensation. Table 1 gives the studies related to government green development behavior and ecological compensation.

2.1. Externality Theory

Externality theory explains the causes of externalities and how to solve them from an economic perspective [39]. Environmental externalities are the nonmarket impacts on the environment caused by the production and consumption of environmental agents [40]. Environmental externalities can be divided into positive environmental externalities and negative environmental externalities, depending on the impact generated. On the one hand, environmental protection behavior generates significant positive externalities. For example, in the process of environmental pollution management, prevention, and control, significant spillover benefits are created due to the improvement of ecosystem service functions [22]. On the other hand, transboundary pollution has negative externalities, resulting in a reduction in ecological quality in neighboring regions [23].
The problem of internalizing externalities is the core issue of externality theory. The optimal level of environmental protection can be achieved only by internalizing environmental externalities [24]. To this end, scholars have engaged in intense debate. Some scholars argue that the solution to the problem of negative externalities arising from environmental pollution focuses on the inclusion of environmental costs in prices and making the agent that generates the negative externalities bear the costs associated with waste disposal [25]. Other scholars, from the perspective of positive environmental externalities, propose internalizing positive environmental externalities by providing ecological compensation for the costs paid by ecological reserves to improve ecological service functions [26].
Unfortunately, most studies have focused on considering only unilateral environmental externalities. In fact, the behavior of the subject of environmental governance will continuously change and evolve under the influence of various factors. In particular, in the early stage of CDW governance, the government was unable to guide enterprises scientifically and effectively to govern CDW due to its insufficient resource awareness [41], which led to a large amount of CDW being directly landfilled and simply disposed of. However, the pollution of soil and water caused by direct landfills and simple disposal will generate negative externalities for neighboring areas. However, in the context of green development, the government may generate positive externalities by actively promoting CDW resource utilization [42]. Therefore, it is incomplete to consider only the unilateral environmental externalities generated by the behavior of environmental agents. However, existing research related to CDW management lacks consideration of both positive environmental externalities and negative environmental externalities internalized in depth.

2.2. Government Green Development Behavior

Green development behavior has received much attention from both enterprise and government researchers, especially government green development behavior [43,44]. Governmental green development behavior is an organizational behavior that uses the government as a vehicle to facilitate the achievement of governmental green development and economic growth goals [8]. The existing research on government green development behavior focuses on the following three aspects. First, there is research on policies and regulations. This type of research mainly focuses on the driving role of policies and regulations on the green development behavior of enterprises and the public [27,28]. The second is research related to environmental regulation mechanisms. This type of research explores the effects of government regulation and the role of environmental governance. The third is research related to the multisubject role mechanism of government green development behavior [29,30]. For example, studies have verified the mechanism of the role of government green development behavior in the multisubject interaction among government, enterprises, and the public through the meta-analysis method [8].
However, existing research on government green development behavior is still incomplete. On the one hand, some studies focus on considering the impact of government green development behaviors on enterprises, the public, and the ecological environment but lack research on the interactions among governments in adopting green development behaviors. On the other hand, as a finite rational subject, the government will continuously revise and improve green development behaviors according to the changing environment. Unfortunately, the dynamic evolutionary mechanism of governmental green development behavior has not been revealed in the field of CDW management.

2.3. Ecological Compensation

Ecological compensation is an institutional arrangement that adjusts the relationship between the interests of ecological beneficiaries and ecological protectors, mobilizes enthusiasm for ecological protection, and internalizes environmental externalities [45]. Ecological compensation was first applied in the fields of ecology and economics [46]. Through ecological compensation, the environmental costs and ecological benefits generated by environmental treatment can be integrated into the traditional economic cost-benefit analysis [21]. With the deepening of ecological compensation research, it continues to play an important role in biodiversity conservation [47], ecological restoration [48], and the coordination of regional environmental protection [49]. In addition, as an important tool for governments to coordinate cross-regional environmental governance [35], ecological compensation can effectively promote the regionalized cooperation of the government in environmental pollution management [31], thus forming a long-term mechanism of environmental governance with shared benefits and cooperation.
The ecological compensation standard is a decisive factor in the long-term and stable implementation of the ecological compensation mechanism. How to determine reasonable ecological compensation standards based on the beneficiary-pays and polluter-pays principles has become a difficult point in the establishment of ecological compensation mechanisms [50]. For this reason, many scholars have explored the feasibility of determining ecological compensation standards through the ecological footprint method, the ecosystem service value method, and the opportunity cost method [32,33,34,35].
Although an increasing number of ecological compensation studies focus on watershed ecological compensation [36], cultivated land ecological compensation [37], and grassland ecological compensation [38], they have not yet been able to explain the ecological compensation mechanism for the cross-regional disposal of CDW.
In summary, existing studies confirm that ecological compensation can effectively internalize environmental externalities and facilitate the green development behavior of the government to collaboratively manage cross-regional pollution. However, previous related studies on governmental green development behavior have not revealed the evolutionary mechanism of government green development behavior from the perspective of ecological compensation, and the existing related studies on ecological compensation have not considered the context of CDW management.

3. Problem Description and Model Assumption

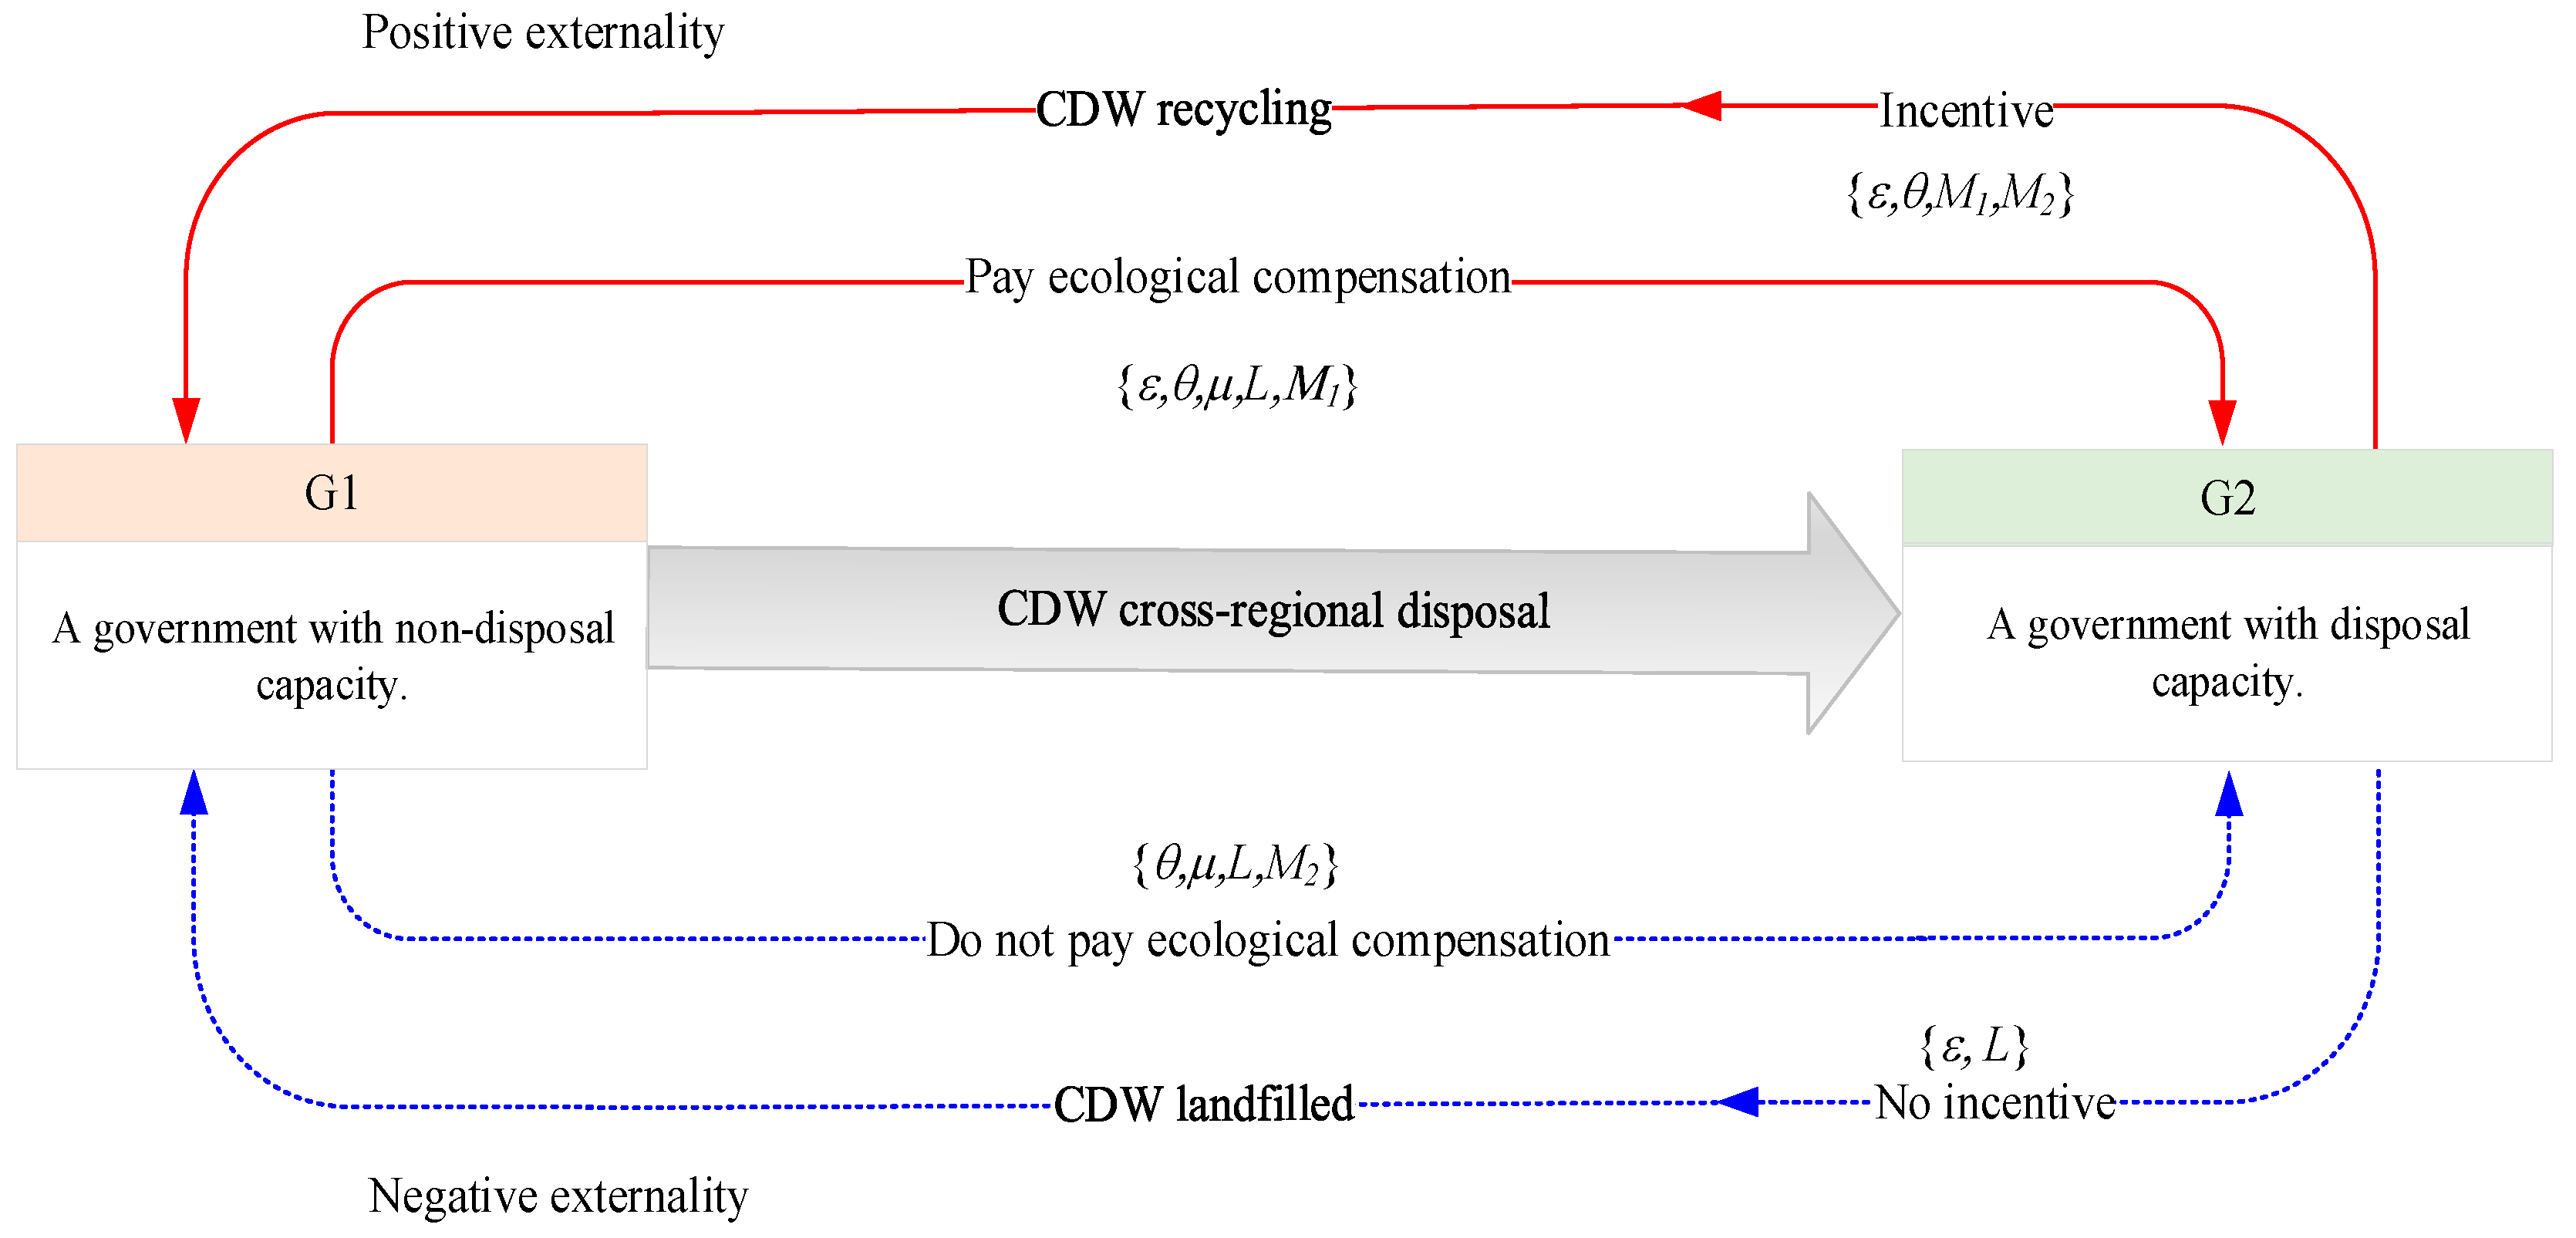
Consider an evolutionary game model consisting of a G1 government and a G2 government. Among them, the G1 government is the CDW generating district government, while the G2 government is the CDW disposal district government. The total amount of CDW generated in the administrative area of the G1 government exceeds its local disposal capacity and needs to be disposed of off-site across districts, and the higher-level government coordinates the G2 government with disposal capacity to dispose off-site. The G2 government can promote the resource utilization of CDW by taking incentives to absorb and dispose of excess CDW and improve the green development level of the region. At the same time, the G2 government can also dispose of CDW in landfills by enterprises without incentives. However, the G2 government needs to supervise enterprises without incentives to avoid illegal dumping. The G2 government’s environmental protection behavior of promoting CDW resource utilization has positive externalities, and the G1 government that benefits from environmental protection should pay ecological compensation to the G2 government. In addition, the G1 government has already paid the costs associated with CDW disposal, and the G1 government can also choose not to pay ecological compensation. The game model formed is shown in Figure 1.
In this paper, the G1 government and the G2 government are selected as game subjects with finite rationality, and ecological compensation is used as the research perspective to reveal the evolutionary mechanism of government green development behavior through externality theory. The parameter settings and descriptions are shown in Table 2.
The basic assumptions are as follows:
Assumption 1. 
The higher-level government coordinates the G2 government with disposal capacity to handle the excess CDW generated within the administrative area of the G1 government; the G1 government bears the costs related to the cross-regional and off-site disposal of CDW; and the basic cost of cross-regional and off-site disposal of CDW by the G1 government is  C 0 .
Assumption 2. 
When the G1 government and the G2 government establish horizontal ecological compensation mechanisms, they need to pay transaction costs  C 1  and  C 2 , respectively. The regulation of the central government is an important factor in ensuring the implementation of ecological compensation. To encourage local governments to establish horizontal ecological compensation mechanisms, the central government subsidizes G1 government that establish horizontal ecological compensation mechanisms  R  to ensure the long-term effectiveness of ecological compensation mechanisms [51].
Assumption 3. 
To improve the G2 government’s motivation to promote CDW resource utilization, the G1 government can choose to pay ecological compensation to the G2 government to reward its eco-environmental protection behavior. The ecological compensation paid by the G1 government is determined according to the input cost of the G2 government to manage CDW [52].
Assumption 4. 
The government plays an important role in promoting the resource utilization of CDW [53]. The G2 government can promote CDW resource utilization by adopting incentive measures to increase the willingness of enterprises and social capital to participate in CDW resource utilization. The cost of the G2 government to adopt incentive measures is  C 3 , including the cost of subsidizing CDW recycling enterprises to provide financial security, accelerating the promotion and application of CDW recycled products, etc. [54]. The G2 government actively promotes CDW resource utilization and receives green subsidies from the central government for environmental governance  J  [55]. At the same time, the G2 government will also gain a good government reputation  S  for effective CDW management [56].
Assumption 5. 
The G2 government’s promotion of CDW resource utilization will generate overall ecological benefits. When the G1 government pays ecological compensation, the overall ecological benefits generated by the G2 government adopting the incentive strategy is  M 1  [57]; the overall ecological benefit generated by the G2 government adopting the incentive strategy when the G2 government does not pay ecological compensation is  M 2  [58], where  M 1 > M 2 . The external spatial spillover effect of ecology allows the G1 government to also receive part of the ecological benefits,  θ  is the ecological benefit allocation coefficient of the G2 government, and the proportion of the overall ecological benefit received by the G1 government is  1 θ  [35]. In addition, the choice of environmental strategies by local governments is influenced by the weight of environmental indicators  α  in the performance appraisal system [59].
Assumption 6. 
The higher cost of CDW resource treatment, longer payback period, and low profitability of recycled construction materials [60] lead to the reluctance of enterprises to participate in CDW resource treatment. In the event that the G2 government chooses not to take incentives, enterprises tend to choose the direct landfill method to dispose of CDW. In this case, the G2 government needs to strengthen the regulation of illegal dumping activities in the cross-regional disposal of CDW, and the cost of regulation is  C 4 . Environmental pollution has strong externalities and can flow across borders. The direct landfill approach can contaminate soil and water sources and cause environmental losses  L  [61]. The spillover effect of environmental pollution  μ  will affect the ecological environment within the administrative region of the G1 government [62], and the negative externality effect caused within the administrative region of the G1 government is  μ L .
Assumption 7. 
The probability that government G1 chooses to pay ecological compensation is  x , while the probability that G1 chooses not to pay ecological compensation is  1 x ( 0 x 1 ) ; the probability that G2 chooses to adopt an incentive strategy is  y , while the probability that G2 chooses not to adopt an incentive strategy is  1 y ( 0 y 1 ) . x  and  y  are functions of time.
Based on the above seven assumptions, the payoff matrix between the G1 government and the G2 government under different strategies is established in this paper, as shown in Table 3.

4. Evolutionary Game Model Analysis

4.1. Stability Point Calculation

According to the benefit matrix, the expected benefits of the G1 government paying ecological compensation and not paying ecological compensation strategies are shown in Equations (1) and (2), respectively, and the average expected benefit is shown in Equation (3):
U A 0 = R C 0 C 1 + y ( α ( 1 θ ) M 1 ε C 3 ) ( 1 y ) ( ε C 4 + μ L )
U A 1 = y α ( 1 θ ) M 2 C 0 ( 1 y ) μ L
U A ¯ = x U A 0 + ( 1 x ) U A 1
The resulting replication dynamic equation is shown in Equation (4):
F ( x ) = x ( 1 x ) ( R C 1 + y α ( 1 θ ) ( M 1 M 2 ) + y ε ( C 4 C 3 ) ε C 4 )
According to the benefit matrix, the expected benefits of the G2 government with and without the incentive strategy are shown in Equations (5) and (6), respectively, and the average expected benefit is shown in Equation (7):
U B 0 = J + S + C 0 + α θ M 2 C 3 + x ( α θ ( M 1 M 2 ) + ε C 3 C 2 )
U B 1 = C 0 L x ( ( 1 ε ) C 4 + C 2 ) 1 x C 4
U B ¯ = y U B 0 + ( 1 y ) U B 1
The resulting replication dynamic equation is shown in Equation (8):
F ( y ) = y ( 1 y ) ( J + S + α θ ( x ( M 1 M 2 ) + M 2 ) + ( 1 x ε ) ( C 4 C 3 ) + L )
Let F x = 0 and F y = 0 , we obtain the 5 equilibrium points of the evolutionary game: (0,0), (0,1), (1,0), (1,1), and x , y . Among them, x = C 3 α θ M 2 J S L C 4 α θ M 1 M 2 + ε ( C 3 C 4 ) , y = ε C 4 + C 1 R α ( 1 θ ) M 1 M 2 + ε ( C 4 C 3 ) .

4.2. Evolutionary Equilibrium Stability Analysis

In this paper, the Jacobi matrix is constructed by referring to Jiang et al. [63], as shown in Equation (9). The stability of the equilibrium point of the replicated dynamic system can be obtained by analyzing the local stability of the Jacobi matrix.
J = F x x F x y F y x F y y = 1 2 x ( y ( α ( 1 θ ) ( M 1 M 2 ) ε C 3 ) ( 1 y ) ε C 4 + R C 1 ) x 1 x ( α ( 1 θ ) ( M 1 M 2 ) ε C 3 + ε C 4 ) y 1 y ( α θ ( M 1 M 2 ) + ε ( C 3 C 4 ) ) 1 2 y ( x α θ ( M 1 M 2 ) + ε ( C 3 C 4 ) + J + S + L + α θ M 2 + C 4 C 3 )
The determinant of the Jacobi matrix is shown in Equation (10):
d e t ( J ) = F ( x ) x F ( y ) y F ( x ) y F ( y ) x
The trace of the Jacobi matrix is shown in Equation (11):
t r ( J ) = F ( x ) x + F ( y ) y
The determinant and trace of the system at each equilibrium point are shown in Table 4 and Table 5.
When the equilibrium point satisfies both conditions d e t ( J ) > 0 and t r ( J ) < 0 , the equilibrium point that replicates the dynamic equations is the system evolutionary stability point (ESS). The tr(J) at the point x , y is equal to 0 and does not satisfy the condition of t r ( J ) < 0 . Therefore, this point is not an evolutionary stability point. Therefore, only the stability of the remaining four points ( 0 , 0 ) , ( 0 , 1 ) , ( 1 , 0 ) and ( 1 , 1 ) need to be analyzed. Six scenarios of equilibrium stability were obtained based on the equilibrium points of the evolutionary model and their stability conditions, as shown in Table 6, Table 7, Table 8, Table 9, Table 10 and Table 11. Among them, A = R C 1 ε C 4 , B = J + S + L + α θ M 2 C 3 + C 4 , D = R C 1 ε C 3 + α ( 1 θ ) ( M 1 M 2 ) , E = J + S + L + α θ M 1 + ( 1 ε ) ( C 4 C 3 ) .
The results of judging the stability of the equilibrium point under case (1) are given in Table 6.
Table 6 shows that in case (1), the only stable equilibrium point for the evolution of the G1 government and G2 government is ( 0 , 0 ) when A < 0 , B < 0 , D < 0 or A < 0 , B < 0 , D > 0 , E < 0 . In this case, the cost of paying ecological compensation by the G1 government is higher than the benefit, regardless of which strategy the G2 government chooses. Therefore, the G1 government chooses not to pay ecological compensation. For the G2 government, regardless of which strategy the G1 government chooses, the cost of the G2 government’s incentive for enterprises to resource CDW is higher than the benefit. Therefore, the G2 government tends to choose not to adopt the incentive strategy.
The results of judging the stability of the equilibrium point under case (2) are given in Table 7.
Table 7 shows that in case (2), the only stable equilibrium point for the evolution of the G1 government and G2 government is ( 0 , 1 ) when A < 0 , B > 0 , D < 0 , E > 0 or A > 0 , B > 0 , D < 0 , E > 0 . In this case, the benefits of the G2 government incentivizing firms to resource CDW are improved, and the benefits are higher than the costs. Therefore, the G2 government chooses to adopt an incentive strategy. For the G1 government, the benefits of not paying ecological compensation are higher when the G2 government chooses to adopt an incentive strategy. Therefore, the G1 government chooses not to pay ecological compensation.
The results of judging the stability of the equilibrium point under case (3) are given in Table 8.
Table 8 shows that in case (3), the only stable equilibrium point for the evolution of the G1 government and G2 government is ( 1 , 0 ) when A > 0 , B < 0 , D < 0 , E < 0 or A > 0 , B < 0 , D > 0 , E < 0 . In this case, the G1 government pays ecological compensation with improved benefits. Therefore, the G1 government chooses to pay ecological compensation. For the G2 government, the benefits of the G2 government’s incentive for firms to resource CDW treatment are lower than the benefits from not adopting the incentive strategy. Therefore, the G2 government chooses not to adopt the incentive strategy.
The results of judging the stability of the equilibrium point under case (4) are given in Table 9.
Table 9 shows that in case (4), the only stable equilibrium point for the evolution of the G1 government and G2 government is ( 1 , 1 ) when B > 0 , D > 0 , E > 0 or A > 0 , B < 0 , D > 0 , E > 0 . In this case, the choice to pay ecological compensation brings large benefits to the G1 government. At the same time, the G2 government incentivizes firms to carry out CDW resource treatment, which brings large benefits. Therefore, the G1 government and the G2 government will actively participate in ecological compensation for CDW cross-regional disposal. That is, the G1 government chooses to pay ecological compensation, and the G2 government chooses to adopt an incentive strategy to promote CDW recycling disposal.
The results of judging the stability of the equilibrium point under case (5) are given in Table 10.
Table 10 shows that in case (5), when A < 0 , B < 0 , D > 0 , E > 0 , the equilibrium points of the G1 government and G2 government evolution are ( 0 , 0 ) or ( 1 , 1 ) . In this case, based on the characteristics of cost sharing and benefit sharing of the ecological compensation mechanism, the G1 government and the G2 government form a close game relationship. When the G1 government chooses not to pay ecological compensation, the G2 government chooses not to adopt an incentive strategy to obtain higher benefits; when the G1 government chooses to pay ecological compensation, the G2 government has more incentive to promote CDW resource utilization, thus improving social and environmental benefits. Therefore, the G2 government chooses to adopt the incentive strategy.
The results of judging the stability of the equilibrium point under case (6) are given in Table 11.
Table 11 shows that in case (6), when A > 0 , B < 0 , D < 0 , E > 0 , the G1 government and G2 government evolve without a stable point. At this time, the G1 government and the G2 government form a close game relationship; both parties pursue their own interest maximization, and it is difficult to form a stable system. Therefore, the strategy choice of the G1 government and the G2 government has uncertainty.

5. Numerical Simulation and Discussion

According to the analysis in Section 4, the most ideal steady state is that the G1 government chooses to pay ecological compensation and the G2 government chooses to adopt an incentive strategy, i.e., strategy ( 1 , 1 ) . To analyze the effects of initial probability, the allocation coefficient of ecological benefits, the ecological compensation coefficient, and ecological benefits on the evolutionary process of green development behavior of the G1 government and the G2 government, numerical simulations and analytical discussions of key variables are conducted in this paper using MATLAB R2020b. The values of the following parameters were determined according to the literature: C 1 [35] = 3, C 3 [4] = 4, C 4 [64] = 8, S [56] = 4, L [61] = 4, α [59] = 0.4, J [55] = 7, M 1 [58] = 35, M 2 [58] = 15. The values of the following parameters were determined based on expert interviews: R = 5, ε = 0.5, θ = 0.5.

5.1. Effect of Initial Probability on Game Equilibrium

Figure 2 shows the effect of the initial probability on the evolutionary process and final state of the green development behavior of the G1 government and the G2 government.
Figure 2 shows that with all initial probabilities of 0.5, the ESS of the game model is ( 1 , 1 ) . In this case, the G1 government chooses to pay ecological compensation, and the G2 government chooses to adopt an incentive strategy to promote CDW resource utilization. Both governments take active measures to realize the collaborative management of CDW across regions and improve the utilization rate of CDW resources. The results of this study are contrary to those of Wang et al. [65]. The study by Wang et al. shows that the initial probability has a strong influence on the final decision of both upstream and central governments. When the initial willingness to participate is low, upstream and central governments tend not to participate in ecological compensation. Unlike Wang et al.’s study, the initial probability in this paper is taken to be 0.5. Thus, the results of the two studies are inconsistent in the case of inconsistent initial values. In addition, G2 government reaches the steady state of green development behavior faster than G1 government. This shows that the G2 government is more sensitive to the initial probability than the G1 government.

5.2. Effect of the Allocation Coefficient of Ecological Benefits on Game Equilibrium

The allocation coefficient of ecological benefits on the evolutionary process and final states of green development behavior of the G1 government and the G2 government are given in Figure 3.
Figure 3a shows that as the value of θ increases, the strategy of the G1 government changes from choosing to pay ecological compensation to not paying ecological compensation. This is because an increase in the value of θ means that the G1 government has fewer ecological benefits to allocate, and the G1 government has less incentive to pay ecological compensation. Therefore, the G1 government will change its strategic choice when it can allocate fewer ecological benefits. This result is contrary to the findings of Gao et al. The reason for the difference may be that this paper considers both the allocation coefficient of ecological benefits and the weighting coefficient of the ecological environment in the local government performance appraisal system. Gao et al. [35] showed that when the allocation coefficient of ecological benefits reaches 0.8, the downstream government’s strategy changes from not paying ecological compensation to paying ecological compensation. In the context set in this paper, the size of the allocation coefficient of ecological benefits affects the amount of ecological benefits received by the G1 government, which in turn affects the performance appraisal and strategy choice of the G1 government.
Figure 3b shows that as the size of the allocation coefficient of ecological benefits θ varies from 0.1 to 0.9, the evolution of the G2 government always results in the adoption of incentives, but the system converges to a steady state at a faster rate. Therefore, an increase in the value of θ only accelerates the rate of system stabilization and has little effect on the G2 government’s strategy choice. Thus, it can be seen that the G2 government tends to adopt incentives to achieve CDW resource utilization and thus improve regional green development, regardless of the amount of ecological benefits they can obtain.

5.3. Effect of the Ecological Compensation Coefficient on Game Equilibrium

Figure 4 shows the effects of the ecological compensation coefficient on the evolutionary process and final state of the green development behavior of the G1 government and the G2 government.
Figure 4a shows that when ε is not greater than 0.5, the convergence time for the G1 government to reach the steady state eventually stabilizes at 1, although it increases with the increase of ε . However, when ε is greater than 0.5, the G1 government eventually stabilizes at 0. In particular, when ε = 0.7, the G1 government pays a large amount of ecological compensation. Having already borne the cost of CDW disposal across the area, the G1 government considers it its right to obtain a good ecological environment and thus gradually tends not to pay ecological compensation. This result is consistent with the findings of Wang et al. [66]. Therefore, the size of the ε value affects the G1 government’s strategy choice. In addition, as the value of ε increases, the G1 government converges to the steady state at a faster rate. This is because an oversized ε will increase the financial burden of the G1 government and thus reduce the G1 government’s willingness to pay ecological compensation [67].
Figure 4b shows that the G2 government strategy is always to take incentives to promote CDW resource utilization, regardless of how much ε increases. In addition, the G2 government converges very quickly and takes a very short time to reach the steady state. This indicates that the G2 government is sensitive to ε and that the payment of ecological compensation by the G1 government to the G2 government can effectively encourage the G2 government to adopt an incentive strategy. Therefore, it is important to determine a reasonable ecological compensation coefficient to promote the establishment of a CDW cross-regional synergistic management mechanism between the G1 government and the G2 government. This finding is contrary to that of Wang [66] et al. The reason for this difference may be due to the different research contexts between Wang et al. and this paper. Wang et al. found that upstream governments are not sensitive to ecological compensation paid by downstream governments in watershed ecological compensation, while the research context of this paper is based on ecological compensation for CDW cross-regional disposal.

5.4. Effect of Ecological Benefits M 1 on Game Equilibrium

Figure 5 shows the effects of ecological benefits M 1 on the evolutionary process and end state of the green development behavior of the G1 government and the G2 government, respectively.
Figure 5a shows that the G1 government’s strategy choice changes from not paying ecological compensation to paying ecological compensation with the increase in M 1 . Comparing the two curves that converge to 1 in Figure 5a, the larger the value of M 1 , the faster the convergence to a steady state where the G1 government pays ecological compensation. Therefore, the larger the value of M 1 , the greater the G1 government tends to pay ecological compensation.
Figure 5b shows that as the ecological benefits M 1 increase, the ESS remains constant, but the system converges to the steady state of taking incentives at an accelerated rate. Unlike the effect of M 1 on the G1 government, the increase in M 2 only accelerates the convergence of the system without affecting the strategy choice of the G2 government. The results of this study are consistent with the findings of Lu [58] et al.

5.5. Effect of Ecological Benefits M 2 on the Game Equilibrium

Figure 6 shows the effects of ecological benefits M 2 on the evolutionary process and end state of the green development behavior of the G1 government and the G2 government, respectively.
Figure 6a shows that when the value of M 2 changes from 10 to 30, the G1 government’s strategy changes from paying ecological compensation to not paying ecological compensation. When the value of M 2 is less than 25, to encourage the G2 government to actively promote CDW recycling to generate more ecological benefits, the G1 government will choose to pay ecological compensation. As the value of M 2 increases, the overall ecological benefits increase. However, this will lead to free-rider behavior of the G1 government [68], and the G1 government will stop paying ecological compensation to reduce fiscal expenditure. However, the free-rider behavior of the G1 government will undoubtedly affect the enthusiasm of the G2 government for environmental management and negatively affect the promotion of CDW resource utilization. Therefore, specific policies and regulations should be used to strengthen the regulation of the G1 government to avoid the free-rider phenomenon as much as possible.
Figure 6b shows that the G2 government’s strategy is always to take incentive measures regardless of the increase in the value of M 2 . However, as the value of M 2 increases, the rate of convergence of the system to the steady state accelerates. In addition, the convergence time of the G2 government is much shorter than that of the G1 government compared to the convergence time of the G1 government to the steady state at the same M 2 value. Therefore, the G2 government is more sensitive to M 2 , and M 2 plays a positive role in promoting the G2 government to take incentive measures for CDW resource utilization.

6. Conclusions and Implications

6.1. Conclusions

Under the perspective of ecological compensation of CDW cross-regional disposal, this paper constructs a game model of the evolution of government green development behavior based on externality theory, which reveals the mechanism of the evolution of government green development behavior. The main findings are as follows:
(1)
In the process of CDW cross-regional disposal, the initial probability of different governments adopting green development behavior does not affect the final steady state of the system. Among them, the steady state of the G1 government’s green development behavior is paying ecological compensation, and the steady state of the G2 government’s green development behavior is taking incentive measures to promote CDW resource utilization. However, with the same initial probability of government green development behavior, the time required for the G1 government to reach the steady state is longer than that required for the G2 government to reach the steady state. This may affect the cooperation between the G1 government and the G2 government to manage cross-regional CDW collaboratively.
(2)
In the cross-regional treatment of CDW, there is heterogeneity in the influence of the allocation coefficient of ecological benefits and the ecological compensation coefficient on different government green development behaviors. On the one hand, the increase in the allocation coefficient of ecological benefits implies that the ecological benefits gained by the G1 government adopting green development behavior will be reduced, resulting in a lower willingness of the G1 government to participate in ecological compensation mechanisms. However, the larger the allocation coefficient of ecological benefits is, the greater the G2 government tends to realize CDW resource utilization through incentive measures. On the other hand, although the ecological compensation coefficient is not conducive to the adoption of green development behavior by the G1 government, it can effectively promote the adoption of an incentive strategy by the G2 government. That is, an increase in the ecological compensation coefficient will increase the expenditure cost of the G1 government and lead to a change in the G1 government’s strategic choice from paying ecological compensation to not paying ecological compensation. However, the G2 government will eventually reach the same steady state regardless of the size of the ecological compensation coefficient. In addition, the G2 government reaches a steady state in a shorter period of time compared to the G1 government. Therefore, the payment of ecological compensation by the G1 government can effectively promote the green development behavior of the G2 government to adopt incentive measures.
(3)
In the process of CDW cross-regional disposal, if the ecological benefits brought by the ecological compensation system are high enough, different governments will actively participate in CDW cross-regional disposal cooperation through green development behavior. However, when only G2 government adopts green development behavior, a free-rider effect may occur, and the ecological benefits will negatively affect G1 government’s green development behaviors.

6.2. Implications

Based on the above conclusions, the following management implications are obtained from this paper:
(1)
To enhance the effectiveness of the cross-regional treatment of CDW, it is recommended that the different local governments all actively adopt green development behavior. For example, on the one hand, it is suggested that the central government strengthen policy propaganda to raise local governments’ awareness of horizontal ecological compensation. In addition, the central government can also provide incentives for government green development behavior through vertical financial transfer payments and the establishment of special funds to increase the participation of local governments. On the other hand, it is suggested that local governments strengthen communication and coordination between departments and build a platform for information sharing and exchange to increase the willingness of each government to participate in ecological compensation.
(2)
To allocate more ecological benefits to both governments that adopt green development behavior, it is suggested that different governments actively realize cross-regional resource utilization of CDW through cross-regional collaboration. Cross-regional collaboration by governments not only improves environmental governance capacity but also helps to produce more environmental benefits and improve regional green development. For example, eight prefecture-level cities in China, including Guangzhou, Shenzhen, and Zhuhai, have successfully achieved balanced cross-regional disposal of CDW [69]. In addition, the government’s ecological compensation efforts should match its financial capacity. On the one hand, it is suggested that the beneficiary government take into account the environmental treatment cost and treatment effectiveness of the ecological reserve and provide moderate compensation to the protection government. On the other hand, to reduce the financial pressure caused by the direct payment of ecological compensation fees, the government should adopt market-oriented and diversified ecological compensation methods. For example, the government can broaden the financing channels of ecological compensation by attracting social capital to enter and purchase ecological products such as CDW recycled materials to promote the development of green industries in protected areas.
(3)
It is suggested that the government actively promote CDW resource utilization through green development behavior, such as subsidizing costs, formulating policies, and promoting guidance, to improve ecological and environmental quality and generate more ecological benefits. What needs special attention is that to reduce or avoid the phenomenon of government free riders in the process of cross-regional disposal of CDW, the central government should strengthen the incentives and constraints for local governments. For example, the central government should implement the ecological compensation responsibilities of beneficiary governments by improving the ecological compensation appraisal and evaluation mechanism and increasing rewards and punishments.
This paper takes ecological compensation as the perspective and takes into account the allocation coefficient of ecological benefits, ecological compensation coefficient, ecological benefits, and other influencing factors in the model to reveal the evolution mechanism of the government green development behavior in the ecological compensation of CDW cross-regional disposal. However, there are still some limitations. (1) Ecological compensation for CDW cross-regional disposal also involves other stakeholders, such as enterprises responsible for transporting and disposing of CDW and the public near the CDW disposal site. However, the consideration of these stakeholders is missing in this paper. (2) Different forms of ecological compensation are not explored in this paper. Therefore, researchers could construct a game model considering the government, enterprises, and the public together in the research framework, and the effects of different ecological compensation methods on the behavior of compensation subjects and objects can be considered comprehensively.

Author Contributions

Methodology, validation, formal analysis, investigation, resources, data curation, writing—original draft, writing—review and editing, visualization, W.C.; conceptualization, methodology, writing—original draft, supervision, project administration, X.L.; writing—review and editing, W.Y., B.Y., S.X. and H.Z. All authors have read and agreed to the published version of the manuscript.

Funding

This work was supported by the National Natural Science Foundation of China (grant number 72204178), the Sichuan Science and Technology Program, Natural Science Foundation of Sichuan, China (grant number 2023NSFSC1053), and the National College Students Innovation and Entrepreneurship Training Plan (grant number 202310626041).

Institutional Review Board Statement

Not applicable.

Informed Consent Statement

Not applicable.

Data Availability Statement

Not applicable.

Conflicts of Interest

The authors declare no conflict of interest.

References

  1. Islam, S.; Islam, J.; Hoque, N.M.R. Improvement of consolidation properties of clay soil using fine-grained construction and demolition waste. Heliyon 2022, 8, e11029. [Google Scholar] [CrossRef] [PubMed]
  2. Wu, H.; Duan, H.; Wang, J.; Wang, T.; Wang, X. Quantification of carbon emission of construction waste by using streamlined LCA: A case study of Shenzhen, China. J. Mater. Cycles Waste Manag. 2015, 17, 637–645. [Google Scholar] [CrossRef]
  3. Prakash, R.; Thenmozhi, R.; Raman, S.N.; Subramanian, C. Characterization of eco-friendly steel fiber-reinforced concrete containing waste coconut shell as coarse aggregates and fly ash as partial cement replacement. Struct. Concr. 2020, 21, 437–447. [Google Scholar] [CrossRef]
  4. Ma, L.; Zhang, L. Evolutionary game analysis of construction waste recycling management in China. Resour. Conserv. Recycl. 2020, 161, 104863. [Google Scholar] [CrossRef]
  5. Liu, Y.; Hao, J.; Li, C.; Li, Y.; Zhou, C.; Zheng, H.; Xu, S.; Chen, W.; Li, X. How Can Construction and Demolition Waste Recycling Public-Private Partnership Projects Performance Compensate during the Operation Period? A Two-Stage Perspective of Recycling and Remanufacturing. Systems 2023, 11, 170. [Google Scholar] [CrossRef]
  6. He, L.; Yuan, H.; Wu, H. Collaborative mechanism for promoting the cross-regional management of construction and demolition waste. J. Clean. Prod. 2022, 372, 133706. [Google Scholar] [CrossRef]
  7. Zheng, H.; Li, X.; Zhu, X.; Huang, Y.; Liu, Z.; Liu, Y.; Liu, J.; Li, X.; Li, Y.; Li, C. Impact of Recycler Information Sharing on Supply Chain Performance of Construction and Demolition Waste Resource Utilization. Int. J. Environ. Res. Public Health 2022, 19, 3878. [Google Scholar] [CrossRef]
  8. Li, X.; Dai, J.; Zhu, X.; He, J.; Li, J.; Liu, X.; Huang, Y.; Shen, Q. What Is the Mechanism of Government Green Development Behavior Considering Multi-Agent Interaction? A Meta-Analysis. Int. J. Environ. Res. Public Health 2022, 19, 8263. [Google Scholar] [CrossRef]
  9. Chen, G.; Wei, B.; Zhu, R. The impact of environmental subsidy on the performance of corporate environmental responsibility: Evidence from China. Front. Environ. Sci. 2022, 10, 972328. [Google Scholar] [CrossRef]
  10. Akhtar, R.; Sultana, S.; Masud, M.M.; Jafrin, N.; Al-Mamun, A. Consumers’ environmental ethics, willingness, and green consumerism between lower and higher income groups. Resour. Conserv. Recycl. 2021, 168, 105274. [Google Scholar] [CrossRef]
  11. Fu, Y.; Dong, N.; Ge, Q.; Xiong, F.; Gong, C. Driving-paths of green buildings industry (GBI) from stakeholders’ green behavior based on the network analysis. J. Clean. Prod. 2020, 273, 122883. [Google Scholar] [CrossRef]
  12. Wu, L.; Ma, T.; Bian, Y.; Li, S.; Yi, Z. Improvement of regional environmental quality: Government environmental governance and public participation. Sci. Total Environ. 2020, 717, 137265. [Google Scholar] [CrossRef] [PubMed]
  13. Promoting Green Development and Building a Beautiful China—A Series of Press Conferences on the Theme of “China in This Decade” Focus on the Achievements of Ecological Civilization in the New Era. Available online: https://www.gov.cn/xinwen/2022-09/16/content_5710157.htm (accessed on 30 May 2023).
  14. Zhou, C.; He, J.; Li, Y.; Chen, W.; Zhang, Y.; Zhang, H.; Xu, S.; Li, X. Green Independent Innovation or Green Imitation Innovation? Supply Chain Decision-Making in the Operation Stage of Construction and Demolition Waste Recycling Public-Private Partnership Projects. Systems 2023, 11, 94. [Google Scholar] [CrossRef]
  15. Ding, Z.; Zhu, M.; Wu, Z.; Fu, Y.; Liu, X. Combining AHP-Entropy Approach with GIS for Construction Waste Landfill Selection-A Case Study of Shenzhen. Int. J. Environ. Res. Public Health 2018, 15, 2254. [Google Scholar] [CrossRef] [PubMed] [Green Version]
  16. Barbudo, A.; Ayuso, J.; Lozano, A.; Cabrera, M.; Lopez-Uceda, A. Recommendations for the management of construction and demolition waste in treatment plants. Environ. Sci. Pollut. Res. 2020, 27, 125–132. [Google Scholar] [CrossRef] [PubMed] [Green Version]
  17. Han, Y.; Zheng, H.; Huang, Y.; Li, X. Considering Consumers’ Green Preferences and Government Subsidies in the Decision Making of the Construction and Demolition Waste Recycling Supply Chain: A Stackelberg Game Approach. Buildings 2022, 12, 832. [Google Scholar] [CrossRef]
  18. Ortiz, C.; Alvarado, R.; Mendez, P.; Flores-Chamba, J. Environmental impact of the shadow economy, globalisation, and human capital: Capturing spillovers effects using spatial panel data approach. J. Environ. Manag. 2022, 308, 114663. [Google Scholar] [CrossRef]
  19. Nguyen, H.G.; Nguyen, D.T.; Nghiem, H.T.; Tran, V.C.; Kato, A.; Matsuno, A.; Isobe, Y.; Kawasaki, M.; Kawamoto, K. Current Management Condition and Waste Composition Characteristics of Construction and Demolition Waste Landfills in Hanoi of Vietnam. Sustainability 2021, 13, 10148. [Google Scholar] [CrossRef]
  20. Tan, R.; Jin, H.; Yu, M.; Yang, J.; Zhang, J. Research on Construction Waste Recycling Subsidy Model Considering Contractor’s Environmental Awareness. Sustainability 2023, 15, 2333. [Google Scholar] [CrossRef]
  21. Yu, B.; Xu, L. Review of ecological compensation in hydropower development. Renew. Sust. Energ. Rev. 2016, 55, 729–738. [Google Scholar] [CrossRef]
  22. Chen, W.Y. Environmental externalities of urban river pollution and restoration: A hedonic analysis in Guangzhou (China). Landsc. Urban Plan. 2017, 157, 170–179. [Google Scholar] [CrossRef]
  23. Du, Z.; Zhu, X.; Shan, W. External Diseconomy Theory and Environmental Management: Optimal Taxation Model in China Marine Management. J. Coast. Res. 2020, 109, 174–180. [Google Scholar] [CrossRef]
  24. Bithas, K. Sustainability and externalities: Is the internalization of externalities a sufficient condition for sustainability? Ecol. Econ. 2011, 70, 1703–1706. [Google Scholar] [CrossRef]
  25. Eidelwein, F.; Collatto, D.C.; Rodrigues, L.H.; Lacerda, D.P.; Piran, F.S. Internalization of environmental externalities: Development of a method for elaborating the statement of economic and environmental results. J. Clean. Prod. 2018, 170, 1316–1327. [Google Scholar] [CrossRef]
  26. Deng, H.; Zheng, P.; Liu, T.; Liu, X. Forest Ecosystem Services and Eco-Compensation Mechanisms in China. Environ. Manag. 2011, 48, 1079–1085. [Google Scholar] [CrossRef]
  27. Luo, J.; Huang, M.; Bai, Y. Promoting green development of agriculture based on low-carbon policies and green preferences: An evolutionary game analysis. Environ. Dev. Sustain. 2023. Published online. [Google Scholar] [CrossRef]
  28. Li, X.; Li, J.; Huang, Y.; He, J.; Liu, X.; Dai, J.; Shen, Q. Construction enterprises’ adoption of green development behaviors: An agent-based modeling approach. Hum. Soc. Sci. Commun. 2022, 9, 244. [Google Scholar] [CrossRef]
  29. Pillay, Y.P.; Buschke, F.T. Misaligned environmental governance indicators and the mismatch between government actions and positive environmental outcomes. Environ. Sci. Policy 2020, 112, 374–380. [Google Scholar] [CrossRef]
  30. Li, X.; Dai, J.; Li, J.; He, J.; Liu, X.; Huang, Y.; Shen, Q. Research on the Impact of Enterprise Green Development Behavior: A Meta-Analytic Approach. Behav. Sci. 2022, 12, 35. [Google Scholar] [CrossRef]
  31. Farley, J.; Costanza, R. Payments for ecosystem services: From local to global. Ecol. Econ. 2010, 69, 2060–2068. [Google Scholar] [CrossRef]
  32. Luo, W.; Bai, H.; Jing, Q.; Liu, T.; Xu, H. Urbanization-induced ecological degradation in Midwestern China: An analysis based on an improved ecological footprint model. Resour. Conserv. Recycl. 2018, 137, 113–125. [Google Scholar] [CrossRef]
  33. Jiang, Y.; Guan, D.; He, X.; Yin, B.; Zhou, L.; Sun, L.; Huang, D.; Li, Z.; Zhang, Y. Quantification of the coupling relationship between ecological compensation and ecosystem services in the Yangtze River Economic Belt, China. Land Use Policy 2022, 114, 105995. [Google Scholar] [CrossRef]
  34. Yi, Y.; Wei, Z.; Fu, C. A Differential Game of Transboundary Pollution Control and Ecological Compensation in a River Basin. Complexity 2020, 2020, 6750805. [Google Scholar] [CrossRef]
  35. Gao, X.; Shen, J.; He, W.; Sun, F.; Zhang, Z.; Guo, W.; Zhang, X.; Kong, Y. An evolutionary game analysis of governments’ decision-making behaviors and factors influencing watershed ecological compensation in China. J. Environ. Manag. 2019, 251, 109592. [Google Scholar] [CrossRef] [PubMed]
  36. Lv, C.; Xu, X.; Guo, X.; Feng, J.; Yan, D. Basin water ecological compensation interval accounting based on dual perspectives of supply and consumption: Taking Qingyi River Basin as an example. J. Clean. Prod. 2023, 385, 135610. [Google Scholar] [CrossRef]
  37. Wang, K.; Ou, M.; Wolde, Z. Regional Differences in Ecological Compensation for Cultivated Land Protection: An Analysis of Chengdu, Sichuan Province, China. Int. J. Environ. Res. Public Health 2020, 17, 8242. [Google Scholar] [CrossRef] [PubMed]
  38. Hou, L.; Xia, F.; Chen, Q.; Huang, J.; He, Y.; Rose, N.; Rozelle, S. Grassland ecological compensation policy in China improves grassland quality and increases herders’ income. Nat. Commun. 2021, 12, 4683. [Google Scholar] [CrossRef]
  39. Sun, J.; Ruze, N.; Zhang, J.; Shi, J.; Shen, B. Capacity planning and optimization for integrated energy system in industrial park considering environmental externalities. Renew. Energy 2021, 167, 56–65. [Google Scholar] [CrossRef]
  40. Pajewski, T.; Malak-Rawlikowska, A.; Golebiewska, B. Measuring regional diversification of environmental externalities in agriculture and the effectiveness of their reduction by EU agri-environmental programs in Poland. J. Clean. Prod. 2020, 276, 123013. [Google Scholar] [CrossRef]
  41. Shao, Z.; Li, M.; Yu, D. Bibliometric analysis of construction and demolition waste recycling and utilization: Review and prospect. Proc. Inst. Civ. Eng.-Eng. Sustain. 2022, 175, 283–292. [Google Scholar] [CrossRef]
  42. Sun, Y.; Gu, Z. Implementation of Construction Waste Recycling under Construction Sustainability Incentives: A Multi-Agent Stochastic Evolutionary Game Approach. Sustainability 2022, 14, 3702. [Google Scholar] [CrossRef]
  43. Li, X.; He, J.; Huang, Y.; Li, J.; Liu, X.; Dai, J. Predicting the factors influencing construction enterprises’ adoption of green development behaviors using artificial neural network. Hum. Soc. Sci. Commun. 2022, 9, 238. [Google Scholar] [CrossRef]
  44. Li, X.; Dai, J.; Zhu, X.; Li, J.; He, J.; Huang, Y.; Liu, X.; Shen, Q. Mechanism of attitude, subjective norms, and perceived behavioral control influence the green development behavior of construction enterprises. Hum. Soc. Sci. Commun. 2023, 10, 266. [Google Scholar] [CrossRef]
  45. Busch, J.; Ring, I.E.; Akullo, M.; Amarjargal, O.; Borie, M.; Cassola, R.S.; Cruz-Trinidad, A.; Droste, N.; Haryanto, J.T.; Kasymov, U.; et al. A global review of ecological fiscal transfers. Nat. Sustain. 2021, 4, 756–765. [Google Scholar] [CrossRef]
  46. Qu, Q.; Tsai, S.B.; Tang, M.; Xu, C.; Dong, W. Marine Ecological Environment Management Based on Ecological Compensation Mechanisms. Sustainability 2016, 8, 1267. [Google Scholar] [CrossRef] [Green Version]
  47. Vaissiere, A.C.; Meinard, Y. A policy framework to accommodate both the analytical and normative aspects of biodiversity in ecological compensation. Biol. Conserv. 2021, 253, 108897. [Google Scholar] [CrossRef]
  48. Cai, Z.; Yang, X. Research on Restoration of Heavy Metal Contaminated Farmland Based on Restoration Ecological Compensation Mechanism. Sustainability 2023, 15, 5210. [Google Scholar] [CrossRef]
  49. Zhai, T.; Wu, L.; Chen, Y.; Nazir, M.; Chang, M.; Ma, Y.; Cai, E.; Ding, G.; Zhao, C.; Li, L.; et al. Ecological Compensation in the Context of Carbon Neutrality: A Case Involving Service Production-Transmission and Distribution-Service Consumption. Land 2022, 11, 2321. [Google Scholar] [CrossRef]
  50. Zhao, Y.; Wu, F.; Li, F.; Chen, X.; Xu, X.; Shao, Z. Ecological Compensation Standard of Trans-Boundary River Basin Based on Ecological Spillover Value: A Case Study for the Lancang-Mekong River Basin. Int. J. Environ. Res. Public Health 2021, 18, 1251. [Google Scholar] [CrossRef]
  51. Li, M.; Lu, S.; Li, W. Stakeholders’ ecological-economic compensation of river basin: A multi-stage dynamic game analysis. Resour. Policy 2022, 79, 103083. [Google Scholar] [CrossRef]
  52. Jiang, K.; You, D.; Li, Z.; Shi, S. A differential game approach to dynamic optimal control strategies for watershed pollution across regional boundaries under eco-compensation criterion. Ecol. Indic. 2019, 105, 229–241. [Google Scholar] [CrossRef]
  53. Wu, Z.; Yu, A.T.W.; Shen, L. Investigating the determinants of contractor’s construction and demolition waste management behavior in Mainland China. Waste Manag. 2017, 60, 290–300. [Google Scholar] [CrossRef] [PubMed]
  54. Liu, J.; Teng, Y. Evolution game analysis on behavioral strategies of multiple stakeholders in construction waste resource industry chain. Environ. Sci. Pollut. Res. 2023, 30, 19030–19046. [Google Scholar] [CrossRef]
  55. Chu, Z.; Bian, C.; Yang, J. How can public participation improve environmental governance in China? A policy simulation approach with multi-player evolutionary game. Environ. Impact Assess. Rev. 2022, 95, 106782. [Google Scholar] [CrossRef]
  56. Wang, W.; You, X.; Liu, K.; Wu, Y.; You, D. Implementation of a Multi-Agent Carbon Emission Reduction Strategy under the Chinese Dual Governance System: An Evolutionary Game Theoretical Approach. Int. J. Environ. Res. Public Health 2020, 17, 8463. [Google Scholar] [CrossRef]
  57. Zheng, S.; Yu, L. The government’s subsidy strategy of carbon-sink fishery based on evolutionary game. Energy 2022, 254, 124282. [Google Scholar] [CrossRef]
  58. Lu, Z.; Wu, X.; Zhang, S.; Li, J.; Cai, F.; Xu, R. A study of ecological compensation in watersheds based on the three-way decisions theory. J. Clean. Prod. 2022, 368, 133166. [Google Scholar] [CrossRef]
  59. Li, J.; Jiang, S. How can governance strategies be developed for marine ecological environment pollution caused by sea-using enterprises?-A study based on evolutionary game theory. Ocean Coast. Manag. 2023, 232, 106447. [Google Scholar] [CrossRef]
  60. Ding, Z.; Yi, G.; Tam, V.W.Y.; Huang, T. A system dynamics-based environmental performance simulation of construction waste reduction management in China. Waste Manag. 2016, 51, 130–141. [Google Scholar] [CrossRef]
  61. Wang, L.; Pan, F.; Li, Y. Evolutionary Game Strategies Analysis of Economic Development and Environmental Protection between Local Governments under Central Supervision Mechanism in China. Sustainability 2022, 14, 12498. [Google Scholar] [CrossRef]
  62. Chu, Z.; Bian, C.; Yang, J. Joint prevention and control mechanism for air pollution regulations in China: A policy simulation approach with evolutionary game. Environ. Impact Assess. Rev. 2021, 91, 106668. [Google Scholar] [CrossRef]
  63. Jiang, K.; Zhang, X.; Wang, Y. Stability and influencing factors when designing incentive-compatible payments for watershed services: Insights from the Xin’an River Basin, China. Mar. Policy 2021, 134, 104824. [Google Scholar] [CrossRef]
  64. Chen, J.; Hua, C.; Liu, C. Considerations for better construction and demolition waste management: Identifying the decision behaviors of contractors and government departments through a game theory decision-making model. J. Clean. Prod. 2019, 212, 190–199. [Google Scholar] [CrossRef]
  65. Wang, Q.; Wang, N.; Wang, H.; Xiu, Y. Study on Influencing Factors and Simulation of Watershed Ecological Compensation Based on Evolutionary Game. Sustainability 2022, 14, 3374. [Google Scholar] [CrossRef]
  66. Wang, Y.; Wu, X.; Shen, J.; Chi, C.; Gao, X. Analysis on Decision-Making Changes of Multilevel Governments and Influencing Factors in Watershed Ecological Compensation. Complexity 2021, 2021, 6860754. [Google Scholar] [CrossRef]
  67. Shen, J.; Gao, X.; He, W.; Sun, F.; Zhang, Z.; Kong, Y.; Wan, Z.; Zhang, X.; Li, Z.; Wang, J.; et al. Prospect theory in an evolutionary game: Construction of watershed ecological compensation system in Taihu Lake Basin. J. Clean. Prod. 2021, 291, 125929. [Google Scholar] [CrossRef]
  68. Zhang, M.; Li, H.; Song, Y.; Li, C. Study on the heterogeneous government synergistic governance game of haze in China. J. Environ. Manag. 2019, 248, 109318. [Google Scholar] [CrossRef]
  69. Provincial Housing and Urban-Rural Development Department Held a Symposium on Cross-Regional Balanced Disposal of Construction and Demolition Waste. Available online: http://zfcxjst.gd.gov.cn/xwzx/zxdt/content/post_3462043.html#:~:text=%E6%8E%92%E6%94%BE%E5%9C%B0%E8%A6%81%E5%88%87%E5%AE%9E%E6%8B%85%E8%B4%9F,%E7%9B%91%E7%AE%A1%E5%92%8C%E5%A6%A5%E5%96%84%E5%A4%84%E7%BD%AE%E3%80%82 (accessed on 4 July 2023).
Figure 1. Construction and demolition waste (CDW) cross-regional disposal model. Note: G1 and G2 represent two different local governments within the same country. ε is the ecological compensation coefficient; θ is the allocation coefficient of ecological benefits of G2 government; μ is the environmental loss spillover coefficient; L is the environmental loss when G2 government does not adopt the incentive strategy; M 1 is the overall ecological benefits when G1 government compensates and G2 government adopts the incentive strategy; M 2 is the overall ecological benefits when G1 government does not compensate and G2 government adopts the incentive strategy.
Buildings 13 01762 g001
Figure 2. Effect of initial probability on the evolutionary strategy of green development behavior of G1 government and G2 government.
Buildings 13 01762 g002
Figure 3. Impact of the allocation coefficient of ecological benefits on the evolutionary strategy of government green development behavior. Note: Figure (a) shows the G1 government, and figure (b) shows the G2 government. For the G1 government, 0.1, 0.3, 0.5, 0.7 and 0.9 represent the highest, high, normal, low, and lowest allocation coefficients of ecological benefits, respectively. For the G2 government, 0.1, 0.3, 0.5, 0.7 and 0.9 represent the proportions of lowest, low, normal, high, and highest allocated ecological benefits, respectively.
Buildings 13 01762 g003
Figure 4. Effect of the ecological compensation coefficient on the evolutionary strategy of government green development behavior. Note: Figure (a) shows the G1 government, and figure (b) shows the G2 government. Values of 0.1, 0.3, 0.5, 0.7, and 0.9 represent the lowest, low, normal, high and highest ecological compensation levels, respectively.
Buildings 13 01762 g004
Figure 5. Impact of ecological benefits M 1 on the evolutionary strategy of government green development behavior. Note: Figure (a) shows the G1 government, and figure (b) shows the G2 government. 15, 20, 25, 30, and 35 represent the least, less, normal, more, and most ecological benefits M 1 , respectively.
Buildings 13 01762 g005
Figure 6. Ecological benefits M 2 impact of the evolutionary strategy of government green development behavior. Note: Figure (a) shows the G1 government, and figure (b) shows the G2 government. 10, 15, 20, 25, and 30 represent the least, less, normal, more, and most ecological benefits M 2 , respectively.
Buildings 13 01762 g006
Table 1. Studies related to government green development behavior and ecological compensation.
Research TopicsDimensionsSosurce Papers
Externality theoryPositive environmental externalities[22]
Negative environmental externalities[23]
Internalization of environmental externalities[24,25,26]
Government green development behaviorThe driving role of policies and regulations[27,28]
Environmental regulation mechanism[29,30]
The mechanism of government green development behavior[8]
Ecological compensationThe role of ecological compensation[21,31]
Determination of ecological compensation standards[32,33,34,35]
Research background of ecological compensation[36,37,38]
Table 2. Parameter settings and descriptions.
ParameterParameter Description
C 0 Base cost of G1 government cross-regional disposal of CDW.
C 1 Additional costs for G1 government adoption of ecological compensation.
C 2 Additional costs for G2 government adoption of ecological compensation.
C 3 Cost when G2 government adopts incentive strategy.
C 4 Cost when G2 government does not adopt incentive strategy.
S Reputation gained when G2 government adopts incentive strategy.
L Environmental losses when G2 government does not adopt incentive strategy.
M 1 The overall ecological benefits when G1 government compensates and G2 government adopts the incentive strategy.
M 2 The overall ecological benefits when G1 government does not compensate and G2 government adopts the incentive strategy.
α The weight coefficient of ecological environment in local government performance appraisal.
ε Ecological compensation coefficient (0 < ε < 1).
θ The allocation coefficient of ecological benefits of G2 government. (0 < θ < 1).
R The amount of incentives given by the central government when the G1 government pays ecological compensation.
J Green subsidies given by the central government when the G2 government adopts incentive strategy.
μ Environmental loss spillover coefficient.
Note: The proportion of overall ecological benefits received by the G1 government is 1 θ .
Table 3. The payoff matrix of the evolutionary game model.
G1 Government
Payment of Ecological CompensationNo Payment of Ecological Compensation
G2 governmentIncentive
No incentive
R + α ( 1 θ ) M 1 ε C 3 C 0 C 1
J + α θ M 1 ( 1 ε ) C 3 + S + C 0 C 2
R ε C 4 C 0 C 1 μ L
C 0 ( 1 ε ) C 4 C 2 L
α ( 1 θ ) M 2 C 0
J + α θ M 2 + S + C 0 C 3
C 0 μ L
C 0 L C 4
Table 4. The determinant at the equilibrium point of the system.
Point D e t ( J )
(0,0) ( R C 1 ε C 4 ) ( J + S + L + α θ M 2 C 3 + C 4 )
(0,1) ( R C 1 ε C 3 + α ( 1 θ ) ( M 1 M 2 ) ) ( ( J + S + L + α θ M 2 C 3 + C 4 ) )
(1,0) ( ( R C 1 ε C 4 ) ) ( J + S + L + α θ M 1 + ( 1 ε ) ( C 4 C 3 ) )
(1,1) ( R C 1 ε C 3 + α ( 1 θ ) ( M 1 M 2 ) ) ( J + S + L + α θ M 1 + ( 1 ε ) ( C 4 C 3 ) )
x , y ε C 4 + C 1 R α ( 1 θ ) M 1 M 2 + R C 1 ε C 3 J S L α θ M 2 + C 3 C 4 J + S + L + α θ M 1 + ( 1 ε ) ( C 4 C 3 ) α θ M 1 M 2 + ε ( C 3 C 4 ) α ( 1 θ ) M 1 M 2 + ε ( C 4 C 3 )
Table 5. The trace at the equilibrium point of the system.
Point T r ( J )
(0,0) ( R C 1 ε C 4 ) + ( J + S + L + α θ M 2 C 3 + C 4 )
(0,1) ( R C 1 ε C 3 + α ( 1 θ ) ( M 1 M 2 ) ) + ( ( J + S + L + α θ M 2 C 3 + C 4 ) )
(1,0) ( ( R C 1 ε C 4 ) ) + ( J + S + L + α θ M 1 + ( 1 ε ) ( C 4 C 3 ) )
(1,1) ( ( R C 1 ε C 3 + α ( 1 θ ) ( M 1 M 2 ) ) + ( J + S + L + α θ M 1 + ( 1 ε ) ( C 4 C 3 ) ) )
x , y 0
Table 6. Stability analysis of the points in case (1).
Point A < 0 , B < 0 , D < 0 A < 0 , B < 0 , D > 0 , Ε < 0
D e t J T r J Stability D e t J T r J Stability
(0,0)+-ESS+-ESS
(0,1)-?Saddle point++Unstable point
(1,0)++Unstable point-?Saddle point
-?Saddle point
(1,1)-?Saddle point-?Saddle point
++Unstable point
Note: “+” indicates that the calculation result is greater than 0, “-” indicates that the calculation result is less than 0, and “?” indicates uncertainty; ESS system evolution is stable.
Table 7. Stability analysis of the points in case (2).
Point A < 0 , B > 0 , D < 0 , Ε > 0 A > 0 , B > 0 , D < 0 , Ε > 0
D e t J T r J Stability D e t J T r J Stability
(0,0)-?Saddle point++Unstable point
(0,1)+-ESS+-ESS
(1,0)++Unstable point-?Saddle point
(1,1)-?Saddle point-?Saddle point
Note: “+” indicates that the calculation result is greater than 0, “-” indicates that the calculation result is less than 0, and “?” indicates uncertainty; ESS system evolution is stable.
Table 8. Stability analysis of the points in case (3).
Point A > 0 , B < 0 , D < 0 , E < 0 A > 0 , B < 0 , D > 0 , Ε < 0
D e t J T r J Stability D e t J T r J Stability
(0,0)-?Saddle point-?Saddle point
(0,1)-?Saddle point++Unstable point
(1,0)+-ESS+-ESS
(1,1)++Unstable point-?Saddle point
Note: “+” indicates that the calculation result is greater than 0, “-” indicates that the calculation result is less than 0, and “?” indicates uncertainty; ESS system evolution is stable.
Table 9. Stability analysis of the points in case (4).
Point B > 0 , D > 0 , Ε > 0 A > 0 , B < 0 , D > 0 , Ε > 0
D e t J T r J Stability D e t J T r J Stability
(0,0)-?Saddle point-?Saddle point
++Unstable point
(0,1)-?Saddle point++Unstable point
(1,0)++Unstable point-?Saddle point
-?Saddle point
(1,1)+-ESS+-ESS
Note: “+” indicates that the calculation result is greater than 0, “-” indicates that the calculation result is less than 0, and “?” indicates uncertainty; ESS system evolution is stable.
Table 10. Stability analysis of the points in case (5).
Point A < 0 , B < 0 , D > 0 , Ε > 0
D e t J T r J Stability
(0,0)+-ESS
(0,1)++Unstable point
(1,0)++Unstable point
(1,1)+-ESS
Note: “+” indicates that the calculation result is greater than 0, “-” indicates that the calculation result is less than 0, and ESS system evolution is stable.
Table 11. Stability analysis of the points in case (6).
Point A > 0 , B < 0 , D < 0 , Ε > 0
D e t J T r J Stability
(0,0)-?Saddle point
(0,1)-?Saddle point
(1,0)-?Saddle point
(1,1)-?Saddle point
Note: “-” indicates that the calculation result is less than 0, and “?” indicates uncertainty.
Disclaimer/Publisher’s Note: The statements, opinions and data contained in all publications are solely those of the individual author(s) and contributor(s) and not of MDPI and/or the editor(s). MDPI and/or the editor(s) disclaim responsibility for any injury to people or property resulting from any ideas, methods, instructions or products referred to in the content.

