Article

Improving the Seismic Performance of Steel Frames under Mainshock–Aftershock Using Post-Tensioned Connections

1
Facultad de Ingeniería Culiacán, Universidad Autónoma de Sinaloa, Culiacán de Rosales 80040, Mexico
2
Facultad de Ingeniería, Arquitectura y Diseño (FIAD), Universidad Autónoma de Baja California, Ensenada 22860, Mexico
3
Instituto de Ingeniería, Universidad Nacional Autónoma de México, CU, Coyoacán, Cuidad de México 04510, Mexico
4
Departamento de Ingeniería Civil, Universidad Autónoma del Carmen, Cd. del Carmen, Campeche 24180, Mexico
*
Authors to whom correspondence should be addressed.
Buildings 2023, 13(7), 1676; https://doi.org/10.3390/buildings13071676
Submission received: 18 April 2023 / Revised: 16 June 2023 / Accepted: 26 June 2023 / Published: 29 June 2023
(This article belongs to the Special Issue Structural Engineering in Building)

Abstract

:
In this study, the seismic responses of moment-resisting steel frames (MRSFs) with welded and post-tensioned connections under 28 artificial seismic sequences (mainshock–aftershock) are compared. For this aim, the mainshock are scaled at different ground motion intensity levels as a function of the spectral pseudo-acceleration corresponding to the fundamental period of vibration of the structure Sa(T1), whereas different intensity levels of the aftershocks are used for a percentage of the peak maximum acceleration of the mainshock. The seismic performance comparison of both structural systems is computed for the maximum, residual inter-story drift and hysteretic energy demands. The results show that post-tensioned frames significantly reduce the structural demands, especially in the case of residual inter-story drifts and hysteretic energy in comparison with moment-resisting steel frames with welded connections. The reductions in the structural response tend to be larger as the intensity of the aftershock tends to increase. Therefore, it is concluded that the use of post-tensioned connections is a great alternative to mitigate the seismic response of buildings subjected to seismic sequences.

1. Introduction

During the second half of the 20th century, a large number of buildings have suffered severe damage due to high intensity seismic events. Therefore, several researchers focused their studies on the proposal and improvement of design methodologies, since a large number of these buildings did not exhibit the expected behavior during seismic events. For example, during the earthquakes of Kobe in 1995, Northridge in 1994 and Mexico City in 1986, moment-resistant steel frames (MRSFs) with welded beam-column connections did not develop the strong-column weak-beam collapse mechanism considered in structural design, which contemplates the formation of plastic hinges at the ends of the beams. Instead, another damage pattern was observed, prior to the formation of plastic hinges in the beam: a brittle fracture along the welded joint appeared [1], which demonstrated an extremely low ductility capacity of this type of structure. Because of the inadequate performance of MRSF with welded connections, the study of MRSF with semi-rigid bolted beam-column connections began to be developed. This type of connection ensures the formation of the strong-column weak-beam collapse mechanism since the elements that compose the joint are ductile and offer the ability to isolate the damage to easily replaceable non-structural elements. With the aim of increasing the stiffness and resistance capacity in this type of connection, Ricles et al. [2] proposed to reinforce the beam-column connection constituted by two “top and seat” steel angles with high resistance steel strands placed in the direction of the main axis of the beam and anchored in the outer flanges of the columns, which are post-tensioned after the installation of the angles and the beam [2,3]. From this connection, a moment-resistant post-tensioned steel frame is obtained, offering self-centering properties, high ductility and hysteretic energy dissipation (EH). The aim of this connection is to transmit the damage to the angles, which through their inelastic behavior dissipate the hysteretic energy, avoiding damage to the main elements of the frames (beams and columns) under the action of severe earthquakes. Other alternatives for connecting with energy dissipative elements have been proposed: with friction plates bolted to the beam flange [4]; and post-tensioned high-strength steel bars that remain in the elastic range during the seismic response, designed to yield in tension and compression stresses [5].
Post-tensioned steel frames with energy dissipating elements (PTDE) have been shown to be a strong option to replace MRSFs [6,7,8,9,10,11,12,13,14,15,16,17,18]. In fact, recent studies have concluded that PTDEs perform better than MRSFs with welded connections [19,20,21]. López-Barraza et al. [19] compared both types of frames subjected to 30 narrow-band seismic records using incremental nonlinear dynamic analysis [22], where a considerable reduction in all response parameters of PTDEs is observed, such as: maximum and residual inter-story drift, basal shear and internal forces in beams and columns. Something very interesting is that the total demand for EH is lower in PTDEs.
The dynamic analysis of the PTDEs becomes complex by taking into account the hysteric behavior of the post-tensioned semi-rigid connection (PTC) accurately. Currently, some proposals for modeling PTC have emerged: a bi-linear model [23], a multi-linear model [24] and recently a continuous hysteretic model [21]. These models were proposed based on experimental studies, so they are limited to a small number of results. The implementation of PTC in steel frames continues to be investigated analytically and experimentally due to the benefits it brings, such as the application of pre-stress in slender columns on a full scale [25], in the reinforcement of columns and beams of different types of steel frames [26], steel bridges [27,28,29], trusses [28] and concrete joints with carbon fiber strips [30] using finite element programs as a tool. On the other hand, buildings constructed in highly seismic zones are exposed to different ground motions events. Generally, every strong seismic event (mainshock) has a lower intensity known as an aftershock, that may even be imperceptible. Sometimes even the aftershock could produce higher ground motion intensities, as occurred in Canterbury on 3 September 2010 (Mw = 7.0), where a strong aftershock (Mw = 6.3) hit the city of Christchurch, causing large amounts of damage to buildings located in the financial district on 21 February 2011 [31] because of the larger intensities in comparison with the mainshock (since the distance of this site to the fault was closer).
Due to the aforementioned, a seismic sequence is made up of a set of ground motions separated by time intervals, where the first event is called a precursor that occurs before the main event, followed by the mainshock and the aftershock, as long as both occur within a distance of one to two times the failure length of the fault that caused the mainshock [32,33]. In the literature, there is a general agreement that aftershocks are triggered by stress changes of some sort produced by the rupture of the mainshock [34,35]. In general, large earthquakes are followed by increasing of the seismic activity, which generate several aftershocks. In general, the aftershocks could continue for weeks, months or even years [36,37]. It is important to say that as large as the mainshock is, the aftershocks tend to be stronger, and the duration, size and frequency decay over time [38,39]. For this reason, it is very important to study the seismic behavior of structures under seismic sequences.
Although the PTDEs have been shown to perform better during seismic events, they have only been studied in the occurrence of a single event or mainshock. Motivated by the need to understand the seismic behavior of structures under seismic sequences, the main objective of the present work is to study and compare the seismic performance of PTDEs and MRSFs subject to seismic sequences obtained from soft soil sites of Mexico City.
Previous studies have determined that Mexico City has only one seismic sequence recorded in soft soil (amounts of water greater than 400%), recorded in the Central Abastos station (CDAF) during the earthquakes that occurred on 19–20 September 1985 [40], and their acceleration history is available in the Mexican Database of Strong Earthquakes, edited by the Mexican Society of Seismic Engineering.
In this study, a set of seismic sequences of narrow-band motions through a randomized approach will be generated. For this aim, eight seismic records from the database of strong earthquakes in soft soil that have similar period values to those of the actual CDAF sequence were selected, four with a period similar to the mainshock (3 s) and four with a period similar to the aftershock (2.3 s). The four records with a similar period of 3.0 s represent the mainshocks and the total eight records represent the aftershocks in artificial seismic sequences. Therefore, through these records, a total of 28 different seismic sequences combinations will be used to evaluate and compare the seismic performance of PTDEs and MRSFs for maximum, residual inter-story drifts and hysteretic energy as seismic response parameters via incremental dynamic analysis.

2. Methodology

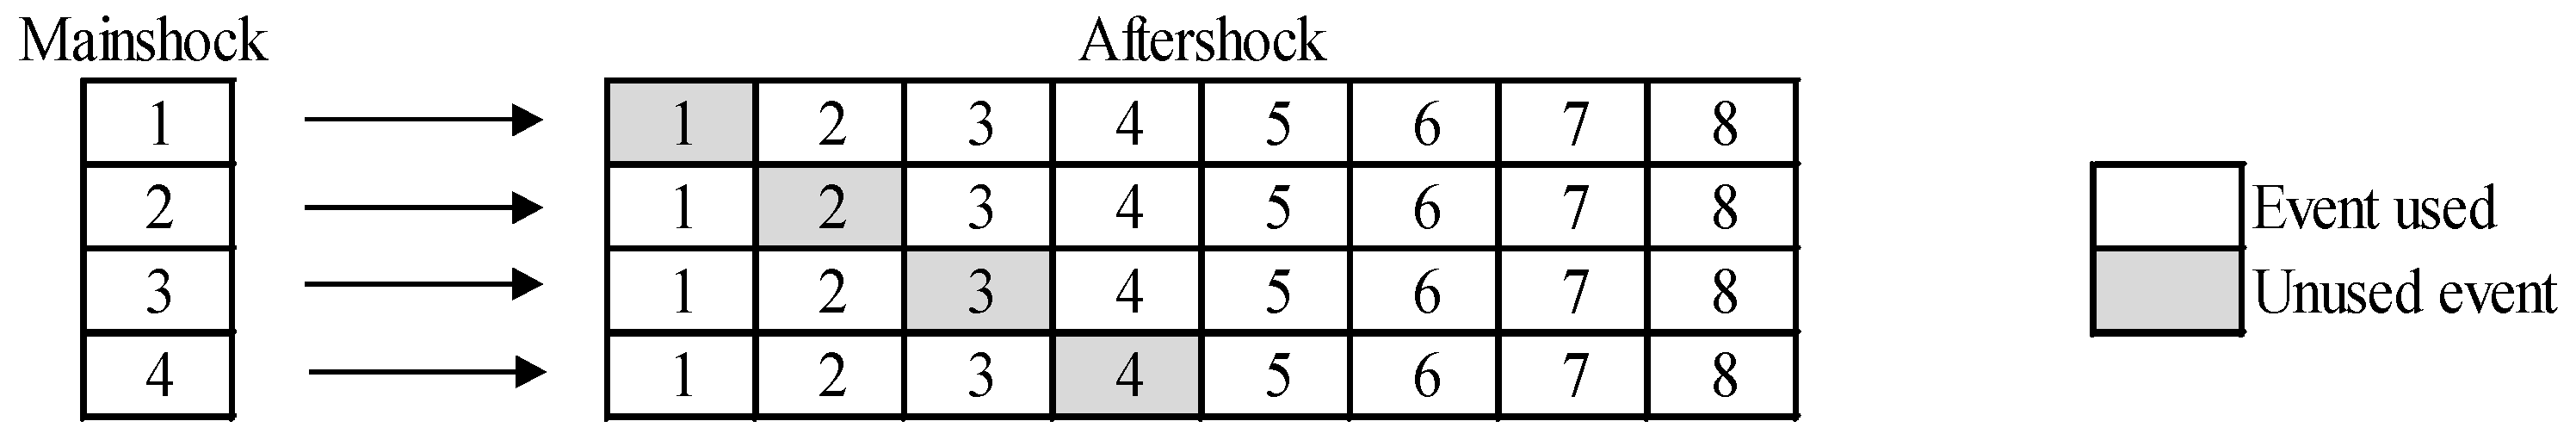
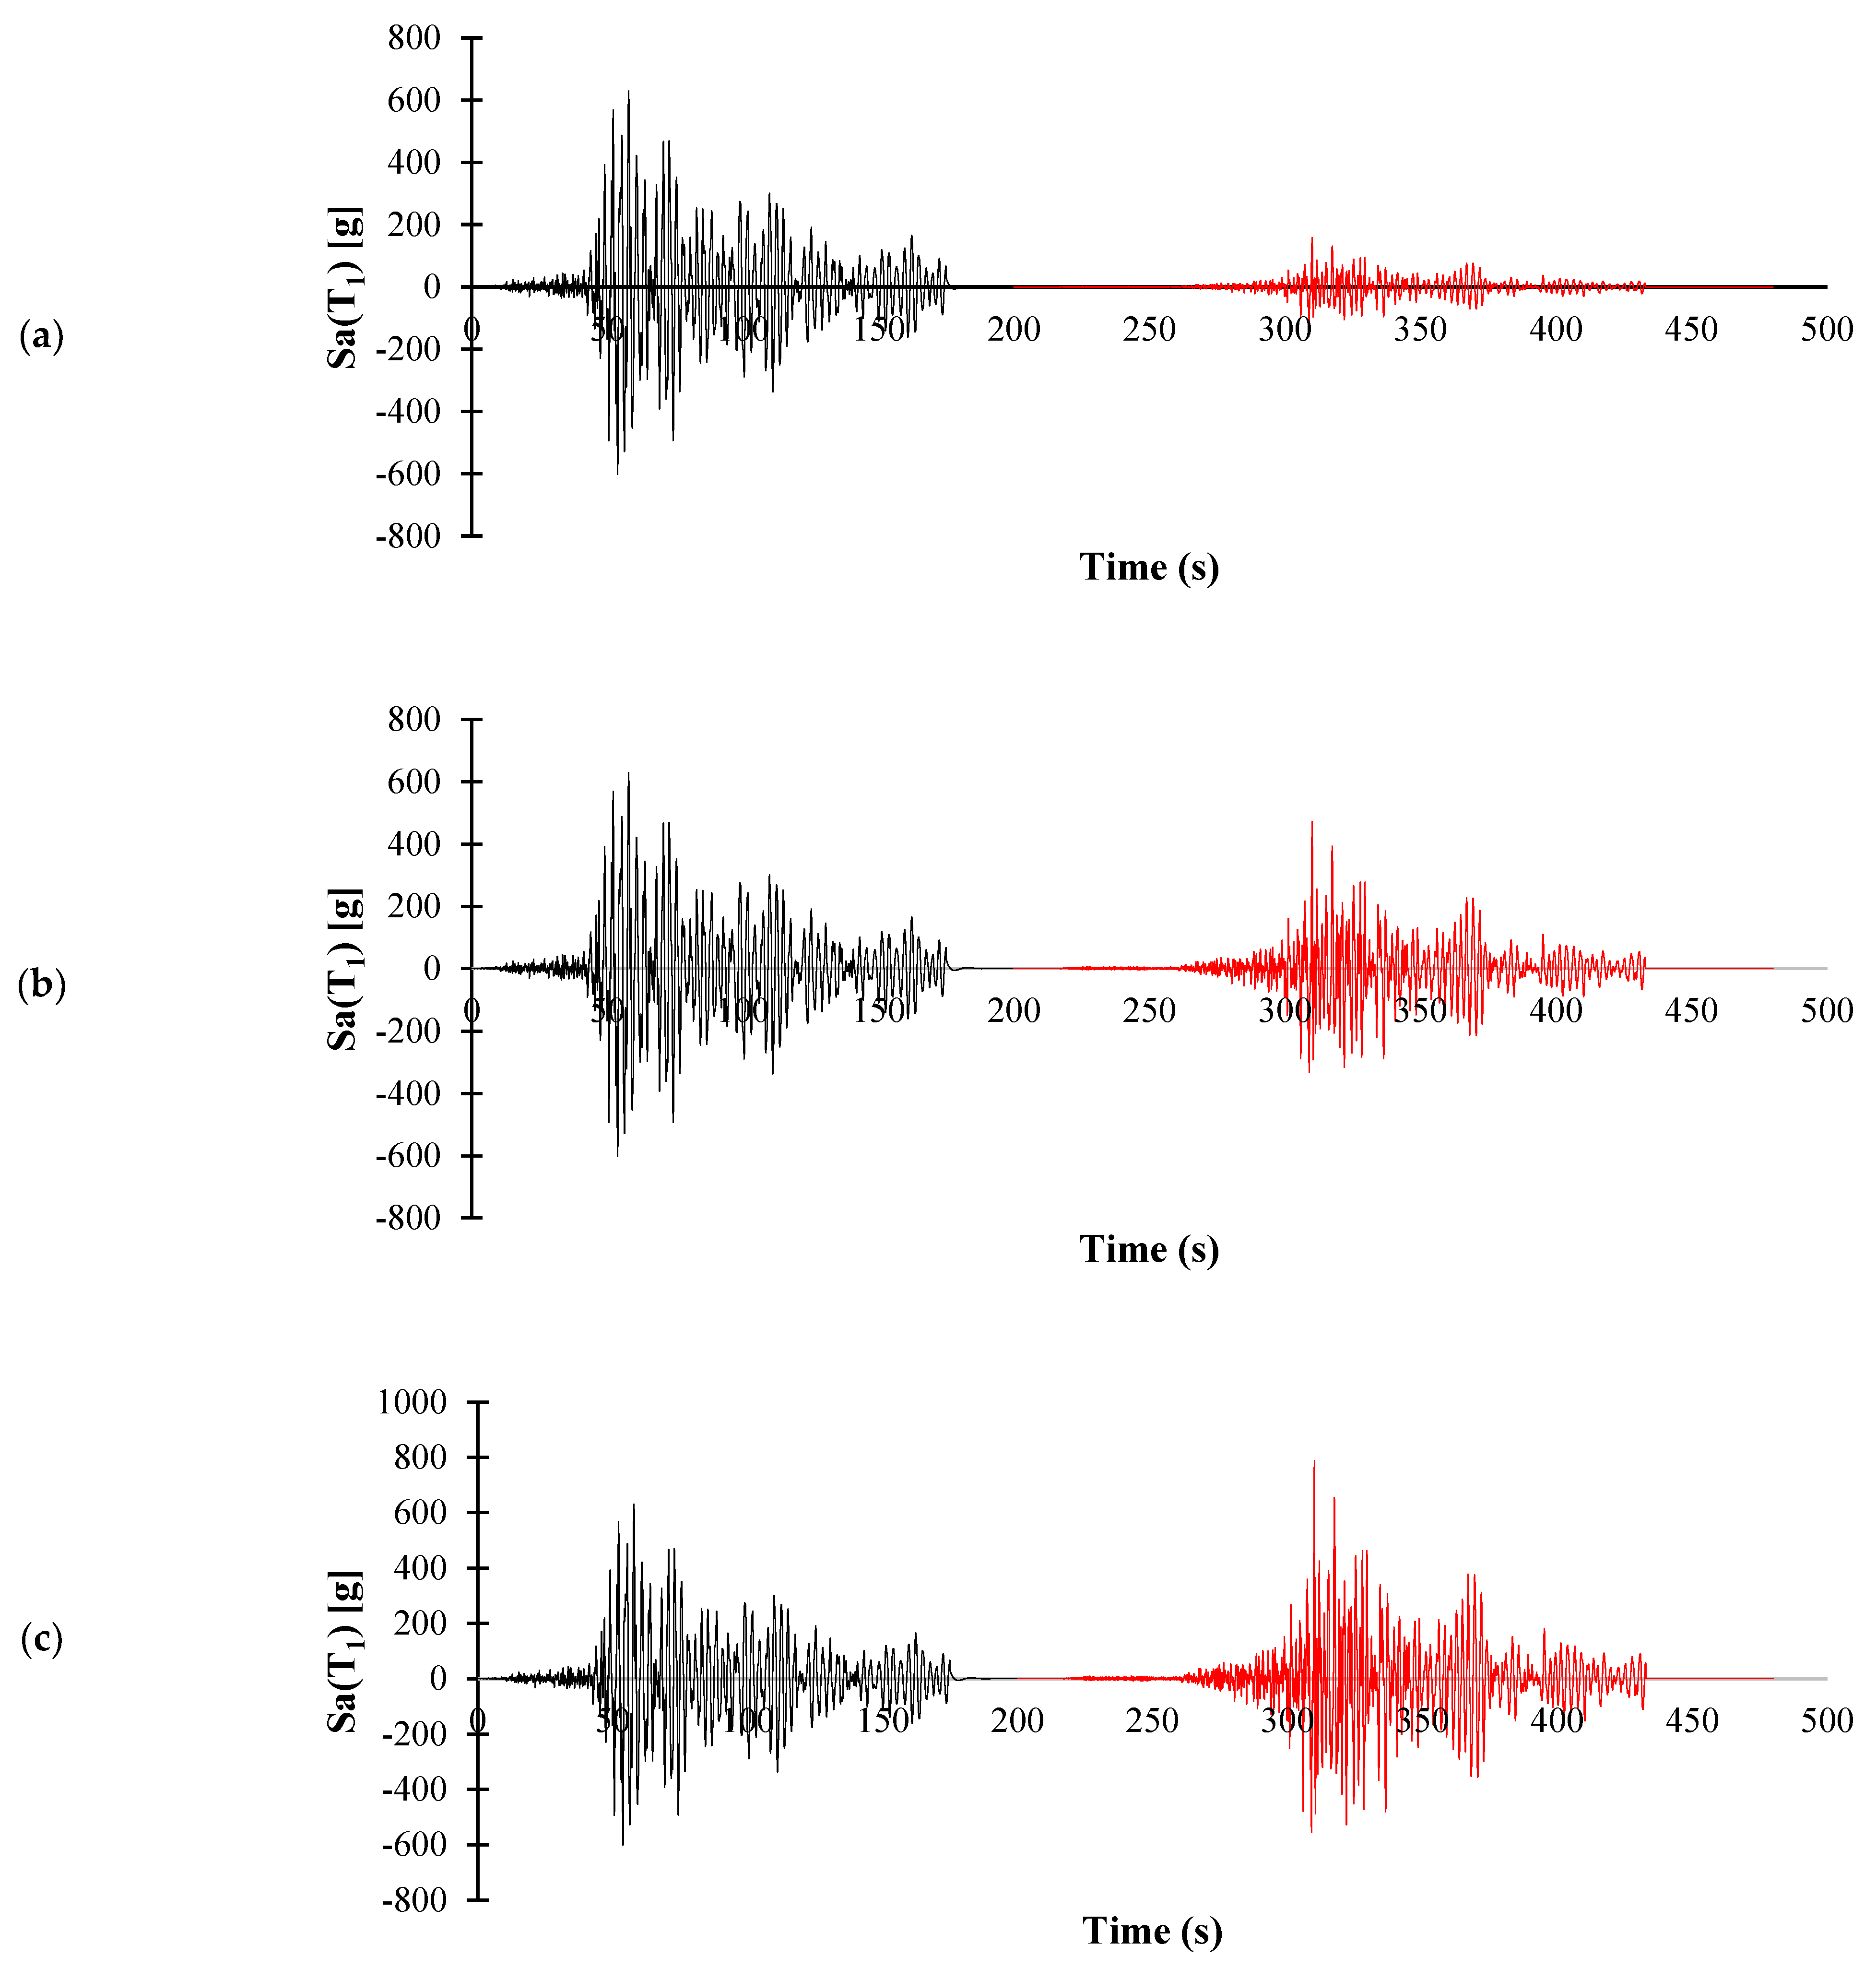
2.1. Seismic Sequences

Previous studies have evidenced the scarcity of seismic sequences recorded in the soft soil zone of Mexico City [41,42,43]; however, when seismic events of these characteristics occur, they produce severe damage to buildings, therefore it is necessary to evaluate the seismic performance of structures subjected to seismic sequences. In this work, the use of artificial seismic sequences developed by the randomized approach to evaluate the seismic performance of structures will be used. This approach consists of assembling a set of real seismic records to generate artificial sequences, first a mainshock is selected, then a period of time with zero accelerations is added; finally, the aftershock is assembled [41,42,43,44,45]. This procedure allows the combination between all considered records. A set of 8 strong ground motions recorded in the soft soil zone of Mexico City [46], listed in Table 1, was selected. Due to the predominant soil periods (Tg) of the mainshocks and aftershocks recorded in the Central de Abastos Station from Mexico City (CDAF) are 3.0 and 2.3 s, respectively, the records with predominant soil periods of 3.0 s will be used as mainshocks, and the rest of the records will represent aftershocks. It is important to say that a ground motion record will be not used to represent the mainshock and the aftershock. Thus, a total of 28 seismic sequences were developed, separating the mainshock from the aftershock with 20 s of zero accelerations to ensure that the structures reach a repose state after free vibration. The combination of the 28 seismic sequences is illustrated in Figure 1. Notice that incremental dynamic analysis (IDA) will be used in order to evaluate the seismic performance of PTDE and MRSF models. It is important to say that the Mexico City Building Code suggests the use of 12 ground motion records. For this reason, we have used a number of records larger than 12 (in this case 28).
All records used in this study have been scaled. The scaled criterion was based on the spectral acceleration at the first mode of vibration of particular structure Sa(T1) values from 0.1 to 2.0 g with 0.1 g increments. The methodology used is as follows:
  • First, the 8 records were integrated to obtain their ground acceleration history.
  • Then, the Sa(T1) values of each record in terms of the structural period are estimated.
  • The target Sa(T1) values from 0.1 to 2.0 g with 0.1 g increments are divided by the real Sa(T1) values of each record in order to obtain 8 scale factors per each scaling level from 0.1 to 2.0 g.
  • The ground acceleration histories were multiplied by the corresponding scale factors.
  • The ground acceleration histories were derived by each of the corresponding scale factors to obtain the scaled mainshocks.
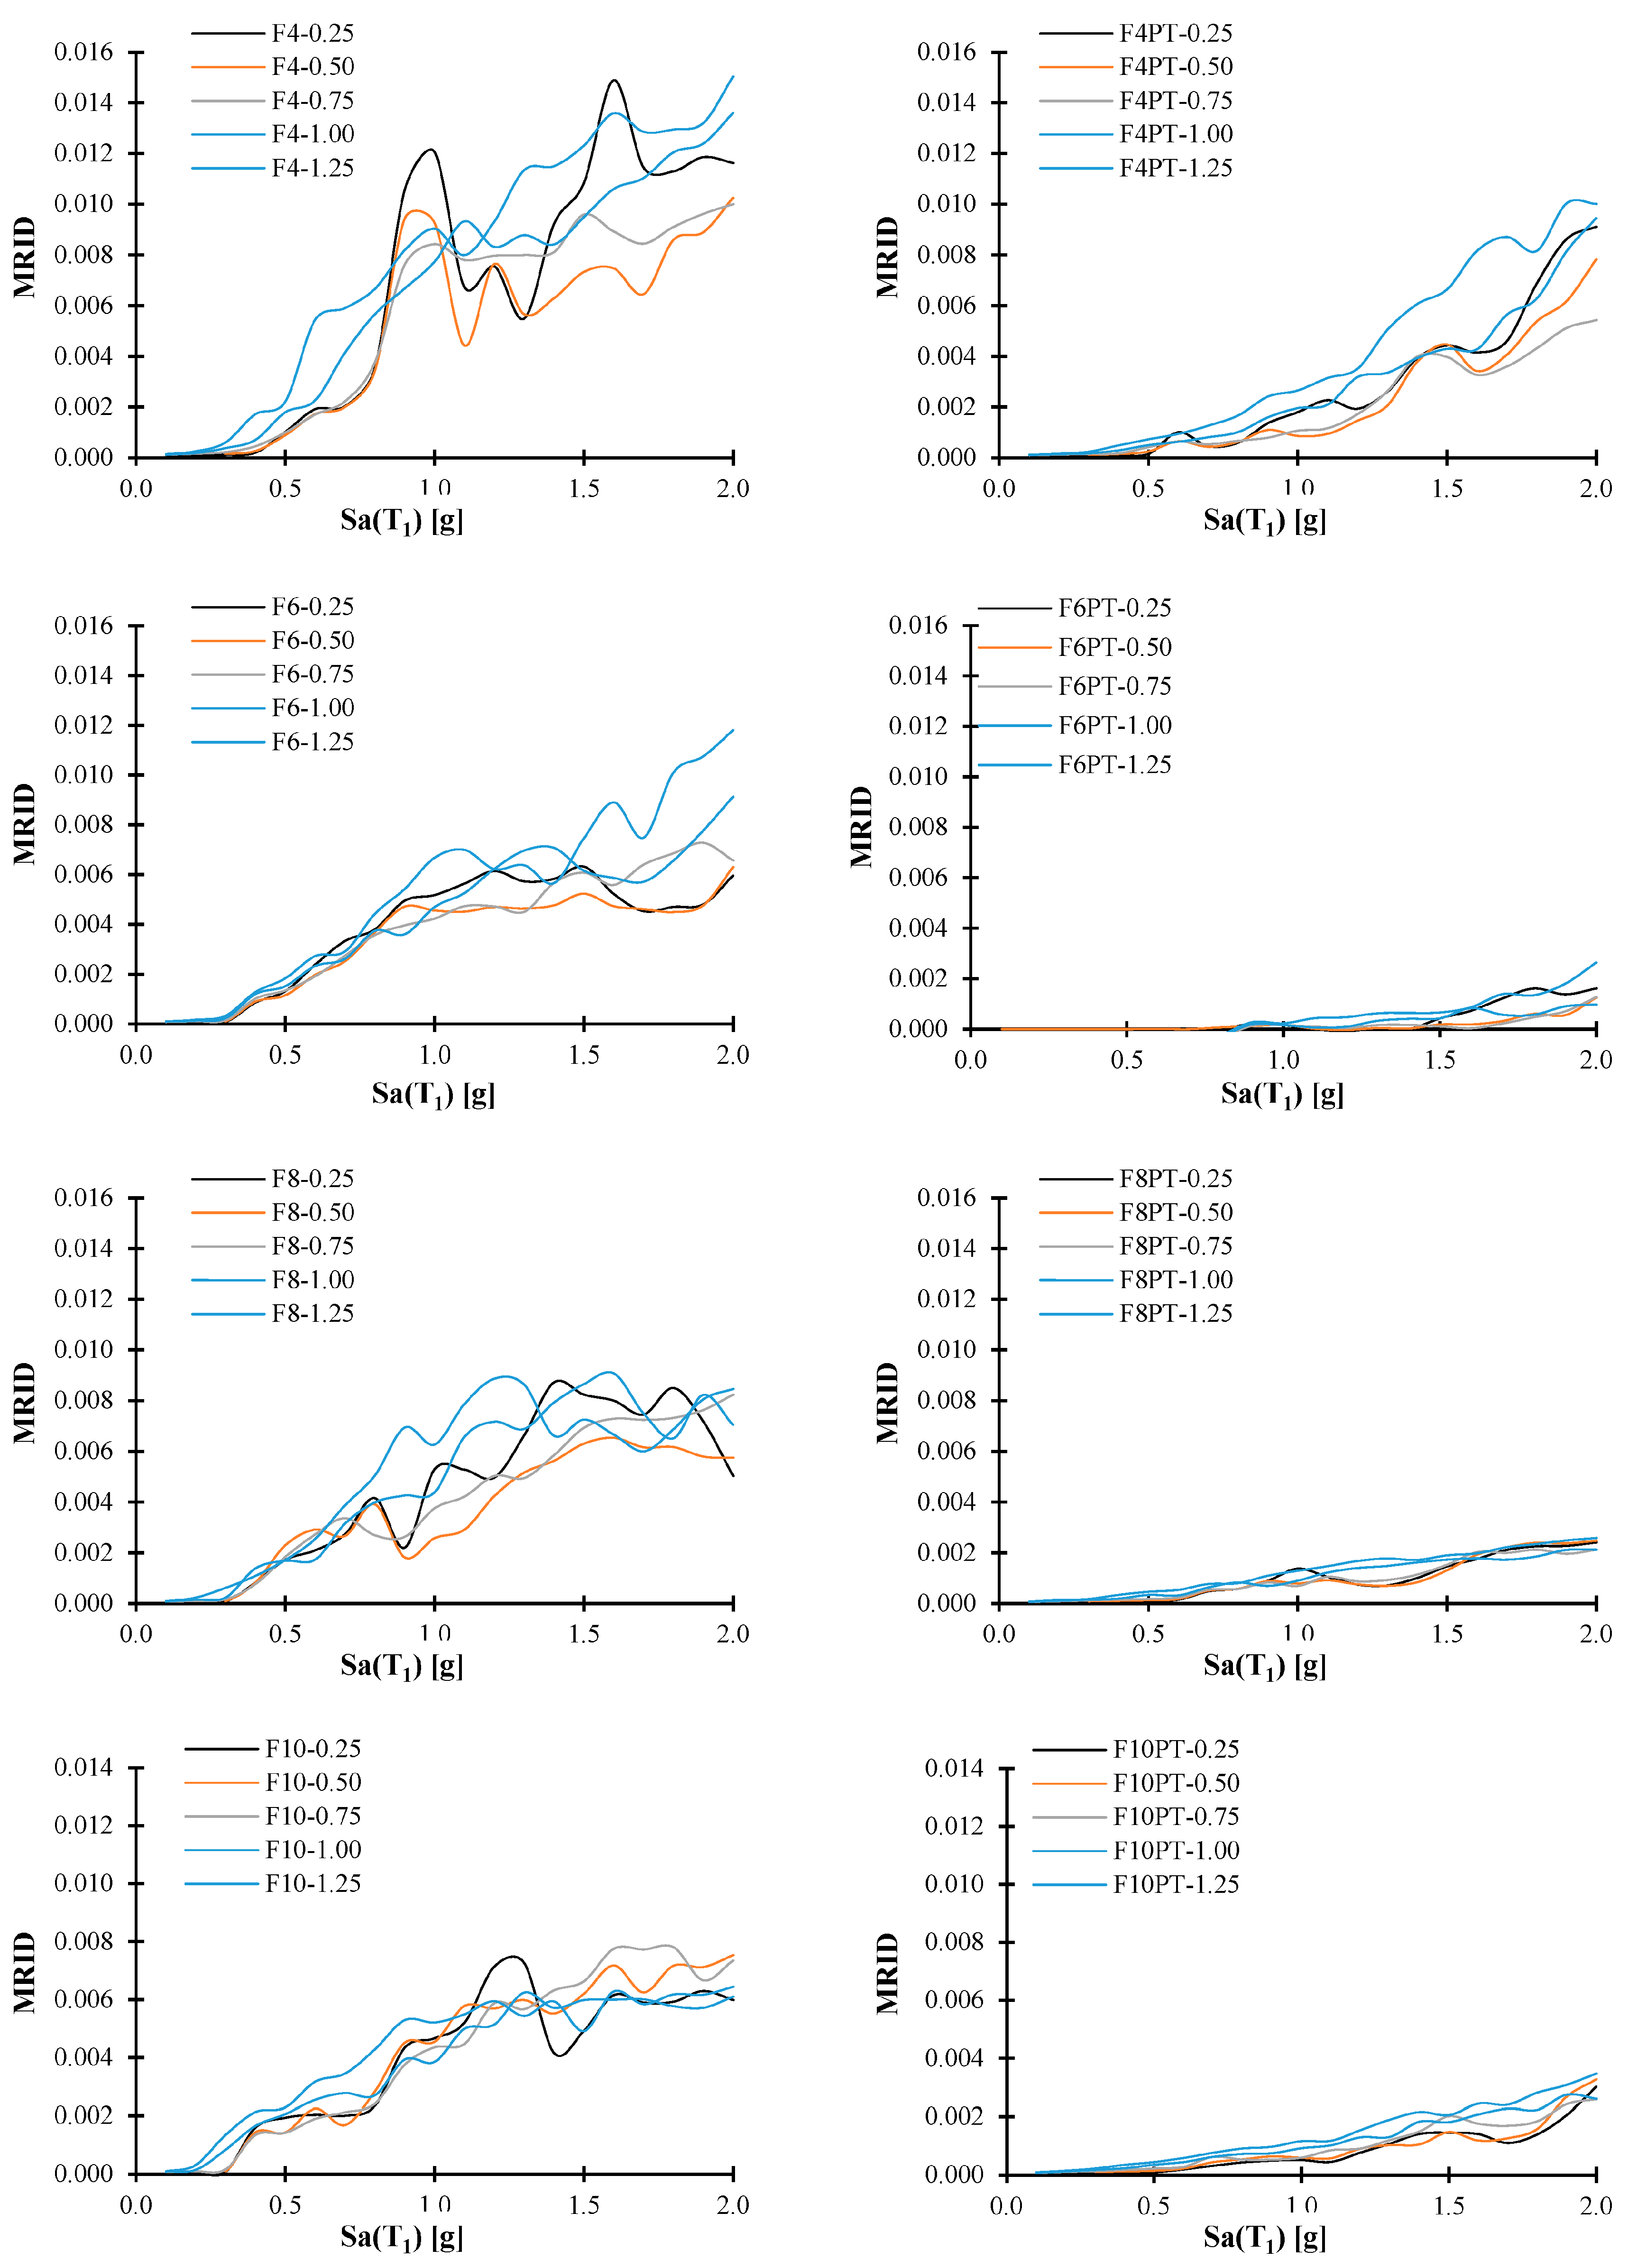
  • The aftershocks are obtained in order to have values of 0.25, 0.5, 0.75, 1.0 and 1.25 peak ground acceleration PGA of the scaled mainshocks.
Figure 2 shows illustrative examples of artificial seismic sequences for three intensity levels of the aftershock.

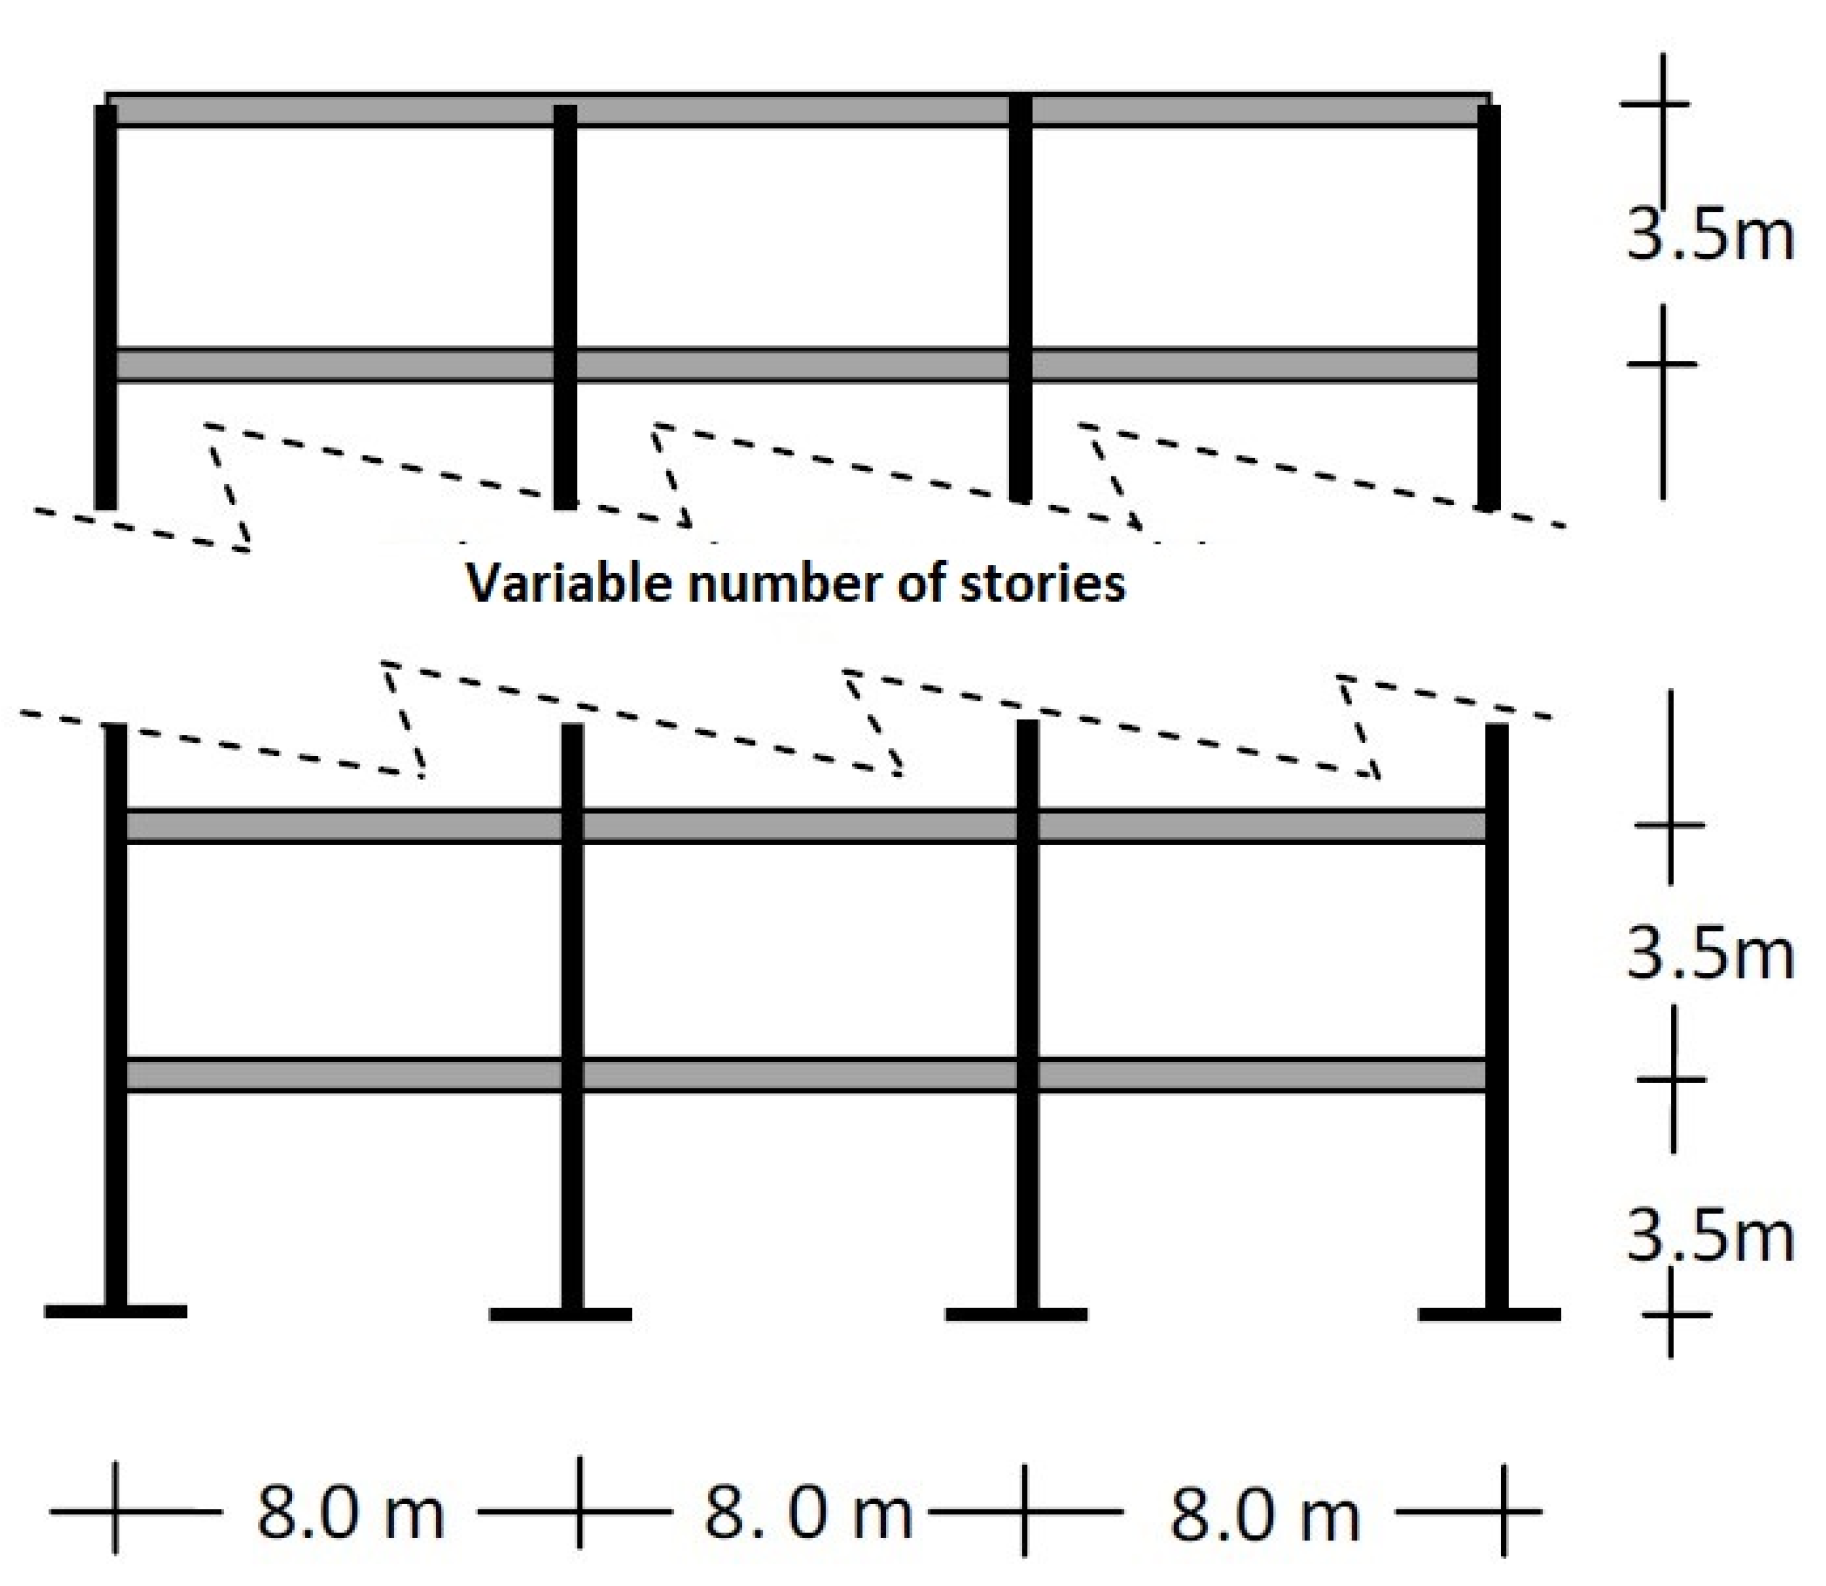
2.2. Structural Models

To achieve the stated objectives of the study, four different steel frames were designed and analyzed. They are identified in two groups: frames with welded connections (MRSFs) and frames with post-tensioned connections (PTDE). The first group of structures was designed for office occupancy under Mexico City Building Code [47]. The buildings are 4, 6, 8 and 10 stories with heights of 3.5 m, and 3 bays of 8 m, named F4, F6, F8 and F10, respectively. Figure 3 shows an illustrative example of a standard frame. Beams and column sections correspond to ASTM A36 structural steel W profiles. In order to consider the inelastic behavior of the material, a hysteretic bilinear model with 3% post-yielding stiffness was selected for beams and columns. In addition, for the seismic analyses, 3% of the critical damping was used. The 4-, 6-, 8- and 10-story frames have a fundamental period of vibration of 0.90, 1.07, 1.20 and 1.37 s, respectively.
The PTDEs design was based on the methodology established by Garlock [48], which begins designing the steel frame with rigid connections, then the semi-rigid connection is designed under service loads action. The post-tensioned beam-column connection type is composed by two angles screwed to the beam (located at the top and bottom) and column flanges. In all the frames, the angles are composed by 50 grade steel and have a length equal to the beam flange width, 152 mm of length on each side and a 13 mm of thickness. Post-tensioned cables consist of seven wires with a 150 mm2 of area and support a 279 kN load. These are anchored at the outer ends of the frames parallelly to beams axis, drilling the interior columns. According to Garlock [48], the initial tension in the cables must be less than 0.33 of their maximum capacity. Figure 4 presents an example of the assembly of a post-tensioned steel frame, where it can be seen the different elements that composes it: angles (energy dissipating elements), reinforcement plates, post-tensioned cables, beams and columns. Steel frames with post-tensioned connections are identified as F4PT, F6PT, F8PT and F10PT, and their fundamental vibration period are 0.89, 1.03, 1.25 and 1.37 s, respectively. The ground floor columns are fixed to the base without post-tensioning. The beam and column sections of all models are shown in Table 2 and Table 3. It is relevant to comment that the MRSF and PTDE sections are the same in order to observe the benefits of using post-tensioned connections. Notice that the FE-based software named RUAUMOKO was used for the nonlinear dynamic analyses. The hysteretic behavior model (flag-shaped Bi-linear, model IHYST 50 in Ruaumoko) was selected for modeling the PT connections, the same critical damping of 3% as in the case of MRSF was used. The new chapter describe the hysteretic behavior of the PT connection.

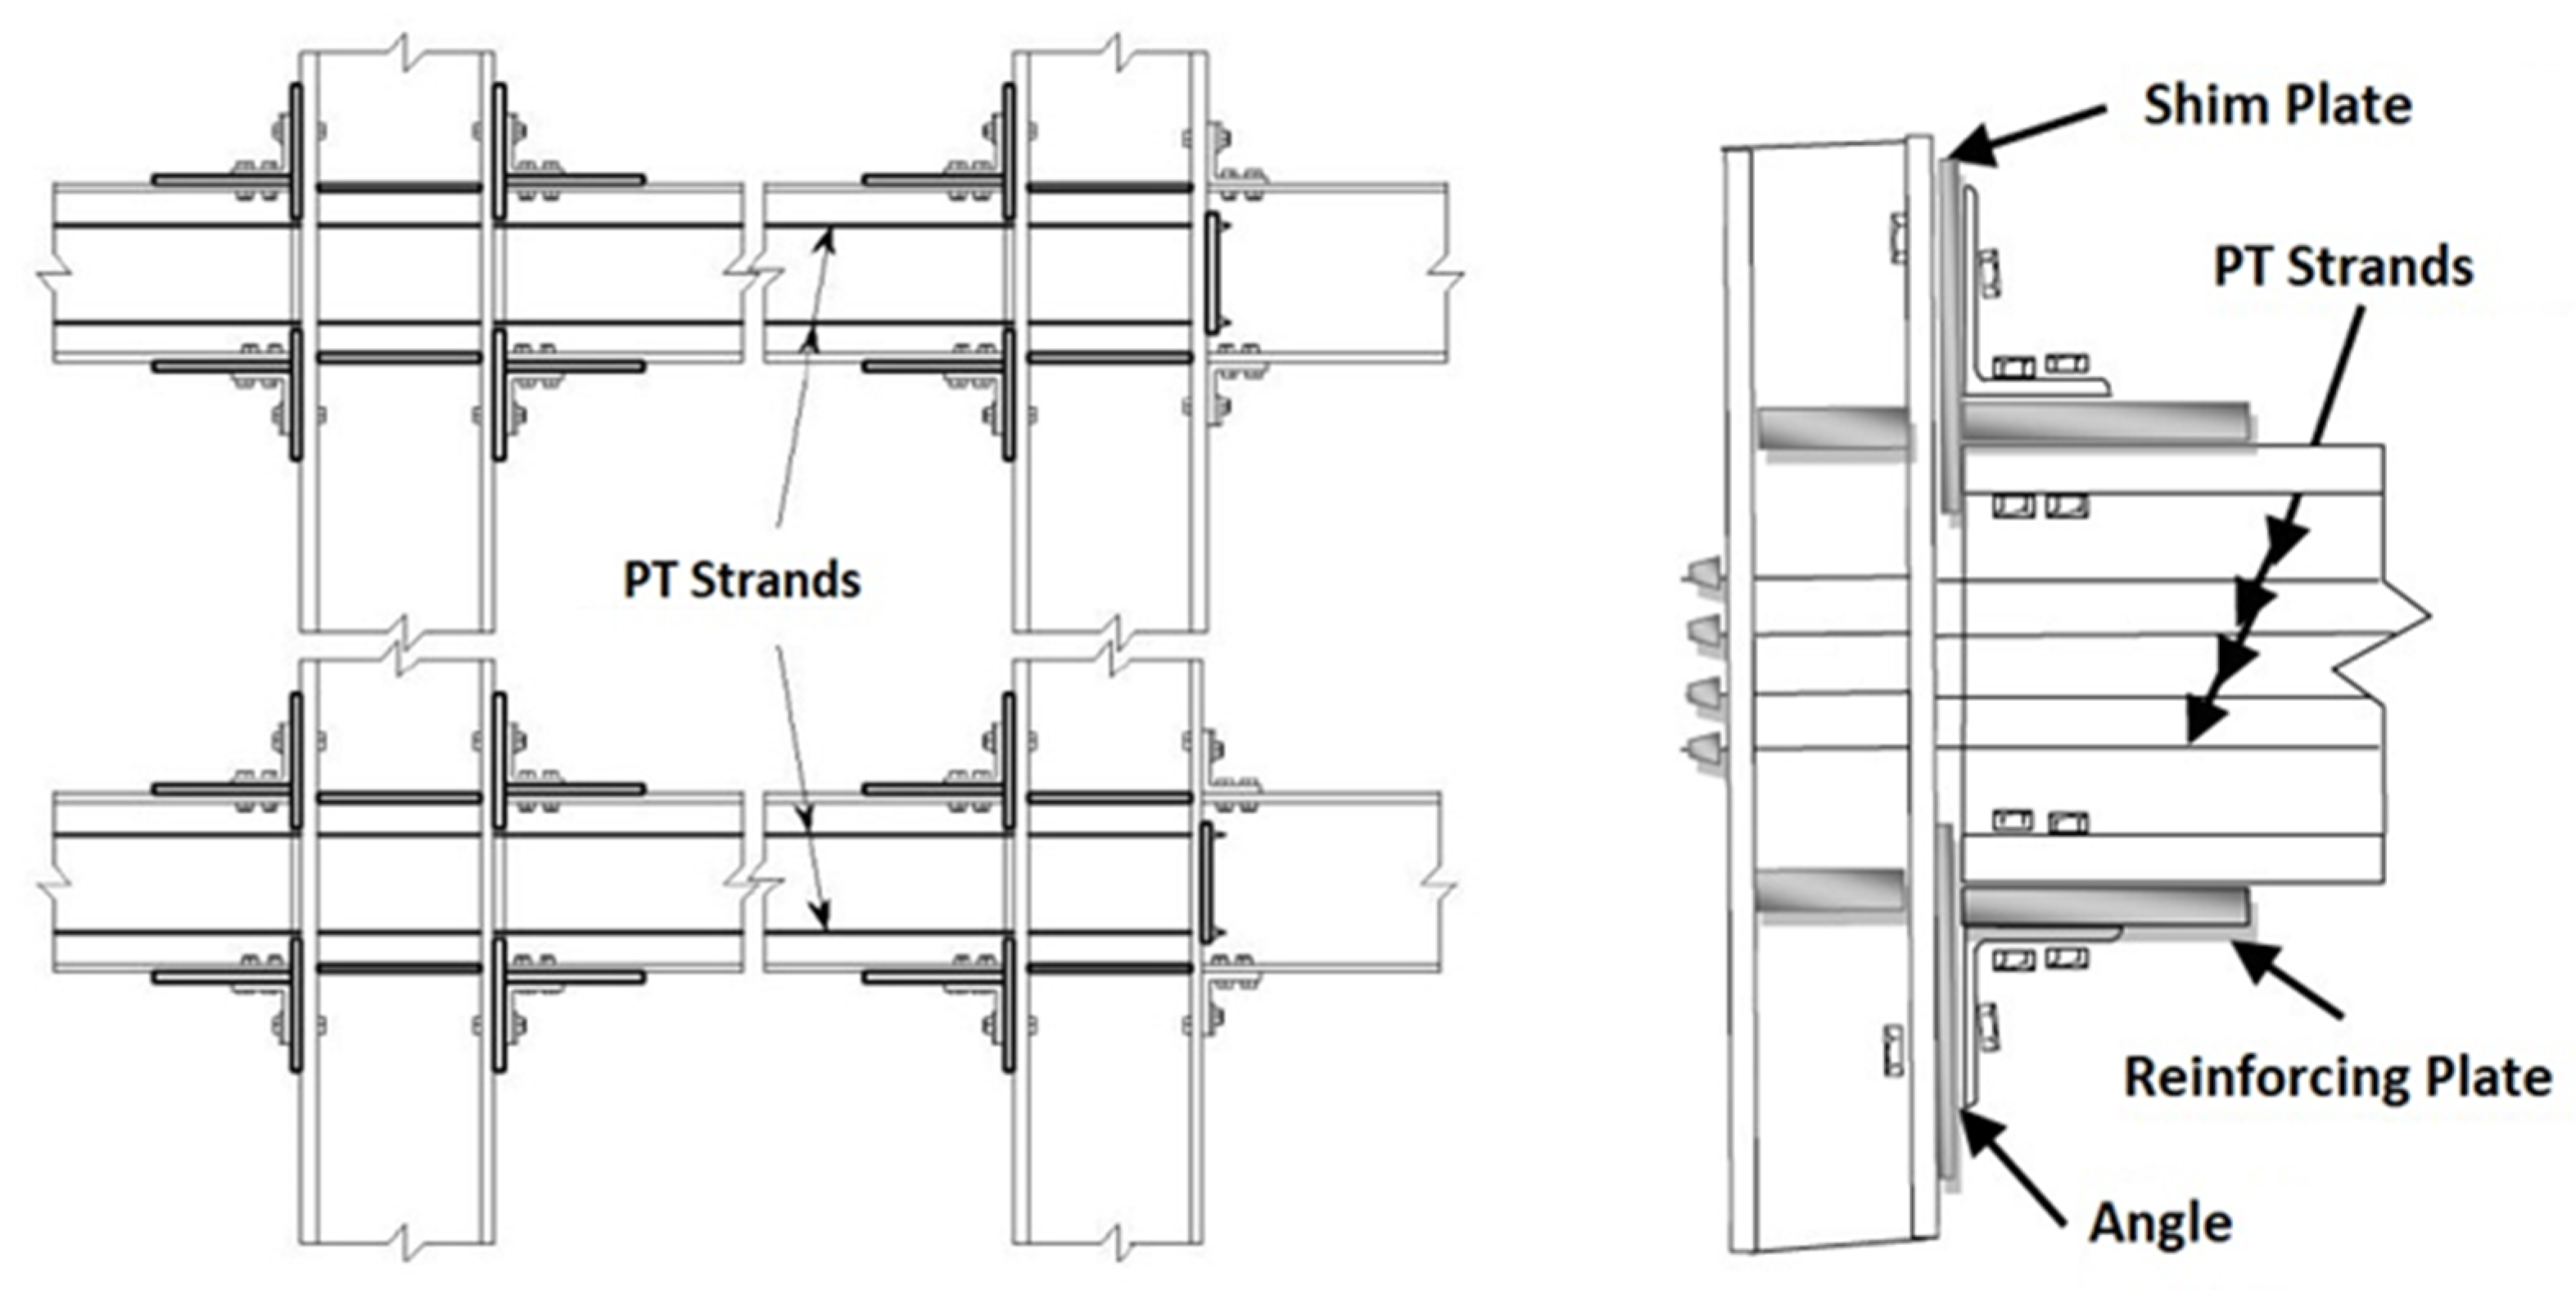
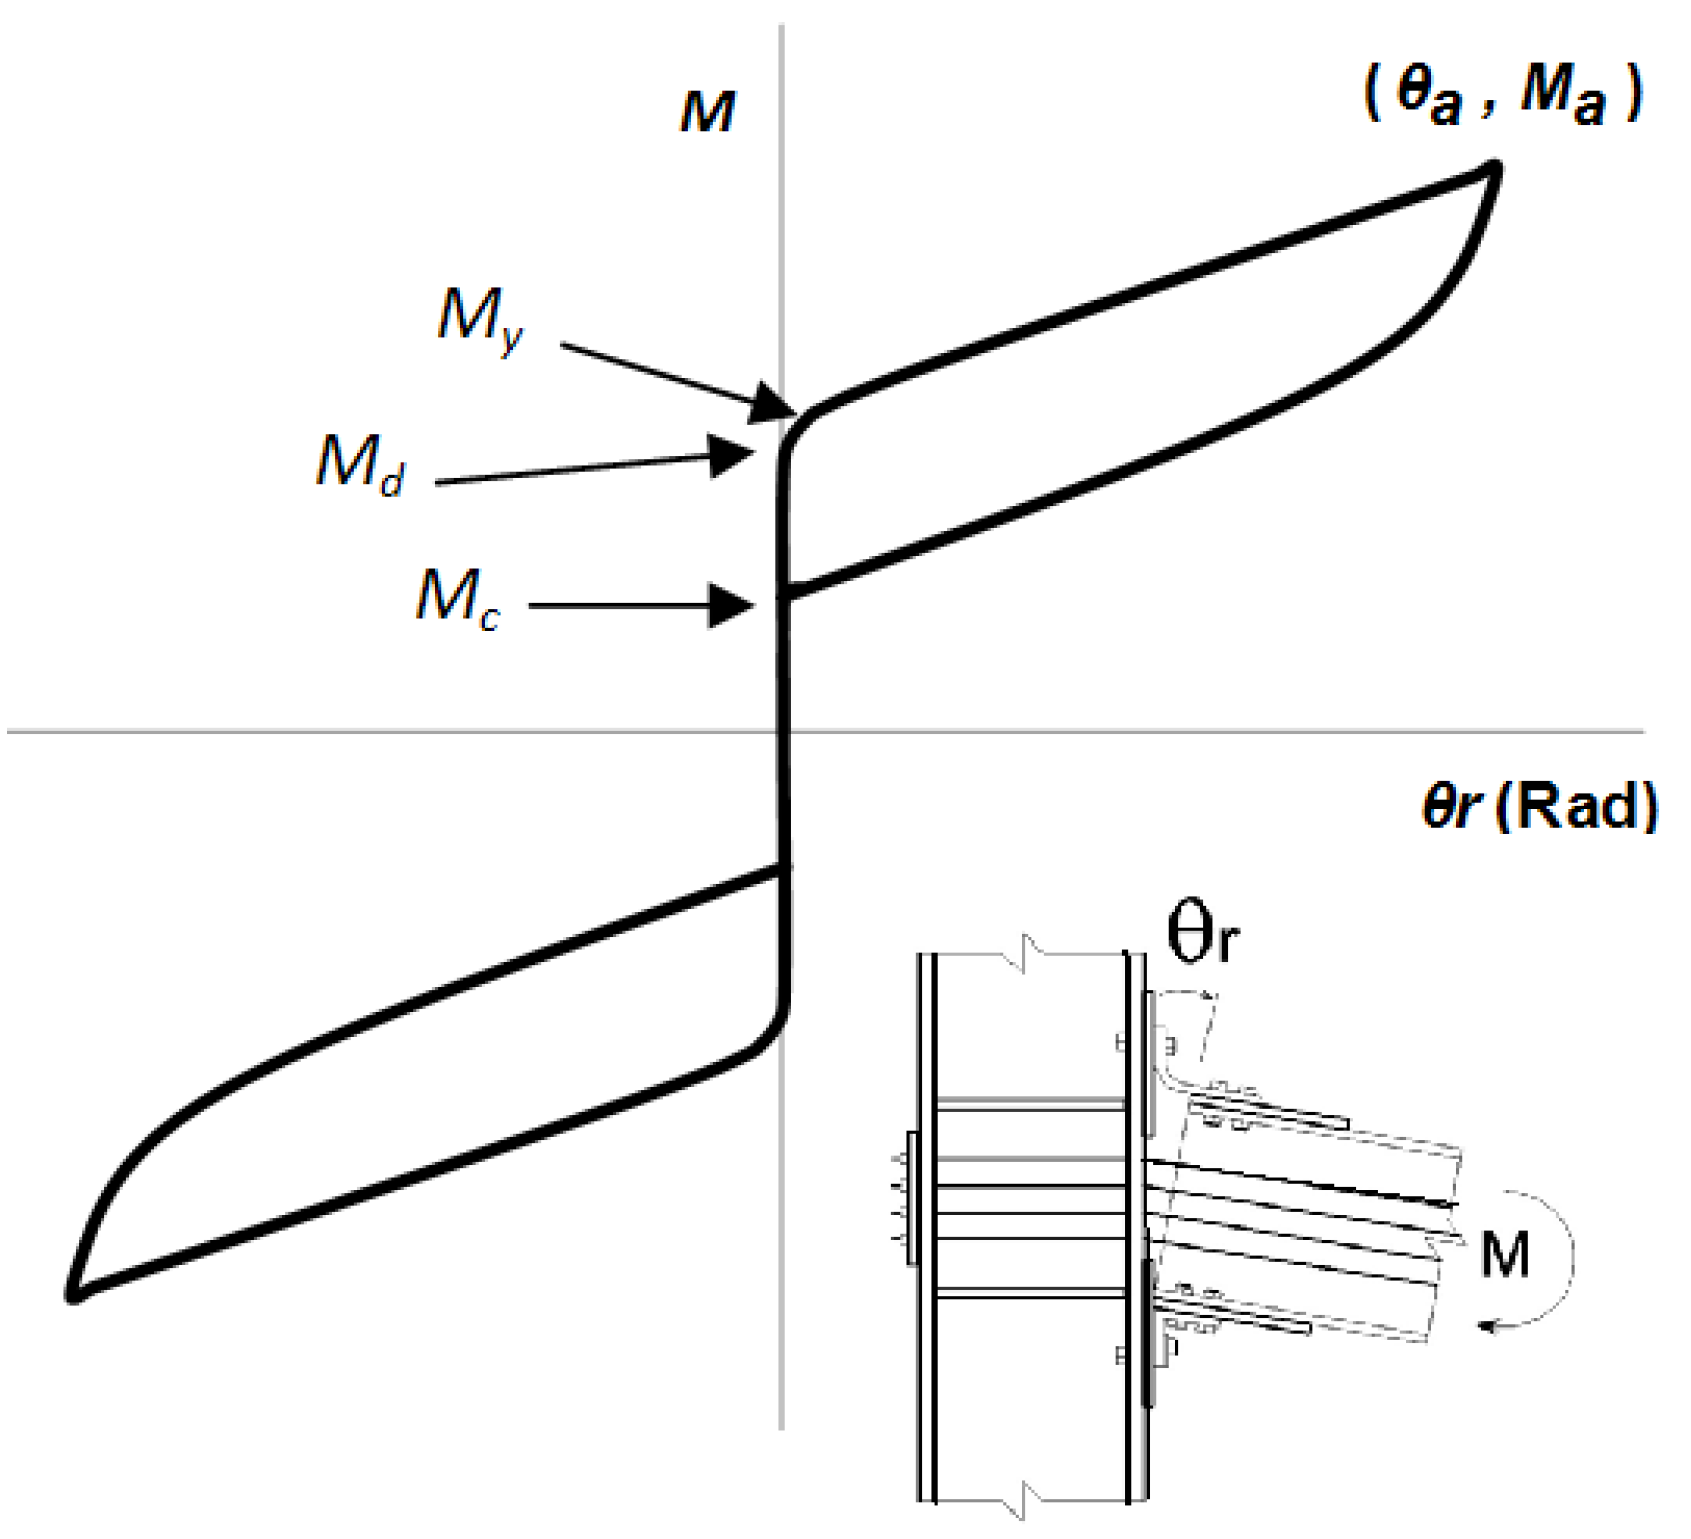
2.3. Nonlinear Behavior of the PT Connection Model

The cyclic behavior of the post-tensioned frames are characterized by moment-rotation curves (M-θr), which usually present shapes similar to a flag, as was stated before. Experimental tests with isolated angles, subjected to cyclic and monotonic loads conducted by Shen and Astaneh-Asl [49], showed a stable cyclic response and good capability of hysteretic energy dissipation. In general, the ultimate strength exceeds 3 times the yield strength and ductility reaches values between 8 and 10. The strength and stiffness in bending of the post-tensioned connections is provided by the contribution of the angles of the PTC and by post-tensioned strands. Wires and angles work as springs in parallel. Post-tensioned strands exhibit linear behavior, while connecting angles behave non-linearly. Figure 5 shows a typical example of a hysteretic curve corresponding to a post-tensioned connection. The mathematical equation of the hysteretic curves has been obtained from the superposition of the exponential equation proposed by Richard [50] for semi-rigid connections and the linear contribution of the strands, as well as decompression moments (Md) and the closing moment (Mc) of the connection. Notice that My corresponds to the yielding moment. In the case of the unloading curve, Ma and ϴa are the maximum values reached in each cycle. As it was indicated before, more information about this hysteretic behavior can be find in RUAUMOKO.

2.4. Dynamic Analyses

In order to estimate the seismic performance of the selected steel structures under mainshock–aftershock seismic sequences, in this study the incremental dynamic analysis approach is used. For this aim, the selected structural models (including MRSFs and PTDE) with 4, 6, 8 and 10 stories are subjected to the artificial seismic sequences described in Section 2.1. As it was previously discussed, all the ground motion records are scaled at different seismic intensity levels as a function of Sa(T1) (for the case of mainshock), while the aftershocks are scaled for different fractions of the mainshock; thus, 0.25, 0.5, 0.75, 1.0 and 1.25 times of peak ground acceleration of the scaled mainshock were considered for the aftershocks. The comparison of the seismic performance is computed for the maximum, residual inter-story drift and hysteretic energy demands. Twenty-eight combinations of seismic sequences were created by the randomized approach, resulting from 4 mainshock and 7 aftershock records. Notice that after scaling each seismic sequence, a total of 2800 different artificial seismic sequences are obtained. The inelastic dynamic time history analysis was performed through the RUAUMOKO computer program [51]. As illustrative example Figure 6 shows two IDA plots corresponding to maximum inter-story drift demands of the F10PT frame subjected to the 28 seismic sequences and aftershock scales of: (a) 0.25 and (b) 1.0 times the peak acceleration of the mainshock. It is important to mention that in Figure 6a, only four IDA curves based on dots are observed, since the influence of the aftershock is insignificant, indicating that the maximum demands were caused by the mainshock. In the case of Figure 6b, more dot IDAs are observed, demonstrating the participation of the aftershock in the estimation of the maximum inter-story drift demands.

3. Numerical Results

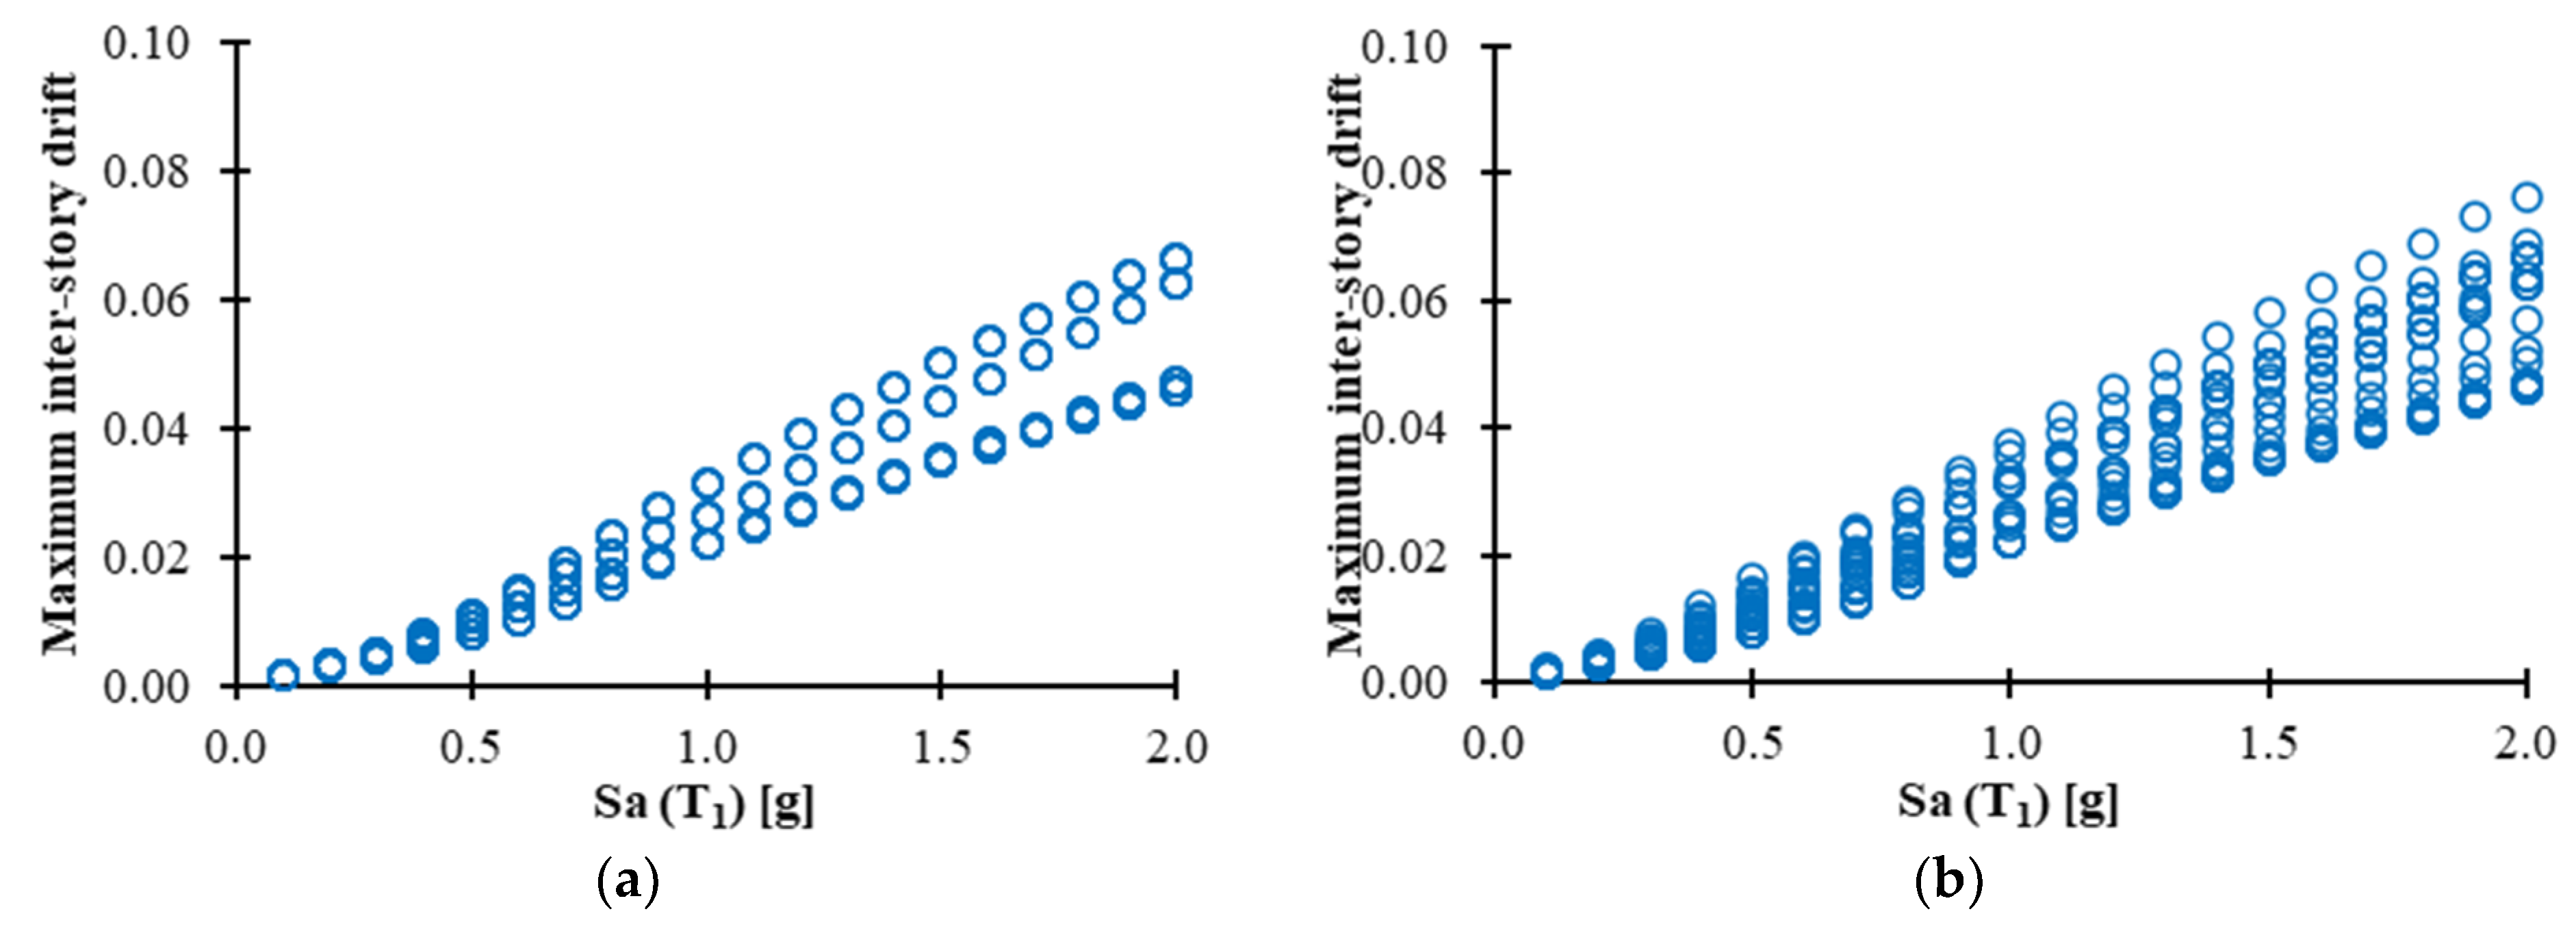
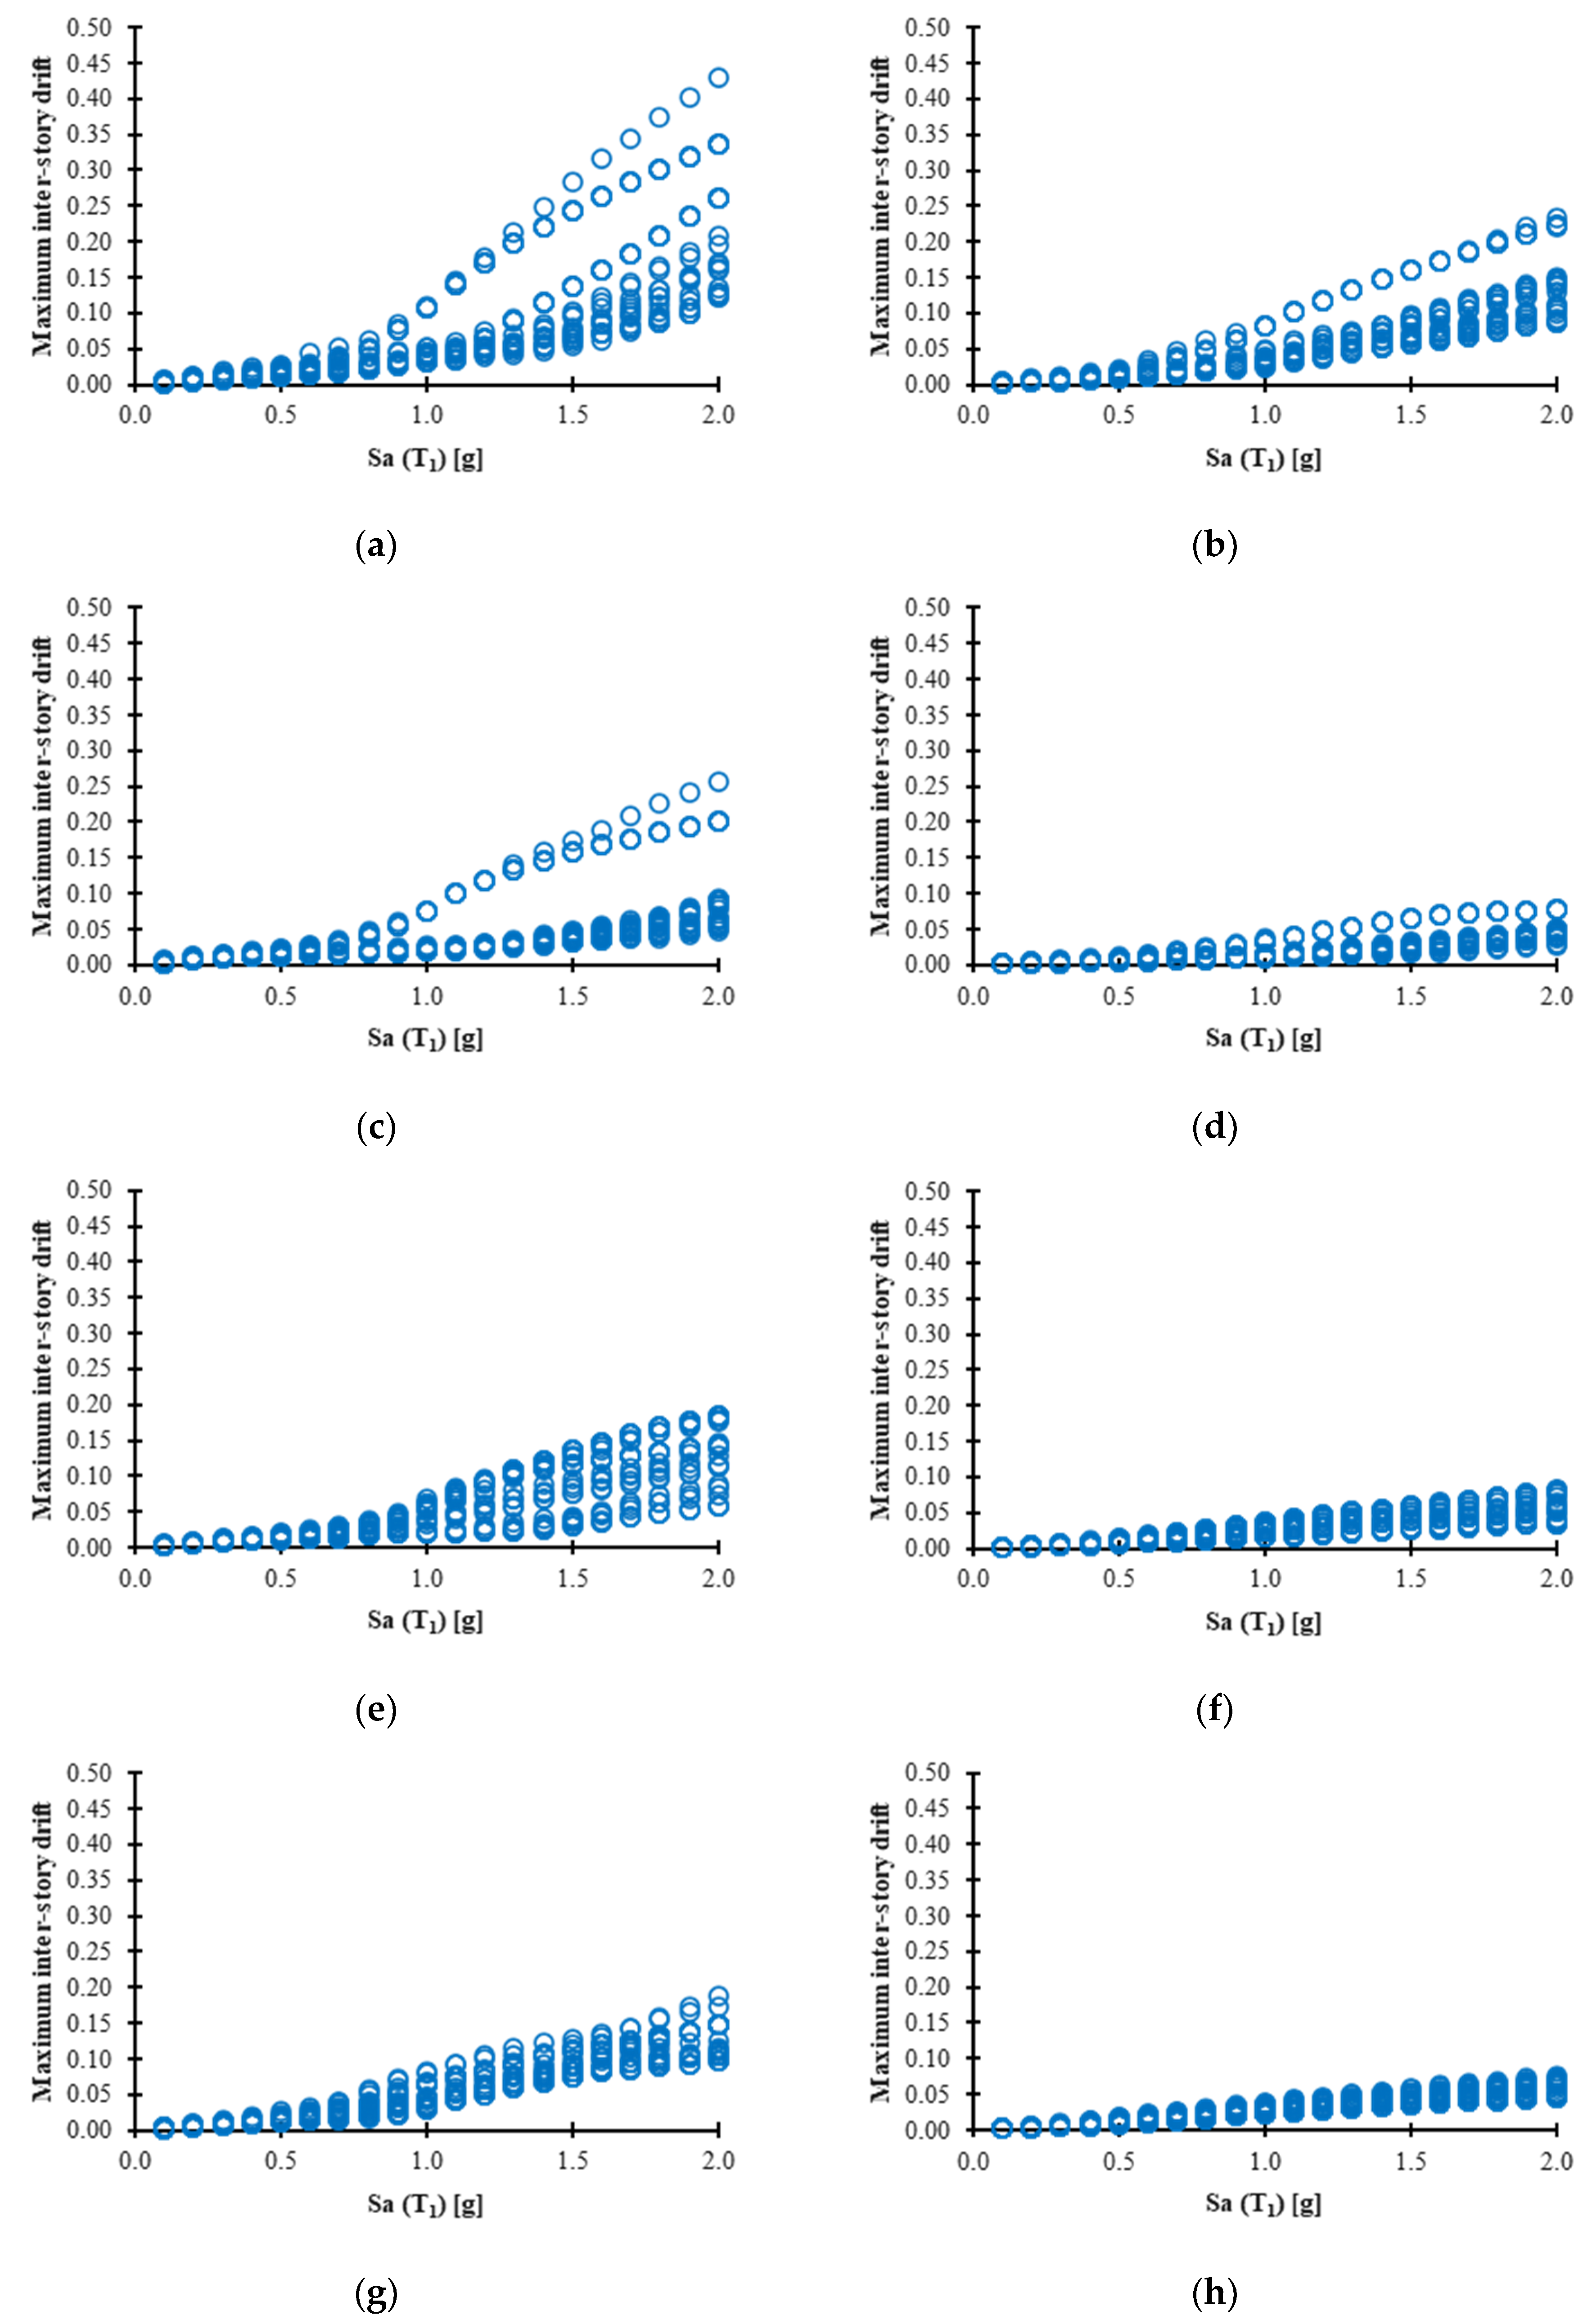
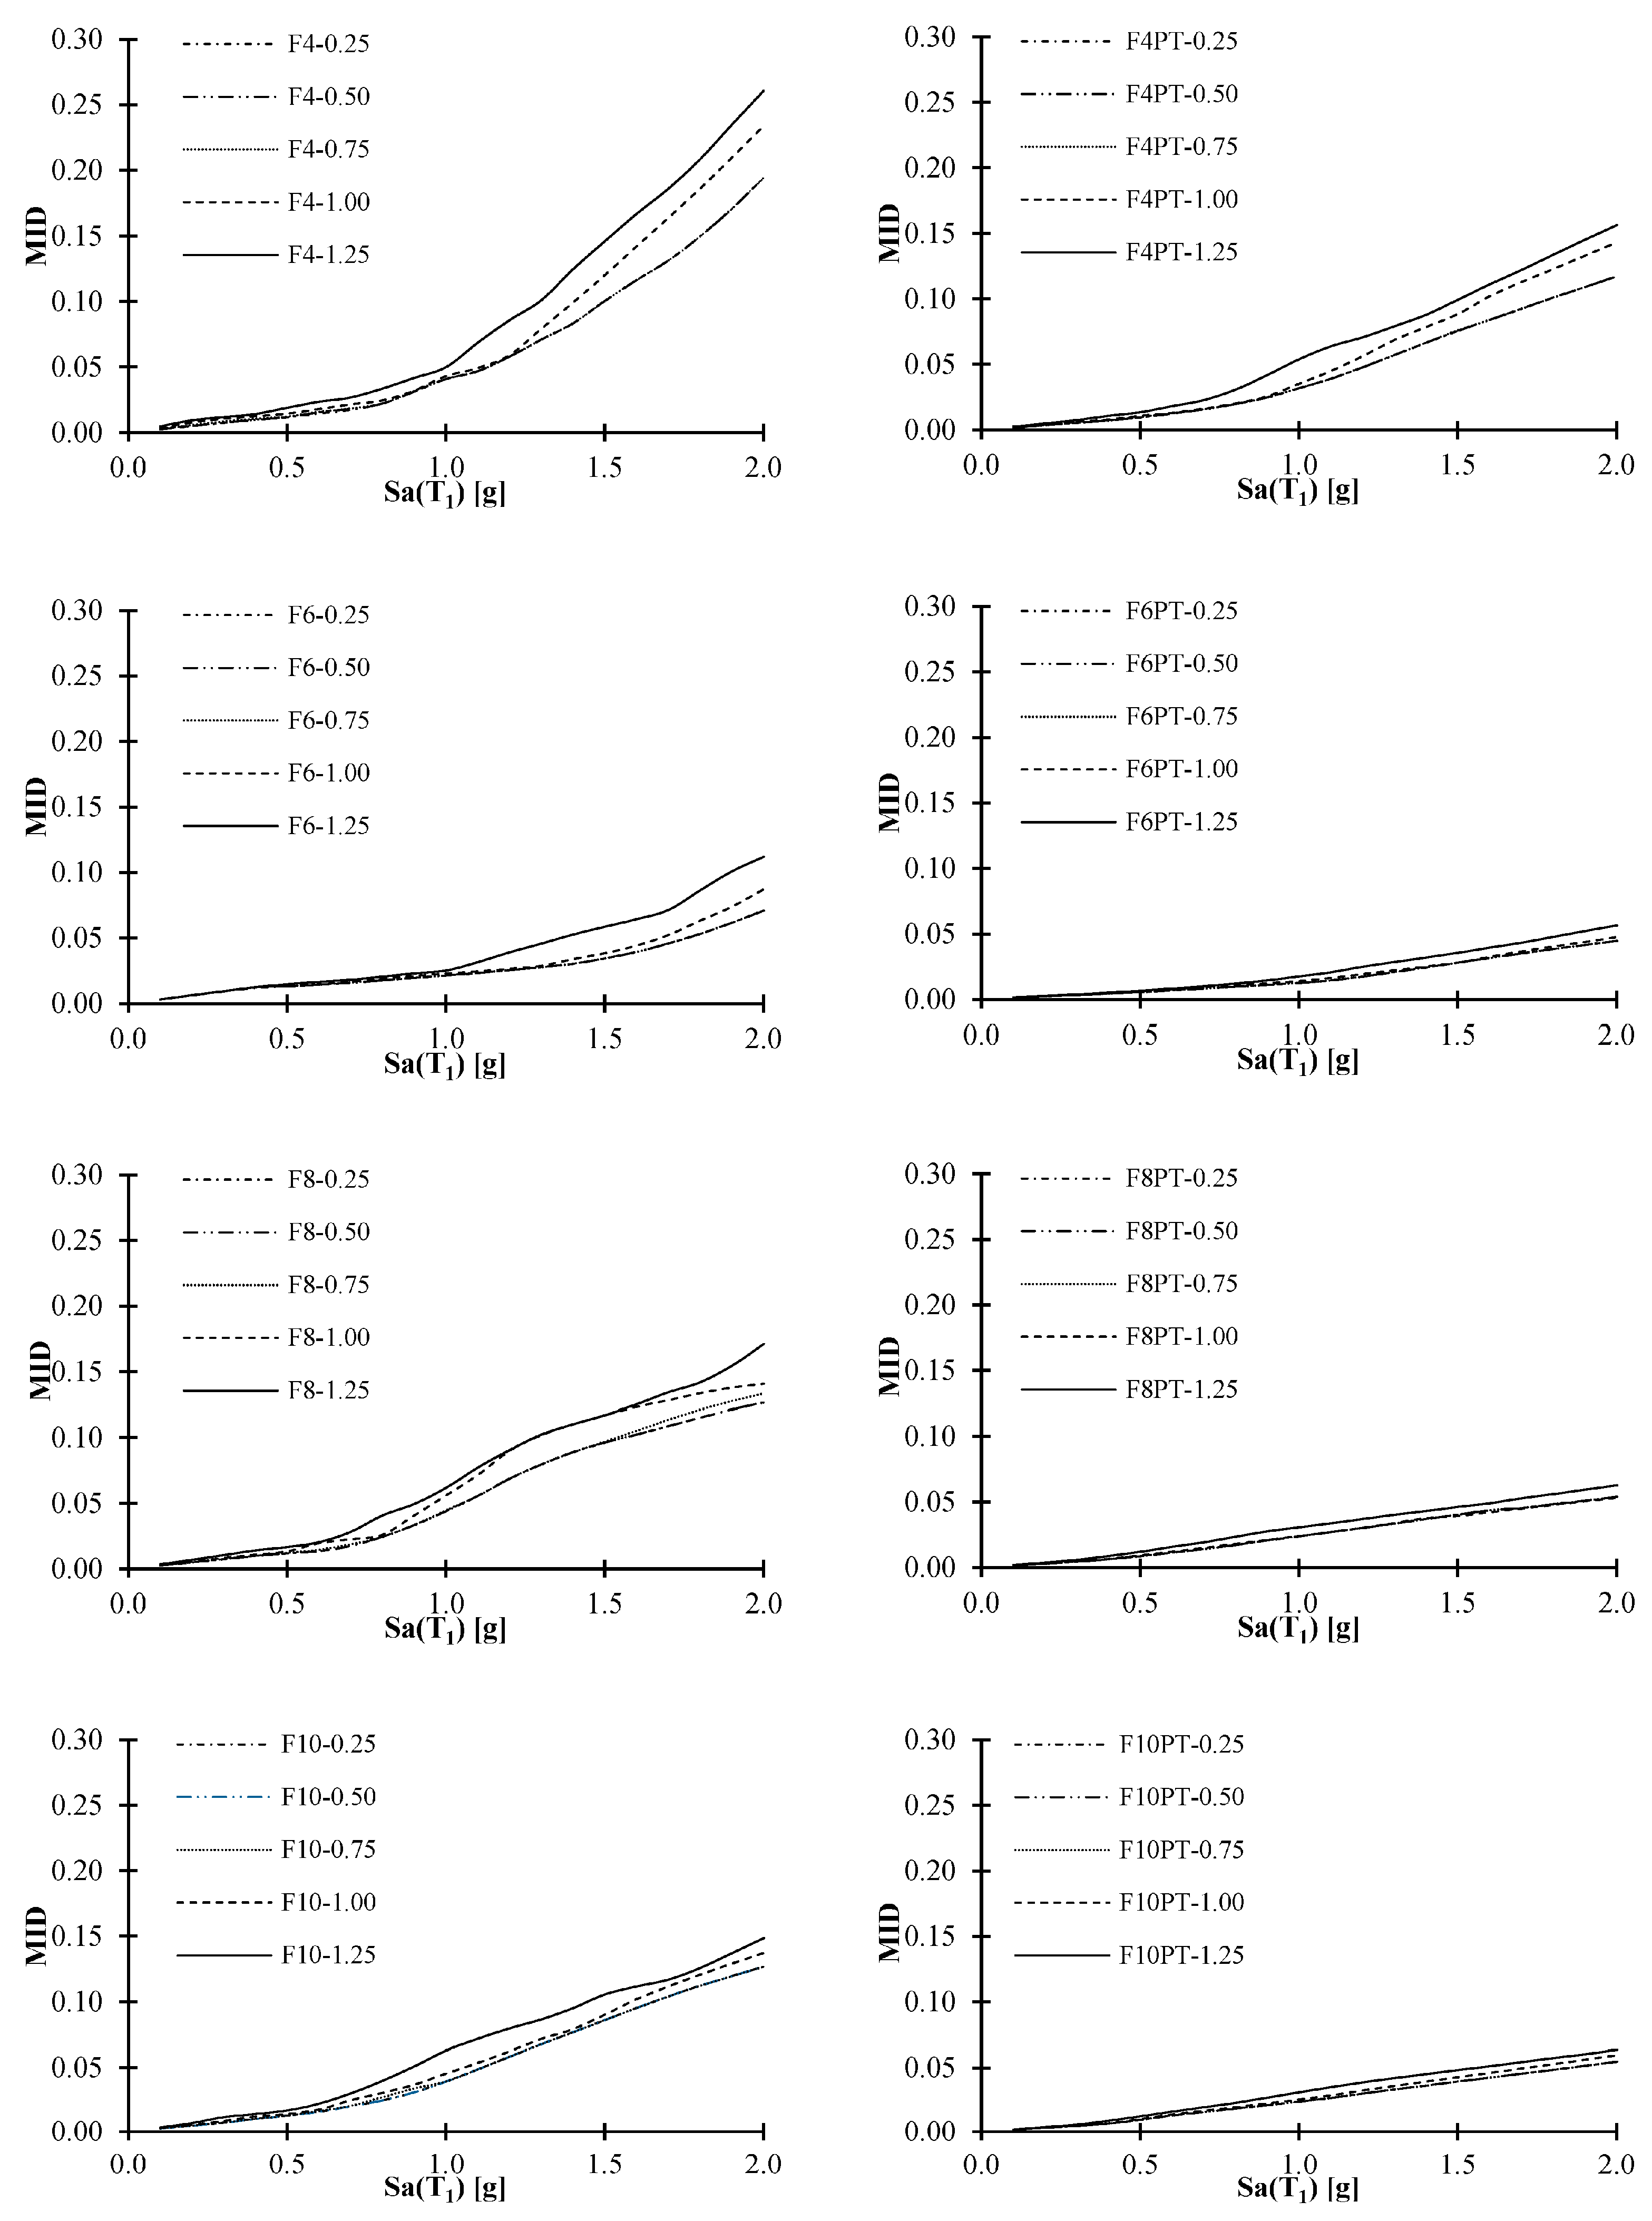
3.1. Results for Maximum Inter-Story Drifts

The numerical results of the incremental dynamic analyses are presented in this section considering the maximum inter-story drift as the engineering demand parameter. Figure 7 compares the IDAs of all the structural models subjected to the 28 seismic sequences when the PGA of the aftershock (PGAaf) is equal to the PGA of the mainshock (PGAms). Notice that in the left side of Figure 7 the results for the structural models with welded connections are presented for MRSFs, while the right side shows the IDA curves for the PTDE (all the figures have the same scale). In first place, it is observed that as the number of stories increases, the structural response based on peak drift demands tend to decrease; on the other hand, for all the models, the maximum inter-story drifts are smaller for the frames with post-tensioned connections in comparison with the MRSFs. This conclusion is also valid for different intensities of the aftershocks, as can be observed in Figure 8, where the median values of the maximum inter-story drift are presented for both structural models under consideration. Figure 8 suggests that the effect of the aftershock is important if the PGAaf is equal or larger than 0.75 times the PGAms. Moreover, it is concluded that when PT connections are used in the steel frames, the seismic performance of the structures is considerably improved.
To better understand and assess the benefits of using post-tensioned connections in steel buildings, the ratio of maximum inter-story drift (RMID), defined as the MID of the PTDE divided by the MID of the MRSFs, is presented in Figure 9 for three level of intensities of the aftershocks (PGAaf equal to 0.75, 1.0 and 1.25 times the PGAms). As it is observed, in all cases the RMID value is less than one, indicating that the MIDs of the PTDE system are less than the MRSF results for most of the study cases. In fact, the reduction of the maximum inter-story drift of the steel buildings with PT connections is about 40 and 80% in comparison with the response of the structures with welded connections, as can be observed in Figure 9. Likewise, the aftershock scales have a very low effect on RMID; in particular, for the steel structures with larger numbers of stories. In general, steel frames with post-tensioned connections show about 30% in average reduction of maximum inter-story drift in comparison with MRSFs. Furthermore, the effect of the intensity of the aftershocks in the case of the maximum inter-story drift of the PTDE is almost insignificant.

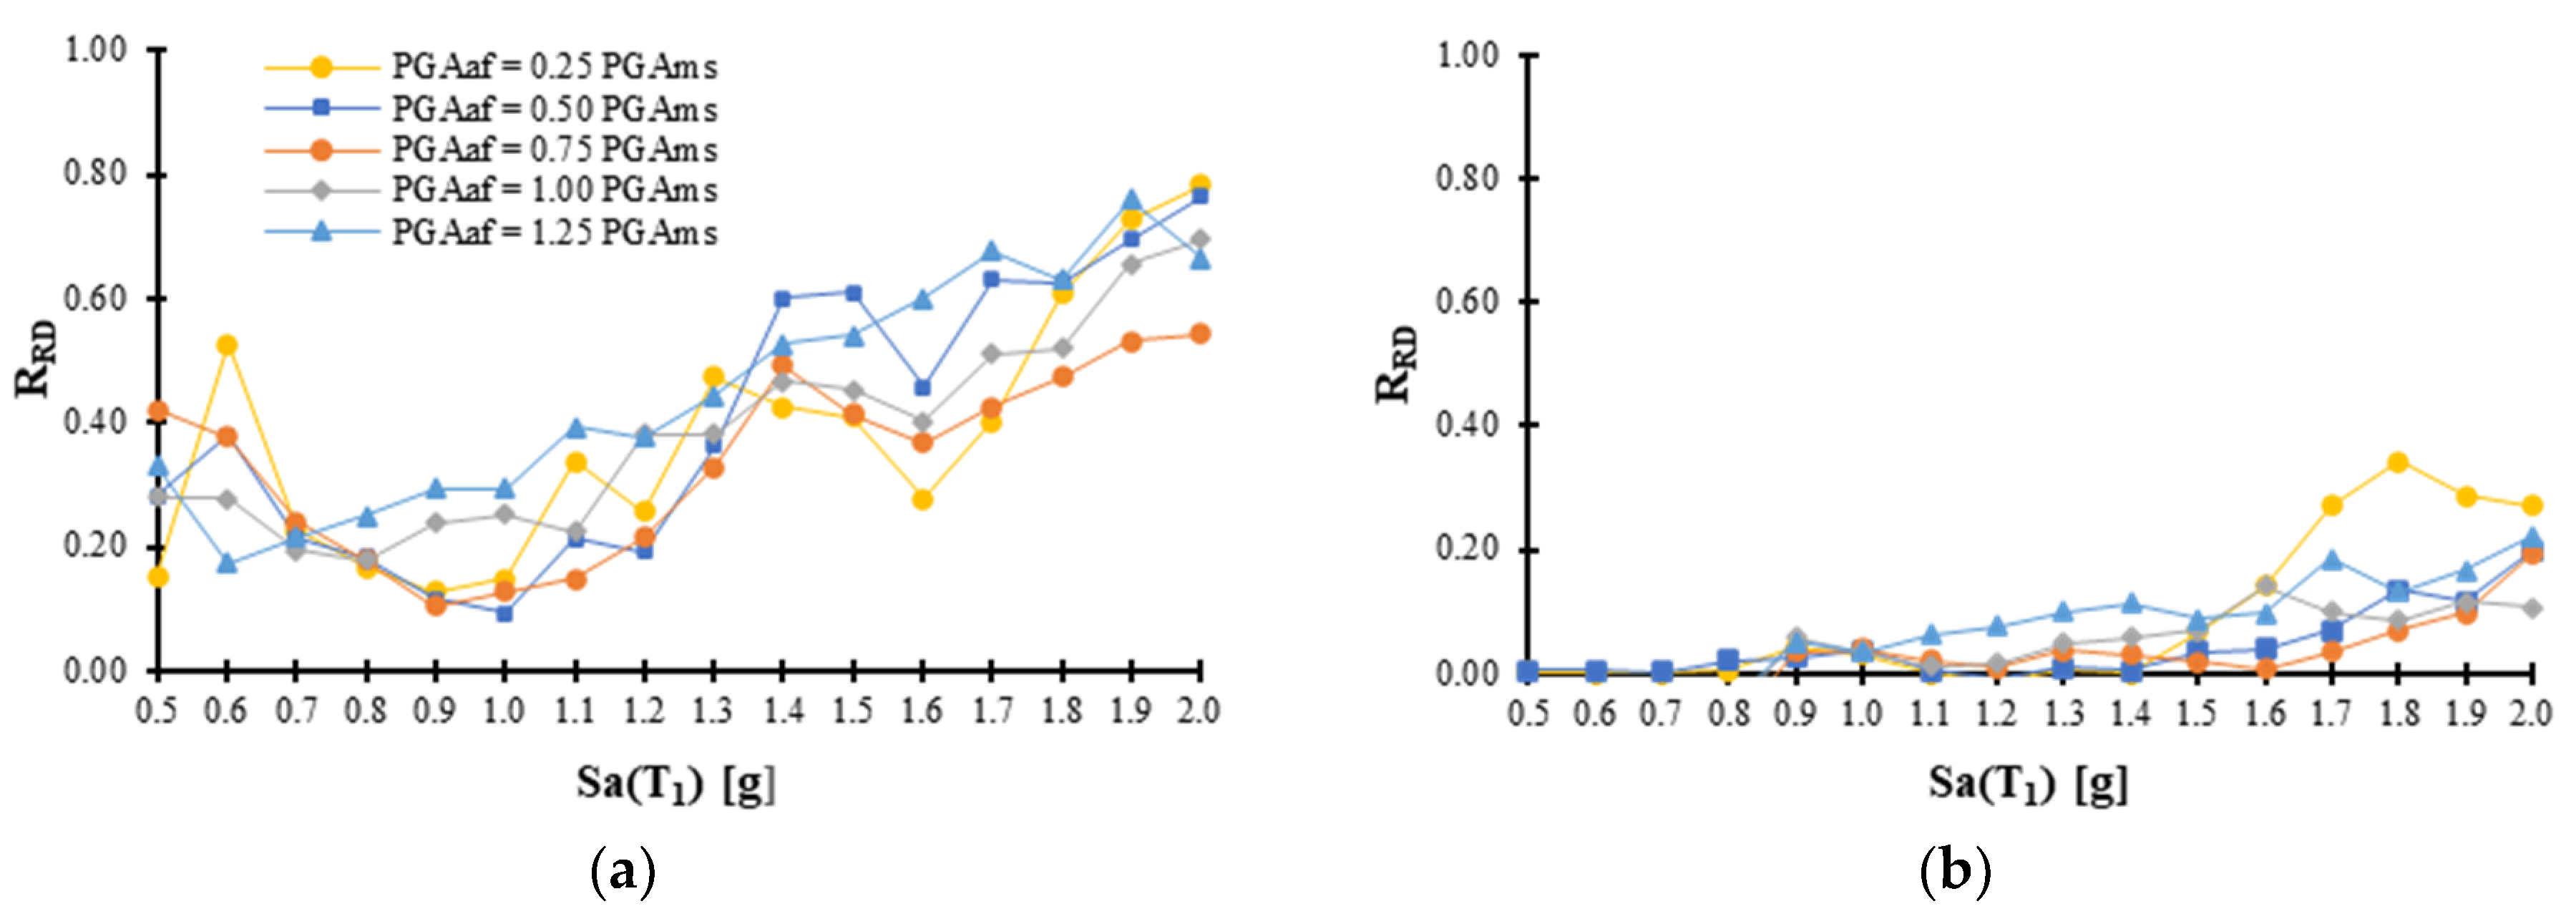
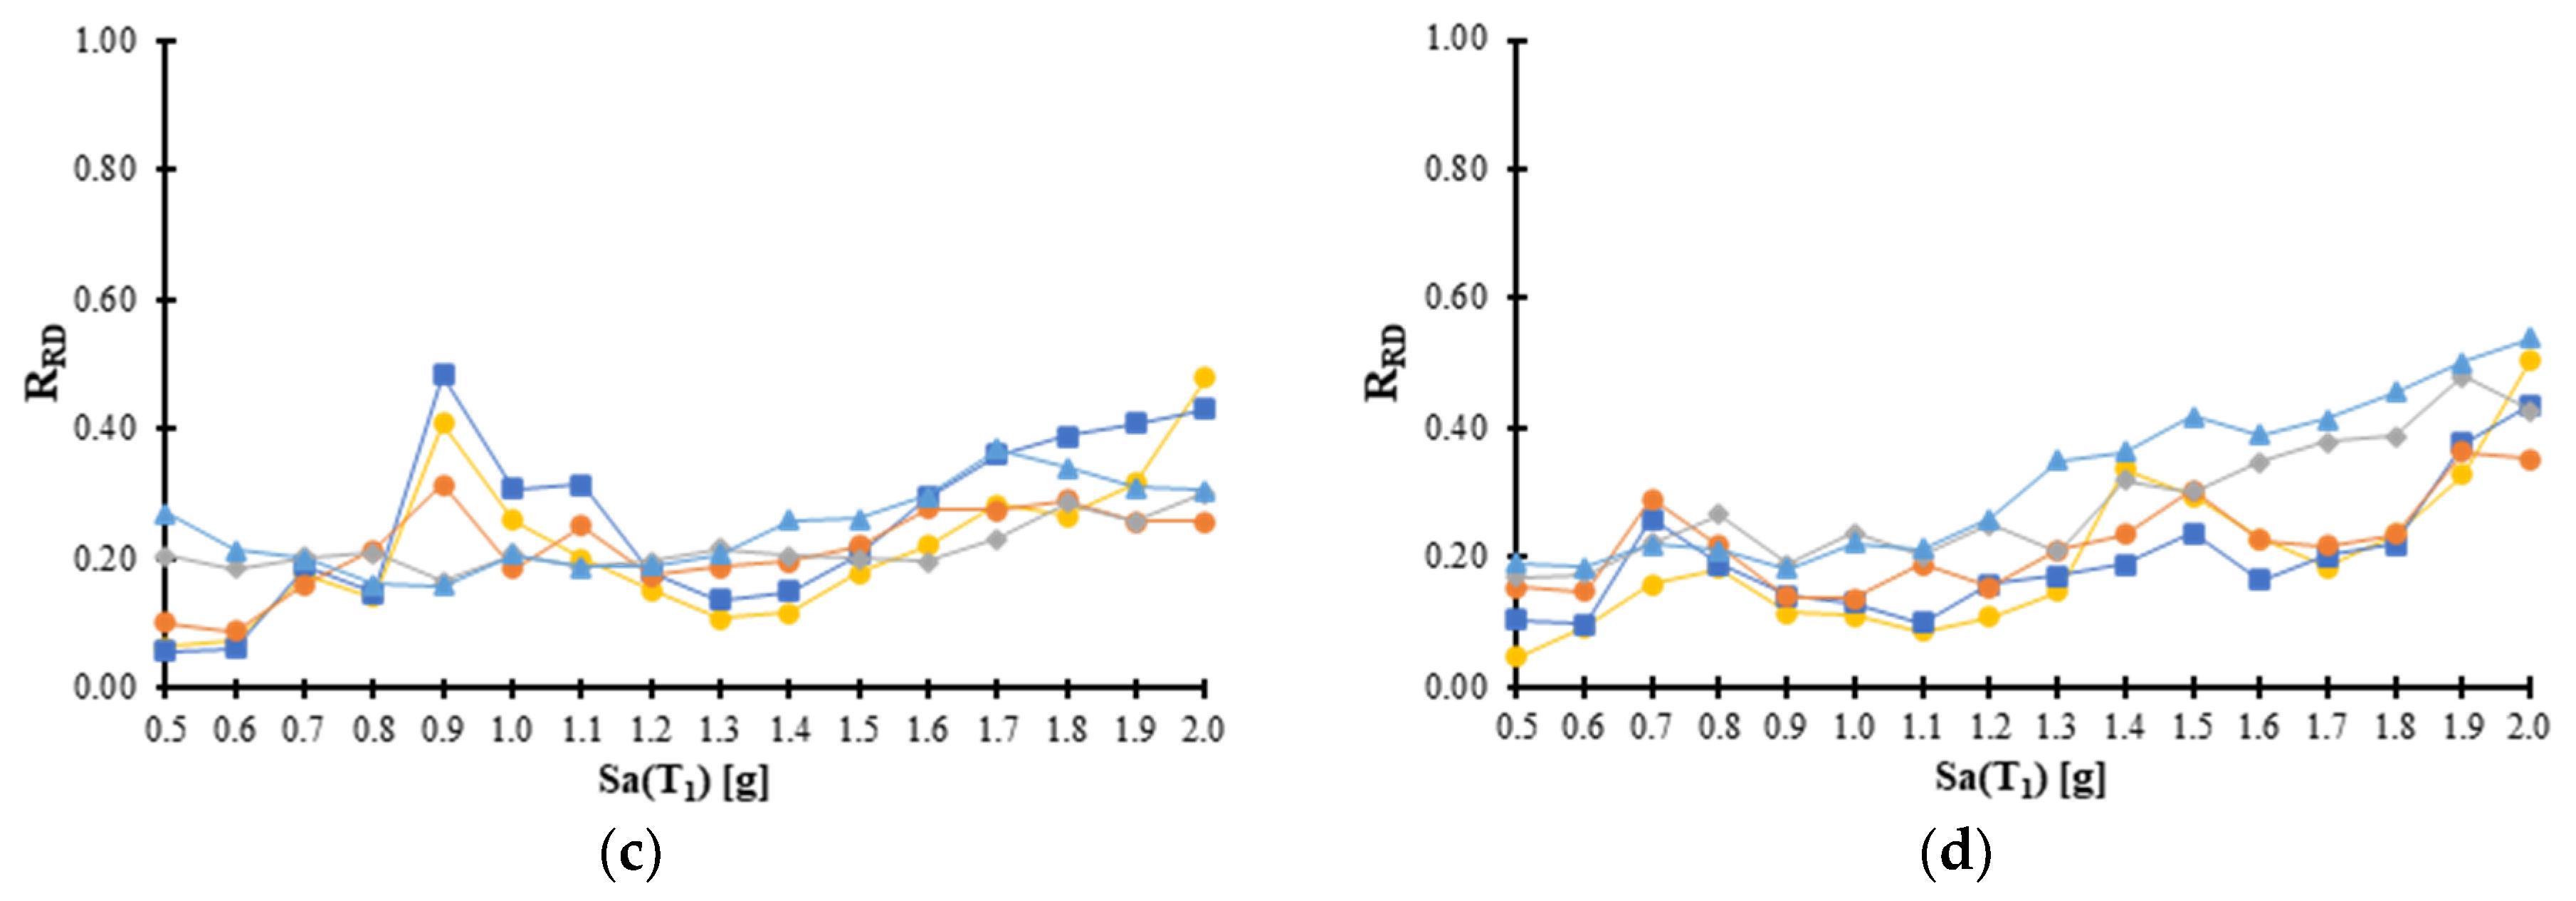
3.2. Results for Maximum Residual Inter-Story Drift (MRID)

In this section, the results for maximum residual inter-story drifts of the structural models subjected to the 28 seismic sequences scaled at different intensities of the mainshock and the aftershocks are presented. Notice that McCormick et al. (2008) [52] concluded that a residual inter-story drift greater than 0.5% represents significant discomfort for building occupants and Hyogoken-Nanbu demonstrates that residual inter-story drifts greater than 0.5% are not economically profitable. This is very important because if an engineering demand parameter is defined for new seismic design codification based on peak residual demands, the target value should be about 0.5%.
Figure 9 shows the median results of the IDA curves for the MRID for the all the selected MRSFs and PTDEs under the set of the 28 seismic sequences at different intensity levels of the aftershocks. While the left side of the figure corresponds to the results for the MRSFs, the right side is associated with the PTDE maximum residual drift demands. A low dispersion can be observed in the residual demands of all the frames for the different intensity levels of the aftershocks; moreover, as the number of stories increases, the dispersion is considerably reduced. Thus, the most important observation is that the values of the MRID are very similar for all the intensities of the aftershocks and considering both structural models. In other words, the values of the peak residual drifts have some independence of the intensity of the aftershock. In particular, the influence of the aftershocks in the structural steel framed models with posttensioned connections is insignificant. On the other hand, for both structural models with welded and posttensioned connections, as the intensity of the mainshock increases, the response for residual drifts also increase; especially, for the traditional MRSF buildings, the MRIDs are larger in comparison with the PTDE. It is important to say that the seismic performance of the PTDE is superior to the traditional MRSF models. In fact, the MRIDs of the frames with post-tensioned connections are less than 0.5%, demonstrating that this type of structure considerably reduces the displacements; in addition, unlike MRSF, they avoid being demolished after seismic sequences. It is important to mention that McCormick et al. [52] established a MRID limit of 0.5% as the maximum displacement for an economically viable structural repair that guarantees the user’s comfort as it was discussed previously.
To further compare the seismic performance of steel frames with different connection systems (MRSFs and PTDE structures) in the case of MRID, a parameter based in the relation of the MRID of the PTDE divided by the MRID of the MRSFs is used (here named residual inter-story drift ratio RRD). Figure 10 shows the average of RRD vs Sa(T1) for all the frames starting from values of 0.5g of the intensity, since for smaller values the residual drift is almost zero, in other words, the structures behave elastically. Notice that all the RRD values are less than one for all the models and scaling levels, indicating that for all the structural frames the residual inter-story drift is considerably reduced by means of post-tensioned connections. In fact, the results show that for the structural post-tensioned frames models with 4, 6, 8 and 10 stories, the RID is reduced by about 55%, 51%, 76% and 68% under the seismic sequences. These comparisons show that the implementation of post-tensioned connections with energy dissipating devices could significantly reduce the permanent damage in steel structures.
Table 4 shows comparisons for different aftershock intensities of the structural response of the PTDE with respect to the MRSF for Sa(T1) and RID when the frame reaches the maximum capacity for peak inter-story drift (γ = 0.03). Notice that the PTDE models show great advantages over the MRSFs subjected to seismic sequences, since they can reach a greater pseudo-acceleration and a lower residual drift for the same peak inter-story drift. It is important to highlight that no PTDE exceeded the value of 0.5% for the residual inter-story drift.

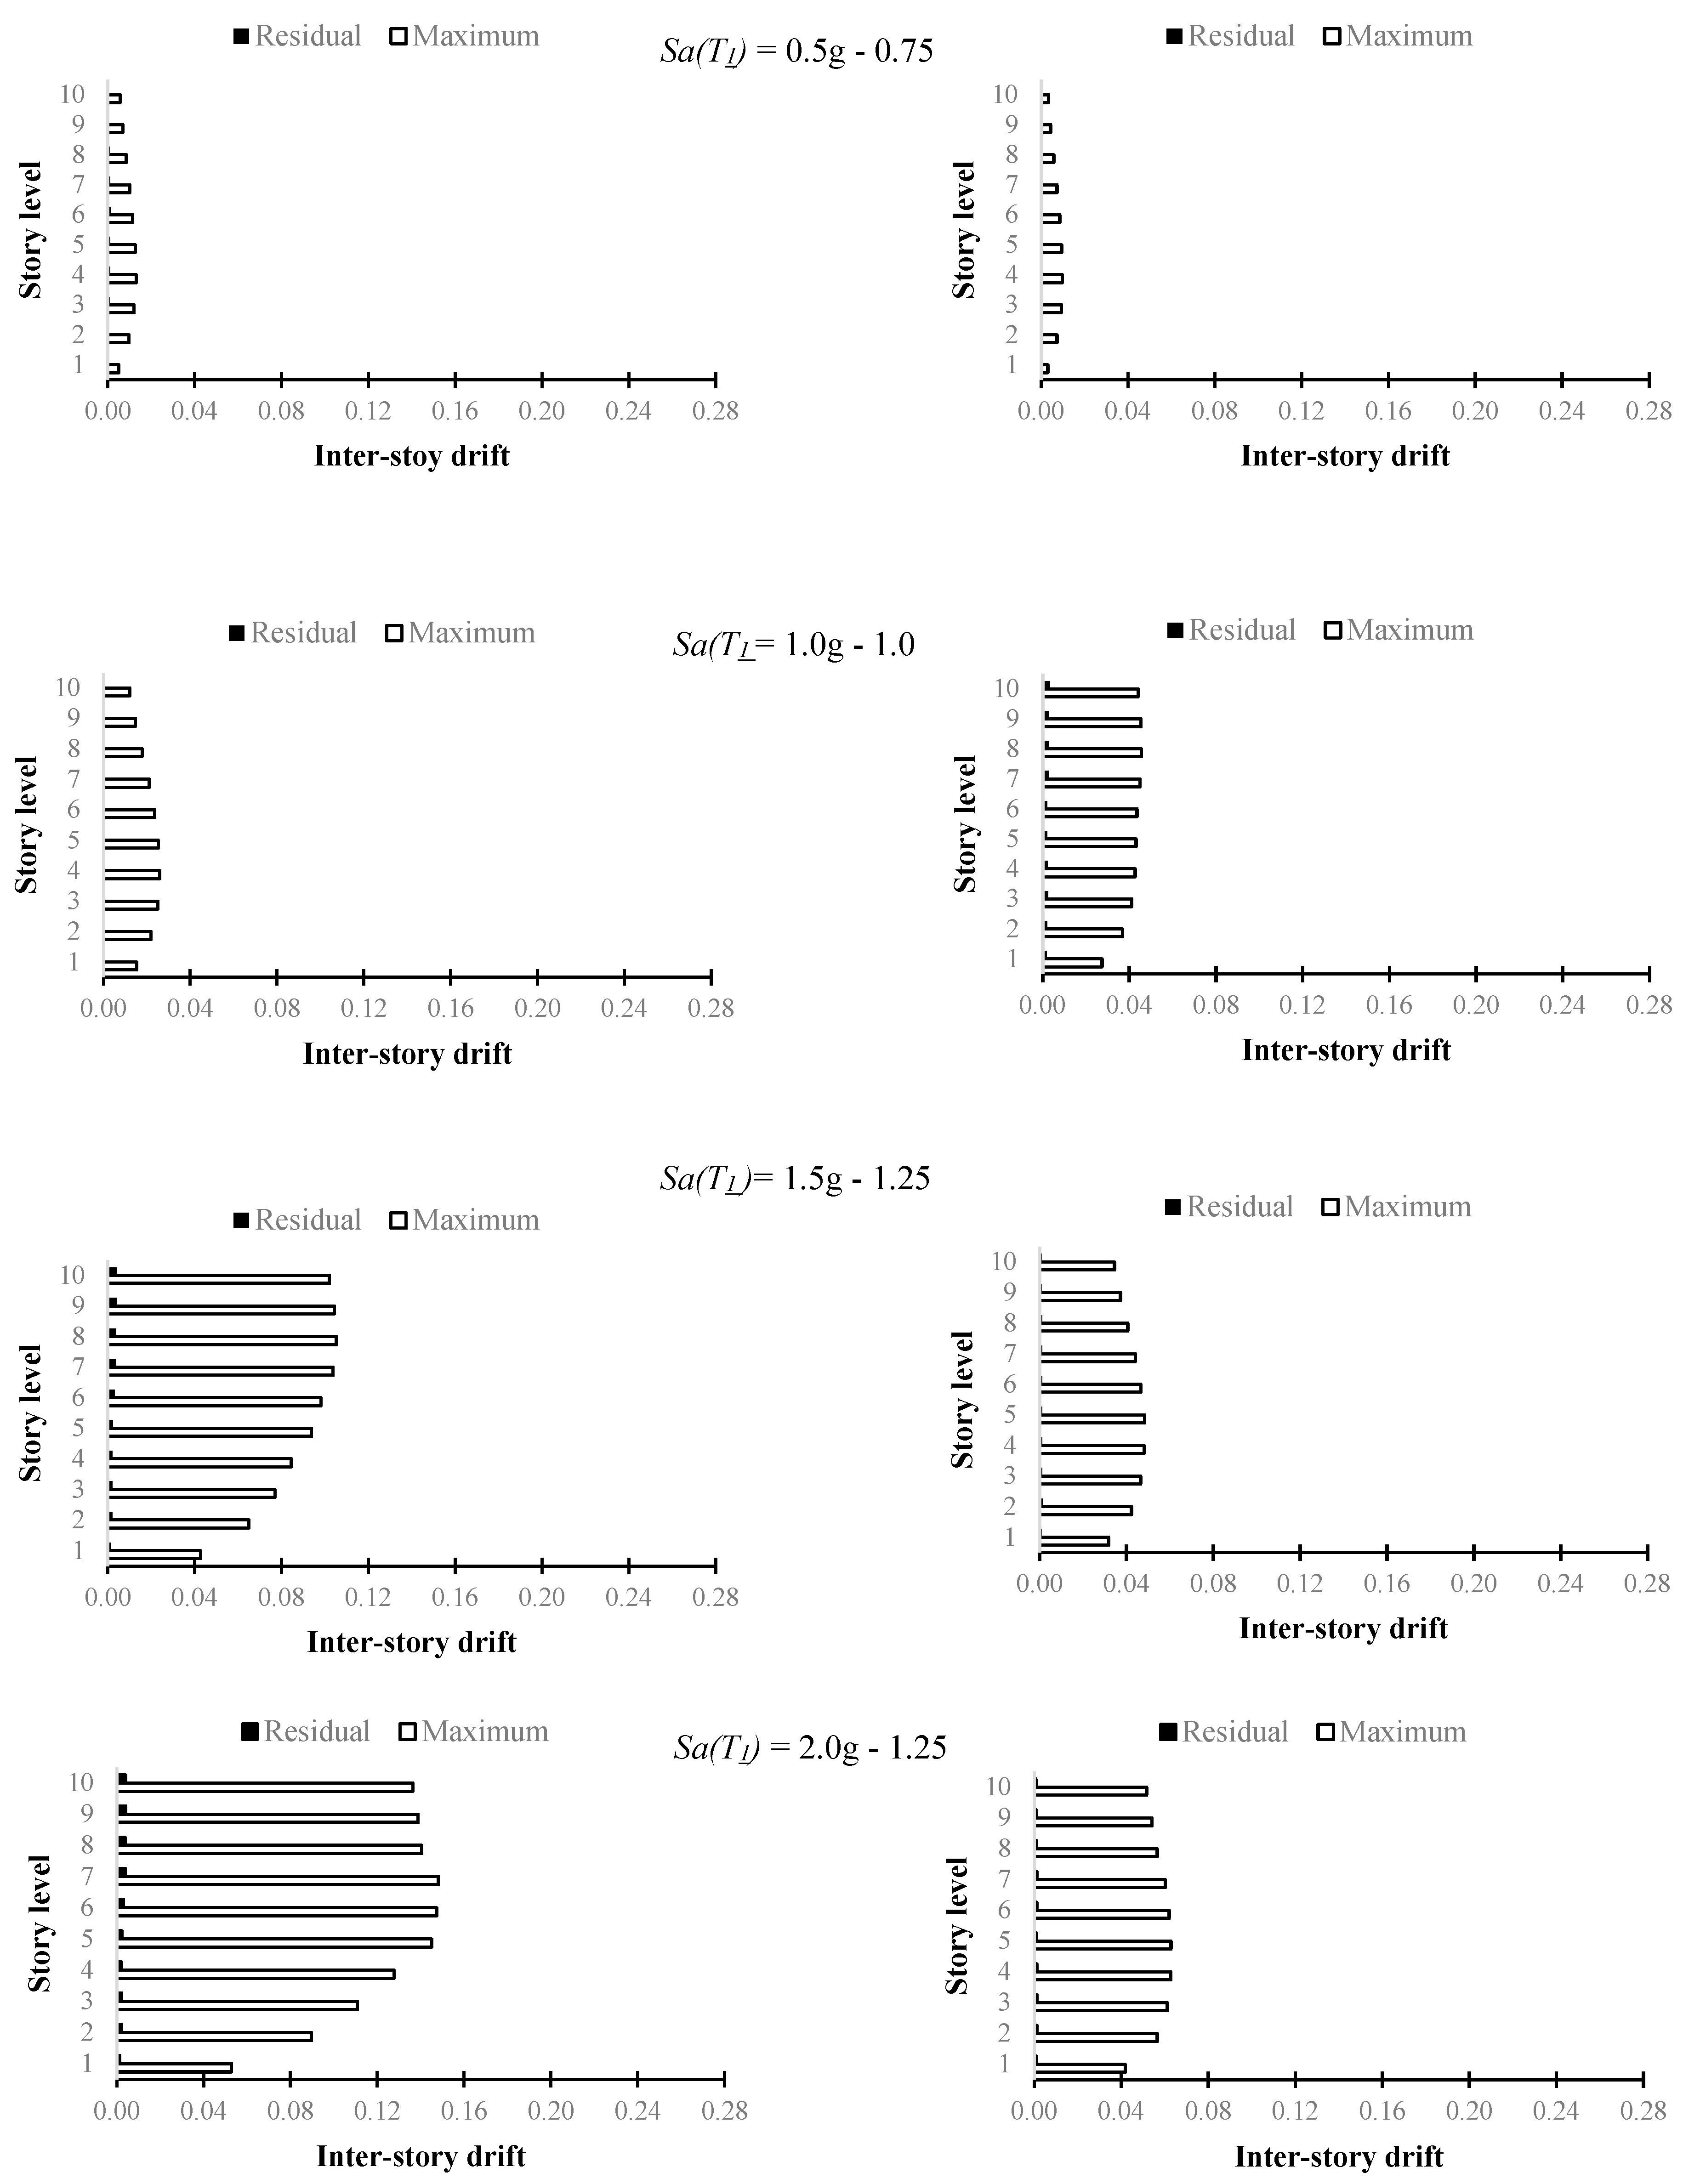
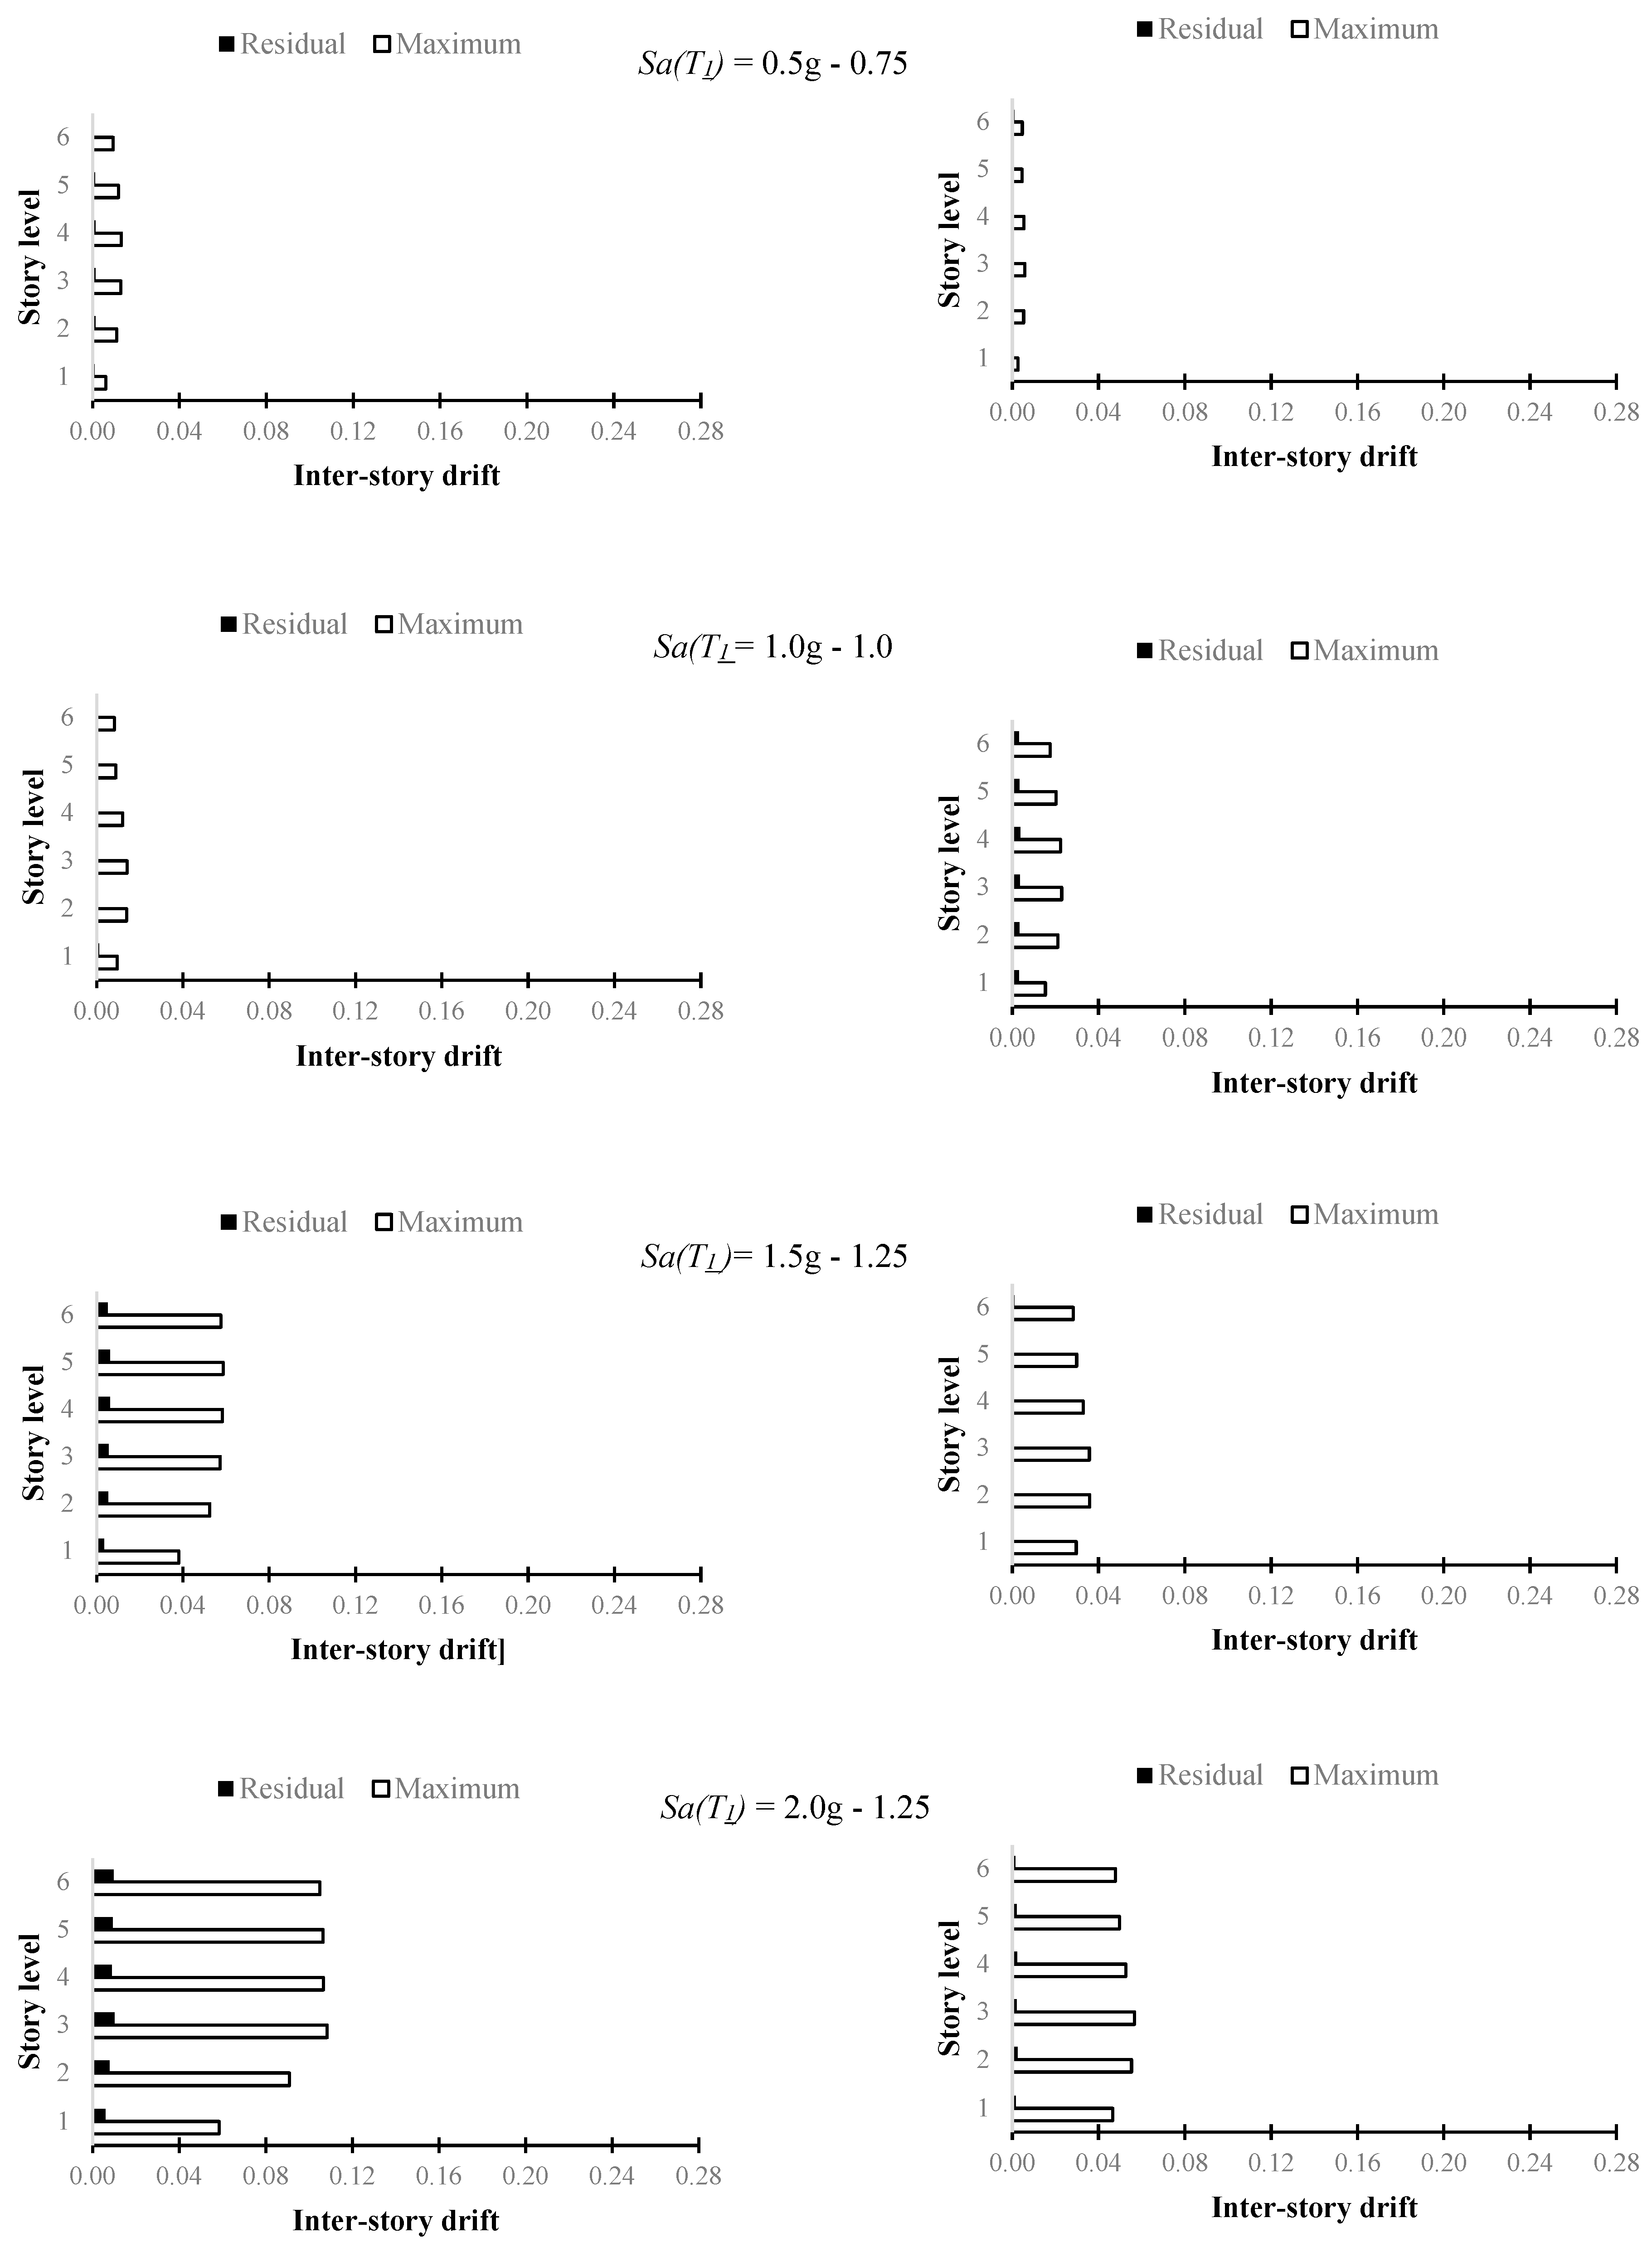
3.3. Peak and Residual Inter-Story Drifts Distribution along the Height

Residual drifts are compared with MID of the PTDE and MRSF models. In order to show the seismic performance difference between these two structural models in the 6- and 10-story steel frames, Figure 11 and Figure 12 compare these results at different story levels. Thus, the distributions of the peak and residual drift along the height are plotted. The median RID and MID values of all models are plotted for mainshock Sa(T1) intensities of 0.5 g, 1.0 g, 1.5 g and 2.0 g, and aftershock scales of 0.75, 1.00 and 1.25 of the MID. It is observed that as the scales of both events increase, the MID and RID increase in the two structural systems studied. For all the cases and scaling values, the RIDs of the frames with post-tensioned connections are less than 0.5%, demonstrating that this type of structure considerably reduces displacements, and, unlike MRSF, avoid being demolished after seismic sequences. It is important to mention that McCormick et al. [52] established a RID limit of 0.5% as the maximum displacement for an economically viable structural repaird that guarantees the user’s comfort.

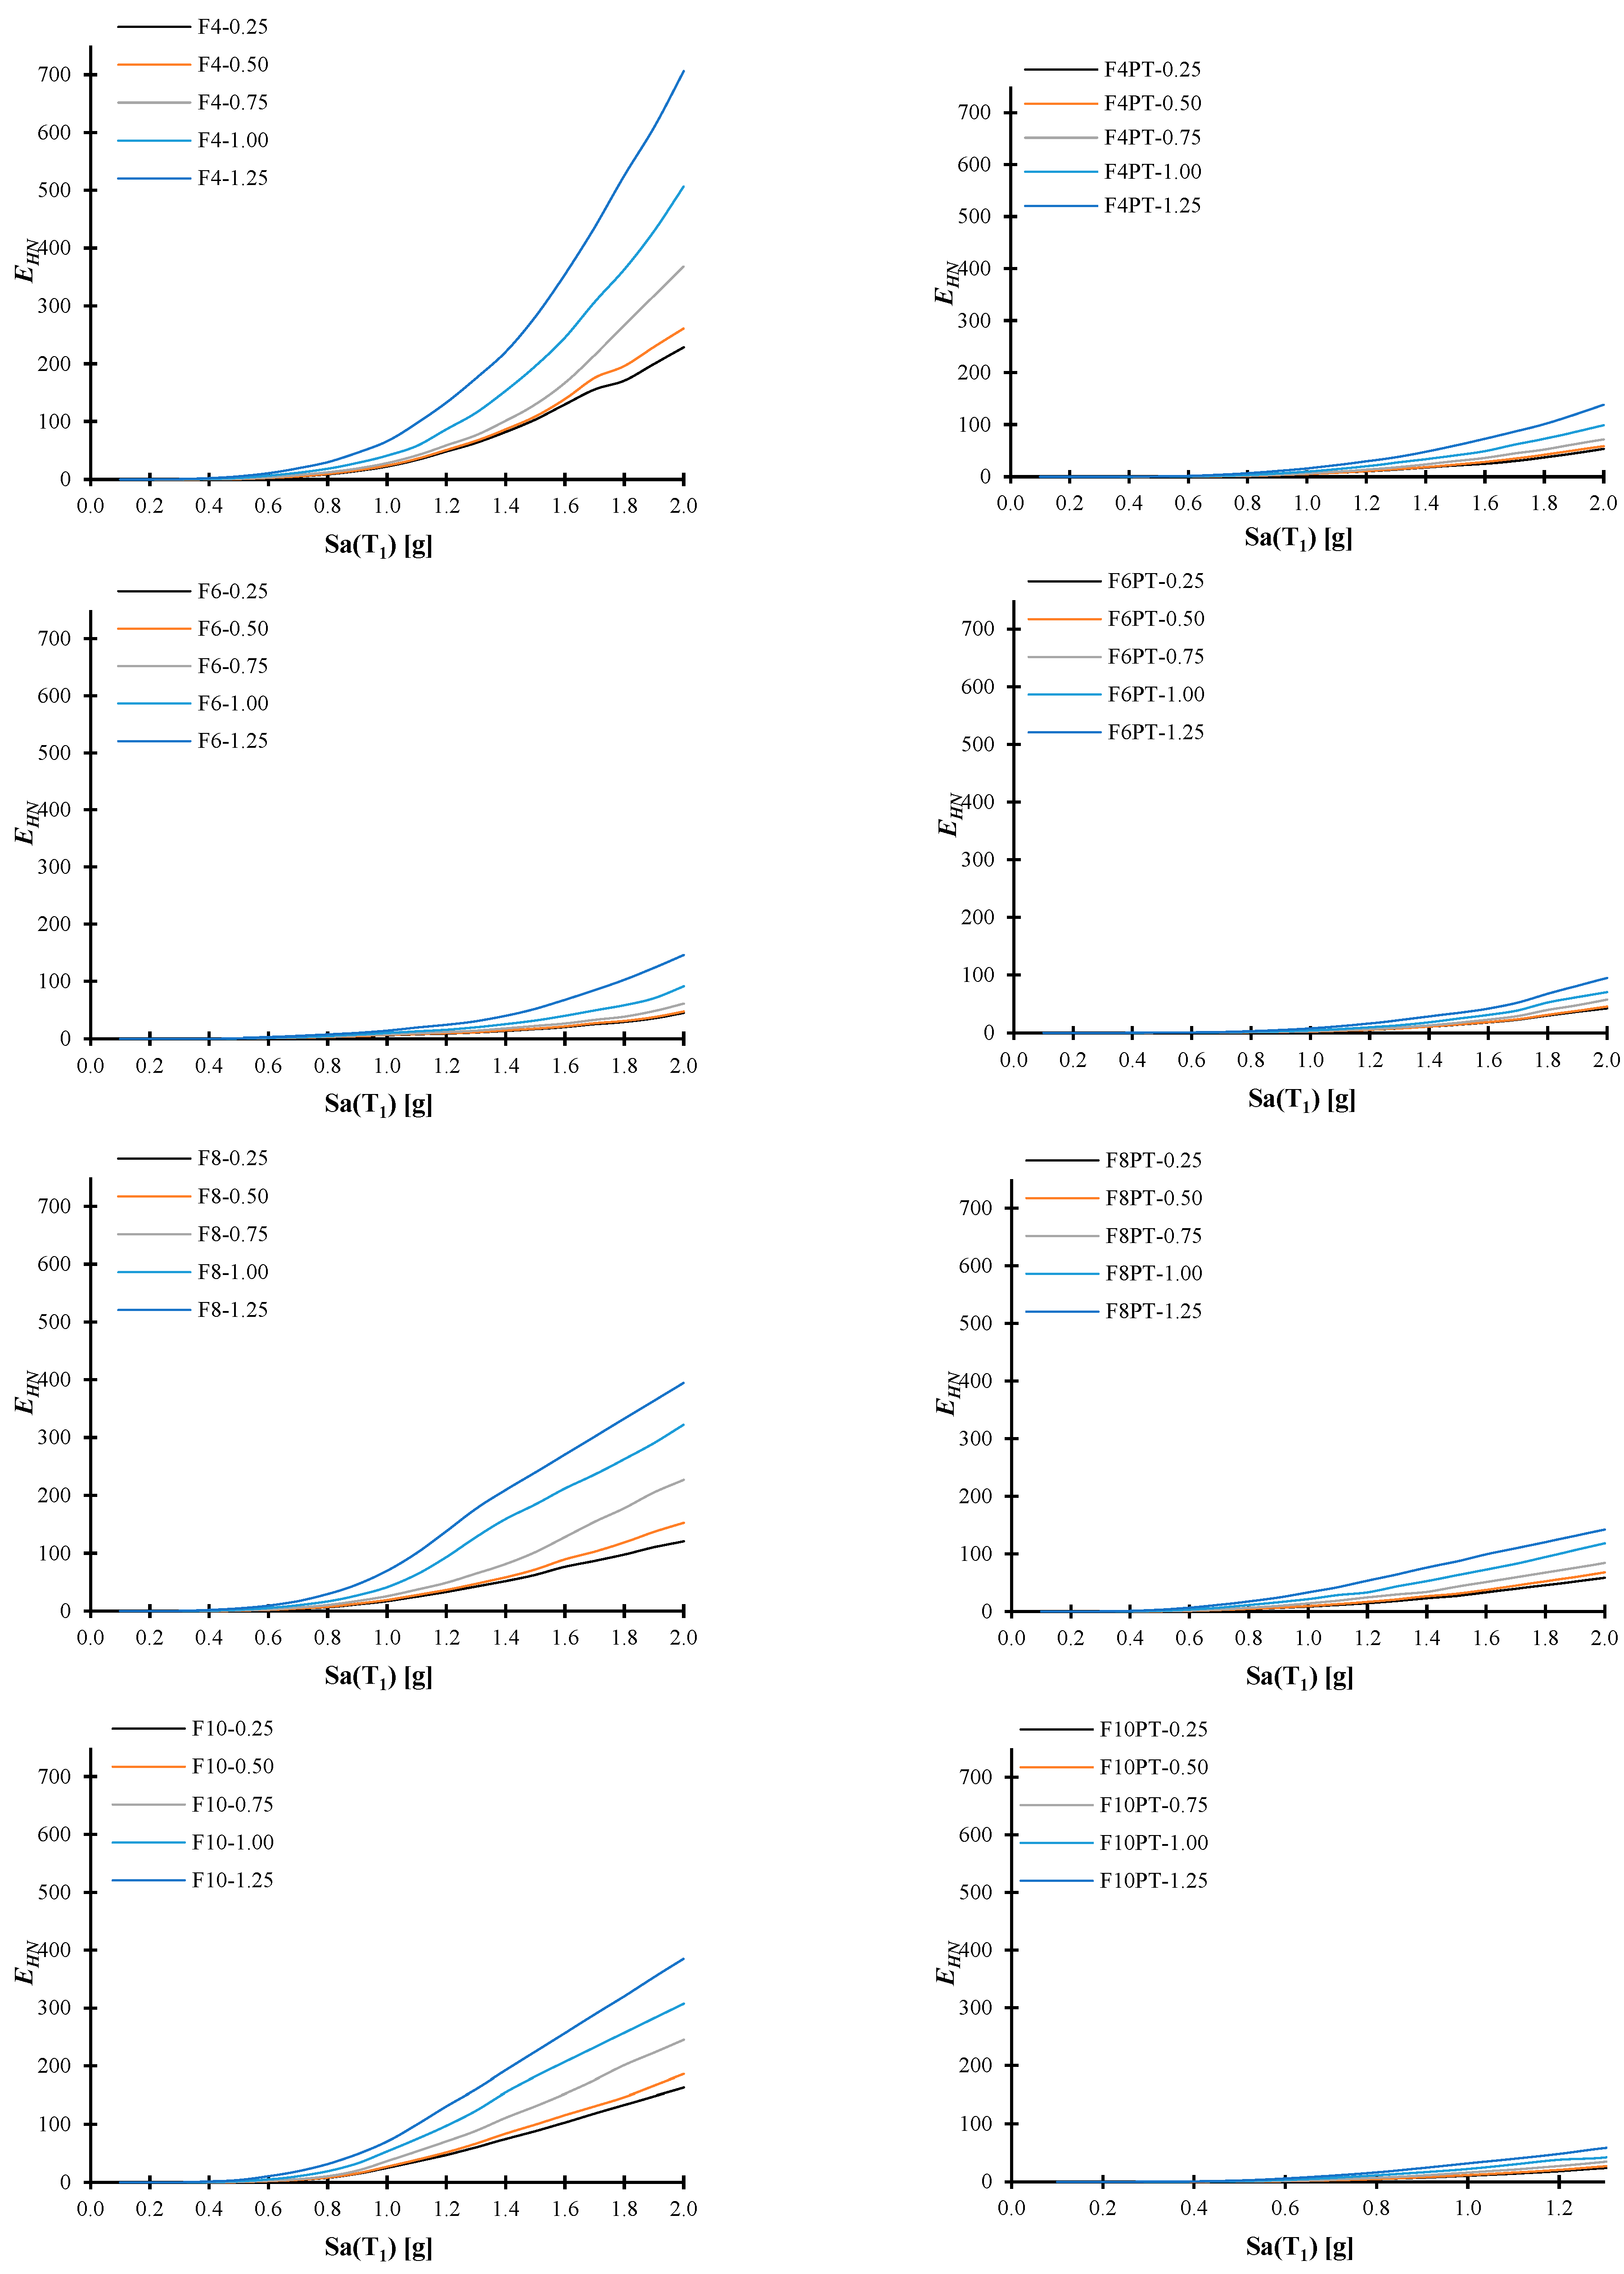
4. Hysteretic Energy Demands (EH)

One of the most important approaches to propose the implementation of post-tensioning systems in steel frames is the concentration of the energy received by severe earthquakes in replaceable non-structural elements with the capacity to dissipate energy through their elastic (steel wires) and plastic deformation (steel angles). The EH is computed via the incremental dynamic analysis developed for each frame subject to the set of seismic sequences described in the previous chapters and scaled at different values of Sa(T1) for the mainshock and a percentage value of the peak ground acceleration of the main event. For the case of Sa(T1,) it scaled from 0.1 to 2.0 g with 0.1 g increments and the secondary event from 0.25 to 1.25 times its maximum acceleration with respect to the first event with 0.25 increments. Under the incremental dynamic analysis approach, the results are discussed for the maximum EH that dissipates the rigid and post-tensioned frames. The frames with rigid connections show a capacity to dissipate more energy than frames with post-tensioned connections, because the stiffness of welded connections has the ability to dissipate by rigidly connected structural elements and the ability to resist moments through its drifts. Regarding the frames with semi-rigid post-tensioned connections, the energy dissipation is carried out in the columns and non-structural ductile elements (angles and wires), while the beams dissipate a negligible amount of energy.
In order to characterize the PTDE, they were subjected to an inelastic pushover analysis to obtain parameters such as yield displacement Dy, yield basal shear Vy, and the seismic coefficient Cy, which is defined as the ratio of the horizontal shear force at the base between the weight of the frame. Table 5 shows the results of all the frames, where in all cases, the posttensioned frames have higher seismic coefficient values, a greater yield shear capacity at a lower displacement. That is, the PTDE show great advantages for this seismic parameter, which translates into supporting a higher shear load with a lower yield displacement subjected to a higher scaling acceleration.

Normalized Hysteretic Energy (EHN)

Hysteretic energy is defined as a seismic demand parameter that is related to the damage of a structure under the action of a seismic event. An earthquake-resistant structure based on energy design must have the capacity to dissipate more energy than the energy it can receive from an earthquake. A given value of EH does not imply that a building may present damage; parameters such as the number of hysteretic cycles and their amplitude to which the frame is subjected intervene, that is, two frames dissipating the same amount of energy can present different damage levels. Considering the above, it is necessary to normalize the EH with respect to the yield parameters of the structure, such as Dy and Vy. The normalized hysteretic energy is evaluated as EHN = EH/(Dy × Vy).
Figure 13 illustrated the median values of the EHN obtained from the incremental dynamic analysis for all the structural models and intensities of the aftershocks. It is observed that in all cases, EHN is lower in the post-tensioned frames compared to the frames with rigid connections, thus the PTDE present less damage under seismic sequences at different scaling values of the mainshock or the aftershock. Notice that although the hysteretic energy demands tend to increase as the aftershock intensity increases, this increment tends to be larger for the traditional steel structures in comparison with the post-tensioned frames. Finally, the advantages of the PTDEs over the MRSFs are remarkable, since they show a better structural performance for peak, residual or the cumulative damage parameters studied under seismic sequences.

5. Conclusions

This study compares the seismic performance between 4-, 6-, 8- and 10-story steel buildings with welded and post-tensioned connections, by analyzing three important engineering demand parameters: maximum inter-tory drift (MID), residual inter-story drift (RID) and normalized hysteretic energy. The seismic performance was evaluated by inelastic incremental dynamic analysis by mean of 28 different seismic sequences. For this purpose, the mainshock was scaled from 0.1 to 2.0 g of Sa(T1) intensity measure, while aftershocks were considered with scales of 0.25, 0.5, 0.75, 1.0 y 1.25 times the maximum acceleration of the scaled mainshock. Therefore, each frame was subjected to 2800 seismic sequences.
The results reveal that the combination of energy dissipating devices with post-tensioned steel tendons in steel frames connections significantly reduce the MID demands by an average of 43.85% and RID demands by 59%. In addition, the residual inter-story drifts of the PTDE are less than the limit established for an economically viable structural repair (0.5%). Thus, it is demonstrated that post-tensioned connections in steel frames can significantly control seismic performance parameters in high seismic activity areas, under the action of an artificial seismic sequences composed by two different earthquakes scaled under different intensity measures.
The EHN normalized hysteretic energy shows that the PTDE presents less damage than the MRSF subjected to seismic sequences, even when the aftershock acceleration is greater than that of the mainshock event.
Finally, it is important to say that significantly reductions of the MID, RID and the hysteretic energy demand parameters in the steel frames with post-tensioned connections help to reduce the damage for the main structural elements of the frames such as beams and columns as its inelastic behavior is almost null. Therefore, the repair cost is also reduced and its life cycle is longer. It is concluded that the use of post-tensioned connections considerably improves the seismic performance of steel building under mainshock–aftershock effects.

Author Contributions

Conceptualization, E.B.; methodology, E.B. and J.R.T.; software, J.R.T. and H.L.; validation, E.B., J.B., S.E.R. and L.P.-A.; formal analysis, A.R.-S. and J.B.; investigation, J.R.T. and H.L.; resources, J.L.R.; data curation, J.B.; writing—original draft preparation, J.R.T.; writing—review and editing, J.L.R., J.C. and A.R.-S.; visualization, H.E.R.; supervision, E.B. and L.P.-A.; project administration, E.B.; funding acquisition, E.B. All authors have read and agreed to the published version of the manuscript.

Funding

This research work was developed thanks to the economic support provided by the Consejo Nacional de Humanidades Ciencias y Tecnologías (CONAHCYT). Finally, the support received from the Autonomous University of Sinaloa within the PROFAPI project, UNAM-DGAPA-PAPIIT and Universidad Autónoma de Cd. del Carmen is appreciated.

Data Availability Statement

The data are availability under request to the corresponding authors.

Acknowledgments

The authors express their gratitude to the CONAHCYT in Mexico for funding the research reported in this study under Grant Ciencia Básica 287103 and Ciencia de Frontera CF-2023-G-1636 and for the scholarships given to the students. The financial support given by the Universidad Autónoma de Sinaloa under Grant PROFAPI, the UNAM-DGAPA-PAPIIT under Project No. IN100423 and Facultad de Ingeniería Civil from the Universidad Autónoma de Cd. del Carmen is appreciated.

Conflicts of Interest

The authors declare no conflict of interest. The funders had no role in the design of the study; in the collection, analyses, or interpretation of data; in the writing of the manuscript; or in the decision to publish the results.

References

  1. Youssef, N.F.G.; Bonowitz, D.; Gross, J.L. A survey on steel moment-resisting frame buildings affected by the 1994 Northridge earthquake. In Building and Fire Research Laboratory; National Institute of Standard and Technology: Gaithersburg, MD, USA, 1995. [Google Scholar]
  2. Ricles, J.M.; Sause, R.; Garlock, M.M.; Zhao, C. Posttensioned seismic-resistant connections for steel frames. Posttensioned Seism. Resist. Connect. Steel Fram. 2001, 127, 113–221. [Google Scholar] [CrossRef]
  3. Garlock, M. Design, analysis and experimental behavior of seimic resistant post-tensioned steel moment resisting frames. Ph. D. Thesis, Lehigh University, Bethlehem, PA, USA, 2002. [Google Scholar]
  4. Rojas, P.; Ricles, J.M.; Sause, R. Seismic Performance of Post-tensioned Steel Moment Resisting Frames with Friction Devices. ASCE J. Struct. Eng. 2005, 131, 529–540. [Google Scholar] [CrossRef]
  5. Christopoulos, C.; Filiatrault, A.; Folz, B. Seismic response of self-centering hysteretic SDOF systems. Earthq. Eng. Struct. Dyn. 2002, 31, 1131–1150. [Google Scholar] [CrossRef]
  6. Moradi, S.; Alam, M.S.; Milani, A.S. Cyclic response sensitivity of post-tensioned steel connections using sequential fractional factorial design. J. Constr. Steel Res. 2015, 112, 155–166. [Google Scholar] [CrossRef]
  7. Moradi, S.; Alam, M.S. Finite-Element Simulation of Posttensioned Steel Connections with Bolted Angles under Cyclic Loading. J. Struct. Eng. Asce. 2016, 142, 04015075. [Google Scholar] [CrossRef]
  8. Moradi, S.; Alam, M.S. Lateral load–drift response and limit states of posttensioned steel beam-column connections: Parametric study. J. Struct. Eng. 2017, 143, 4017044. [Google Scholar] [CrossRef]
  9. Qian, K.; Liu, Y.; Yang, T.; Li, B. Progressive collapse resistance of posttensioned concrete beam-column subassemblages with unbonded posttensioning strands. J. Struct. Eng. 2018, 144, 4017182. [Google Scholar] [CrossRef]
  10. Qian, K.; Li, B.; Ma, J. Load-carrying mechanism to resist progressive collapse. J. Perform. Constr. Facil. 2015, 141, 04014107. [Google Scholar] [CrossRef]
  11. Zhu, Y.; Chen, C.H.; Yao, Y.; Keer, L.M.; Huang, Y. Dynamic increase factor for progressive collapse analysis of semi-rigid steel frames. Steel Compos. Struct. 2018, 28, 209–221. [Google Scholar]
  12. Sharbati, R.; Hayati, Y.; Hadianfard, M.A. Numerical Investigation on the Cyclic Behavior of Post-tensioned Steel Moment Connections with Bolted Angles. Int. J. Steel Struct. 2019, 19, 1840–1853. [Google Scholar] [CrossRef]
  13. D’Antimo, M.; Latour, M.; Cavallaro, G.F.; Jaspart, J.P.; Ramhormozian, S.; Demonceau, J.F. Short-and long-term loss of pre-loading in slotted bolted connections. J. Constr. Steel Res. 2020, 167, 105956. [Google Scholar] [CrossRef]
  14. Elettore, E.; Freddi, F.; Latour, M.; Rizzano, G. Design and analysis of a seismic resilient steel moment resisting frame equipped with damage-free self-centering column bases. J. Constr. Steel Res. 2021, 179, 106543. [Google Scholar] [CrossRef]
  15. Mattei, F.; Giuliani, G.; Andreotti, R.; Caprili, S.; Tondini, N. Experimental and numerical assessment of a steel frame equipped with Dissipative Replaceable Bracing Connections. Procedia Struct. Integr. 2023, 44, 1204–1211. [Google Scholar] [CrossRef]
  16. Wang, S.; Zhang, T.; Xu, W.; Du, D.; Zhang, Y. Experimental and numerical investigations on novel post-tensioned precast beam-to-column energy-dissipating connections. Structures 2023, 54, 117–133. [Google Scholar] [CrossRef]
  17. Bomben, L.; Fasan, M.; Amadio, C. Assessment of the effect of seismic sequences on steel X-CBF for industrial buildings. Procedia Struct. Integr. 2023, 44, 99–106. [Google Scholar] [CrossRef]
  18. Mehmandousti, A.M.A.; Jalaeefar, A. Effect of seismic sequences on behavior of mid-rise steel moment-resisting frames equipped with fluid viscous dampers. Structures 2023, 54, 657–668. [Google Scholar] [CrossRef]
  19. López-Barraza, A.; Ruiz, S.E.; Bojórquez, E.; Reyes-Salazar, A. Seismic performance of steel frames with post-tensioned connections. In Proceedings of the 15 World Conference on Earthquake Engineering, Lisbon, Portugal, 24–28 September 2012. [Google Scholar]
  20. Garlock, M.; Ricles, J.M.; Sause, R.M. Cyclic Load Tests and Analysis of Bolted Top-and-Seat Angle Connections. J. Struct. Eng. 2003, 129, 1615–1625. [Google Scholar] [CrossRef]
  21. López-Barraza, A. Diseño Sísmico de Marcos de Acero Con Conexiones Semi-Rígidas, Basado en Energía. Ph.D. Thesis, Universidad Nacional Autónoma de México, México City, Mexico, 2014. [Google Scholar]
  22. Vamvatsikos, D.; Cornell, C.A. Incremental dynamic analysis. Earthq. Eng. Struct. Dyn. 2002, 31, 491–514. [Google Scholar] [CrossRef]
  23. Garlock, M.; Ricles, J.M.; Sause, R.M. Experimental Studies of Full-Scale Posttensioned Steel Connections. J. Struct. Eng. 2005, 131, 438–448. [Google Scholar] [CrossRef]
  24. Shen, J.; Astaneh-Asl, A. Hysteretic model of bolted-angle connections. J. Constr. Steel Res. 2000, 54, 317–343. [Google Scholar] [CrossRef]
  25. Serra, M.; Shahbazian, A.; Da Silva, L.S.; Marques, L.; Rebelo, C.; da Silva Vellasco, P.C.G. A full scale experimental study of prestressed stayed columns. J. Eng. Struct. 2015, 100, 490–510. [Google Scholar] [CrossRef]
  26. Ghannam, M.; Mahmoud, N.S.; Badr, A.; Salem, F.A. Effect of post tensioning on strengthening different types of steel frames. J. King Saud Univ. Eng. Sci. 2016, 29, 329–338. [Google Scholar] [CrossRef] [Green Version]
  27. Ghannam, M.; Mahmoud, N.S.; Badr, A.; Ssalem, F.A. Strengthening and repairing of an existing steel bridge using post tensioning. Int. J. Civil Struct. Eng. 2014, 5, 91–100. [Google Scholar]
  28. Manley, K. Innovation case study No 9: Post-tensioned steel trusses for long span roofs. In A Series of Innovation Case Studies, the BRITE Project; The Cooperative Research Centre for Construction Innovation: Brisbane, QLD, Australia, 2008. [Google Scholar]
  29. Nazir, C.P. Prestressed steel arch bridge. IE (I) J. CV 2003, 84, 72–76. [Google Scholar]
  30. Soudki, K.; El-Sayed, A.K.; Vanzwol, T. Strengthening of concrete slab-column connections using CFRP strips. J. King Saud Univ. Eng. Sci. 2012, 24, 33–35. [Google Scholar] [CrossRef] [Green Version]
  31. Kam, W.Y.; Pampanin, S.; Elwood, K. Seismic performance of reinforced concrete buildings in the 22 February Christchurch (Lyttelton) earthquake. Bull. N. Z. Soc. Earthq. Eng. 2011, 44, 239–278. [Google Scholar] [CrossRef] [Green Version]
  32. Felzer, K.R.; Abercrombie, R.E.; Ekstrom, G. A Common Origin for Aftershocks, and Multiplets. Bull. Seismol. Soc. Am. 2004, 94, 88–98. [Google Scholar] [CrossRef]
  33. Yamashita, T.; Knopoff, L. Models of aftershock occurrence. Geophis. J. R. Astr. Soc. 1987, 91, 13–26. [Google Scholar] [CrossRef] [Green Version]
  34. Das, S.; Henry, C. Spatiel Relation Between main earthquake slip and its aftershock distribution. Rev. Geophys. 2003, 41. [Google Scholar] [CrossRef] [Green Version]
  35. Molchan, G.M.; Dmitrieva, O.E. Aftershock identification: Methods and new approaches. Geophys. J. Int. 1992, 109, 501–516. [Google Scholar] [CrossRef]
  36. Felzer, K.R.; Becker, T.W.; Abercrombie, R.E.; Ekström, G.; Rice, J.R. Triggering of the 1999 Mw 7.1 Hector Mine earthquake by afthershocks of the 1992 Mw 7.3 Landers earthquake. J. Geophys. Res. Solid Earth 2002, 107, ESE 6-1–ESE 6-13. [Google Scholar] [CrossRef]
  37. Felzer, K.R.; Abercrombie, R.E.; Ekström, G. Secondary aftershocks and their importance for aftershock forecasting. Bull. Seismol. Soc. Am. 2003, 93, 1433–1448. [Google Scholar] [CrossRef]
  38. Ogata, Y.; Jones, L.M.; Toda, S. When and where the aftershock activity was depressed: Contrasting decay patterns of the proximate large earthquakes in southern California. J. Geophys. Res. Solid Earth 2003, 108. [Google Scholar] [CrossRef] [Green Version]
  39. Chiarabba, C.; De Gori, P.; Chiaraluce, L.; Bordoni, P.; Cattaneo, M.; De Martin, M.; Frepoli, A.; Michelini, A.; Monachesi, A.; Moretti, M.; et al. Mainshocks and Aftershocks of the 2002 Molise Seismic Sequence, Southern Italy. J. Seismol. 2005, 9, 487–494. [Google Scholar] [CrossRef]
  40. Marín López, M.V. Efecto Del Comportamiento Histerético en la Respuesta Sísmica de Edificios Cimentados en Terreno Blando. Bachelor’s Thesis, Universidad Michoacana de San Nicolas de Hidalgo, Morelia, Mexico, 2012. [Google Scholar]
  41. Ruiz-García, J.; Marín, M.V.; Terán-Gilmore, A. Effect of seismic sequences in reinforced concrete frame buildings located in soft-soil sites. Soil Dyn. Earthq. Eng. 2014, 63, 56–68. [Google Scholar] [CrossRef]
  42. Díaz-Martínez, G.; Ruiz-García, J.; Terán-Gilmore, A. Response of structures to seismic sequences corresponding to Mexican soft soils. Earthq. Struct. 2014, 7, 1241–1258. [Google Scholar] [CrossRef]
  43. Guerrero, H.; Ruiz-García, J.; Escobar, J.A.; Terán-Gilmore, A. Response to seismic sequences of short-period structures equipped with Buckling-Restrained Braces located on the lakebed zone of Mexico City. J. Constr. Steel Res. 2017, 137, 37–51. [Google Scholar] [CrossRef]
  44. Lee, K.; Foutch, D.A. Performance evaluation of damaged steel frame buildings subjected to seismic loads. J. Struct. Eng. 2004, 130, 588–599. [Google Scholar] [CrossRef]
  45. Li, Q.; Ellingwood, B.R. Performance evaluation and damage assessment of steel frame buildings under main shock-aftershock sequences. Earthq. Eng. Struct. Dyn. 2007, 36, 405–427. [Google Scholar] [CrossRef]
  46. Mexican Strong Motion Dataset 1960–1999. Mexican Society of Seismic Engineering, A.C. Available online: https://aplicaciones.iingen.unam.mx/AcelerogramasRSM/Referencias.aspx (accessed on 2 February 2023).
  47. NTCS-20; Normas Técnicas Complementarias para Diseño por Sismo con Comentarios. Gaceta Oficial de la Ciudad de México: Mexico City, Mexico, 2020.
  48. Garlock, M.; Sause, R.; Ricles, J. Behavior and Design of Post-tensioned Steel Frames System. ASCE J. Struct. Eng. 2007, 133, 389. [Google Scholar] [CrossRef]
  49. Shen, J.; Astaneh-Asl, A. Hysteretic behavior of bolted angle connections. J. Constr. Steel Res. 1999, 51, 201–218. [Google Scholar] [CrossRef]
  50. Richard, R.M.; Abbott, B.J. Versatile Elastic Plastic Stress-Strain Formula. ASCE J. Eng. Mech. 1975, 101, 511–515. [Google Scholar] [CrossRef]
  51. Carr, A. RUAUMOKO Inelastic Dynamic Analysis Program; Department of Civil Engineering, University of Canterbury: Christchurch, New Zealand, 2017. [Google Scholar]
  52. McCormick, J.; Aburano, H.; Ikenaga, M.; Nakashima, M. Permissible residual deformation levels for building structures considering both safety and human elements. In Proceedings of the 14th Conference on Earthquake Engineering, Beijing, China, 12–17 October 2008. [Google Scholar]
Figure 1. Combination of ground motion records to obtain the seismic sequences.
Buildings 13 01676 g001
Figure 2. An illustrative example of artificial seismic sequences used to evaluate the seismic performance of the structural models for three different aftershocks intensities as a function of the mainshock PGA: (a) 0.25, (b) 0.75 and (c) 1.25.
Buildings 13 01676 g002
Figure 3. Illustrative example and global dimensions of the MRSF models.
Buildings 13 01676 g003
Figure 4. Components of the PT structural steel frame connection selected in the present study.
Buildings 13 01676 g004
Figure 5. Moment-relative rotation hysteretic curve for the post-tensioned connection.
Buildings 13 01676 g005
Figure 6. Illustrative example of IDA curves for F10PT and two intensities of the aftershocks as a function of the mainshock PGA: (a) 0.25 and (b) 1.0.
Buildings 13 01676 g006
Figure 7. Incremental dynamic analysis in term of maximum inter-story drift (left side MRSF—right side PTDE) for frame: (a) F4; (b) F4PT; (c) F6; (d) F6PT; (e) F8; (f) F8PT; (g) F10 and (h) F10PT.
Buildings 13 01676 g007
Figure 8. Median values curves of maximum inter-story drift (left side MRSF—right side PTDE). The legends indicate the structural frame and the scaling level of the aftershocks.
Buildings 13 01676 g008
Figure 9. Median value curves of maximum residual inter-story drift (MRSF- PTDE). Notice that the legends indicate the structural frame and the scaling level of the aftershocks.
Buildings 13 01676 g009
Figure 10. Average of residual inter-story drift ratio (RRD) at different Sa(T1) values for each structural model: (a) 4-stories; (b) 6-stories; (c) 8-stories and (d) 10-stories.
Buildings 13 01676 g010aBuildings 13 01676 g010b
Figure 11. Comparison between median MID and RID values for F6 and F6PT at different scaling levels of the mainshock and aftershock M-A (left side MRSF-right side PTDE).
Buildings 13 01676 g011
Figure 12. Comparison between median MID and RID values for F10 and F10PT at different scaling levels of the mainshock and aftershock M-A (left side MRSF-right side PTDE).
Buildings 13 01676 g012
Figure 13. EHN median curve results for all structural models. The legends indicate the structural frame and the intensity of the aftershock.
Buildings 13 01676 g013
Table 1. Records used in the generation of seismic sequences.
RecordStationDateMagnitudePGA (cm/s2)Tg (s)
1Villa del mar25/04/19896.946.52.96
2Villa del mar25/04/19896.949.42.96
3Jamaica25/04/19896.935.23.04
4Rodolfo Menendez25/04/19896.947.72.89
5P.C.C. Superficie25/04/19896.942.52.3
6Córdova14/04/19897.119.42.3
7Liverpool15/04/19896.940.02.3
8Roma-B14/04/19897.125.02.3
Table 2. W sections of the steel frame models with six and ten story levels.
FramesF6
F6PT
F10
F10PT
F6
F6PT
F10
F10PT
F6
F6PT
F10
F10PT
StoriesInternal ColumnsExternal ColumnsBeams
130 × 17336 × 28027 × 14636 × 28018 × 7121 × 68
230 × 17336 × 28027 × 14636 × 28018 × 7621 × 93
330 × 14836 × 24527 × 12936 × 24518 × 7621 × 101
430 × 14836 × 24527 × 12936 × 24518 × 6721 × 101
530 × 12436 × 21027 × 11436 × 21018 × 5021 × 101
630 × 12436 × 21027 × 11436 × 21018 × 4521 × 93
7 36 × 182 36 × 182 21 × 73
8 36 × 182 36 × 182 21 × 68
9 36 × 150 36 × 150 21 × 57
10 36 × 150 36 × 150 21 × 50
Table 3. W sections of the steel frame models with four and eight story levels.
FramesF4
F4PT
F8
F8PT
F4
F4PT
F8
F8PT
F4
F4PT
F8
F8PT
StoriesInternal ColumnsExternal ColumnsBeams
121 × 12236 × 21018 × 9736 × 19416 × 6721 × 83
221 × 12236 × 21018 × 9736 × 19416 × 5721 × 93
321 × 11136 × 19418 × 8636 × 18216 × 4521 × 93
421 × 11136 × 19418 × 8636 × 18216 × 4021 × 83
5 36 × 170 36 × 160 21 × 71
6 36 × 170 36 × 160 21 × 65
7 36 × 160 36 × 135 21 × 55
8 36 × 160 36 × 135 21 × 46
9
10
Table 4. Results to compare seismic performance parameters of frames under seismic sequences.
Aftershock ScaleEDPF4F4PTF6F6PTF8F8PTF10F10PT
0.75Sa(T1)[g]0.880.971.391.540.861.20.831.18
γ0.030.030.030.030.030.030.030.03
RID0.00660.0010.00550.00110.00260.0010.00290.001
1.0Sa(T1)[g]0.880.951.321.5350.8321.190.791.12
γ0.030.030.030.030.030.030.030.03
RID0.00660.001730.00680.00170.0040.00160.00250.0011
1.25Sa(T1)[g]0.750.81.0751.330.7150.970.70.965
γ0.030.030.030.030.030.030.030.03
RID0.00610.0010.0010.00650.00250.00130.00350.001
Table 5. Values of parameters Cy, Vy and Dy.
F4F4PTF6F6PTF8F8PTF10F10PT
Cy0.230.390.260.40.270.340.30.34
Vy (N)78,000134,000132,000200,000181,000230,000250,000275,000
Dy (m)0.120.10.180.140.190.190.250.22
Disclaimer/Publisher’s Note: The statements, opinions and data contained in all publications are solely those of the individual author(s) and contributor(s) and not of MDPI and/or the editor(s). MDPI and/or the editor(s) disclaim responsibility for any injury to people or property resulting from any ideas, methods, instructions or products referred to in the content.

