Article

Influence of Small Radius Curved Shield Tunneling Excavation on Displacement of Surrounding Soil

1
School of Civil Engineering, Henan University of Technology, Zhengzhou 450001, China
2
Henan Key Laboratory of Grain and Oil Storage Facility & Safety, Henan University of Technology, Zhengzhou 450001, China
3
School of Civil Engineering, Central South University, Changsha 410075, China
*
Author to whom correspondence should be addressed.
Buildings 2023, 13(3), 803; https://doi.org/10.3390/buildings13030803
Submission received: 20 February 2023 / Revised: 9 March 2023 / Accepted: 16 March 2023 / Published: 18 March 2023
(This article belongs to the Collection Innovation of Materials and Technologies in Civil Construction)

Abstract

:
In contrast to straight tunnels, the mechanisms of displacement of surrounding soil induced by shield excavation of small radius curved tunnels are more complex. Based on field monitoring data of surface settlement and horizontal displacement of a small radius curved shield tunnel in a section of Zhengzhou Metro Line 3, a numerical model using three-dimensional a finite element method is established to evaluate factors of the displacement of surrounding soil. The results verify the validity of numerical simulation by comparison with field monitoring data and the influence of unbalanced additional thrust at tail jacks, curvature radius of a tunnel and tail grouting pressure on surface settlement and horizontal displacement of surrounding soil. Maximum surface settlement and horizontal displacement of surrounding soil at the outer side and inner side of curved tunnel axes are positively related to thrust ratio, while negatively related to curvature radius and grouting pressure. The ultimate objective of this study is to ascertain factors of displacement of surrounding soil induced by small radius shield excavation and provide a theoretical basis and technical support for the design and construction of similar tunnel.

1. Introduction

With the flying development of the economy and acceleration of urbanization process, road traffic system is suffering increasing pressure [1,2,3,4]. Metros are considered priorities to solve congestion and improve traffic efficiency because of their high transport capacity and speed, low environmental pollution and little disturbance to ground traffic [5,6,7,8,9]. On the basis of a statistical report from China Association of Metros, nearly 1000 km of metro lines were brought into operation annually in the past 3 years. Further, up to the end of 2022, there were 55 metro cities in China, and the total length of metro lines in operation exceeded 8000 km. The shield tunneling method is extensively applied in metro construction due to its high level of mechanization and automation, fast construction speed, high safety and strong adaptability to stratum and ground water [10,11,12,13,14].
The vast majority of tunnel axes of metro sections are straight lines or flat curves with relatively mature construction experience and technique [15]. Nevertheless, limited by complex surrounding environments, such as urban transportation planning, existing buildings and structures and underground utilities, it is necessary to construct curved axes with small radiuses to fulfill the requirements of metro lines. In comparison with a straight or flat curved section, shield construction of a small radius curved tunnel section is characterized by its enhanced stratum disturbance, uneven ground losses on both sides and complicated ground deformation [16,17]. Thus, more attention should be paid to deformation and displacement of surrounding soil induced by shield excavation of small radius curved tunnels.
Plenty of studies have been conducted to evaluate the effect of shield construction surrounding soil by field monitoring, theoretical analysis, model tests and numerical modeling. According to massive engineering data, Peck [18] found that surface settlement trough is in accord with Gaussian distribution and proposed an empirical formula. Modifications to Peck formula were carried out hereafter [19,20]. Cao et al. [21] monitored the surface settlement of a subway station using a combined shield and shallow tunneling method, and discovered that surface settlements were mainly induced by the excavation of a shield tunnel slope and that double arch and grouting could effectively limit the surface settlement. Finno et al. [22] developed a finite element simulation procedure to evaluate soil response to shield tunneling and found the ground disturbance was both three-dimensional and time-dependent. Khademian et al. [23] systematically compared settlement data and results of numerical modeling to evaluate the accuracy of several methods to predict surface settlement caused by tunnel excavation. Benmebarek et al. [24] analyzed ground disturbance induced by the excavation of a shallow tunnel and found that surface deformation is the result of complex interactions between stratum, construction process and shield parameters. Zheng et al. [5] used numerical model to assess the influence of shield excavation on surrounding soil and bridge substructures and verified the validity of the model by comparison with monitoring data. Cheng et al. [25] studied surface settlement induced by a large diameter earth pressure balance shield, discussed the effect of construction parameters on surface deformation and proposed a calculation method to predict ground losses during various excavation stages. Wu et al. [12] combined field monitoring data and a three-dimensional finite element model and assessed ground deformation characteristics caused by the advance of a mechanized shield along a curved alignment. Imamura et al. [26] employed a model shield in a centrifuge to simulate excavation of tunnel and discussed the effect of the thickness of overlying soil and ground loess on ground settlement. Atkinson et al. [27] conducted a scale test to analyze the process of shield advances and studied impressions of buried depth and crown effect on surface settlement. Zhou et al. [28] studied the relation between ground displacement and type, relative and water content of surrounding soil and obtained calculation parameters of settlement trough.
Existing research about surface settlement produced by shield excavation is concentrated on straight line tunnels, whereas studies about curved tunnels are relatively less [29]. Feng et al. [30] considered additional thrust, grouting pressure, ground loss and friction between shield shell and soil and analyzed the variation of surface settlement during small radius curved shield excavation. Lou et al. [16] established a numerical model considering over excavation to evaluate the influence of excavation of a curved shield tunnel on ground settlement and segment stress. Lu et al. [31] monitored the surface settlement of a curved shield tunnel in clay stratum, discussed the effect of tunnel depth and curvature radius on surface deformation and proposed a prediction formula on the basis of the Peck formula. Previous studies about curved shield tunnels mainly focus on surface settlement induced by excavation. Horizontal displacement of surrounding soil leads to a shear layer in the stratum and might affect the structural stability of the tunnel and surrounding buildings. In spite of severe threat to construction safety, research about horizontal displacement of surrounding soil during shield excavation is few.
In this paper, the influence of excavation of small radius shield tunnels on displacement characteristics of surrounding soil are evaluated. On account of field monitoring data of a surface settlement and horizontal displacement of a small radius curved shield tunnel in a certain section of Zhengzhou Metro Line 3, a numerical model using a finite element method is established to analyze the effect of unbalanced additional thrust at tail jacks, curvature radius of a tunnel and grouting pressure on the displacement of surrounding soil. The ultimate objective of this study is to ascertain factors of the displacement of surrounding soil induced by small radius shield excavation and provide a theoretical basis and technical support for the design and construction of similar tunnels.

2. Engineering Background

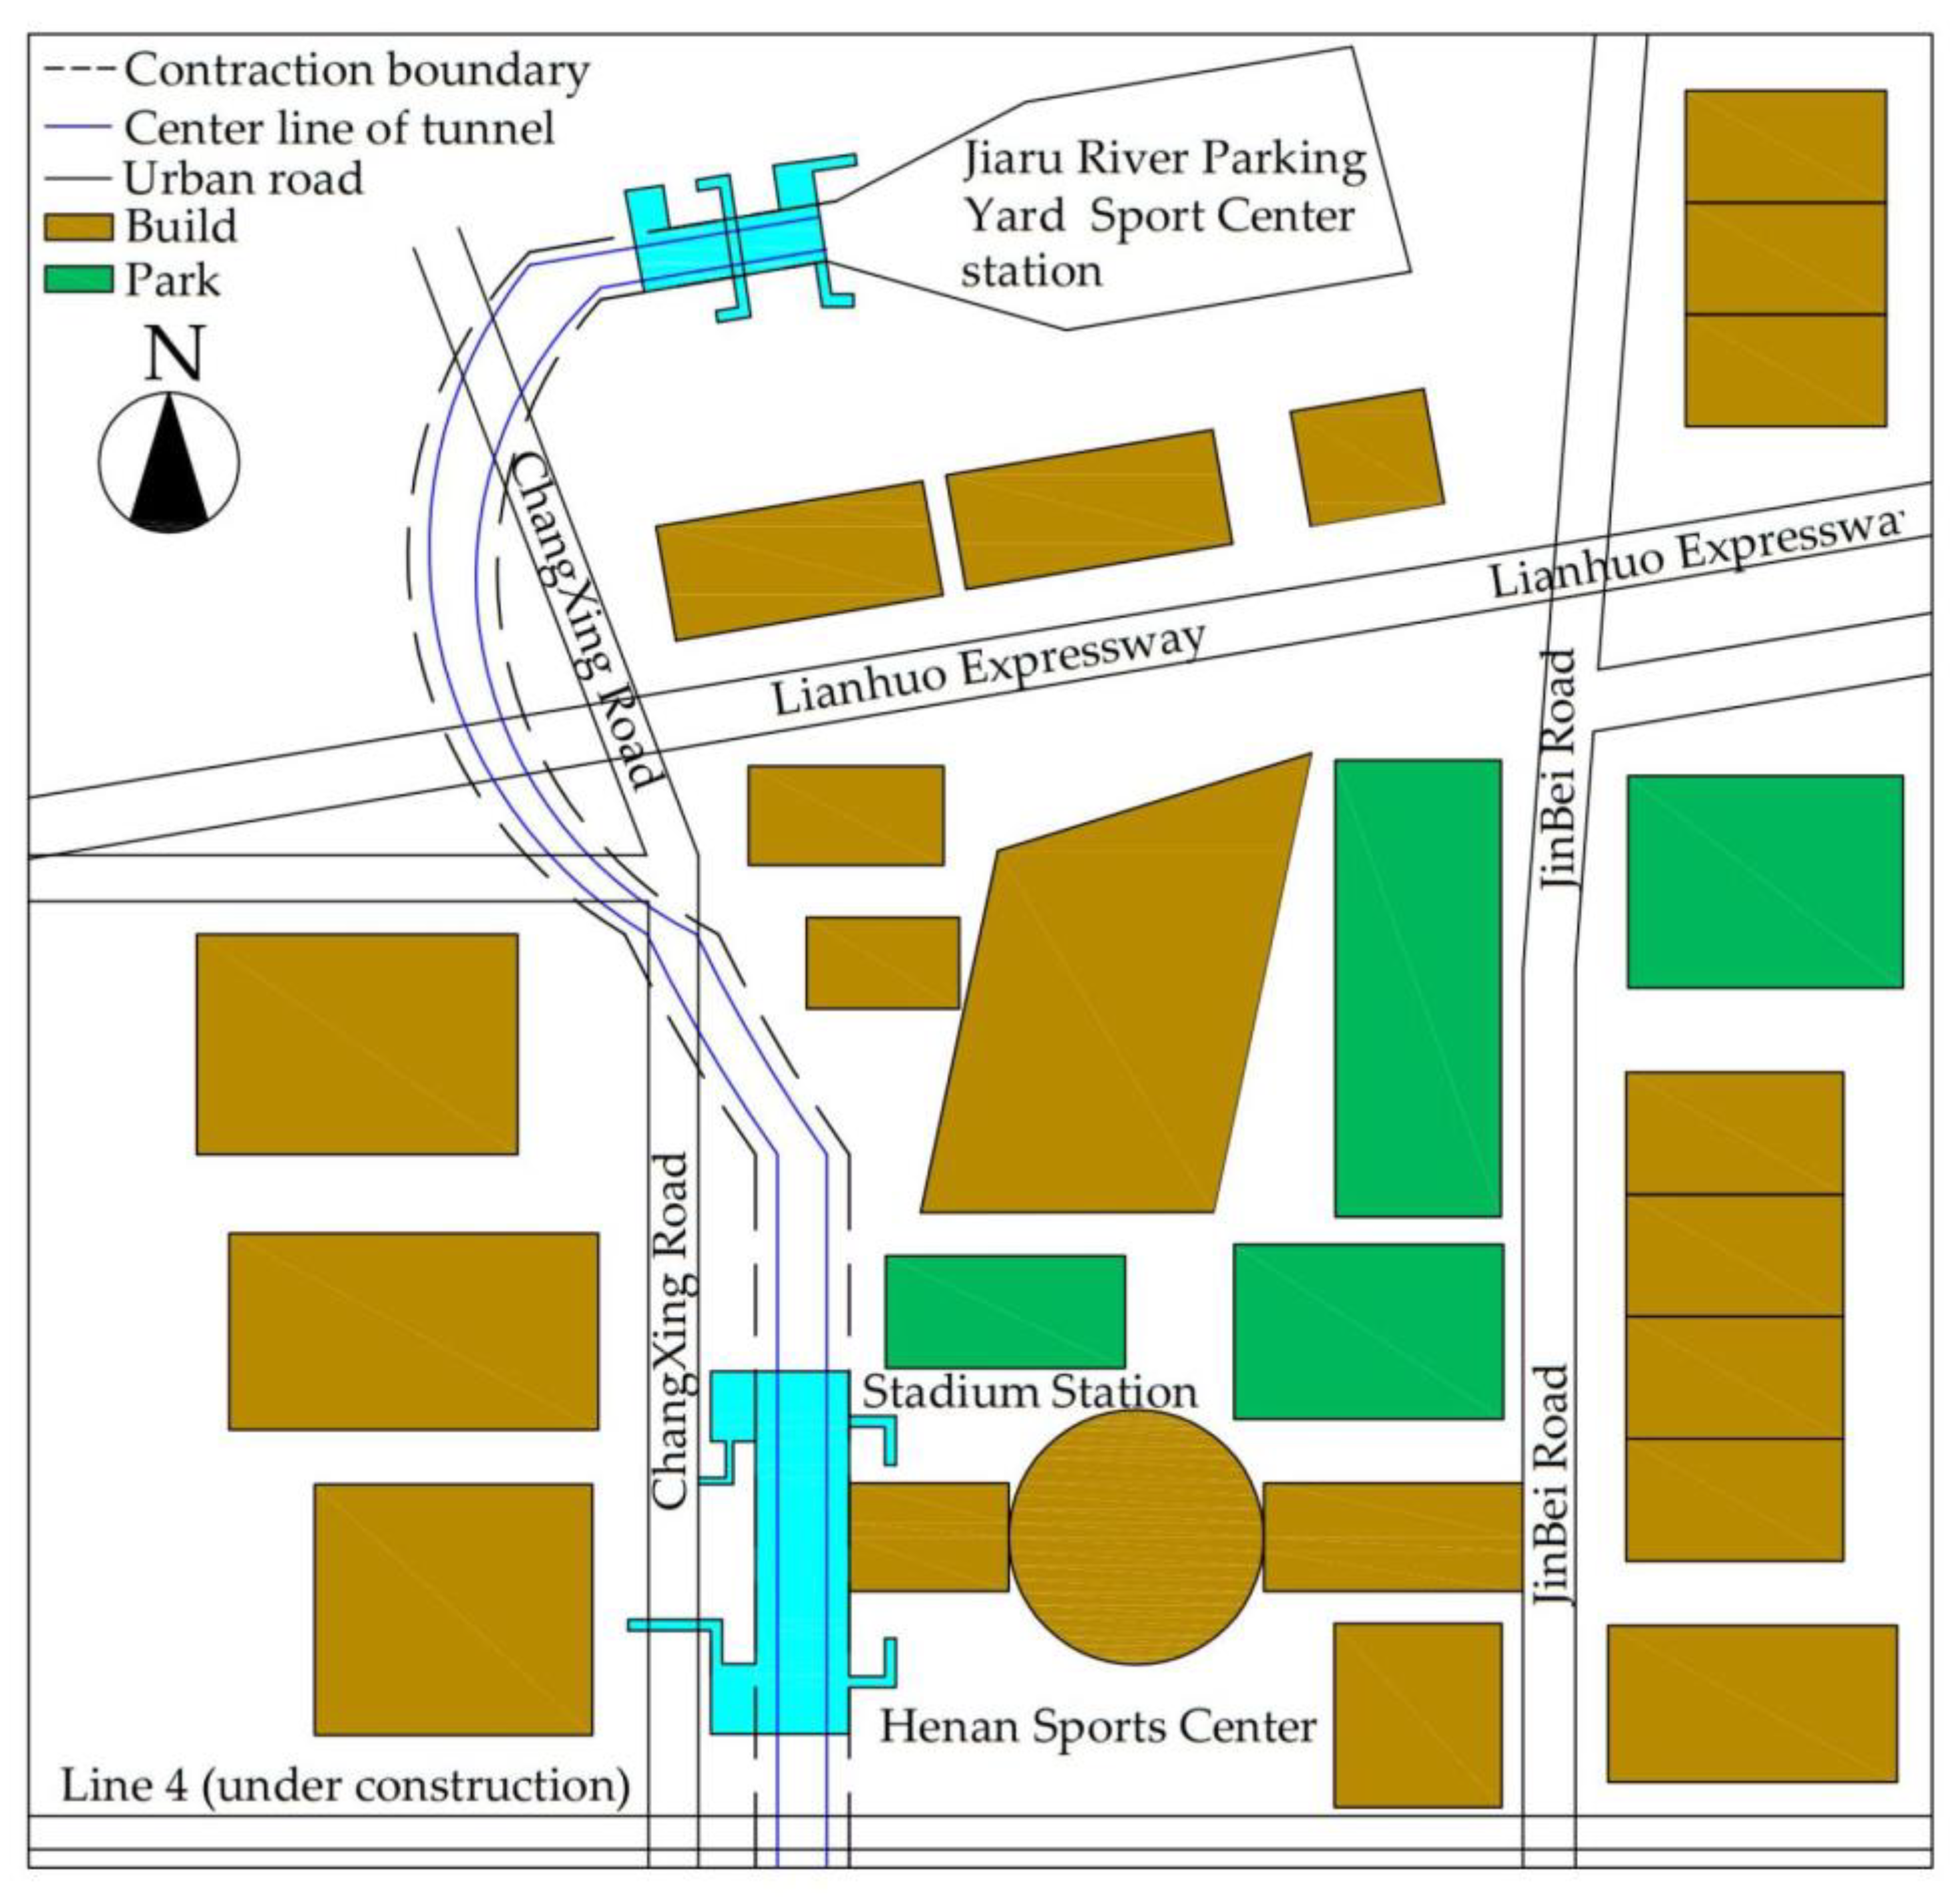
2.1. Engineering Overview

The Jiaru River Parking Yard entry line of Metro Line 3 is located in Huiji District, Zhengzhou City, Henan Province. As shown in Figure 1, Metro Line 3 starts from Sport Center station, moves northwest along Changxing Road and turns east to the parking yard after passing through the Lianhuo Expressway. Designed interval mileage of this section is CK0+000-CK1+603 and the length of shield construction is 1200 m following the construction sequence of first the right line and then the left line. A small radius curved tunnel of the right line with a length of 469.21 m and a curvature radius of 300 m was selected as the object of this study. The tunnel was excavated by an earth pressure balancing shield with a length of 8 m and a diameter of 6.48 m. The inside diameter and outside diameter of the shield segment were 5.5 m, 6.2 m, respectively. The width of the segment was 1.2 m and the thickness was 0.35 m in the curved tunnel.

2.2. Engineering Geological Conditions

The geomorphic unit of this tunnel is Yellow River alluvial-proluvial plain with flat terrain. The stratum is mostly Quaternary loose deposits, with a total thickness of about 280–300 m. The surrounding soil of the shield is mainly composed of Holocene fill and alluvial and Epipleistocene alluvial, which could be divided into three layers from the top down; relevant physical and mechanical parameters are listed in Table 1. No surface water was observed in the field investigation. The type of underground water is phreatic water with a depth of 9.60–11.7 m and a water level elevation of 81.2–83.3 m.

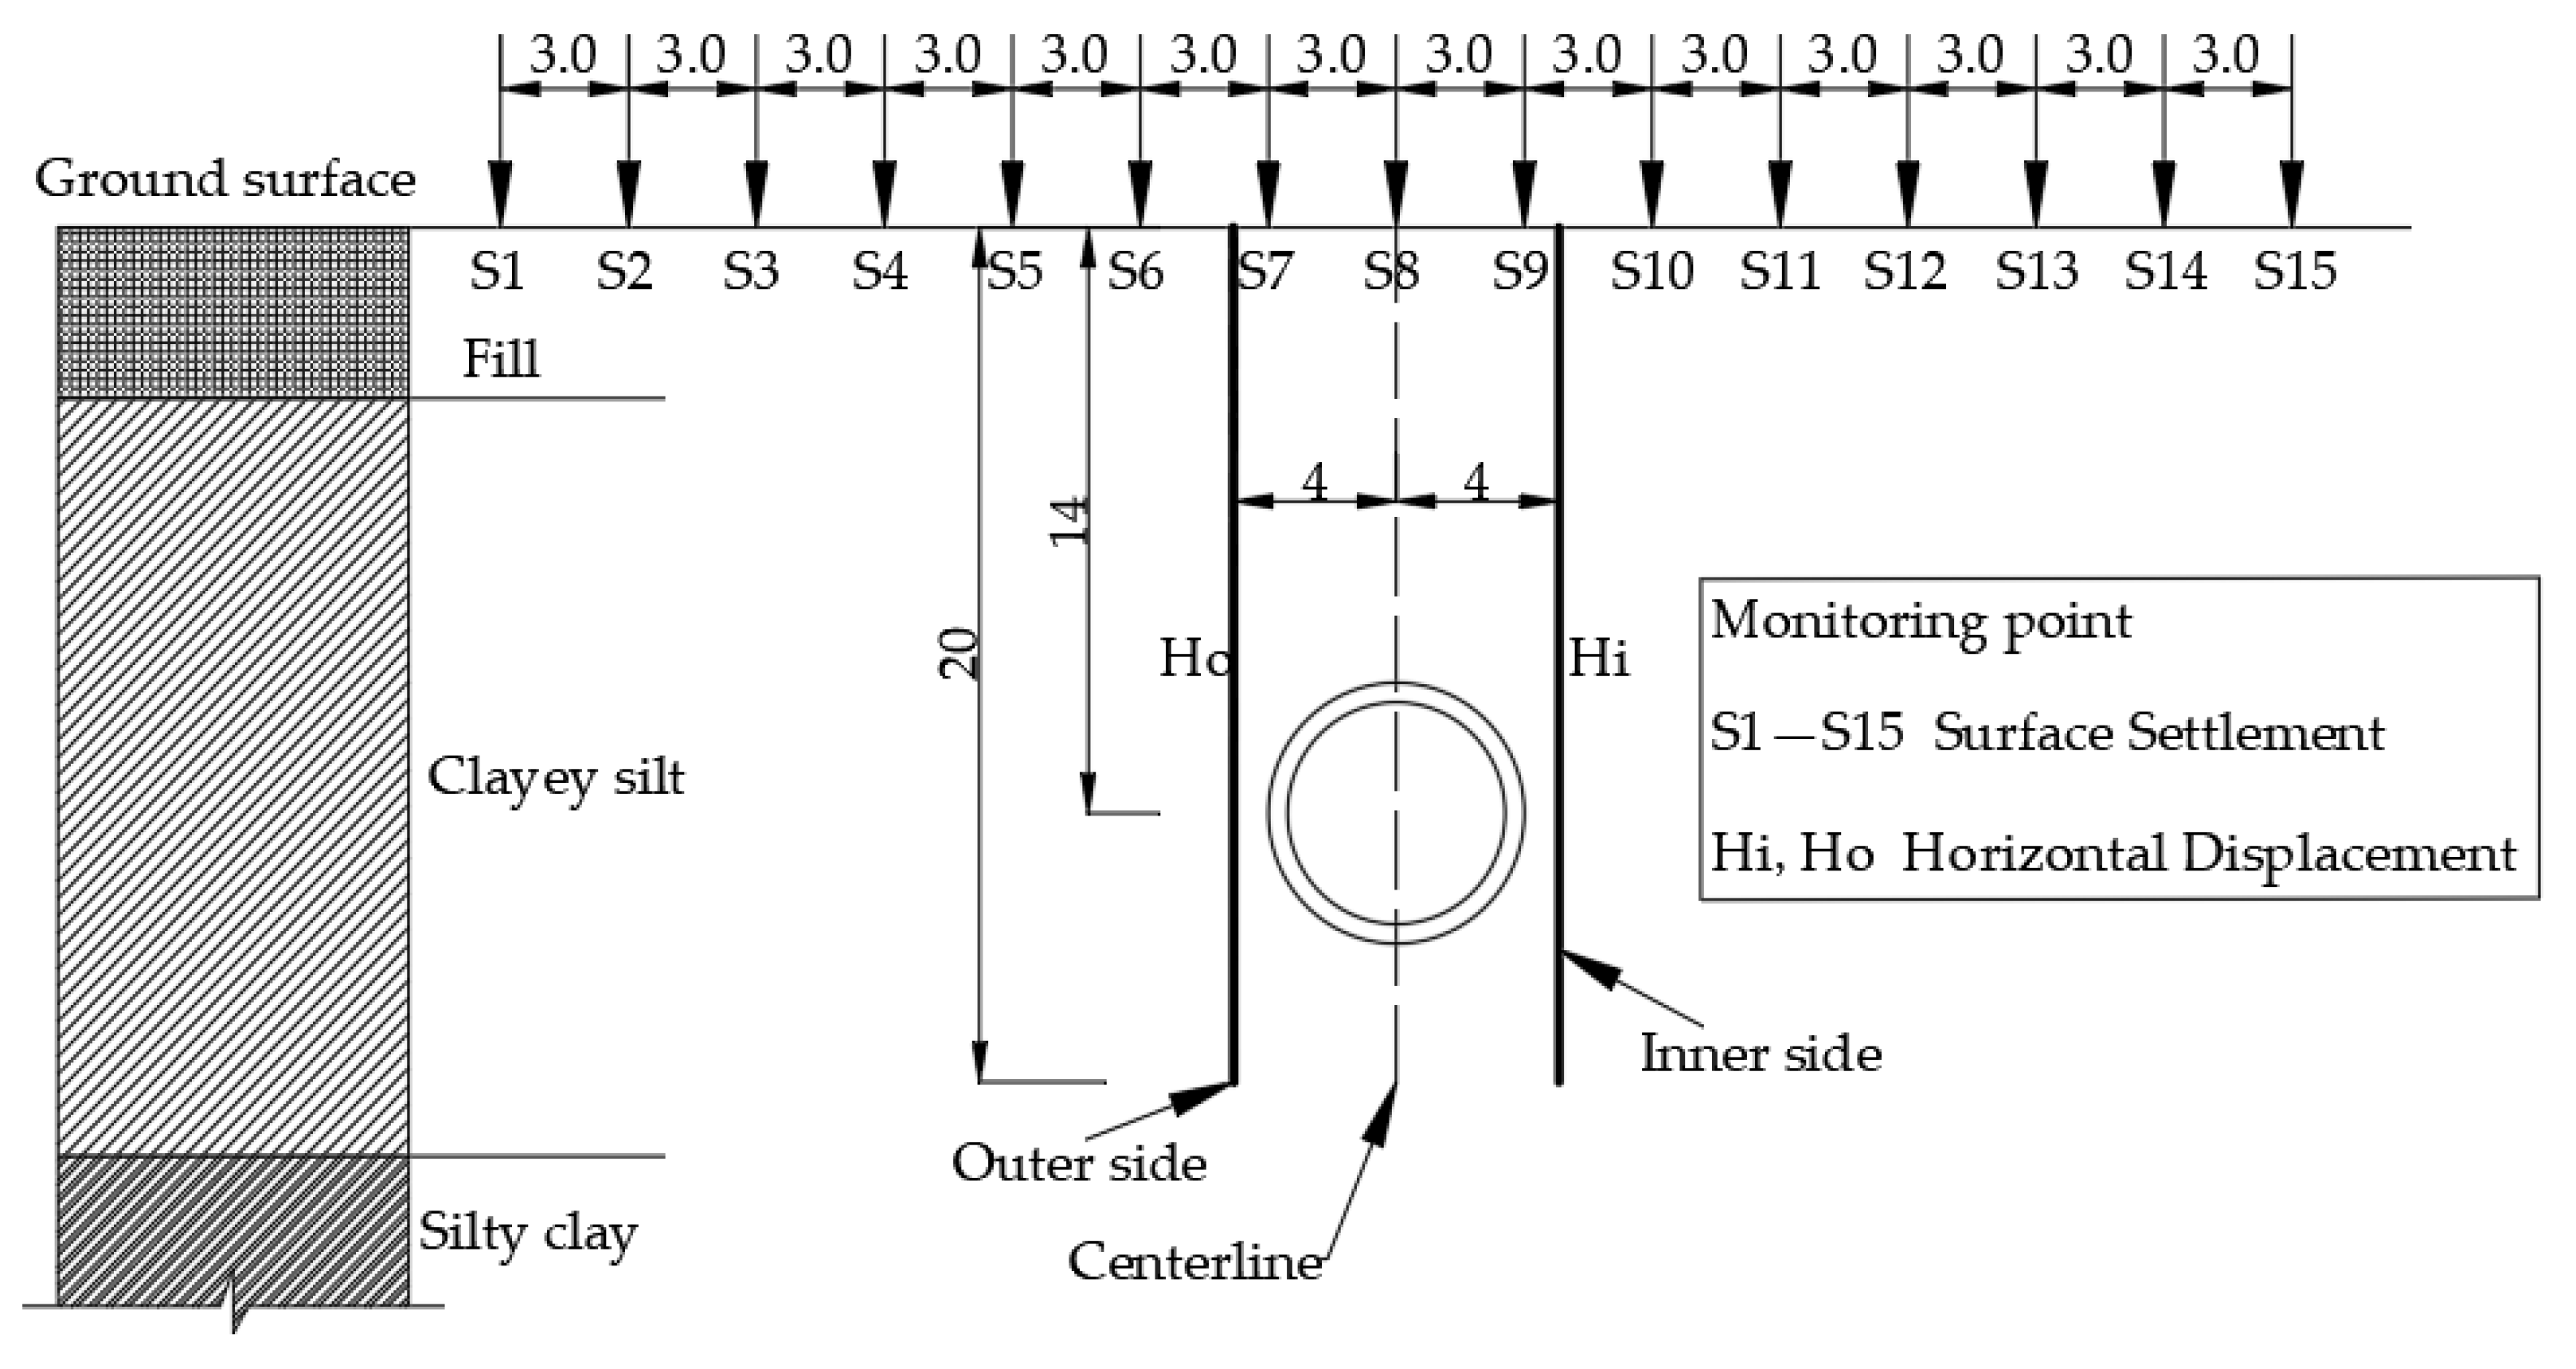
2.3. Monitoring Scheme

A cross section at the midpoint of the small radius curved tunnel axis was selected as a representative to monitor the displacement of surrounding soil. A level gauge and slip inclinometer were installed to monitor surface settlement and horizontal displacement, respectively. The layout of the monitoring points are shown in Figure 2. Centered on the axis line, a total of 15 monitoring points of the surface settlement, numbered as S1–S15 from left to right, were arranged at both sides of the tunnel, with an interval of 3 m. Two monitoring points of horizontal displacement were placed at both the inner and outer sides of the curved tunnel and numbered as Hi and Ho, respectively. The horizontal distance between the monitoring point and tunnel wall was 0.9 m. The depth of the installed inclinometer was 20 m, approximately 1.5 times the depth of the tunnel axis. The frequency of monitoring generally decreased with the increase in distance between heading face and monitoring cross section during excavation. Detailed information about the field monitoring is listed in Table 2.

3. Numerical Modelling

In this study, Midas GTS NX (New eXperience of Geo-Technical analysis System) was adopted to simulate displacement characteristics of surrounding soil induced by shield excavation of a small radius curved tunnel [12]. As a finite element software, Midas GTS NX is widely applied in analysis of geotechnical problems, such as deep found pit [32], slope stability [33], pile–soil interaction [34], seepage deformation [35] and tunnels [36].

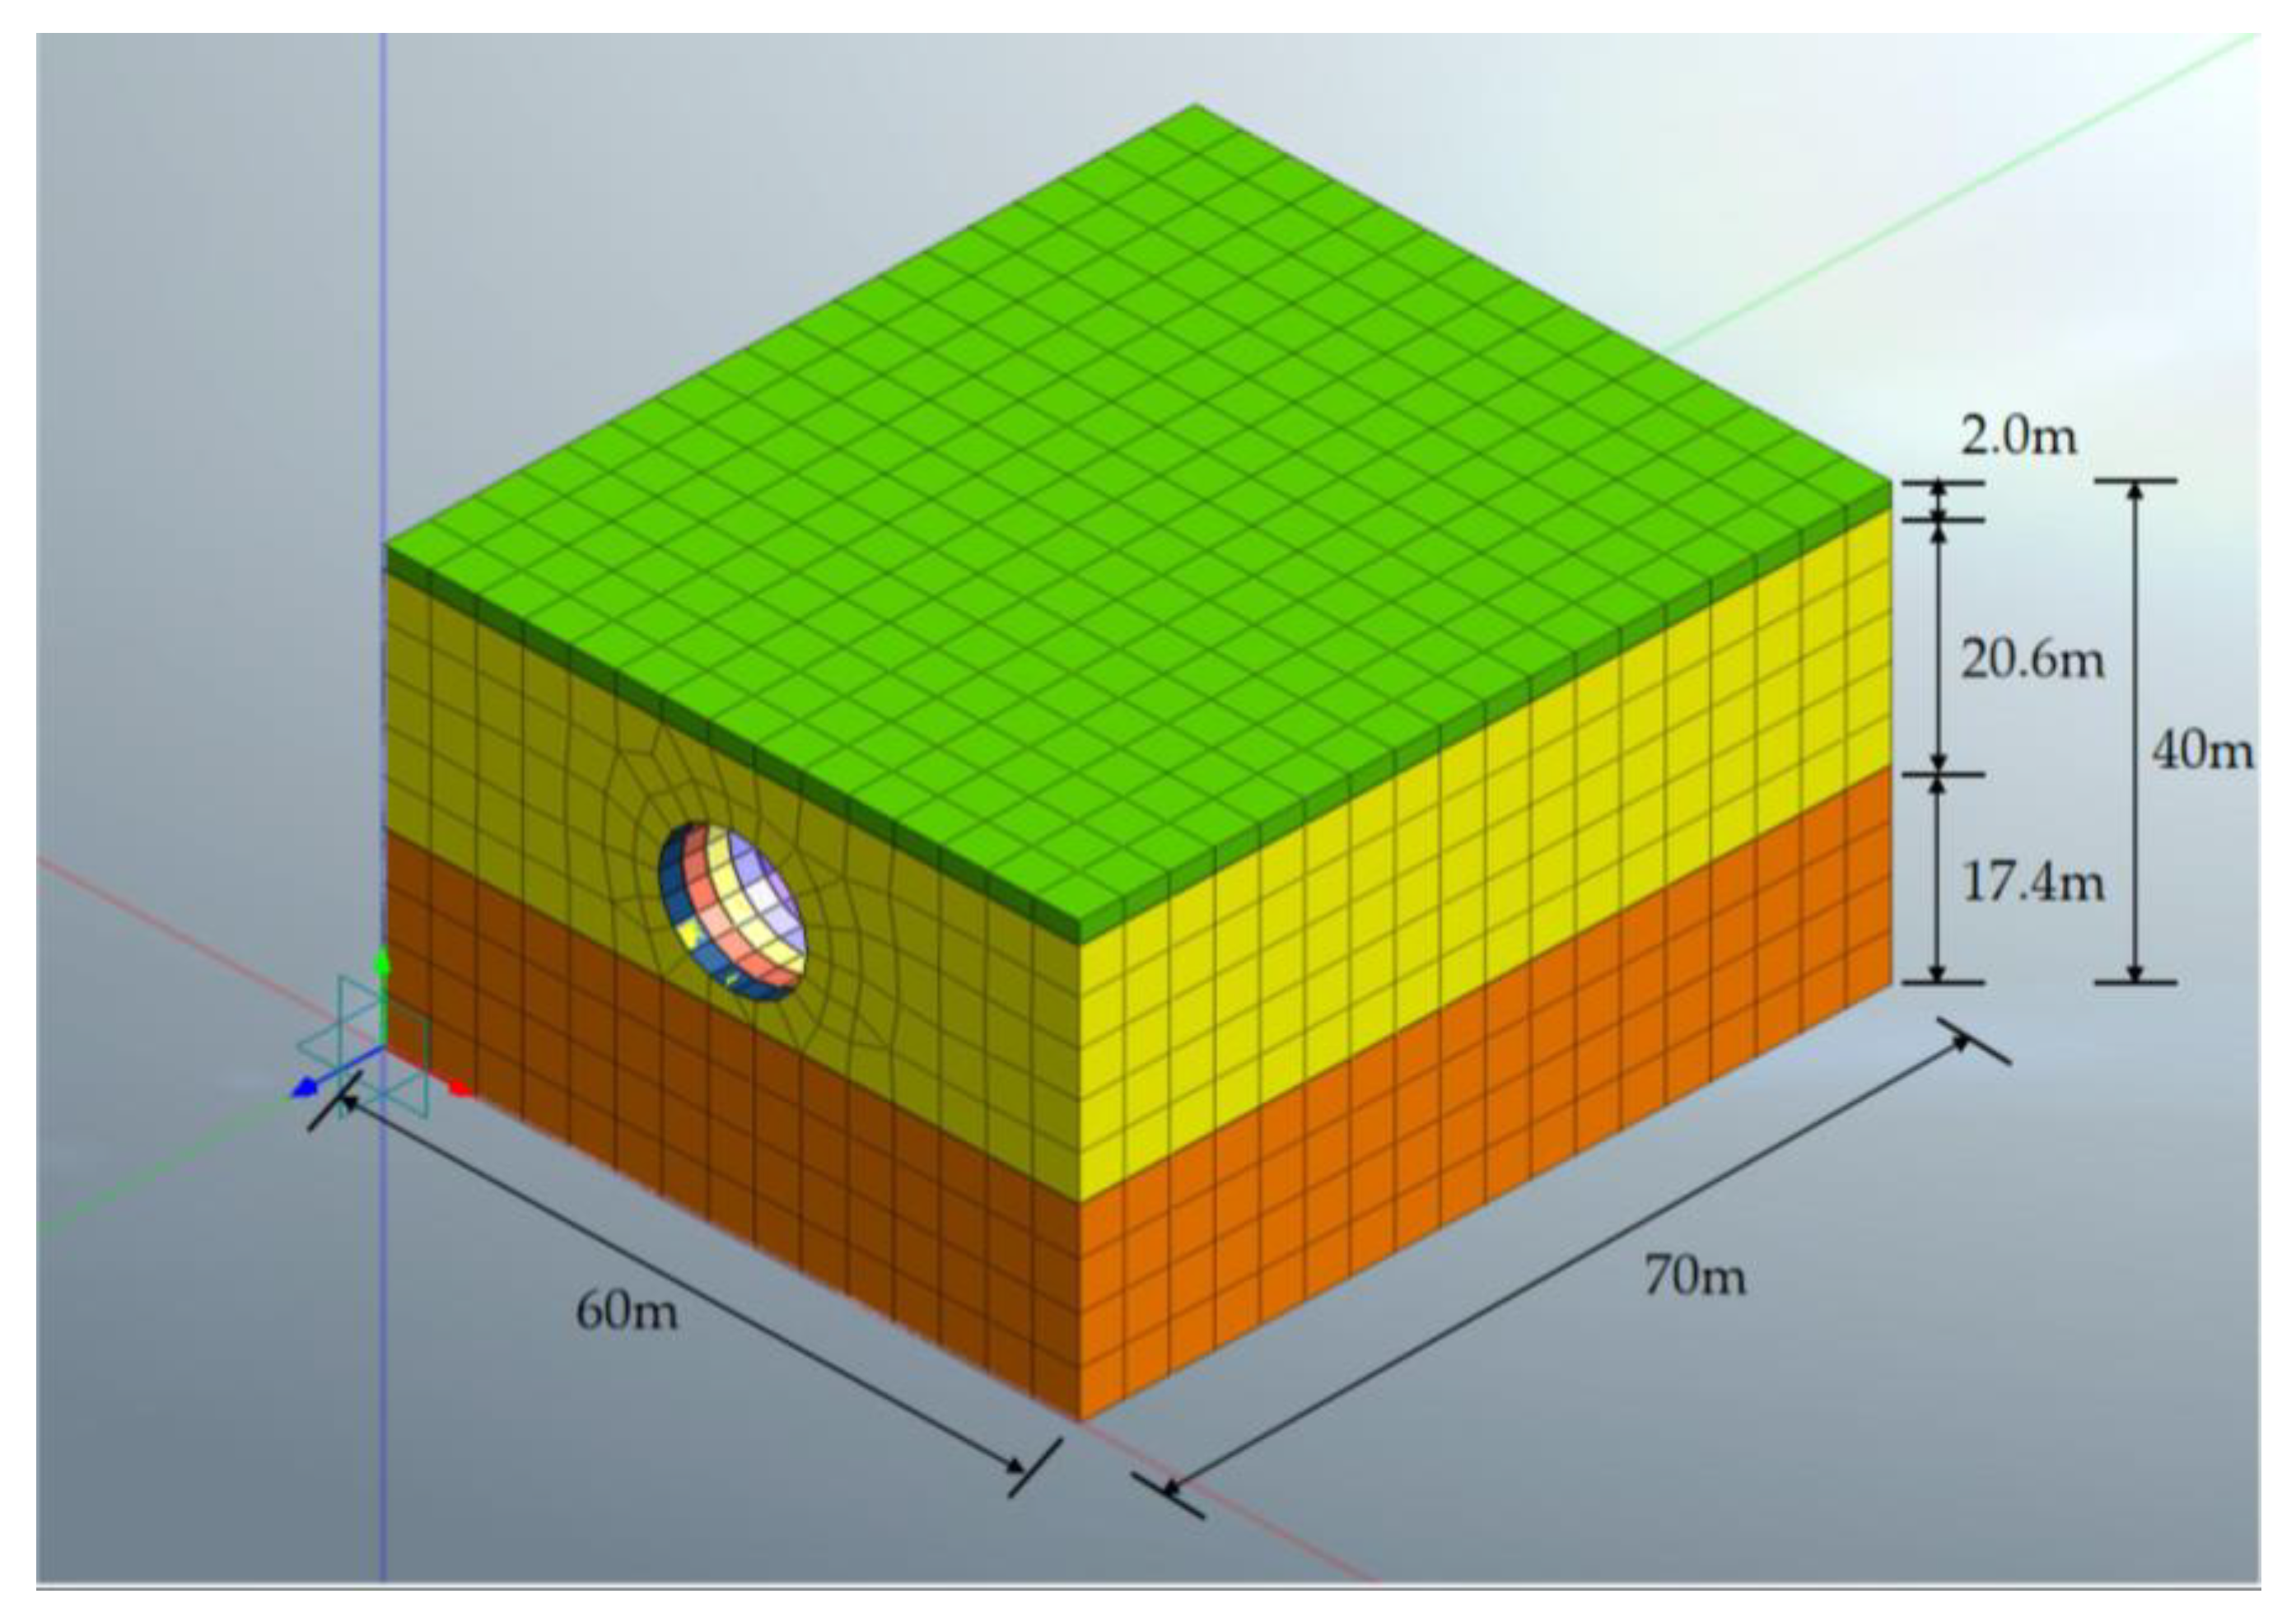
3.1. Model and Boundary Conditions

The size of the soil mode is of high significance because an oversized model would sharply increase the calculation work load, and an undersized model might cause a boundary effect. According to engineering practice and the related literature [1], the later influence range of soil induced by tunnel excavation is about three times the diameter, and the longitudinal influence range is three–five times the tunnel diameter at both sides of the excavation face. A preliminary trail calculation was carried out to evaluate the accuracy and efficiency of the simulation and revealed that deformation of the soil outside the influence range could be neglected. Taking into account scale and boundary effect [37], the length of the model along the tunnel axis was set as 70 m, about 10 times the tunnel diameter, and the width was set as 60 m, extending approximately 5 times the diameter at both sides, and the height was set as 40 m, about 6 times the diameter. A schematic diagram of the model is shown in Figure 3.
Base on the engineering properties of surrounding soil, a three-dimensional solid element with the constitutive relation of Mohr–Coulomb model was used to simulate soil behavior. The bottom boundary of the model was fixed, lateral boundaries were constrained in normal direction and the top boundary was free [38]. During meshing of the model, computational accuracy was negatively correlated with the efficiency. Taking both accuracy and efficiency into consideration, the size of the mesh generally increased with the distance from tunnel excavation. The size of the mesh near the tunnel was 1 m, and that near the boundary was 4 m. The model had a total of 22,027 elements and 18,002 nodes.

3.2. Simulation Process

Grouping of tail jacks is shown in Figure 4a. Sixteen circumferential jacks with 22 propulsion cylinders were divided in to four groups, and each group had a cylinder with a built-in displacement sensor. During excavation of the curved tunnel, the thrust of groups B and D were equal and turning of the shield was implemented by adjustment of the thrust of groups A and C. In this model, thrust on the tail was divided into two groups by vertical center line to simulate unbalanced thrust during excavation of a tunnel of small radius and shown in Figure 4b.
In order to maintain the stability of the tunnel face, it is necessary to exert sufficient pressure according to geological conditions. In this simulation, a uniform pressure of 0.15 MPa according to earth pressure at rest was applied on the tunnel face. During shield excavation, synchronous tail grouting was a significant method to control surface deformation. Excessive grouting pressure might lead to leakage and a decrease in filling ratio, or displacement and damage of segments and surrounding soil, whereas insufficient grouting pressure could not effectively fill tail void, which would cause excessive surface settlement. Grouting pressure was determined by monitoring data of surface settlement and similar engineering experiences and adjusted with excavation. Shield tail void, filling range of tail grouting and disturbance range of tunnel excavation were generalized as a homogeneous, isopachous and elastic equivalent circular layer [39]. In simulation, segments and shell of shield were generally considered as a homogeneous ring around the tunnel [40]. With the advance of shield excavation, solidification of the grouting layer was simulated by variation of elastic modulus. After solidification, elastic modulus of grouting layer was 10 times that before [41]. Physical and mechanical parameters of materials are listed in Table 3.

4. Field Monitoring Data and Model Validation

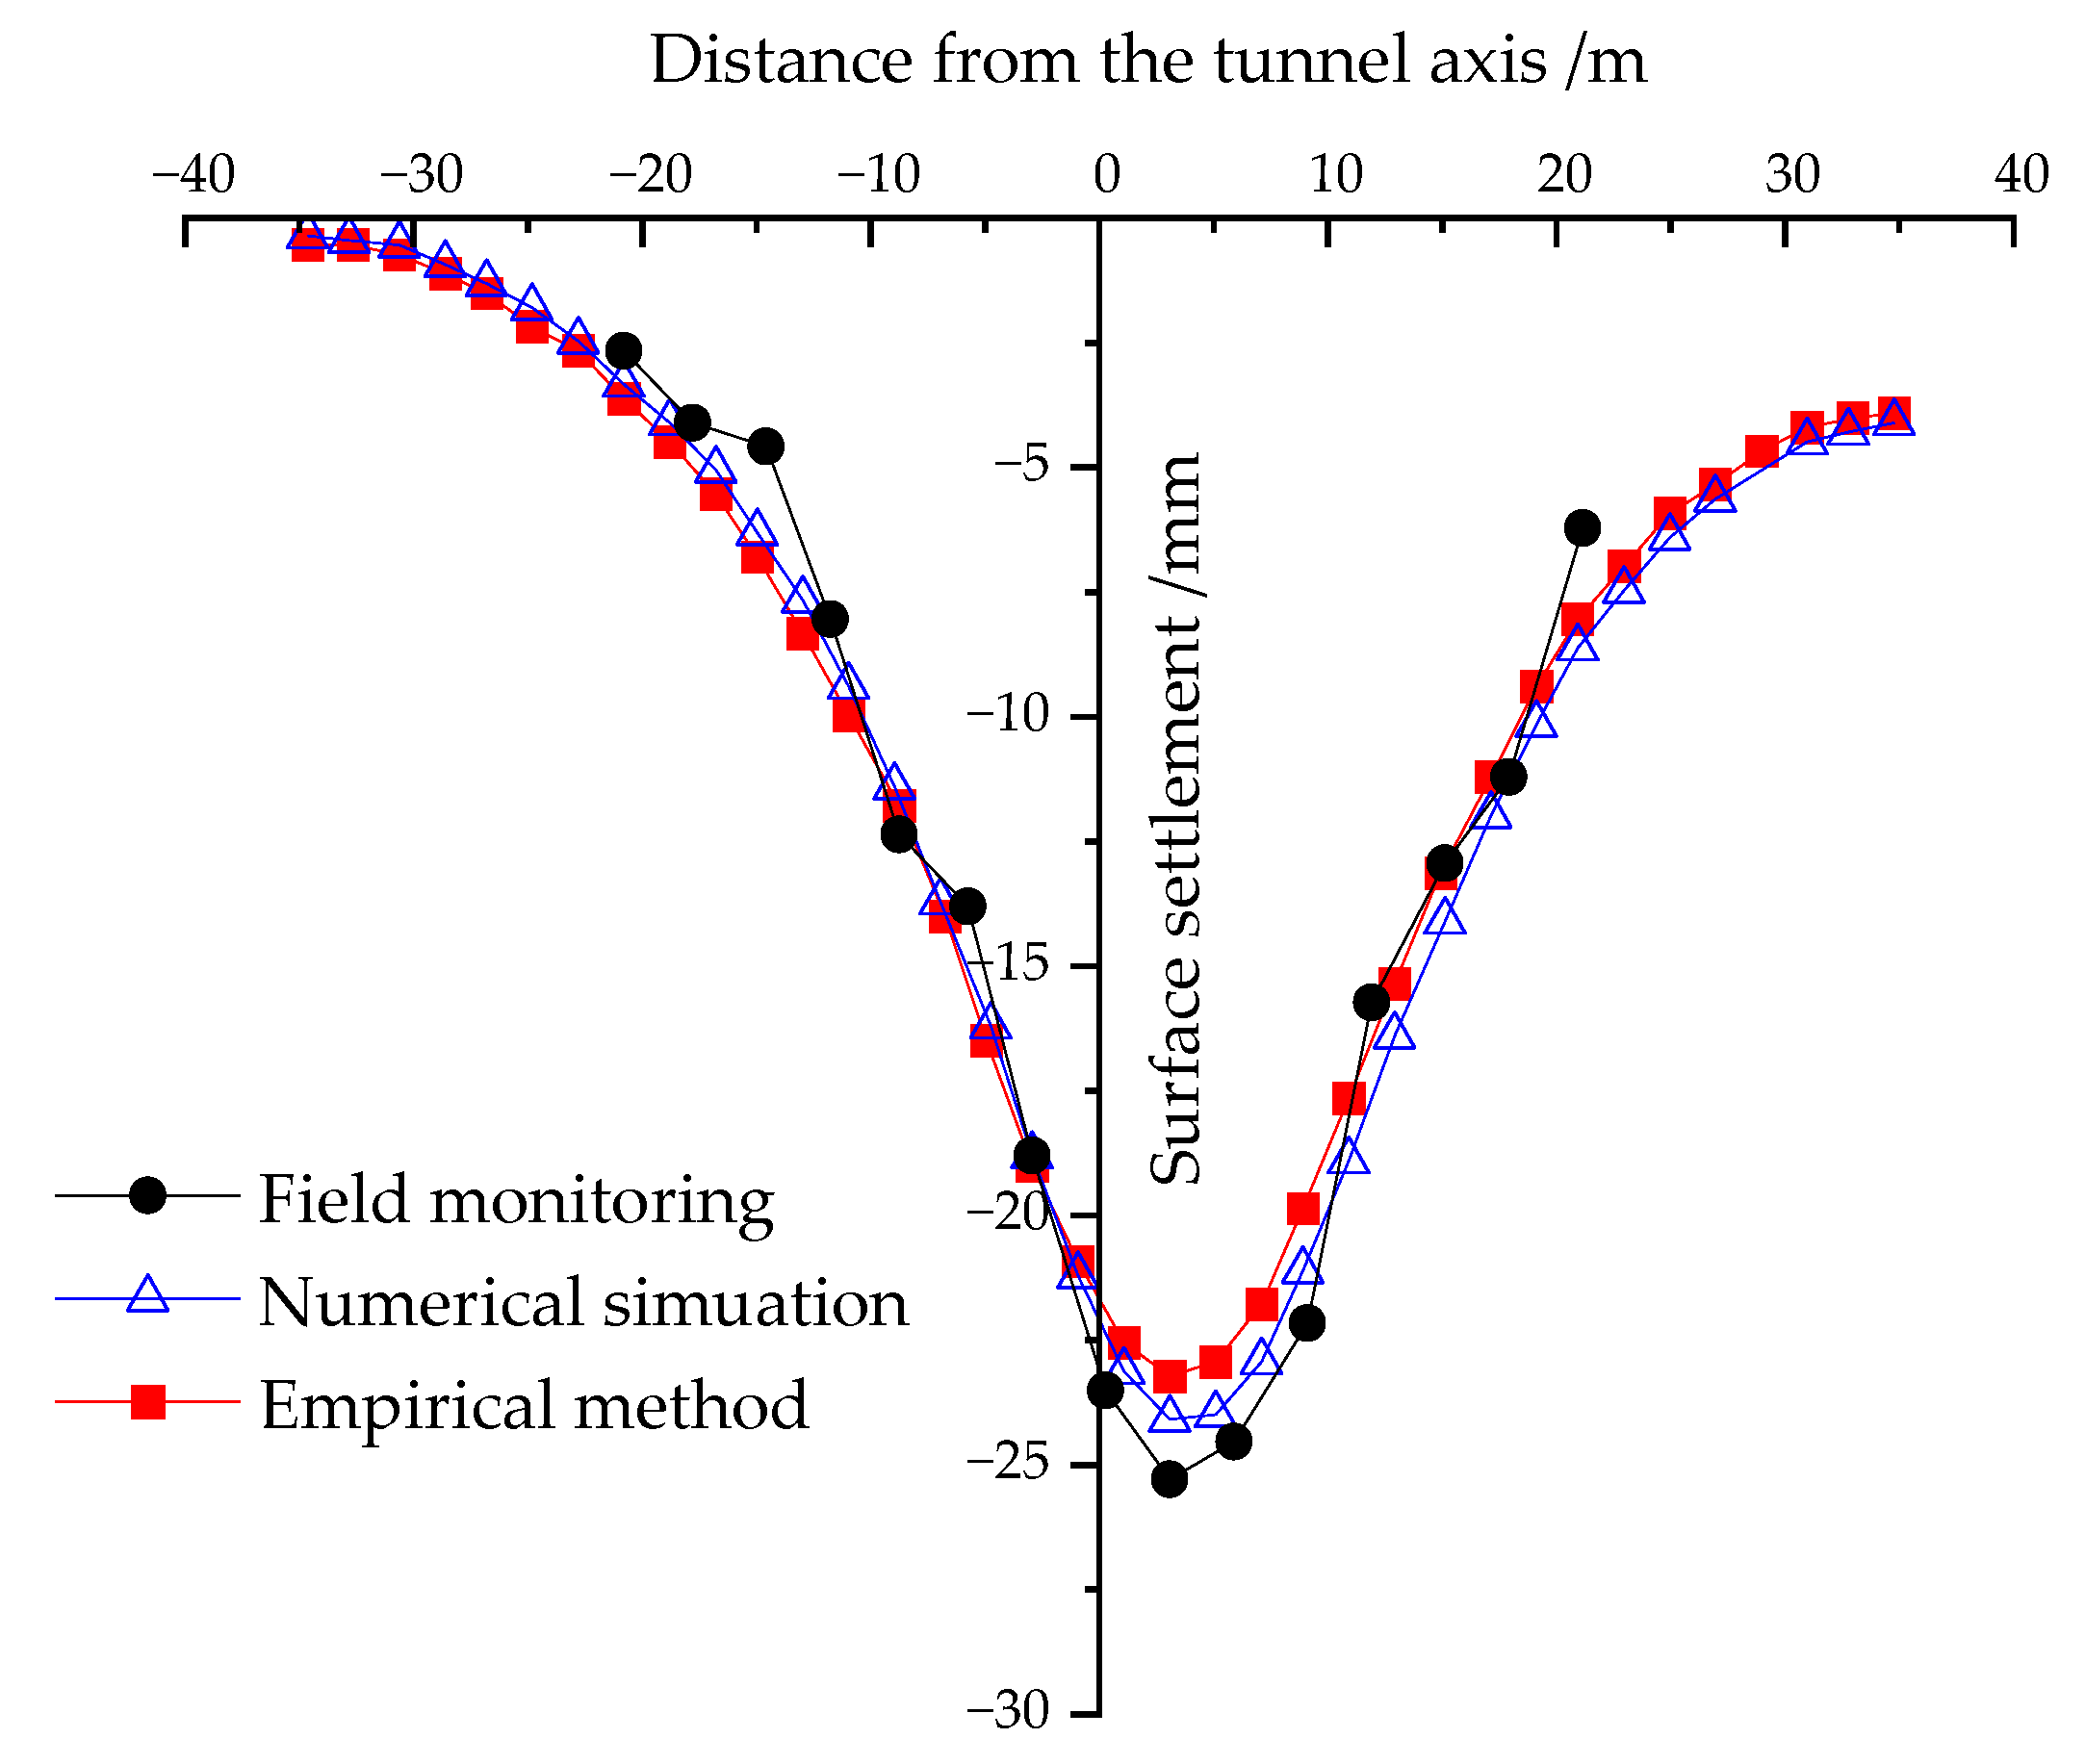
4.1. Surface Settlement

The validity of the numerical simulation was verified by comparison with field monitoring data. Results of field monitoring, numerical simulation and modified Peck formula [31] are shown in Figure 5. In this figure and hereafter, figures with abscissas represent distance from the tunnel axis, a negative abscissa indicates the outer side of the curved tunnel axis, while a positive value indicates the inner side of the tunnel. According to monitoring data, geometry of sediment trough on cross section is approximately the normal Gaussian distribution. The maximum surface settlement caused was directly above the tunnel axis for the straight line tunnel. Offset of maximum surface settlement towards the inside of the curved tunnel axis could be observed, which might be attributed to over excavation at the inner side of the curved tunnel and unbalanced thrust exerted at both sides of the tail [42]. Different from straight line tunnels, surface settlement trough of a curved tunnel is not symmetrical to the axis and the position of maximum settlement is on the inner side of tunnel. The comparison reveals that simulation results were similar to, whereas not completely consistent with, the field monitoring data. In spite of certain errors of the 15 monitoring points, the error range was acceptable and the model was reasonable in consideration of the simplification of soil condition during simulation. The maximum value of surface settlement of the simulation was 24.08 mm and monitoring data was 25.29 mm, with a small difference of 1.21 mm. This difference might be attributed to a measuring error of the instrument and adjustment of excavation parameters to accommodate inhomogeneous geological conditions [16]. On the whole, similar results could verify the validity of the simulation in the calculation of surface settlement induced by shield excavation of a small radius curved tunnel.
In addition, an empirical formula method could also be used to calculate surface settlement caused by shield excavation. The Peck formula is based on straight line tunnels, taking no account of the offset of settlement trough caused by curved shield tunneling, and needs to be modified. A modified formula, considering over excavation, compaction of shell on surrounding soil and unbalanced thrust during shield advances through clayey stratum, is shown in Equation (1):
S x = α S m a x e x p x ξ 2 2 β i 2
where S(x) is the surface settlement at the distance of x from tunnel axis on the cross section; Smax is the maximum value of surface settlement; α is the correction factor of Smax and ranges from 0.46 to 0.52 in clayey stratum; ξ is the offset value of sediment of a curved shield tunnel determined by the curvature radius of shield tunnel; i is the coefficient of width of settlement trough, namely the distance between the inflection point of the settlement curve and tunnel axis; β is the correction factor of i and ranges from 0.43 to 1.16 in clayey stratum [31]. Based on surface settlement from field monitoring, calculation results of Equation (1) are also shown in Figure 5. In general, the comparison shows that the result of this modified formula is similar with that of both numerical simulation and field monitoring, which further proves the reliability of numerical simulation of surface settlement.

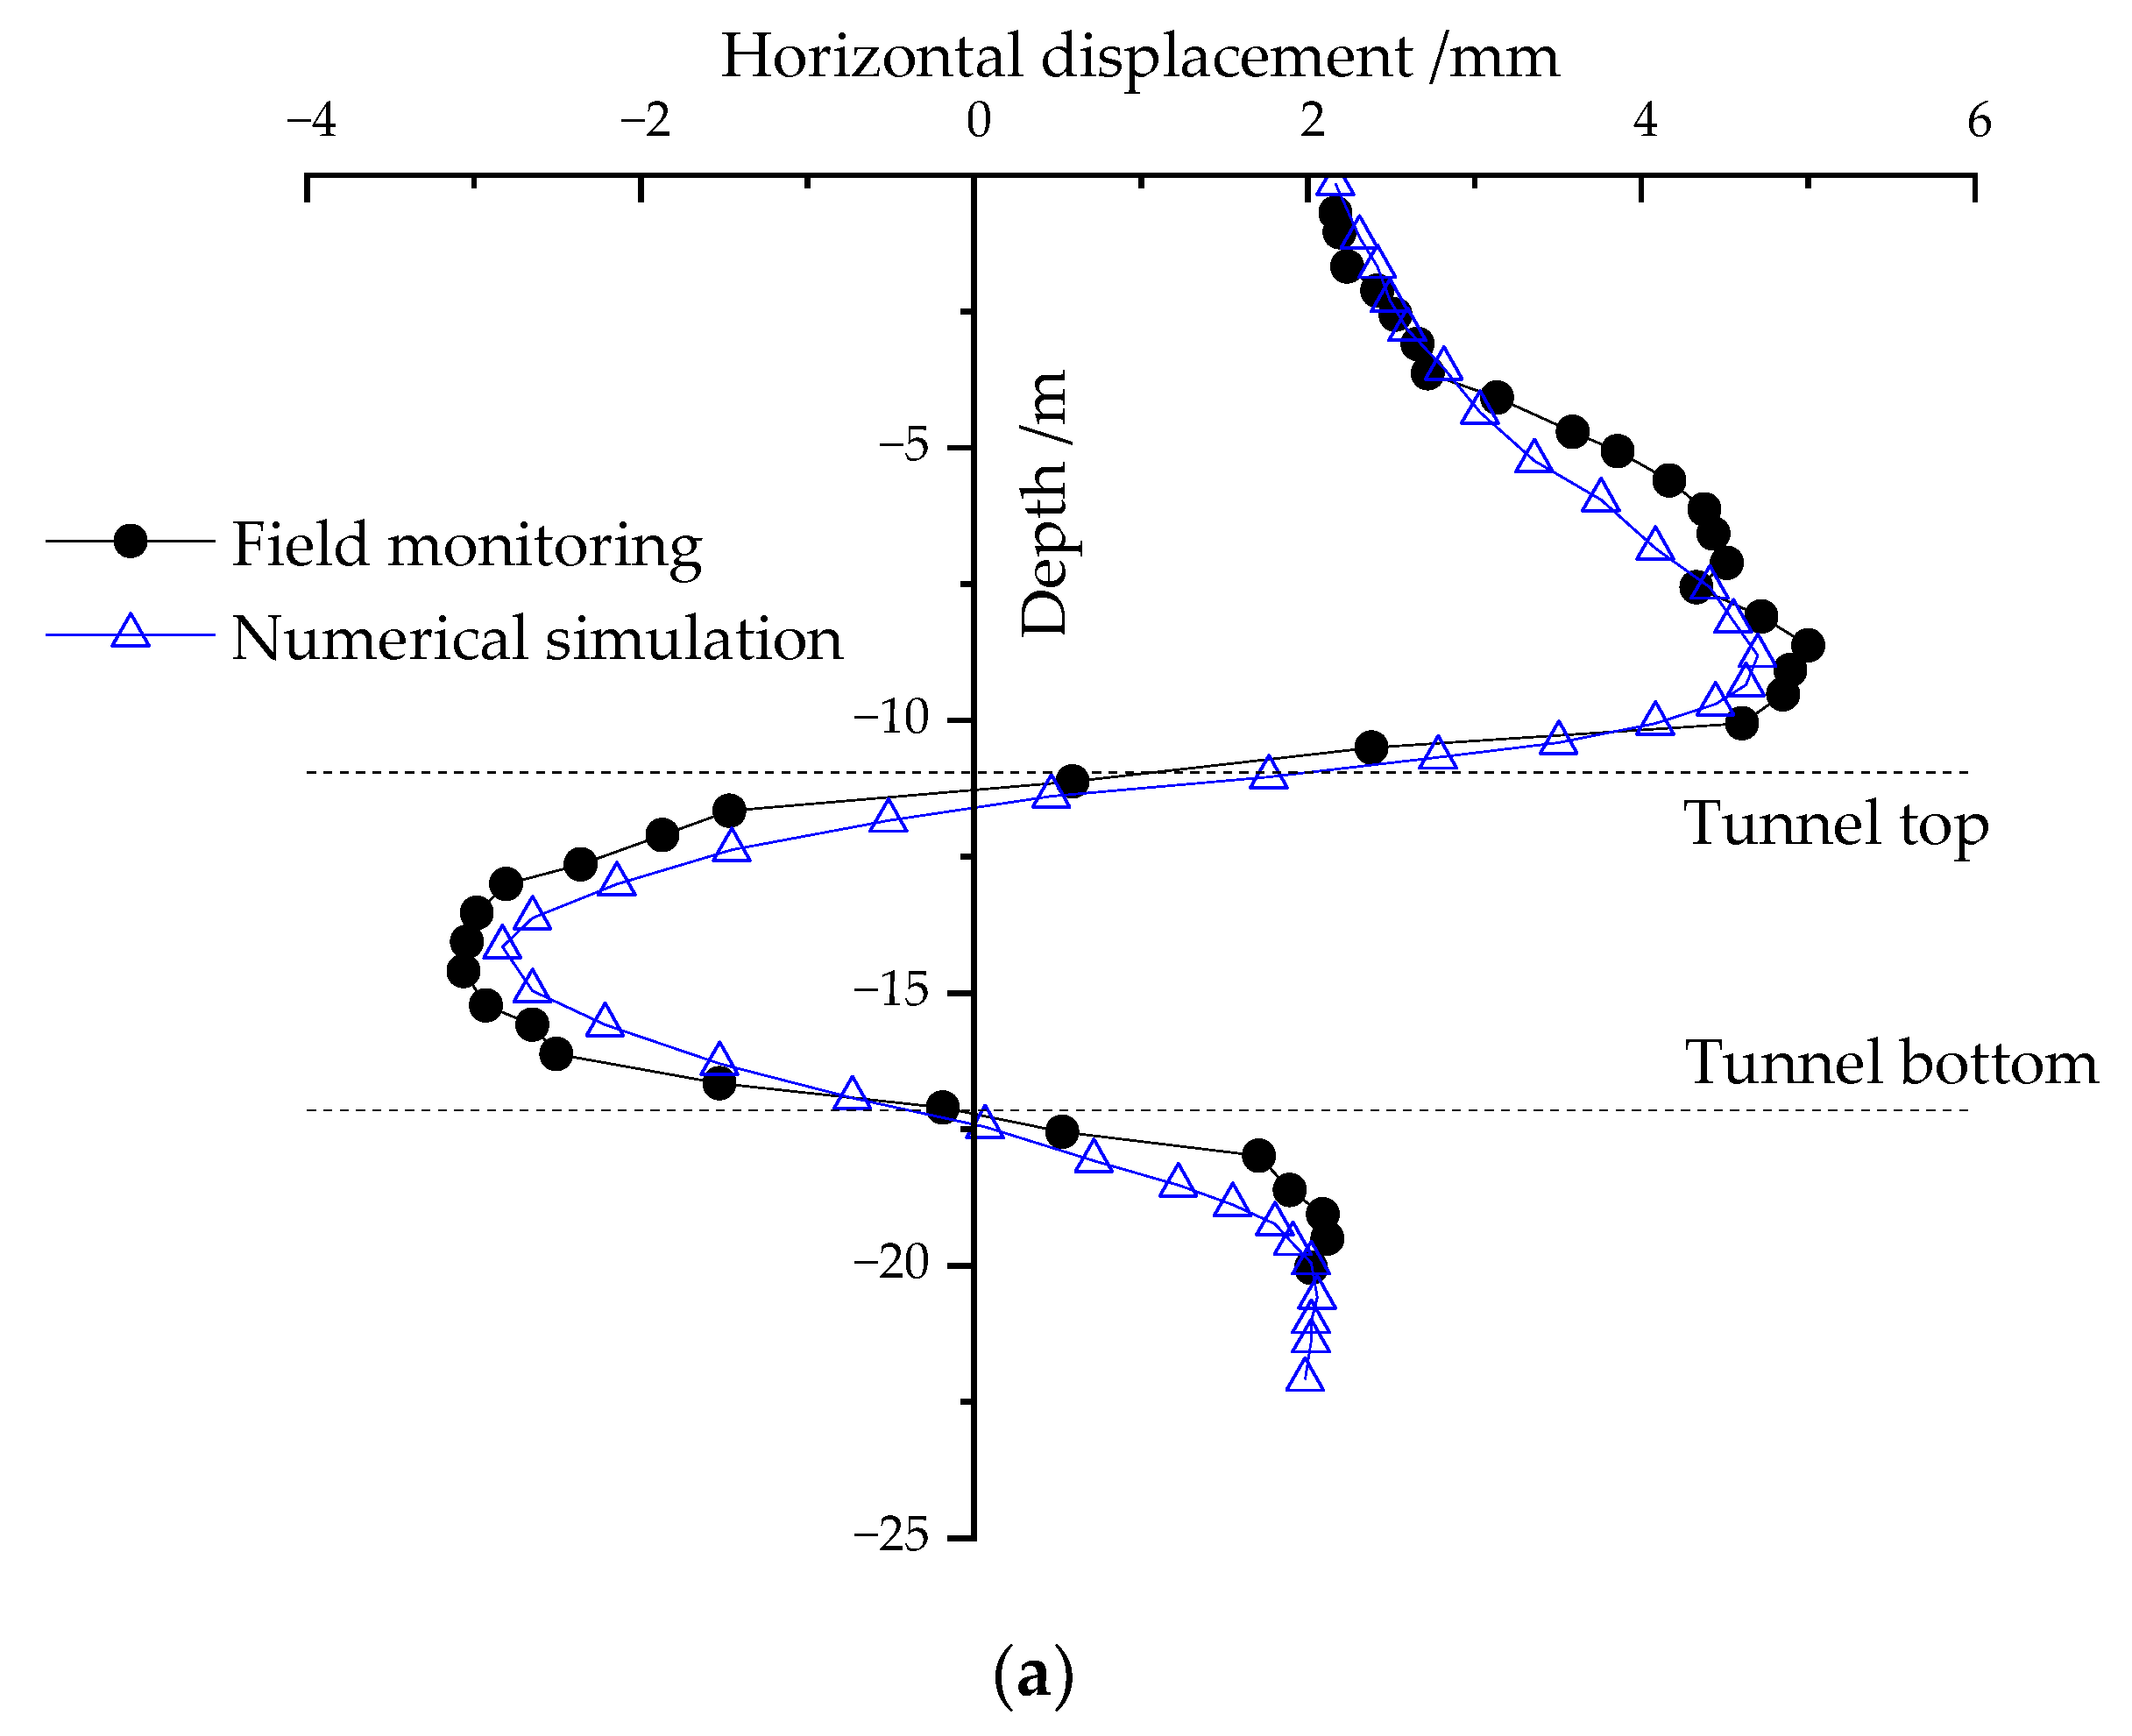
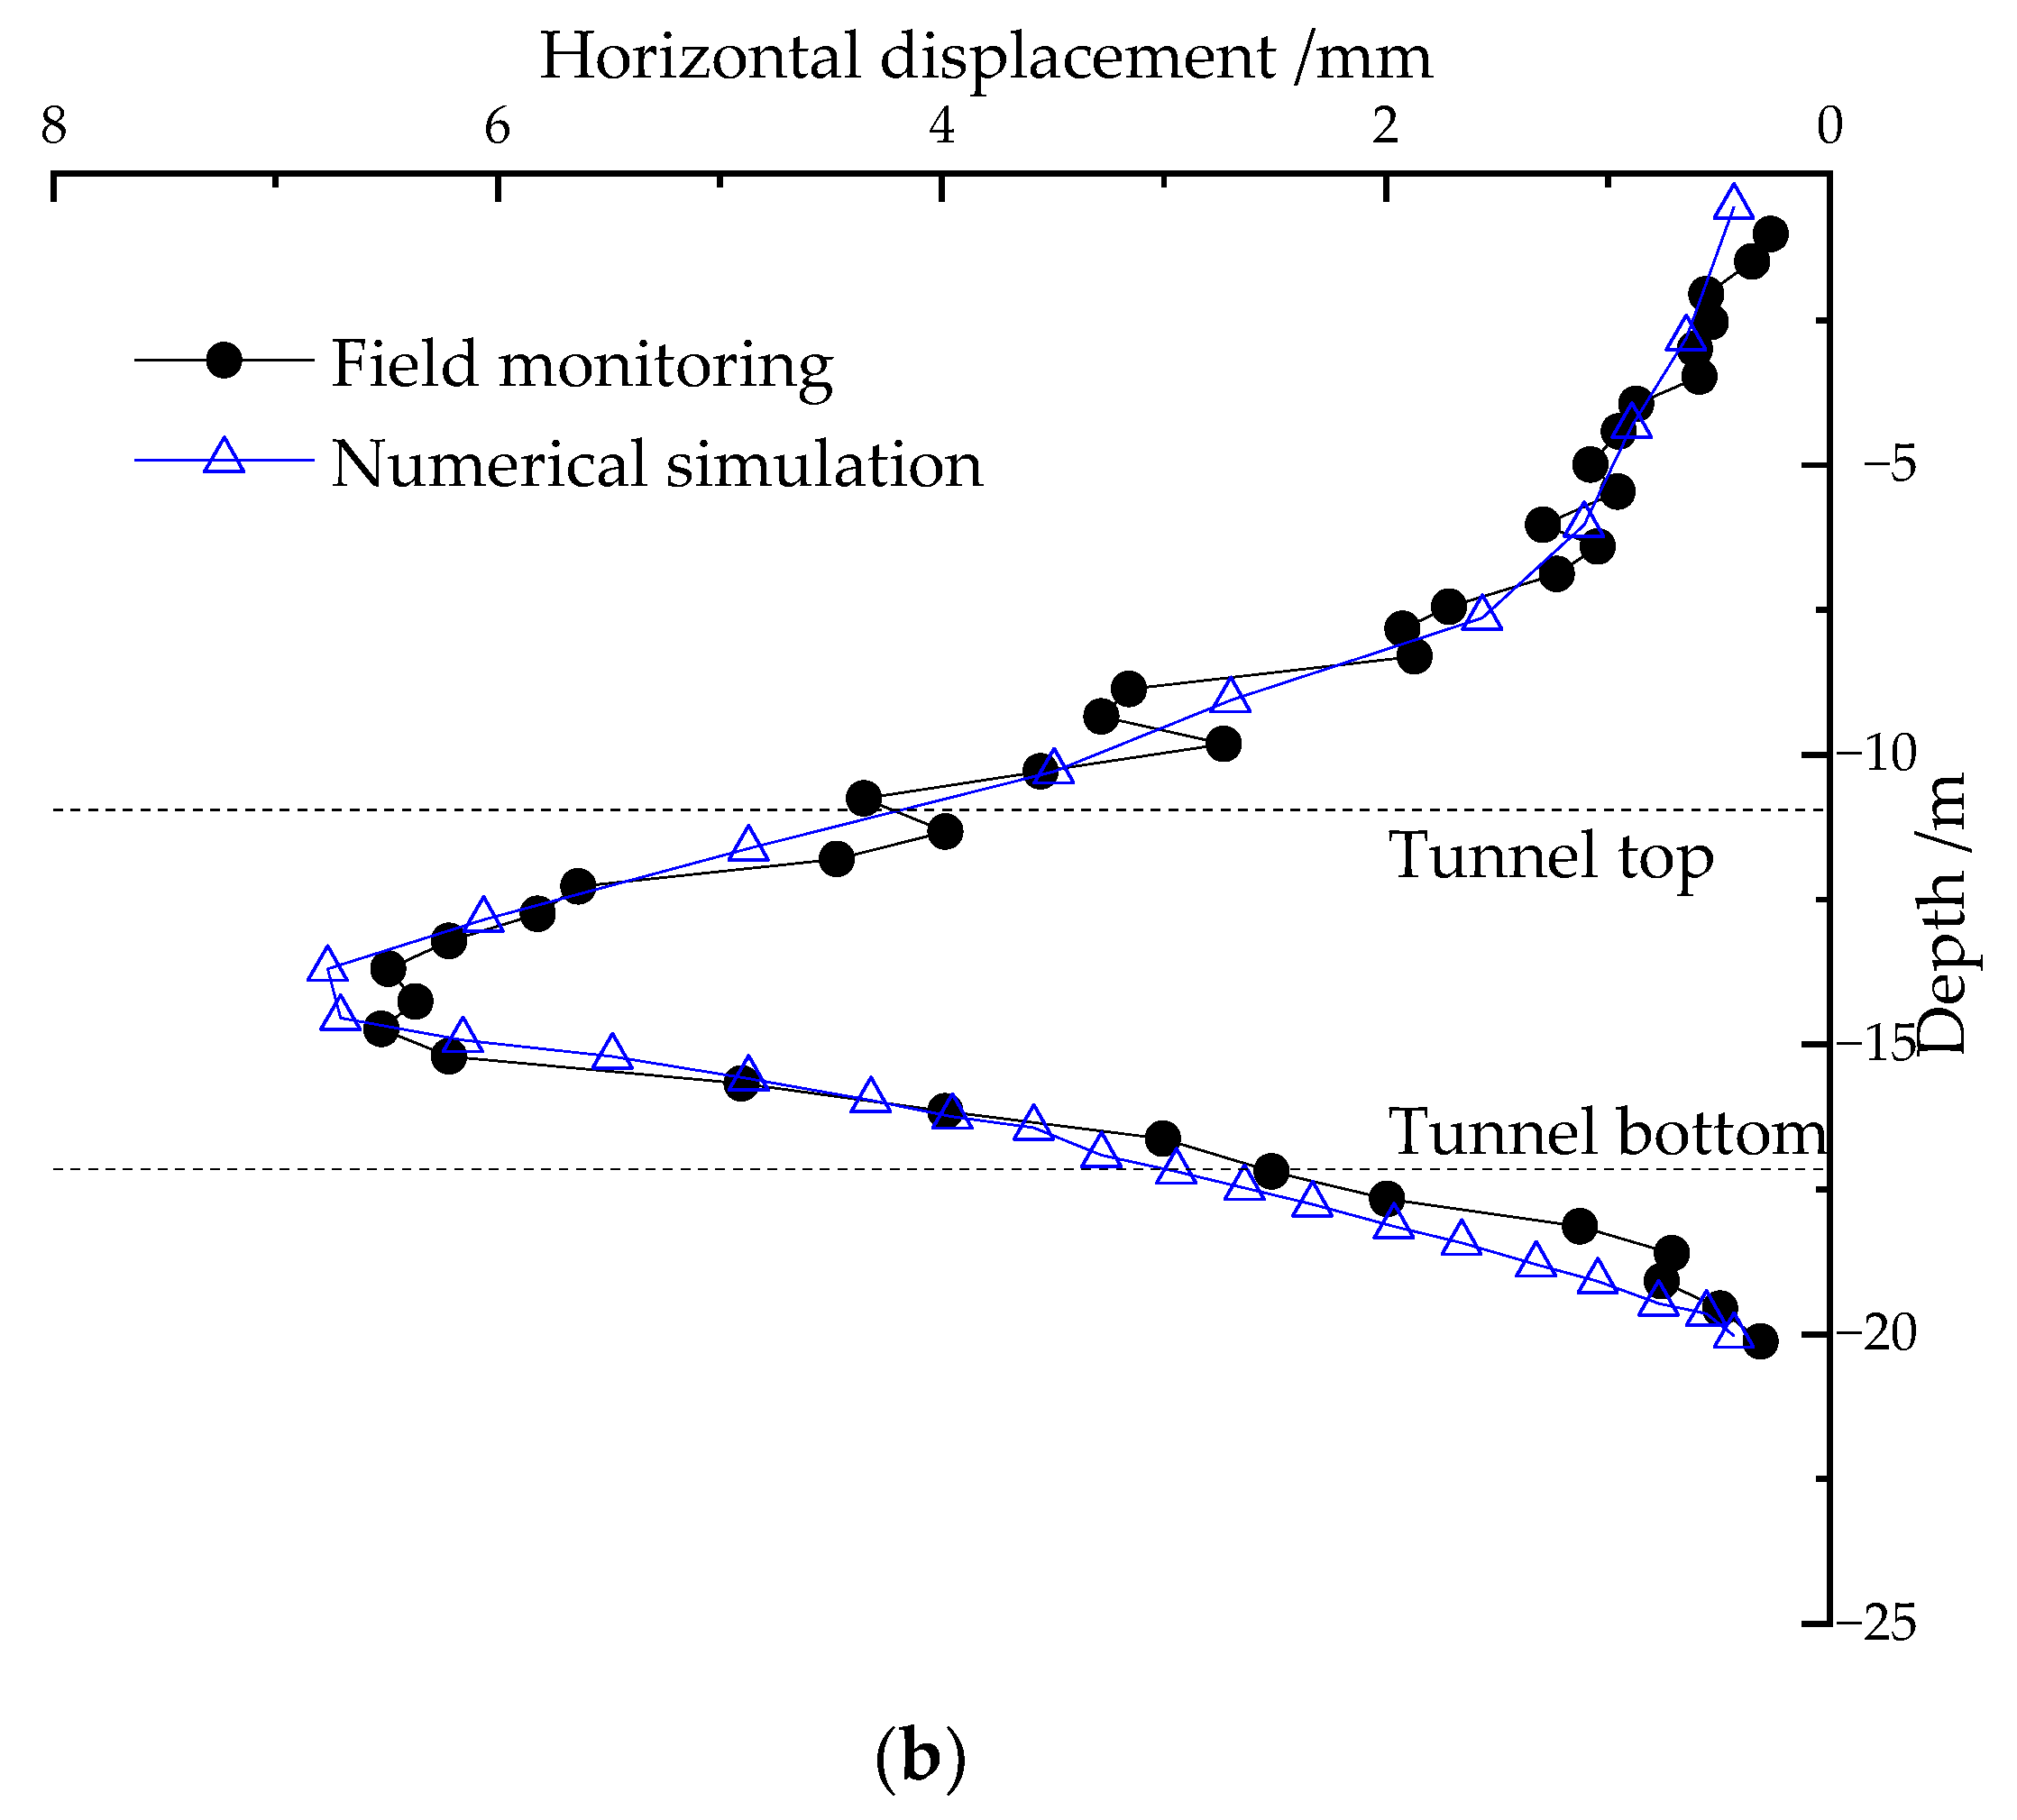
4.2. Horizontal Displacement

Field monitoring data of horizontal displacement at both sides of the tunnel axis are plotted in Figure 6. In this figure and hereafter, figures with abscissas represent horizontal displacement, a positive abscissa indicates displacement towards the tunnel axis, while a negative value indicates displacement away from the tunnel axis. As shown in Figure 6a, the curve of horizontal displacement of soil at the outer side of tunnel axis is approximately an inverted “S” shape, and could be divided into three sections by top and bottom of the tunnel. Horizontal displacement of soil above the tunnel top is towards the tunnel due to ground loss from shield excavation. The maximum displacement was 5.01 mm, with a depth of 8.62 m and a vertical distance of 2.28 m to tunnel top. Horizontal displacement of soil between the top and bottom is away from the tunnel axis because of compaction by shield turning. The maximum displacement was −3.06 mm with a depth of 14.6 m and a vertical distance of 0.6 m to the tunnel axis. Horizontal displacement of soil below the tunnel bottom, with a relatively small value ranging from −0.19 to 2.09 mm, is mainly towards the tunnel axis caused by unloading rebound after excavation.
As shown in Figure 6b, horizontal displacement of soil at the inner side of the tunnel axis is away from the tunnel axis, and obvious displacement can be found at the vertical range of tunnel excavation. The maximum displacement was −6.71 mm with a depth of 14.54 m and a vertical distance of 0.54 m to the tunnel axis. Horizontal displacements of soil above tunnel and below tunnel bottom generally decreased with the vertical distance to tunnel excavation.
Results of numerical simulation of horizontal displacement are also shown in Figure 6. According to comparison, results from the simulation were basically consistent with the monitoring data, which could verify the validity of simulation of horizontal displacement.

5. Influence Analysis of Displacement of Surrounding Soil

In contrast to a straight line tunnel, the most significant characteristics of a small radius curved tunnel is shield turning implemented by over excavation of surrounding soil at the inner side of the axis and controlling the difference of stroke and thrust of tail jacks [43,44]. A single factor analysis method was used to explore influence factors of the displacement of surrounding soil. Based on the offset of surface settlement and dissymmetry of horizontal displacement, tunnel axis, unbalanced thrust, curvature radius and grouting pressure are considered as variables for sensibility analysis in the model.

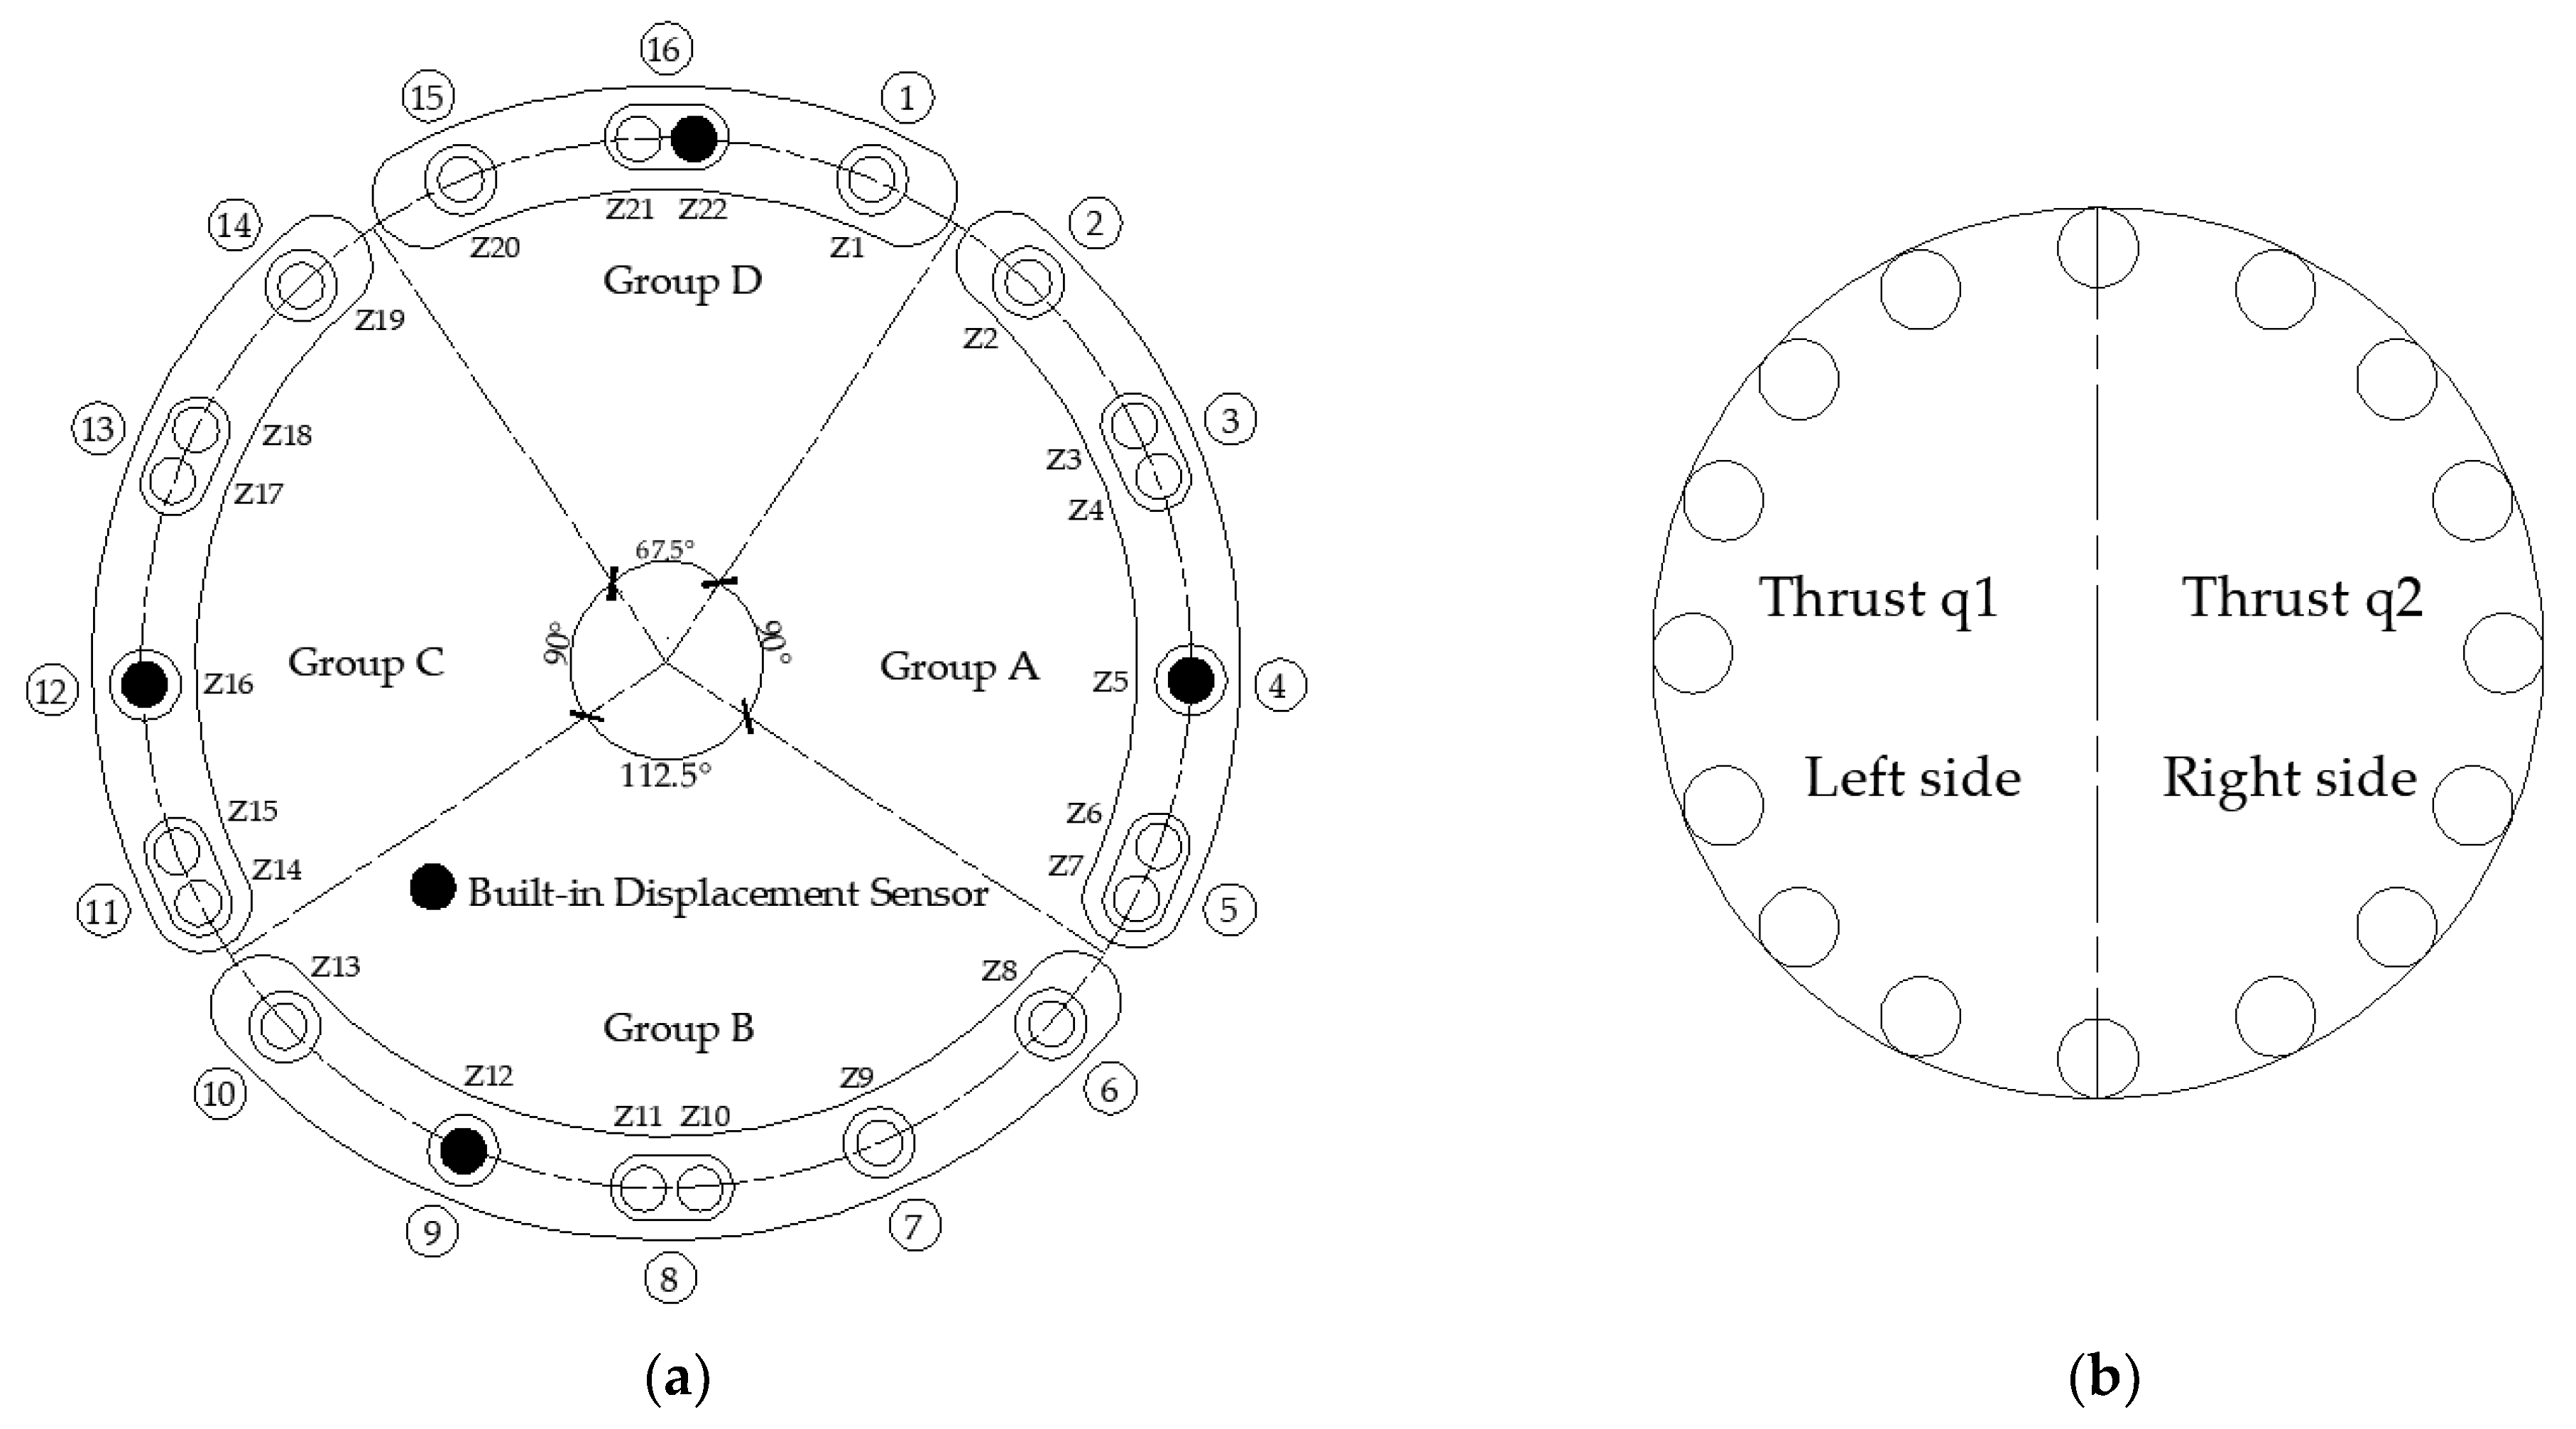
5.1. Influence of Unbalanced Thrust on Displacement of Surrounding Soil

Shield turning during excavation was accomplished by unbalanced thrust of tail jack. As shown in Figure 4b, q1 and q2 represent thrust on the left and right side of the tunnel in the model, respectively. Thrust ratio, defined as q1 over q2, was used for convenience. To assess the influence of unbalanced thrust on the displacement of surrounding soil, four cases with various thrust ratios were selected. In the four cases, the curvature radius of the tunnel was 300 m and grouting pressure was 0.15 MPa. q1 was 1000 kN, while q2 was 1000 kN, 1500 kN, 2000 kN and 2500 kN and the thrust ratios were 1.0, 1.5, 2.0 and 2.5, respectively.

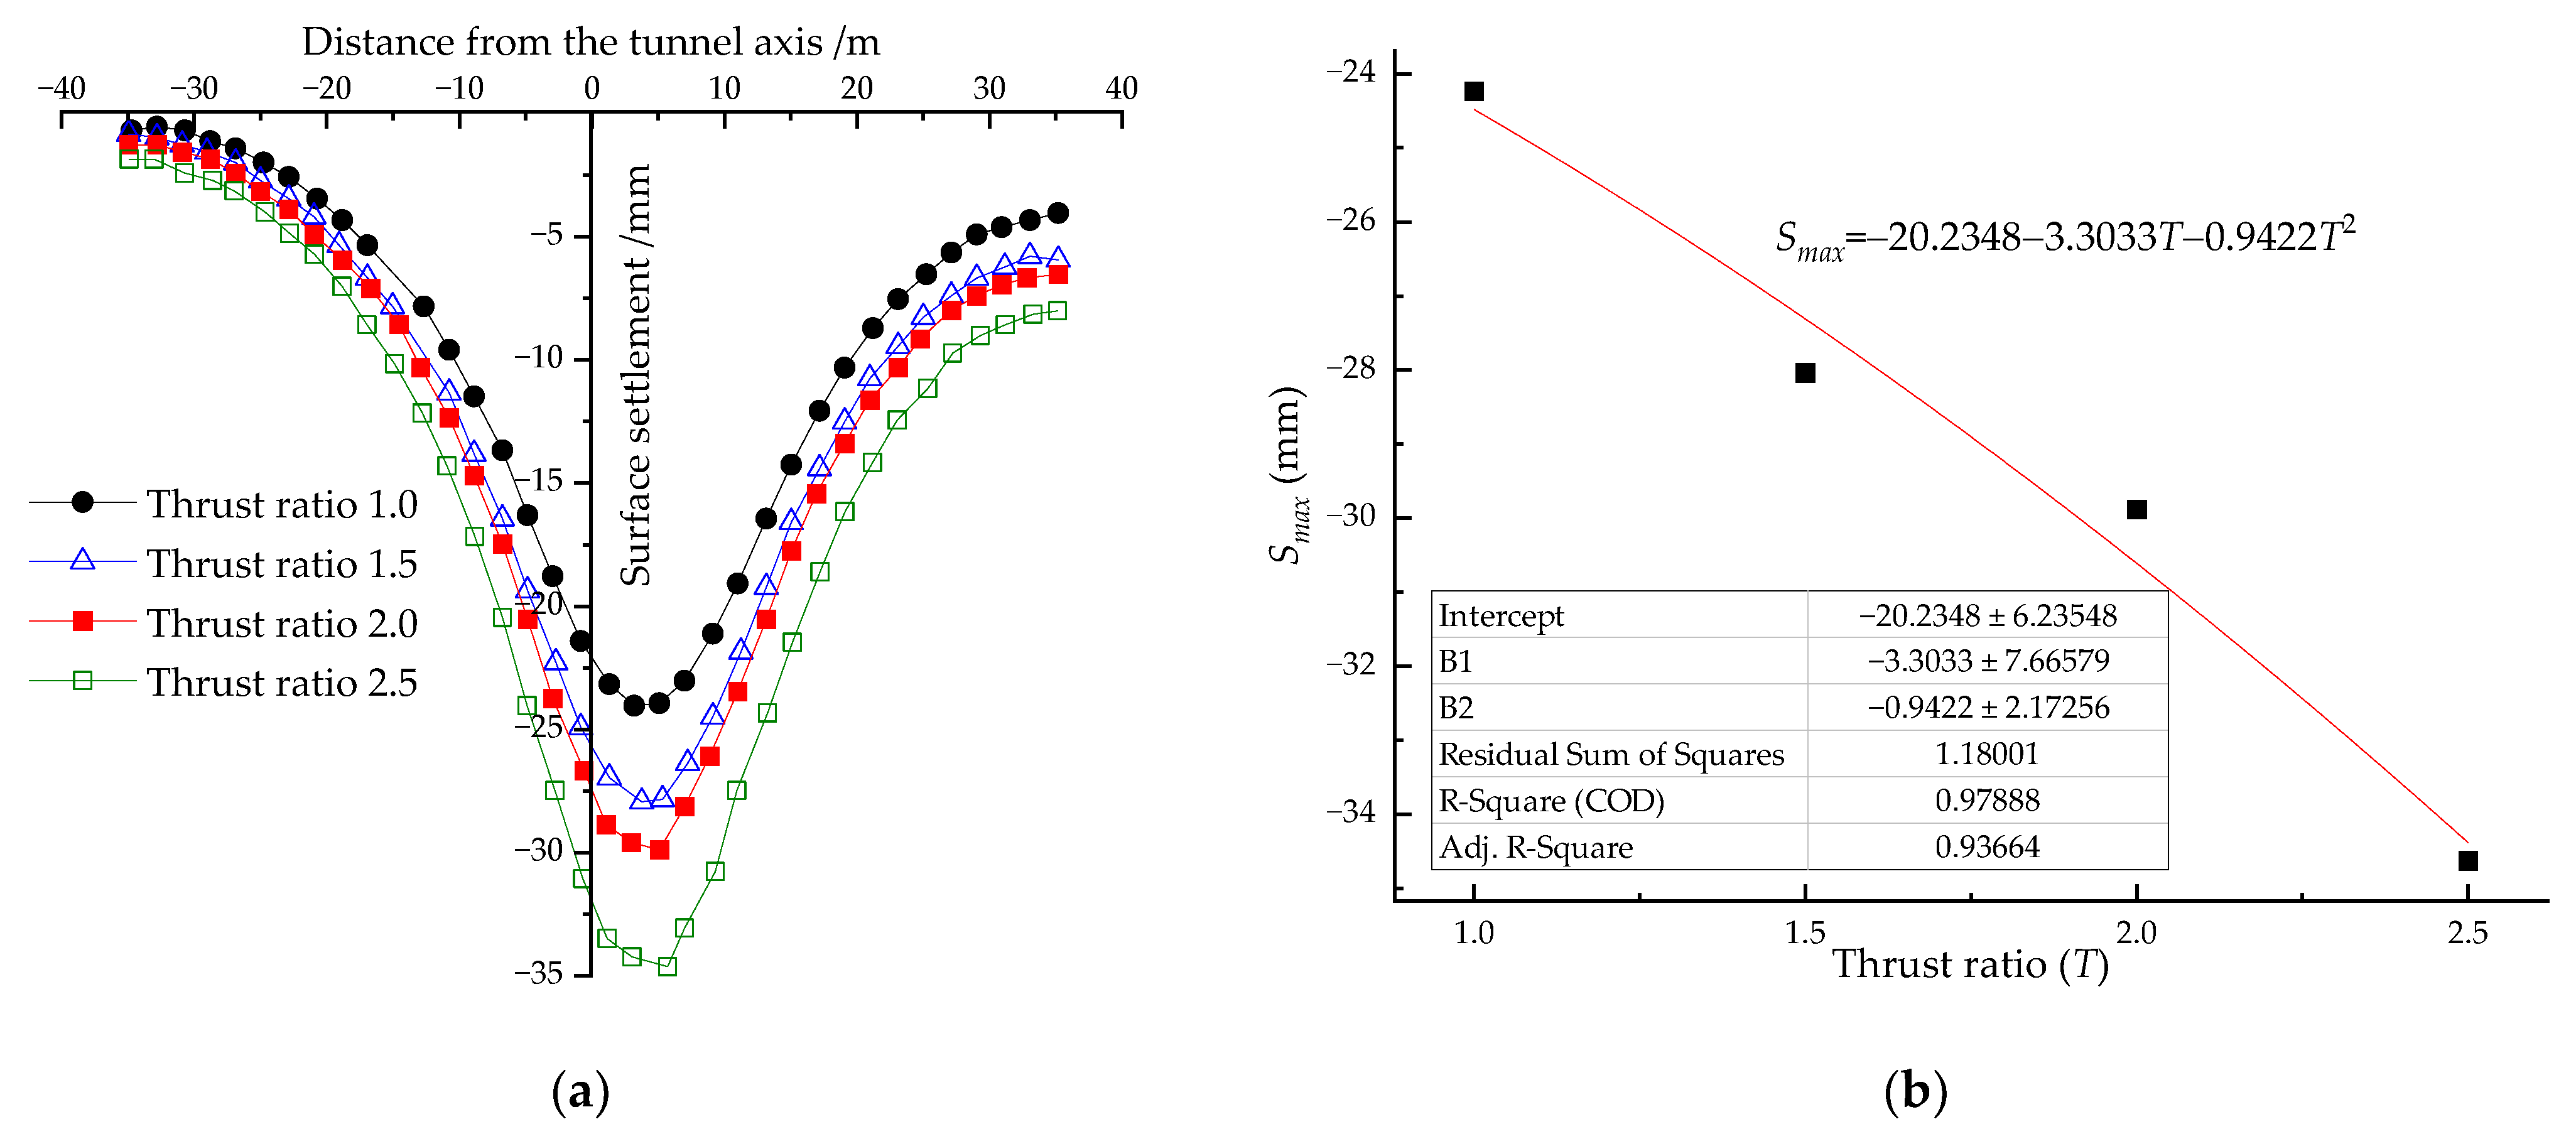
5.1.1. Influence of Unbalanced Thrust on Surface Settlement

Surface settlement curves under the four thrust ratios are shown in Figure 7a. It can be seen from Figure 7a that settlement troughs were asymmetrical about tunnel axis and maximum values of settlement offsets inside of tunnel axis. For the four aforementioned thrust ratios, corresponding maximum settlements were −24.08 mm, −27.93 mm, −29.88 mm and −34.61 mm, with an absolute value increment of 43.7%. Meanwhile, offsets of maximum settlement points were 3.19 m, 3.75 m, 5.09 m and 5.71 m and maximum value was 1.8 times that of the minimum.
Figure 7b shows the negative relationship between maximum surface settlement and thrust ratio. The functional relationship can be obtained by fitting as follows:
S m a x = 20.2348 3.3033 T 0.9422 T 2
where Smax is maximum surface settlement and T is thrust ratio.
The obvious increase might be attributed to intensive uneven thrust distribution and over excavation of soil at the inner side of tunnel [29]. Therefore, it is necessary to precisely control thrust on tail to avoid excessive surface settlement during shield advances.

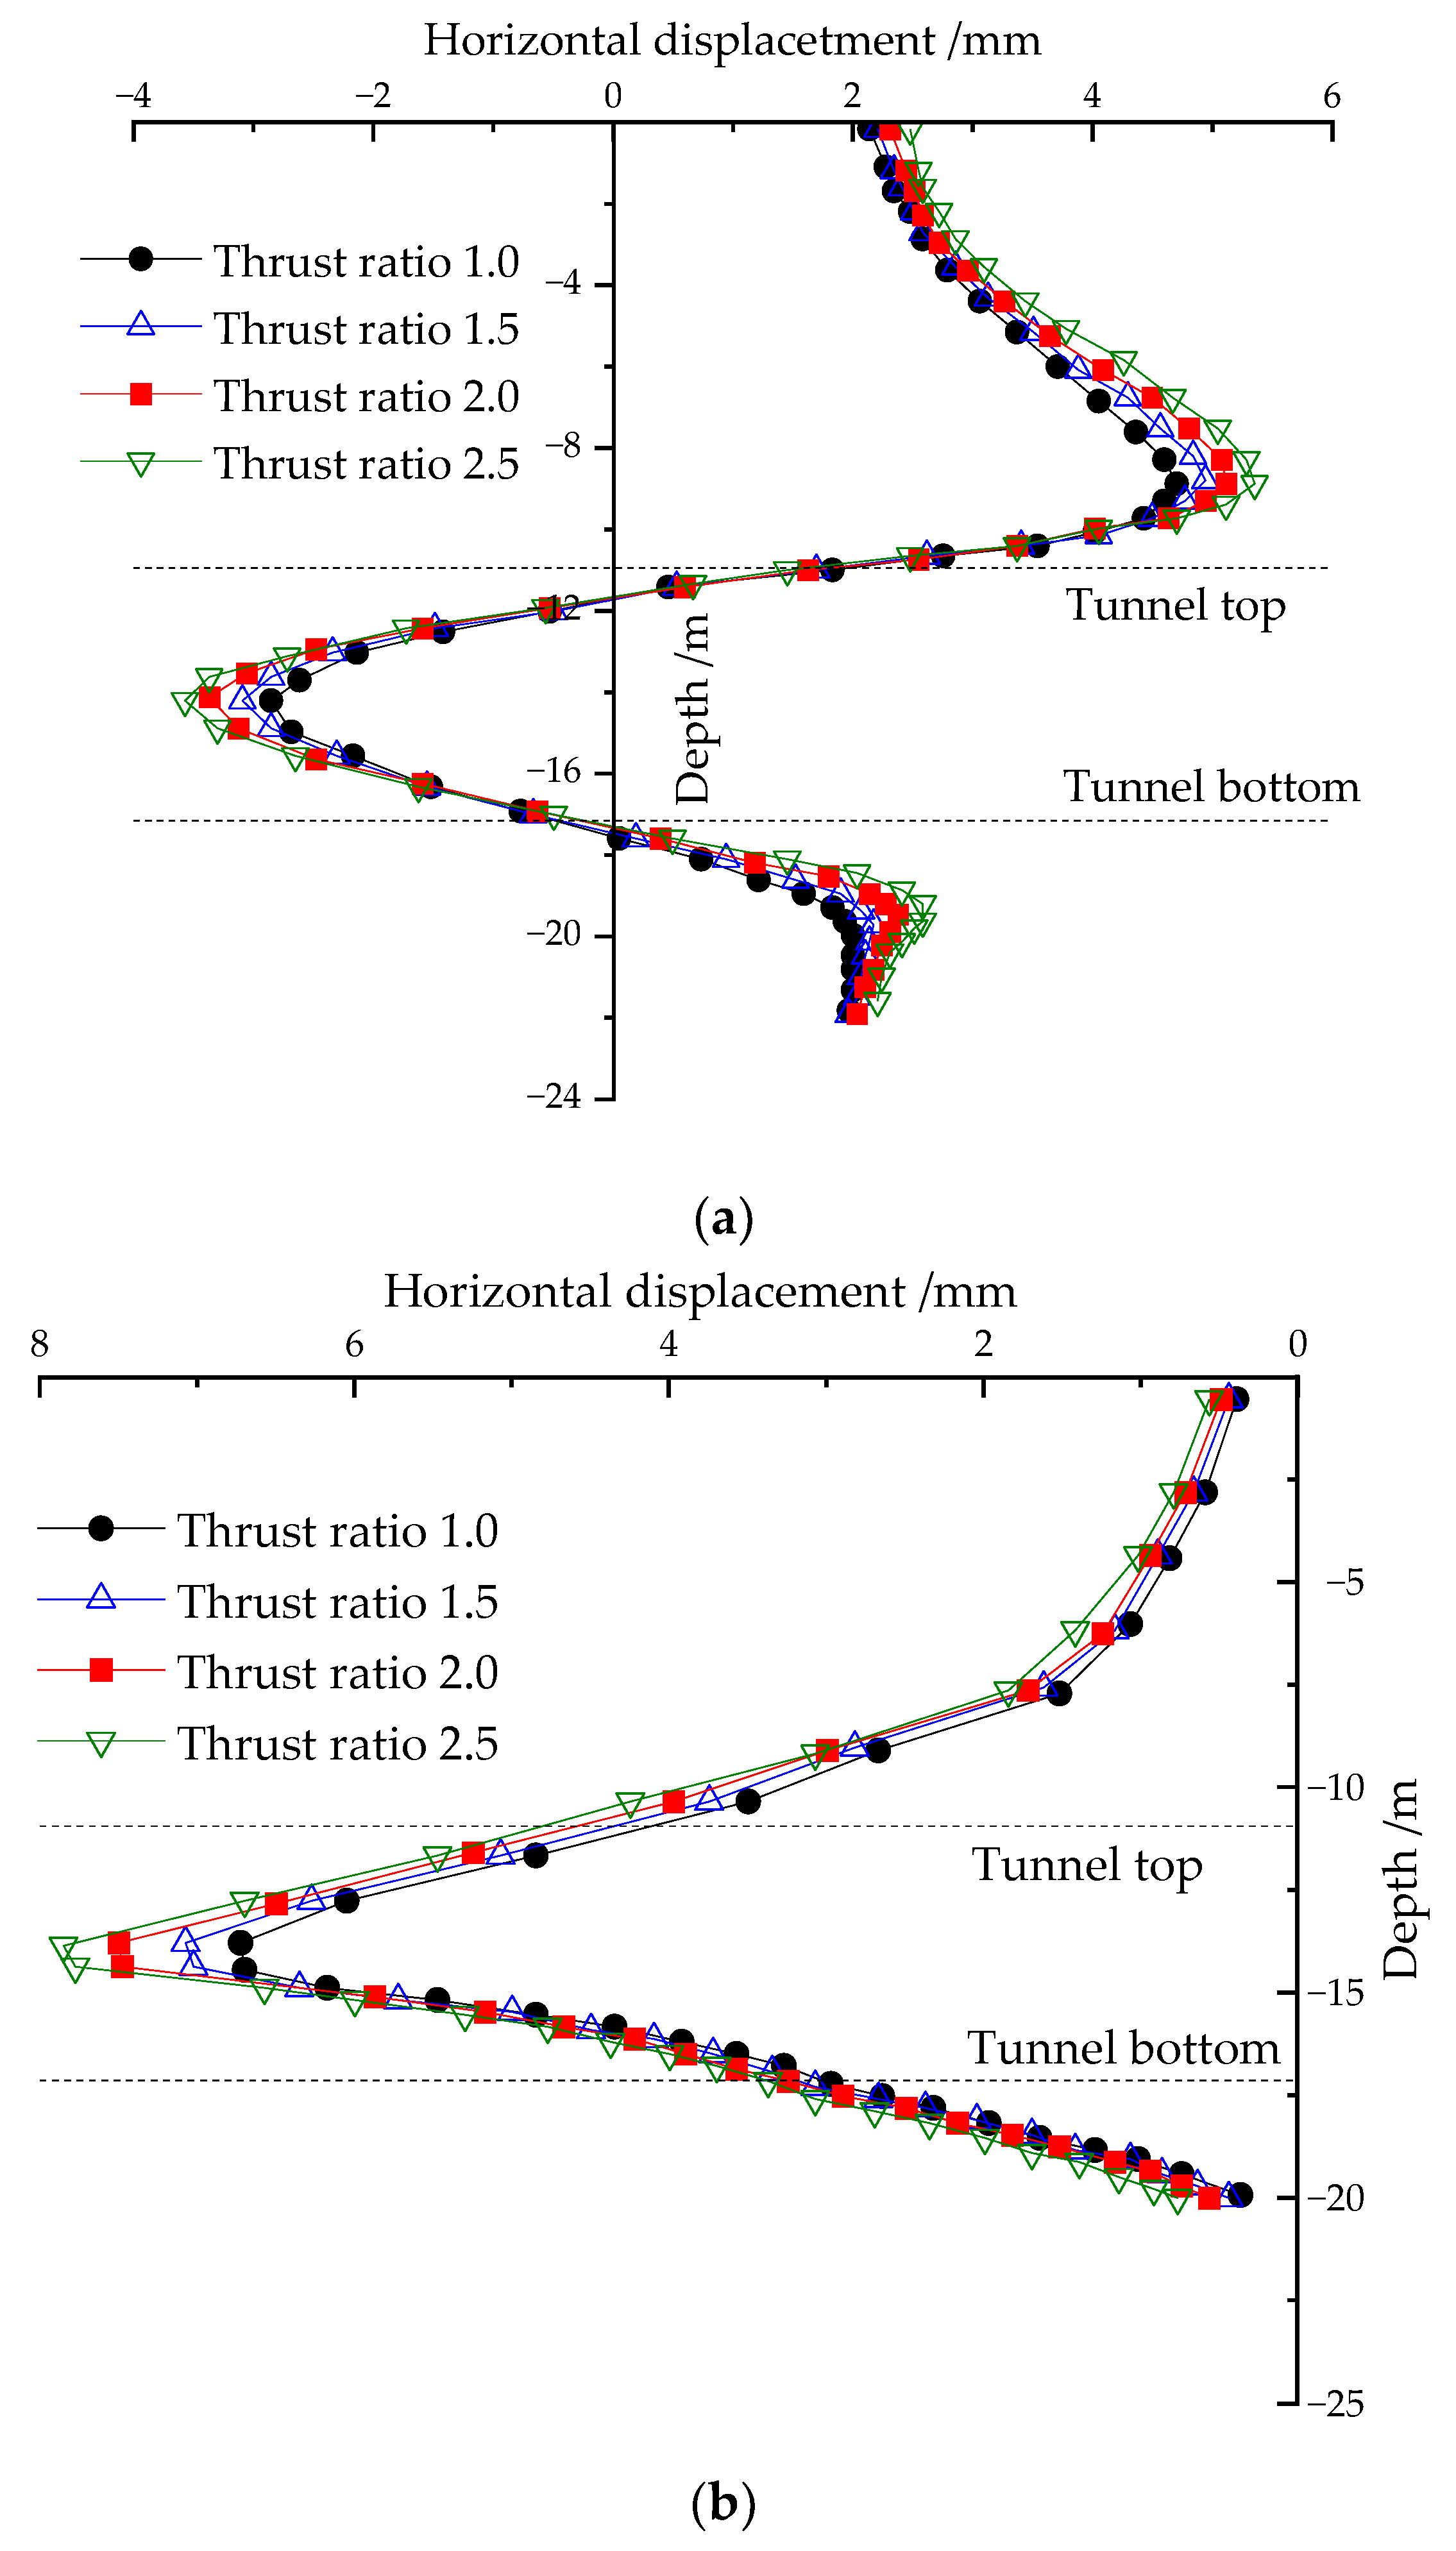
5.1.2. Influence of Unbalanced Thrust on Horizontal Displacement

Curves of horizontal displacement of surrounding soil under various thrust ratios are shown in Figure 8. Figure 8a shows that horizontal displacement of soil at the outer side of the tunnel axis increased with the thrust ratio. For the four thrust ratios, maximum displacement values of soil above tunnel top were 4.70 mm, 4.94 mm, 5.11 mm and 5.35 mm, with a 13.8% increment. Maximum horizontal displacement values of soil between tunnel top and bottom were −2.85 mm, −3.09 mm, −3.36 mm and −3.57 mm, with an absolute value increment of 25.3%.
As shown in Figure 8b, with the increase in thrust ratio, horizontal displacement of soil at the inner side of the tunnel axis also increased, especially the soil between the top and bottom of tunnel. For the four thrust ratios, corresponding maximum displacement values were −6.72 mm, −7.07 mm, −7.49 mm and −7.84 mm, with an absolute value increment of about 16.7%. On the whole, the increase in thrust ratio intensified the disturbance difference between soil on both sides of the tunnel axis and then increase the horizontal displacement.

5.2. Influence of Curvature Radius on Displacement of Surrounding Soil

During excavation of a curved tunnel, frequent adjustments of advance direction are required to ensure the tunnel axis complies with the design axis, the loss of which would lead to inevitable over excavation and increased tail space and ground loss [45,46]. To evaluate the influence of curvature radius on displacement of surrounding soil, four tunnels, with curvature radiuses of 250 m, 300 m, 400 m and 500 m, were selected. In the four tunnels, exerted thrust from tail jacks was 1000 kN and grouting pressure was 0.15 MPa.

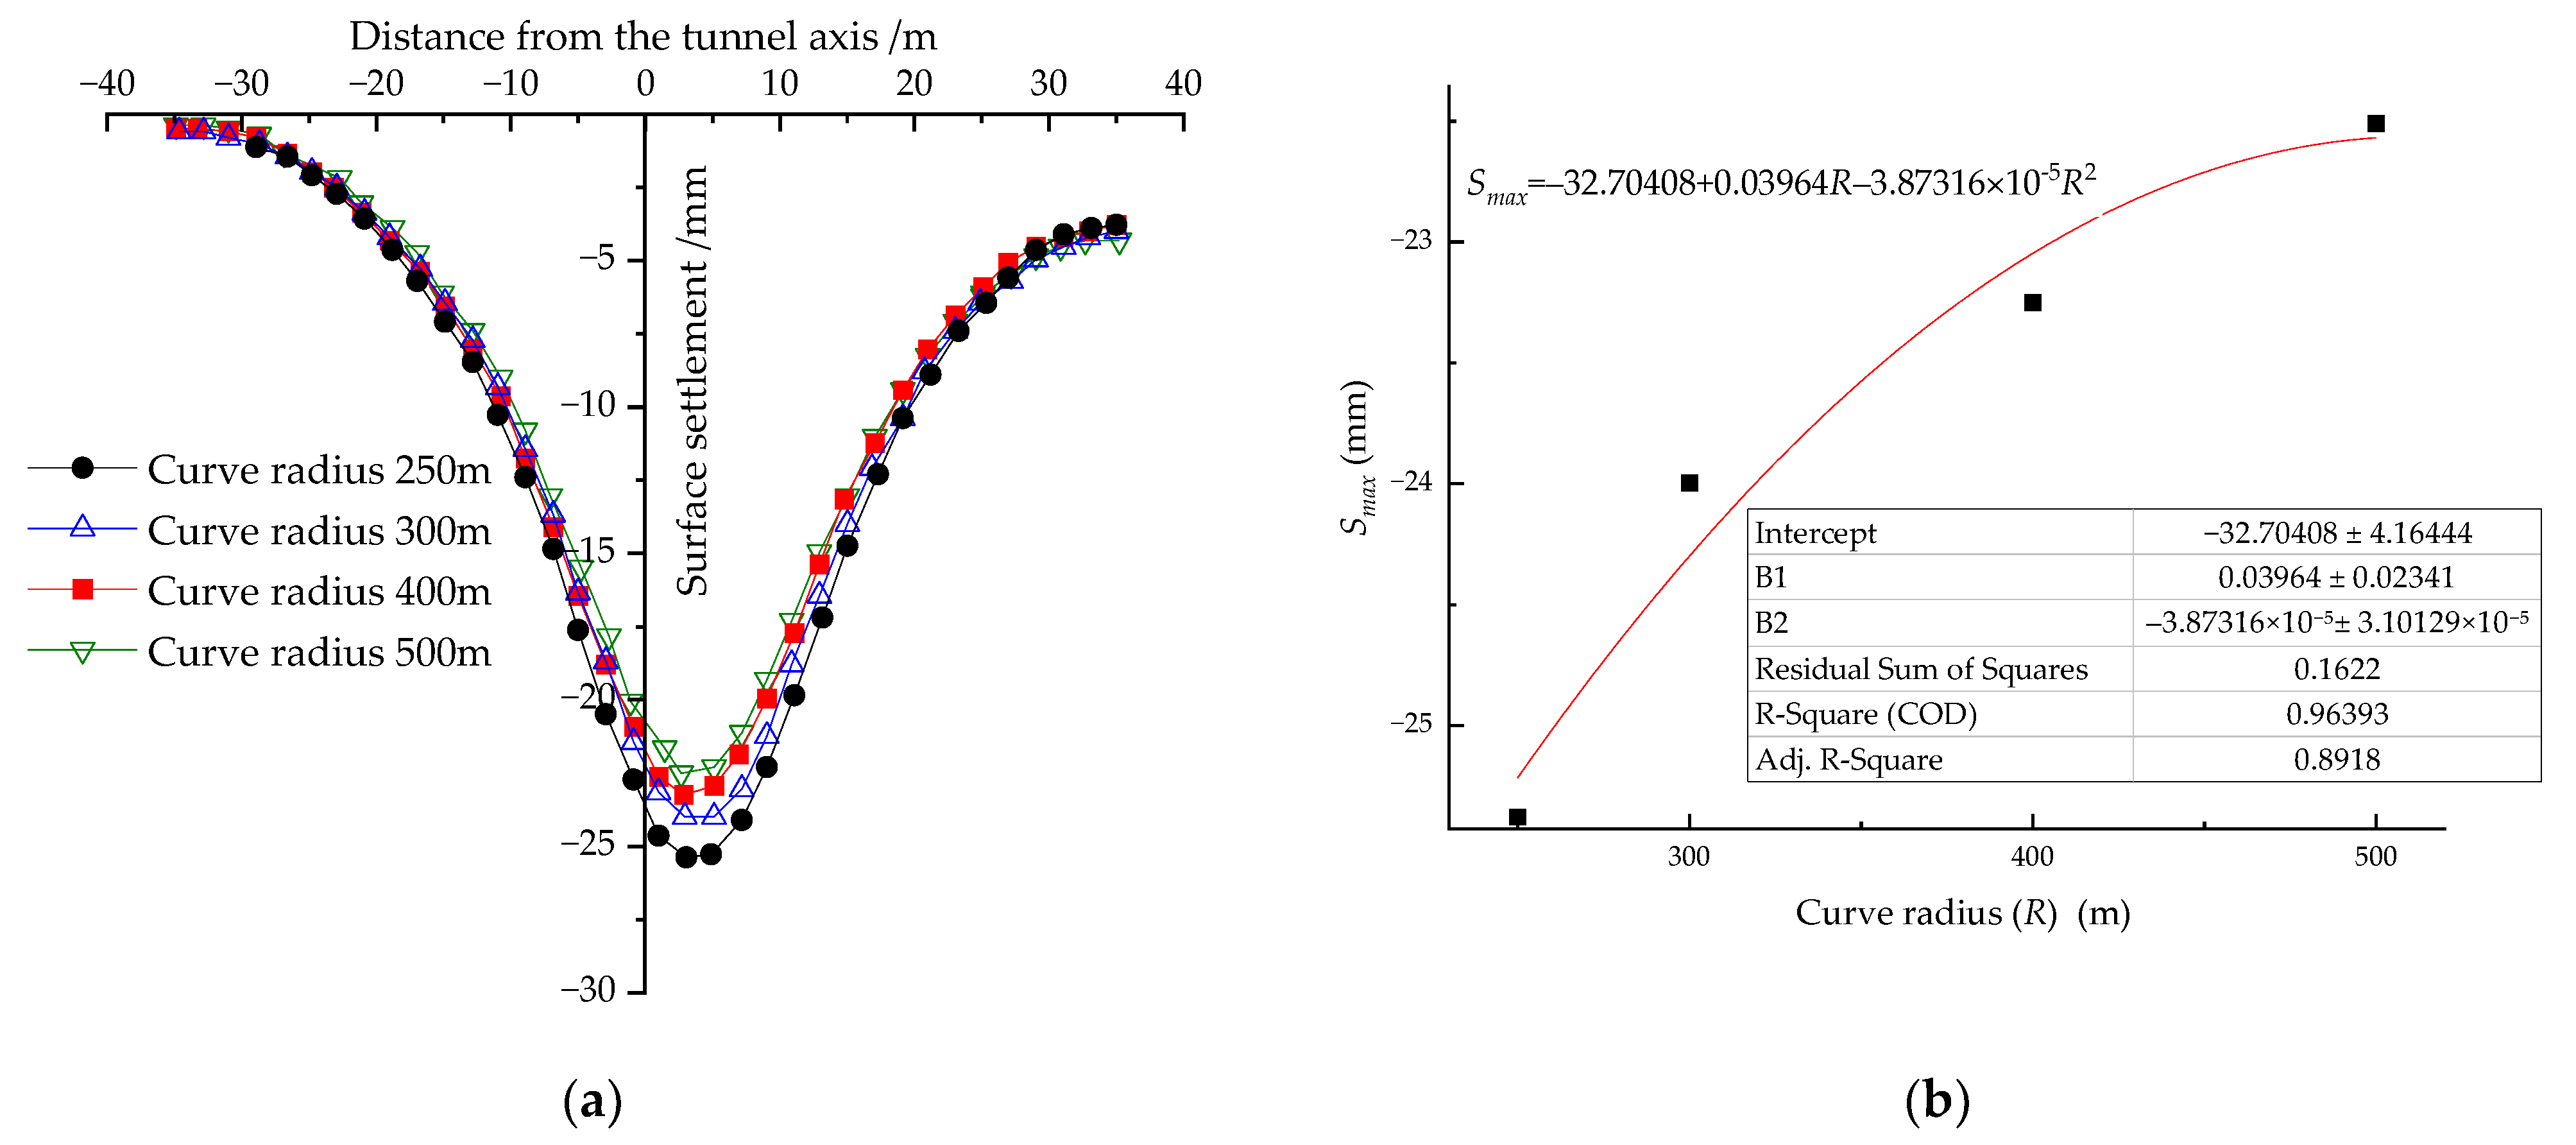
5.2.1. Influence of Curvature Radius on Surface Settlement

Surface settlement curves with the four curvature radiuses are shown in Figure 9, which shows the negative correlation between surface settlement and curvature radius. For the four tunnels mentioned above, corresponding maximum settlements were −25.37 mm, −24.08 mm, −23.24 mm and −22.50 mm, with an absolute value decrement of 11.3%. Simultaneously, offsets of the maximum settlement point were 3.03 m, 2.93 m, 2.83 m and 2.67 m, with a decrement of 11.9%. The decrease in maximum settlement and offset should be ascribed to the reduction of disturbance of surrounding soil and over excavation of soil at the inner side of the tunnel with the increase in curvature radius.
Figure 9b shows the relationship between maximum surface settlement and curvature; the functional relationship can be obtained by fitting as follows:
S m a x = 32.7048 + 0.03964 R 3.87316 × 10 5 R 2
where Smax is maximum surface settlement and R is curvature radius.
In consideration of the influence of curvature radius and dimension of shield segments, a formula was proposed to calculate the amount of over excavation at the inner side of the curved shield tunnel [45] and expressed as Equation (4):
δ = 1 2 R D 2 R D 2 2 L 2
where δ is the amount of over excavation; R is the curvature radius of shield tunnel; D is the outer diameter of the segment; L is the length of tail covering segments and could be reduced for a shield with a hinged shell. In this case, the values of D and L were 6.2 m and 2.5 m, respectively. Substituting these parameters into Equation (4), the amounts of over excavation for the four tunnels were 6.33 mm, 5.26 mm, 3.94 mm and 3.14 mm, declined with the increase in curvature radius and are shown in Figure 10. Similar trends were reported by Zhao [45] and are also plotted in Figure 10. A decrease in the over excavation of soil at the inner side of a curved tunnel would relieve disturbance of soil induced by shield excavation, and finally reduce surface settlement and offset the maximum settlement point [47].

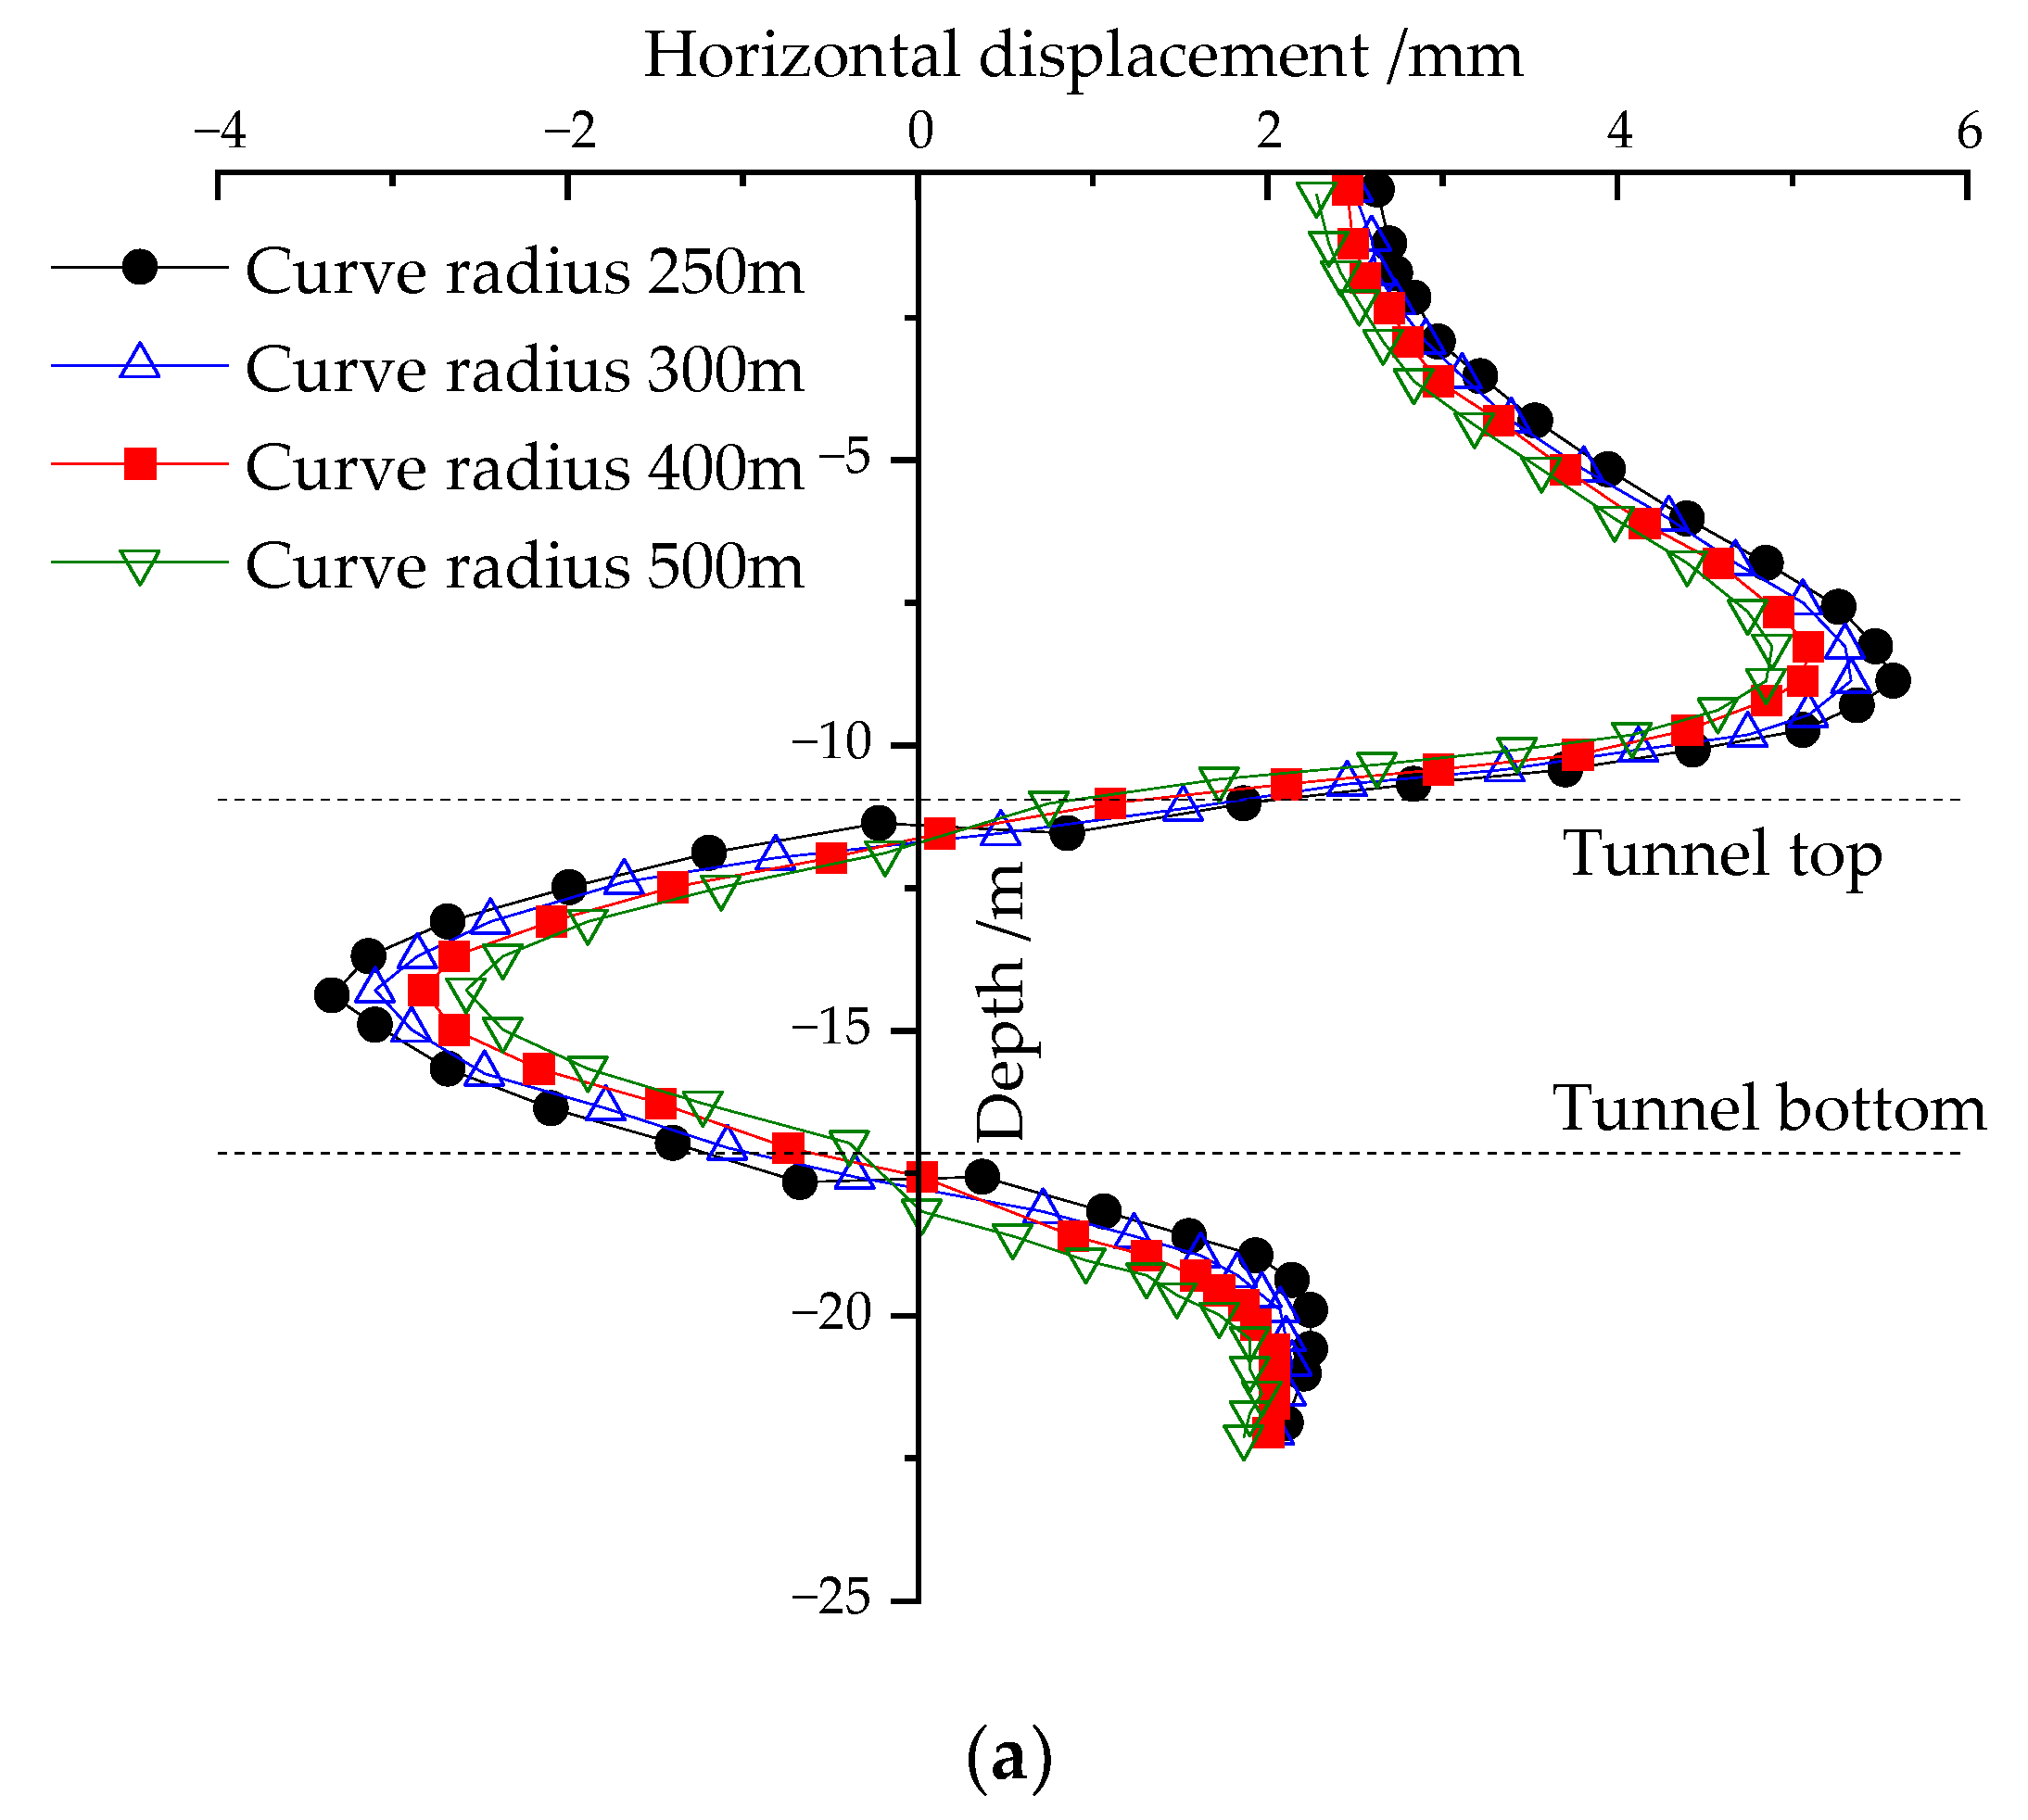
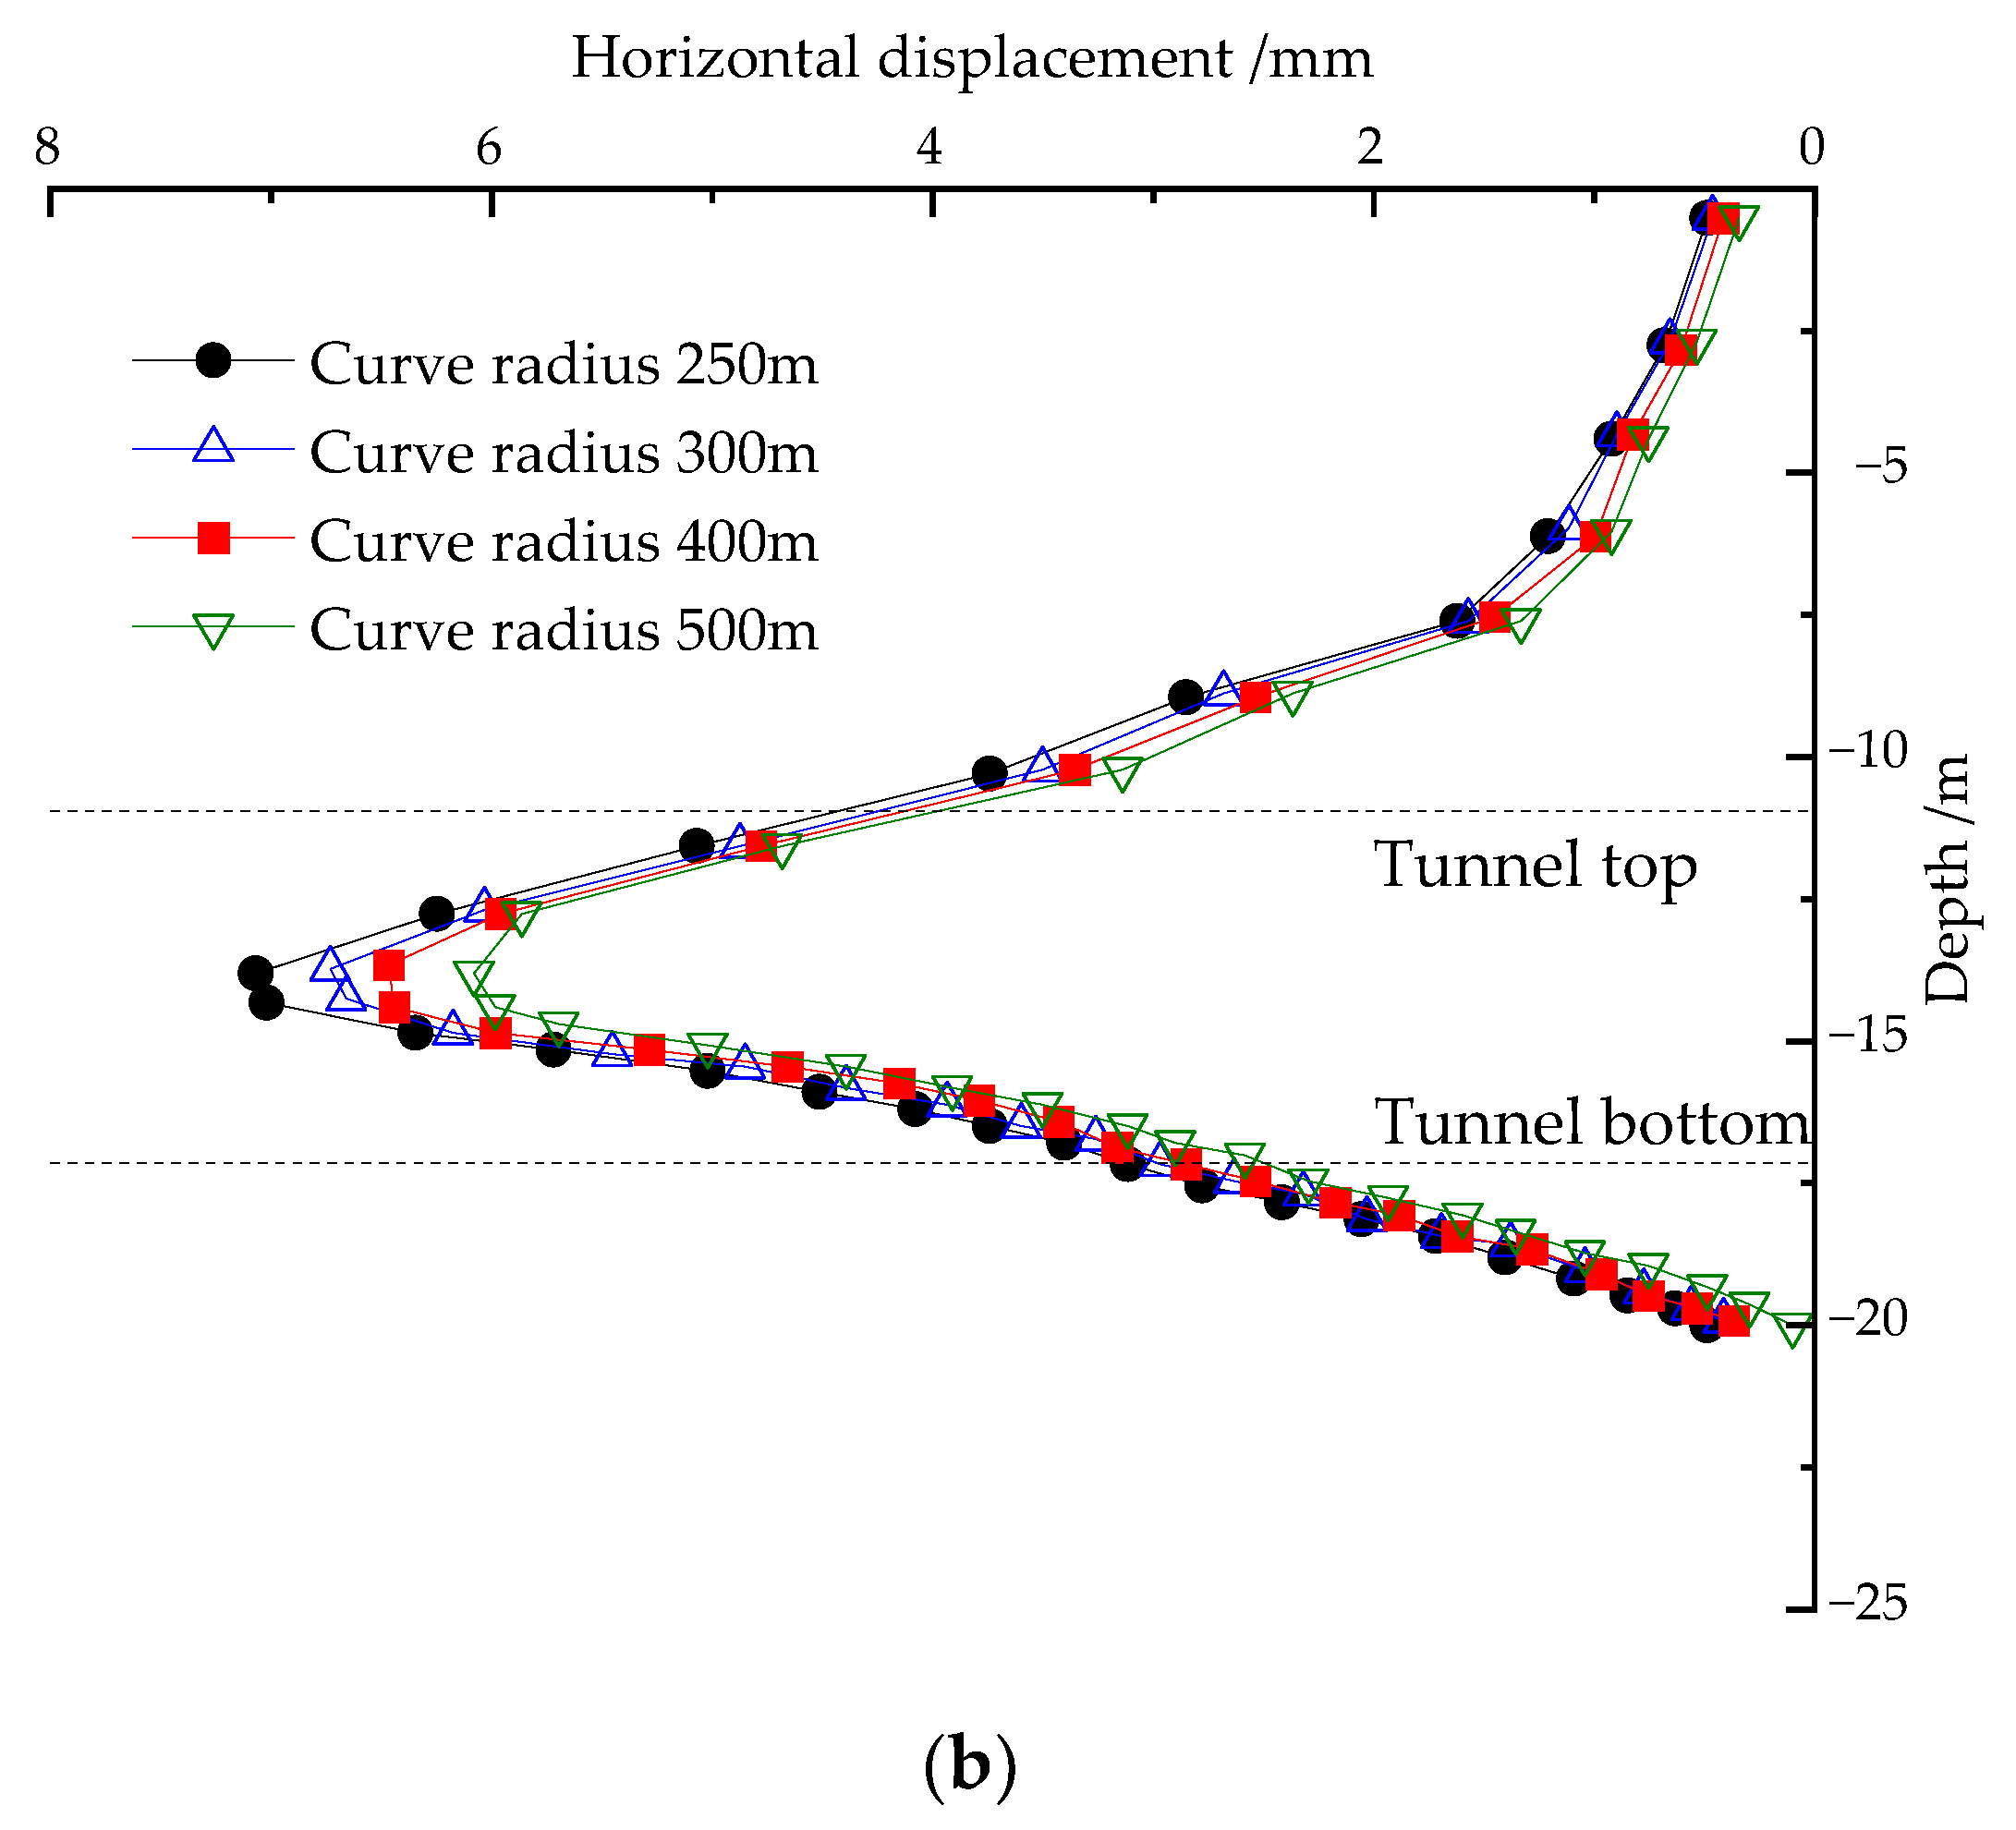
5.2.2. Influence of Curvature Radius on Horizontal Displacement

Curves of horizontal displacement with curvature radiuses of the tunnel are shown in Figure 11. Figure 11a shows that horizontal displacement of surrounding soil at the outer side of the tunnel decreased with the increase in curvature radius. For the four tunnels, maximum displacement values of soil above the tunnel top were 5.58 mm, 5.33 mm, 5.09 mm and 4.88 mm, with a 12.5% decrement. Maximum horizontal displacement values of soil between the tunnel top and bottom were −3.34 mm, −3.10 mm, −2.83 mm and −2.58 mm, with an absolute value decrement of 22.8%.
As shown in Figure 11b, with the increase in curvature radius, horizontal displacement of soil at the inner side of the tunnel axis decreased, especially the soil between the top and bottom of tunnel. For the four curvature radiuses, the corresponding maximum horizontal displacement values were −7.07 mm, −6.73 mm, −6.47 mm and −6.08 mm, with an absolute value decrement of about 14.0%. An increase in curvature radius would decrease the frequency of adjustment of shield advance, and would alleviate disturbance of soil and over excavation, which would finally reduce horizontal displacement.

5.3. Influence of Grouting Pressure on Displacement of Surrounding Soil

As mentioned before, tail grouting is an effective measure to control the displacement of surrounding soil. Pressure is the pivotal parameter of grouting effect during shield excavation. To explore the influence of grouting pressure on the displacement of surrounding soil, four grouting pressures, namely 0.10 MPa, 0.15 MPa, 0.20 MPa and 0.25 MPa, were selected. Under the four grouting pressures, exerted thrust from tail jacks was 1000 kN and the curvature radius of the tunnel was 300 m.

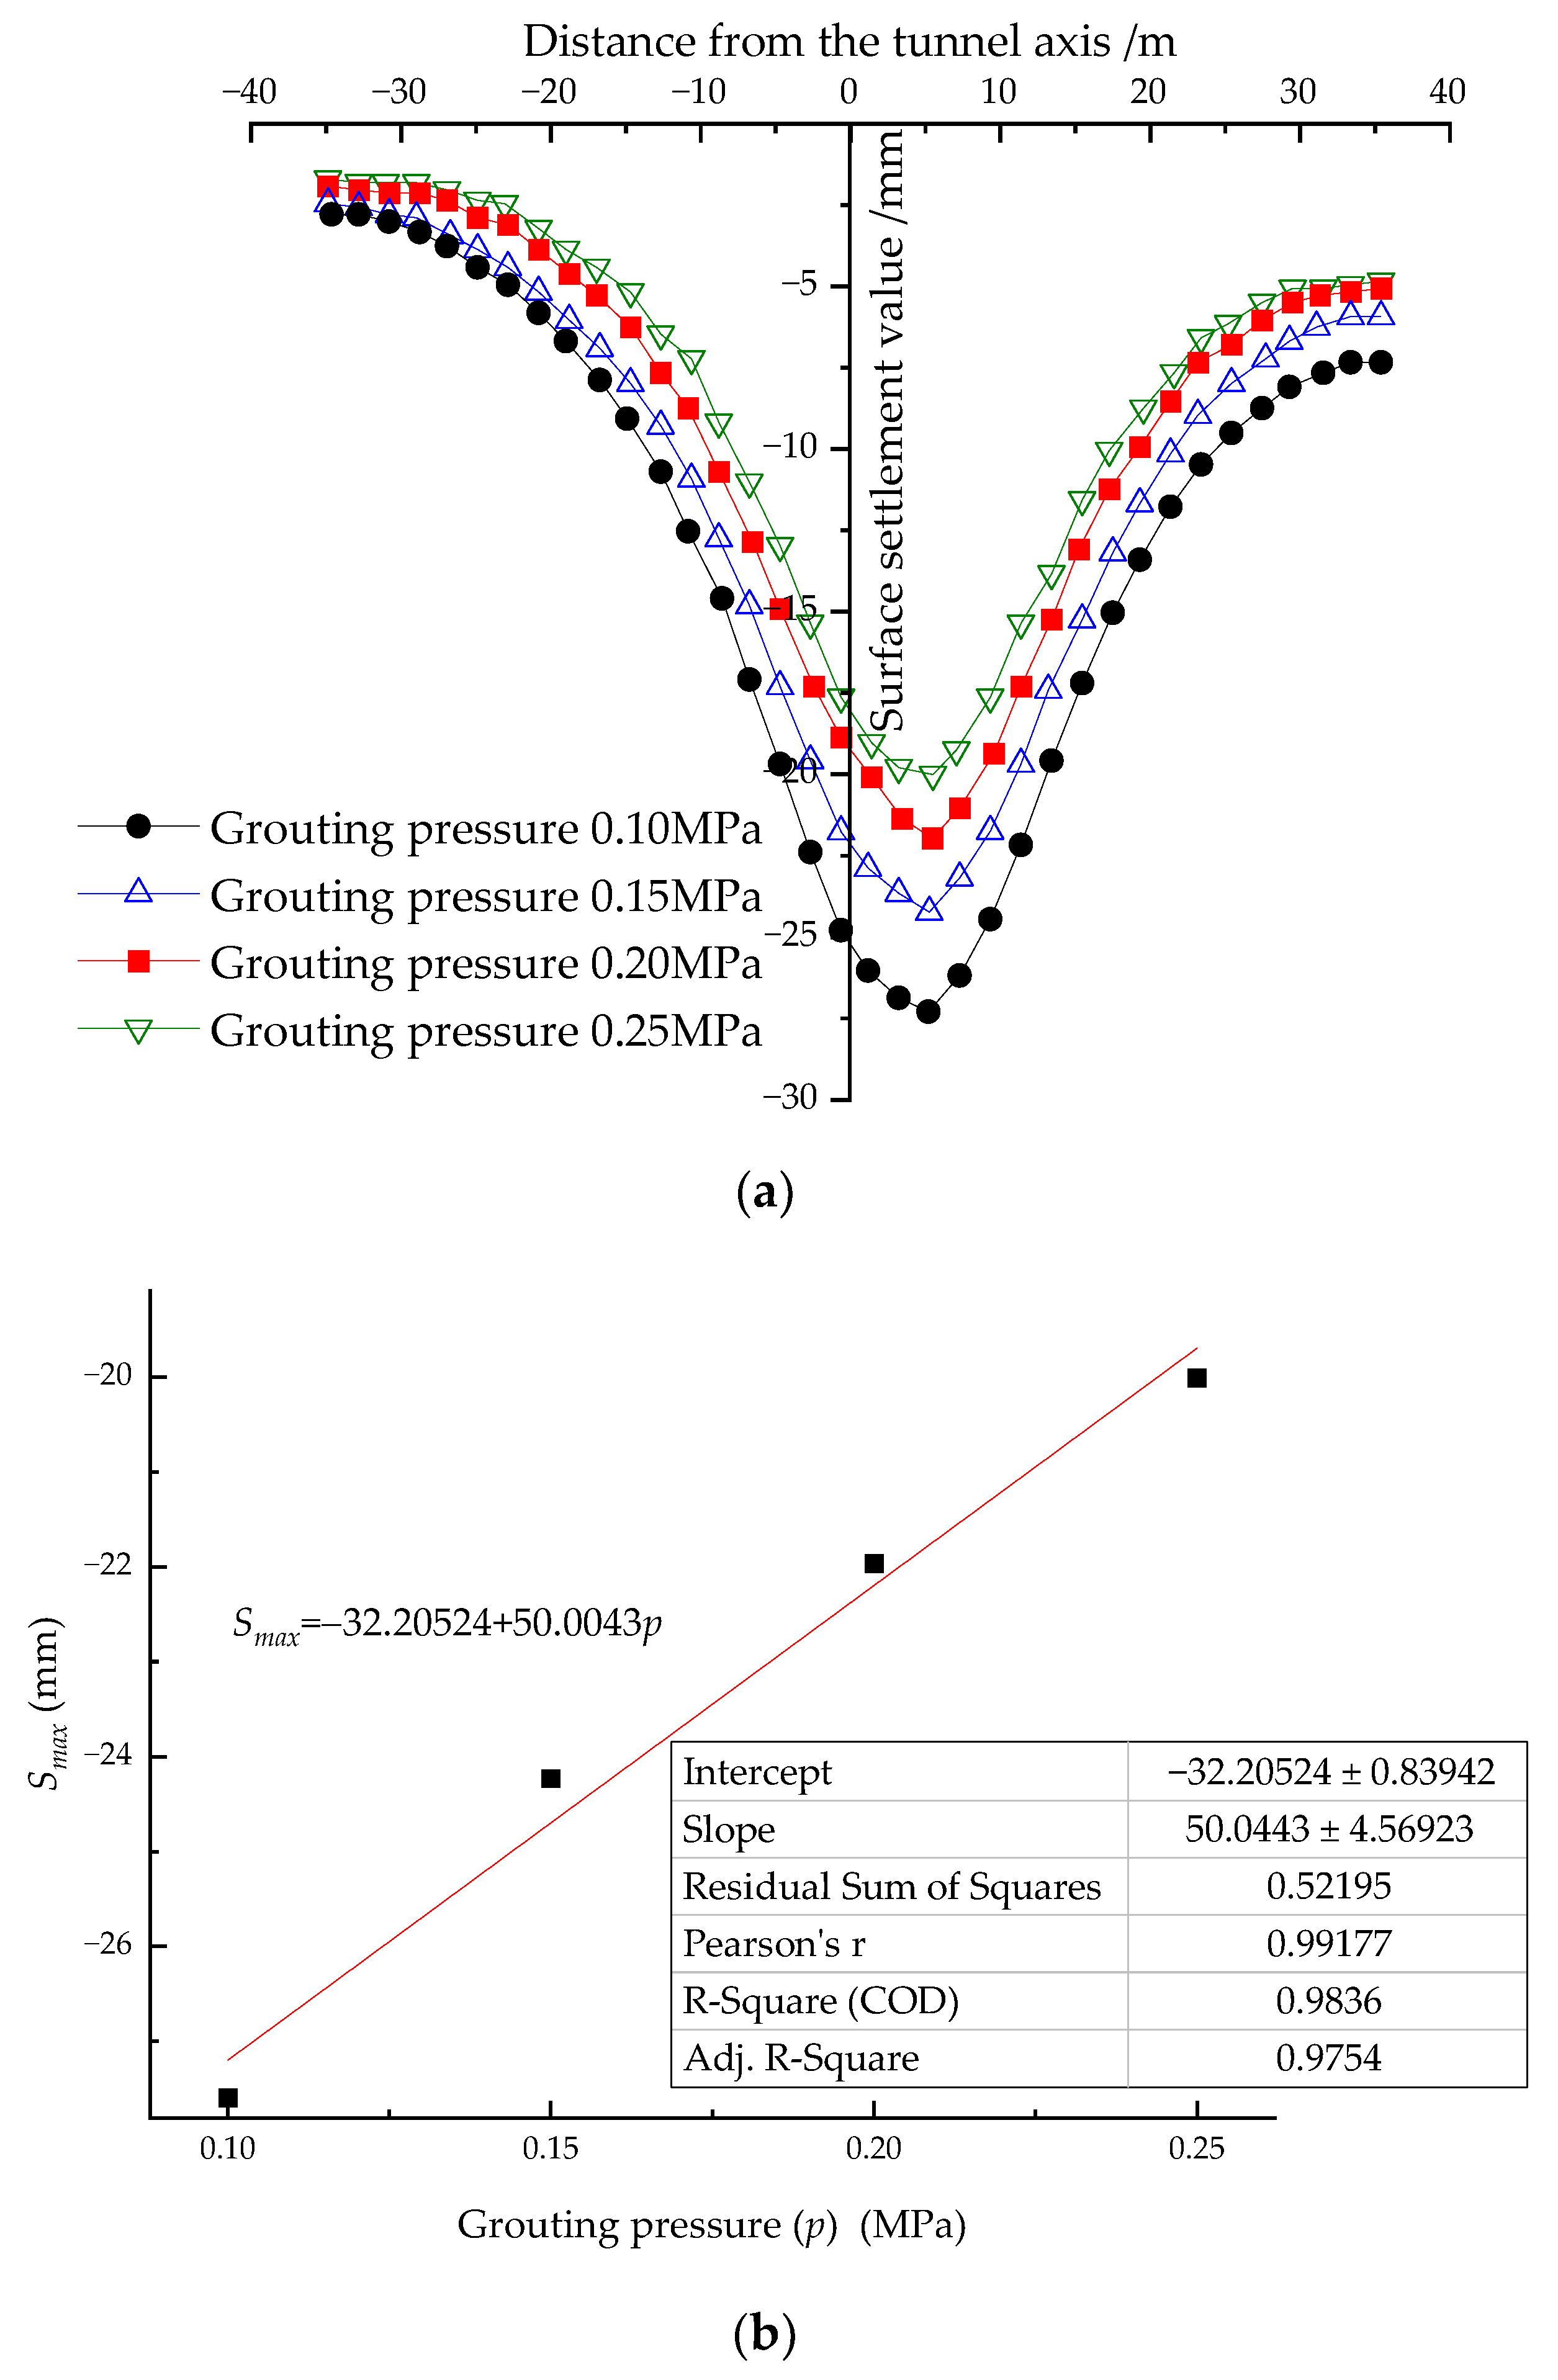
5.3.1. Influence of Grouting Pressure on Surface Settlement

Surface settlement curves with the four grouting pressures are shown in Figure 12. It can be seen that when the grouting pressure increased from 0.10 MPa to 0.25 MPa, the maximum surface settlement value changed from −27.29 mm to −20.01 mm, with an absolute value decrement of 26.7%.
Figure 12b shows the linear relationship between the maximum surface settlement and grouting pressure of shield tail. The functional relationship can be obtained by fitting as follows:
S m a x = 32.20524 + 50.043 p
where Smax is the maximum surface settlement and p is the grouting pressure.
Detailed data about the maximum surface settlement under various grouting pressures from this study and related research are listed in Table 4. The restrain effect of increased grouting pressure to surface settlement is obvious. Feng et al. [30] found that when grouting pressure increased from 0.1 MPa to 0.5 MPa, maximum surface settlement decreased from −13.22 mm to −9.8 mm, with a gradual decrease in change rate. Grouting pressure for settlement control largely depends on the water and earth pressure and should not exceed 0.4 MPa. Lou et al. [16] reported that a grouting pressure of 0.25 MPa is quite efficient in controlling surface settlement. If further increased, improvement of the effect of relieving surface settlement is not obvious and it might affect stresses on segments and surrounding soil. Mei et al. [1] also discussed the efficiency and limitations of grouting in decreased surface settlement. When grouting pressure increased from 0.1 MPa to 0.3 MPa, maximum surface settlement generally decreased obviously, while a grouting pressure of 0.3 MPa might cause excessive surface upheaval. Consequently, increased grouting pressure is helpful in controlling surface settlement, but with an upper limit that is determined by specific field monitoring data and engineering geological conditions, especially water and earth pressure. Hence, it is necessary to strictly monitor grouting pressure for precise control of surface settlement and upheaval.

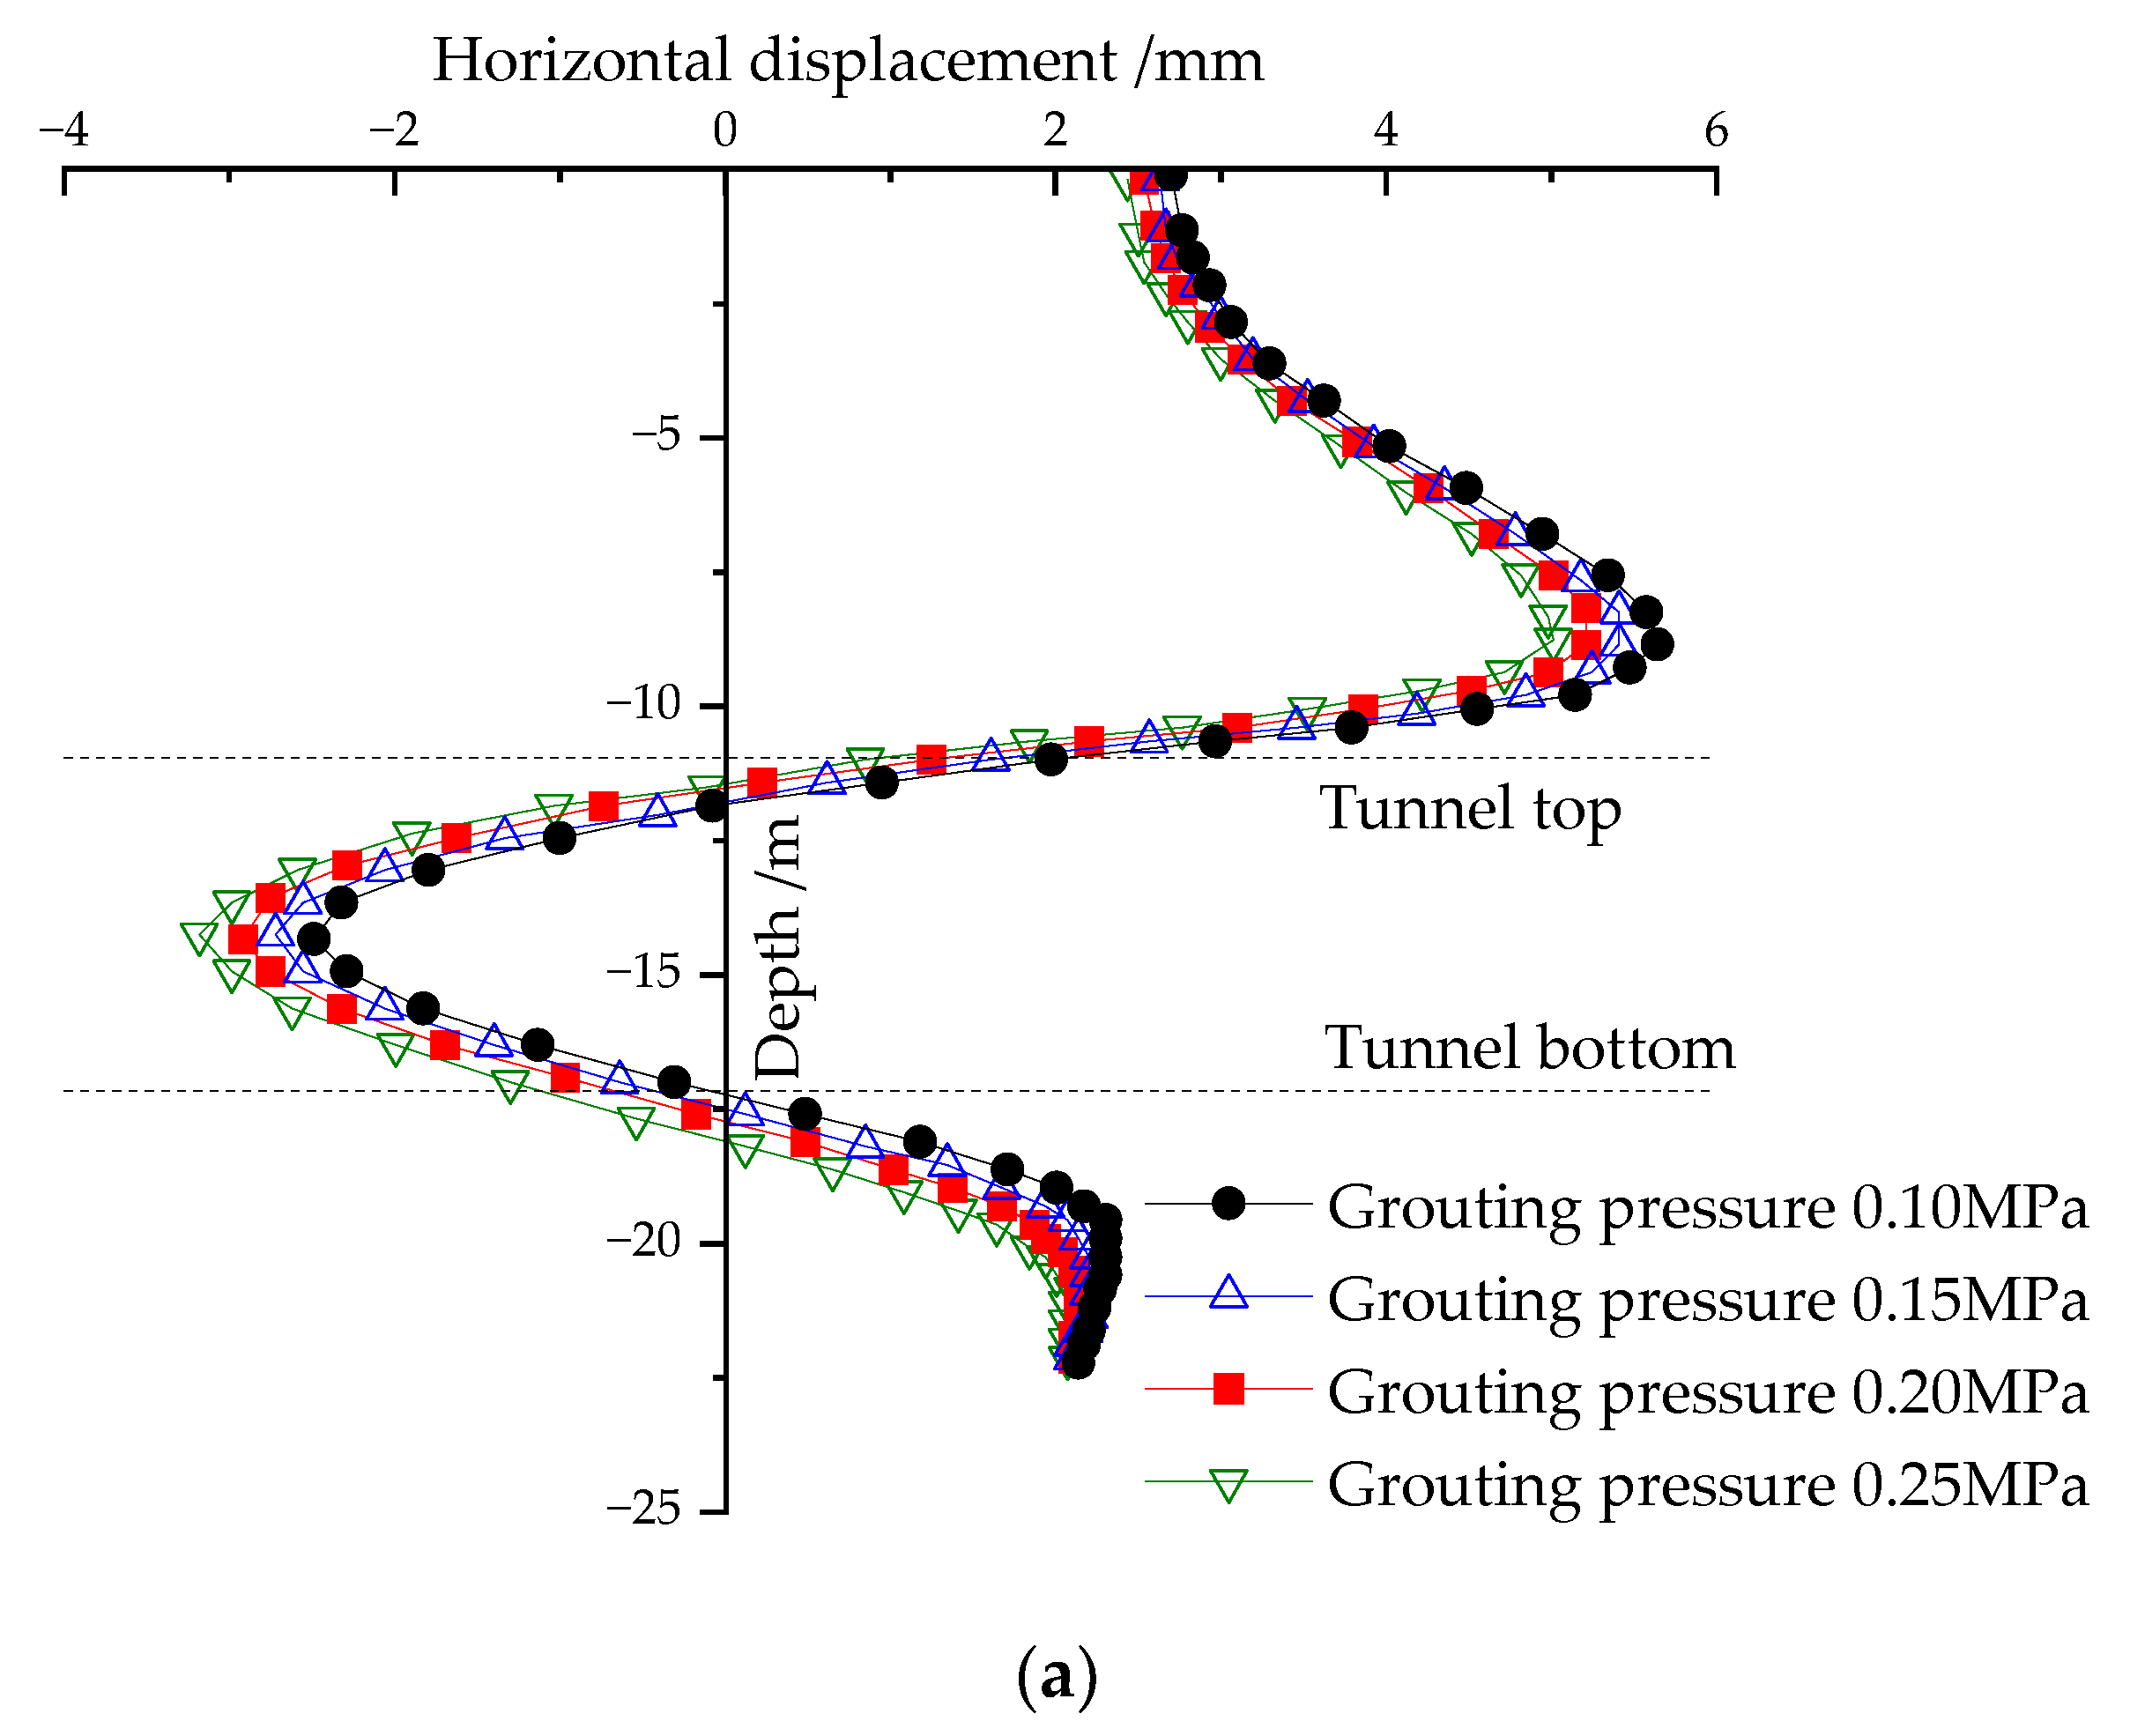
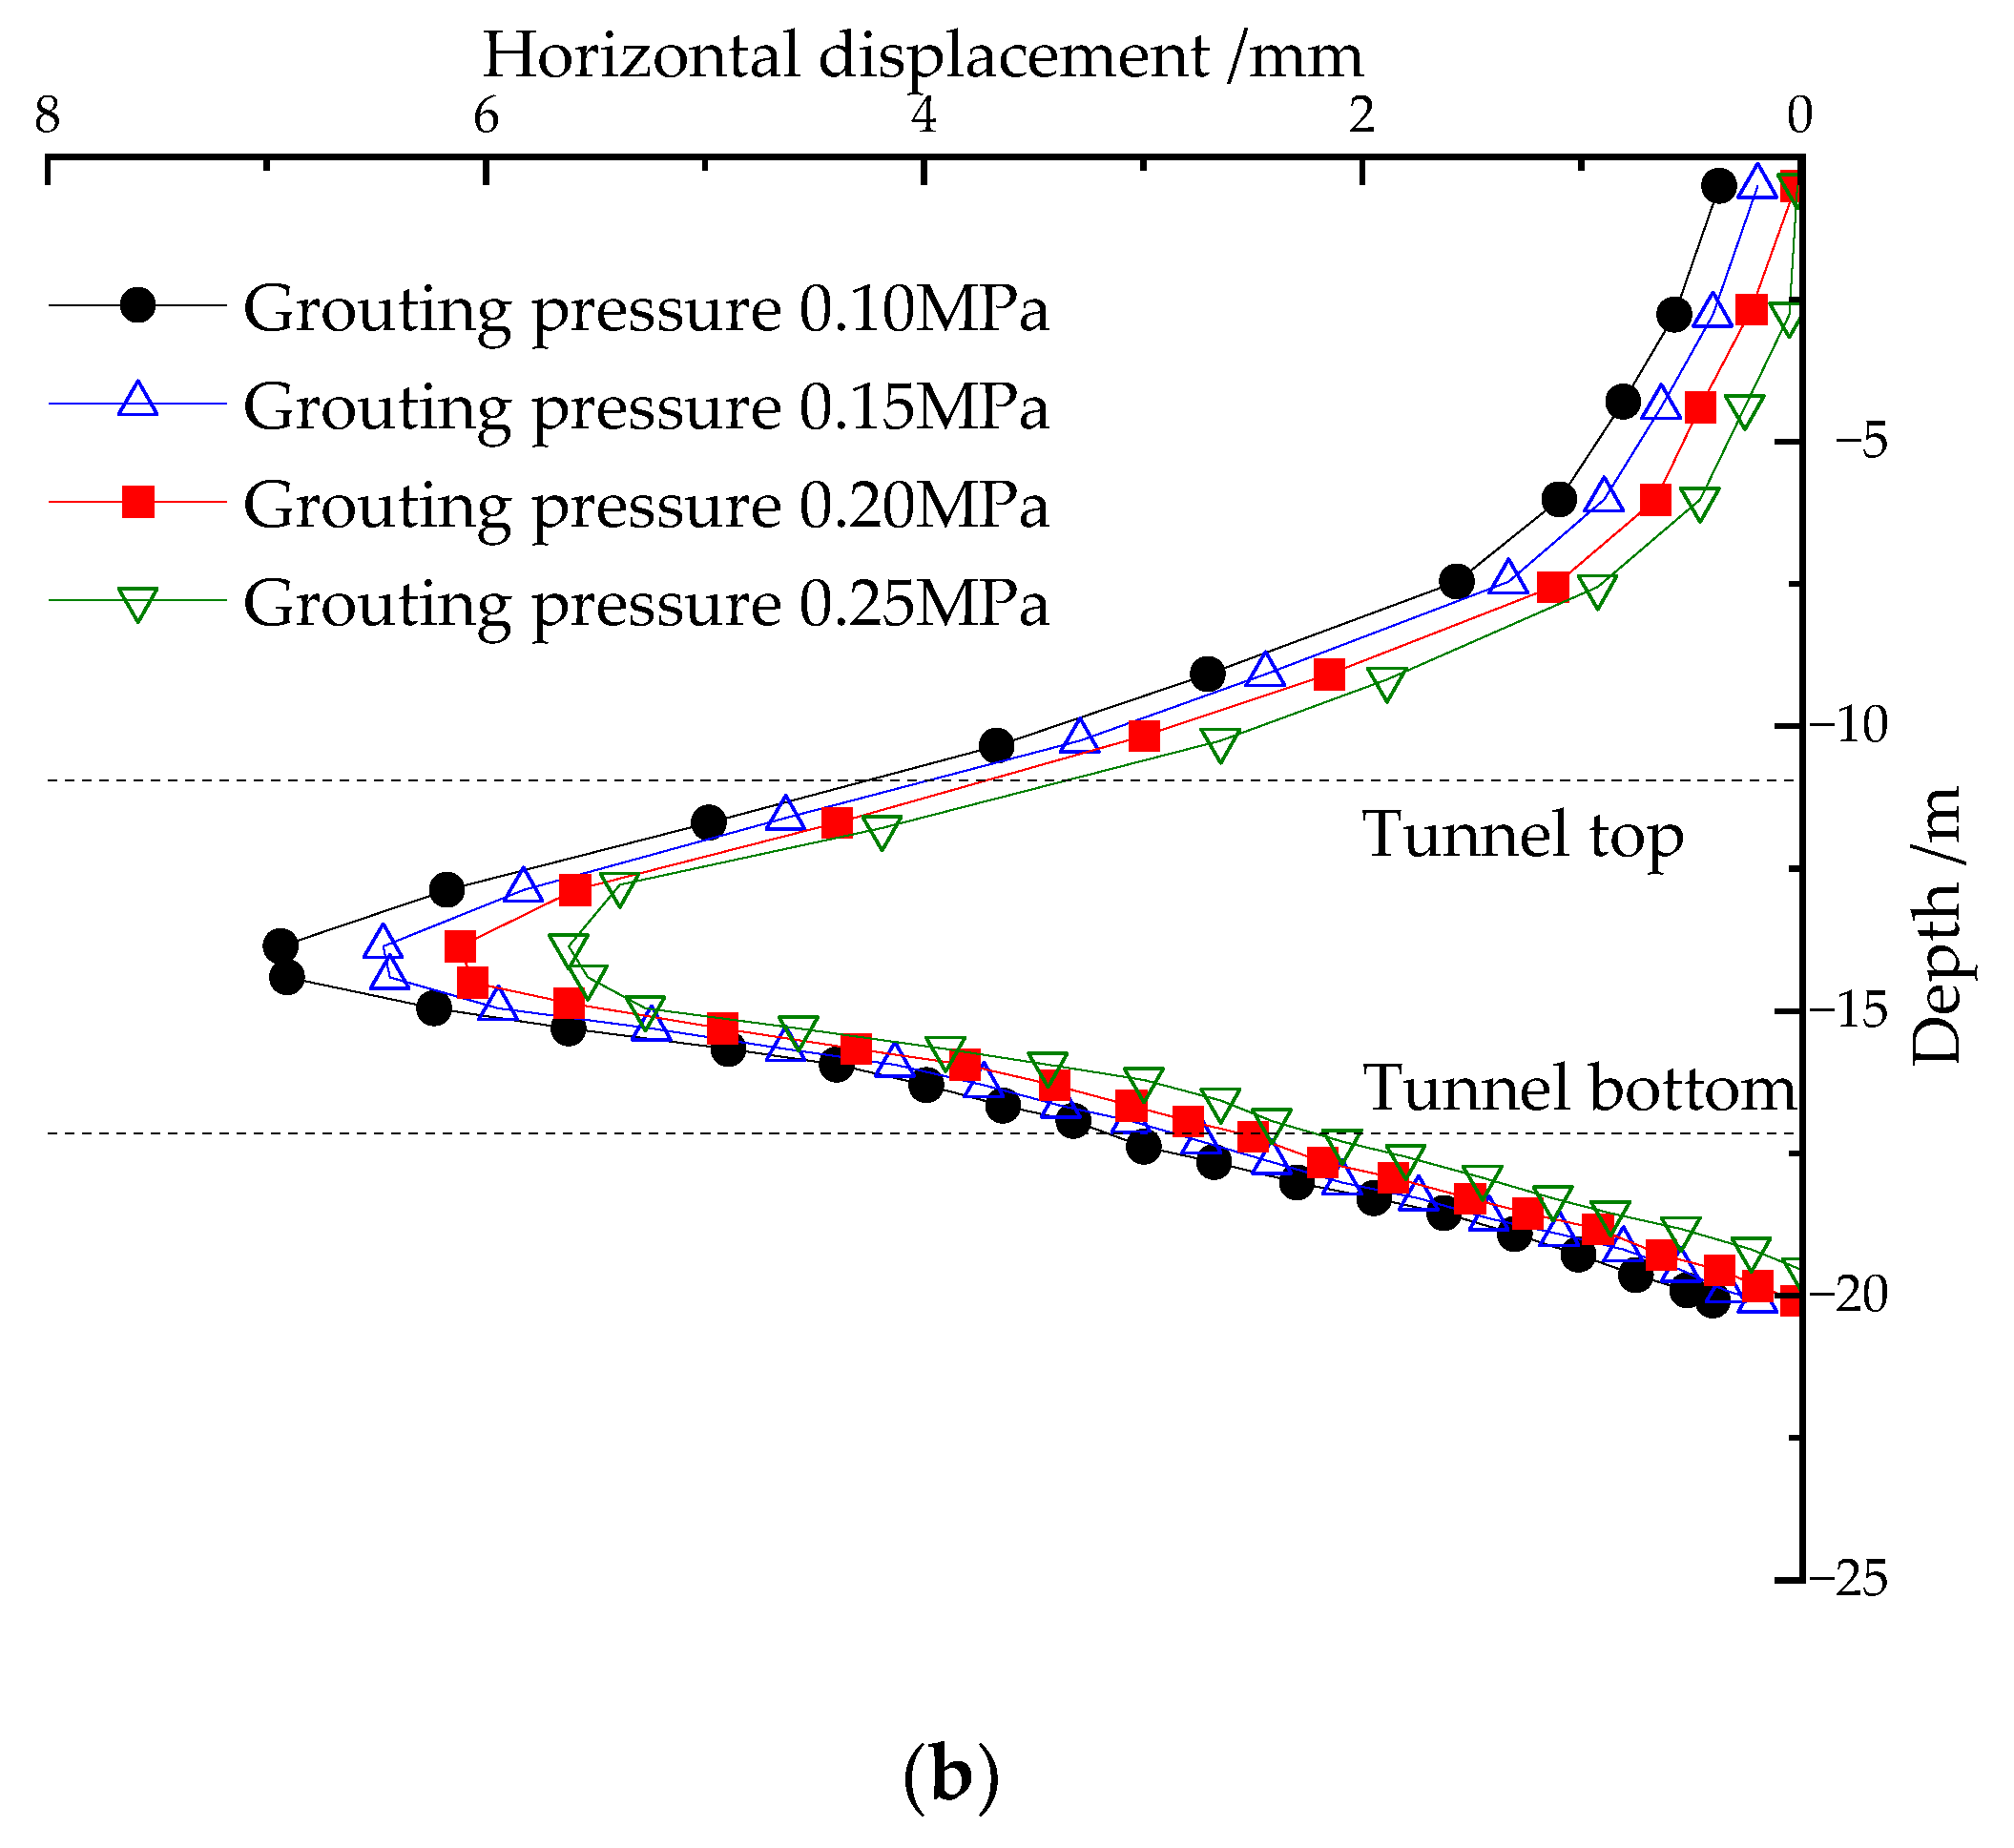
5.3.2. Influence of Grouting Pressure on Horizontal Displacement

Curves of horizontal displacement with various grouting pressures are shown in Figure 13. Figure 13a shows horizontal displacement of soil at the outer side of the tunnel axis. With the increase in grouting pressure from 0.1 MPa to 0.25 MPa, horizontal displacement of soil above the tunnel top decreased from 5.64 mm to 5.01 mm with a decrement of 11.2%. Similar results could be observed for soil below the tunnel bottom. These changes indicate that increases in grouting pressure are beneficial to reduce deformation and improve the stability of soil above tunnel top and below tunnel bottom. For soil between the top and bottom of the tunnel, the absolute value of horizontal displacement generally increased from 2.49 mm to 3.18 mm, with an increment of 27.7%. This abnormal increase might be the result of combined action of increased soil disturbance, grouting reinforcement and complicated soil stress redistribution.
As shown in Figure 13b, with the increase in grouting pressure, horizontal displacement of soil at the inner side of the tunnel axis decreased. For grouting pressures of 0.10 MPa, 0.15 MPa, 0.20 MPa and 0.25 MPa, the corresponding maximum horizontal displacement values were −6.94 mm, −6.47 mm, −6.12 mm and −5.62 mm, with an absolute value decrement of about 19.0%. Grouting could fill the void at the inner side of the tunnel axis induced by over excavation, and the effect of grouting reinforcement was generally enhanced with the increase in grouting pressure. In general, an increase in grouting pressure is helpful to control displacement of surrounding soil, but its upper limit needs to be considered comprehensively.

5.4. Paramener Sensitivity Analysis

A multiple linear regression analysis was carried out to explore the sensitivity of factors. In this analysis, the absolute value of maximum surface settlement induced by shield excavation of the tunnel with curved axis was selected as a dependent variable, and thrust ratio T of tail jacks, curvature radius R of tunnel and tail grouting pressure p were chosen as variables. Obtained regression parameters are listed in Table 5.
As displayed in Table 5, the standardized regression coefficients of thrust ratio, curvature radius of tunnel and tail grouting pressure were 0.780, −0.185 and −0.438, respectively. The results show that the strongest correlation to maximum surface settlement was thrust ratio and the weakest was curvature radius of the tunnel. The correlation of grouting pressure to maximum surface settlement was somewhere between them. Moreover, the three factors were all significant with p-values of far below the significance level of 0.05. In consideration of the curvature radius determined at the design stage, during shield excavation of curved tunnel, great attention should be paid to the thrust ratio of tail jacks and tail grouting pressure, especially the former for effectively controlling surface settlement.

6. Conclusions

In this study, a section of a tunnel with a small curvature radius of 300 m of Jiaru River Parking Yard entry line of Metro Line 3 in Zhengzhou was selected as engineering case to explore influence factors of displacement of surrounding soil induced by shield excavation of a curved tunnel. A numerical model using a three-dimensional finite element method was established and its validity was verified by comparison with field monitoring data and calculation results of an empirical formula. The influence of three factors, unbalanced thrust ratio of tail jacks, curvature radius of shield tunnel and pressure of tail grouting on both surface settlement and horizontal displacement, were investigated with single factor analysis method. The main conclusions can be summarized as follows:
(1)
By contrast to field monitoring data, the validity of numerical simulation could be verified by the small differences of maximum surface settlement of 1.21 mm, maximum horizontal displacement of surrounding soil of 0.31 mm at the outer side and 0.75 mm at the inner side.
(2)
Obvious increases in displacement of surrounding soil could be found when the thrust ratio of tail jacks increased from 1.0 to 2.5. (Absolute) value of maximum surface settlement increased from 24.08 mm to 34.61 mm with an increment of 43.7%. For horizontal displacements of soil at the outer side and inner side of curved tunnel axis, the increments were 13.8% and 16.7%, respectively. The increases should be attributed to intensive uneven thrust distribution and disturbance to surrounding soil.
(3)
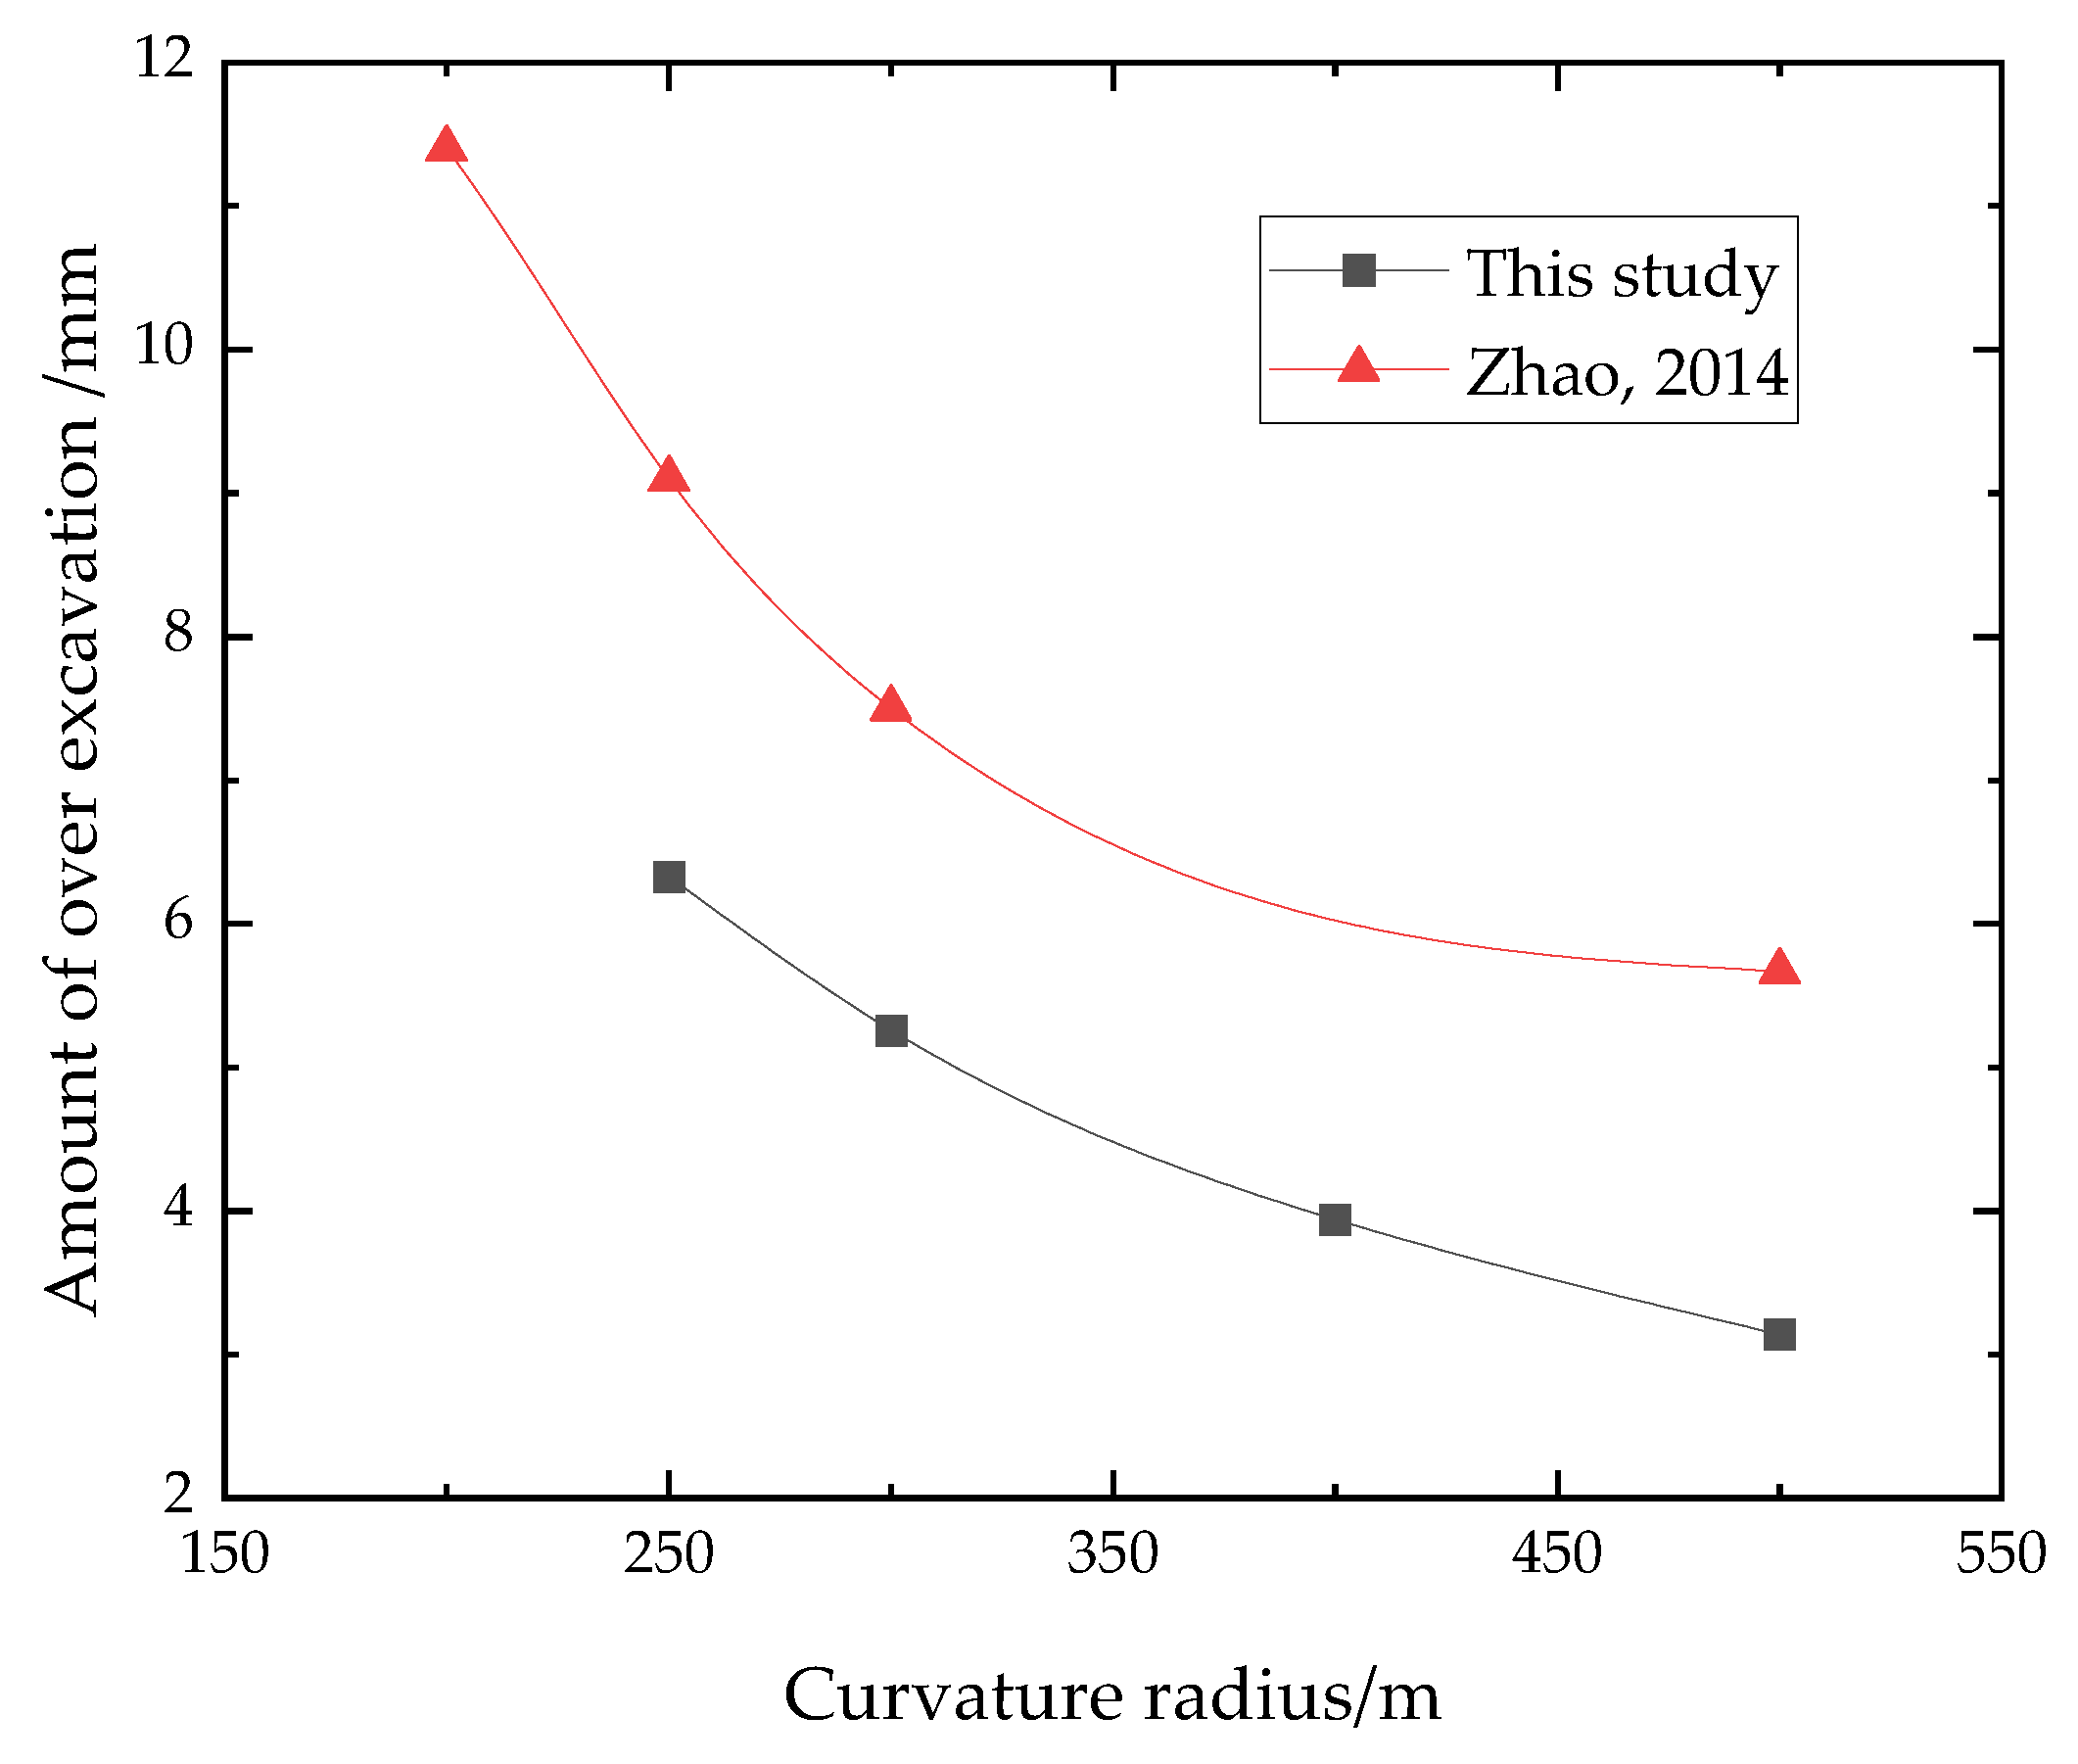
Increases in curvature radius generally decrease displacement of surrounding soil. During curvature radius increases from 250 m to 500 m, the (absolute) decrements of maximum surface settlement, horizontal displacements of soil at the outer side and inner side of curved tunnel axis were 11.3%, 12.5% and 14.0%, respectively. The reason might be the decreases in frequency of adjustment of shield advances and the amount of over excavation.
(4)
On the whole, the restrain effect of increased grouting pressure to displacement of surrounding soil is obvious. When the grouting pressure increased from 0.1 MPa to 0.25 MPa, the decrement of (absolute) value of maximum surface settlement, horizontal displacements of soil at the outer side and inner side were 26.7%, 11.2% and 19.0%, respectively. Enhancement of fill effect on tail void and reinforcement of surrounding soil with the grouting pressure might be the reason.
(5)
Results of multiple linear regression analysis reveal that thrust ratio and grouting pressure were significant factors for maximum surface settlement, especially during the shield excavation stage.

Author Contributions

Conceptualization, B.Y. and Z.X.; methodology, B.Y. and C.Z.; software, C.Z. and N.S.; validation, B.Y. and Z.X.; formal analysis, C.Z. and N.S.; investigation, Z.X.; data curation, Z.X.; writing—original draft preparation, B.Y. and C.Z.; writing—review and editing, B.Y. and N.S.; funding acquisition, B.Y. and Z.X. All authors have read and agreed to the published version of the manuscript.

Funding

This research was funded by the Henan Key Scientific and Technological Project (Grant No. 212102110200), the School Research Fund for the Doctoral Program (Grant No. 2017BS024), the Open Research Subject of Henan Key Laboratory of Grain and Oil Storage Facility & Safety (Grant No. 2022KF06) and the Scientific Research Fund of Henan University of Technology (Grant No. 2017QNJH05).

Data Availability Statement

Data in this study are available from the corresponding author upon reasonable request.

Conflicts of Interest

The authors declare no conflict of interest.

References

  1. Mei, Y.; Zhou, D.; Shi, W.; Zhang, Y.; Zhang, Y. Laws and Numerical Analysis of Surface Deformation Caused by Excavation of Large Diameter Slurry Shield in Upper-Soft and Lower-Hard Composite Stratum. Buildings 2022, 12, 1470. [Google Scholar] [CrossRef]
  2. Yuan, B.; Li, Z.; Chen, W.; Zhao, J.; Lv, J.; Song, J.; Cao, X. Influence of Groundwater Depth on Pile-Soil Mechanical Properties and Fractal Characteristics under Cyclic Loading. Fractal Fract. 2022, 6, 198. [Google Scholar] [CrossRef]
  3. Franza, A.; Ritter, S.; Dejong, M.J. Continuum solutions for tunnel–building interaction and a modified framework for deformation prediction. Geotechnique 2020, 70, 108–122. [Google Scholar] [CrossRef]
  4. Singh, D.K.; Aromal, V.; Mandal, A. Prediction of surface settlements in subway tunnels by regression analysis. Int. J. Geotech. Eng. 2020, 14, 836–842. [Google Scholar] [CrossRef]
  5. Zheng, F.; Jiang, Y.; Wang, N.; Geng, D.; Xu, C. Investigation on the Influence of Active Underpinning Process on Bridge Substructures during Shield Tunnelling: Numerical Simulation and Field Monitoring. Buildings 2023, 13, 241. [Google Scholar] [CrossRef]
  6. Huang, H.; Li, P.; Wang, C.; Yuan, B.; Chen, M.; Feng, W. Research and Analysis on the Influence of Small Clear Distance Drilling and Blasting Method on the Existing Tunnel Structure. Adv. Civ. Eng. 2021, 2021, 4730936. [Google Scholar] [CrossRef]
  7. Mao, J.-H.; Yuan, D.-J.; Jin, D.-L.; Zeng, J.-F. Optimization and application of backfill grouting material for submarine tunnel. Constr. Build. Mater. 2020, 265, 120281. [Google Scholar] [CrossRef]
  8. Pinto, F.; Zymnis, D.M.; Whittle, A.J. Ground movements due to shallow tunnels in soft ground. II: Analytical interpretation and prediction. J. Geotech. Geoenviron. Eng. 2014, 140, 04013041. [Google Scholar] [CrossRef] [Green Version]
  9. Vitali, O.P.; Celestino, T.B.; Bobet, A. 3D finite element modelling optimization for deep tunnels with material nonlinearity. Undergr. Space 2018, 3, 125–139. [Google Scholar] [CrossRef]
  10. Loganathan, N.; Poulos, H.G.; Stewart, D.P. Centrifuge model testing of tunnelling-induced ground and pile deformations. Geotechnique 2000, 50, 283–294. [Google Scholar] [CrossRef]
  11. Qi, W.; Yang, Z.; Jiang, Y.; Yang, X.; Shao, X.; An, H. Investigation on ground displacements induced by excavation of overlapping twin shield tunnels. Geomech. Eng. 2022, 28, 531–546. [Google Scholar]
  12. Wu, D.; Xu, K.; Guo, P.; Lei, G.; Cheng, K.; Gong, X. Ground Deformation Characteristics Induced by Mechanized Shield Twin Tunnelling along Curved Alignments. Adv. Civ. Eng. 2021, 2021, 6640072. [Google Scholar] [CrossRef]
  13. Mirhabibi, A.; Soroush, A. Effects of surface buildings on twin tunnelling-induced ground settlements. Tunn. Undergr. Space Technol. 2012, 29, 40–51. [Google Scholar] [CrossRef]
  14. Li, Z.; Chen, Z.Q.; Wang, L.; Zeng, Z.K.; Gu, D.M. Numerical simulation and analysis of the pile underpinning technology used in shield tunnel crossings on bridge pile foundations. Undergr. Space 2021, 6, 396–408. [Google Scholar] [CrossRef]
  15. Zhao, K.; Janutolo, M.; Barla, G. A Completely 3D Model for the Simulation of Mechanized Tunnel Excavation. Rock Mech. Rock Eng. 2012, 45, 475–497. [Google Scholar] [CrossRef]
  16. Lou, P.; Li, Y.; Xiao, H.; Zhang, Z.; Lu, S. Influence of Small Radius Curve Shield Tunneling on Settlement of Ground Surface and Mechanical Properties of Surrounding Rock and Segment. Appl. Sci. 2022, 12, 9119. [Google Scholar] [CrossRef]
  17. Li, S.; Li, P.; Zhang, M. Analysis of additional stress for a curved shield tunnel. Tunn. Undergr. Space Technol. 2021, 107, 103675. [Google Scholar] [CrossRef]
  18. Peck, R.B. Deep Excavations and Tunneling in Soft Ground. In Proceedings of the 7th International Conference on Soil Mechanics and Foundation Engineering, Mexico City, Mexico, 25 August 1969; pp. 225–290. [Google Scholar]
  19. Attewell, P. Predicting the dynamics of ground settlement and its derivatives caused by tunnelling in soil. Ground Eng. 1982, 15, 13–22. [Google Scholar]
  20. Zhao, W.; Jia, P.; Zhu, L.; Cheng, C.; Han, J.; Chen, Y.; Wang, Z. Analysis of the Additional Stress and Ground Settlement Induced by the Construction of Double-O-Tube Shield Tunnels in Sandy Soils. Appl. Sci. 2019, 9, 1399. [Google Scholar] [CrossRef] [Green Version]
  21. Cao, L.; Fang, Q.; Zhang, D.; Chen, T. Subway station construction using combined shield and shallow tunnelling method: Case study of Gaojiayuan station in Beijing. Tunn. Undergr. Space Technol. 2018, 82, 627–635. [Google Scholar] [CrossRef]
  22. Finno, R.J.; Clough, G.W. Evaluation of soil response to EPB shield tunneling. J. Geotech. Eng. 1985, 111, 155–173. [Google Scholar] [CrossRef]
  23. Khademian, A.; Abdollahipour, H.; Bagherpour, R.; Faramarzi, L. Model uncertainty of various settlement estimation methods in shallow tunnels excavation; case study: Qom subway tunnel. J. Afr. Earth Sci. 2017, 134, 658–664. [Google Scholar] [CrossRef]
  24. Benmebarek, S.; Kastner, R. Modélisation numérique des mouvements de terrain meuble induits par un tunnelier. Can. Geotech. J. 2000, 37, 1309–1324. [Google Scholar] [CrossRef]
  25. Cheng, H.; Chen, J.; Chen, G. Analysis of ground surface settlement induced by a large EPB shield tunnelling: A case study in Beijing, China. Environ. Earth Sci. 2019, 78, 605. [Google Scholar] [CrossRef]
  26. Imamura, S.; Hagiwara, T.; Mito, K.; Nomoto, T.; Kusakabe, O. Settlement trough above a model shield observed in a centrifuge. In Proceedings of the Centrifuge 98, Tokyo, Japan, 23 September 1998; pp. 713–719. [Google Scholar]
  27. Atkinson, J.H.; Potts, D.M. Subsidence above shallow tunnels in soft ground. J. Geotech. Eng. Div. 1977, 103, 307–325. [Google Scholar] [CrossRef]
  28. Zhou, X.; Bao, C.; Pu, J. Centrifuge model test study on ground settlement induced by tunnel excavation in sandy soil. Rock Soil Mech. 2002, 23, 559–563. [Google Scholar]
  29. Sun, J.; Lu, l.; Wang, G.; Zhou, G.; Tan, S.; Han, S. Calculation Method of Surface Deformation Induced by Small Radius Curve Shield Tunneling Construction. China Railw. Sci. 2019, 40, 63–72. [Google Scholar]
  30. Feng, X.; Wang, P.; Liu, S.; Wei, H.; Miao, Y.; Bu, S. Mechanism and Law Analysis on Ground Settlement Caused by Shield Excavation of Small-Radius Curved Tunnel. Rock Mech. Rock Eng. 2022, 55, 3473–3488. [Google Scholar] [CrossRef]
  31. Lu, L.; Sun, J.; Zhou, G.; Tan, S.; Liu, H.; Li, G. Research on the Surface Deformation Prediction for Curved Shield Construction in Clay Stratum. J. Railw. Eng. Soc. 2018, 35, 99–105. [Google Scholar]
  32. Fan, S.; Song, Z.; Xu, T.; Wang, K.; Zhang, Y. Tunnel deformation and stress response under the bilateral foundation pit construction: A case study. Arch. Civ. Mech. Eng. 2021, 21, 109. [Google Scholar] [CrossRef]
  33. Zhu, Y.; Yang, H.; Liu, Y.; Jiang, X.; Deng, R.; Huang, L.; Yin, P.; Lai, G. Numerical simulation of the combined slope protection effect of living stump and bamboo anchor. Geotech. Geol. Eng. 2021, 40, 635–645. [Google Scholar] [CrossRef]
  34. Eid, M.; Hefny, A.; Sorour, T.; Zaghloul, Y.; Ezzat, M. Numerical analysis of large diameter bored pile installed in multi layered soil: A case study of damietta port new grain silos project. Int. J. Curr. Eng. Technol. 2018, 8, 218–226. [Google Scholar] [CrossRef] [Green Version]
  35. Yuan, C.; Hu, Z.; Zhu, Z.; Yuan, Z.; Fan, Y.; Guan, H.; Li, L. Numerical simulation of seepage and deformation in excavation of a deep foundation pit under water-rich fractured intrusive rock. Geofluids 2021, 2021, 6628882. [Google Scholar] [CrossRef]
  36. Ibrahim, E.; Soubra, A.-H.; Mollon, G.; Raphael, W.; Dias, D.; Reda, A. Three-dimensional face stability analysis of pressurized tunnels driven in a multilayered purely frictional medium. Tunn. Undergr. Space Technol. 2015, 49, 18–34. [Google Scholar] [CrossRef]
  37. Wang, N.; Jiang, Y.; Geng, D.; Huang, Z.; Ding, H. Numerical Investigation of the Combined Influence of Shield Tunneling and Pile Cutting on Underpinning Piles. Front. Earth Sci. 2022, 10, 896634. [Google Scholar] [CrossRef]
  38. Liu, B.; Lin, H.; Chen, Y.; Liu, J.; Guo, C. Deformation stability response of adjacent subway tunnels considering excavation and support of foundation pit. Lithosphere 2022, 2022, 7227330. [Google Scholar] [CrossRef]
  39. Zhang, Y.; Yin, Z.; Xu, Y. Analysis on three-dimensional ground surface deformations due to shield tunnel. Chin. J. Rock Mech. Eng. 2002, 21, 388–392. [Google Scholar]
  40. Sun, J.; Liu, H. 3-D numerical simulation of ground surface settlement under overlapped shield tunneling. J. Tongji Univ. Nat. Sci. 2002, 30, 379–385. [Google Scholar]
  41. He, C.; Su, Z.; Zeng, D. Influence of metro shield tunneling on existing tunnel dir ectly above. China. Civ. Eng. J. 2008, 41, 91–98. [Google Scholar]
  42. Sigl, O.; Atzl, G. Design of bored tunnel linings for Singapore MRT North East Line C706. Tunn. Undergr. Space Technol. 1999, 14, 481–490. [Google Scholar] [CrossRef]
  43. Zhu, H.-H.; Wang, D.-Y.; Shi, B.; Wang, X.; Wei, G.-Q. Performance monitoring of a curved shield tunnel during adjacent excavations using a fiber optic nervous sensing system. Tunn. Undergr. Space Technol. 2022, 124, 104483. [Google Scholar] [CrossRef]
  44. Zhang, M.; Li, S.; Li, P. Numerical analysis of ground displacement and segmental stress and influence of yaw excavation loadings for a curved shield tunnel. Comput. Geotech. 2020, 118, 103325. [Google Scholar] [CrossRef]
  45. Zhao, D. Study on Construction Mechanical Characteristics of the Small Radius Curve and Large Gradient Shield Tunnel. Master’s Thesis, Central South University, Changsha, China, 20 May 2007. [Google Scholar]
  46. Deng, H.-S.; Fu, H.-L.; Yue, S.; Huang, Z.; Zhao, Y.-Y. Ground loss model for analyzing shield tunneling-induced surface settlement along curve sections. Tunn. Undergr. Space Technol. 2022, 119, 104250. [Google Scholar] [CrossRef]
  47. Xu, P.; Xi, D. Investigation on the surface settlement of curved shield construction in sandy stratum with laboratory model test. Geotech. Geol. Eng. 2021, 39, 5493–5504. [Google Scholar] [CrossRef]
Figure 1. Location of the small radius curved shield tunnel of Jiaru River Parking Yard entry line of Zhengzhou Metro Line 3.
Buildings 13 00803 g001
Figure 2. Layout of monitoring points of the representative cross section.
Buildings 13 00803 g002
Figure 3. Schematic diagram of the model.
Buildings 13 00803 g003
Figure 4. Arrangement and grouping of thrust: (a) tail jacks; (b) in the simulation.
Buildings 13 00803 g004
Figure 5. Surface settlement obtained from different methods.
Buildings 13 00803 g005
Figure 6. Horizontal displacement of surrounding soil from field monitoring and numerical simulation: (a) outer side of curved tunnel axis; (b) inner side of tunnel.
Buildings 13 00803 g006aBuildings 13 00803 g006b
Figure 7. Surface settlement under various thrust ratios: (a) curves of surface settlement; (b) maximum surface settlement with various thrust ratios.
Buildings 13 00803 g007
Figure 8. Curves of horizontal displacement of surrounding soil under various thrust ratios: (a) outer side of curved tunnel axis; (b) inner side of tunnel.
Buildings 13 00803 g008
Figure 9. Surface settlement under various curvature radiuses: (a) curves of surface settlement; (b) maximum surface settlement with various curvature radiuses.
Buildings 13 00803 g009
Figure 10. Amount of over excavation versus curvature radius [45].
Buildings 13 00803 g010
Figure 11. Curves of horizontal displacement of surrounding soil with curvature radius: (a) outer side of curved tunnel axis; (b) inner side of tunnel axis.
Buildings 13 00803 g011aBuildings 13 00803 g011b
Figure 12. Surface settlement under various grouting pressures: (a) curves of surface settlement; (b) maximum surface settlement with various grouting pressures.
Buildings 13 00803 g012
Figure 13. Curves of horizontal displacement of surrounding soil with various grouting pressures: (a) outer side of curved tunnel axis; (b) inner side of tunnel.
Buildings 13 00803 g013aBuildings 13 00803 g013b
Table 1. Physical and mechanical parameters of soil.
Soil LayerThickness
(m)
Poisson’s RatioCompression Modulus
(MPa)
Friction Angle
(°)
Unit Weight
(kN/m3)
Cohesion
(kPa)
Fill2.00.303.615.618.417.0
Clayey silt20.60.319.414.319.622.5
Silty clay17.40.277.919.619.733.8
Table 2. Detailed information of field monitoring of displacement.
Monitoring ItemsInstrumentsStandard DeviationFrequency
Surface settlement Level gauge0.3 mm/kmOnce a day (d * ≤ 20 m)
Once every two days (d > 20 m)
Horizontal displacementSlip inclinometer0.02 mm/500 mmOnce a day
* “d” means the distance between heading face and monitoring cross section.
Table 3. Physical and mechanical parameters of materials in the simulation.
MaterialsUnit Weight
(kN/m3)
Elastic Modulus
(MPa)
Poisson’s Ratio
Segments272.93×1040.20
Shield shell762.15×1050.30
Grouting layer
(Before solidification)
251.70.32
Grouting layer
(After solidification)
28170.25
Table 4. Detailed data about maximum surface settlement under various grouting pressures.
Grouting Pressure
(MPa)
Corresponding Maximum Surface Settlement
(mm)
Source of Data
0.10, 0.15, 0.20, 0.25−27.29, −24.23, −21.96, −20.01This study
0.10, 0.15, 0.20, 0.30−10.25, −9.42, −8.59, −7.15Mei et al. [1]
0.05, 0.10, 0.15, 0.20, 0.30, 0.40, 0.50−37.66, −30.78, −24.88, −20.58, −15.30, −12.23, −11.74Lou et al. [16]
0.10, 0.20, 0.30, 0.40, 0.50−11.52, −10.08, −9.24, −9.04, −8.73Feng et al. [30]
Table 5. Regression parameters of multiple linear analysis.
ProjectCoefficientStandard ErrorStandardized
Regression Coefficient
T-StatisticSignificance
Constant28.9011.462-19.7631.088 × 10−6
T6.3060.3630.78017.3962.313 × 10−6 *
R−0.0110.003−0.185−4.1650.006 *
p−48.3164.846−0.438−9.9705.893 × 10−5 *
Note: At the significance level of 0.05, * means significant.
Disclaimer/Publisher’s Note: The statements, opinions and data contained in all publications are solely those of the individual author(s) and contributor(s) and not of MDPI and/or the editor(s). MDPI and/or the editor(s) disclaim responsibility for any injury to people or property resulting from any ideas, methods, instructions or products referred to in the content.

