Article

Effect of Block Morphology on Building Energy Consumption of Office Blocks: A Case of Wuhan, China

1
School of Architecture & Urban Planning, Huazhong University of Science and Technology, Wuhan 430073, China
2
Hubei New Urbanization Engineering and Technology Research Center, Wuhan 430073, China
3
China Railway Development and Investment Group Co., Ltd., Kunming 650500, China
4
Department of Architecture and Built Environment, University of Nottingham, Ningbo 315100, China
5
School of Civil Engineering and Built Environment, Liverpool John Moores University, Cherie Booth Building, Byrom St., Liverpool L3 3AF, UK
*
Author to whom correspondence should be addressed.
Buildings 2023, 13(3), 768; https://doi.org/10.3390/buildings13030768
Submission received: 20 February 2023 / Revised: 9 March 2023 / Accepted: 11 March 2023 / Published: 15 March 2023
(This article belongs to the Special Issue Study on Building Energy Efficiency Related to Simulation Models)

Abstract

:
Block morphology refers to critical parameters influencing building energy performance on the block scale. However, analysis of the combined effect of block morphological parameters on building energy consumption with real blocks is lacking. In this paper, the aim is to evaluate the combined effect of office block morphology on building energy consumption in the context of the Hot-summer and Cold-winter zone in China. First, a workflow for the energy assessment of office buildings with the coupled block morphology on the block scale was proposed with evaluation tools. Seventy office blocks in Wuhan were taken as examples and then classified based on building layout typology and building height. Afterwards, the morphological parameters and building energy use intensity (EUI) for different blocks were calculated. Then, the combined effect of block morphology on the buildings’ energy consumption was evaluated and the model on predicting the building energy consumption of office blocks was proposed. Finally, based on the results, low-energy design strategies were projected for office blocks. The results illustrated that the effect of block morphology on building cooling, heating, and lighting is EUI 28.83%, 28.56%, and 23.23%, respectively. Building shape factor (BSF), floor area ratio (FAR), average building height of block (BH), and average building depth of block (BD) are effective block morphological parameters. The key morphological parameters which combined affect the building energy consumption of office blocks are BSF and FAR; BSF has 1.24 times the effect on building energy consumption than FAR. The workflow built in this paper can be applied to other cities around the world for promoting sustainable cities.

1. Introduction

1.1. Background

The world is in the midst of its first global energy crisis, and to tackle it, the IEA has set out its analysis of energy supply per capita in three scenarios. The three scenarios are the stated policies scenario (STEPS), announced pledges scenario (APS), and net zero emissions (NZE) by 2050 scenario [1]. Regional trends in per capita energy demand under these three scenarios are shown in Figure 1. In the STEPS scenario, energy demand in developed economies declines at a rate of 0.5% per year. Renewable energy applications and energy electrification accelerate in the APS scenario, with a 17% reduction in fossil fuel demand in 2030 compared to the STEPS scenario. By 2030, energy demand in developing economies will grow at more than 1.4% per year under the STEPS scenario. China and India alone account for nearly 50% of energy growth [1]. Regional trends in per capita CO2 emissions in 2020 and 2030 of the APS are shown in Figure 2. By 2030, the US’ CO2 emissions are 30% lower in the APS than the STEPS scenario and per capita CO2 emissions are reduced to 8 tonnes of CO2 per capita, while China’s CO2 emissions will be cut by 6.25% by 2030 [2].
According to the International Energy Agency, the sectors of building and building construction together are accountable for nearly a third of the total global energy consumption, and almost 15% of direct CO2 emissions in 2021 [2]. Therefore, there is a global consensus to save energy consumption in buildings. With the support of national policies [3,4], China is showing a trend towards the development of green buildings on a larger scale. Urban blocks in China consist of a multitude of functions, which include commercial, residential, industrial, office, etc. Office blocks account for greater than 50% of the floor area of public buildings, and the energy consumption per square meter of floor area of office buildings is 2.4 times higher than that of urban residential buildings [5]. Office blocks play a vital role in the development of urban green blocks.

1.2. Literature Review

1.2.1. Urban Building Energy Modeling

With the continuous expansion of research on building energy consumption and the further development of computer technology, building energy consumption models at the building level are increasingly unable to meet the application requirements of the quantitative energy consumption assessment of building groups in complex urban environments, and it is difficult to make technical support available for the formulation of energy-saving targets and energy policies at the macro level of cities [6]. Therefore, it is urgent to study urban building energy consumption.
City information modelling (CIM) has become a research hotspot in recent years, as it can be used as a support decision tool for urban management, sustainable urban development, and smart city construction [7]. Urban building energy modeling (UBEM) is a domain of CIM implementation [8]. UBEM is a bottom-up, physics-based approach for simulating the thermal performance of new or existing neighborhoods and cities [9]. Reinhart and Cerezo Davila [10] defined urban building energy modeling (UBEM), which is an expanding area in modelling building energy, which covers a spatial scale from an urban block to a district for a whole city [11]. It is presently understood that urban building energy performance is dependent upon four dimensional factors [12], which are, respectively, (1) urban block morphology, (2) building design, (3) systems efficiency, and (4) occupant behavior (Figure 3). Block morphology refers to the critical parameters affecting building energy consumption on the block scale.

1.2.2. The Effect of Block Morphology on Building Energy Consumption

Block morphology is an effective means of controlling the energy consumption of buildings [13,14], which can affect around 10% to 30% or more of a building’s energy consumption [12,15]. Shareef and Altan [16] carried out a study on the impact of sinuous morphology on building energy consumption in Dubai, the results of which showed that the building energy for cooling can be reduced by 4.9% when buildings are arranged to be alternating in urban blocks. Bat et al. [17] researched the relationship between urban courtyard morphology and building energy consumption in different climates (cold, temperate, hot, and arid climates), the results showed that, in temperate climates, a courtyard with less width and a medium-depth shape allowed a reduction of building energy demand of about 58%. Bansal and Quan [18] studied the relationship between the urban form and energy consumption of residential buildings in different local climate zone contexts in Seoul, with the electricity and gas dataset; the results demonstrated that the local climate zone explained 16.2% and 13.2% of the variance in electricity and gas use, respectively. Deng et al. [19] carried out the effect of the residential block layout morphology on the building energy consumption for heating in cold II B zones in China; the research results showed that increasing the spacing between residential buildings can reduce heating energy consumption by 4%. Li et al. [20] studied the relationship between block morphology and household building energy consumption in Ningbo, China, with a real-block morphology and utility bill data of 534 household in 46 residential blocks; the results showed that the building energy consumption increases by 9.1%, when the floor area ratio increases per unit. In addition, other scholars have conducted empirical studies on the prediction of building energy consumption [21] and the identification of key morphological parameters affecting building energy consumption [22] using real-world data.
Some scholars have begun to study the correlation between block morphology and building energy consumption based on block-prototype morphology. Vartholomaios [23] carried out the effect of block morphology on the domestic energy consumption of heating and cooling in a Mediterranean city based on a parametric sensitivity analysis with the block prototype. The results showed that the difference in cooling and heating energy consumption due to morphological parameters in different urban density blocks ranges from 13.96% to 22.08%. Shi et al. [24] came up with a parametric method to investigate the relationship between block morphology and building energy consumption in a Singapore urban context using the block prototype. Other scholars have studied the correlation between block morphology and building energy consumption from different perspectives, using the block prototype in different climate zones [16,25,26,27]. Due to the complexity of real urban blocks, the use of the block prototype cannot fully restore the characteristics of real blocks and thus guide urban design and architectural practice. It is therefore necessary to carry out a study of the building energy consumption based on a real-block morphology.
Most of the current scholarly research on the impact of block morphology on building energy consumption is focused on the relationship between a single block morphological parameter and building energy consumption. Andersena and Sattrup [15] studied the effect of the urban canyon morphology on the energy consumption of office buildings using a qualitative approach in the context of Copenhagen, a temperate marine climate zone. The findings demonstrated that the geometry morphology of urban canyons had an impact on the total energy consumption of office buildings by up to 30%. Shareef [28] studied the impact of urban block morphology and the building’s height diversity on the building energy consumption of residential blocks, using a qualitative approach in the desert climate zone of Dubai city. The results indicated that the main effect on the cooling energy consumption in urban blocks was from the orientation of the building, with a 6.4% reduction in the N–S orientation compared to NW–SE. Mangan et al. [29] evaluated the effect of morphological parameters such as building height to street width, orientation, and building type on the energy consumption of residential buildings, using a qualitative approach in temperate-humid zones. The findings indicated that increasing the building height of rectangular-pavilion, rectangular-slab, and square-pavilion residential buildings can reduce building energy consumption by 14%, 8%, and 18%, respectively. Zhang et al. [30] investigated the relationship between urban block morphology and building energy use in the urban context of Singapore, with thirty generic urban residential block cases in six typologies. The results showed that differences in urban block types can lead to up to 12 times the rate of reduction in building cooling loads and 25% reduction in the net energy use intensity of buildings, under identical planning conditions and design properties.
It has been found that building energy consumption is affected by multi-block morphological parameters [18,31,32,33], However, the mechanisms of the combined effect of block morphological parameters on building energy consumption have not been evaluated in detail, especially using a real-block morphology in the Hot-summer and Cold-winter zone in China. Such knowledge will play a vital role in optimal design approaches in the future for the low-energy design of office blocks. Immediate improvements in understanding the effect of block morphological parameters on building energy consumption are required. Particularly, preceding research which provides accurate evaluations of the building energy consumption of office blocks in China is very limited, and few applicable works of research have been carried out in relation to climatic conditions such as those in central China. Studies carried out under real climatic conditions are essential, because the existing studies have shown that the building energy consumption of office blocks in different climate zones show different characteristics of results [34].

1.3. Research Aim

In this context, this study aims to quantify the combined effect of block morphology on office building energy consumption, focusing on the following three issues:
  • Are there differences in building energy consumption distribution characteristics among different office blocks? If so, to what extent?
  • Do block morphological parameters have an effect on building energy consumption? If so, what morphological parameters? To what extent?
  • What are the key morphological parameters that have a combined effect on building energy consumption in office blocks?
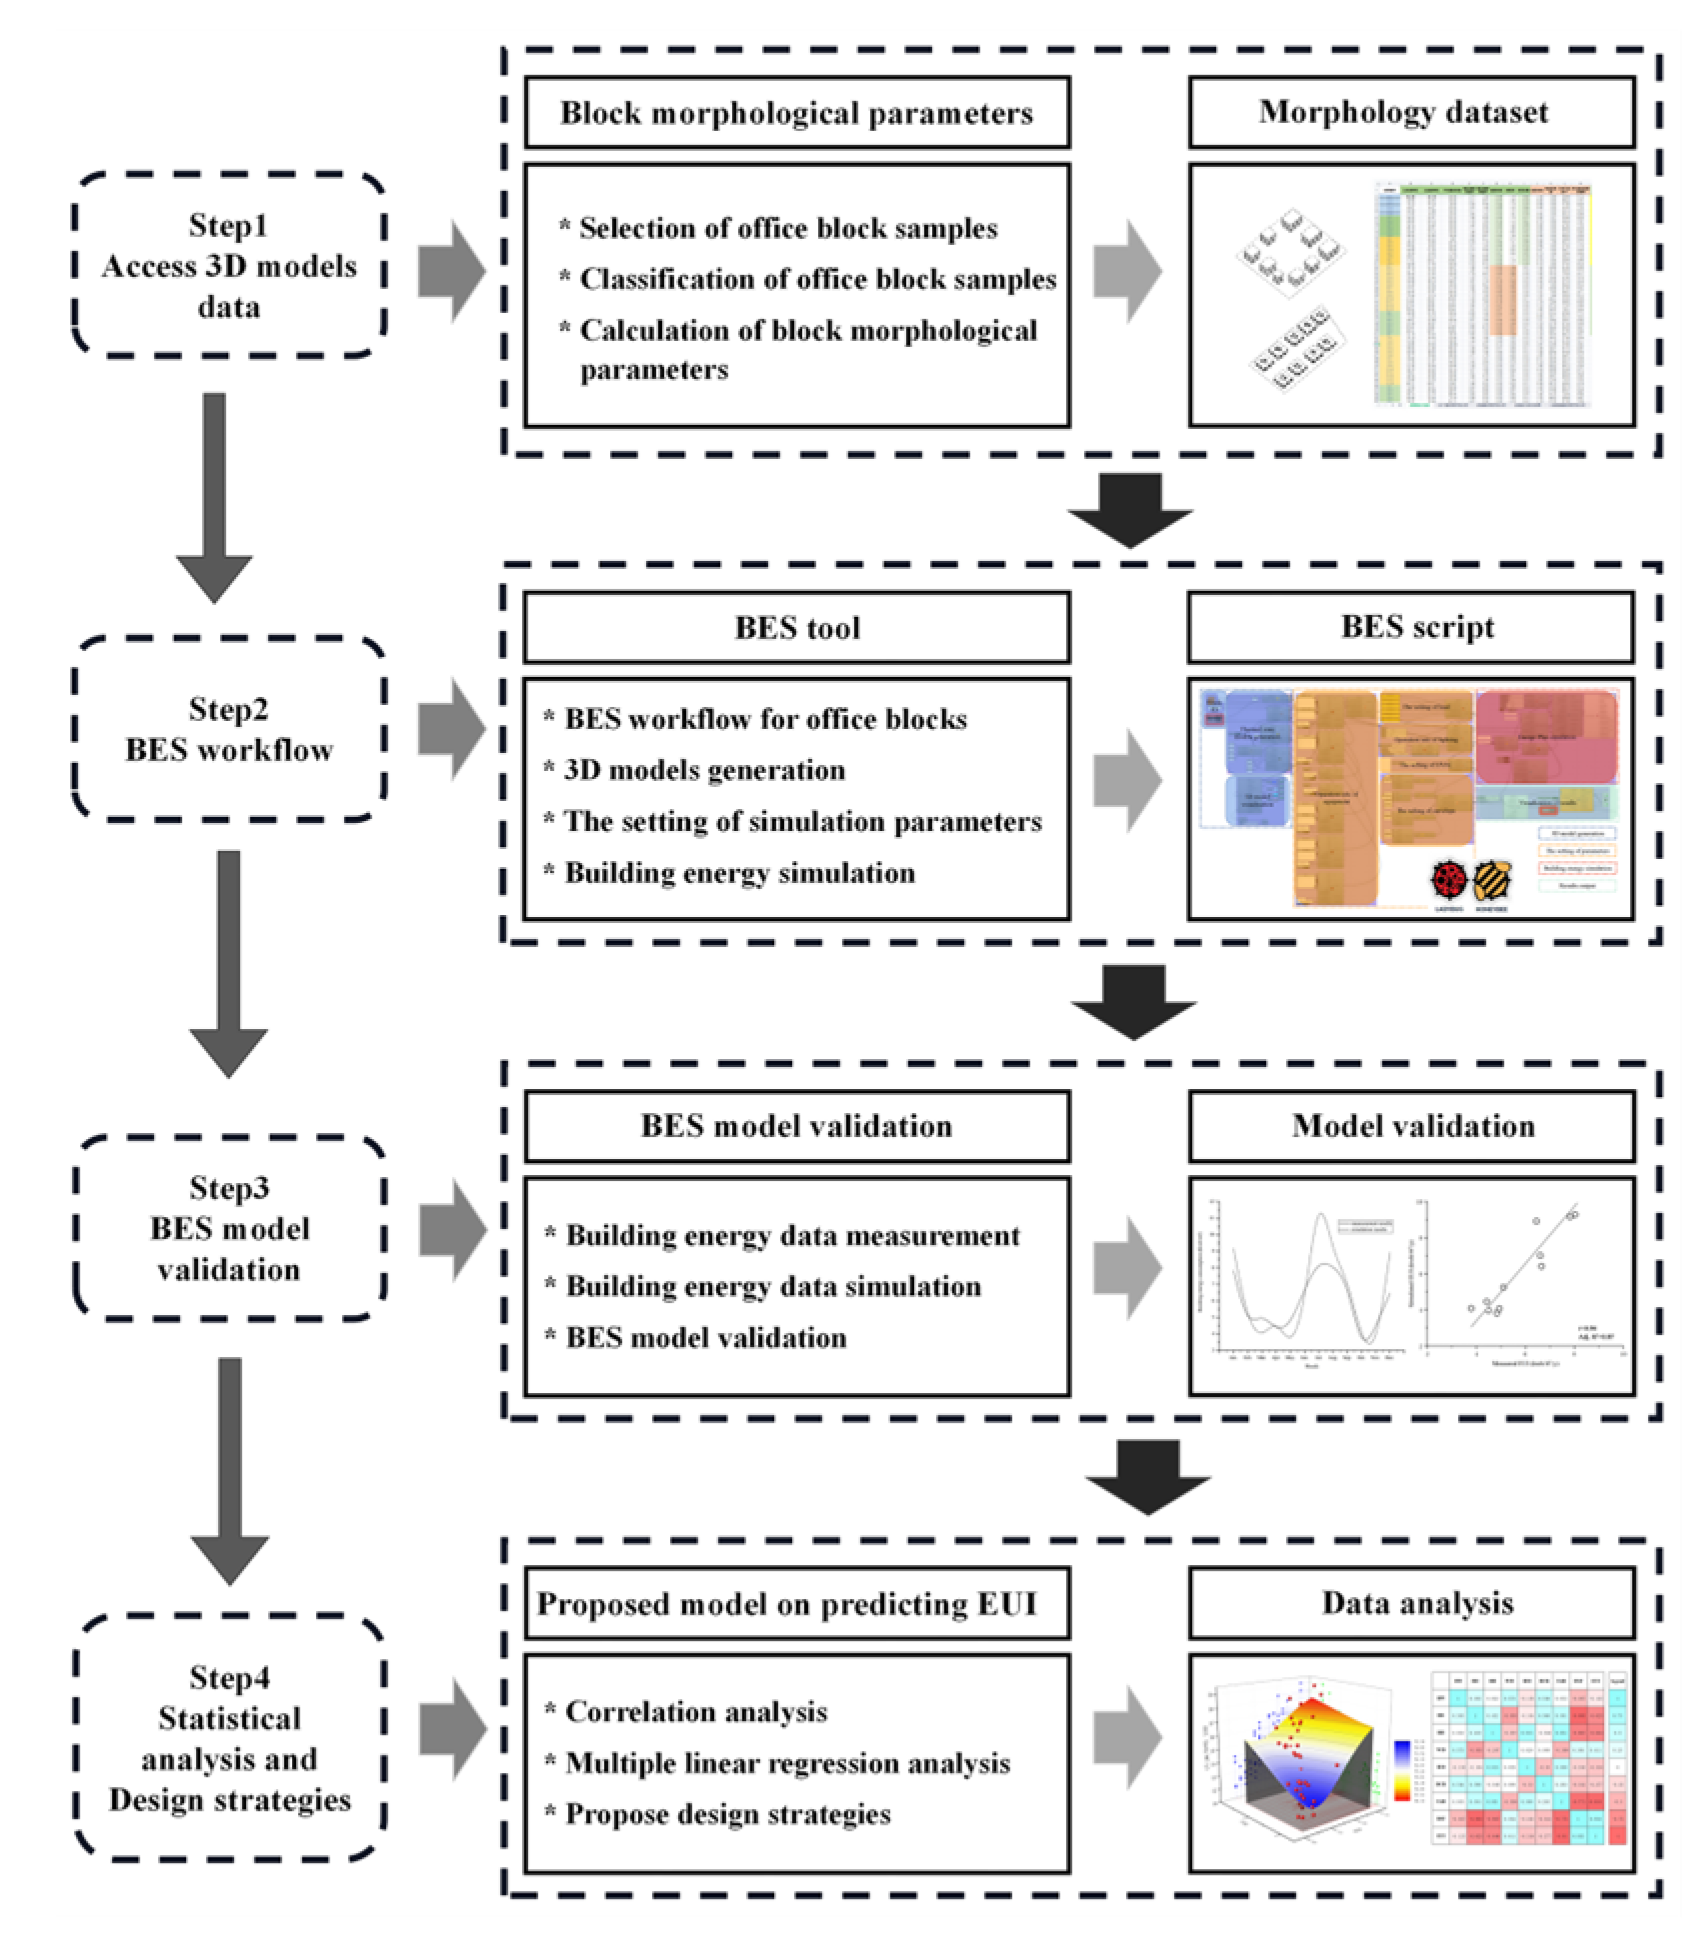
2. Methodology

The research workflow for this study is shown in Figure 4. It can be divided into four major steps: (1) access to 3D model data of office blocks; (2) building energy simulation (BES) workflow; (3) BES model validation; and (4) statistical analysis and proposal of design strategies.

2.1. Access to 3D Model Data of Office Blocks

A combination of Open Street Map and satellite maps was used to obtain information about the floor plan and dimensions of office blocks through field research combined with street maps to obtain information about building heights and window-to-wall ratios, and then to build a 3D model. This method has been proven to be scientifically sound and feasible by academics [35]. To ensure the accuracy of the energy simulation results, the acquisition of 3D model data of office blocks includes three aspects: (1) selection of samples: The selected samples cover the whole city to make the selected samples representative. (2) calculation of morphological parameters: Morphological parameters include average building width of block (BW), average building depth of block (BD), average building height of block (BH), width-to-depth ratio of block (W/D), height-to-depth ratio of block (H/D), building shape factor (BSF), building coverage ratio (BCR), and floor area ratio (FAR). (3) acquire data used for the building energy simulation: The data include window-to-wall ratio of buildings, building envelope, occupancy rate, the operation rate of lighting and equipment, etc.

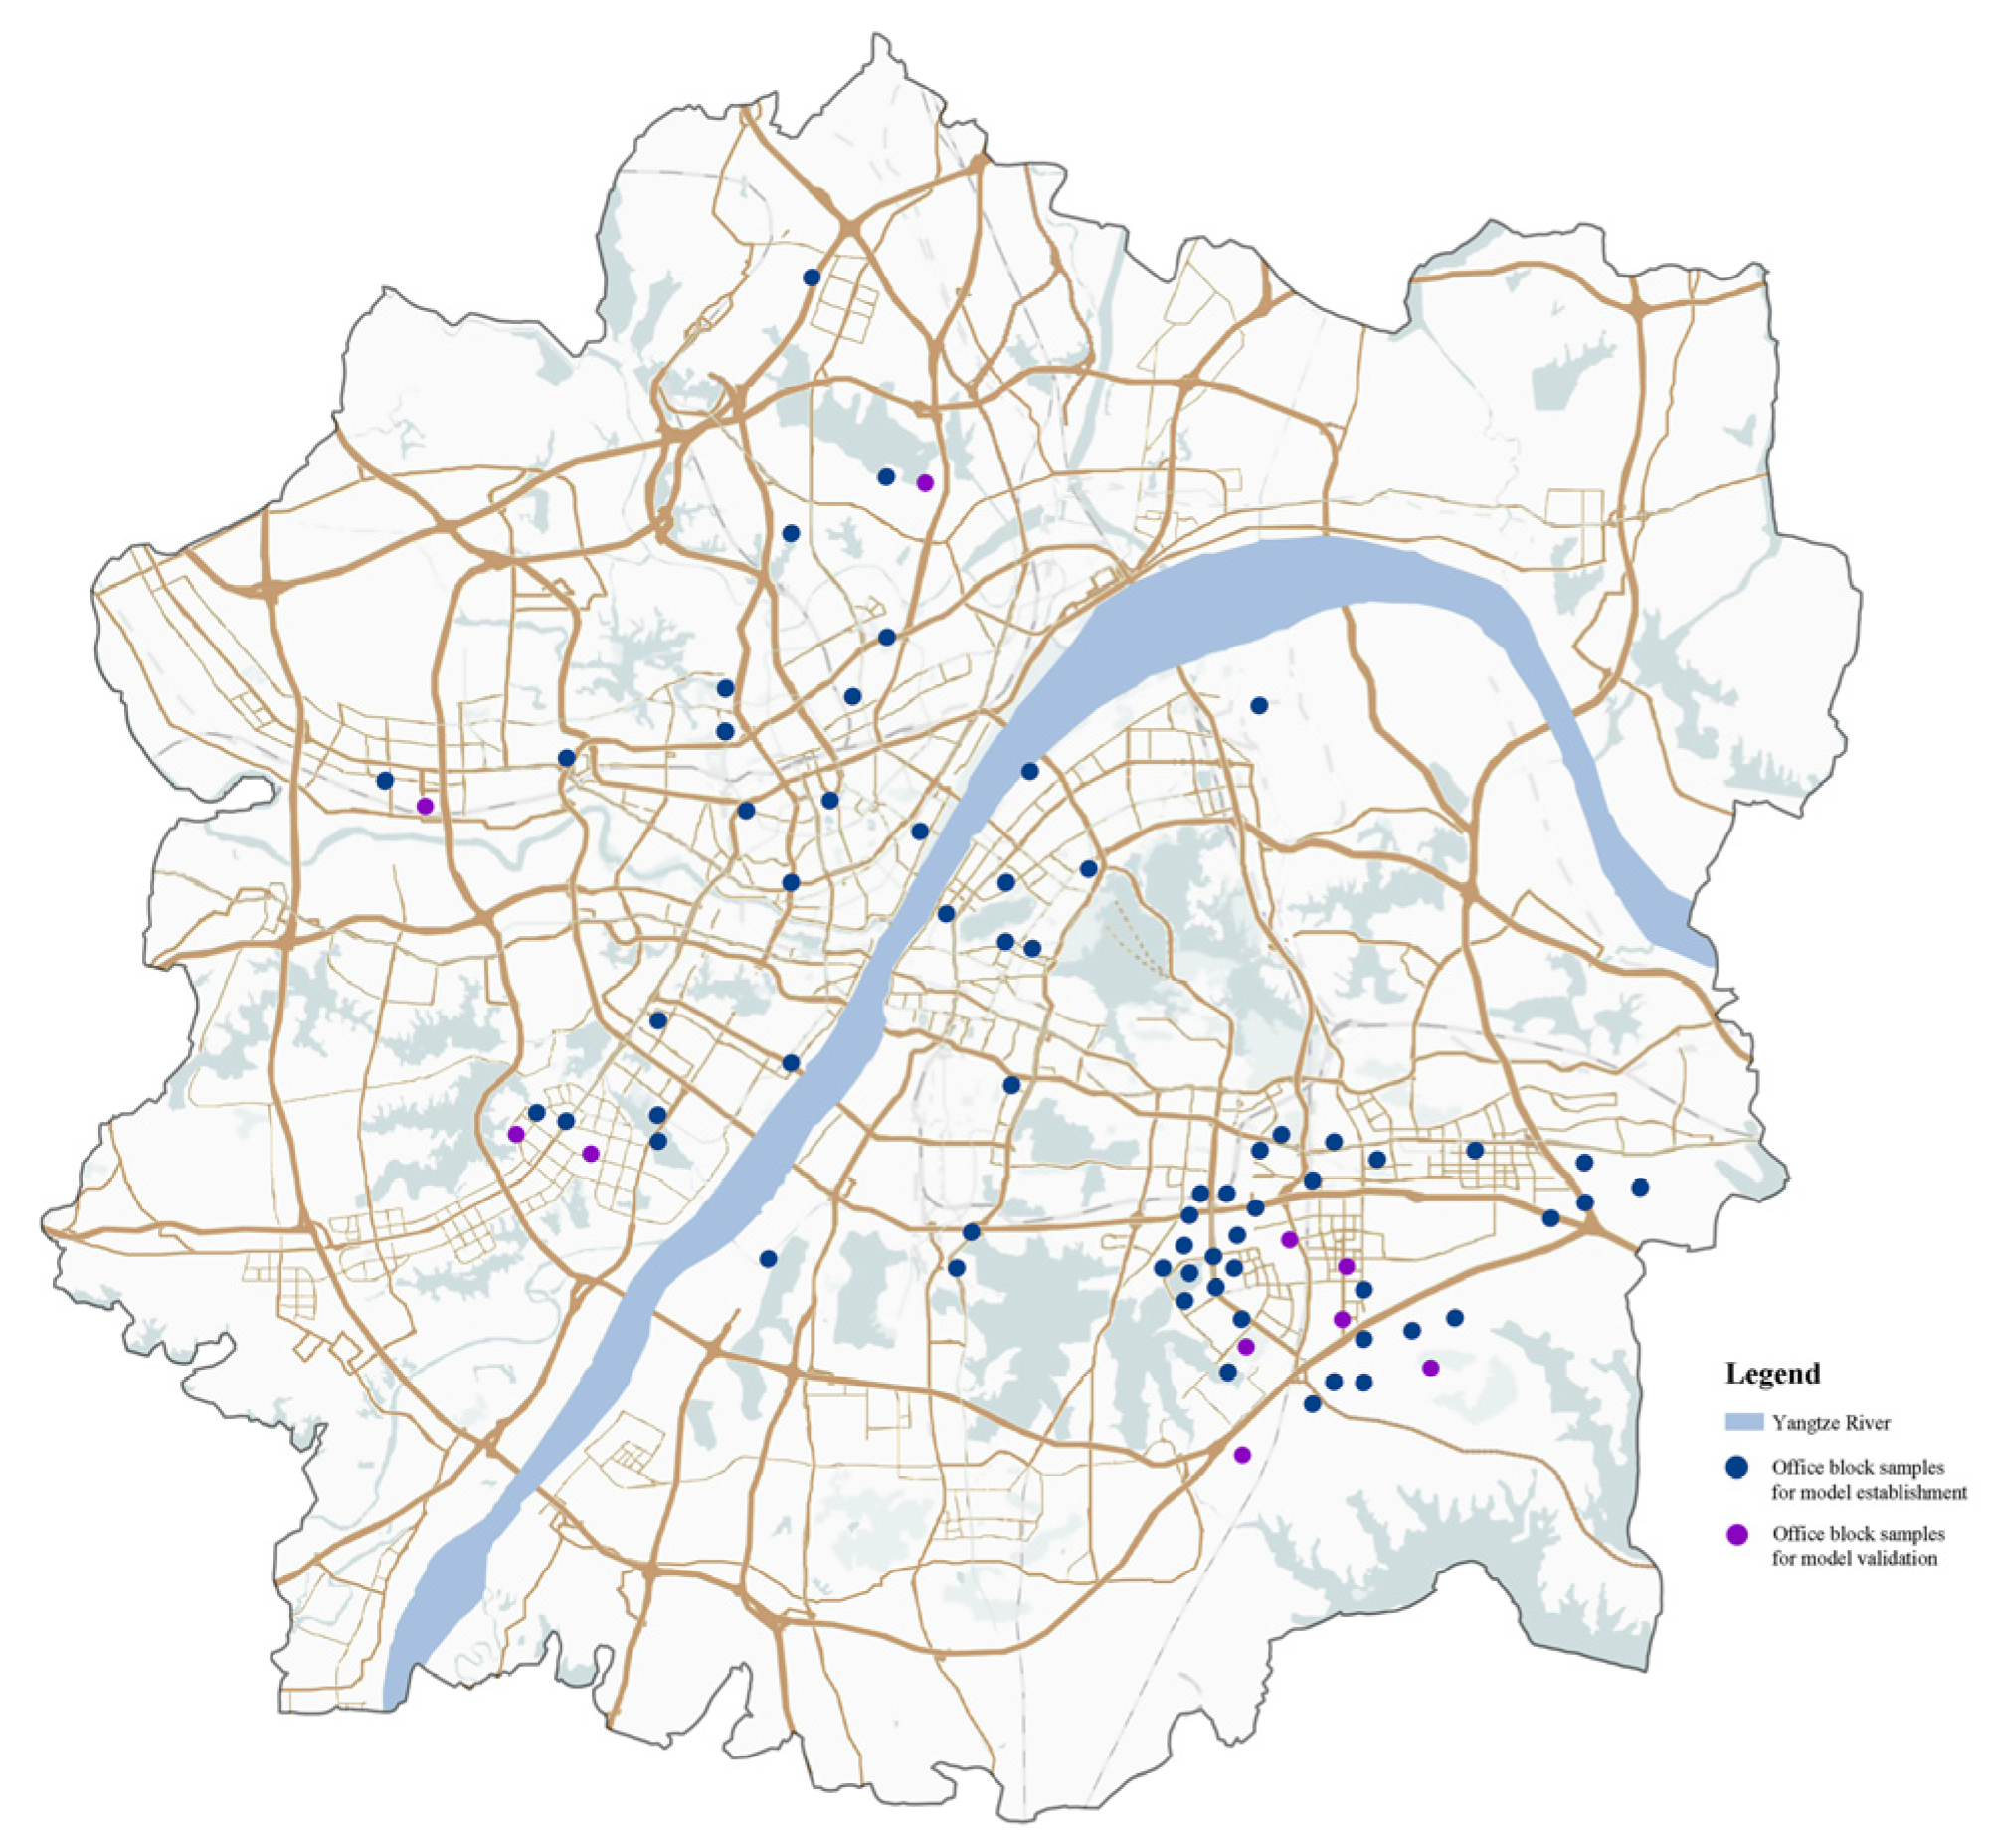
2.1.1. Selection of Samples

In order to ensure that the selection of samples reflects the overall characteristics of office blocks in Wuhan, the block samples selected for this paper should satisfy several principles: (1) the land area of sample should be less than 1 km2; (2) the building function of the block is mainly office; (3) the number of buildings in the block should be no less than 3, so as to give the block a distinct group character; and (4) the samples selected are built after the year 2000, in order to avoid excessive differences in thermal performance among office block buildings.
Based on the above principles, seventy office block samples in Wuhan were selected. Of these, 60 samples were used to develop building energy prediction model and 10 samples were used for model validation. The geographical distribution of the selected samples in Wuhan is shown in Figure 5.

2.1.2. Classification of Office Block Samples

The research aims to find the combined effect of block morphology on building energy consumption on the block scale. In addition, the purpose of classifying office blocks is to reconcile the research findings with the process of planning and design. Through field surveys and literature review [36], it can be found that office blocks in China show a certain consistency in terms of floor plan layout. Office blocks in China are usually composed of multiple buildings, mostly in the form of pavilion, slab, and courtyard layouts. The office buildings are mainly in the range of 1–6 storeys, 7–12 storeys, and 13–25 storeys. This is mainly due to the mandatory national code requirements for lighting and fire evacuation in office buildings [37,38]. Based on the above description, this study uses a combination of building layout and building height to classify office blocks.
Three layout typologies of blocks, namely, pavilion, slab, and courtyard [12,39,40,41], and three building height of blocks, namely, multi-storey, mid-rise, and high-rise [42], were selected to analyze and compare block morphological parameters and building energy consumption. Based on building layout type and building height type, this paper classified office blocks into the following seven categories: pavilion multi-storey, slab multi-storey, courtyard multi-storey, mid-rise pavilion, mid-rise slab, high-rise pavilion, and high-rise slab. The detailed classification results are shown in Table 1.

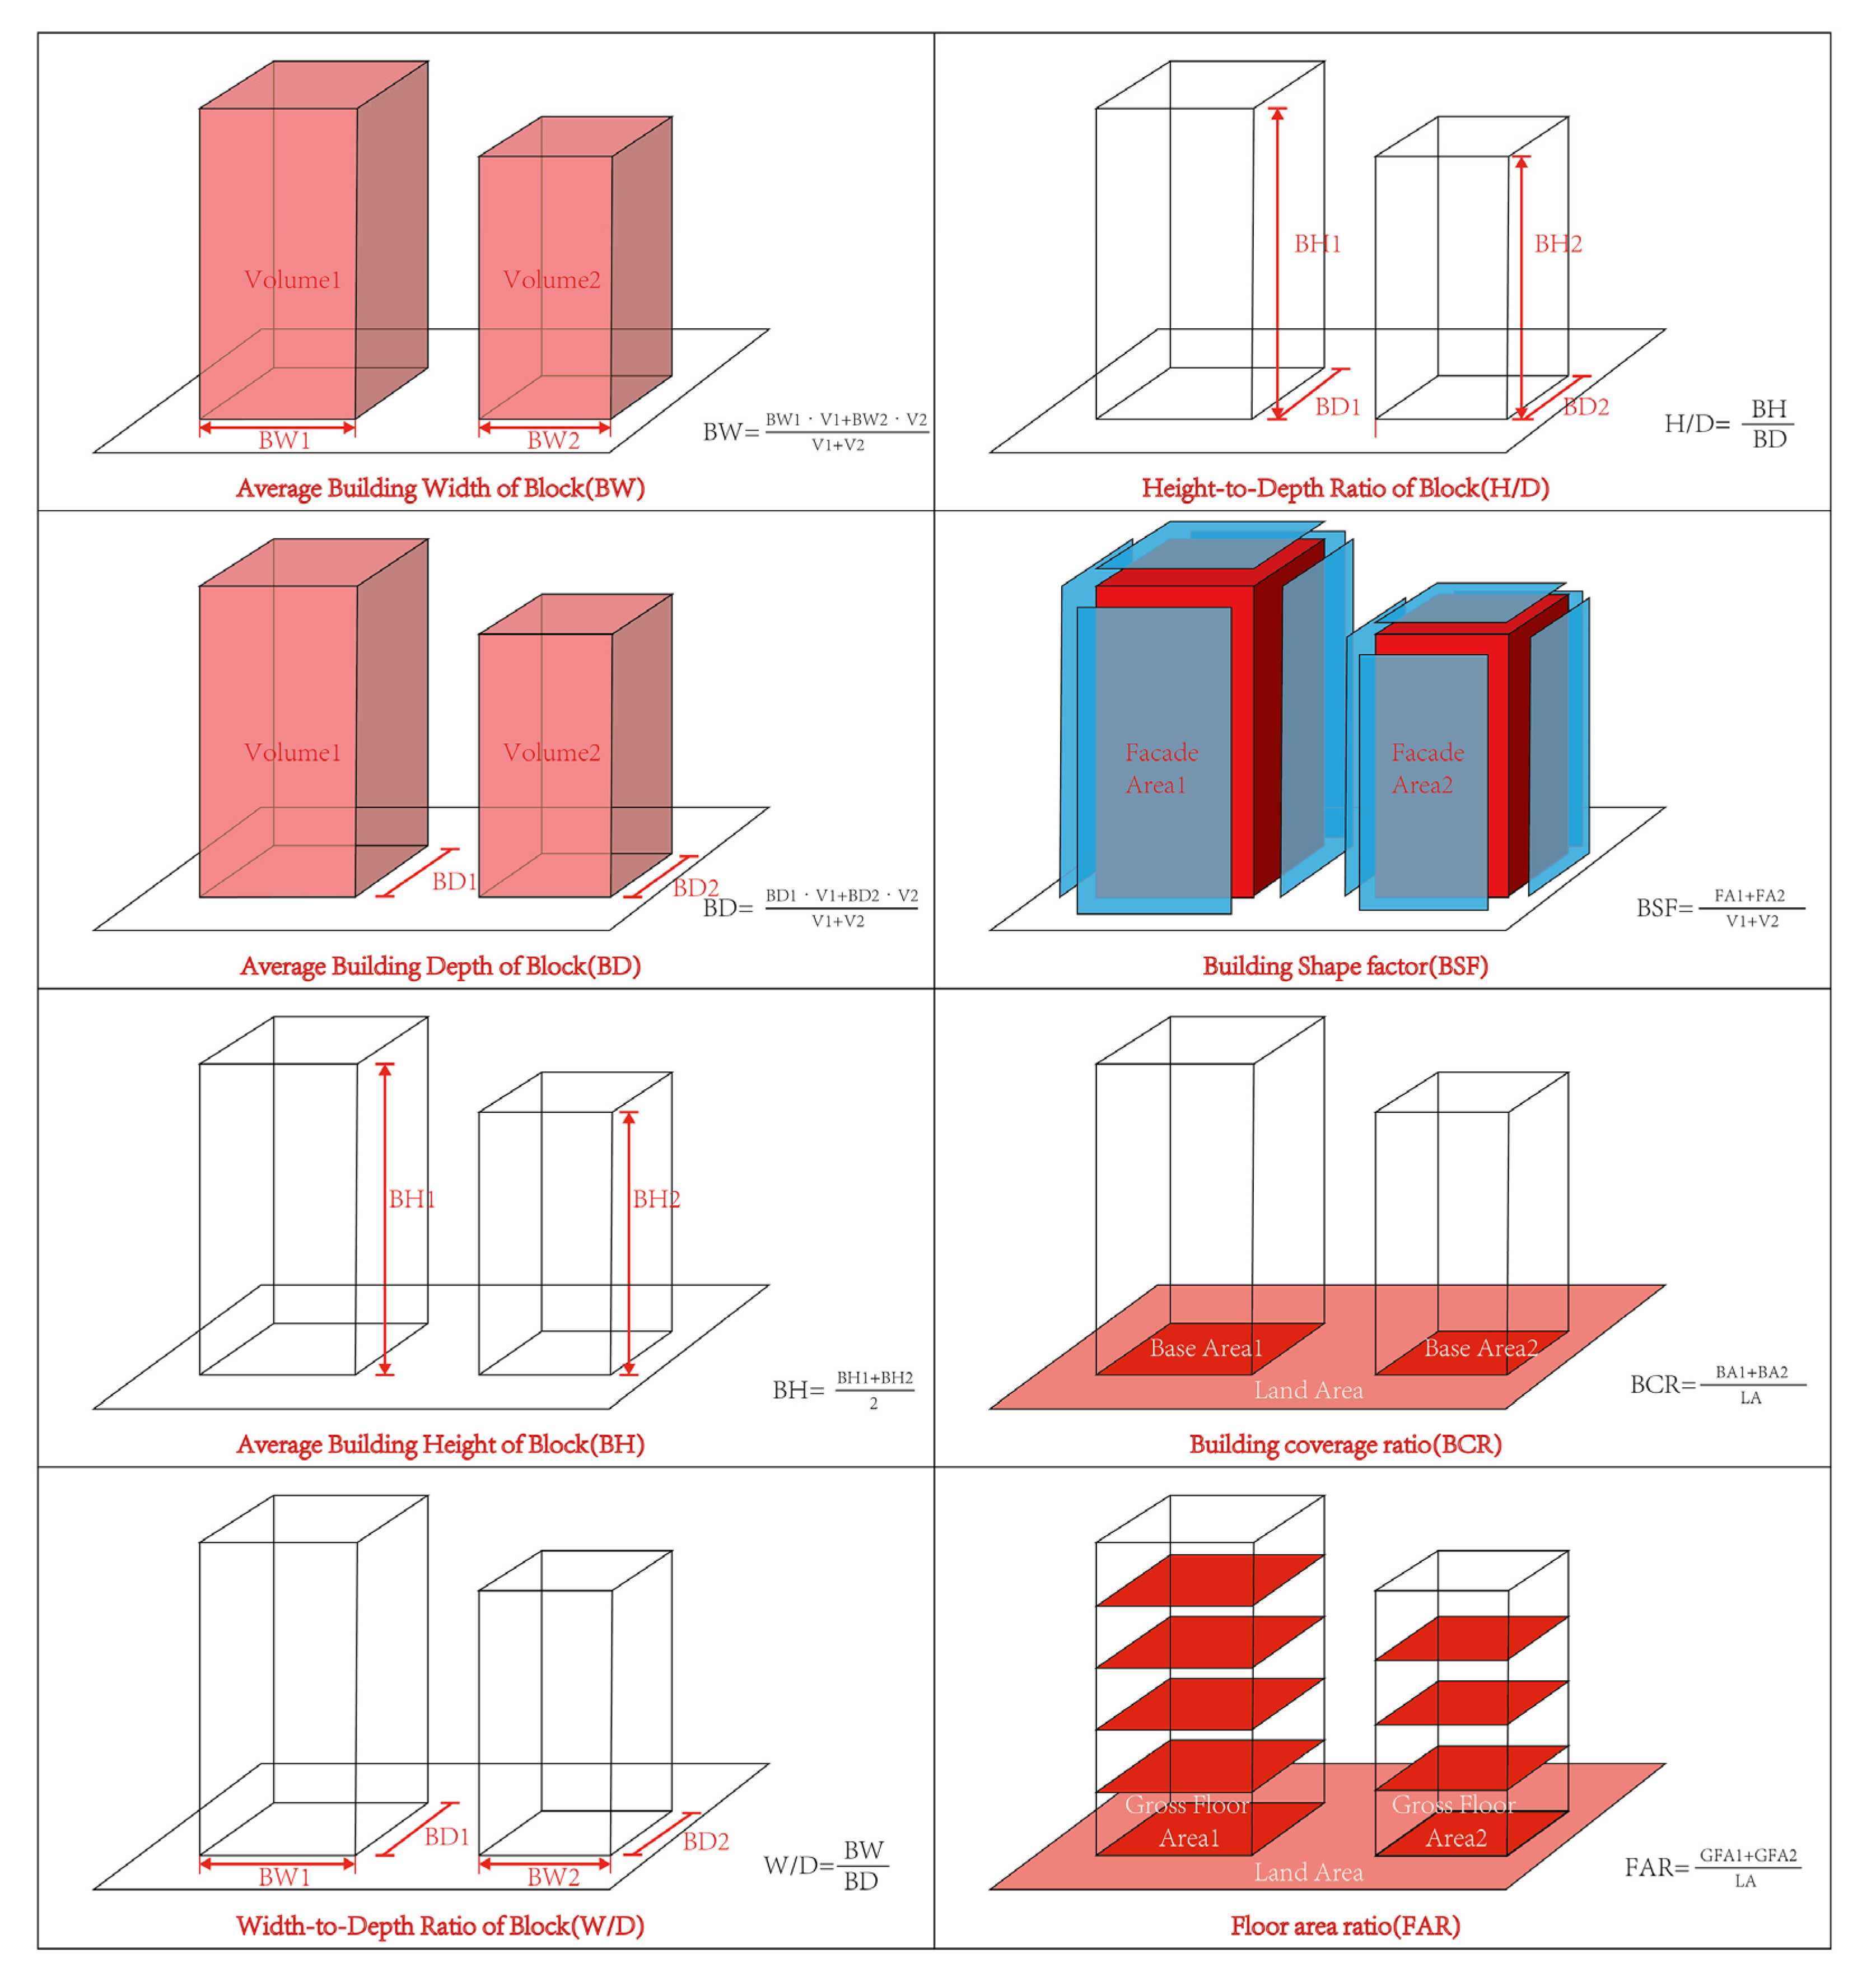
2.1.3. Calculation of Block Morphological Parameters

The block morphology is in reference to the spatial configuration of urban land use within a block area [43]. After the urban block design is put forward, several block morphological parameters can be defined to describe the block, and this also corresponds greatly to energy demand. The block morphology parameters selected in this paper should be considered in block design practice. The calculation equation of each morphological parameter is shown in Figure 6. This paper accurately studied the building energy consumption of office blocks with different morphological typologies through the analysis of block morphological parameters. The morphological parameters of different block samples are shown in Appendix A.

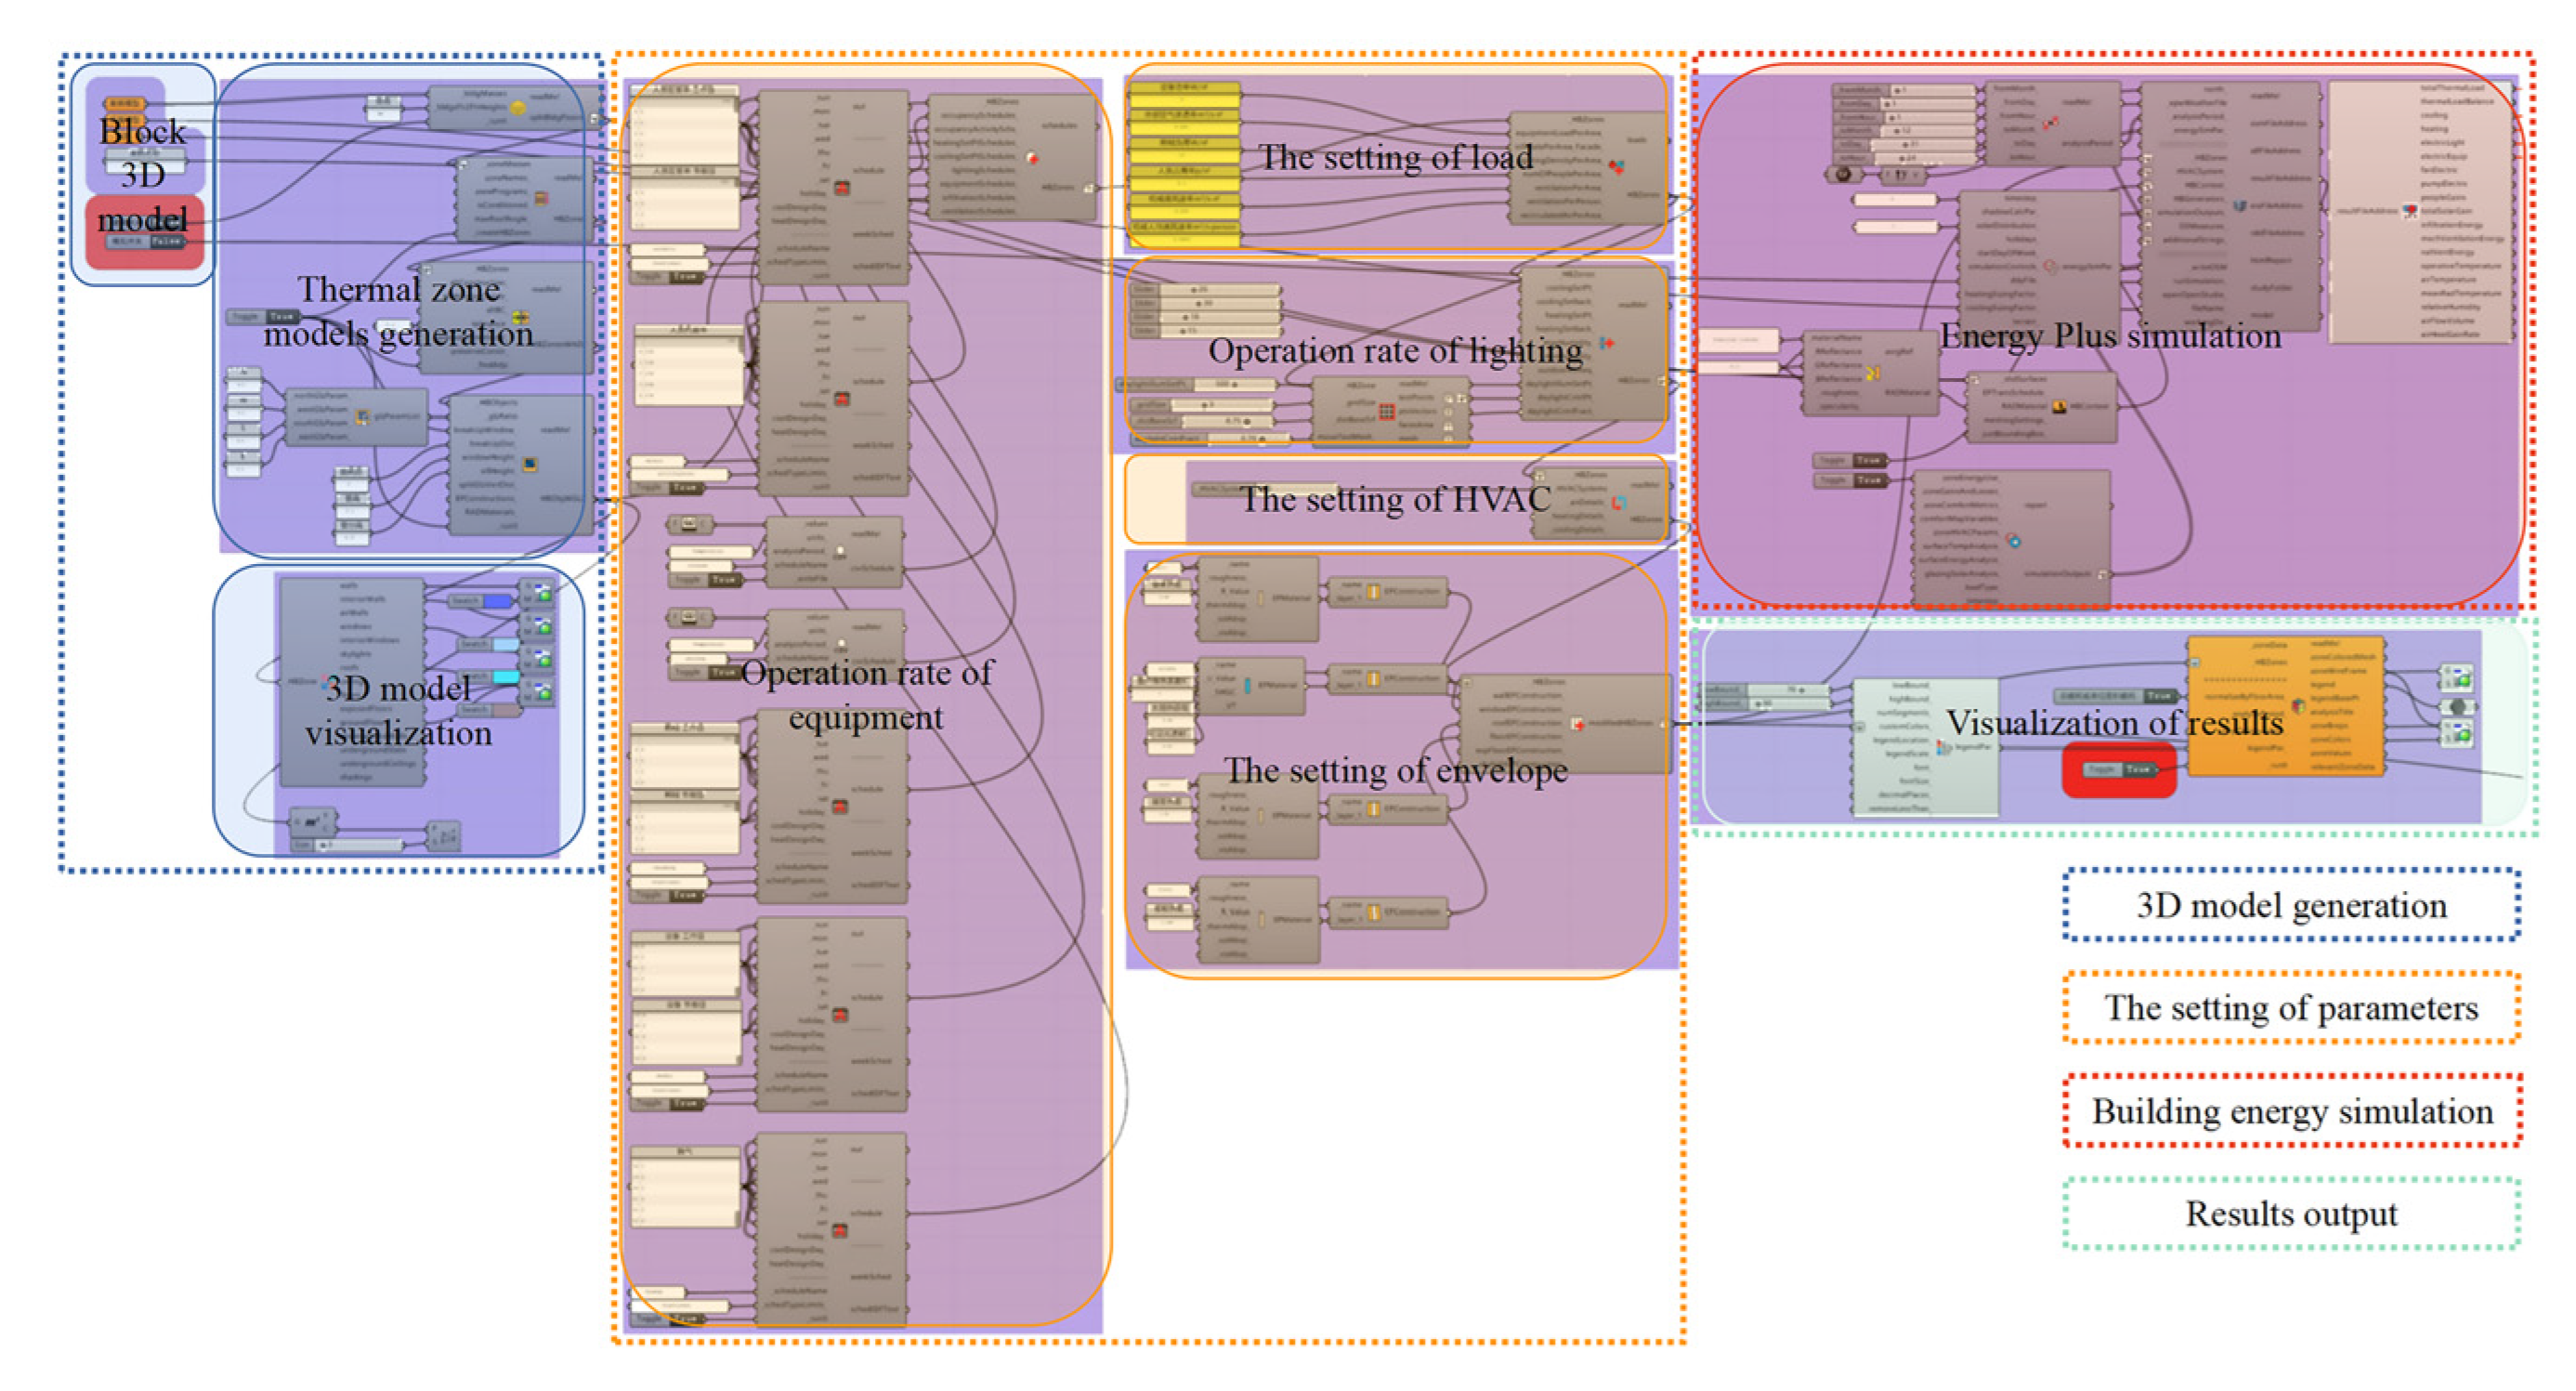
2.2. Building Energy Simulation (BES) Workflow

2.2.1. BES Workflow for Office Blocks

The building energy simulation workflow(Figure 7) was built based on Rhino and Grasshopper platform, invoking the Energy Plus [44,45] simulation core, which was run in the Rhino Ladybug module [33,39,46]. The workflow was divided into four sections: (a) 3D model generation; (b) the setting of simulation parameters; (c) building energy simulation; and (d) result output.

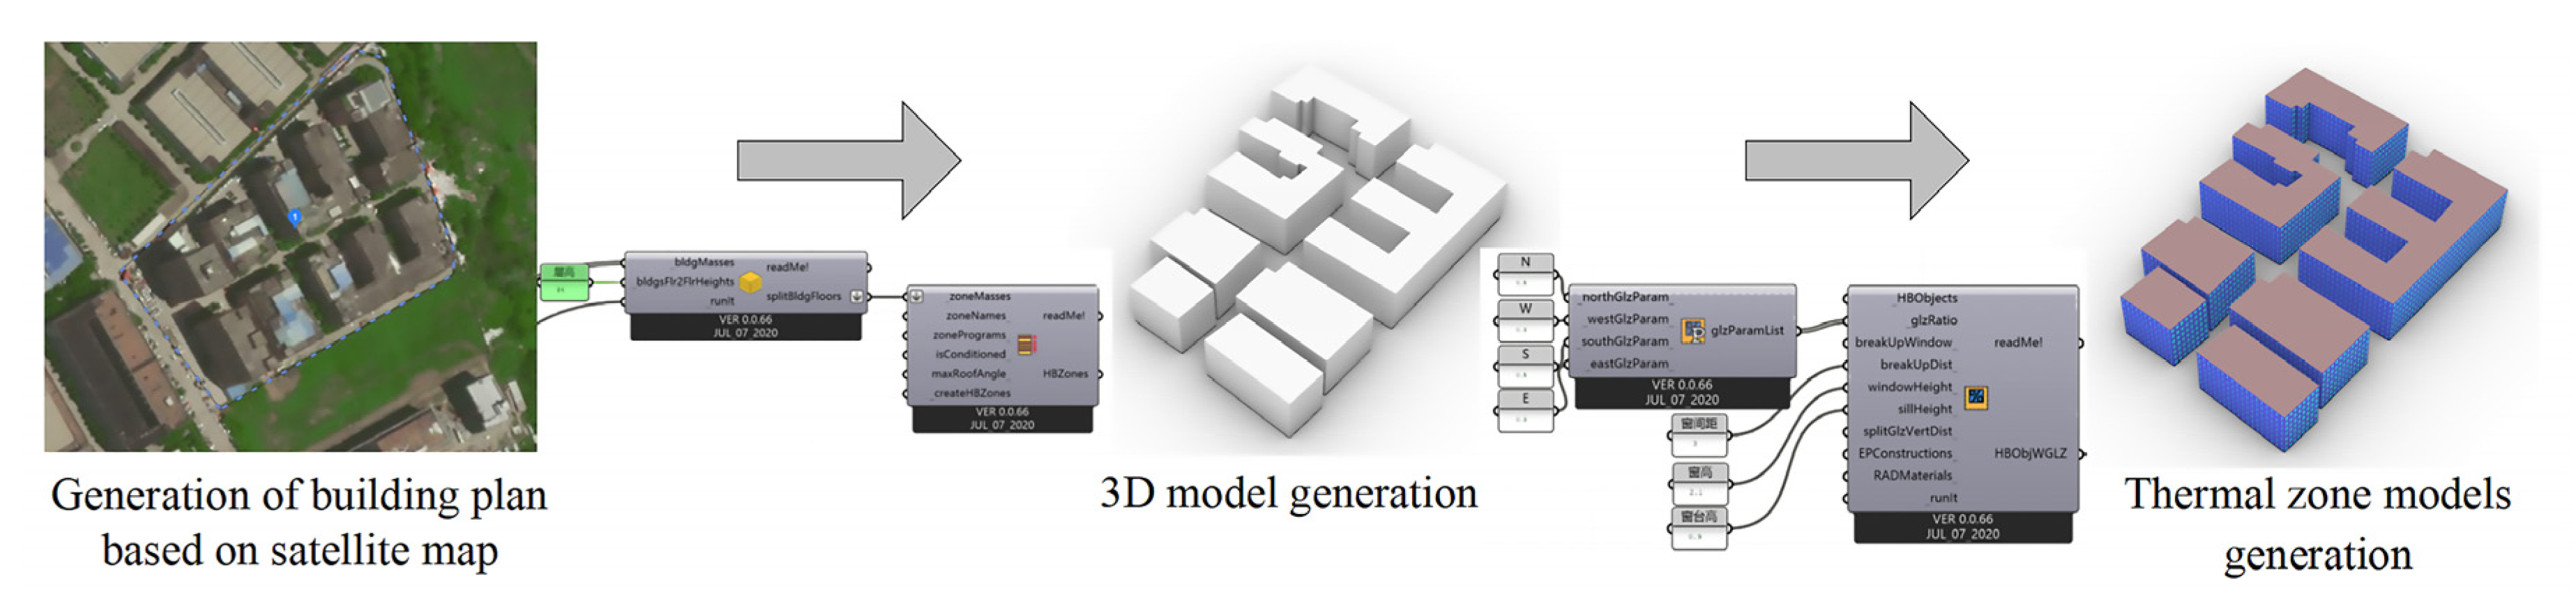
2.2.2. 3D Model Generation

Firstly, the building plans were drawn in Rhino based on satellite images, GIS platforms, and geometric information obtained from field survey. Secondly, 3D building models were created based on the storey number of buildings, at a height of 4 m. Thirdly, the window-to-wall ratio script was used to automatically divide the windows of each building facade. Finally, the office buildings’ thermal zone models of the block were established, based on Honeybee Tools. The process of the 3D model generation is shown in Figure 8.

2.2.3. The Setting of Simulation Parameters

The building energy simulation parameters required the setting of external meteorological conditions, building geometry parameters, and building physical parameters. The meteorological data were obtained from China Meteorological Data Network. The building geometry parameters were obtained through field survey combined with GIS. The data about the building envelope of the blocks were obtained through literature survey combined with energy-saving report of typical office block project. The occupancy rate, operation rate of lighting, and equipment of the office blocks were obtained from questionnaire survey. The simulation parameters were set as shown in Table 2 and Table 3.

2.2.4. Building Energy Simulation

The building energy simulation used the Honeybee module Energy Plus as the calculation kernel to calculate the building energy consumption of the office blocks. Energy use intensity (EUI) [47,48] was used to denote the efficiency of building energy consumption in this study, which is in reference to the annual energy consumption per unit area of a building, typically expressed in kWh/m2/y.
Due to the fact that equipment energy consumption varies greatly from office buildings, but it is not affected by the block morphology parameters [14]; therefore, equipment energy consumption was excluded from the results and analysis. The building energy consumption and the sum of cooling, heating, and lighting energy consumption, for each office block buildings, were simulated and the annual EUI was calculated by Equation (1):
Total   EUI = E S A
Total EUI—the sum of cooling, heating, and lighting EUI
E—building energy consumption
S A —total floor area of office block buildings

2.3. BES Model Validation

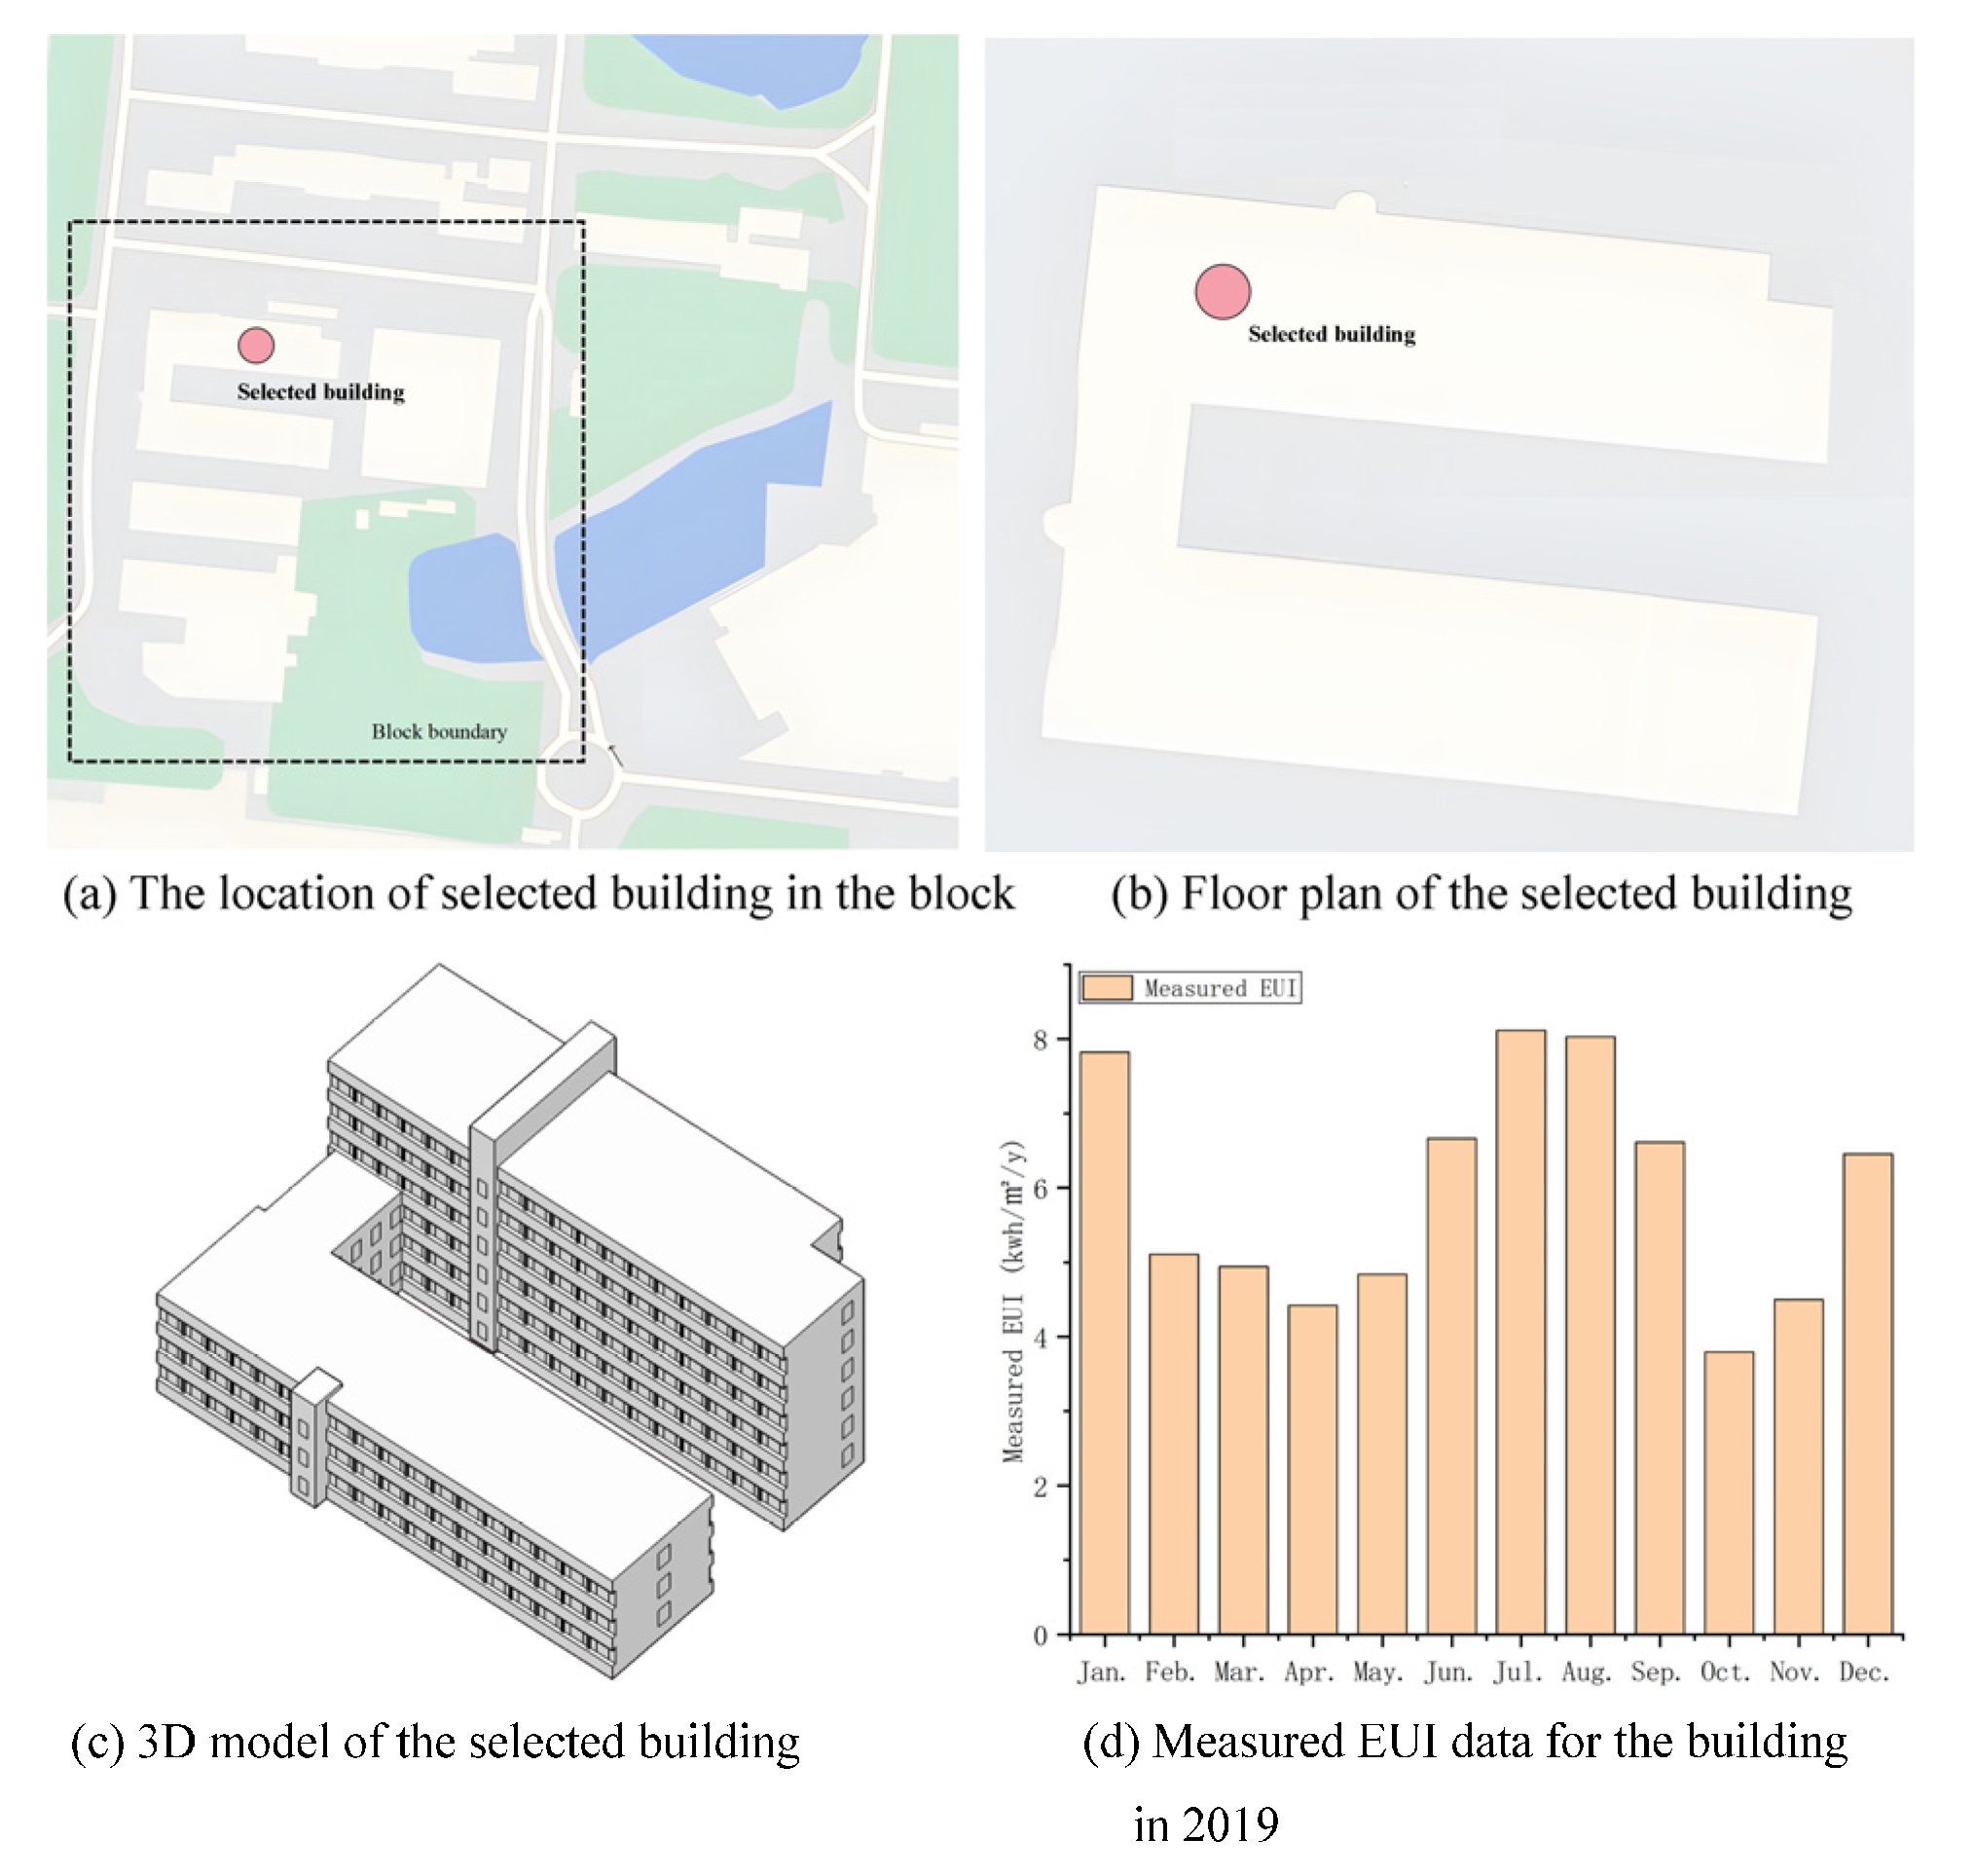
2.3.1. Building Energy Data Measurement

The actual month-by-month building energy consumption of the office building in Wuhan was measured by smart meter for the whole year of 2019. The investigation revealed that the winter heating and summer cooling demand of the office building were met by air conditioning; i.e., the electricity consumption data were representative of the annual building energy consumption of the building. In addition, the month-by-month EUI data for this building is shown in Figure 9.

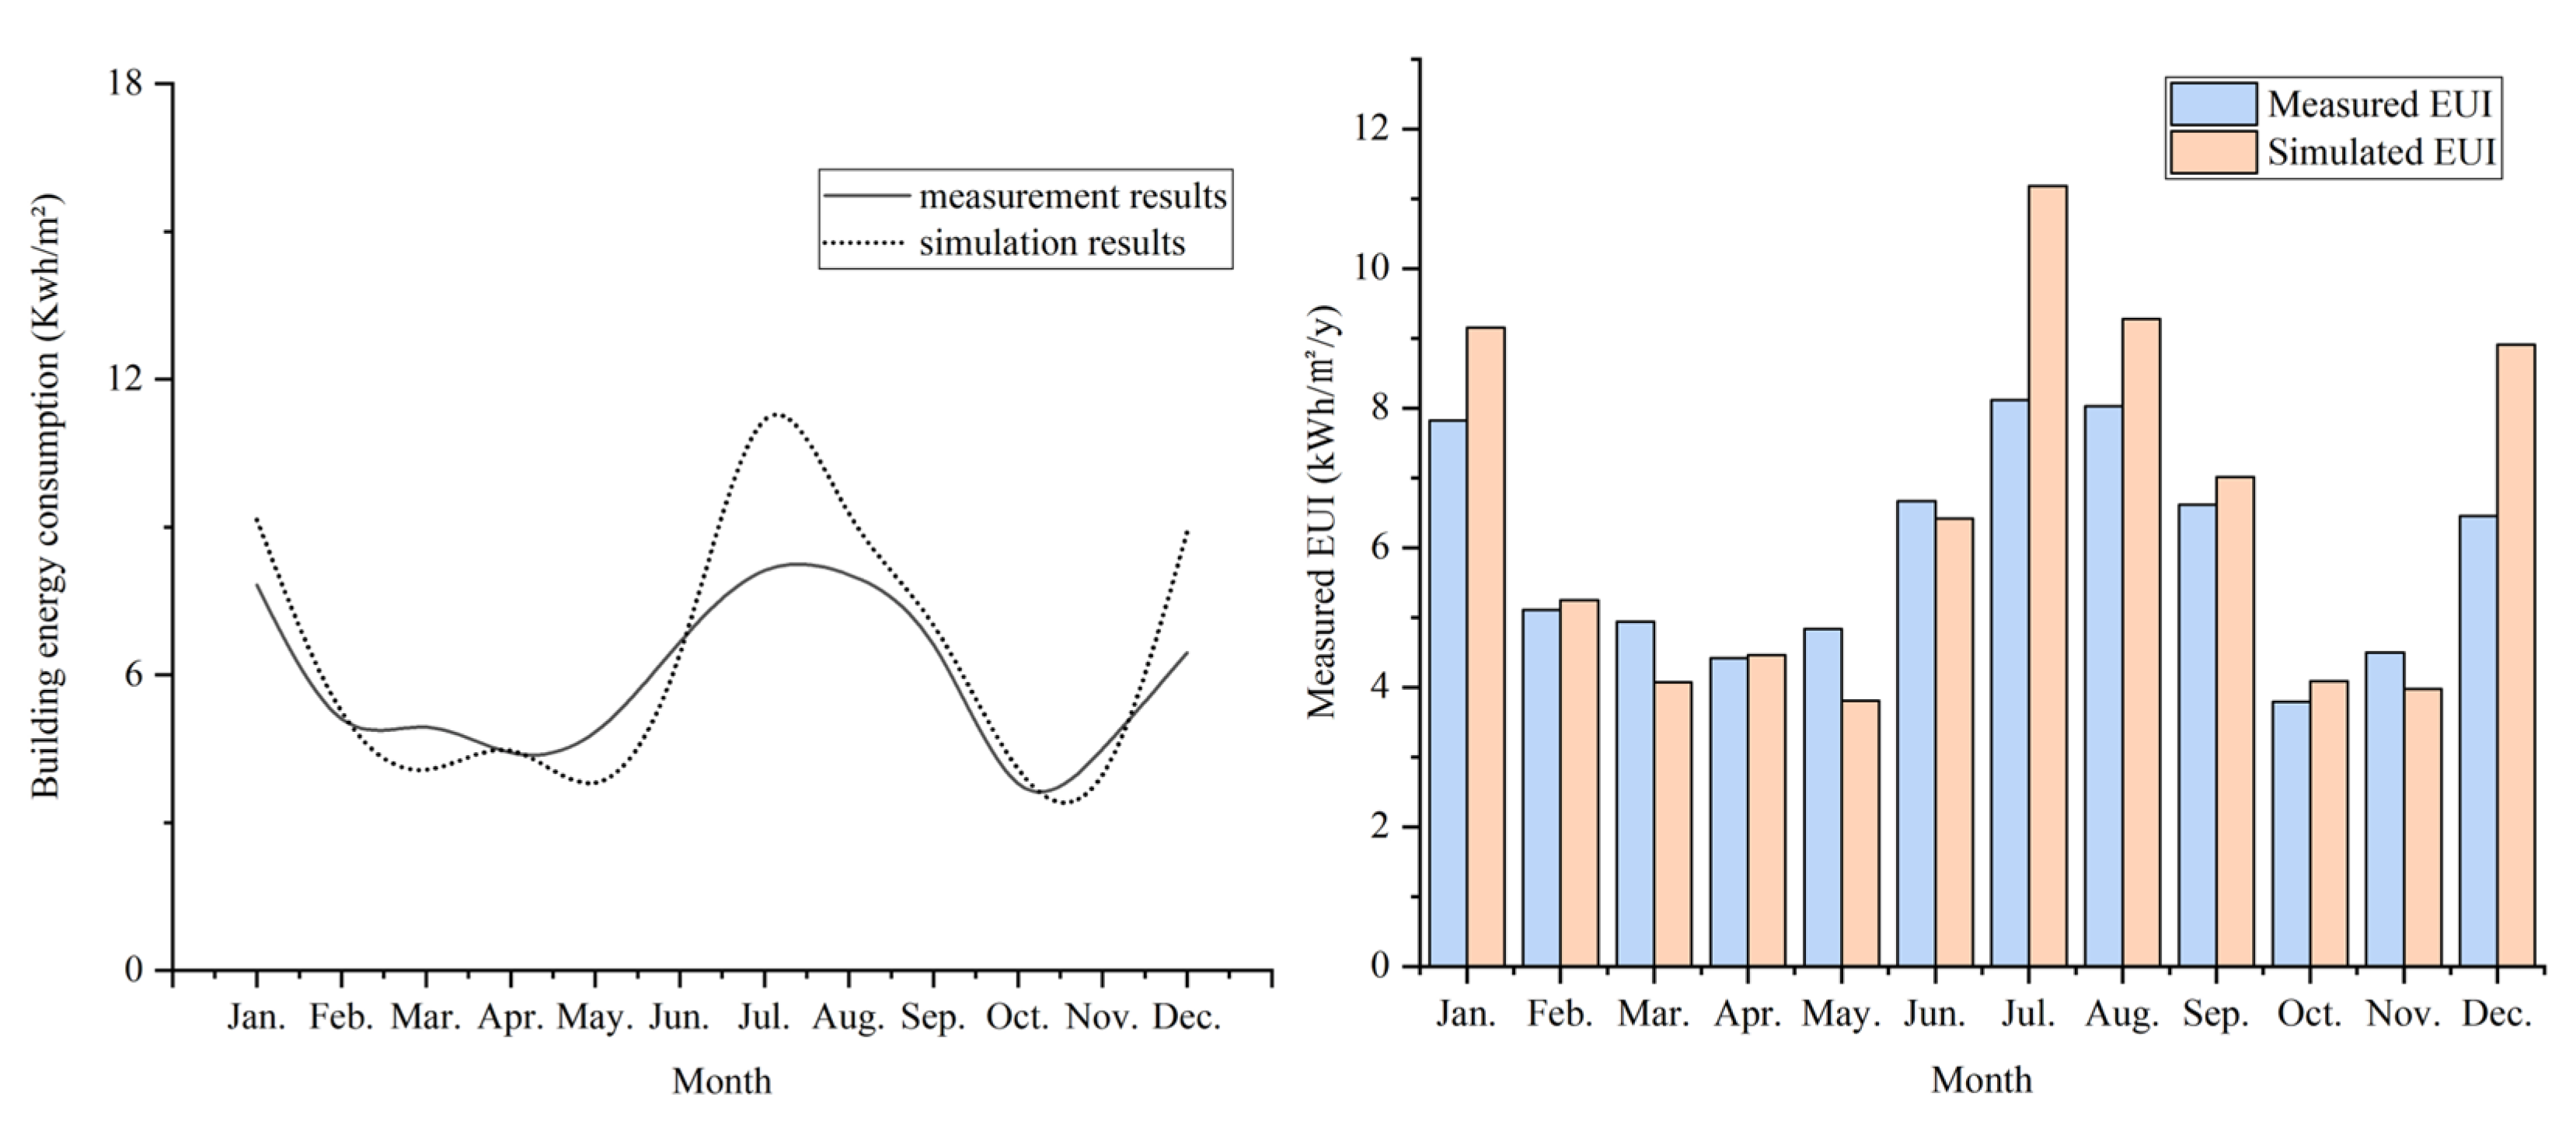
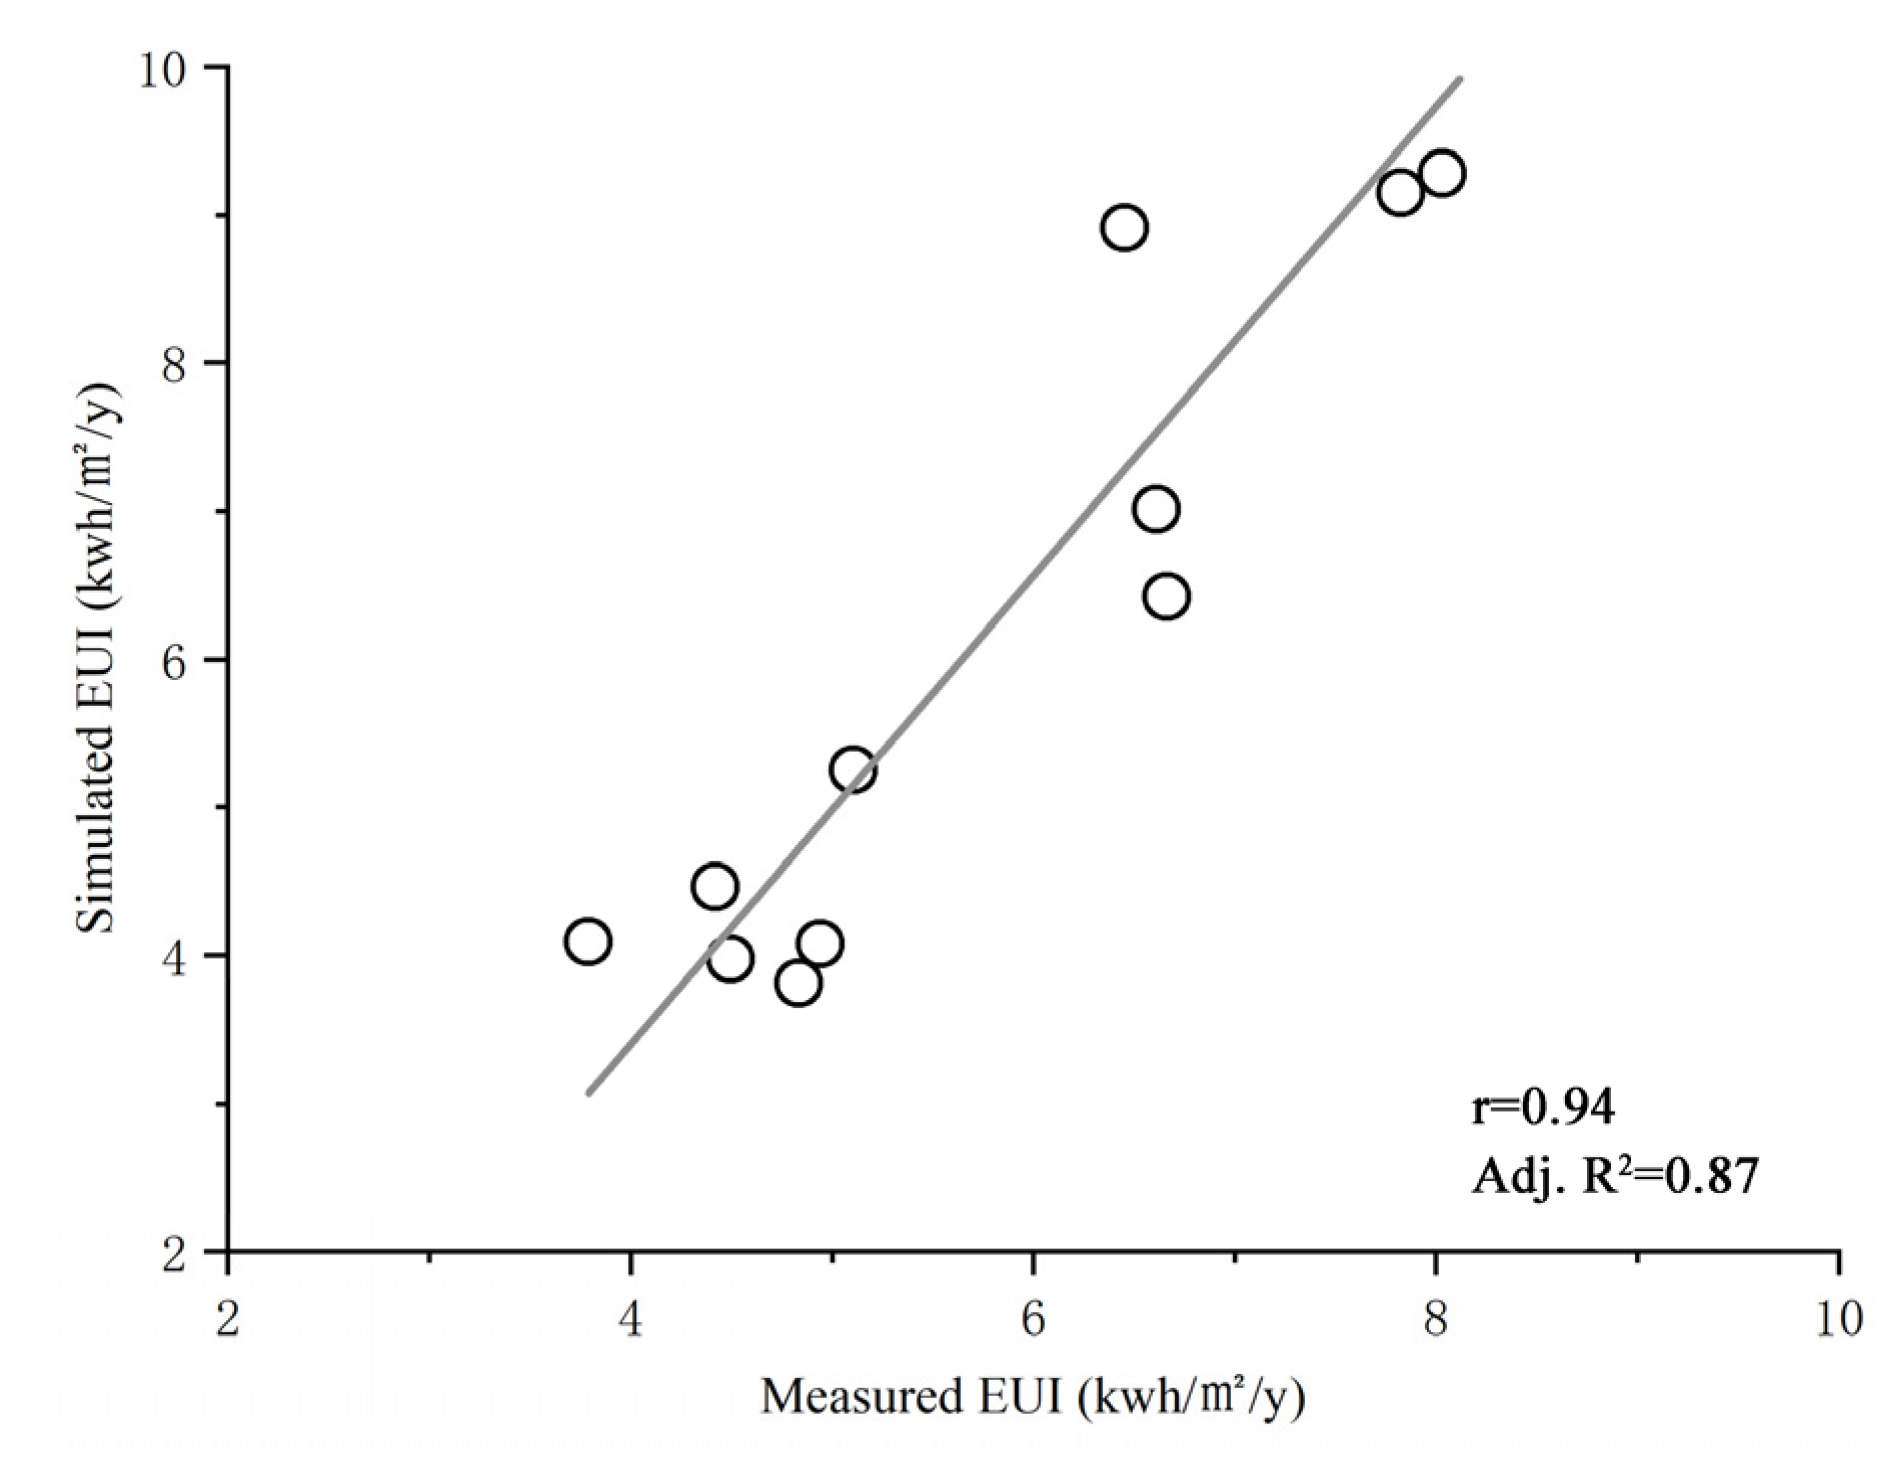
2.3.2. BES Model Validation

The results simulated from the building energy model were compared with the measurements that were recorded during field experiments. Figure 10 exhibits variations of building energy consumption of office buildings month by month for a year (2019) and establishes clearly that the simulated results agree soundly with the measurements, with a deviation of less than 8.14%, which is within a reasonable margin of error [49,50]. Other comparisons in fitness were also carried out, and the results demonstrate good agreement, with an R2 value of 0.87 (Figure 11).

2.4. Correlation Analysis and Multiple Linear Regression Analysis

Statistical analysis methods such as correlation analysis [51] and multiple linear regression analysis [52] were used to study the extent to which block morphological parameters affected the building energy consumption of office blocks. Firstly, correlation analysis was conducted between the dependent variable (building EUI) and independent variables (block morphological parameters) to examine the intensity of the statistical relationship between variables. The Pearson correlation coefficient in the data analysis software IBM SPSS 24.0 was used to carry out a correlation analysis between block morphology variables and building EUI, and the result was obtained.
Multiple linear regression analysis has been conducted in numerous relevant studies [19,48,53]. This method was chosen to quantitatively analyze the relative significance of eight block morphological parameters on building EUI. Each independent variable (block morphological parameter) is linked to a value of the dependent variable (building EUI). This means that researchers can analyze the impact of a morphological variable on building energy consumption after controlling for other morphological variables through the established equation’s result. Thus, multiple linear regression analysis was carried out with SPSS to propose the model for predicting building energy consumption coupled with block morphology in office blocks and then revealed how adequately the block morphological parameters can clarify the differences in building energy consumption among office blocks.

3. Results and Discussion

3.1. The Effect of Block Typologies on Building EUI

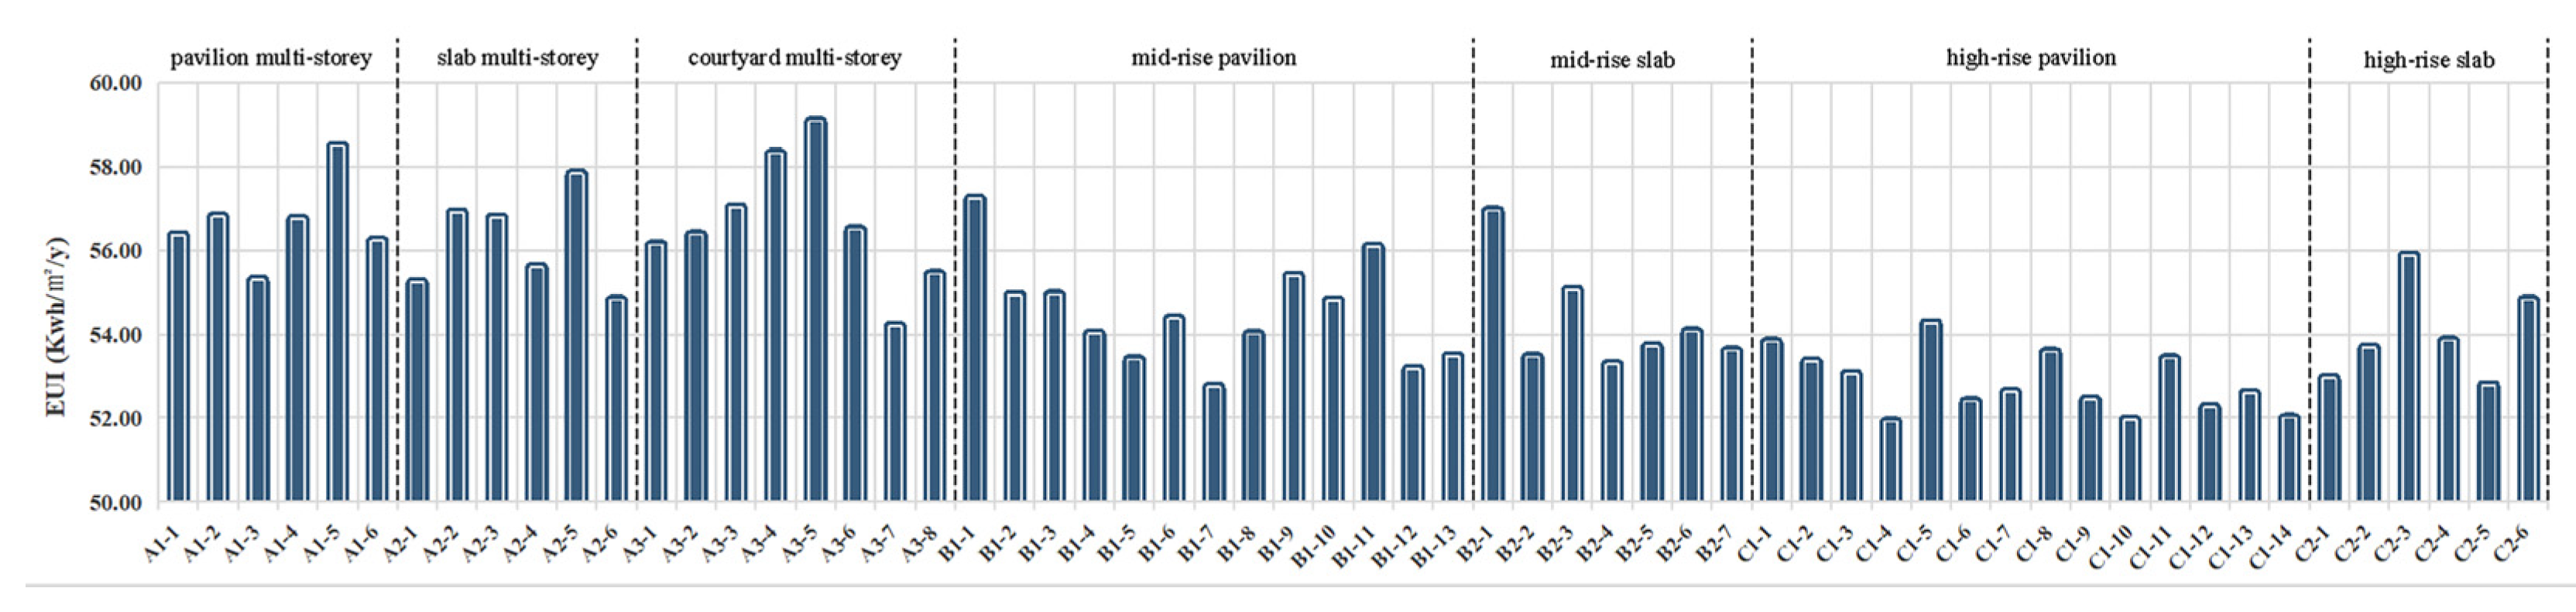
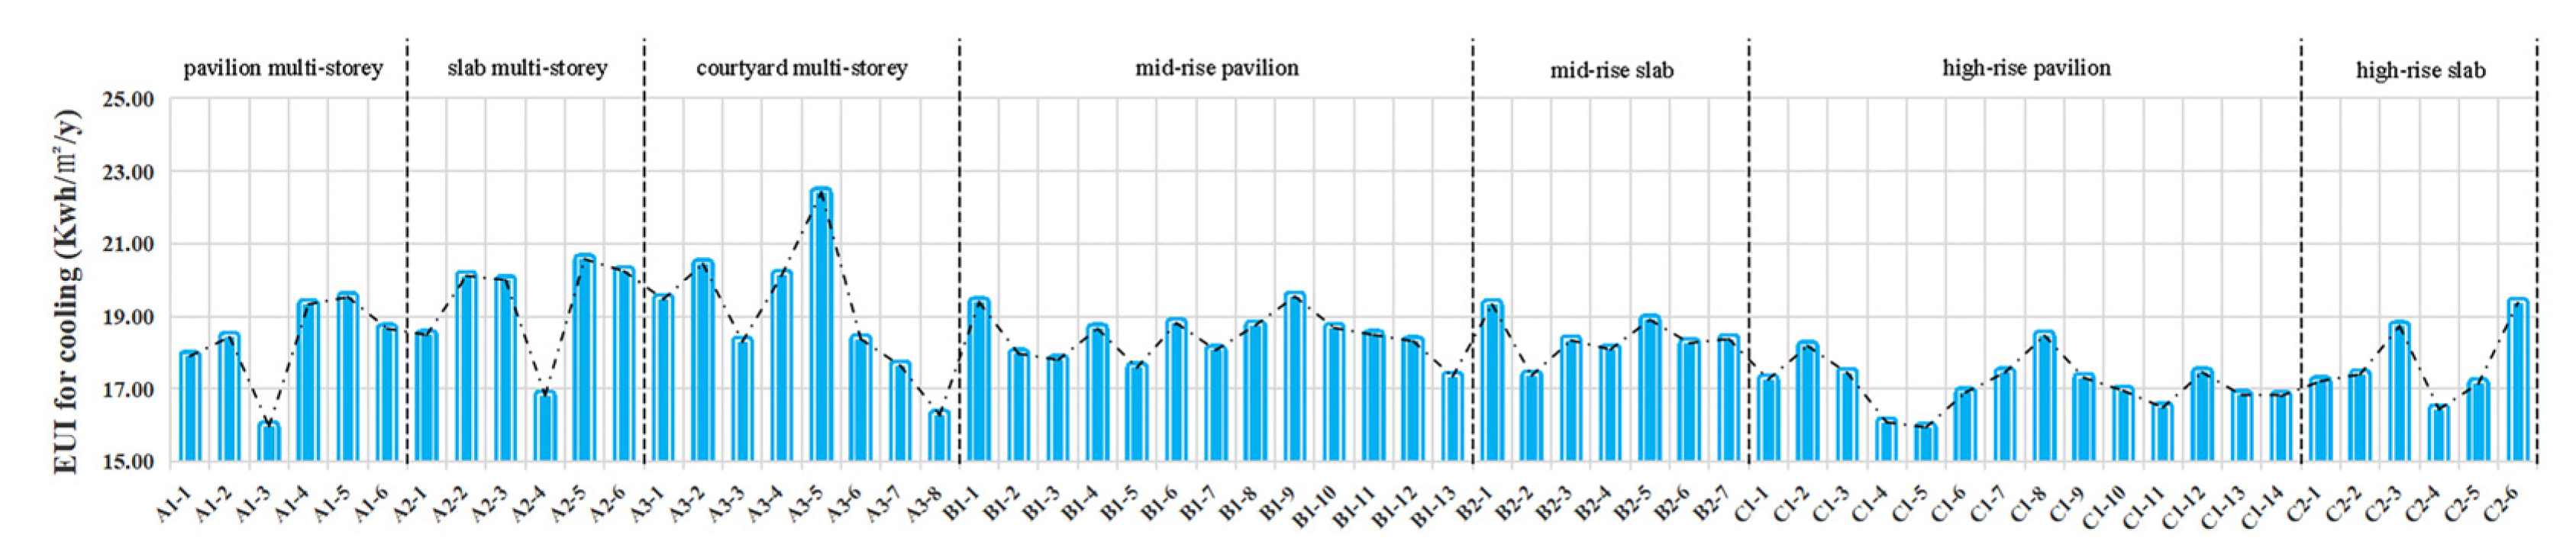
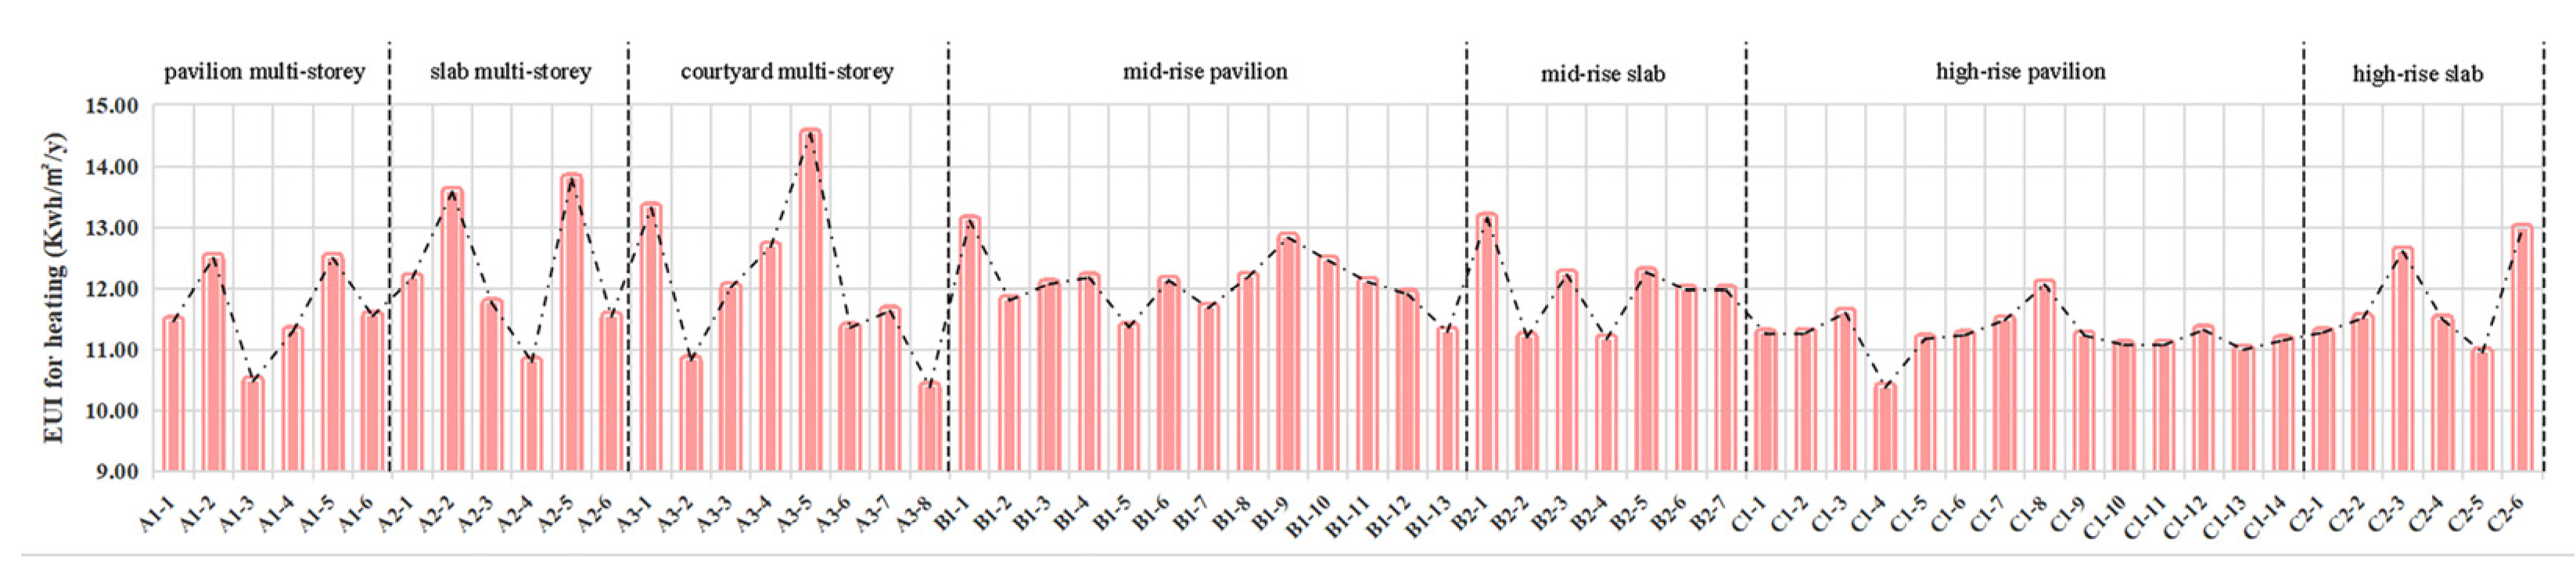
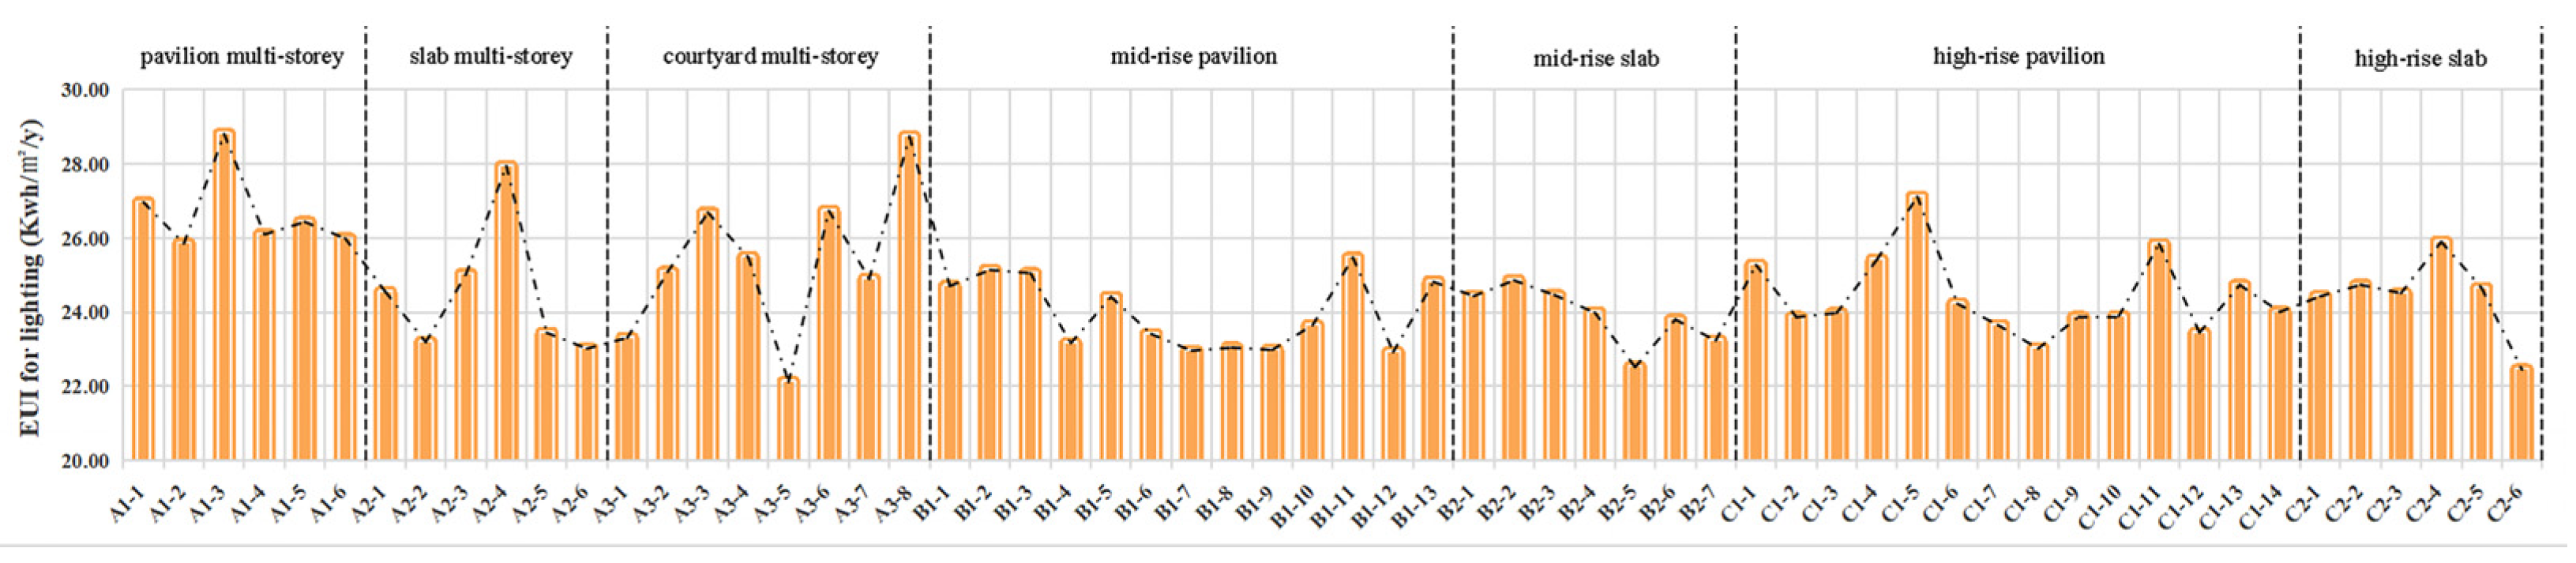
3.1.1. Building EUI for All Office Blocks

The building EUI for the sixty block samples are shown in Figure 12. The results showed that courtyard multi-storey blocks had a maximum EUI of 56.63 kWh/m2/y, while the minimum EUI for high-rise pavilion blocks was 52.80 kWh/m2/y. The average EUI varies among block types by up to 7.0% due to differences in morphological parameters. For the sixty samples, the results of the building energy consumption distribution characteristics revealed that the EUI of the lowest sample C1-4, with 51.88 kWh/m2/y, was 13.82% lower than that of the highest sample A3-5 with 59.05 kWh/m2/y, which was within the range of the existing research threshold that block morphology affects building energy consumption by around 10% to 30% or more [12,15]. Javanroodi et al. studied the effect of block morphology on cooling load and ventilation potential. The results showed that the cooling energy consumption and ventilation potential in Tehran can be optimized by more than 10% and 15%, respectively, due to the difference in block morphology [25]. Similarly, another study which was based on hot and humid climates found a 16–18% reduction in office building cooling energy consumption when the surrounding buildings were taken into account [54]. Mangan et al. evaluated the effect of morphological parameters such as building height to street width, orientation, and building type on the energy consumption of residential buildings. The findings indicated that increasing the building height of rectangular-pavilion, rectangular-slab, and square-pavilion residential buildings can decrease building energy consumption by 14%, 8%, and 18%, respectively [29].
In the Hot-summer and Cold-winter zone in China, block buildings have a dual demand for cooling in summer and heating in winter, while lighting energy consumption is a non-negligible part of office buildings. The distribution characteristics of the EUI for cooling of the seven urban block typologies are shown in Figure 13. For the overall block samples, the cooling EUI of the lowest block high-rise pavilion (C1-5), with 15.95 kWh/m2/y, was 28.83% lower than that of the highest block slab multi-storey block (A3-5), with 22.41 kWh/m2/y. The distribution characteristics of the EUI for heating of the seven urban block typologies are shown in Figure 14. The heating EUI of the lowest block high-rise pavilion (C1-4), with 10.38 kWh/m2/y, was 28.56% lower than that of the highest block slab multi-storey block (A3-5), with 14.53 kWh/m2/y. The distribution characteristics of the EUI for lighting of the seven urban block typologies are shown in Figure 15. The lighting EUI of the lowest block high-rise pavilion (C1-5), with 22.11 kWh/m2/y, was 23.23% lower than that of the highest block courtyard multi-storey block (A1-3), with 28.80 kWh/m2/y.
The relationship between the cooling, heating, and lighting building EUI did not increase and decrease in the same way; there was a discounting phenomenon (Figure 13, Figure 14 and Figure 15). This is due to the fact that the trend in the EUI for cooling among different office blocks agrees well with the trend in the EUI for heating, while the trend in the EUI for lighting is the opposite of them. Therefore, it is difficult to judge the total building EUI change pattern by the trend of the cooling, heating, and lighting building EUI; in addition to that, the total building energy consumption should be controlled instead of the sub-energy consumption when designing for low-energy office blocks.

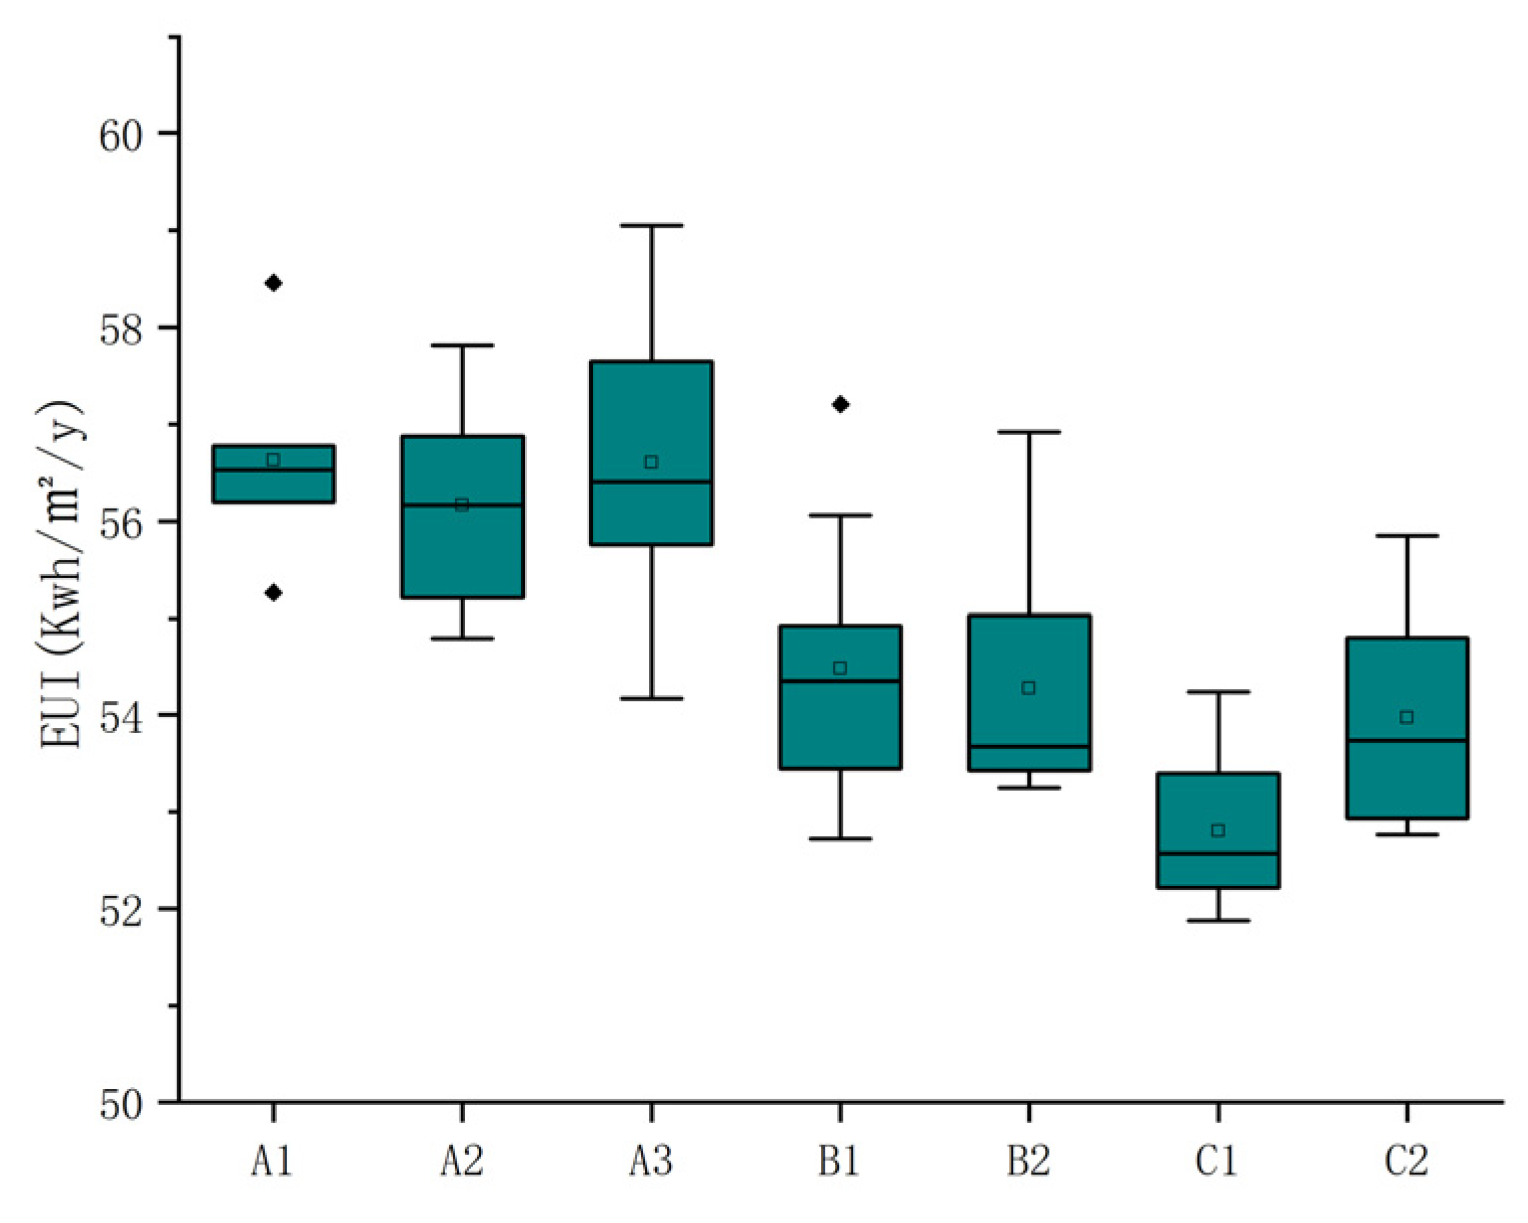
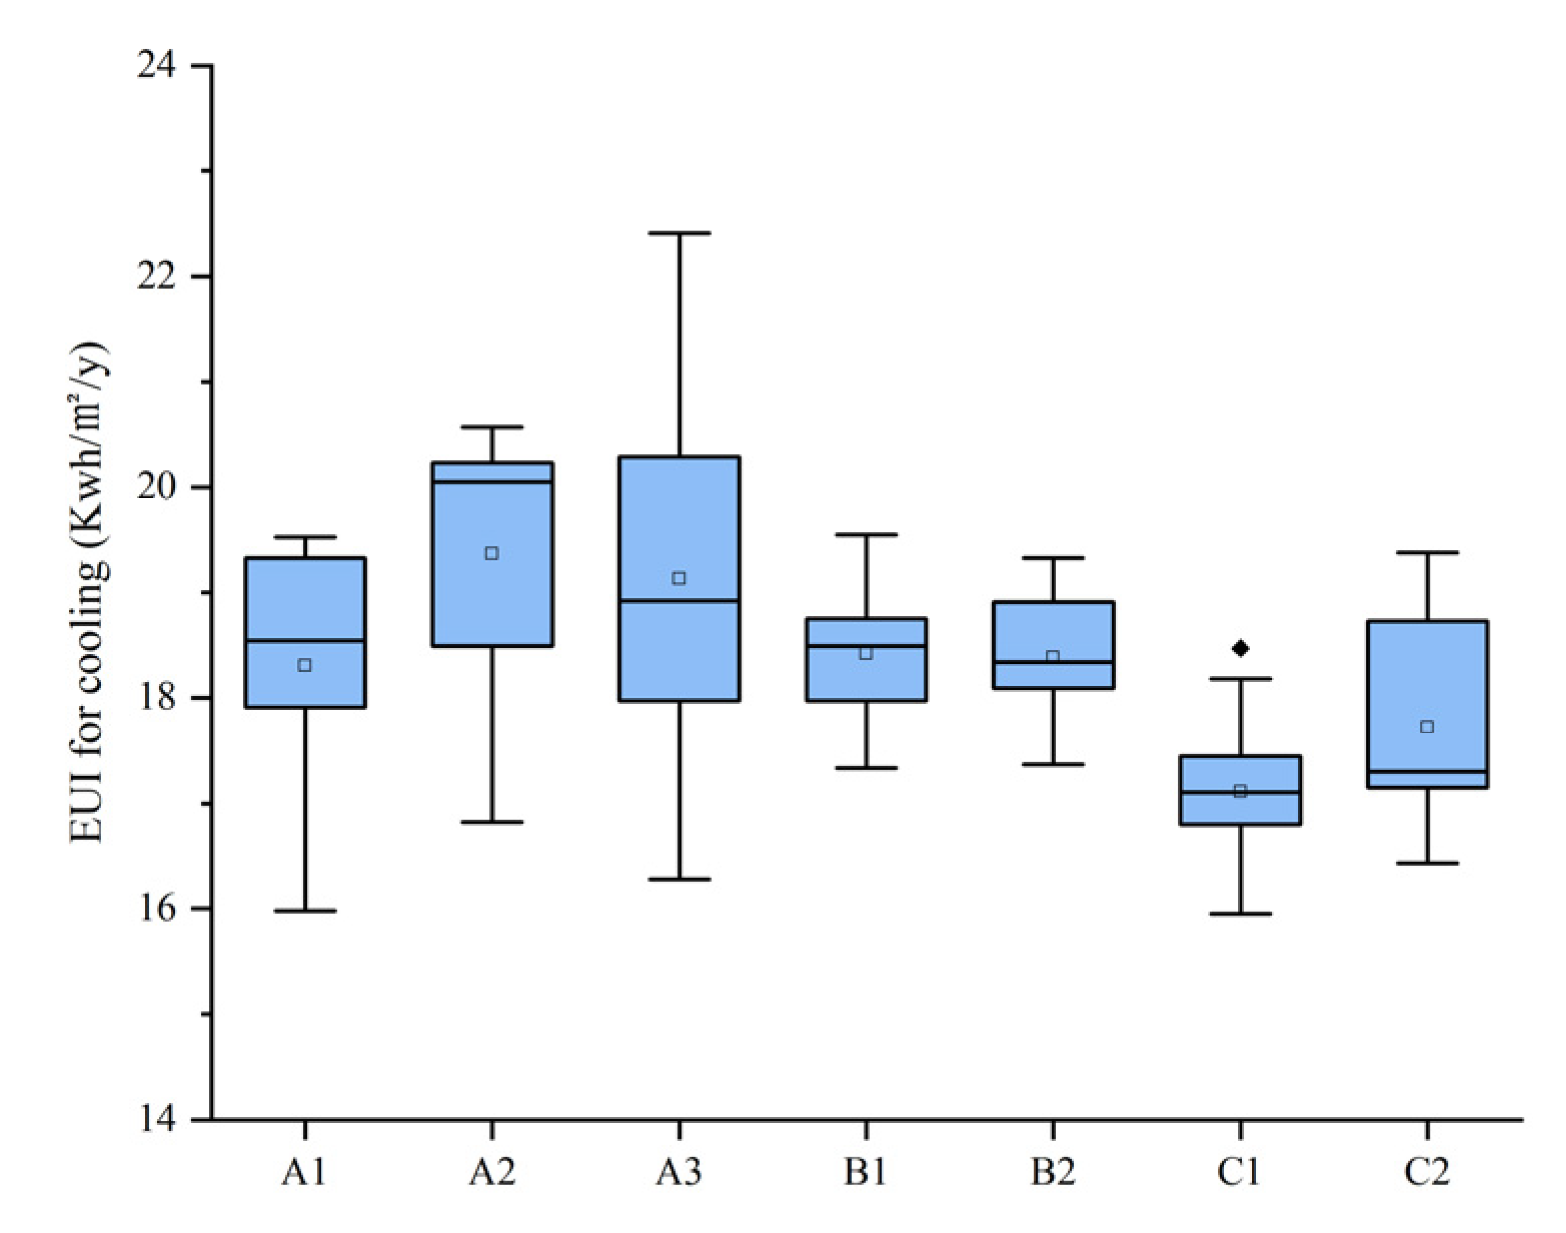
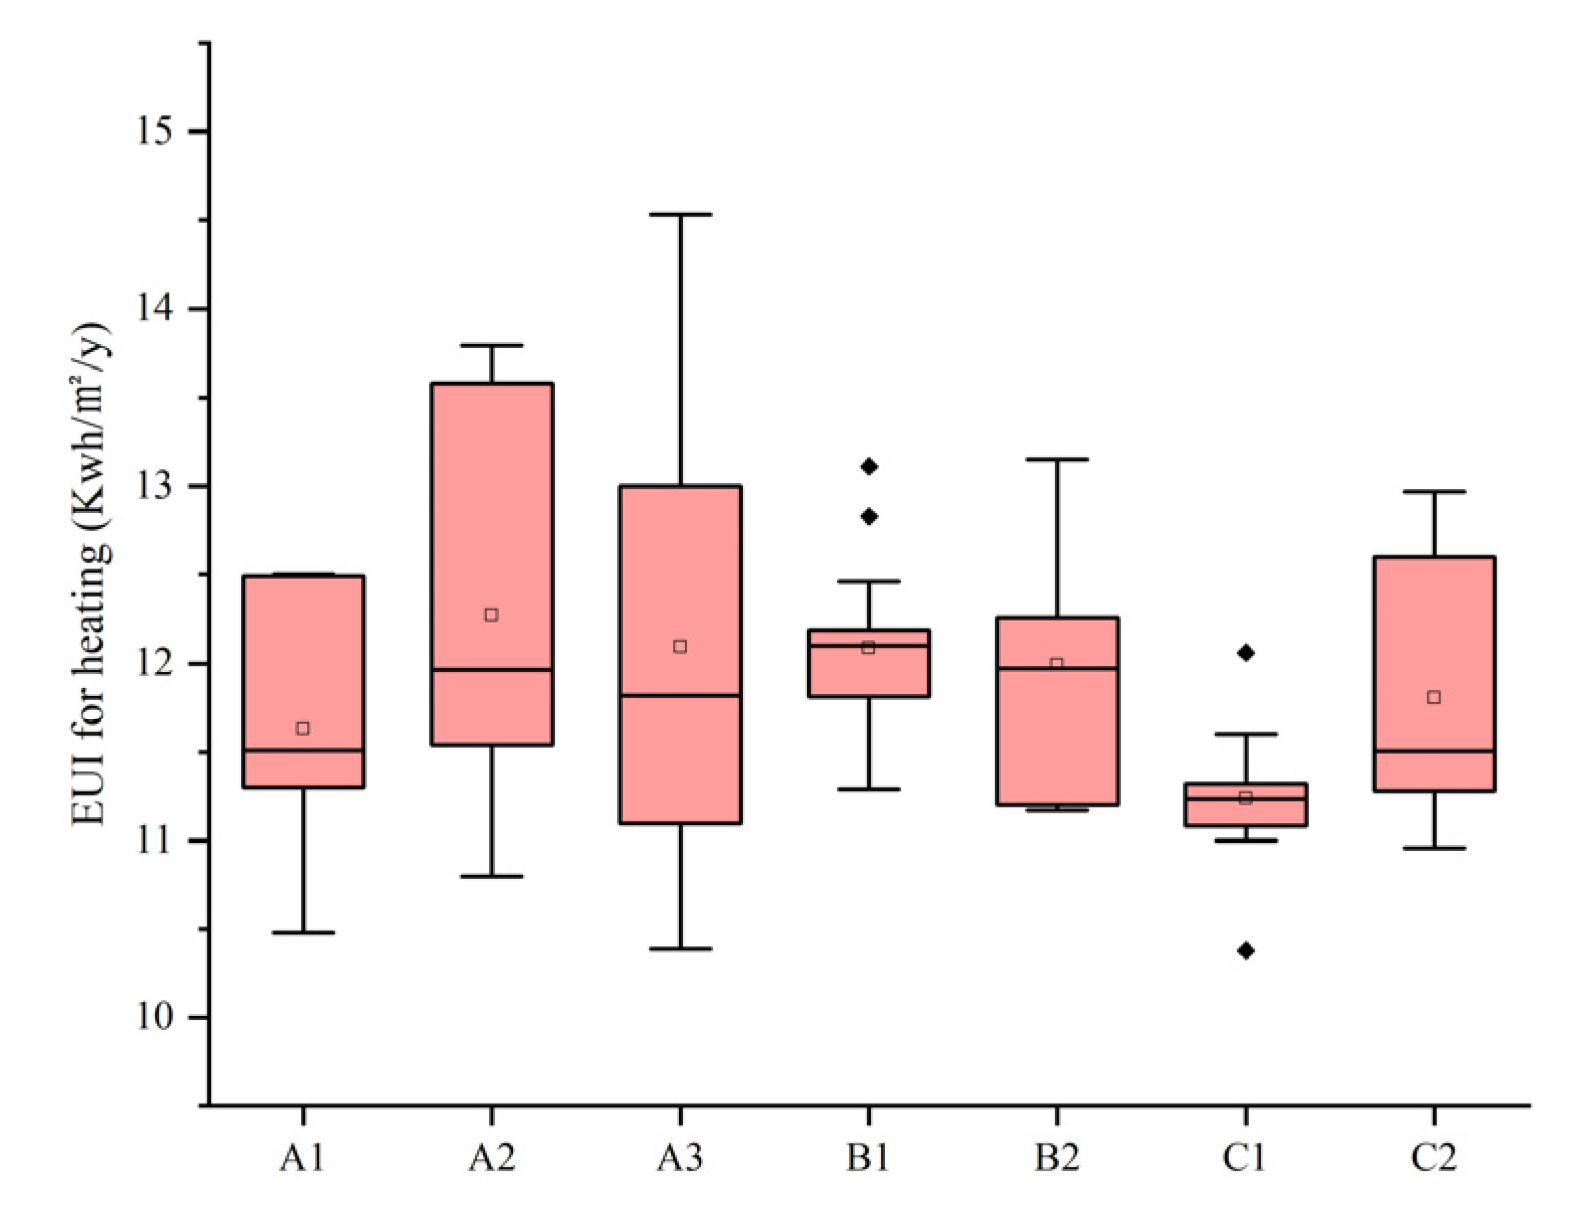
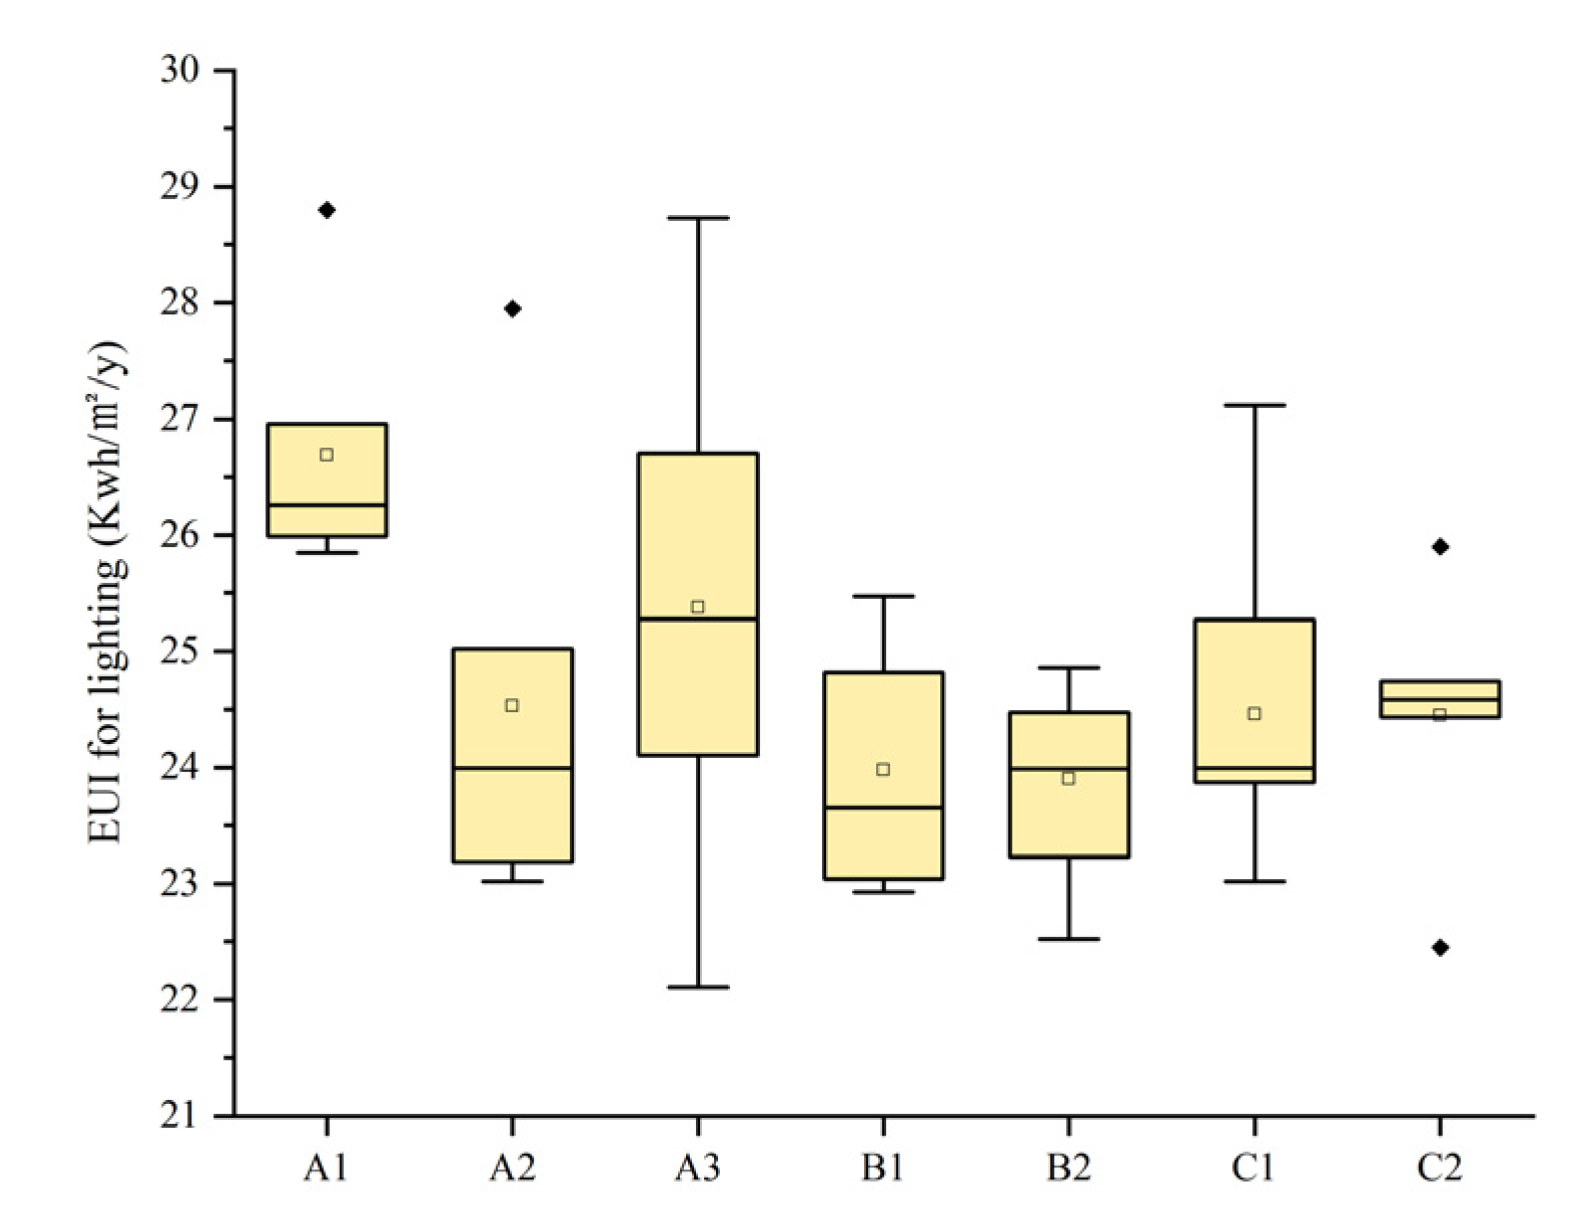
3.1.2. Building EUI for Different Typologies

The characteristics of the building energy consumption distribution in different typologies of office blocks are shown in Figure 14, from which it can be seen that the building energy consumption varies significantly among the different typologies of office blocks. In terms of average building energy consumption, the pavilion high-rise (52.40 kWh/m2/y) and the slab high-rise (53.97 kWh/m2/y) typologies outperformed the slab mid-rise (54.28 kWh/m2/y) and the pavilion mid-rise (54.45 kWh/m2/y), while the pavilion multi-storey (56.17 kWh/m2/y), slab multi-storey (56.60 kWh/m2/y) and courtyard multi-storey (56.63 kWh/m2/y) had a higher EUI level.
The EUI for cooling, heating, and lighting in the seven typologies of blocks shows a different distribution feature from the EUI for the total (Figure 16, Figure 17, Figure 18 and Figure 19). The courtyard multi-storey had the higher EUI level, but the cooling, heating, and lighting EUI for the courtyard multi-storey was not the higher. The courtyard multi-storey block had the highest total EUI due to several factors. The L-shaped office buildings are mutually shaded, and the ventilation corridors underneath are poorly ventilated. The high wind resistance of this block typology makes it challenging to remove heat from building surfaces in winter. Conversely, building energy consumption is higher during summer. Additionally, mutual shading affects natural lighting availability, contributing to the highest total EUI value for this block typology.
Taking into account the building layout and building height, the office block adopts the high-rise pavilion and high-rise slab typologies, avoiding the multi-storey pavilion and multi-storey slab ones, which can achieve the purpose of reducing the building energy consumption of office blocks in the Hot-summer and Cold-winter zone in China.
Block typology is the external expression of block morphological parameters. In order to analyze the differences in building energy consumption distribution characteristics of different block typologies, it is necessary to research the quantitative relationship between block morphological parameters and building energy consumption.

3.2. The Effect of Block Morphology on Building EUI

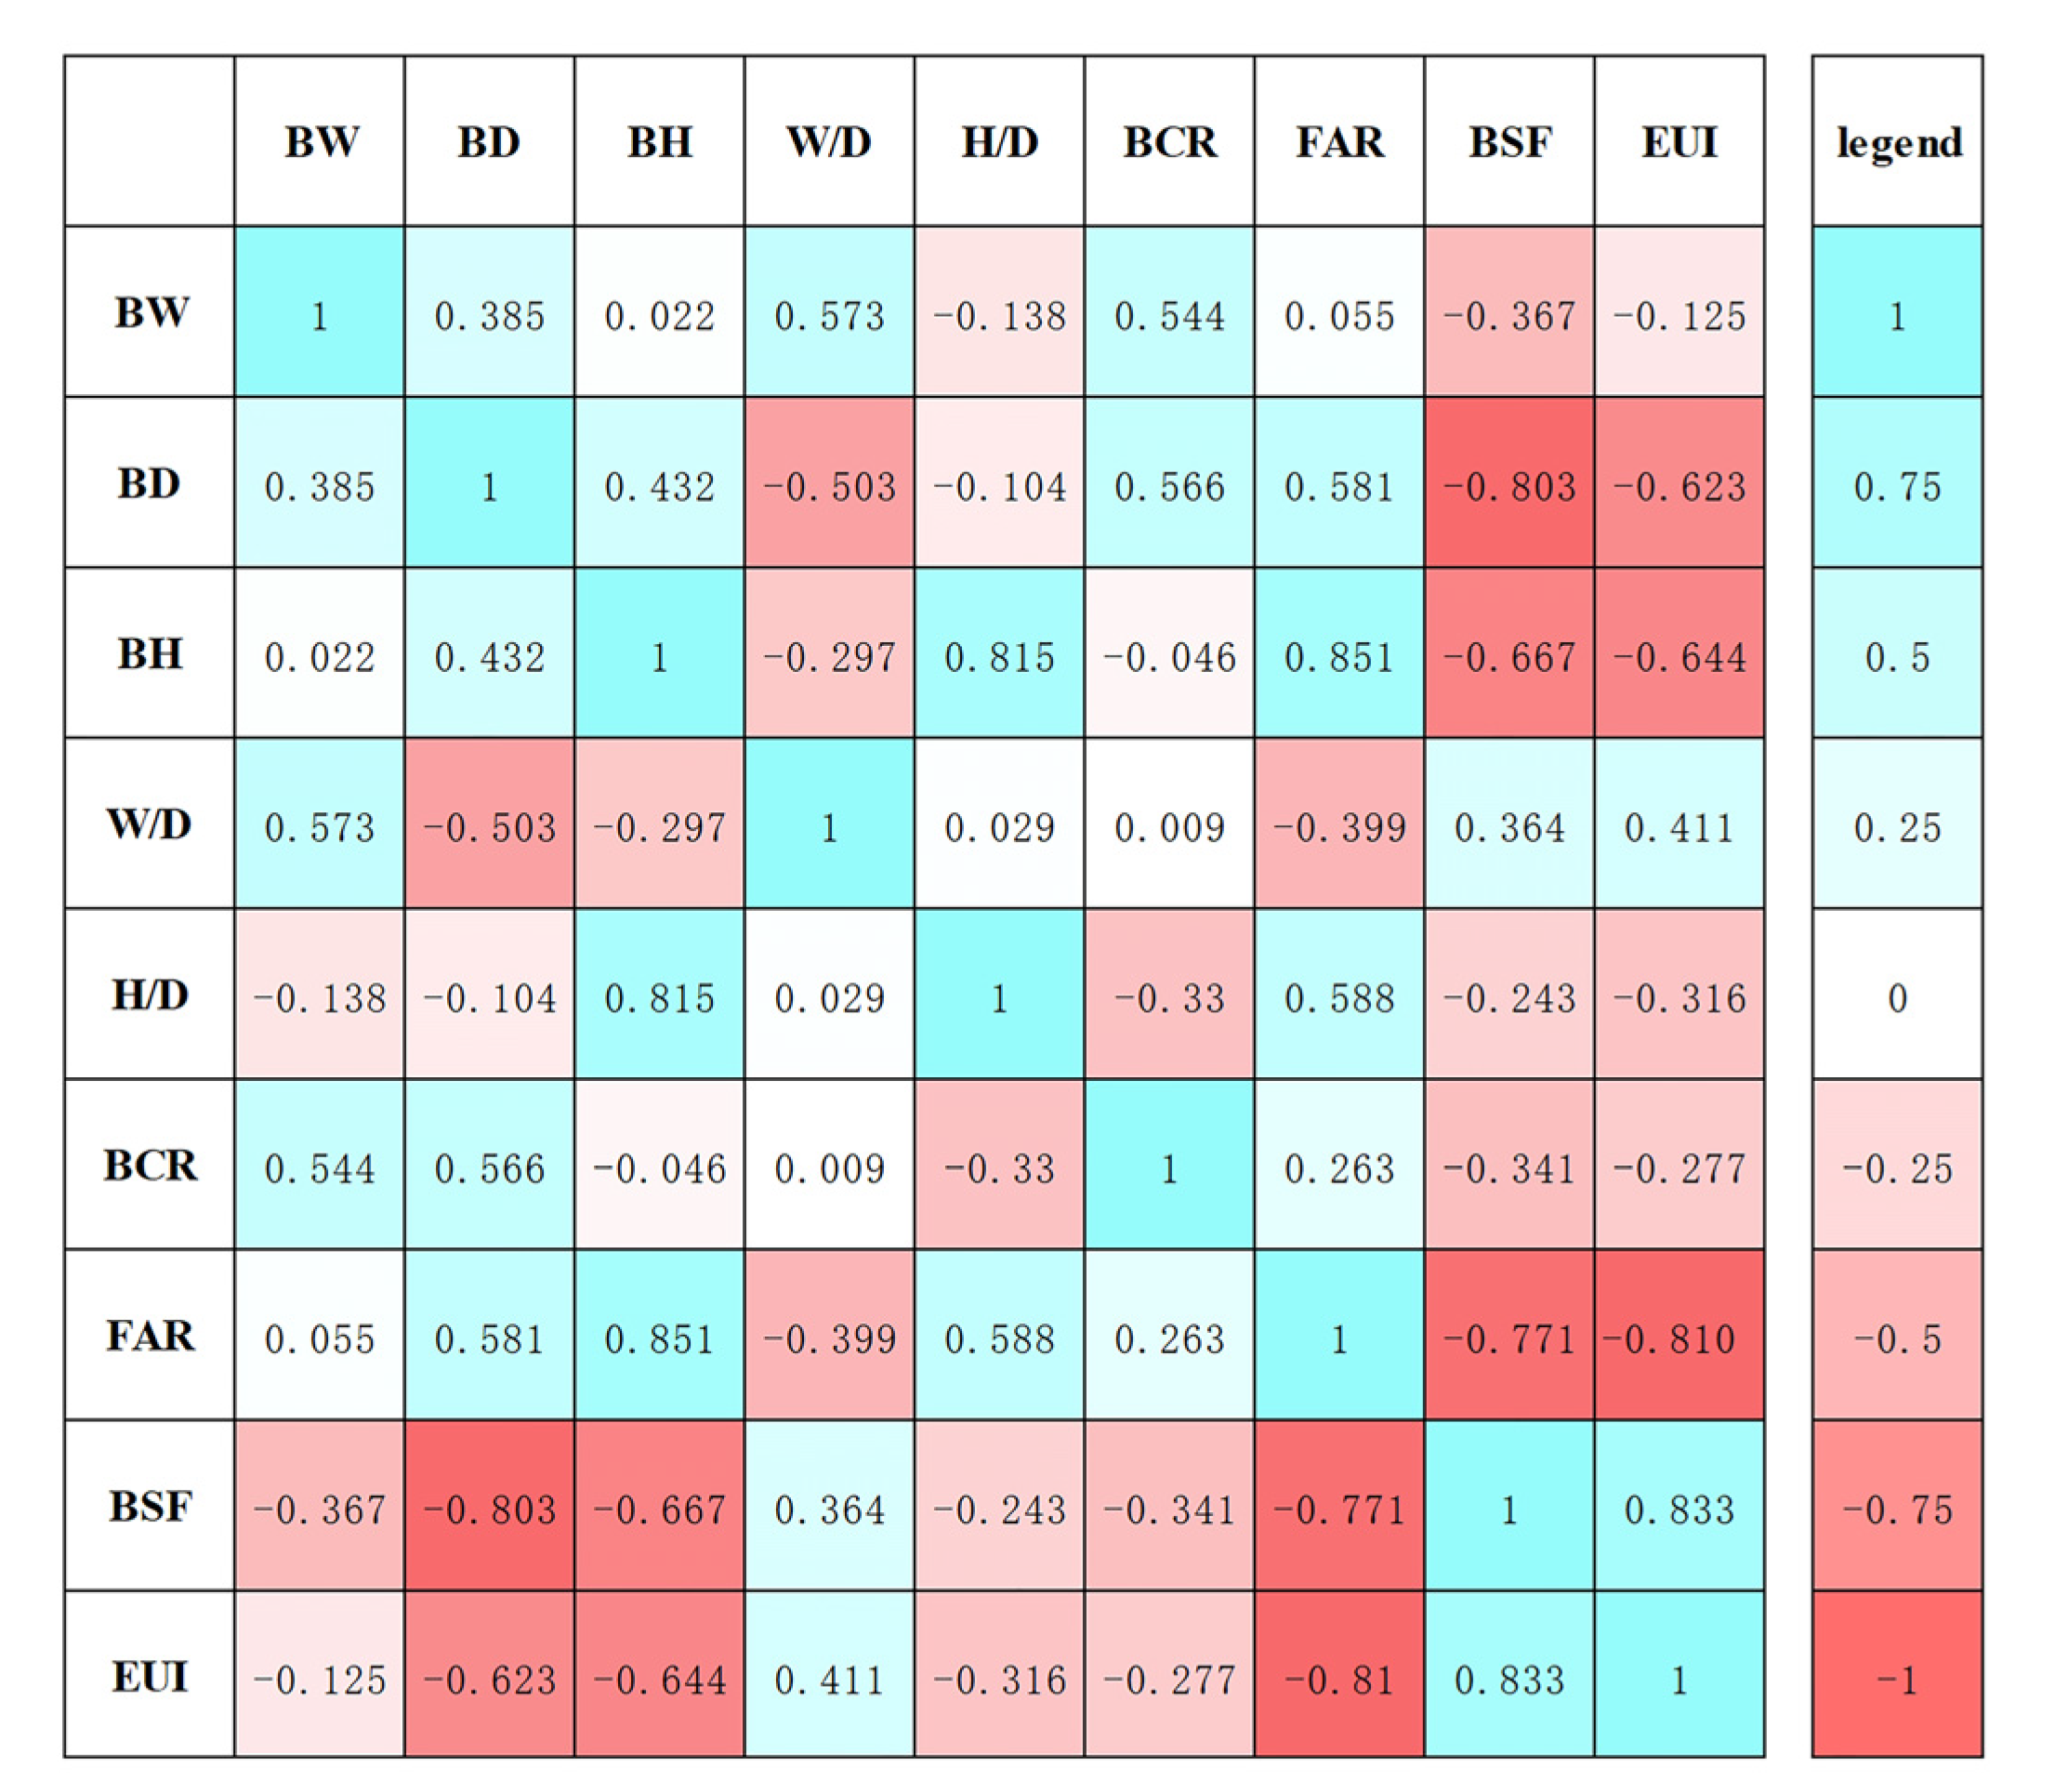
3.2.1. Correlation Analysis between Block Morphology and Building EUI

Table 4 shows the results of the correlation analysis between the eight block morphological parameters and building EUI of office blocks. If the significance value (Sig.) is less than 0.05, then the independent variable and dependent variable are significantly correlated. In this paper, the building EUI showed a significant correlation with all independent variables, except BW. Figure 20 depicts the thermal matrix of correlations between block morphological parameters and building EUI. Based on a linear regression analysis, BSF was the most significant factor regarding building EUI, which accounted for 0.833 of its Pearson correlation coefficient, and this was followed by FAR (PCC = −0.810), BH (PCC = −0.644), BD (PCC = −0.623), W/D (PCC = 0.411), and H/D (PCC = −0.316). In addition, BCR (PCC = −0.277) also had a significant impact, although to a lesser extent.
Among these significant independent variables, there is a positive correlation between EUI, and BSF and W/D, which suggests that building EUI is advanced with the increase of BSF and W/D, whereas there is a negative correlation between EUI, and FAR, BH, BD, H/D, and BCR, which indicates that building EUI is reduced with the increase of these five variables. In addition, the larger the absolute value of the Pearson correlation coefficient, the closer the relationship is. Among them, the representative morphological parameters were BSF, FAR, BH, and BCR. Leng et al. [48] researched the influence of block morphology on building heating energy consumption, which demonstrated that there is a high correlation between BD, FAR, and BH, and heating energy consumption in office buildings, and a negative correlation between these morphological parameters and heating energy consumption. The results support the findings of this paper. In addition, the results of another study about the analysis of building energy demand based on block morphology in Maceió showed that there is a positive correlation between BSF and building energy consumption, while a negative correlation between BH, BD, and FAR, and building energy consumption [55], which are consistent with the findings of this paper. Similarly, studies have shown that there is a negative correlation between FAR and energy consumption in office buildings [46,56]. Due to the multitude of urban morphological parameters, there is variation in the morphological parameters selected by different research scholars when studying different issues, which in turn generates some interesting research findings. For example, this study found a correlation between BD, W/D, H/D, and building energy consumption, which is an interesting finding.

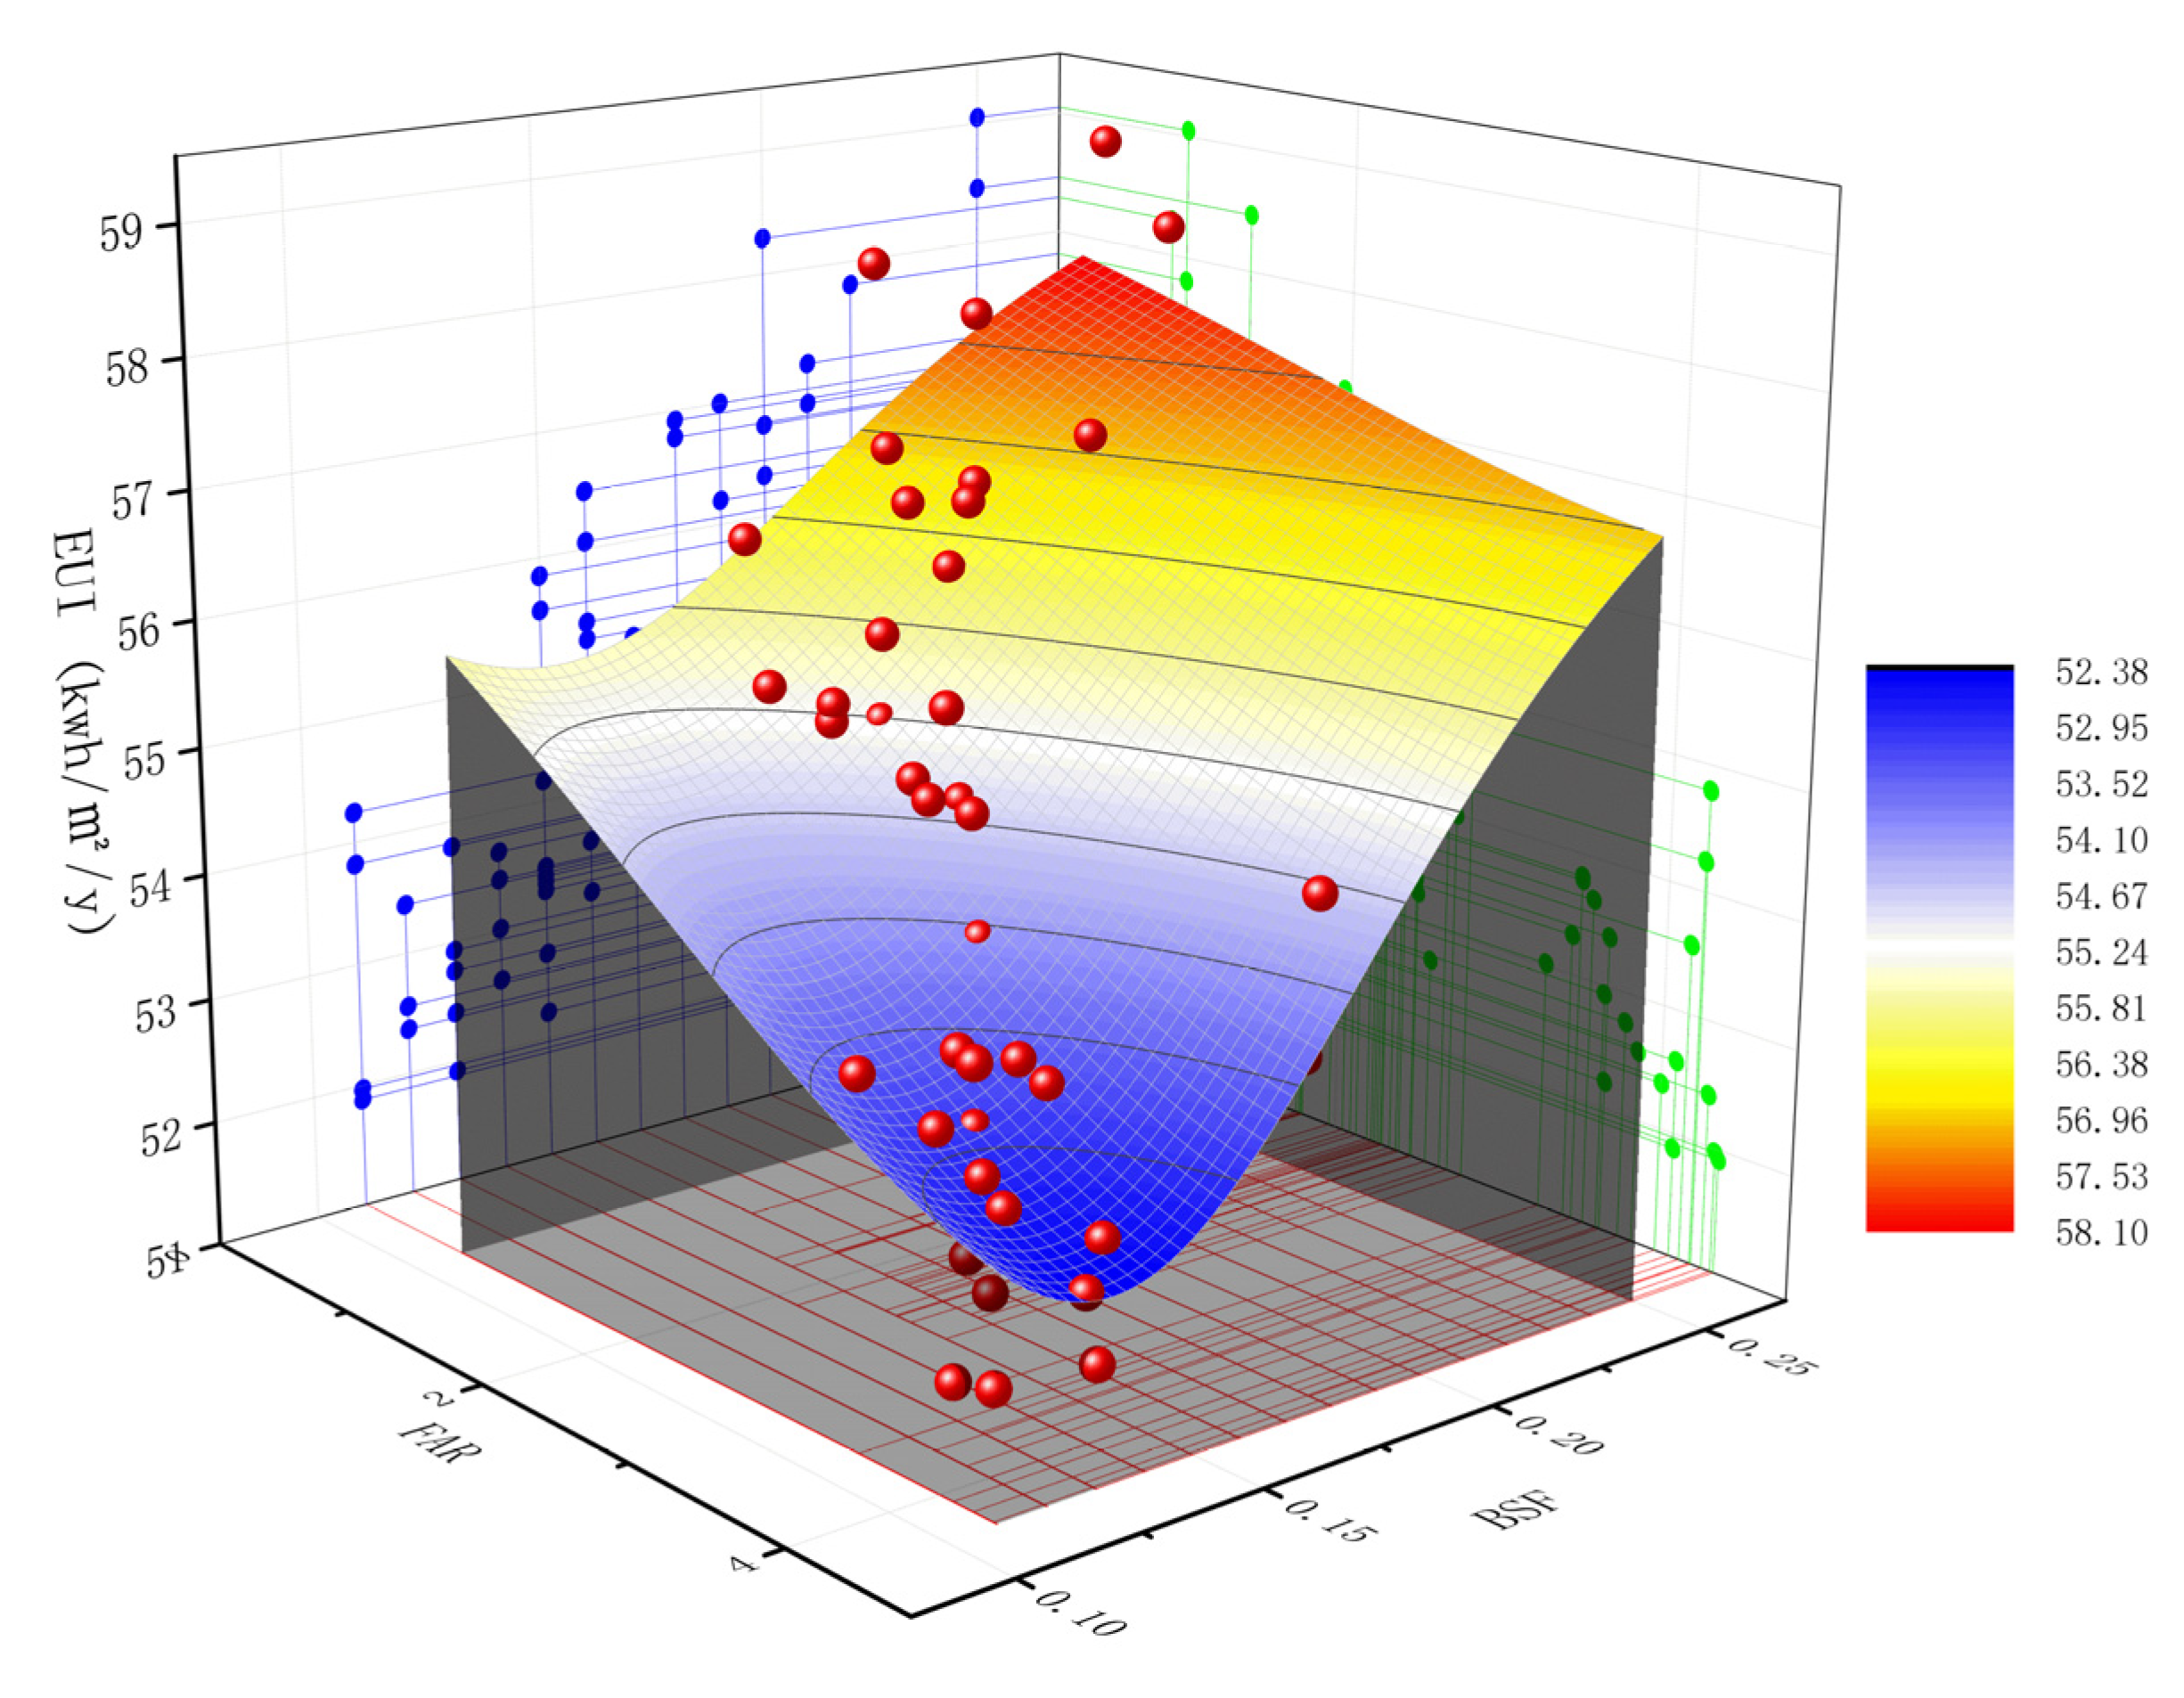
3.2.2. Predictive Model for Building Energy Consumption with Coupled Block Morphology

(1)
Predictive model
Based on the correlation analysis results, this study removed the non-significant correlation variables BW, BD, BH, W/D, H/D, and BCR. The remaining significantly correlated block morphological variables were retained as independent variables, while building EUI was considered the dependent variable for multiple regression analysis. To mitigate the impact of collinearity variables, the study chose a step-by-step regression as the regression method, with the following results obtained:
From Table 5 above, the results of the regression analysis showed that the building energy consumption of office blocks was mainly affected by the combined effect of BSF and FAR, and the predictive model for building energy consumption with the coupled block morphology of office blocks was as follows:
EUI = 52.047 + 26.682 × BSF 0.7 FAR , R 2 = 0.755
Concurrently, the regression analysis results also produce standardized coefficients (Table 5). These coefficients allow for the comparison of the impact of block morphological parameter variables on the dependent variable, despite having different magnitudes and units. The standardization factor Beta is a quantitative indicator used to unify the different quantitative units, which represents the efficiency of the morphological parameters on the building energy consumption. The standardized coefficient for BSF was 0.514, while the standardized coefficient for FAR was −0.414. The multiple correlation coefficient R2 had a value of 0.755. The determination coefficient R2 is a statistical measure that indicates the fitting effect of the model. When R2 is closer to 1, the better the fitting effect of the model. Therefore, the equation showed a relatively high degree of fit, indicating satisfactory and linearly related block morphological parameters with the dependent variable EUI. In other words, the prediction model of building energy consumption with the coupled block morphology in office blocks had a high accuracy. Additionally, the result of the significant value (Sig.) was 0.000 indicating that the prediction model has high statistical significance and reliability.
From the energy flux perspective, the energy gain and loss of an office building is determined by the solar heat gain from the building surface, the heat exchange between the building and the outdoor environment, and the heat loss from the building. On the one hand, the mutual shading of the building group in the block reduces the solar heat gain of the buildings, which in turn reduces the building energy consumption for cooling in summer and increases the building energy consumption for heating in winter. This is supported by the study of Wong et al. [57]. On the other hand, the building fabric geometry impacts the thermal conduction and convection; the larger the building shape factor of the block building groups, the more thermal conduction and convection there is between the building and the outdoor environment, resulting in increased building energy consumption for cooling in summer and reduced building energy consumption for heating in winter. The study of Martilli provides evidence for this view [58].
The three-dimensional spatial relationship of the equation is shown in Figure 21. With the per unit decrease in BSF, EUI can be saved by 2.67 kWh/m2/y (4.88% of average EUI), while with the per unit increase in FAR, EUI can be saved by 0.7 kWh/m2/y (1.23% of average EUI). The beta in this equation was BSF (0.514) > FAR (−0.414). From an energy-efficiency perspective, both reducing the building BSF and increasing the FAR are effective measures in reducing building energy consumption. Moreover, the former is a higher priority than the latter.
The results of the multiple regression equation showed that the key block morphological parameters which combined affected the building EUI of office blocks are the BSF and FAR. Leng et al. [48] investigated the relationship between block morphology and the building heating energy consumption of office buildings; the analysis results showed that the heating energy consumption of office buildings is affected by both BSF and FAR. This finding is consistent with our research conclusions. The impact of urban block typology on building energy use was explored by Taleghani et al. [59] who found that BSF is a significant geometric factor, and the three-storey courtyard layout uses 22% less energy compared to the one-zone layout.
(2)
The predictive model validation
The proposed predictive model was validated through a comparison of the estimated building energy consumption with the simulated values of 10 office blocks that were not used in the model development (Table 6). Validation is measured using the coefficient of variation of CV(RMSE). This approach provides a reliable indicator of model accuracy and ensures that the model is capable of accurately predicting energy consumption for buildings beyond the initial sample [60]. The equation of CV(RMSE) is:
C V ( R M S E ) = 1 _ y i = 1 n ( y i y _ i ) 2 n 1
where y i is the building energy consumption predictive value of block i, _ y i is the mean of the building energy consumption simulated values, and n is the total number of blocks. ASHRAE Guideline 14 [61] suggests that a CV(RMSE) value lower than 30% indicates a reasonable estimation for predictive models. In this case, the calculated CV(RMSE) was 3.91%, indicating that the proposed predictive model for building energy consumption with the coupled block morphology was highly accurate. This model can serve as a valuable reference for exploring the relationship between block morphology and building energy consumption in the Hot-summer and Cold-winter zone in China.

3.3. Limitations and Future Research

The building energy assessment tool for office blocks built in this study is constructed based on the Hot-summer and Cold-winter zone in China, and it can be directly applied to similar climate zones worldwide. For different climatic zones, the assessment tool requires an adjustment of the meteorological parameters, thermal performance parameters, window-to-wall ratios, and other simulation parameters before it can be applied. The workflow proposed in this study can provide urban planners and designers with guiding design indicators at the pre-design stage and policymakers with a reference to the range of building energy use intensity indicators.
There are some limitations in this study that need to be addressed in future research. In terms of research assumptions, this study focuses on the combined effect mechanism of block morphology on building energy consumption. The simulation parameters need to be set uniformly in the building energy simulation model. Therefore, the typical values of the simulation parameters were obtained through field research and literature research for setting, such as the building envelope, occupancy rate, operation rate of lighting and equipment, and window-to-wall ratio. Future research should obtain more accurate simulation parameters for each office block, such as the occupancy rate and operation rate of lighting and equipment, and set them separately to improve the accuracy of the building energy simulation.
The research methodology and workflow proposed in this paper offer new possibilities for studying the correlation between block morphological parameters and building energy consumption with limited research samples and relevant data, which met the statistical requirements.

4. Conclusions

This paper quantitatively investigated the combined effect of block morphology parameters on the building energy consumption of office blocks in the Hot-summer and Cold-winter zone in China, with Wuhan as a case study. Seventy office block building energy consumption data and eight block morphology parameters of blocks are studied in detail through a combination approach of simulation and statistical analysis. A model for predicting the energy consumption of office blocks was proposed. Several conclusions can be addressed here:
  • Block morphology impacted the total EUI by 13.82%.
  • The effect of block morphology on the building cooling, heating, and lighting EUI was 28.83%, 28.56%, and 23.23%, respectively.
  • The results of the correlation analysis demonstrated that BSF is the most significant factor regarding EUI and this is followed by FAR (PCC = −0.810), BH (PCC = −0.644), and BD (PCC = −0.623).
  • The predictive model for building energy consumption with the coupled block morphology for office blocks was as follows Equation (2).
  • The key morphological parameter which combined affect the building energy consumption of office blocks are BSF and FAR, with standardized coefficients of 0.514 and −0.414, respectively. BSF has 1.24 times the effect on building energy consumption than FAR.
The findings of this work are applied to contribute a prospective block-scale energy consumption assessment and energy-efficient design strategies for urban planners, designers, and policymakers. The workflow proposed in this paper can be applied to other cities around the world for promoting sustainable cities.

Author Contributions

Conceptualization, S.X. and H.Z.; methodology, S.X.; software, H.Z. and G.L.; validation, G.L., M.X. and S.X.; formal analysis, G.L.; investigation, H.Z. and G.L.; resources, S.X.; data curation, G.L.; writing—original draft preparation, G.L. and H.Z.; writing—review and editing, M.X., H.D. and T.M.; visualization, G.L.; supervision, S.X.; project administration, S.X.; funding acquisition, S.X. All authors have read and agreed to the published version of the manuscript.

Funding

This research was funded by the National Natural Science Foundation (No. 51978296) and the program for the HUST Academic Frontier Youth Team (No. 2019QYTD10).

Data Availability Statement

The data presented in this study are available in Appendix A.

Conflicts of Interest

The authors declare no conflict of interest.

Nomenclature

BWAverage Building Width of Block
BDAverage Building Depth of Block
BHAverage Building Height of Block
W/DWidth-to-Depth Ratio of Block
H/DHeight-to-Depth Ratio of Block
BSFBuilding Shape Factor
BCRBuilding Coverage Ratio
FARFloor Area Ratio
EUIEnergy Use Intensity
PCCPearson Correlation Coefficient
R-squared (R2)Goodness-of-Fit
VIFVariance Inflation Factor
BESBuilding Energy Simulation

Appendix A

Table A1. Block morphological parameters of 60 block cases.
Block TypologyBlock SamplesBWBDBHW/DH/DBSFBCRFAR
Courtyard multi-storeyA1-143.5415.7424.002.771.520.220.291.74
A1-250.0923.0520.002.170.870.180.331.65
A1-378.1333.1916.002.350.480.160.441.76
A1-445.9714.2720.003.221.400.240.261.30
A1-542.5813.6924.003.111.750.250.221.33
A1-657.6319.5520.002.951.020.190.321.62
Pavilion multi-storeyA2-146.4424.5123.331.890.950.170.301.78
A2-226.4323.1324.001.141.040.210.181.10
A2-334.7424.4020.001.420.820.200.301.49
A2-468.7640.3120.001.710.500.150.331.66
A2-540.0020.1520.001.990.990.220.180.90
A2-646.3423.9416.001.940.670.190.321.26
Slab multi-storeyA3-172.7825.538.002.850.310.230.370.75
A3-259.3318.8020.753.161.100.200.291.51
A3-360.0419.3224.003.111.240.190.201.20
A3-444.8821.2020.002.120.940.200.160.80
A3-534.3816.2617.932.111.100.250.210.90
A3-669.9124.1823.162.890.960.160.201.17
A3-777.7624.1524.003.220.990.150.301.78
A3-884.5627.3020.003.100.730.160.351.77
Mid-rise pavilionB1-126.7921.1830.671.261.450.210.281.96
B1-241.7825.3628.291.651.120.160.282.40
B1-355.3531.0330.001.780.970.160.522.68
B1-438.9825.4437.501.531.470.160.312.73
B1-543.5626.1046.671.671.790.150.192.49
B1-631.4530.8428.001.020.910.160.322.26
B1-747.5124.4841.331.941.690.150.242.59
B1-842.9523.9748.001.792.000.160.202.36
B1-933.4419.1036.001.751.890.200.262.28
B1-1031.3824.1648.361.302.000.170.162.30
B1-1133.5625.8241.331.301.600.160.192.10
B1-1241.2425.5028.001.621.100.160.212.14
B1-1356.0429.3830.401.911.030.150.372.42
Mid-rise slabB2-152.2021.3230.912.451.450.180.312.05
B2-272.2930.1032.672.401.090.140.372.14
B2-349.5123.8640.442.071.690.160.302.30
B2-461.0528.6737.712.131.320.150.352.50
B2-553.4319.9042.862.682.150.170.232.31
B2-649.1222.5734.292.181.520.160.222.21
B2-751.7625.2238.222.051.520.160.262.24
High-rise pavilionC1-153.7928.5053.091.891.860.130.283.50
C1-241.6431.1356.001.341.800.150.293.45
C1-333.6030.24100.001.113.310.140.133.30
C1-458.0441.9869.331.381.650.110.374.08
C1-592.5446.5269.001.991.480.110.484.20
C1-650.7336.9866.291.371.790.120.364.00
C1-734.8431.4357.001.111.810.140.264.08
C1-831.3421.9744.001.432.000.180.254.14
C1-941.3634.5950.861.201.470.130.354.27
C1-1042.1533.2553.141.271.600.130.324.34
C1-1158.0135.9956.001.611.560.120.293.67
C1-1248.3425.4654.861.902.150.150.303.67
C1-1355.9032.3550.401.731.560.120.323.86
C1-1456.7534.2776.001.662.220.110.384.32
High-rise slabC2-172.0432.3164.622.232.000.130.393.65
C2-258.4724.2850.672.412.090.140.283.57
C2-365.7321.7566.403.023.050.150.262.82
C2-469.0633.2673.142.082.200.110.253.50
C2-554.5326.4061.712.072.340.130.263.78
C2-652.3316.4590.403.185.500.180.204.21

References

  1. IEA. World Energy Outlook 2022; IEA: Paris, France, 2022.
  2. IEA. World Energy Outlook 2021; IEA: Paris, France, 2021.
  3. Central People’s Government of the People’s Republic of China. Proposal of the CPC Central Committee on Formulating the 14th Five-Year Plan for National Economic and Social Development and the long-range Goals for the next Five-Year Period. 2020. Available online: http://www.gov.cn/zhengce/2020-11/03/content_5556991.htm (accessed on 20 January 2023).
  4. The State Council of China. Carbon Peaking Action Programme by 2030. 2021. Available online: http://www.gov.cn/zhengce/content/2021-10/26/content_5644984.htm (accessed on 20 January 2023).
  5. China Association of Building Energy Efficiency. China Building Energy Consumption Research Report 2016; China Association of Building Energy Efficiency: Shanghai, China, 2016. [Google Scholar]
  6. Hong, T.; Langevin, J.; Sun, K. Building simulation: Ten challenges. Build. Simul. 2018, 11, 871–898. [Google Scholar] [CrossRef]
  7. Souza, L.; Bueno, C. City Information Modelling as a support decision tool for planning and management of cities: A systematic literature review and bibliometric analysis. Build. Environ. 2022, 207, 108403. [Google Scholar] [CrossRef]
  8. Omrany, H.; Ghaffarianhoseini, A.; Ghaffarianhoseini, A.; Clements-Croome, D.J. The uptake of City Information Modelling (CIM): A comprehensive review of current implementations, challenges and future outlook. Smart Sustain. Built Environ. 2022. ahead-of-print. [Google Scholar] [CrossRef]
  9. Ang, Y.; Berzolla, Z.; Reinhart, C. From concept to application: A review of use cases in urban building energy modeling. Appl. Energy 2020, 279, 115738. [Google Scholar] [CrossRef]
  10. Reinhart, C.F.; Davila, C.C. Urban building energy modeling—A review of a nascent field. Build. Environ. 2016, 97, 196–202. [Google Scholar] [CrossRef]
  11. Hong, T.; Chen, Y.; Luo, X.; Luo, N.; Lee, S.H. Ten questions on urban building energy modeling. Build. Environ. 2020, 168, 106508. [Google Scholar] [CrossRef]
  12. Ratti, C.; Baker, N.; Steemers, K. Energy consumption and urban texture. Energy Build. 2005, 37, 762–776. [Google Scholar] [CrossRef]
  13. Oh, M.; Jang, K.M.; Kim, Y. Empirical analysis of building energy consumption and urban form in a large city: A case of Seoul, South Korea. Energy Build. 2021, 245, 111046. [Google Scholar] [CrossRef]
  14. Steemers, K. Energy and the city: Density, buildings and transport. Energy Build. 2003, 35, 3–14. [Google Scholar] [CrossRef]
  15. Strømann-Andersen, J.; Sattrup, P.A. The urban canyon and building energy use: Urban density versus daylight and passive solar gains. Energy Build. 2011, 43, 2011–2020. [Google Scholar] [CrossRef]
  16. Shareef, S.; Altan, H. Urban block configuration and the impact on energy consumption: A case study of sinuous morphology. Renew. Sustain. Energy Rev. 2022, 163, 112507. [Google Scholar] [CrossRef]
  17. El Bat, S.; Romani, Z.; Bozonnet, E.; Draoui, A.; Allard, F. Optimizing urban courtyard form through the coupling of outdoor zonal approach and building energy modeling. Energy 2023, 264, 126176. [Google Scholar] [CrossRef]
  18. Bansal, P.; Quan, S.J. Relationships between building characteristics, urban form and building energy use in different local climate zone contexts: An empirical study in Seoul. Energy Build. 2022, 272, 112335. [Google Scholar] [CrossRef]
  19. Deng, Q.; Wang, G.; Wang, Y.; Zhou, H.; Ma, L. A quantitative analysis of the impact of residential cluster layout on building heating energy consumption in cold IIB regions of China. Energy Build. 2021, 253, 111515. [Google Scholar] [CrossRef]
  20. Li, C.; Song, Y.; Kaza, N. Urban form and household electricity consumption: A multilevel study. Energy Build. 2018, 158, 181–193. [Google Scholar] [CrossRef]
  21. Huang, J.; Kaewunruen, S. Forecasting Energy Consumption of a Public Building Using Transformer and Support Vector Regression. Energies 2023, 16, 966. [Google Scholar] [CrossRef]
  22. Li, X.; Ying, Y.; Xu, X.; Wang, Y.; Hussain, S.A.; Hong, T.; Wang, W. Identifying key determinants for building energy analysis from urban building datasets. Build. Environ. 2020, 181, 107114. [Google Scholar] [CrossRef]
  23. Vartholomaios, A. A parametric sensitivity analysis of the influence of urban form on domestic energy consumption for heating and cooling in a Mediterranean city. Sustain. Cities Soc. 2017, 28, 135–145. [Google Scholar] [CrossRef]
  24. Shi, Z.; Fonseca, J.A.; Schlueter, A. A parametric method using vernacular urban block typologies for investigating interactions between solar energy use and urban design. Renew. Energy 2021, 165, 823–841. [Google Scholar] [CrossRef]
  25. Javanroodi, K.; Nik, V.M.; Mahdavinejad, M. A novel design-based optimization framework for enhancing the energy efficiency of high-rise office buildings in urban areas. Sustain. Cities Soc. 2019, 49, 101597. [Google Scholar] [CrossRef]
  26. Loeffler, R.; Österreicher, D.; Stoeglehner, G. The energy implications of urban morphology from an urban planning perspective – A case study for a new urban development area in the city of Vienna. Energy Build. 2021, 252, 111453. [Google Scholar] [CrossRef]
  27. Hadavi, M.; Pasdarshahri, H. Investigating effects of urban configuration and density on urban climate and building systems energy consumption. J. Build. Eng. 2021, 44, 102710. [Google Scholar] [CrossRef]
  28. Shareef, S. The impact of urban morphology and building’s height diversity on energy consumption at urban scale. The case study of Dubai. Build. Environ. 2021, 194, 107675. [Google Scholar] [CrossRef]
  29. SMangan, D.; Oral, G.K.; Kocagil, I.E.; Sozen, I. The impact of urban form on building energy and cost efficiency in temperate-humid zones. J. Build. Eng. 2021, 33, 101626. [Google Scholar] [CrossRef]
  30. Zhang, J.; Xu, L.; Shabunko, V.; Tay, S.E.R.; Sun, H.; Lau, S.S.Y.; Reindl, T. Impact of urban block typology on building solar potential and energy use efficiency in tropical high-density city. Appl. Energy 2019, 240, 513–533. [Google Scholar] [CrossRef]
  31. Kamal, A.; Abidi, S.M.H.; Mahfouz, A.; Kadam, S.; Rahman, A.; Hassan, I.G.; Wang, L.L. Impact of urban morphology on urban microclimate and building energy loads. Energy Build. 2021, 253, 111499. [Google Scholar] [CrossRef]
  32. Boccalatte, A.; Fossa, M.; Gaillard, L.; Menezo, C. Microclimate and urban morphology effects on building energy demand in different European cities. Energy Build. 2020, 224, 110129. [Google Scholar] [CrossRef]
  33. Mirzabeigi, S.; Razkenari, M. Design optimization of urban typologies: A framework for evaluating building energy performance and outdoor thermal comfort. Sustain. Cities Soc. 2022, 76, 103515. [Google Scholar] [CrossRef]
  34. Quan, S.J.; Li, C. Urban form and building energy use: A systematic review of measures, mechanisms, and methodologies. Renew. Sustain. Energy Rev. 2021, 139, 110662. [Google Scholar] [CrossRef]
  35. Wang, C.; Ferrando, M.; Causone, F.; Jin, X.; Zhou, X.; Shi, X. Data acquisition for urban building energy modeling: A review. Build. Environ. 2022, 217, 109056. [Google Scholar] [CrossRef]
  36. East China Construction Group Co., Ltd. Architectural Design Sourcebook, Volume 3; China Architecture & Building Press: Beijing, China, 2017; p. 2. [Google Scholar]
  37. Ministry of Public Security of the People’s Republic of China. Code for Fire Protection Design of Buildings, GB 50016-2014; China Planning Press: Beijing, China, 2014; pp. 61–62.
  38. Zhejiang Building Design & Research Institute. Office Building Design Standards, JGJ /T 67-2019; China Architecture Publishing Media Co., Ltd.: Beijing, China, 2019; pp. 15–16. [Google Scholar]
  39. Wang, W.; Liu, K.; Zhang, M.; Shen, Y.; Jing, R.; Xu, X. From simulation to data-driven approach: A framework of integrating urban morphology to low-energy urban design. Renew. Energy 2021, 179, 2016–2035. [Google Scholar] [CrossRef]
  40. Ahmadian, E.; Sodagar, B.; Bingham, C.; Elnokaly, A.; Mills, G. Effect of urban built form and density on building energy performance in temperate climates. Energy Build. 2021, 236, 110762. [Google Scholar] [CrossRef]
  41. Ahmadian, E.; Sodagar, B.; Mills, G.; Byrd, H.; Bingham, C.; Zolotas, A. Sustainable cities: The relationships between urban built forms and density indicators. Cities 2019, 95, 102382. [Google Scholar] [CrossRef]
  42. Tian, J.; Xu, S. A morphology-based evaluation on block-scale solar potential for residential area in central China. Sol. Energy 2021, 221, 332–347. [Google Scholar] [CrossRef]
  43. Urquizo, J.; Calderón, C.; James, P. Understanding the complexities of domestic energy reductions in cities: Integrating data sets generally available in the United Kingdom’s local authorities. Cities 2018, 74, 292–309. [Google Scholar] [CrossRef]
  44. Fumo, N.; Mago, P.; Luck, R. Methodology to estimate building energy consumption using EnergyPlus Benchmark Models. Energy Build. 2010, 42, 2331–2337. [Google Scholar] [CrossRef]
  45. Boyano, A.; Hernandez, P.; Wolf, O. Energy demands and potential savings in European office buildings: Case studies based on EnergyPlus simulations. Energy Build. 2013, 65, 19–28. [Google Scholar] [CrossRef]
  46. Natanian, J.; Aleksandrowicz, O.; Auer, T. A parametric approach to optimizing urban form, energy balance and environmental quality: The case of Mediterranean districts. Appl. Energy 2019, 254, 113637. [Google Scholar] [CrossRef]
  47. Kavgic, M.; Mavrogianni, A.; Mumovic, D.; Summerfield, A.; Stevanovic, Z.; Djurovic-Petrovic, M. A review of bottom-up building stock models for energy consumption in the residential sector. Build. Environ. 2010, 45, 1683–1697. [Google Scholar] [CrossRef]
  48. Leng, H.; Chen, X.; Ma, Y.; Wong, N.H.; Ming, T. Urban morphology and building heating energy consumption: Evidence from Harbin, a severe cold region city. Energy Build. 2020, 224, 110143. [Google Scholar] [CrossRef]
  49. Maamari, F.; Andersen, M.; de Boer, J.; Carroll, W.L.; Dumortier, D.; Greenup, P. Experimental validation of simulation methods for bi-directional transmission properties at the daylighting performance level. Energy Build. 2006, 38, 878–889. [Google Scholar] [CrossRef]
  50. Reeves, S.O.T. Validation of Building Energy Modeling Tools: EcotectTM, Green Building StudioTM and IES<VE>TM. In Proceedings of the 2012 Winter Simulation Conference, Berlin, Germany, 9–12 December 2012; pp. 582–593. [Google Scholar]
  51. Tian, W. A review of sensitivity analysis methods in building energy analysis. Renew. Sustain. Energy Rev. 2013, 20, 411–419. [Google Scholar] [CrossRef]
  52. Kristensen, M.H.; Petersen, S. Choosing the appropriate sensitivity analysis method for building energy model-based investigations. Energy Build. 2016, 130, 166–176. [Google Scholar] [CrossRef]
  53. Tso, G.K.F.; Guan, J. A multilevel regression approach to understand effects of environment indicators and household features on residential energy consumption. Energy 2014, 66, 722–731. [Google Scholar] [CrossRef]
  54. Lima, I.; Scalco, V.; Lamberts, R. Estimating the impact of urban densification on high-rise office building cooling loads in a hot and humid climate. Energy Build. 2019, 182, 30–44. [Google Scholar] [CrossRef]
  55. Martins, T.; Adolphe, L.; Bonhomme, M. Building Energy Demand based on urban morphology analysis. In Proceedings of the PLEA2013—29th Conference, Sustainable Architecture for a Renewable Future, Munich, Germany, 10–12 September 2013. [Google Scholar]
  56. Pan, Y.; Pan, Y.; Yang, Y.; Liu, H. A Parametric Study on the Community Form and Its Influences on Energy Consumption of Office Buildings in Shanghai. Procedia Eng. 2017, 205, 548–555. [Google Scholar] [CrossRef]
  57. Wong, N.H.; Jusuf, S.K.; Syafii, N.I.; Chen, Y.; Hajadi, N.; Sathyanarayanan, Y.V. Manickavasagam, Evaluation of the impact of the surrounding urban morphology on building energy consumption. Sol. Energy 2011, 85, 57–71. [Google Scholar] [CrossRef]
  58. Martilli, A. An idealized study of city structure, urban climate, energy consumption, and air quality. Urban Clim. 2014, 10, 430–446. [Google Scholar] [CrossRef]
  59. Taleghani, M.; Tenpierik, M.; van den Dobbelsteen, A.; de Dear, R. Energy use impact of and thermal comfort in different urban block types in the Netherlands. Energy Build. 2013, 67, 166–175. [Google Scholar] [CrossRef]
  60. Ruiz, G.; Bandera, C. Validation of Calibrated Energy Models: Common Errors. Energies 2017, 10, 1587. [Google Scholar] [CrossRef]
  61. American Society of Heating, Ventilation, and Air Conditioning Engineers (ASHRAE). Guideline 14-2014, Measurement of Energy, Demand and Water Savings; American Society of Heating, Ventilating, and Air Conditioning Engineers: Atlanta, GA, USA, 2014. [Google Scholar]
Figure 1. Regional trends in energy demand per capita under three scenarios [1].
Buildings 13 00768 g001
Figure 2. Regional trends in per capita CO2 emissions in 2020 and 2030 of the APS [2].
Buildings 13 00768 g002
Figure 3. Factors that affect building energy consumption [12].
Buildings 13 00768 g003
Figure 4. Workflow of holistic approach with four major steps.
Buildings 13 00768 g004
Figure 5. The distribution of office block samples.
Buildings 13 00768 g005
Figure 6. Calculation equation of block morphological parameters.
Buildings 13 00768 g006
Figure 7. The workflow of building energy simulation.
Buildings 13 00768 g007
Figure 8. The process of 3D model generation.
Buildings 13 00768 g008
Figure 9. Building information and monthly electricity consumption data.
Buildings 13 00768 g009
Figure 10. Comparison of measured and simulated EUI.
Buildings 13 00768 g010
Figure 11. Results of linear regression analysis.
Buildings 13 00768 g011
Figure 12. Distribution characteristics of total EUI of sixty office block samples.
Buildings 13 00768 g012
Figure 13. Distribution characteristics of EUI for cooling in seven typologies of office blocks.
Buildings 13 00768 g013
Figure 14. Distribution characteristics of EUI for heating in seven typologies of office blocks.
Buildings 13 00768 g014
Figure 15. Distribution characteristics of EUI for lighting in seven typologies of office blocks.
Buildings 13 00768 g015
Figure 16. Distribution characteristics of total EUI in different typologies of office blocks.
Buildings 13 00768 g016
Figure 17. Distribution characteristics of EUI for cooling in different typologies of office blocks.
Buildings 13 00768 g017
Figure 18. Distribution characteristics of EUI for heating in different typologies of office blocks.
Buildings 13 00768 g018
Figure 19. Distribution characteristics of EUI for lighting in different typologies of office blocks.
Buildings 13 00768 g019
Figure 20. Thermal matrix of correlations between block morphological parameters and EUI.
Buildings 13 00768 g020
Figure 21. 3D nonlinear surface for multiple regression equation.
Buildings 13 00768 g021
Table 1. The classification results of real office block samples.
Building
Height Type
Building HeightBuilding Layout TypeBlock
Typology
Block 3D ModelBlock Sample
Multi-storey
office blocks
H ≤ 24 mCourtyardCourtyard multi-storeyBuildings 13 00768 i001Buildings 13 00768 i002
PavilionPavilion multi-storeyBuildings 13 00768 i003Buildings 13 00768 i004
SlabSlab multi-storeyBuildings 13 00768 i005Buildings 13 00768 i006
Mid-rise office blocks24 < H ≤ 50 mPavilionMid-rise pavilionBuildings 13 00768 i007Buildings 13 00768 i008
SlabMid-rise slabBuildings 13 00768 i009Buildings 13 00768 i010
High-rise office blocks50 < H ≤ 100 mPavilionHigh-rise pavilionBuildings 13 00768 i011Buildings 13 00768 i012
SlabHigh-rise slabBuildings 13 00768 i013Buildings 13 00768 i014
Table 2. Parameter setting in the BES model-1.
ItemParameter Setting
Occupancy Rate8 a.m.–7 p.m. (Mon.–Fri.)8 a.m.–9.a.m.9 a.m.–12 a.m.12 a.m.–1 p.m.1 p.m.–2 p.m.2 p.m.–6 p.m.6 p.m.–7.p.m.
0.170.960.040.810.960.23
9 a.m.–5 p.m. (Sat.–Sun.)8 a.m.–9 a.m.9 a.m.–12 a.m.12 a.m.–1 p.m.1 p.m.–2 p.m.2 p.m.–6 p.m.6 p.m.–7 p.m.
0.100.180.040.040.180.10
Operation Rate of Lighting8 a.m.–7 p.m. (Mon.–Fri.)8 a.m.–9 a.m9 a.m.–12 a.m.12 a.m.–1 p.m.1 p.m.–2 p.m.2 p.m.–6 p.m.6 p.m.–7 p m.
0.060.960.860.920.960.75
9 a.m.–5 p.m. (Sat.–Sun.)8 a.m.–9 a.m.9 a.m.–12 a.m.12 a.m.–1 p.m.1 p.m.–2 p.m.2 p.m.–6 p.m.6 p.m.–7 p.m.
0.060.180.140.140.180.10
Operation Rate of Equipment8 a.m.–7 p.m. (Mon.–Fri.)8 a.m.–9 a.m.9 a.m.–12 a.m.12 a.m.–1 p.m.1 pm–2 pm2 p.m.–6 p.m.6 p.m.–7 p.m.
0.180.960.880.930.960.16
9 a.m.–5 p.m. (Sat.–Sun.)8 a.m.–9 a.m9 a.m.–12 a.m.12 a.m.–1 p.m.1 p.m.–2 p.m.2 p.m.–6 p.m.6 p.m.–7 p.m.
0.100.180.140.160.180.10
Temperature setCooling Set Point (°C)8 a.m.–6 p.m. (Mon.–Fri.)26Heating Set Point (°C)8 a.m.–6 p.m. (Mon.–Fri.)Heating Set Point (°C)18
DensityOccupancy density/(m2/person)8
Lighting power density/(W/m2)15
Equipment power density/(W/m2)15
Table 3. Parameter setting in the BES model-2.
ItemParameter Setting
Transparent EnvelopeWindow-to-Wall RatioNESW
0.50.30.50.3
Solar Heat Gain CoefficientNESW
0.480.440.440.44
Opaque EnvelopeHeat Transfer Coefficient (W/(m2·K)Exterior wallInterior wallRoofFloor slabs
0.980.790.480.98
Heat Transfer Coefficient (W/(m2·K)3.0Floor-to-Floor Height(m)4
Table 4. Pearson correlation coefficient and p value in the linear regression relationship between block morphological parameters and building EUI.
Block Morphological ParametersPCCp Value
Average Building Width of Block (BW)−0.1250.343
Average Building Depth of Block (BD)−0.0623 **0.000
Average Building Height of Block (BH)−0.644 **0.000
Width-to-Depth Ratio of Block (W/D)0.411 **0.001
Height-to-Depth Ratio of Block (H/D)−0.316 *0.014
Building Shape Factor (BS)0.833 **0.000
Building Coverage Ratio (BCR)−0.277 *0.032
Floor Area Ratio (FAR)−0.810 **0.000
* means the correlation was significant at level 0.05; ** means the correlation was significant at level 0.01.
Table 5. Regression analysis results.
Dependent VariablesIndependent VariablesUnstandardized CoefficientsStandardized CoefficientsSig.VIFR Square
(R2)
BStandard ErrorBeta
EUI(Constants)52.0471.229 0.000 0.755
BSF26.6825.2440.5140.0002.464
FAR−0.7000.171−0.4140.0002.464
Table 6. Block morphological parameters and EUI of block samples for model validation.
No.Block
Typology
BW
(m)
BD
(m)
BH
(m)
W/DH/DBSFBCRFARPredictive EUI (kWh/m2/y)Simulated EUI (kWh/m2/y)
1Multi-storey82.6036.2612.002.280.400.1840.00%1.2056.0157.50
2Multi-storey28.2310.5520.002.682.210.3636.06%1.8061.1162.53
3Multi-storey54.5916.9820.003.241.190.2130.63%1.5356.5857.86
4Multi-storey51.7421.6620.002.390.740.1638.53%1.9354.9756.38
5Multi-storey85.1523.5516.003.620.710.1934.28%1.3756.1657.73
6Mid-rise54.9614.8224.003.711.620.2231.73%1.9056.5957.88
7Mid-rise49.4115.3524.003.221.580.2239.40%2.3656.2757.75
8Mid-rise51.4017.0624.003.011.480.2121.99%1.3256.7358.27
9Mid-rise39.3416.4524.002.391.460.2223.86%1.4356.9257.68
10Mid-rise55.9515.8824.003.521.230.1828.75%1.7255.6558.89
Disclaimer/Publisher’s Note: The statements, opinions and data contained in all publications are solely those of the individual author(s) and contributor(s) and not of MDPI and/or the editor(s). MDPI and/or the editor(s) disclaim responsibility for any injury to people or property resulting from any ideas, methods, instructions or products referred to in the content.

