

The Effect of Using Tall Windows in Buildings on the Thermal Load of the Building and Its Cost Analysis: A Comparative Case Study for Antalya and Erzurum

Abstract
:1. Introduction
2. Materials and Methods
2.1. Building Design
2.2. Determination of Building Types
2.3. Selection of Window Types
2.4. Determination of Construction Component
2.5. Calculation of Thermal Loads
2.5.1. Heat Loss
2.5.2. Heat Gain
2.6. Determination of Systems Costs
2.6.1. Initial Investment Costs
2.6.2. Operating Costs
3. Results and Discussion
- The garage on the ground floor was also naturally air-conditioned.
- A central heating system with natural gas was preferred for the heating system.
- A split air conditioner was preferred for the cooling system.
- The building was a free-standing layout type.
- The heating system was selected so that the system runs continuously, with the set value turned down during night.
- The passive type in Erzurum and solar-controlled type in Antalya were selected as the window coating types.
- Ambient data assumed to be for Erzurum and Antalya, respectively;
- is −21 °C and +3 °C (winter);
- is +30 °C and +39 °C (summer);
- is +25 °C and +29 °C (summer);
- is 55% and 45% (summer);
- is 60% and 35% (summer).
- All thermal loads are presented in kcal h−1 in the calculations.
- In Erzurum, the heating system was considered to operate for 8 months, October–May, and the cooling system operated for only one month, August.
- In Antalya, the heating system was considered to operate for 5 months, November–March, and the cooling system operated for 4 months, June–September.
- In the solar irradiation calculations, the shading factor was taken as 0.9 for windows with clear glass, and 0.5 for windows with low-E glass.
3.1. Heat Loss
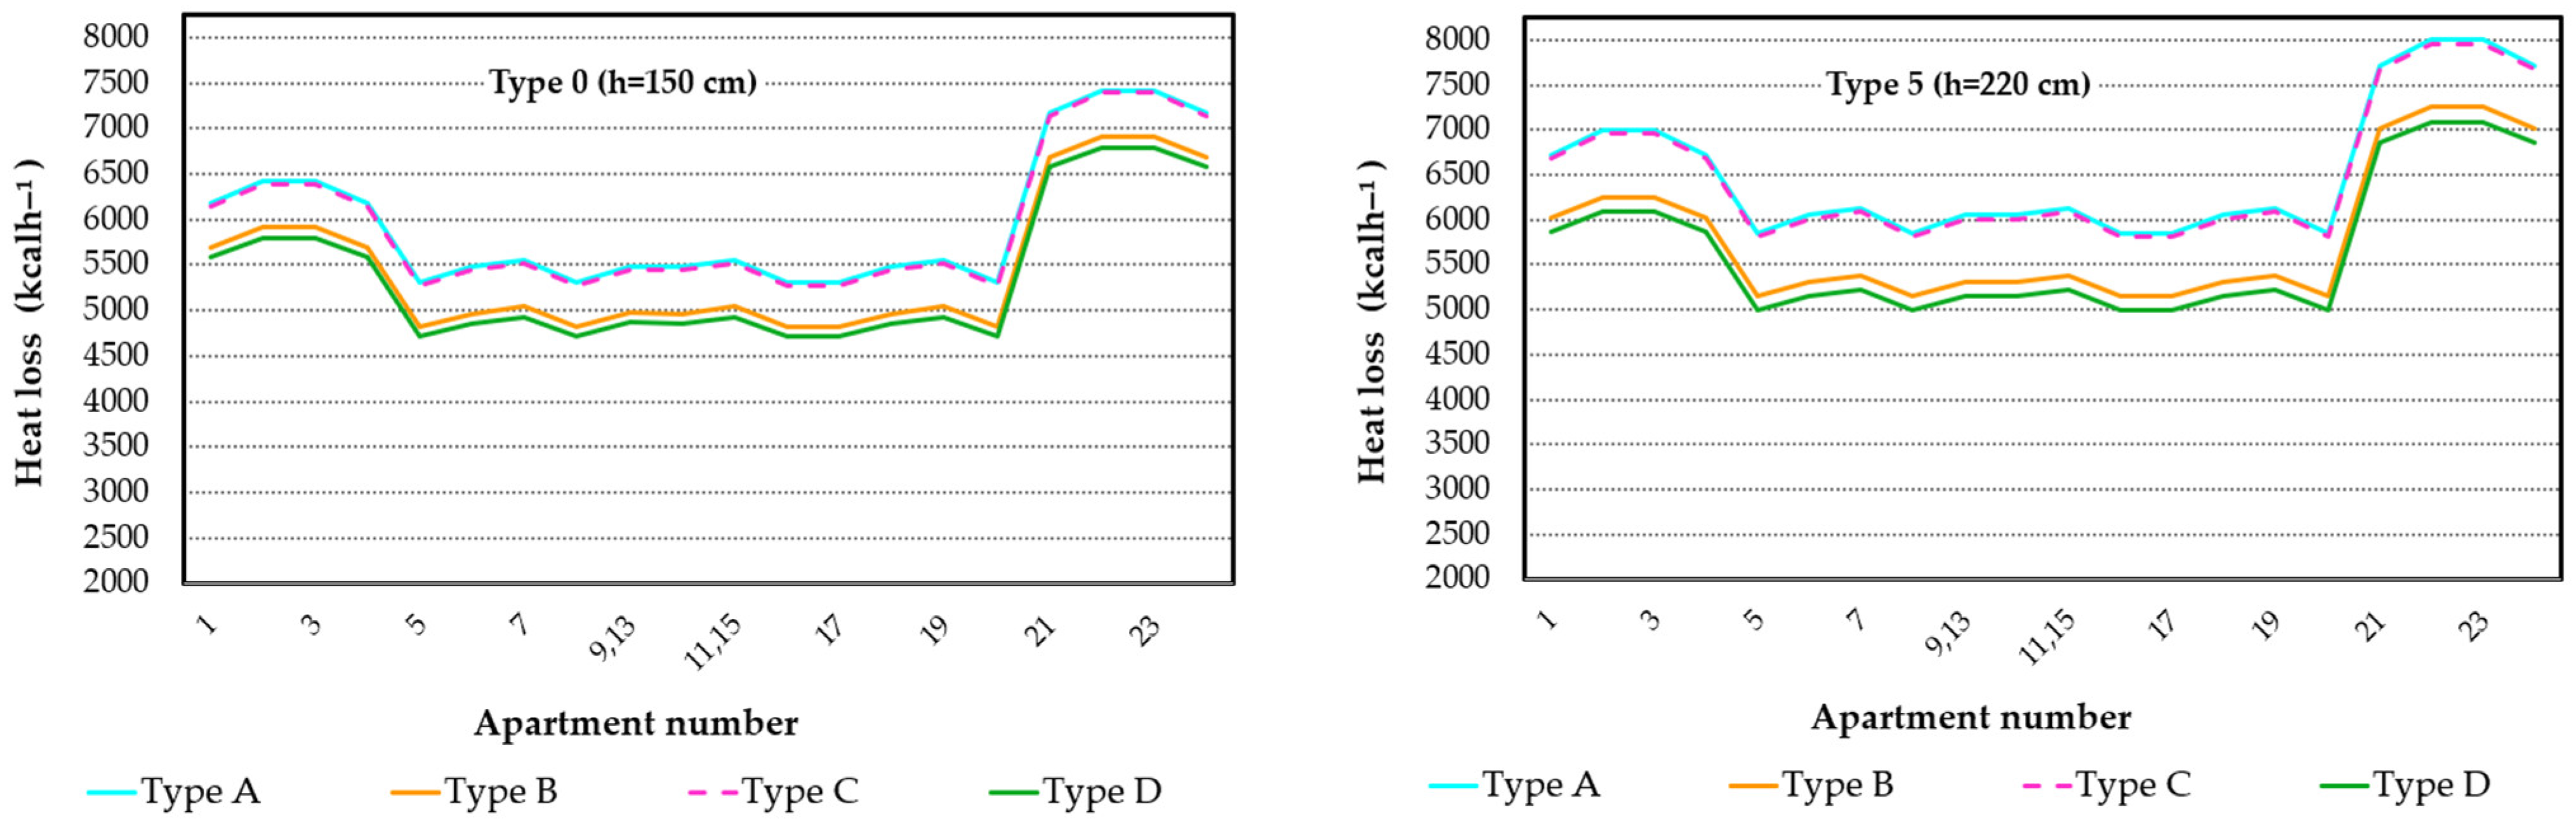
- It is seen that the heat loss in the apartments numbered 1, 2, 3, and 4 on the first floor above the unheated volume (garage) is much higher than the heat loss in the apartments on the intermediate floors.
- It is also observed that the heat loss in the apartments on the top floor is much higher than for the apartments on the intermediate floors due to the heat loss through the roof.
- Similarly, although located on the same floor, this difference in apartments with different heat loss values varies depending on the direction of the apartment.
- It is seen that the heat loss values in Type 1, 2, 3, 4, and 5 buildings, which show a gradual transition from a 150 cm tall window to a 220 cm tall window, are more distinctly spaced in Type A and C windows, whereas they are narrower in Type B and D windows with low-E glass.
- The positive effect of low-E technology in windows on heat loss is evident in Type B and D.
- The heat loss values of windows with clear glass are significantly higher than of windows with low-E glass.
- Since the U values of Type C and Type A windows defined in Table 4 are very close to each other, the lines appear almost adjacent to each other in the graph.
- In Erzurum, which has a colder climate, the heat loss in apartments is higher than in Antalya due to the larger values.
- There is a noticeable increase in heat loss with an increasing window height.
- The difference in heat loss between apartments on the same floor, i.e., the fluctuation in the figure, is also larger in Erzurum. This shows the importance of solar energy in cold climates.
3.2. Heat Gain
3.3. Costs Analysis
- Different results may be obtained in different studies since the thermal loads and related costs in buildings depend on many different parameters such as the size, architecture, and location of the building.
- In buildings with different base area to surface area proportions, the differential costs incurred by the change in the window size may become too small so that the implementation seems insignificant in comparison. Such situations will relatively reduce the emphasis on the importance of energy saving, which is the main objective of this study.
4. Conclusions
- The 46.7% increase in window area brought on an increase in the heat loss for the most window with clear glass, Type-A, and the least window with low-E glass, Type-D.
- When the thermal loss values are examined, it can be seen that the thermal loss values in Erzurum were approximately 50% higher than in Antalya. Antalya, which has higher temperatures than Erzurum both in the summer and winter, had lower thermal loss values due to lower values in the winter. However, as for the heat gain, the opposite is the case.
- When thermal gain values are examined:
- ○
- It can be seen that the thermal gain value by conduction in Erzurum was approximately 25% less than in Antalya. Although the heat gain value in Antalya increased with the increased window area, the increase rates with respect to Type 0 were less in Erzurum due to the lower values.
- ○
- Due to the effect of insolation during the day in Antalya, the amount of heat gained by irradiation in Antalya is higher than in Erzurum. The 46.7% increase in the window area resulted in an approximately 30% increase in heat gain by radiation.
- Since the thermal transmittance coefficients of windows with low-e glass are lower, they have a positive effect from 70% to 75% in thermal gain values and 50% to 60% in heat loss values.
- In cold climates such as Erzurum, the energy consumed by heating systems is always much higher than the energy consumed by the cooling system.
- In hot climates such as Antalya, the energy consumed by heating systems is always much lower than that consumed by the cooling system.
- The 46.7% increase in the window area led to an increase in energy consumption in both the heating system and the cooling system. This value is approximately 50% less in the case of windows with low-E glass.
- The average cost of energy consumption increased by USD 1465.32 per year in Erzurum and USD 581.08 in Antalya due to the increased window area. All these values were discussed in detail in the study.
- This study used real window sizes from a real architectural project. However, in similar studies in the literature, approximate wall/window ratios were generally used, such as 10%, 20%, etc.
- The costs are real values that are used in the markets.
- In similar studies in the literature, the energy consumption values and costs caused by increased thermal loads due to an increased window area have been analyzed. Unlike the literature, this study also examined the differences in the initial investment cost caused by the increased capacities of the thermal system equipment due to increasing thermal loads.
Supplementary Materials
Funding
Institutional Review Board Statement
Informed Consent Statement
Data Availability Statement
Conflicts of Interest
Nomenclature
| Surface area of construction components (m2) | |
| Annual consumption amount of natural gas (kg year−1 or m3 year−1) | |
| Diversity factor | |
| Window height (m) | |
| Lower heating value (kJm−3) | |
| Construction components of building | |
| Heat gain from equipment (W) | |
| Amount of electric energy consumption (kWh) | |
| Heat value by conduction (W) | |
| Heat gain from devices (W) | |
| Heat gain with fresh air (W) | |
| Heat gain (W) | |
| Indoor heat gain (W) | |
| Heat gain from lamp (W) | |
| Heat loss (W) | |
| Non-incremental heat loss (W) | |
| Heat gain from humans (W) | |
| Outdoor heat gain (W) | |
| Heat value by radiation (W) | |
| The difference in the cost of windows between tall windows and standard windows (USD) | |
| Cost of external wall area to be saved when tall windows are used (USD) | |
| The difference in initial investment costs of equipment in the heating system due to change in window height (USD) | |
| The difference in initial investment costs of equipment in the cooling system due to change in window height (USD) | |
| The difference in the cost of the amount of natural gas used in the heating system (USD) | |
| The difference in the cost of electricity consumed by the air conditioner used in the cooling system (USD) | |
| Outdoor air temperature (K) | |
| Indoor air temperature (K) | |
| Thermal transmittance coefficient of construction components (Wm−2 K−1) | |
| Annual operating time (day year−1) | |
| Direction factor | |
| Daily operating time (hour day−1) | |
| Height effect | |
| Combined effect | |
| Thermal efficiency | |
| Humidity value of outdoor | |
| Humidity value of indoor | |
| Abbreviations | |
| W1, …, W5 | Window1, …, Window5 |
| TS | Turkish Standards |
| low-E | Low-emissivity coating |
References
- The International Energy Agency. Turkey 2021 Enery Policy Review; The International Energy Agency (IEA): Paris, France, 2021; Available online: https://www.iea.org/reports/turkey-2021 (accessed on 14 December 2022).
- Najjar, M.K.; Figueiredo, K.; Hammad, A.W.; Tam, V.W.; Evangelista, A.C.; Haddad, A. A framework to estimate heat energy loss in building operation. J. Clean. Prod. 2019, 235, 789–800. [Google Scholar] [CrossRef]
- Hee, W.; Alghoul, M.; Bakhtyar, B.; Elayeb, O.; Shameri, M.; Alrubaih, M.; Sopian, K. The role of window glazing on daylighting and energy saving in the buildings. Renew. Sustain. Energy Rev. 2015, 42, 323–343. [Google Scholar] [CrossRef]
- Heydaria, A.; Sadatib, S.E.; Ghariba, M.R. Effects of different window configurations on energy consumption in building: Optimization and economic analysis. J. Build. Eng. 2020, 35, 102099. [Google Scholar] [CrossRef]
- Moghaddam, S.A.; Mattsson, M.; Ameen, A.; Akander, J.; Silva, M.G.; Simões, N. Low-Emissivity Window Films as an Energy Retrofit Option for a Historical Stone Building in Cold Climate. Energies 2021, 14, 7584. [Google Scholar] [CrossRef]
- Akram, M.W.; Hasannuzaman, M.; Cuce, E.; Cuce, P.M. Global technological advancement and challenges of glazed window, facade system and vertical greenery-based energy savings in buildings: A comprehensive review. Energy Built Environ. 2021, 4, 206–226. [Google Scholar] [CrossRef]
- Shree, V.; Goyal, N.; Saxena, A.; Bhattacharyya, S.; Dwivedi, A.; Goel, V. Assessment of thermal loading in energy-efficient buildings: Parametric review on the window design aspects. J. Therm. Anal. Calorim. 2022. [Google Scholar] [CrossRef]
- Lee, J.; Jung, H.; Park, J.; Lee, J.; Yoon, Y. Optimization of building window system in Asian regions by analyzing solar heat gain and daylighting elements. Renew. Energy 2013, 50, 522–531. [Google Scholar] [CrossRef]
- Khaled, K.; Berardi, U. Current and future coating technologies for architectural glazing applications. Energy Build. 2021, 244, 111022. [Google Scholar] [CrossRef]
- Rezaei, S.D.; Shannigrahi, S.; Ramakrishna, S. A review of conventional, advanced, and smart glazing technologies and materials for improving indoor environment. Sol. Energy Mater. Sol. Cells 2017, 159, 26–51. [Google Scholar] [CrossRef]
- Omar, E.A.; Al-Ragom, F. On the effect of glazing and code compliance. Appl. Energy 2002, 71, 75–86. [Google Scholar] [CrossRef]
- Fathi, S.; Kavoosi, A. Optimal Window to Wall Ratio Ranges of Photovoltachromic Windows in High-Rise Office Buildings of Iran. J. Daylighting 2021, 8, 134–148. [Google Scholar] [CrossRef]
- Xie, X.; Chen, X.-N.; Xu, B.; Pei, G. Investigation of occupied/unoccupied period on thermal comfort in Guangzhou: Challenges and opportunities of public buildings with high window-wall ratio. Energy 2022, 244, 123–186. [Google Scholar] [CrossRef]
- Simko, T.; Moore, T. Optimal window designs for Australian houses. Energy Build. 2021, 250, 111300. [Google Scholar] [CrossRef]
- Wikipedia. Antalya. 2022. Available online: https://en.wikipedia.org/wiki/Antalya (accessed on 6 December 2022).
- Meteorology Directorate. Republic of Turkey Ministry of Environment Urbanization and Climate Change. 2022. Available online: https://www.mgm.gov.tr/veridegerlendirme/il-ve-ilceler-istatistik.aspx?m=ANTALYA (accessed on 6 December 2022).
- Wikipedia. Erzurum. 2022. Available online: https://en.wikipedia.org/wiki/Erzurum (accessed on 6 December 2022).
- Meteorology Directorate. Republic of Turkey Ministry of Environment Urbanization and Climate Change. 2022. Available online: https://www.mgm.gov.tr/veridegerlendirme/il-ve-ilceler-istatistik.aspx?m=ERZURUM (accessed on 6 December 2022).
- Turkish Standards Institute. Principles For the Prefaration of the Projects of the Central Heating Systems; Turkish Standards Institute: Ankara, Türkiye, 1983; TS 2164; Available online: https://intweb.tse.org.tr/Standard/Standard/Standard.aspx?08111805111510805110411911010405504806508207705510307607605608410809008606508711005311406508511907808708610905107409008507110708710007912208311107207510205005707811909712007012207606605305007009705 (accessed on 21 September 2022).
- TGUB. Turkish Autoclaved Aerated Concrete Association. 2022. Available online: http://tgub.org.tr (accessed on 21 September 2022).
- Turkish Standart Institute. Thermal Insulation Requirements for Buildings; Turkish Standart Institute: Ankara, Türkiye, 2013; TS 825; Available online: https://intweb.tse.org.tr/Standard/Standard/Standard.aspx?08111805111510805110411911010405504806508207705510307607605608411808508711706812108111411806710511107809811305306606508610205608108011306611906807707611008607510708508612206607005111706908212208907 (accessed on 18 September 2022).
- Turkish Standards Institute. TS EN 13162+A1 Thermal Insulation Products for Buildings—Factory Made Mineral Wool (MW) Products-Specification; Turkish Standards Institute: Ankara, Turkey, 2018; Available online: https://intweb.tse.org.tr/Standard/Standard/Standard.aspx?08111805111510805110411911010405504806508207705510307607605608411504911104811206511307605607911911807511604906607207312105306511510208510310107609005304707606505205405405711606712108209007604812109 (accessed on 22 September 2022).
- Küçükyalı, R. Heating Instalation; Isısan: Kayseri, Türkiye, 2000; Available online: https://gunesisi.com/assets/images/pdf/Isitma-Tesisati.pdf (accessed on 2 October 2022).
- Global Solar Atlas. 2023. Available online: https://globalsolaratlas.info/map (accessed on 4 January 2023).
- Republic of Turkey Ministry of Environment Urbanization and Climate Change. Construction and Installation Unit Price; Republic of Turkey Ministry of Environment Urbanization and Climate Change: Ankara, Türkiye, 2023. Available online: https://webdosya.csb.gov.tr/db/yfk/icerikler/2023-b-r-m-f-yatlar-23012023-1100-sonn-20230123090721.pdf (accessed on 11 January 2023).
- Palen Natural Gas. Natural Gas Prices. 2023. Available online: https://www.palen.com.tr/evsel-musteri/satis-tarifeleri (accessed on 12 January 2023).
- Enerya Natural Gas. Natural Gas Prices. 2023. Available online: https://portal.enerya.com.tr/DogalGazBirimFiyatlari/index.xhtml?city=07 (accessed on 12 January 2023).
- Republic of Turkey Energy Market Regulatory Authority. Electricity Prices. 2023. Available online: https://lisans.epdk.gov.tr/epvys-web/faces/pages/online/tarifeFatura/tarifeFatura.xhtml (accessed on 12 January 2023).


| Value | Avg. Temp. (°C) | Avg. Highest Temp. (°C) | Avg. Lowest Temp. (°C) | Avg. Insolation Time (h) | Avg. Total Monthly Rainfall (mm) | Highest Temp. (°C) | Lowest Temp. (°C) |
|---|---|---|---|---|---|---|---|
| January | 10 | 14.9 | 6 | 5.1 | 234.6 | 23.9 | −4.3 |
| February | 10.7 | 15.6 | 6.4 | 5.8 | 152.1 | 26.7 | −4.6 |
| March | 12.9 | 18 | 8.1 | 6.7 | 94 | 28.6 | −1.6 |
| April | 16.4 | 21.4 | 11.2 | 8 | 49.4 | 36.4 | 1.4 |
| May | 20.6 | 25.6 | 15.2 | 9.8 | 32.1 | 41.7 | 6.7 |
| June | 25.3 | 30.7 | 19.6 | 11.4 | 11 | 44.8 | 11.1 |
| July | 28.5 | 34.1 | 22.8 | 11.8 | 4.5 | 45 | 14.8 |
| August | 28.4 | 34.1 | 22.8 | 11.3 | 4.5 | 44.8 | 13.6 |
| September | 25.2 | 31.2 | 19.5 | 9.8 | 16.6 | 42.5 | 10.3 |
| October | 20.6 | 26.6 | 15.3 | 7.9 | 67.9 | 38.7 | 4.9 |
| November | 15.5 | 21.3 | 10.8 | 6.3 | 132.1 | 33 | 0 |
| December | 11.6 | 16.7 | 7.6 | 4.9 | 261.2 | 25.4 | −1.9 |
| Annual | 18.8 | 24.2 | 13.8 | 8.2 | 1060 | 45 | −4.6 |
| Value | Avg. Temp. (°C) | Avg. Highest Temp. (°C) | Avg. Lowest Temp. (°C) | Avg. Insolation Time (h) | Avg. Total Monthly Rainfall (mm) | Highest Temp. (°C) | Lowest Temp. (°C) |
|---|---|---|---|---|---|---|---|
| January | −9.1 | −4 | −13.9 | 3.3 | 21.9 | 8 | −36 |
| February | −7.7 | −2.3 | −12.6 | 4.4 | 25.9 | 10.6 | −37 |
| March | −2.4 | 2.6 | −7.1 | 5.2 | 35.4 | 21.4 | −33.2 |
| April | 5 | 11 | 0 | 6.3 | 53.8 | 26.5 | −22.4 |
| May | 10.7 | 16.9 | 4.4 | 8 | 72.4 | 29.6 | −7.1 |
| June | 14.9 | 21.8 | 7.3 | 10.3 | 48.4 | 32.7 | −5.6 |
| July | 19.2 | 26.6 | 11.1 | 11.2 | 27 | 35.6 | −1.8 |
| August | 19.5 | 27.2 | 11.2 | 10.7 | 18.1 | 36.5 | −1.1 |
| September | 14.8 | 22.7 | 6.4 | 9.1 | 24.3 | 33.3 | −6.8 |
| October | 8.2 | 15.2 | 1.7 | 6.9 | 47.4 | 27 | −14.1 |
| November | 1.1 | 6.9 | −3.8 | 4.9 | 33.2 | 20.7 | −34.3 |
| December | −5.8 | −1 | −10.3 | 3.2 | 22.1 | 14 | −37.2 |
| Annual | 5.7 | 12 | −0.5 | 7 | 429.9 | 36.5 | −37.2 |
| Building Types | Living Room (W1) | Kitchen (W2) | Bedroom 1 (W3) | Bedroom 2 (W4) | Bedroom 3 (W5) | Total Number of Windows | Total Window Area (m2) | Increase in Total Window Area (%) | ||||||||
|---|---|---|---|---|---|---|---|---|---|---|---|---|---|---|---|---|
| 280 × 150 | 280 × 220 | 140 × 150 | 140 × 220 | 140 × 150 | 140 × 220 | 140 × 150 | 140 × 220 | 140 × 150 | 140 × 220 | 280 × 150 | 280 × 220 | 140 × 150 | 140 × 220 | |||
| Type 0 | ● | ● | ● | ● | ● | 24 | 96 | 302.4 | - | |||||||
| Type 1 | ● | ● | ● | ● | ● | 24 | 96 | 349.44 | 15.6% | |||||||
| Type 2 | ● | ● | ● | ● | ● | 24 | 72 | 24 | 372.96 | 23.3% | ||||||
| Type 3 | ● | ● | ● | ● | ● | 24 | 48 | 48 | 396.48 | 31.1% | ||||||
| Type 4 | ● | ● | ● | ● | ● | 24 | 24 | 72 | 420.00 | 38.9% | ||||||
| Type 5 | ● | ● | ● | ● | ● | 24 | 96 | 443.52 | 46.7% | |||||||
| Building Type | Feature | U (Wm−2 K−1) |
|---|---|---|
| Type A | Air-filled, PVC-framed, double-glazed a, and clear glass | 2.60 |
| Type B | Air-filled, PVC-framed, double-glazed a, and low-emissivity-coated glass | 1.70 |
| Type C | Argon-filled, PVC-framed, double-glazed a, and clear glass | 2.55 |
| Type D | Argon-filled, PVC-framed, double-glazed a, and low-emissivity-coated glass | 1.50 |
| Construction Component | U (Wm−2 K−1) | Construction Component | U (Wm−2 K−1) | ||
|---|---|---|---|---|---|
| Erzurum | Antalya | Erzurum | Antalya | ||
| External wall 1 | 0.401 | 0.535 | Window 1 | 2.6 | 2.6 |
| External wall 2 | 0.3598 | 0.4311 | Window 2 | 1.7 | 1.7 |
| Column and beam | 0.491 | 0.682 | Window 3 | 2.55 | 2.55 |
| Internal wall | 1.288 | 1.288 | Window 4 | 1.5 | 1.5 |
| Internal door | 2 | 2 | Floor-1 | 0.275 | 0.359 |
| Balcony door | 3.5 | 3.5 | Floor-2 | 0.618 | 0.75 |
| External door | 4 | 4 | Ceiling | 0.387 | 0.579 |
| Floor | Apartment Number | Type A | |||||
|---|---|---|---|---|---|---|---|
| Type 0 | Type 1 | Type 2 | Type 3 | Type 4 | Type 5 | ||
| 1 | 1 | 6169.4 | 6349.6 | 6435.3 | 6525.5 | 6620.0 | 6714.5 |
| 2 | 6418.1 | 6616.1 | 6710.2 | 6809.2 | 6903.7 | 6998.2 | |
| 3 | 6418.1 | 6616.1 | 6710.2 | 6809.2 | 6903.7 | 6998.2 | |
| 4 | 6169.4 | 6349.6 | 6435.3 | 6525.5 | 6620.0 | 6714.5 | |
| 2 | 5 | 5300.3 | 5480.5 | 5566.3 | 5656.4 | 5750.9 | 5845.5 |
| 6 | 5473.2 | 5671.2 | 5765.3 | 5864.3 | 5958.8 | 6053.3 | |
| 7 | 5549.1 | 5747.0 | 5841.1 | 5940.1 | 6034.6 | 6129.2 | |
| 8 | 5300.3 | 5480.5 | 5566.3 | 5656.4 | 5750.9 | 5845.5 | |
| 3,4 | 9,13 | 5477.7 | 5666.7 | 5756.7 | 5851.2 | 5950.2 | 6049.1 |
| 10,14 | 5473.2 | 5671.2 | 5765.3 | 5864.3 | 5958.8 | 6053.3 | |
| 11,15 | 5549.1 | 5747.0 | 5841.1 | 5940.1 | 6034.6 | 6129.2 | |
| 12,16 | 5300.3 | 5480.5 | 5566.3 | 5656.4 | 5750.9 | 5845.5 | |
| 5 | 17 | 5300.3 | 5480.5 | 5566.3 | 5656.4 | 5750.9 | 5845.5 |
| 18 | 5473.2 | 5671.2 | 5765.3 | 5864.3 | 5958.8 | 6053.3 | |
| 19 | 5549.1 | 5747.0 | 5841.1 | 5940.1 | 6034.6 | 6129.2 | |
| 20 | 5300.3 | 5480.5 | 5566.3 | 5656.4 | 5750.9 | 5845.5 | |
| 6 | 21 | 7168.5 | 7348.7 | 7434.5 | 7524.6 | 7619.1 | 7713.7 |
| 22 | 7417.3 | 7615.2 | 7709.3 | 7808.3 | 7902.8 | 7997.4 | |
| 23 | 7417.3 | 7615.2 | 7709.3 | 7808.3 | 7902.8 | 7997.4 | |
| 24 | 7168.5 | 7348.7 | 7434.5 | 7524.6 | 7619.1 | 7713.7 | |
| Total | 141,193.0 | 145,748.6 | 147,915.3 | 150,193.1 | 152,470.9 | 154,748.7 | |
| Building Type | Window Type | |||||||
|---|---|---|---|---|---|---|---|---|
| Type A | Type B | Type C | Type D | |||||
| Type 0 | 141,193.0 | - | 129,304.2 | - | 140,532.5 | - | 126,662.3 | - |
| Type 1 | 145,748.6 | 3.2% | 131,995.4 | 2.1% | 144,984.5 | 3.2% | 128,939.1 | 1.8% |
| Type 2 | 147,915.3 | 4.8% | 133,275.3 | 3.1% | 147,101.9 | 4.7% | 130,021.9 | 2.7% |
| Type 3 | 150,193.1 | 6.4% | 134,620.8 | 4.1% | 149,328.0 | 6.3% | 131,160.3 | 3.6% |
| Type 4 | 152,470.9 | 8.0% | 135,966.4 | 5.2% | 151,554.0 | 7.8% | 132,298.7 | 4.4% |
| Type 5 | 154,748.7 | 9.6% | 137,312.0 | 6.2% | 153,780.0 | 9.4% | 133,437.1 | 5.3% |
| Building Type | Window Type | |||||||
|---|---|---|---|---|---|---|---|---|
| Type A | Type B | Type C | Type D | |||||
| Type 0 | 75,816.1 | - | 70,943.7 | - | 75,545.4 | - | 69,860.9 | - |
| Type 1 | 77,589.9 | 2.3% | 71,944.4 | 1.4% | 77,276.3 | 2.3% | 70,689.9 | 1.2% |
| Type 2 | 78,372.5 | 3.4% | 72,385.9 | 2.0% | 78,039.9 | 3.3% | 71,055.6 | 1.7% |
| Type 3 | 79,259.4 | 4.5% | 72,886.3 | 2.7% | 78,905.3 | 4.4% | 71,470.0 | 2.3% |
| Type 4 | 80,146.3 | 5.7% | 73,386.6 | 3.4% | 79,770.8 | 5.6% | 71,884.5 | 2.9% |
| Type 5 | 81,033.2 | 6.9% | 73,887.0 | 4.1% | 80,636.2 | 6.7% | 72,298.9 | 3.5% |
| Building Type | Window Type | |||||||
|---|---|---|---|---|---|---|---|---|
| Type A | Type B | Type C | Type D | |||||
| Type 0 | 13,732.44 | - | 12,620.02 | - | 13,670.64 | - | 12,372.81 | - |
| Type 1 | 13,943.89 | 1.5% | 12,725.62 | 0.8% | 13,876.20 | 1.5% | 12,454.90 | 0.7% |
| Type 2 | 14,049.61 | 2.3% | 12,778.43 | 1.3% | 13,978.99 | 2.3% | 12,495.94 | 1.0% |
| Type 3 | 14,155.33 | 3.1% | 12,831.23 | 1.7% | 14,081.77 | 3.0% | 12,536.98 | 1.3% |
| Type 4 | 14,383.69 | 4.7% | 12,945.28 | 2.6% | 14,303.78 | 4.6% | 12,625.64 | 2.0% |
| Type 5 | 14,612.05 | 6.4% | 13,059.34 | 3.5% | 14,525.79 | 6.3% | 12,714.29 | 2.8% |
| Building Type | Window Type | |||||||
|---|---|---|---|---|---|---|---|---|
| Type A | Type B | Type C | Type D | |||||
| Type 0 | 18,298.10 | - | 17,185.68 | - | 18,236.30 | - | 16,938.48 | - |
| Type 1 | 18,478.03 | 1.0% | 17,259.77 | 0.4% | 18,410.35 | 1.0% | 16,989.05 | 0.3% |
| Type 2 | 18,568.00 | 1.5% | 17,296.82 | 0.6% | 18,497.38 | 1.4% | 17,014.33 | 0.4% |
| Type 3 | 18,657.96 | 2.0% | 17,333.86 | 0.9% | 18,584.40 | 1.9% | 17,039.61 | 0.6% |
| Type 4 | 18,852.28 | 3.0% | 17,413.87 | 1.3% | 18,772.37 | 2.9% | 17,094.23 | 0.9% |
| Type 5 | 19,046.61 | 4.1% | 17,493.89 | 1.8% | 18,960.34 | 4.0% | 17,148.84 | 1.2% |
| Par. N. | Parameter Description | Properties | Price (USD) |
|---|---|---|---|
| P1 | The difference in the cost of windows between tall windows and standard windows. | Type A | 68.47 |
| Type B (Erzurum) | 73.52 | ||
| Type B (Antalya) | 95.21 | ||
| Type C | 68.84 | ||
| Type D (Erzurum) | 79.22 | ||
| Type D (Antalya) | 95.58 | ||
| P2 | Cost of external wall area to be saved when tall windows are used. | External wall 1 (Erzurum) | 60.44 |
| External wall 1 (Antalya) | 56.92 | ||
| P3 | The difference in initial investment costs of equipment in the heating system due to change in window height. (Note: The changes in the heating system components are limited to changes in the radiator size as the amount of heat loss increase was not very large. was taken to be 1350 kcal h−1.) | Radiator (1 m) | 80.25 |
| P4 | The difference in initial investment costs of equipment in the cooling system due to change in window height. (Note: Addition split-type air conditioners were preferred for change in the cooling system components.) | Capacity 2–2.5 KW | 76.63 |
| P5 | The difference in the cost of the amount of natural gas used in the heating system. | 1 m3 natural gas (Erzurum) a | 0.313985221 |
| 1 m3 natural gas (Antalya) b | 0.307528729 | ||
| P6 | The difference in the cost of electricity consumed by the air conditioner used in the cooling system. | 1 kWh electricity c | 0.09241 |
| Window Types | Type 0 | Type 5 | ||||
|---|---|---|---|---|---|---|
| P2 | P1 | P3 | P4 | P5 | P6 | |
| Type A (Erzurum) | 8528.81 | 9662.72 | 735.46 | 193.06 | 1603.34 | 325.13 |
| Type A (Antalya) | 8032.75 | 9662.72 | 184.87 | 609.40 | 372.53 | 284.39 |
| Type B (Erzurum) | 8528.81 | 10,375.61 | 436.93 | 105.49 | 947.54 | 165.35 |
| Type B (Antalya) | 8032.75 | 13,435.35 | 310.12 | 270.50 | 376.07 | 148.11 |
| Type C (Erzurum) | 8528.81 | 9715.35 | 717.14 | 192.18 | 1566.62 | 317.56 |
| Type C (Antalya) | 8032.75 | 9715.35 | 184.87 | 608.53 | 372.53 | 276.82 |
| Type D (Erzurum) | 8528.81 | 11,180.07 | 363.64 | 102.01 | 800.65 | 135.07 |
| Type D (Antalya) | 8032.75 | 13,487.98 | 240.54 | 267.01 | 376.07 | 117.82 |
Disclaimer/Publisher’s Note: The statements, opinions and data contained in all publications are solely those of the individual author(s) and contributor(s) and not of MDPI and/or the editor(s). MDPI and/or the editor(s) disclaim responsibility for any injury to people or property resulting from any ideas, methods, instructions or products referred to in the content. |
© 2023 by the author. Licensee MDPI, Basel, Switzerland. This article is an open access article distributed under the terms and conditions of the Creative Commons Attribution (CC BY) license (https://creativecommons.org/licenses/by/4.0/).
Share and Cite
Efe, S. The Effect of Using Tall Windows in Buildings on the Thermal Load of the Building and Its Cost Analysis: A Comparative Case Study for Antalya and Erzurum. Buildings 2023, 13, 731. https://doi.org/10.3390/buildings13030731
Efe S. The Effect of Using Tall Windows in Buildings on the Thermal Load of the Building and Its Cost Analysis: A Comparative Case Study for Antalya and Erzurum. Buildings. 2023; 13(3):731. https://doi.org/10.3390/buildings13030731
Chicago/Turabian StyleEfe, Sukran. 2023. "The Effect of Using Tall Windows in Buildings on the Thermal Load of the Building and Its Cost Analysis: A Comparative Case Study for Antalya and Erzurum" Buildings 13, no. 3: 731. https://doi.org/10.3390/buildings13030731