Article

Investigation on the Seismic Performance of RC Frame Buildings with Rubber Isolation Bearing Installed in Staircases

1
School of Civil Engineering, Chang’an University, Xi’an 710061, China
2
School of Civil Engineering, Xi’an University of Architecture and Technology, Xi’an 710055, China
3
China Northwest Architecture Design and Research Institute Co., Ltd., Xi’an 710018, China
*
Author to whom correspondence should be addressed.
Buildings 2023, 13(3), 616; https://doi.org/10.3390/buildings13030616
Submission received: 19 January 2023 / Revised: 14 February 2023 / Accepted: 24 February 2023 / Published: 26 February 2023
(This article belongs to the Special Issue Improvement Technology on Building Seismic Toughness)

Abstract

:
A rubber isolation bearing installed in a staircase (RBS) was proposed to mitigate seismic damages to the component of staircases and improve their seismic performance. A series of quasi-static tests performed with respect to the horizontal and vertical mechanical properties of RBS as well as the numerical modelling were verified with experimental results. Next, the finite element models of typical types of reinforced concrete frames (without stairs, with cast-in-place reinforced concrete stairs, and with RBS stairs) were established. The modal dynamic and non-linear elasto-plastic analyses of system-level building models were herein conducted, respectively. The effect of the RBS on the dynamic response of the whole structure and the mechanical performance of stair components was revealed. The analysis results indicated that the RBS provided the desired floor-to-floor relative drift and effectively isolate the seismic action from the stair flight. Therefore, the presence of RBS can effectively mitigate the influence of a staircase on the entire building’s structure, weaken the diagonal strut effect of flights, and reduce the inner forces of staircase components.

1. Introduction

Stairways, the primary vertical emergency exit routes in most buildings, are critically significant for building accessibility and survivability in emergency events. They should remain operable following even a severe earthquake and the ensuing post-earthquake disaster in order to support the occupant evacuation and recovery response [1]. However, the seismic behavior of stairways is complicated, and staircases have performed poorly in prior earthquakes [2,3,4,5]. In some cases, stairways were damaged more severely than the main structures, such as in the observations made following the 2003 Algeria earthquake, where the presence of short columns near the staircase was one of the main causes of severe stair damage [6]. In the 2008 Wenchuan earthquake [
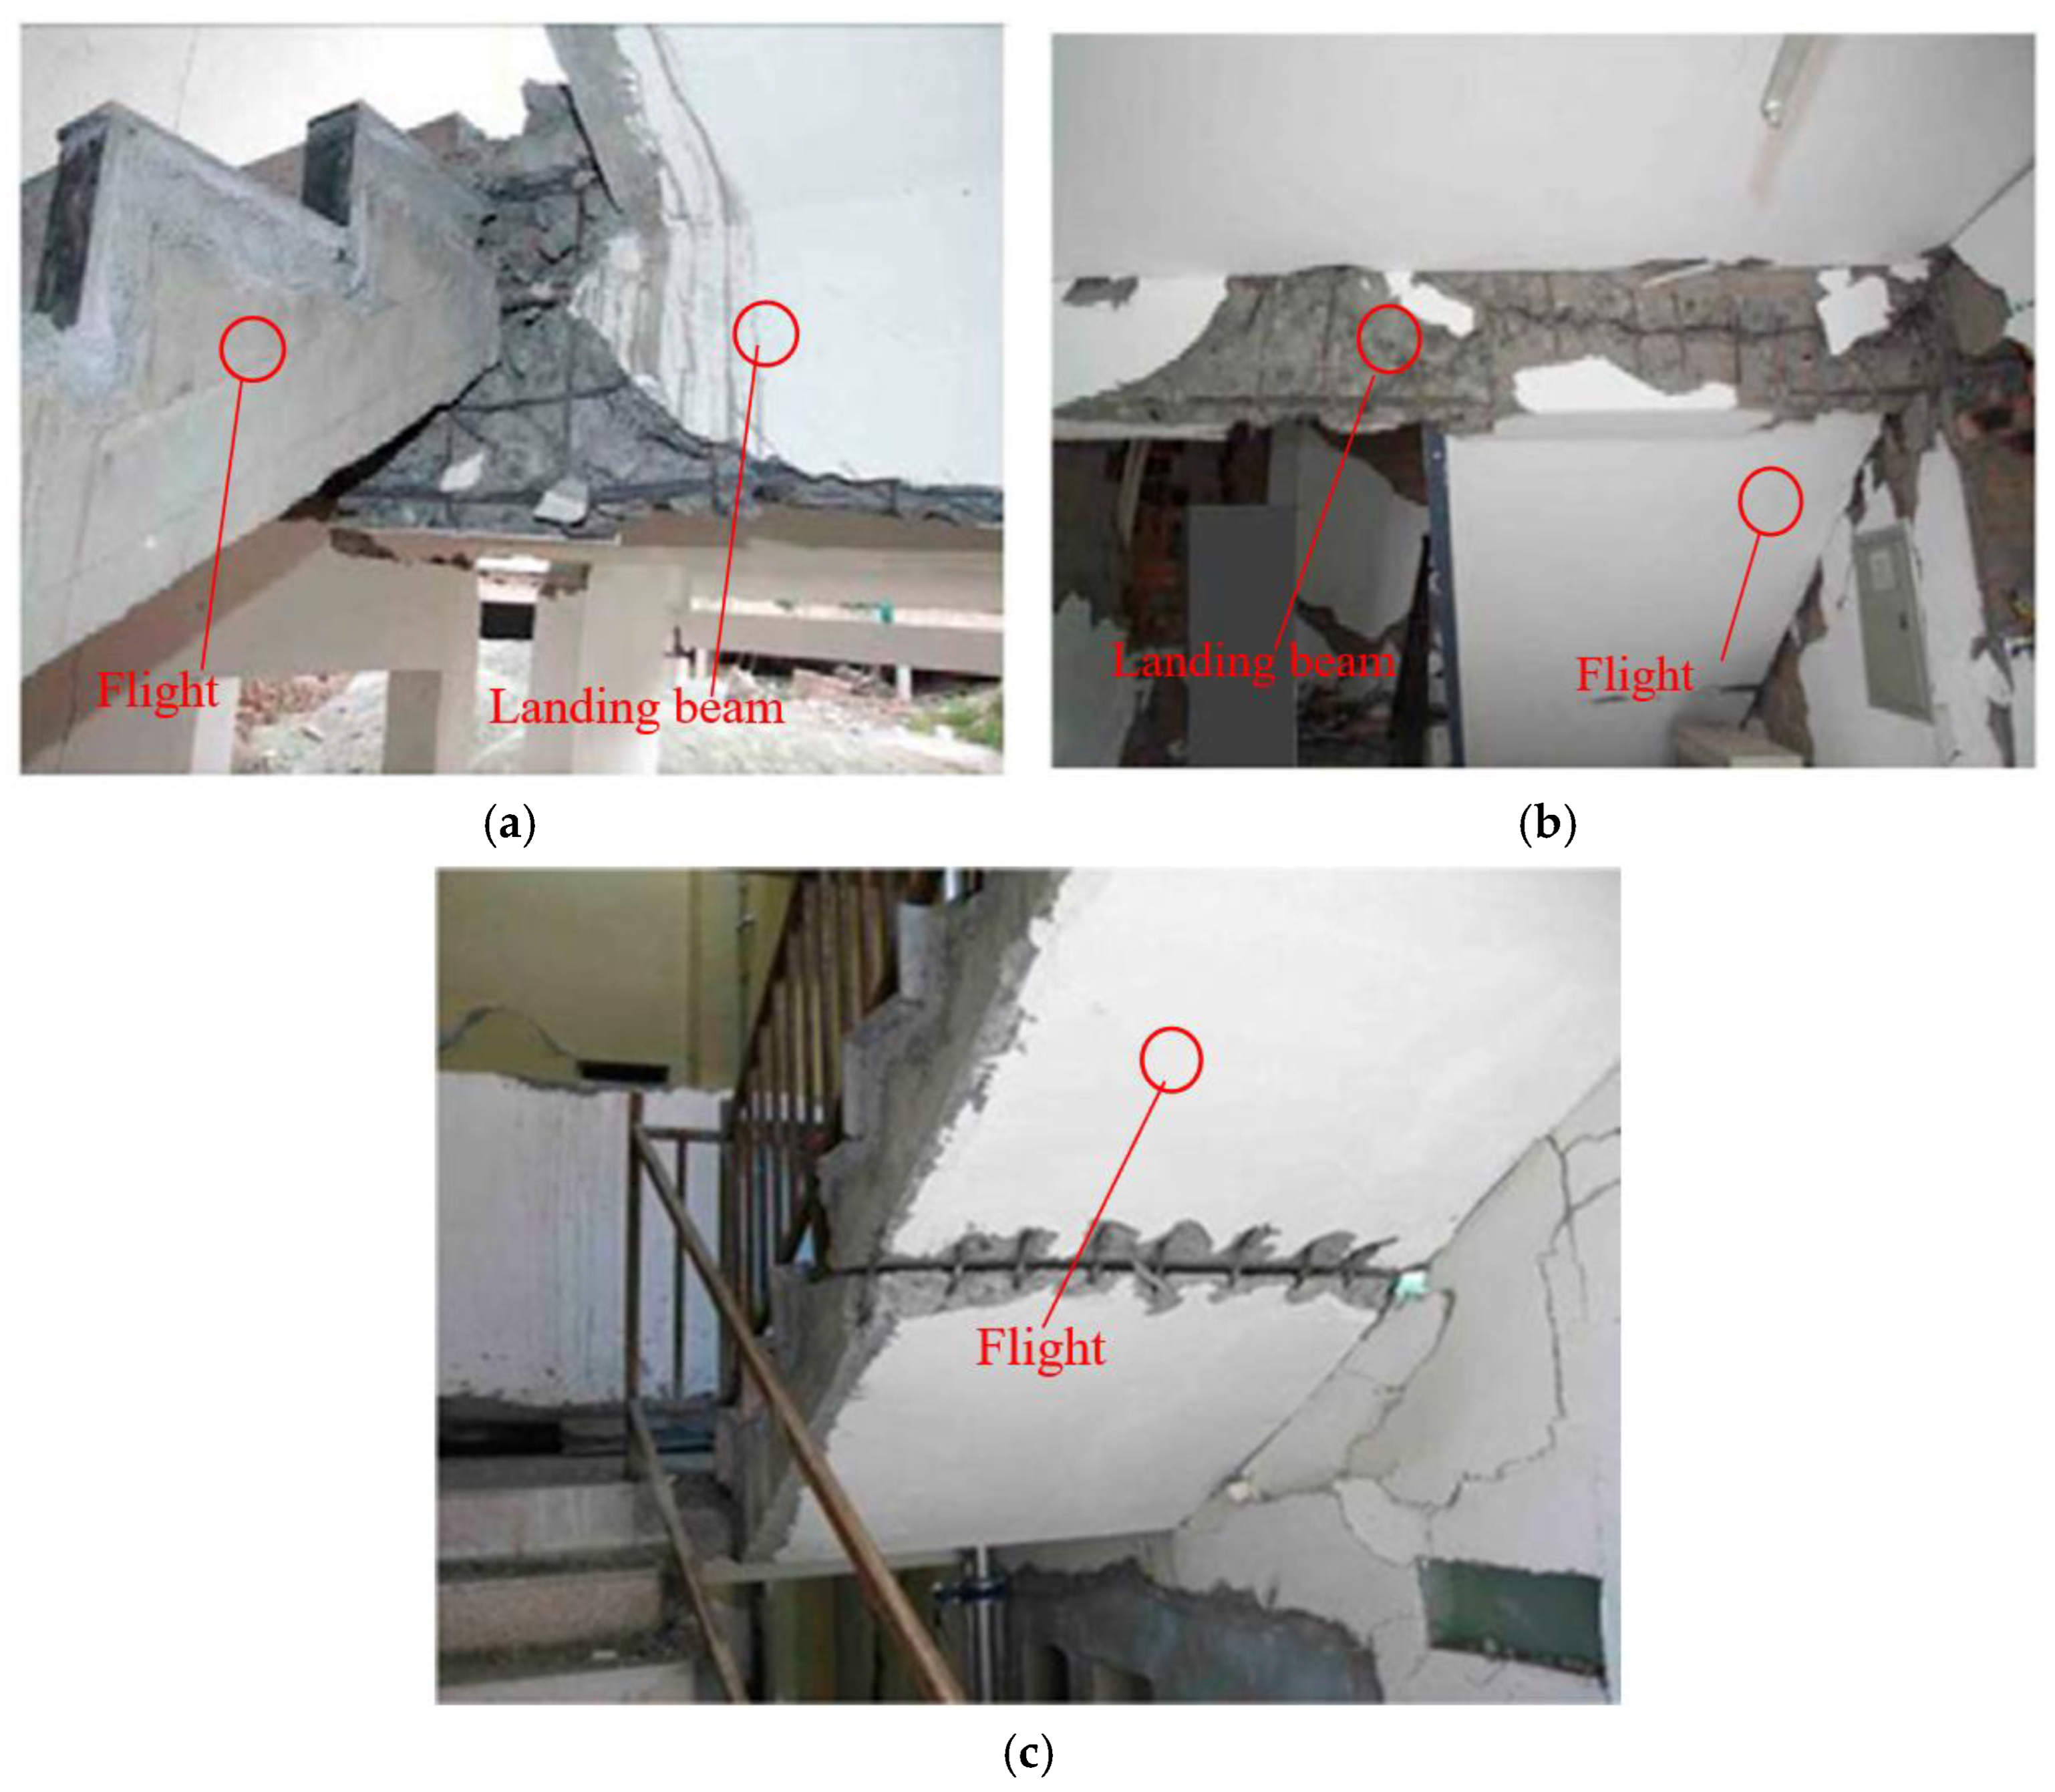
2], the damages to buildings, especially stairwells with reinforced concrete frames, were severe. The majority of deaths and injuries were caused by collapsed stairways. In the 2011 Christchurch earthquake [3,
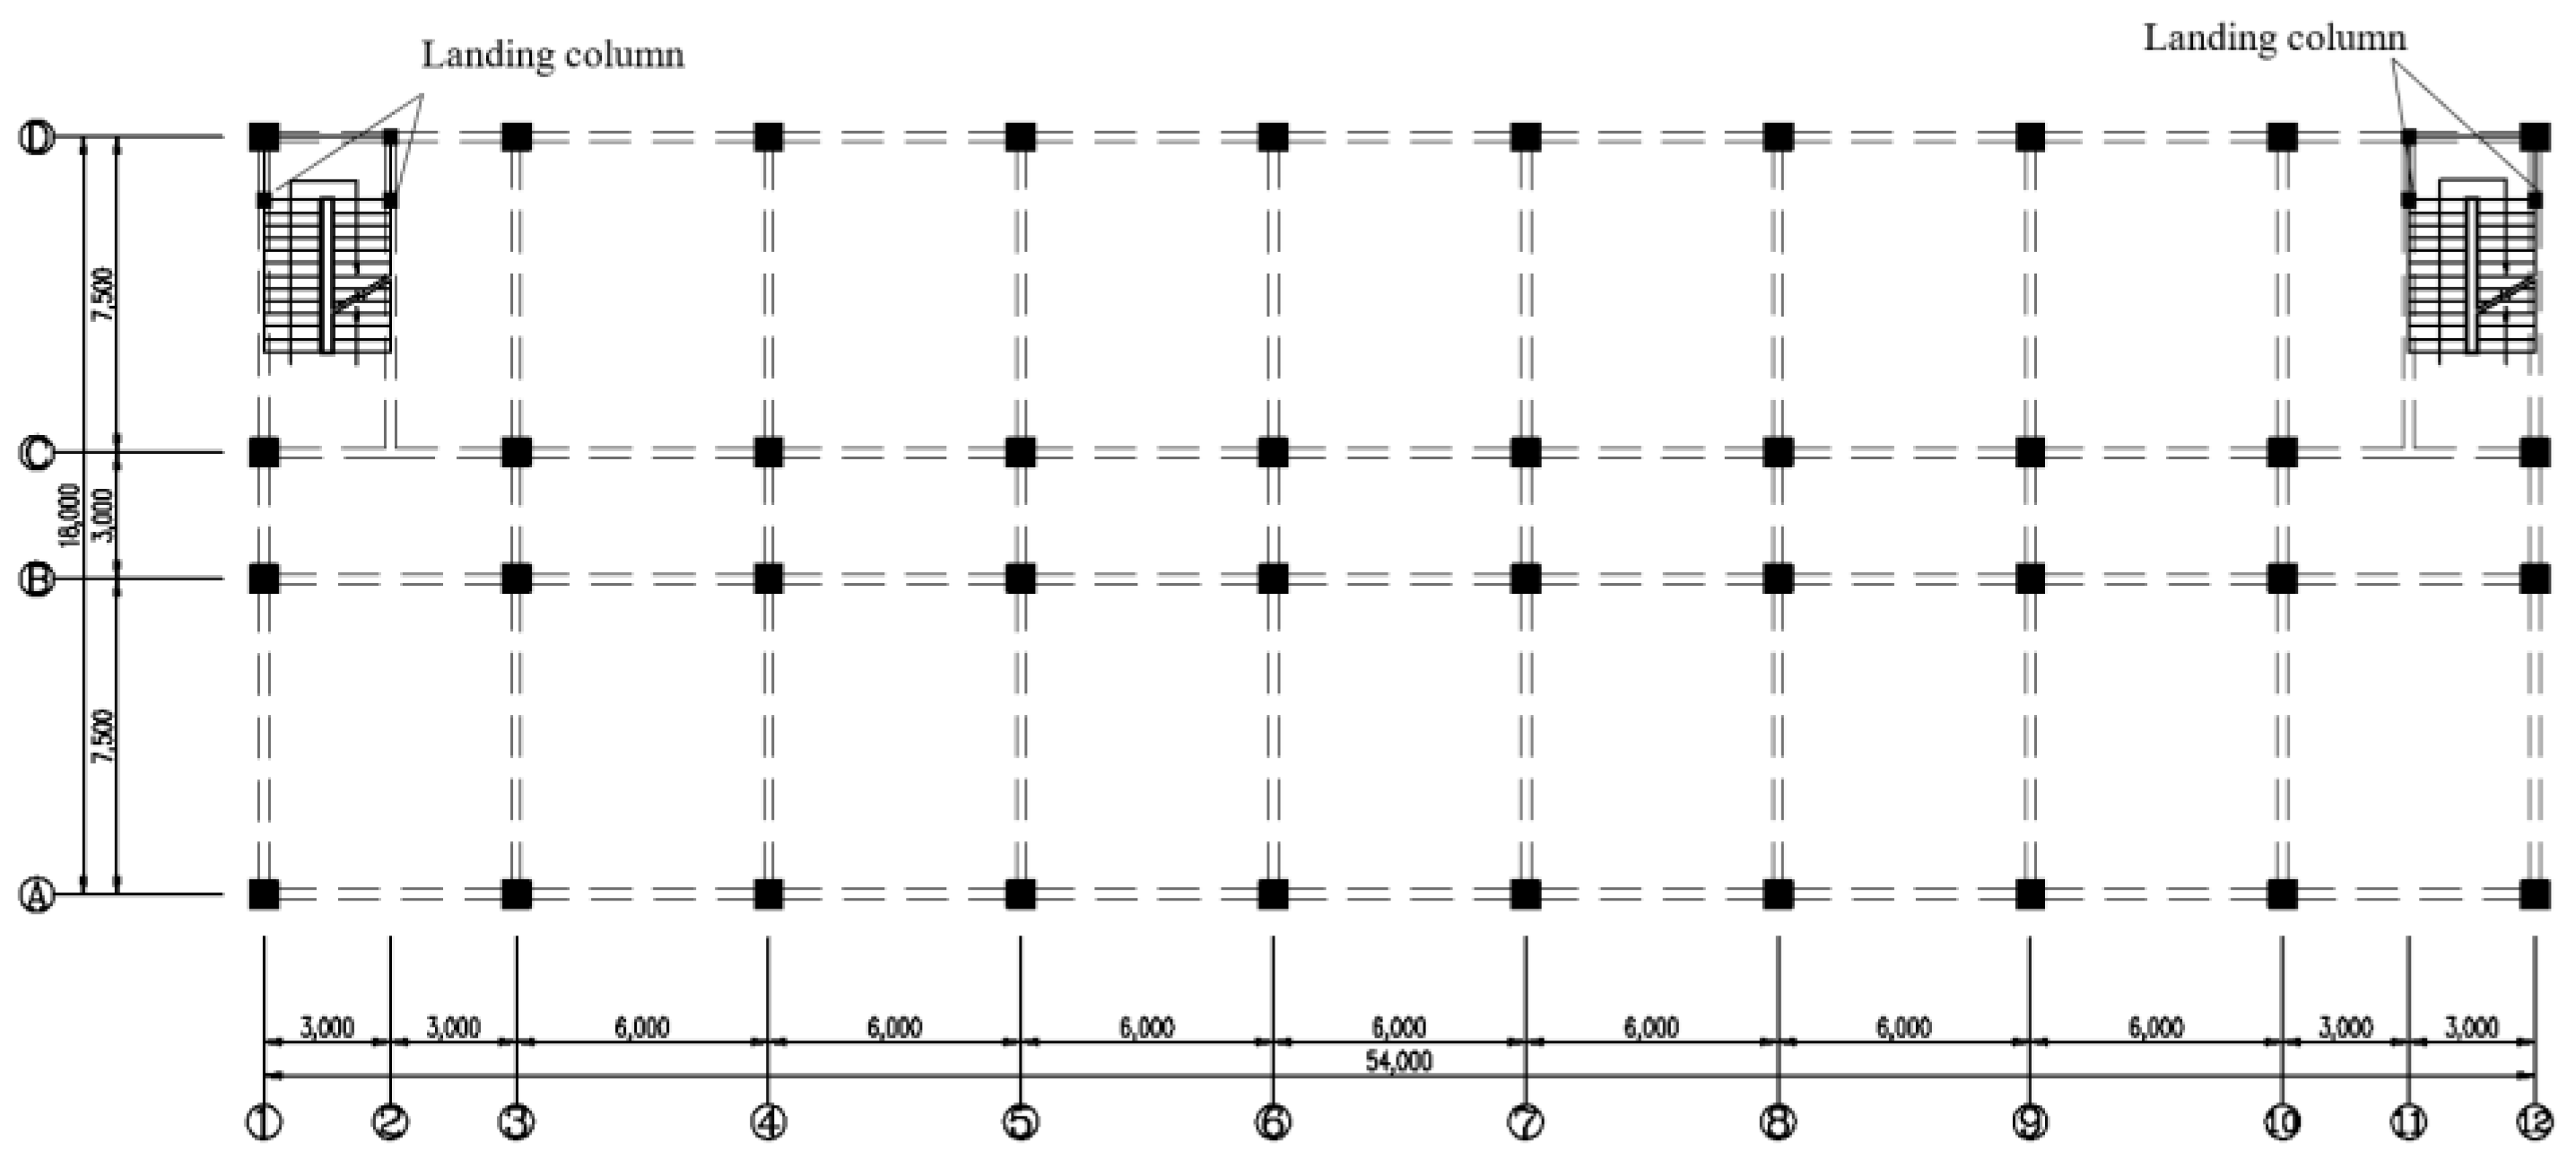
4], many stairways exhibited significant damage in buildings where inter-story movements of the stairs were restrained. Seismically damaged stairways, in short, caused disruptions to the building functionality, delayed rescue operations, and threatened safety, as shown in Figure 1 and Figure 2.
Despite such proof of the vulnerability of stairs as well as the implications related to stair damage, studies on the seismic behavior of stair systems have been only occasionally conducted. In the work of Li et al. [2], the seismic behavior of reinforced-concrete stairs during the 2008 Wenchuan earthquake was studied. This research indicated that various types of seismic damage to the stair components or the major structures occurred because of the interaction between the primary structural systems and stairways. Cosenza et al. [7] investigated the seismic behavior of stairs in existing RC buildings and suggested that the stairs increase the stiffness and strength of the structure, which results in a reduction in the natural vibration period and the attraction of seismic forces. In addition, Tegos et al. [8] attempted to quantify the influence of a stair system on the structure response with the numerical simulation method. Thus far, limited experimental data are available to validate the findings of these and other numerical studies. For complementing these studies, tests on the seismic performance of stair systems are required. Simmons and Bull [9] conducted quasi-static cyclic tests of three full-height reinforced concrete straight-run stair flights conforming to the New Zealand design code. Higgins [10] performed tests of two full-sized prefabricated steel scissor stairs constructed in accordance with the US design standards, to assess the seismic inter-story drift response combined with the factored gravity loads. These experimental studies promoted the understanding regarding the seismic performance of stair systems. However, they were both conducted in an isolated configuration, using cyclic loading to replicate earthquake floor drifts.
In the design practice, stairways are typically attached to their major structure and span as a floor-to-floor system. Nevertheless, the seismic design forces for stairways can be easily determined from code provisions [11], detailing why it is difficult to keep these floor-to-floor systems damage-free with relative deformation between their lower and upper floors. The current condition of practice often imposes specific provisions to one end of the stairways (e.g., slotted or ductile connections and seismic gaps) to provide the desired floor-to-floor relative drift. However, more commonly, the designers simply fix both the bottom and top of the stair system to the lower and upper floors of the supporting structure. This practice has demonstrated catastrophic results, as the stairways lack protection from the large floor-to-floor relative displacements [11,12].
Feng et al. [13] and Zhao et al. [14] proposed a design to separate the staircase from the overall structure and suggested cutting off the transfer path of horizontal load in the staircase. In addition, Jiang et al. [15] put forward detailed requirements to separate the staircase from the overall structure, and the sliding support installed in the staircase was also proposed. Subsequently, shaking table tests of a reinforced concrete stair with sliding bearing were conducted by Zhao et al. [16]. The test results showed that the presence of sliding bearing can improve the seismic performance of staircases, however, several vertical detachment and horizontal sways occurred between the lower end of the flight and the sliding bearing, and there existed a risk of falling off the flight during a strong earthquake.
Seismic isolation is the separation of the superstructure from its base to negotiate the destructive movement of the ground [17,18]. By comparison with the conventional seismic design approach, which is based on an increased strengthening of the structures, the seismic isolation concept is aimed at a significant reduction in dynamic response induced by the earthquake. To date, extensive isolation devices, including rubber bearings (RB), lead plug rubber bearings (LRB), frictional-sliding bearings, and roller bearings, have been developed [19,20,21,22,23]. Though those isolation bearings have been applied to the area of base isolation, the application of the seismic isolation devices into the staircases is still rare. Compared to LRB and rolling bearings, the RB has the advantages of simpler construction and lower cost. Additionally, as shown in the following Figure 3a, the isolation bearings are set between the flight and the landing beam, and the space for installation is limited. The application of RB could solve this problem and is more convenient to install in staircases. To mitigate seismic damages to the component of staircases and improve their seismic performance, this work introduces a rubber isolation bearing installed in a staircase (RBS), as shown in Figure 3a, which is composed of a rubber layer, connecting steel plate, cover steel plate, and anchor bolts. The rubber layer was vulcanized to the cover steel plate. The connecting steel plate and cover steel plate were connected by sunken bolts. Figure 3b,c depict the specific layout and detailed view of the RBS, respectively. As seen in Figure 3b, the RBS is set between the flight and the landing beam, and the flight and landing beam are connected by anchor bolts with the RBS. When under a horizontal seismic action, the RBS will generate relative deformation, which could accommodate the desired floor-to-floor relative drift, effectively weaken the diagonal strut effect of the flight, and mitigate the effect of the staircase on the whole structure, consequently protecting the staircase from damage.
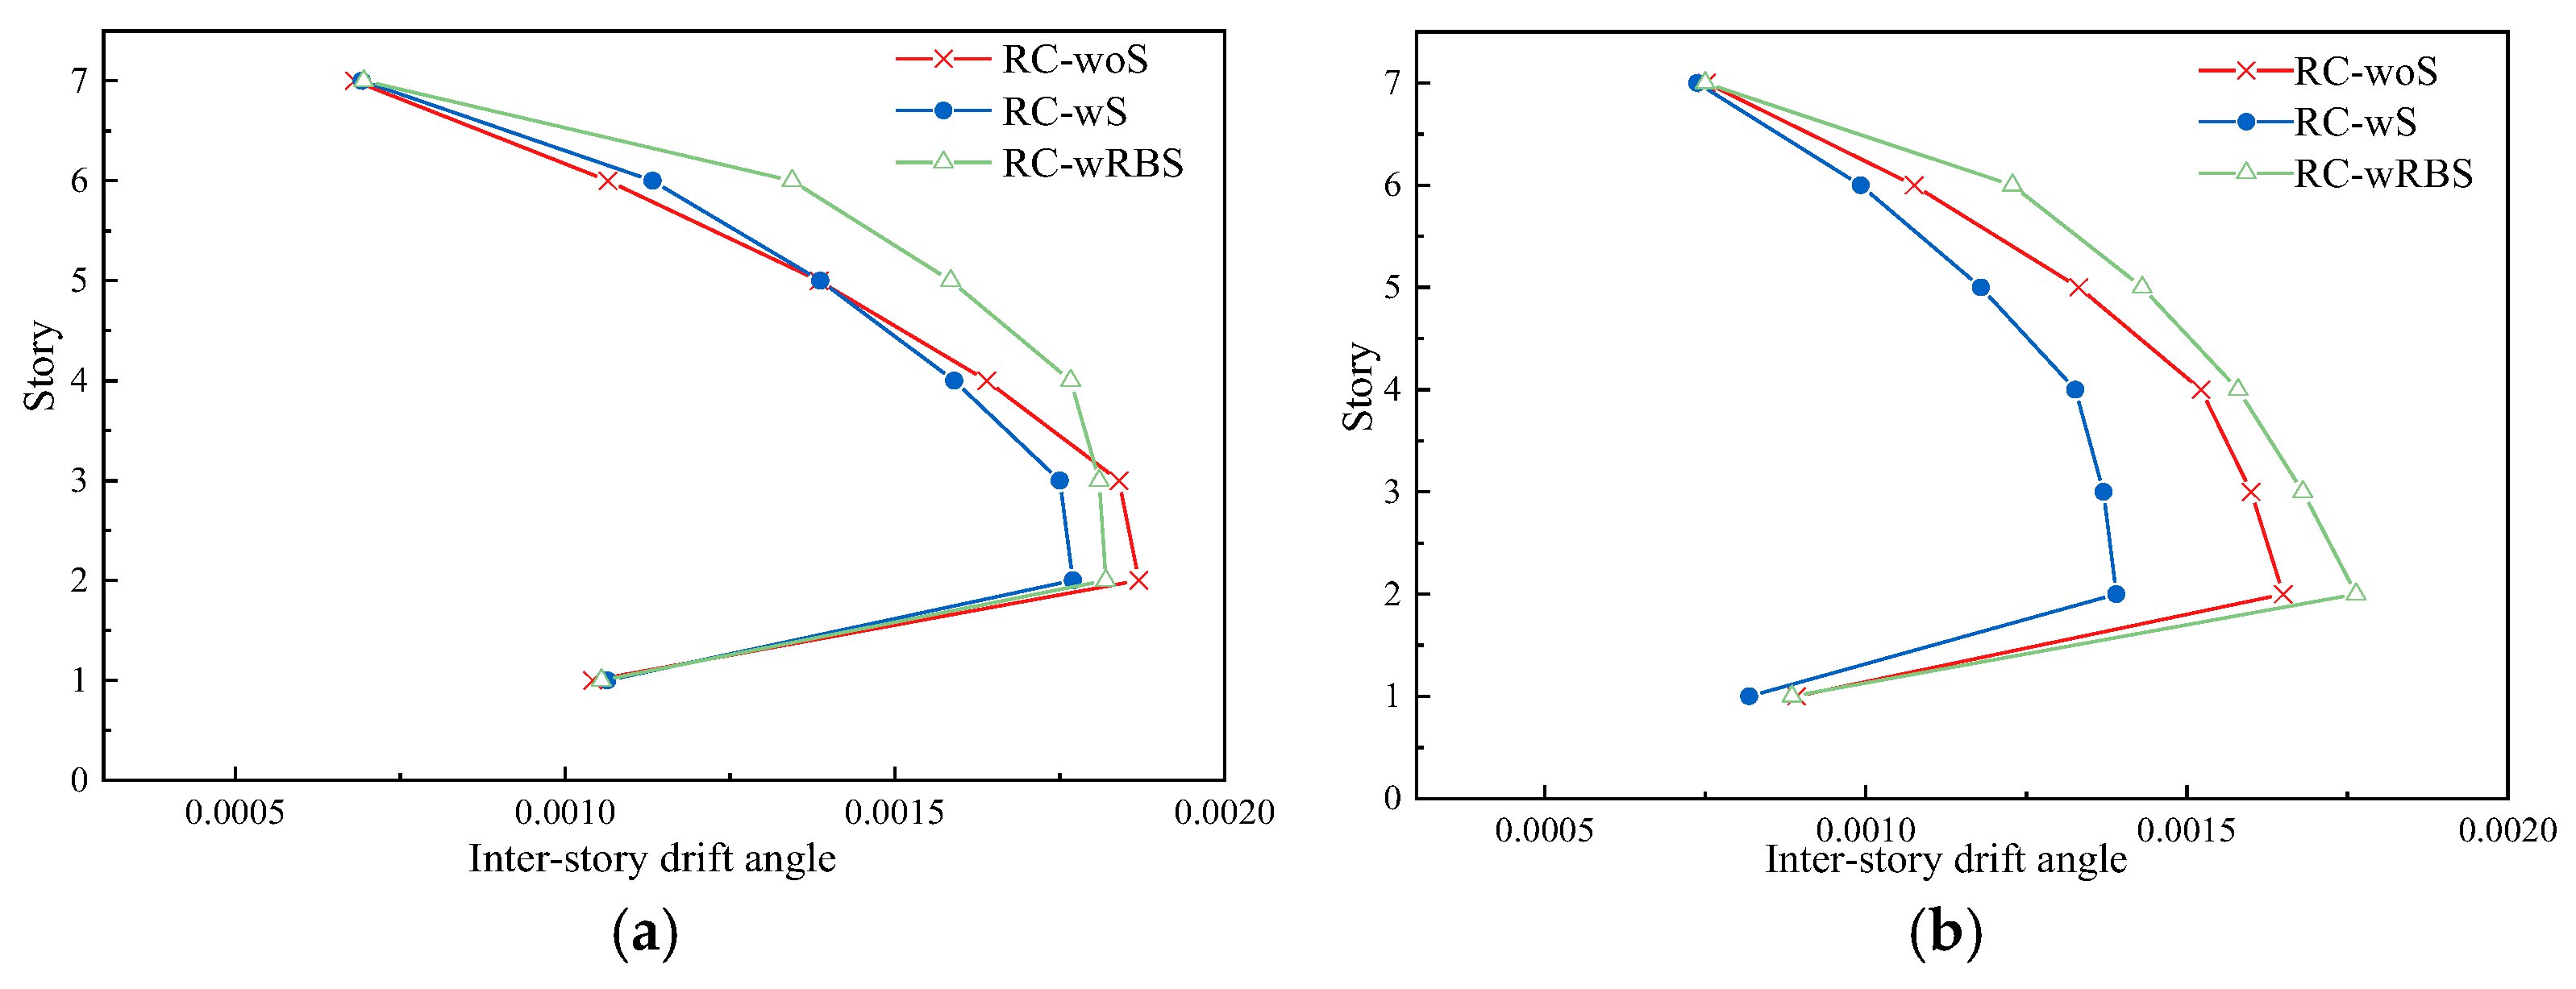
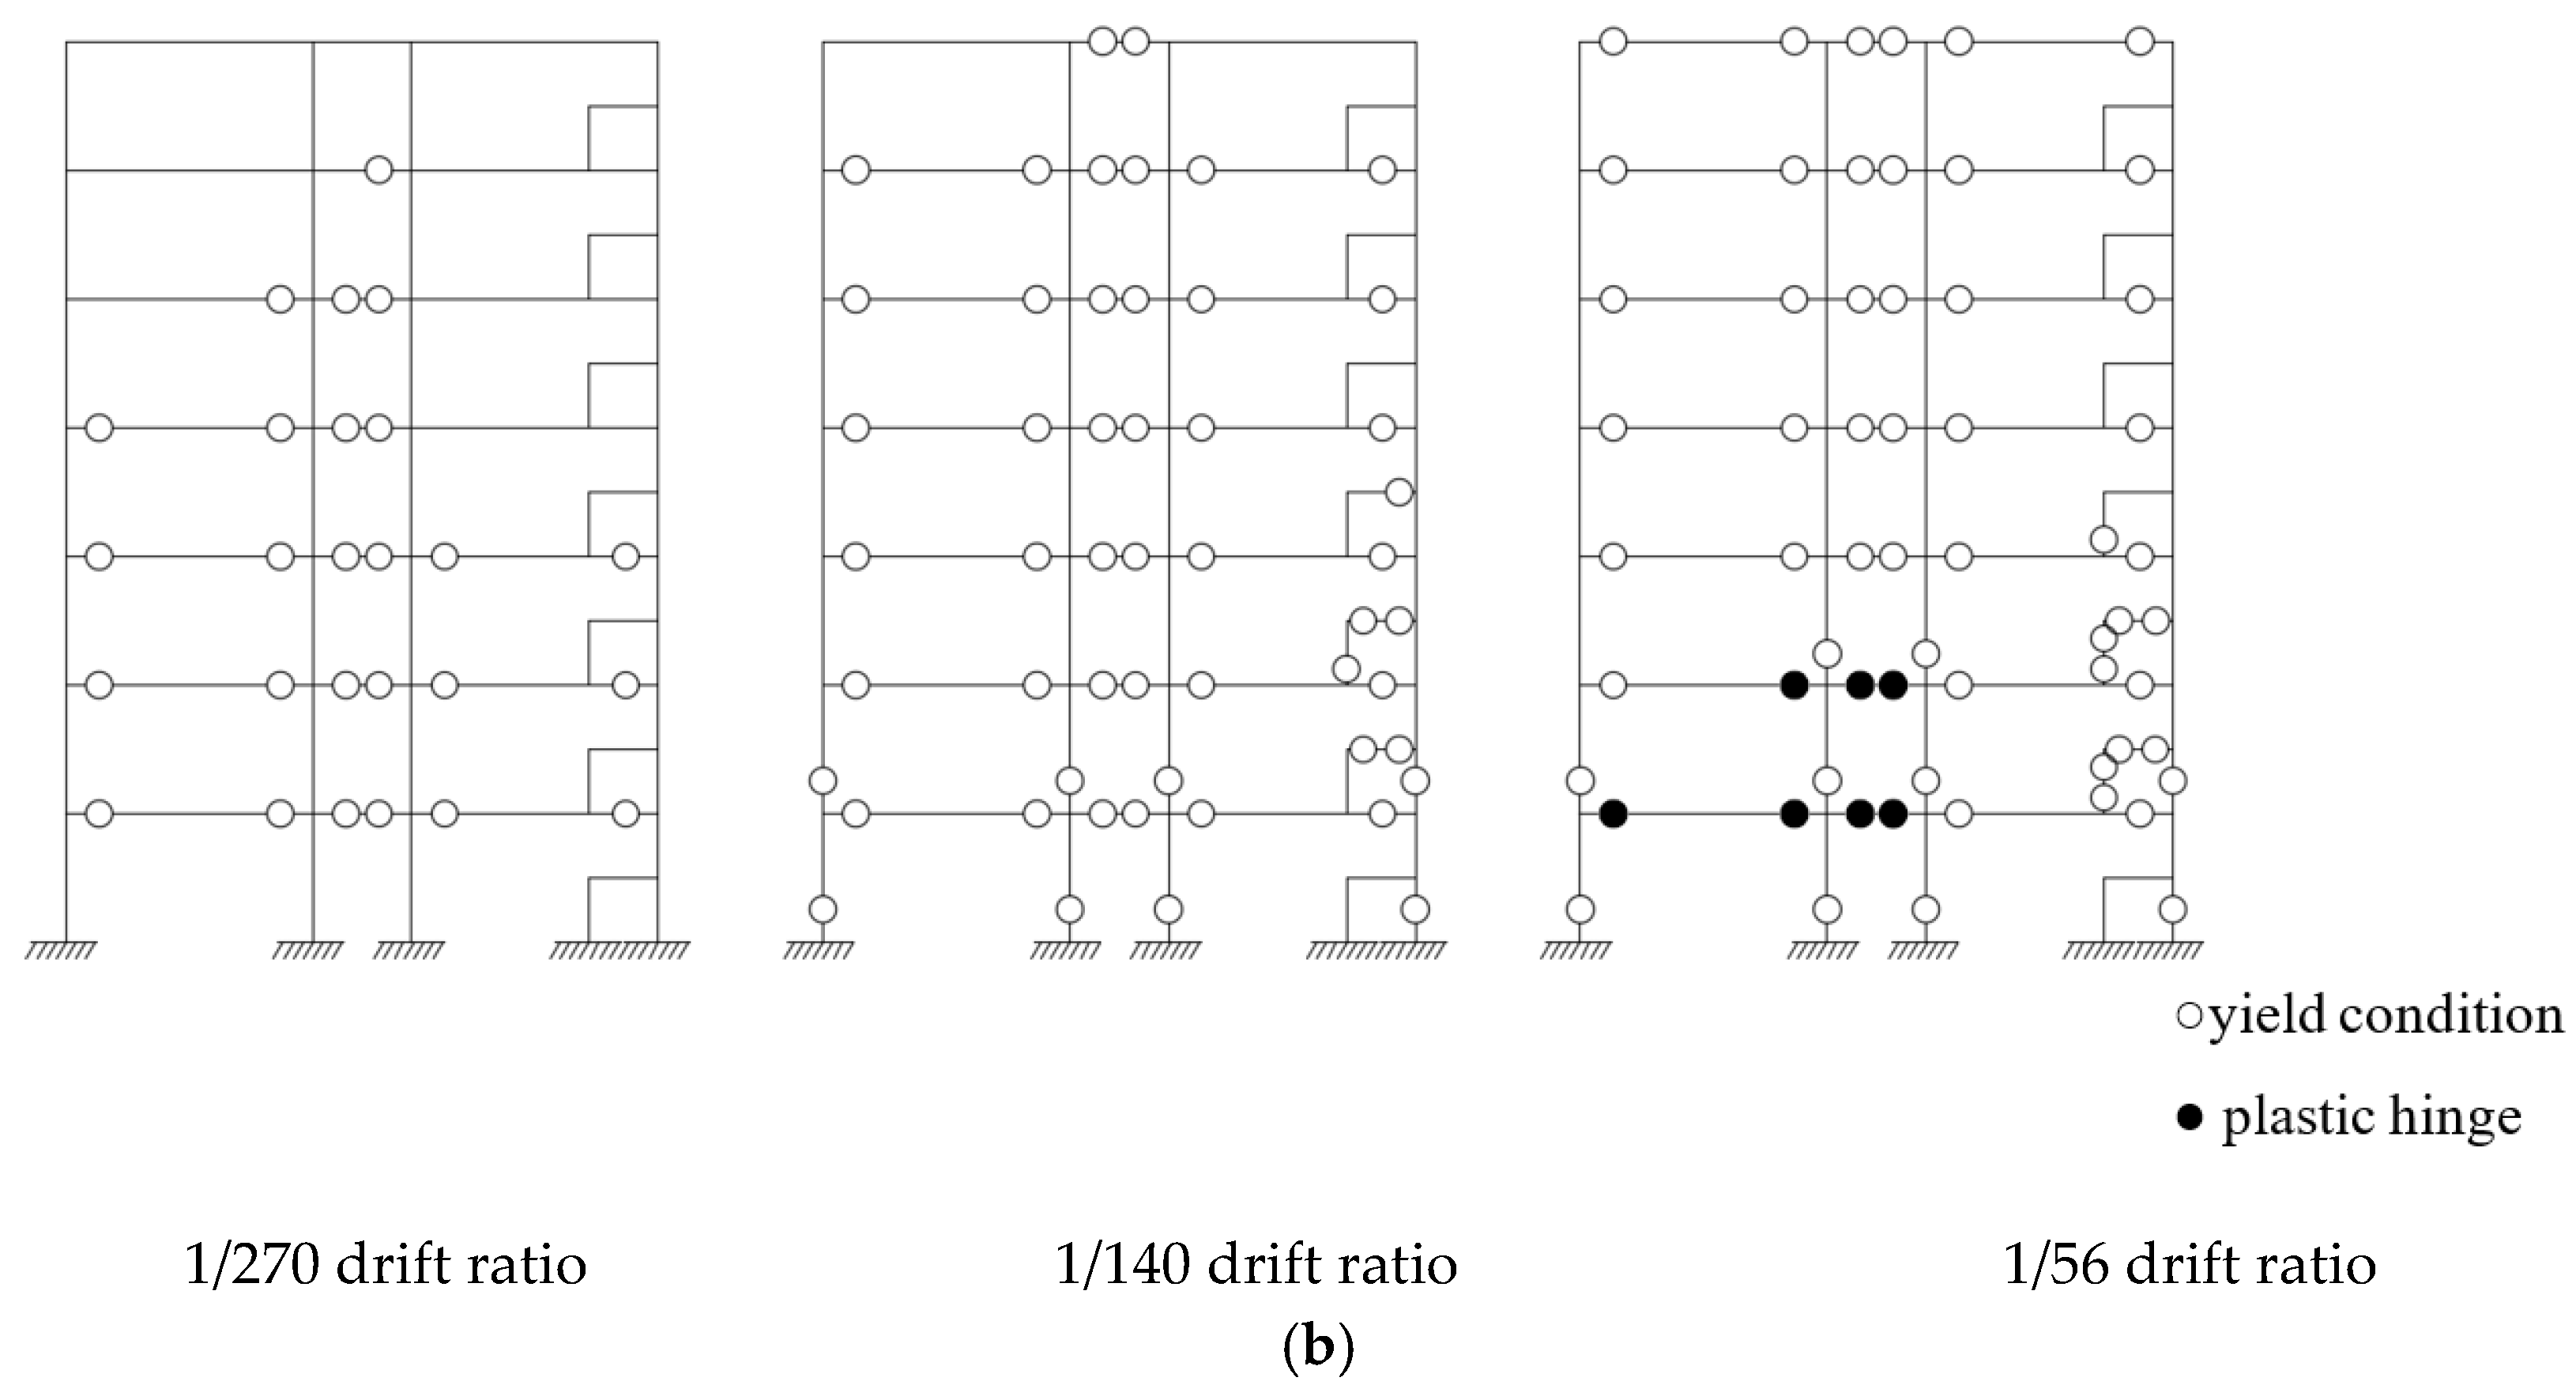
In this study, the horizontal and vertical mechanical properties of RBS were determined through experimental study, and numerical modeling was validated with the experimental result. Subsequently, finite element models of three types of reinforced concrete frames (without stairs, with cast-in-place reinforced concrete stairs, and with RBS stairs) were established in order to assess the seismic performance of the proposed RBS. Response spectrum and non-linear time–history analyses were conducted to analyze the effect of the RBS on the dynamic characteristics of the whole structure. The dynamic responses (i.e., natural vibration period, base shear, story shear, story drift angle, and vertex acceleration) were obtained for each model, and the inner forces of stair components were deeply analyzed.

2. Mechanical Performance Test of RBS

2.1. Specimen Description

The details of the specimens are presented in Figure 4 and the elevation view is shown in Figure 5. The specimens are composed of a rubber layer, cover steel plates, and connecting steel plate. The density of natural rubber is 930 kg/m3 and the hardness of the rubber was determined to be 58 using the rubber hardness tester. Additionally, the elastic modulus of rubber is 2.63 MPa and the shear modulus is 0.81 MPa. The rubber layer is bonded to the cover steel plates both above and below the layer. The connecting steel plates and cover steel plates are connected by sunken bolts. The main function of the connecting steel plate is to connect the RBS to the loading device. In fact, the thickness of the rubber layer of the RBS products and test specimens is the same and the value is 50 mm; however, the thickness of the cover steel plate and connecting steel plate is increased to a certain extent in the test to ensure the reliability of connection between the test specimens and the loading device. In engineering practice, the production of the RBS adopts a modular design to cope with the demands of building standardization. The RBS is designed to be a series of modular units. Different modular units can be assembled according to the width of the staircase in order to meet the practical application requirements.

2.2. Test Setup and Methodology

All the tests of horizontal mechanical behavior are carried out using an electrohydraulic servo compression–shear loading system, which is designed to work on specimens, including RBS-1and RBS-2. In the horizontal direction, a sinusoidal wave loading is used and the maximum sampling frequency is 10 Hz. The loading device is shown in Figure 6. The tests of vertical mechanical behavior are also conducted using this loading system, by providing loading force in the vertical direction only.
The test contents include shear behavior, correlation test, and vertical performance, which are used to evaluate the RBS mechanical performance and provide the mechanical parameters for the following numerical analysis.

2.3. Horizontal Shearing Performance

Specimen RBS-1 was used to conduct the test of horizontal shearing performance. The specific test loading process was performed by using the standard test method for rubber bearings [24]. The vertical design compression stress of RBS is 0.2 MPa. While under constant axial load, the sinusoidal wave lateral loading was used to load four cycles. The target lateral displacement of this paper took 50 mm, corresponding to a shear strain of 100%, and the loading frequency was 0.15 Hz. The horizontal load–displacement curve is shown in Figure 7a. The horizontal stiffness was obtained by using the data of the third cycle of the four cyclic loadings, and the value is 0.471 kN/mm.
Specimen RBS-2 was used to study the RBS compression–shear behaviors under varying shear strain. The influence of different shear strains on the RBS shear behavior was tested. According to the standard test method of rubber bearings [24], the target lateral displacements for each of the cycles were 12.5 mm, 25 mm, 37.5 mm, 50 mm, and 75 mm, corresponding to shear strains of 25%, 50%, 75%, 100%, and 150%, respectively. When the target displacement reached 75 mm, the RBS is still in good condition. The horizontal load–displacement curve under different shear strains was obtained, as shown in Figure 7b. The force-displacement results were used to calculate the horizontal stiffness Kh and equivalent damping ratio heq. The horizontal stiffness corresponding to 100% shear strain is 0.472 kN/mm, and the equivalent damping ratio is 0.021. As shown in Figure 8, the horizontal stiffness and equivalent damping of RBS decreases gradually with the increase in shear strain.

2.4. Vertical Mechanical Properties

Specimen RBS-3 was used to study the vertical mechanical properties of the RBS. The test loading process was performed by using the standard test method of rubber bearings [24]. The vertical stress is ±30% σ0, where σ0 is the design compressive stress. The permanent and live loads to which the RBS was subjected were calculated in accordance with the load code for the design of building structures [25]. The design compressive stress was obtained, which is 0.2 MPa. After four cyclic loadings, the vertical load–displacement relationship curve was obtained. Using the data of the third cycle of the four cyclic loadings, the vertical stiffness can be obtained, and the value is 5.2 kN/mm. Under the vertical design force, the vertical deformation of RBS is 1.15 mm.

3. Numerical Modeling and Verification of RBS Bearings

The general-purpose software package for finite element analysis, ABAQUS/CAE6.10-1 [26], was employed to simulate the shear behavior of the RBS bearings tested in this study, and the experimental results are used to calibrate the model.
The existing studies [27,28] demonstrated that the strength degradation of LRB under cyclic loading should be considered when modeling the behavior of LRB. In comparison, the rubber materials were characterized by their isotropic property and nonlinear elastic and incompressible behavior; therefore, the strength degradation of rubber materials under cyclic loading was not involved. The Mooney–Rivlin model [29] was used to simulate the mechanical properties of rubber materials in this study which considers the aging effect of the rubber materials.
The rubber components of the bearings were simulated with eight-node continuum elements (C3D8H) that use a first order hybrid formulation in which the displacement and pressure fields are integrated independently to prevent the volumetric locking caused by the nearly incompressible behavior of rubber. The Mooney-Rivlin [29] model was adopted for the rubber material because of the direct relationship between the engineering properties of the rubber and the model parameters. The Mooney-Rivlin model assumes that rubber is isotropic, nonlinear elastic, and incompressible or nearly incompressible and is stated by the strain energy potential W, that is
W = C 10 ( I 1 3 ) + C 01 ( I 2 3 )
In which I1 = the first stress invariant, I2 = the second stress invariant, and C10 and C01 = material parameters. The material parameters which were input into the ABAQUS program were calculated as C10 = 0.32 MPa and C01 = 0.08 MPa, based on the following Equations (2)–(5).
According to the incompressibility of the rubber material, the Poisson’s ratio of rubber is obtained, where ν = 0.5; hence, the relation between C10, C01, and elastic modulus E0 can be obtained as follows:
E 0 = 6 ( C 10 + C 01 )
An empirical equation between C01 and C10: C01 = 0.25C10 is proposed in the literature of Gent [30]. The following Equation (3) can be obtained.
E 0 = 6 × 1.25 C 10
The relation between hardness (Hr) and the elastic moduli (E0) of the rubber material is proposed according to the experimental data [31].
lg E 0 = 0.0238 H r 0.9905
Substituting Equation (3) into Equation (4), the relation between Hr and C10 can be obtained as follows:
lg ( 7.5 C 10 ) = 0.0238 H r 0.9905
where Hr was determined to be 58 in the above experiment. Substituting Hr into Equation (5), C10 can be obtained; furthermore, C01 is also obtained by the equation C01 = 0.25C10.
Figure 9a showed three−dimensional views of the mesh for the RBS bearing, which was selected as the mesh with the fewest number of elements that provided a converged solution from a mesh sensitivity analysis.
The finite element model of the RBS was used to simulate the horizontal shearing performance of the bearing. The comparisons of horizontal load-displacement curves between finite element analysis and test were shown in Figure 9b. The results indicated the comparison between the numerical performance parameters of RBS under varying shear strains and the experimental results. Comparing the finite element analysis results with the experimental results, the error rate is within 0.2%, which indicates that the finite element analysis is in good agreement with the experimental results.

4. Analysis of Isolation Properties and Discussion

In order to investigate the effect of RBS on the dynamic characteristic of typical structures and the mechanical behavior of stair components, the response spectrum and non-linear time–history analyses were carried out using the ETABS and ABAQUS 6.10 software, respectively. The finite element models of three types of reinforced concrete frames, without stairs (RC-woS), with cast-in-place reinforced concrete stairs (RC-wS), and with RBS stairs (RC-wRBS), were established. The response spectrum analysis was performed to investigate the structural response in the elastic stage, whereas the non-linear time–history analysis was conducted to study the elastoplastic response of the structures.

4.1. Prototype RC Frame Building

A typical building was designed with the aim of performing the numerical simulations and capturing the influence of the RBS on the seismic behavior of the whole structure and stair members. The typical plan view of the building was shown in Figure 10. The building has a total height of 27.3 m and 7 stories, with the story height being 3.9 m. The dimensions of the building in the plan are 54 × 18 m. The column dimension is 0.65 × 0.65 m, the beam cross section is 0.30 × 0.60 m, and the thickness of the slab is 0.12 m. The cross-sectional size of the staircase components is presented in Table 1, and the total building mass is 4885 t. The bottom frame column of the concrete type used for this building structure is C35 type, and the rest are C30 type.
The typical buildings considered in this study are reinforced concrete frame structures, which are designed in accordance with the Code for Seismic Design of Buildings [32]. The seismic fortification intensity varies in different regions, and the corresponding relationship between seismic fortification intensity and designed basic seismic acceleration value of ground motion can be obtained from ligature [32]. The typical building in this study was assumed to be located in a region with an eight-degree seismic design intensity. The corresponding peak ground acceleration (PGA) value of the design earthquake (i.e., probability of exceedance of 10% in 50 years) is around 0.20 g. According to the code [32], the site category is divided into site-class I0, I1, II, III, and IV. The typical building in this study was assumed to be located in an area with site-class II, where the shear wave velocity of soil is between 250 m/s and 500 m/s, and the thickness of site covering layer is more than 5 m.

4.2. Response Spectrum Analysis

4.2.1. Analytical Model

The finite element models of RC-woS, RC-wS, and RC-wRBS were established with the ETABS software [33]. The columns and beams were modeled using the beam element, the floor slab was modeled by the membrane element, and the flight was modeled by the shell element. In order to describe the mechanical behavior of the RBS isolator, a nonlinear finite element NL link “Rubber Isolator” was adopted. Based on the previous experimental results, the equivalent horizontal stiffness of the RBS obtained from the test was input in finite element models as the element attribute of the Rubber Isolator. The response spectrum analysis of RC-woS, RC-wS, and RC-wRBS was carried out under frequent earthquakes, and the finite element model of RC-wRBS was shown in Figure 11.

4.2.2. Numerical Results

(1)
Natural vibration period of structure
A modal dynamic analysis was conducted on the models of RC-woS, RC-wS, and RC-wRBS to understand the influence of the stairs and RBS on the dynamical behavior of the whole structure. In Table 2, the modal analysis results are summarized and, in particular, the first three modal periods are reported. The presence of the stairs in model RC-wS increases the transversal stiffness, and the period drastically decreases with respect to the result of model RC-woS without stairs. This confirms the stiffness increase caused by the presence of the stairs, which is consistent with the conclusion of Kumbhar et al. [34]. However, the comparison between models RC-wS and RC-wRBS shows that the presence of the RBS elongates the whole building period: as the introduction of the RBS weakens the diagonal strut effect of the flight, it also decreases the transversal stiffness of the whole structure.
(2)
Story stiffness
The contribution ratio of stairs to the stiffness of the whole structure is 13~30% in the transversal direction Y (parallel-to-stair-run direction); by comparison, the ratio in the longitudinal direction X (perpendicular-to-stair-run direction) is lower, as shown in Figure 12. In addition, Figure 13 shows the story stiffness distribution of each model, including both the transversal direction and longitudinal direction. It is revealed that the transversal stiffness of the whole structure increased significantly due to the presentation of staircase. However, the transversal stiffness of the second floor of model RC-wRBS is reduced by 28.4% with respect to that of model RC-wS. This is because the introduction of the RBS almost eliminates the influence of the staircase on the transversal stiffness of the whole structure.
(3)
Story shear
The story shear distribution of each model is shown in Figure 14. It can be seen that the staircase has little effect on the longitudinal story shear of the whole structure. Taking the transversal story shear of the second floor as an example, the story shear of model RC-wS increases by 16.9% compared with that of model RC-woS. It indicates that the presence of the stairs increases the transversal story shear of the whole structure. Compared with the longitudinal direction, the reduction in the story shear for the transversal direction is distinct. The story shear of model RC-wRBS is reduced by 13.5% with respect to that of model RC-wS because the RBS can considerably reduce the one-way slanting bracing effect of the flight and decrease the transversal stiffness of the whole structure.
(4)
Story drift
The distribution curves of the story drift of each model are shown in Figure 15. It can be seen from the figure that the staircase has little influence on the story drift in the longitudinal direction. In the transversal direction, the maximum story drift angles of models RC-woS, RC-wS, and RC-wRBS are 1/606, 1/718, and 1/568, respectively. From the comparison of the results, we can find that the maximum story drift angle of model RC-wS decreases by 15.6% with respect to that of model RC-woS. The main reason is that the presence of the stairs in model RC-wS increases the transversal stiffness of the whole structure, and thus, it decreases the inter-story deformation in the transversal direction. However, the maximum story drift of model RC-wRBS is close to that of model RC-woS, which indicates that the presence of the RBS can reduce the influence of the staircase on the transversal deformation of the whole structure.
(5)
Pushover analysis
The Pushover analysis of the models RC-ws and RC-wRBS was performed by ETABS software. The development of the plastic hinge of the model is shown in Figure 16.
When the drift ratio was 1/270, several frame beams in both models reached yield condition first. When the drift ratio reached 1/140, most of the frame beams and columns reached the yield condition. In contrast, the number of landing columns reaching yield condition in model RC-wRBS was less than that in model RC-ws. When the drift ratio was 1/56, the plastic hinges formed at the ends of the landing beams and columns in the model RC-ws. For model RC-wRBS, the landing beams and columns were still under yielding condition, and there was no plastic hinge formed. The above results indicated that the presence of the RBS could prevent the collapse of the staircases and protect the staircases from damage by severe earthquake.

4.2.3. Parametric Analysis

This section is focused on the parametric analysis of the relative contribution of the frame and the stairs to the overall horizontal stiffness, respectively. The different relative contribution to the overall horizontal stiffness may be presented by the variation in stair quantity, and then an identical building was designed except for the number of stairs, i.e., the building with a single stair named RCA and the other with more stairs named RCB, as shown in Figure 17. Since the change in location of staircases causes a difference in structural rigidity distribution, the staircases are symmetrically arranged. The finite element models were established likewise, with cast-in-place reinforced concrete stairs (RCA-wS, RCB-wS) and with RBS stairs (RCA-wRBS, RCB-wRBS).
Since the influence of the stairs on the whole structure is mainly concentrated on the transversal direction Y, the parametric analysis in the transversal direction was mainly conducted. The relative contribution of the stairs to the overall horizontal stiffness increased with the increasing staircase quantity, as shown in Figure 18. The transversal story stiffness distribution and story shear of each model was obtained as shown in Figure 19 and Figure 20. For the RCA model with a single stair, the transversal stiffness of the second floor of model RCA-wRBS is reduced by 16.4% with respect to that of model RCA-wS. For the RCB model with more stairs, the transversal stiffness of the second floor of model RCB-wRBS is reduced by 35.8% with respect to that of model RCB-wS. The reduction rate of transversal stiffness increases as the relative contribution of stairs increase. Similarly, the transversal story shear of the second floor of model RCA-wRBS is only 8% lower than that of model RCA-wS; however, the value of RCB-wRBS is 18% lower than that of model RCB-wS. It is stated that the reduction degree of transversal story shear caused by the RBS is more obvious with the increasing relative contribution of stairs to the overall horizontal stiffness.

4.3. Dynamic Elasto-Plastic Analysis

4.3.1. Analysis Model

Due to the article length limit, the finite element models of RC-woS, RC-wS, and RC-wRBS were only established using the finite element software ABAQUS to compare the dynamic response of these three models under elasto-plastic condition. Using the fiber element model PQ-fiber, based on the work of Lu et al. [35], the beam, column, and steel rebar were modeled by setting the parameters of the UConcrete02 and USteel02 materials, respectively. The shell element was used to simulate the floor and flight, and the RBS bearings were simulated based on the Section 3, where detailed model parameters were introduced. The finite element model of RC-wRBS and the local model of the stairs are shown in Figure 21. The non-linear time-history analyses of RC-woS, RC-wS, and RC-wRBS were conducted.

4.3.2. Dynamic Response

Selection of appropriate ground motion records for nonlinear dynamic analysis of structures plays a crucial role to estimate structural responses reasonably. Various criteria are used in the selection of ground motion records for nonlinear time history analyses; spectral matching is the primary consideration, and maximum displacement demands are also considered [36,37]. According to the Code for Seismic Design of Buildings (GB50011-2010) [32], at least two actual strong earthquake records and one artificially simulated acceleration time–history curve should be selected for time-history analysis. The El-Centro wave, Tangshan wave, and an artificial wave (with components in the north–south (N–S) and west–east (W–E) directions) were used to conduct a time–history analysis.
In this study, the details about selected waves were as follows. The EL-Centro wave was recorded in El-Centro, southern California in 1940, whose magnitude was 7.1, and the acceleration interval was 0.02 s. The peak acceleration of the N–S component was 341.7 cm/s2, and the E–W component was 210.1 cm/s2. The Tangshan wave was recorded at the Beijing Hotel observation site in Tangshan City, and the magnitude was 7.8. The peak acceleration of the N–S component was 55.49 cm/s2, and the E–W component was 65.9 cm/s2. The acceleration interval was 0.01 s. An artificial wave was generated according to the Code for Seismic Design of Buildings (GB50011-2010) [32]; the design’s basic acceleration of ground motion was 0.2 g, the site class was Ⅱ, and the intensity was 8-degree. For a rare earthquake, the maximum acceleration value for the seismic acceleration of the ground was adjusted to 400 cm/s2 when conducting a time–history analysis. The comparison between the response spectra of the selected seismic waves and the standard response spectra is shown in Figure 22, indicating that the response spectrum of selected waves was compatible with the code-based target spectrum.
For the rare earthquake of 8-degree intensity, the maximum value for the seismic acceleration of the ground was adjusted to 400 cm/s2 when conducting time–history analysis, as the code proposed. The duration of each ground motion was 20 s.
The results of the response spectrum analysis show that the influence of the stairs on the whole structure is mainly concentrated on the transversal direction Y in Section 4.2.2. Therefore, in the nonlinear time–history analysis, the dynamic response of the whole structure in the transversal direction was mainly studied.
(1)
Story drift angle
Figure 23 showed the envelope values of the story drift angle (transversal direction Y) of models RC-woS, RC-wS, and RC-wRBS under a rare earthquake. As can be seen from the figure, the maximum story drift angles of the three models appear on the second story. Among the three models, model RC-wS has the smallest story drift angle, which shows that the presence of the stairs increases the transversal stiffness of the structure. However, the story drift angle of model RC-wRBS is close to that of model RC-woS, which indicates that the presence of the RBS can eliminate the influence of the stairs on the lateral displacement of the whole structure.
(2)
Base shear
The maximum transversal base shear of each model is listed in Table 3. It can be seen from the table that the transversal base shear of model RC-wRBS is reduced by 19.5% at most, compared with that of model RC-wS, which indicates that the presence of the RBS reduces the transversal base shear. Furthermore, it improves the seismic performance of the whole structure.
(3)
Vertex acceleration
The maximum vertex acceleration of the transversal direction and the amplification coefficients of each model are listed in Table 4. The amplification amplitude refers to the ratio between output maximum acceleration on the top floor and input ground acceleration. It can be seen from the table that the vertex acceleration of model RC-wRBS is very close to that of model RC-wS, which indicates that the presence of the RBS is not effective in reducing the vertex acceleration response.

4.3.3. Force Analysis of Stair Component

It can be seen that the maximum story drift angle occurred on the second floor; therefore, the RBS and structural components located at the second floor were selected to analyze.
(1)
Deformation analysis of RBS
The RBS located at the axis Ⓓ/①-②of the second floor was analyzed, as shown in Figure 10. The time–history curve of relative horizontal displacement between the upper and lower ends of the RBS is shown in Figure 24. It can be seen that the maximum relative horizontal displacement of the upper and lower ends of the RBS is 38 mm. This indicates that the RBS provides the desired floor-to-floor relative drift and can effectively isolate the seismic action from the stair flight. According to the horizontal test result of RBS, it is still on the good condition at the target displacement of 75 mm, corresponding to the 150% shear strain. Therefore, the drift demand from a global analysis can be achieved. The time-history curve of vertical deformation of the RBS was also analyzed, as shown in Figure 25. The vertical displacement of RBS under earthquake action is lower, and the maximum value is less than 5 mm.
(2)
Landing column
In Chinese engineering practice, the landing columns are commonly used in staircases to support the landing beam. The landing column located at the axis Ⓕ/② of the second floor was analyzed. The envelope values of axial force, shear force, and bending moment of the landing column under an earthquake wave are listed in Table 5. Compared with model RC-wS, the axial force of model RC-wRBS is reduced by 44.5% and the transversal shear and bending moment of the landing column decrease by 56.5% and 40.9%, respectively. This indicated that the presence of the RBS significantly reduces the forces of the landing column.
(3)
Landing beam
The landing beam located at the axis Ⓓ/①-② of the second floor was analyzed. Under the earthquake wave, the envelope values of the shear force and bending moment of the landing beam are listed in Table 6. It can be seen from the table that the mid-span shear and bending moment of the landing beam of model RC-wRBS are reduced by 93% and 76.2%, respectively, and the shear and bending moment at the end of the beam are reduced by 65.7% and 63.8%, respectively, compared with those of model RC-wS. This indicates that the forces of the landing beam are significantly reduced when the RBS is installed in the staircase.
(4)
Stair flight
The flight located at the axis ①–② of the second floor was analyzed. Under an earthquake wave, the time–history curve of axial force of the flight is shown in Figure 26, and the axial pressure on the flight of model RC-wRBS decreased by 74.9% and the axial tension decreased by 80.6% compared with model RC-wS.
With regard to model RC-wS, the flights and the landing beams are fixed together. The damage to the stair flights was mostly caused by the interaction of bending moment–axial force (M–N) due to the diagonal truss action of the stairway. Following the Wenchuan earthquake, field reconnaissance [2] was carried out for direct evaluation of building performance, and it was found that several types of damage were due to the tension and compression generated by the complex diagonal truss action of the stairway, such as cracking or spalling of concrete and buckling of the reinforcing bars in the middle of the flights or at the stair flight–landing junction. For model RC-wRBS, the boundary conditions of the stair flights are changed because of the addition of RBS. The time–history curve of relative displacement between the flights and the landing beams was analyzed, as shown in Figure 27. The relative deformation along transversal direction Y and longitudinal direction X is obvious, and the deformation along vertical direction Z is slight. However, there is no relative rotor angle between the flights and the landing beams around the longitudinal X axis based on output results. It shows that the translational degree of freedom is released and the rotation degree of freedom is restricted. This is the main reason why the application of the RBS can reduce the repeated action of tension and compression effectively, which can avoid the failure of the flights.
(5)
Frame column located in staircase
The frame column in the staircase, located at the axis Ⓕ/① of the second floor, was analyzed. The envelope values of shear force and bending moment of the frame column are listed in Table 7. It can be concluded from the table that the envelope values of shear force and moment of the frame column in the staircase of model RC-wRBS were reduced by 28.5% and 35.9%, respectively, compared with those of model RC-wS. This indicates that the presence of the RBS can reduce the shear force and bending moment of the frame column in the staircase and effectively avoid the destruction of this frame column under the earthquake action.

5. Discussion

In design practice, the stairways are typically attached to their major structure and span as a floor-to-floor system. The bottom and top of the stair system are fixed to the lower and upper layers of the supporting structures, which results in the diagonal strut effect of the staircase. The existing studies [13,14] showed that the diagonal strut effect can significantly change the natural vibration period and the story drift angle of the whole structure. Moreover, the internal forces of the frame members joined with the staircases greatly increase due to the diagonal strut effect of the staircases and the short columns formed with the frame columns, becoming the weakness of the structures. Therefore, reasonable measures should be taken to make the stairs not participate in the overall force of the structure. This study indicated that the presence of RBS can effectively mitigate the negative influence of a staircase on the whole building structure, weaken the diagonal strut effect of flights, and reduce the inner forces of staircase components. Although the cost of the RBS is about RMB 5000, including raw materials, fabrication and construction, etc., this study demonstrated that the introduction of RBS can reduce the inner forces of components under an earthquake action, and consequently, the section size and re-bars area of structural members has decreased. Additionally, the RBS can effectively prevent severe damage to the staircase components during an earthquake. Therefore, the RBS can provide reliable and economical solutions for staircase designs in seismic fortification areas.

6. Conclusions

This study proposed a rubber isolation bearing installed in a staircase (RBS). A series of quasi-static tests were conducted to investigate the mechanical properties of the RBS. Then, a finite element analysis was used to simulate the shear behavior of the RBS, and the experimental results were used to verify the validity of the finite element model. Subsequently, the effect of the RBS on the whole structure and on the stair components was further investigated by numerical simulations of system-level building models. The following conclusions are drawn on the basis of the results of these investigations:
(1)
The equivalent horizontal stiffness and equivalent damping ratio of the RBS decreases with an increase in shear deformation; when the target displacement reaches to 150% of shear strain, the RBS is still on the good condition. The maximum relative deformation of RBS from a global analysis is less than the target values; in addition, the displacement demands can be satisfied.
(2)
The RBS can considerably reduce the one-way slanting bracing effect of the flights and decrease the transversal stiffness (parallel-to-stair-run direction) of the whole structure. It is the main reason for mitigating the story shear of transversal direction. The Pushover analysis indicated that the introduction of RBS could prevent the collapse of the staircases and protect the staircases from damage by severe earthquake. Base on the parametric analysis result, the reduction degree of transversal story shear caused by the RBS is more obvious with increasing relative contribution of the stairs to the overall horizontal stiffness.
(3)
The RBS provides the desired floor-to-floor relative drift and effectively isolates the seismic action from the stair flight. Therefore, the presence of the RBS can reduce the inner forces of the staircase components under an earthquake action, including the landing column, landing beam, flight, and frame column of the staircase.
This study presented a new method for improving the seismic behavior of staircases and mainly investigated the role of the proposed bearings in the seismic response of the whole structure. This work has been primarily focused on numerical simulations of system-level building models with and without an incorporated RBS. To date, very little test data are available to validate the findings of these and other numerical studies. Therefore, the corresponding tests of the whole structure involving RBS should be performed to provide sufficient test data for the numerical studies.

Author Contributions

Conceptualization, X.L.; Methodology, L.B. and L.X.; Formal analysis, M.L., Z.Y. and Y.C.; Investigation, M.L., Z.Y. and Y.C.; Resources, Z.Y.; Data curation, M.L. and Y.C.; Writing—original draft, M.L.; Writing—review & editing, L.B.; Visualization, L.B., X.L. and L.X.; Supervision, L.B.; Funding acquisition, L.X. All authors have read and agreed to the published version of the manuscript.

Funding

The study in this paper was supported by the National Natural Science Foundation of China (51208058, 51708035) and the Natural Science Foundation of Shaanxi Province (2022JM-242), and was funded by the Youth Innovation Team of Shanxi Provincial Education Department (21JP006) and the Research and Development Project of China State Construction Engineering Corporation (CSCEC-2015-Z-41).

Data Availability Statement

The written data used to support the findings of this study are included within the article. The digital data used to support the findings of this study are available from the corresponding author upon request.

Acknowledgments

The study in this paper was supported by the National Natural Science Foundation of China (51208058, 51708035) and the Natural Science Foundation of Shaanxi Province (2022JM-242), and was funded by the Youth Innovation Team of Shanxi Provincial Education Department (21JP006) and the Research and Development Project of China State Construction Engineering Corporation (CSCEC-2015-Z-41). This financial support is gratefully acknowledged.

Conflicts of Interest

The authors declare that there are no conflict of interest regarding the publication of this paper.

References

  1. ICC. International Building Code; International Code Council: Washington, DC, USA, 2012. [Google Scholar]
  2. Bi, X.L.; Khalid, M.M. Seismic performance of reinforced-concrete stairways during the 2008 Wenchuan earthquake. J. Perform. Constr. Facil. 2013, 27, 721–730. [Google Scholar]
  3. Bull, D. Stair and Access Ramps between Floors in Multi-Storey Buildings, a Report of the Canterbury Earthquakes Royal Commission; Royal Commission: Christchurch, New Zealand, 2011.
  4. Kam, W.; Pampanin, S. The seismic performance of RC buildings in the 22 February 2011 Christchurch earthquake. Struct. Concr. 2011, 12, 223–233. [Google Scholar] [CrossRef]
  5. Roha, C.; Axley, J.W.; Bertero, V.V. The Performance of Stairways in Earthquakes; Report No.UCB/EERC-82/15; Earthquake Engineering Research Center; University of California: Berkeley, CA, USA, 1982. [Google Scholar]
  6. Bechtoula, H.; Ousalem, H. The 21 May 2003 Zemmouri (Algeria) earthquake: Damages and disaster responses. J. Adv. Concr. Technol. 2005, 3, 161–174. [Google Scholar] [CrossRef] [Green Version]
  7. Cosenza, E.; Verderame, G.M.; Zambrano, A. Seismic performance of stairs in the existing reinforced concrete building. In Proceedings of the 14th World Conference on Earthquake Engineering, Beijing, China, 12–17 October 2008. [Google Scholar]
  8. Tegos, I.A.; Panoskaltsis, V.P.; Tegou, S.D. Analysis and design of staircases against seismic loadings. In Proceedings of the 4th Eccomas Thematic Conference on Computational Methods in Structural Dynamics and Earthquake Engineering, Kos Island, Greece, 12–14 June 2013. [Google Scholar]
  9. Simmons, P.W.; Bull, D.K. The Safety of Single Storey Straight Stair Flights with Mid-Height Landings under Simulated Seismic Displacements; Research Report 2000-09; Department of Civil Engineering, University of Cantebury: Christchurch, New Zealand, 2000. [Google Scholar]
  10. Higgins, C. Prefabricated steel stair performance under combined seismic and gravity loads. J. Struct. Eng. 2009, 135, 122–129. [Google Scholar] [CrossRef]
  11. ASCE 7-10; Minimum Design Loads for Buildings and Other Structures. American Society of Civil Engineers: Reston, VA, USA, 2010.
  12. Zhang, Y.; Tan, P.; Ma, H.; Donà, M. Improving the Seismic Performance of Staircases in Building Structures with a Novel Isolator. CMES-Comp. Model. Eng. 2020, 124, 415–431. [Google Scholar] [CrossRef]
  13. Feng, Y.; Wu, X.B.; Xionget, Y.Q. Seismic performance analysis and design suggestion for frame buildings with cast-in-place staircases. Earthq. Eng. Eng. Vib. 2013, 12, 209–219. [Google Scholar] [CrossRef]
  14. Zhao, Y.X.; Yang, Q.; Li, L.Y. Seismic Design by Semi-Slip-Supported Stairs for Reasonable Structural System of the Frame Building. Ind. Constr. 2012, 42, 94–97. [Google Scholar]
  15. Jiang, H.J.; Wang, B.; Lv, X.L. Seismic damage analysis and design suggestions for staircases in RC frame structures. J. Vib. Shock 2013, 32, 22–28. [Google Scholar]
  16. Zhao, J.; Hou, P.C.; Liu, M.; Jun, T.; Zhiqiang, G.; Lingyun, P. Shaking table test on structural model of concrete frame-staircase with sliding supports. J. Build. Struct. 2014, 35, 53–59. [Google Scholar]
  17. Kandemir, E.C.; Mortazavi, A. Optimization of Seismic Base Isolation System Using a Fuzzy Reinforced Swarm Intelligence. Adv. Eng. Softw. 2022, 174, 103323. [Google Scholar] [CrossRef]
  18. Warn, G.P.; Ryan, K.L. A Review of Seismic Isolation for Buildings: Historical Development and Research Needs. Buildings 2012, 2, 300–325. [Google Scholar] [CrossRef] [Green Version]
  19. Chen, C.; Lei, J.; Liu, Z. A Ternary Seismic Metamaterial for Low Frequency Vibration Attenuation. Material 2022, 15, 1246. [Google Scholar] [CrossRef]
  20. Buckle, I.G.; Eeri, M.; Mayes, R.L. Seismic isolation: History, application, and performance—A world view. Earthq. Spectra 1990, 6, 161–201. [Google Scholar] [CrossRef]
  21. Alfarah, B. Suitability of Seismic Isolation for Buildings Founded on Soft Soil. Case Study of a RC Building in Shanghai. Buildings 2020, 10, 241. [Google Scholar]
  22. Zhou, Y.; Zhang, Z.D. Experimental and analytical investigations on compressive behavior of thick rubber bearings for mitigating subway-induced vibration. Eng. Struct. 2022, 270, 114879. [Google Scholar] [CrossRef]
  23. Wu, D.; Lin, J.; Xiong, Y. Analysis of Seismic Isolation Performance of X-Shaped Rubber Bearings (XRBs). Buildings 2022, 12, 1102. [Google Scholar] [CrossRef]
  24. GB/T20688.1-2007; Rubber Bearings-Part 1: Seismic-Protection Isolators Test Methods. China Standard Press: Beijing, China, 2007.
  25. GB50009-2012; Ministry of Housing and Urban-Rural Development of the People’s Republic of China; Load Code for the Design of Building Structures. China Architecture and Building Press: Beijing, China, 2012.
  26. DSSC. Abaqus/CAE6.10-1, 6.10-1 ed.; Dassault Systèmes Simulia Corporation: Mayfield Heights, OH, USA, 2010. [Google Scholar]
  27. Zheng, W.; Wang, H.; Tan, P.; Li, J.; Liu, Y. Numerical modeling and experimental validation of Sliding-LRBs considering hysteretic strength degradation. Eng. Struct. 2022, 262, 114374. [Google Scholar] [CrossRef]
  28. Liu, Y.; Zhong, W.; Mercan, O.; Tan, P.; Zhou, F. A new nonlinear model to describe the degradation law of the mechanical properties of lead-rubber bearings under high-speed horizontal loading. Struct. Control. Health Monit. 2021, 28, e2836. [Google Scholar] [CrossRef]
  29. Keerthiwansa, R.; Javorik, J.; Kledrowetz, J. Elastomer testing: The risk of using only uniaxial data for fitting the Mooney-Rivlin hyper elastic-material model. Mater. Technol. 2018, 52, 3–8. [Google Scholar]
  30. Gent, A.N. Engineering with Rubber: How to Design Rubber Components; Hanser Gardner Publications: Munich, Germany, 2001. [Google Scholar]
  31. Ma, Y.H.; Zhao, G.F.; Luo, J.R.; Cui, J.; Zhou, F.L. Influence of uneven aging on mechanical property of natural rubber bearing for offshore bridge and simplified aging prediction method. J. Cent. South Univ. 2016, 47, 3498–3506. [Google Scholar]
  32. GB50011-2010; Ministry of Housing and Urban-Rural Development of the People’s Republic of China. Code for Seismic Design of Buildings; China Architecture and Building Press: Beijing, China, 2010.
  33. Computers and Structures Inc. ETABS Structural Analysis Programs—Theoretical and User’s Manual; Release No. 13.20; Computers and Structures Inc.: Berkeley, CA, USA, 2013. [Google Scholar]
  34. Kumbhar, O.G.; Kumar, R.; Adhikary, S. Effect of staircase on seismic performance of RC frame building. Earthq. Struc. 2015, 9, 375–390. [Google Scholar] [CrossRef]
  35. Lu, X.Z.; Jiang, Q.; Liao, Z.W. Elasto-Plastic Analysis of Buildings against Earthquake; China Architecture and Building Press: Beijing, China, 2015. [Google Scholar]
  36. Kayhan, A.H.; Demir, A.; Palanci, M. Multi-functional solution model for spectrum compatible ground motion record selection using stochastic harmony search algorithm. Bullet. Earthq. Eng. 2022, 20, 6407–6440. [Google Scholar] [CrossRef]
  37. Kayhan, A.H.; Demir, A.; Palanci, M. Statistical evaluation of maximum displacement demands of SDOF systems by code-compatible nonlinear time history analysis. Soil Dyn. Earthq. Eng. 2018, 115, 513–530. [Google Scholar] [CrossRef]
Figure 1. Staircase damage in Wenchuan earthquake. (a) Damage along the whole landing beam length. (b) Shear damage and deformation of landing beam. (c) Damage due to cyclic tension and compression [2].
Buildings 13 00616 g001
Figure 2. Staircase damage in Christchurch earthquake. (a) Collapse. (b) Top landing damage. (c) Bottom landing damage [4].
Buildings 13 00616 g002
Figure 3. Illustration of the RBS. (a) Photograph of the RBS. (b) Specific layout of the RBS. (c) Detailed view of the RBS. Z is the height of RBS, including the thickness of rubber layer (50 mm thick) and cover steel plate (5 mm thick).
Buildings 13 00616 g003
Figure 4. Test specimen.
Buildings 13 00616 g004
Figure 5. Elevation view of specimens. (a) Front view. (b) Side view (Unit: mm).
Buildings 13 00616 g005aBuildings 13 00616 g005b
Figure 6. Test loading device. (a) Schematic of test loading device. (b) Photograph of loading device during testing.
Buildings 13 00616 g006
Figure 7. Horizontal test result. (a) Horizontal load−displacement curve at 100% shear strain. (b) Horizontal load−displacement curves under different shear strains.
Buildings 13 00616 g007
Figure 8. RBS compression−shear behaviors under varying shear strain.
Buildings 13 00616 g008
Figure 9. Finite element analysis of RBS. (a) Three−dimensional view of the mesh for the RBS bearing. (b) Comparison of horizontal load−displacement curves between finite element analysis and test.
Buildings 13 00616 g009
Figure 10. Plan view of the typical building.
Buildings 13 00616 g010
Figure 11. Finite element model of RC-wRBS in ETABS.
Buildings 13 00616 g011
Figure 12. Contribution ratio of stairs and frame to stiffness of whole structure. (a) Longitudinal direction X. (b) Transversal direction Y.
Buildings 13 00616 g012
Figure 13. Distribution curves of story stiffness. (a) Longitudinal direction X. (b) Transversal direction Y.
Buildings 13 00616 g013
Figure 14. Distribution curves of story shear. (a) Longitudinal direction X. (b) Transversal direction Y.
Buildings 13 00616 g014
Figure 15. Distribution curves of story drift angle. (a) Longitudinal direction X. (b) Transversal direction Y.
Buildings 13 00616 g015
Figure 16. Distribution of plastic hinges. (a) Model RC-ws. (b) Model RC-wRBS.
Buildings 13 00616 g016aBuildings 13 00616 g016b
Figure 17. Plan view of the RC frame with different number of stairs. (a) RCB. (b) RCA.
Buildings 13 00616 g017aBuildings 13 00616 g017b
Figure 18. Contribution ratio to stiffness of the whole structure along transversal direction Y. (a) RCA. (b) RCB.
Buildings 13 00616 g018
Figure 19. Distribution curves of story stiffness along transversal direction Y. (a) RCA. (b) RCB.
Buildings 13 00616 g019
Figure 20. Distribution curves of story shear along transversal direction Y. (a) RCA. (b) RCB.
Buildings 13 00616 g020
Figure 21. Finite element model of RC-wRBS in ABAQUS. (a) Whole structural model. (b) Local model of stairs with RBS.
Buildings 13 00616 g021
Figure 22. Comparison between the response spectra of the selected seismic waves and the standard response spectra in GB50011-2010.
Buildings 13 00616 g022
Figure 23. Envelope value of the story drift angle under a rare earthquake (transversal direction).
Buildings 13 00616 g023
Figure 24. Time−history curve of relative horizontal displacement between upper and lower ends of the RBS.
Buildings 13 00616 g024
Figure 25. Time−history curve of vertical deformation of the RBS.
Buildings 13 00616 g025
Figure 26. Time−history curves of axial force of the flight. (a) EI-Centro wave. (b) Tangshan wave. (c) Artificial wave.
Buildings 13 00616 g026
Figure 27. Time−history curve of relative displacement between the flights and the landing beams under EI-Centro wave.
Buildings 13 00616 g027
Table 1. Dimensions of staircase components.
Cross-Sectional Dimension
Landing ColumnLanding BeamThickness of the FlightThickness of the Landing Slabs
300 mm × 300 mm250 mm × 400 mm120 mm120 mm
Table 2. Natural vibration period of each model.
Period (s)RC-woSRC-wSRC-wRBS
First mode1.5041.3111.441
Second mode1.4761.2231.434
Third mode1.3761.0941.340
Table 3. Maximum transversal base shear of the whole structure (kN).
ModelEl-Centro WaveTangshan WaveArtificial Wave
RC-woS9764.810,468.78775.39
RC-wS11,374.413,437.610,976.5
RC-wRBS10,374.510,952.19214.77
Table 4. Maximum vertex acceleration of the structure along the transversal direction Y (cm/s2).
Seismic WaveEl-Centro WaveTangshan WaveArtificial Wave
RC-woSVertex acceleration606.9581.5610.9
Amplification factor1.521.451.53
RC-wSVertex acceleration708.8615.9651.6
Amplification factor1.771.541.63
RC-wRBSVertex acceleration693.8600.5635.2
Amplification factor1.731.501.59
Table 5. Envelope values of axial force, shear force, and bending moment of staircase column.
ModelAxial Force (kN)Shear (kN)Bending Moment (kN·m)
RC-wS306.9132.368.9
RC-wRBS170.457.640.7
Table 6. Envelope values of shear force and bending moment of landing beam.
ModelMidspanEnd of the Landing Beam
Shear (kN)Bending Moment (kN·m)Shear (kN)Bending Moment (kN·m)
RC-wS31534.920132
RC-wRBS21.98.36911.6
Table 7. Envelope values of shear force and bending moment of the frame column in staircase.
ModelShear (kN)Bending Moment (kN·m)
RC-wS475.7487.9
RC-wRBS340.3312.8
Disclaimer/Publisher’s Note: The statements, opinions and data contained in all publications are solely those of the individual author(s) and contributor(s) and not of MDPI and/or the editor(s). MDPI and/or the editor(s) disclaim responsibility for any injury to people or property resulting from any ideas, methods, instructions or products referred to in the content.

