1. Introduction
Under the dual influence of urbanization and global climate change, the urban heat island effect is intensifying, which not only seriously affects the thermal comfort of the human body and the health of residents [
1,
2,
3,
4], but also has an important influence on urban ecological function and regional sustainable development [
5,
6]. As an important part of the urban ecosystem, the green space system has a variety of ecological functions that can effectively stabilize the urban ecological environment and improve the quality of the living environment [
7]. Concurrently, the structural indicators of green space, such as green space form, structure, and spatial layout, also have a significant impact on the thermal environment. Urban land resources are limited, and greenspace construction costs are high. Compared with increasing green space quantity, optimizing the green space landscape pattern, improving the cooling function of green space per unit area, and maximizing the cooling effect of limited green space has important theoretical and practical significance [
8,
9,
10,
11,
12,
13,
14].
The thermal environment effect on green spaces is the focus of urban thermal environment research. Scholars at home and abroad have conducted much research in different cities using different methods. Thermal environment research methods mainly include field observation [
15], remote sensing technology [
16], numerical simulation [
17], human thermal comfort perception [
18], and comprehensive use of a variety of methods to carry out research. Field observation is often used for small-scale green patches, and the effective measurement range is small and easily limited by external conditions; however, the data have the advantages of continuity and high accuracy [
19,
20]. Remote sensing technology can simultaneously acquire land surface temperature data over a wide range and usually studies the thermal environmental effects of green space systems based on urban and regional spatial scales [
21]. The numerical simulation method has the characteristics of fast research speed, adjustable research scale, and adaptability to complex urban patterns; however, it needs to be combined with field observation methods, FLUENT, ENVI-met, and other software [
22]. Zhang et al. used numerical simulations to study how the number and layout of trees and pavements affected the thermal environment [
23]. Zhu et al. studied the human physiological thermal response in different green spaces of urban parks using questionnaire surveys and physiological parameter and microclimate measurements [
24].
As the object of study, green patches can be divided into vegetation and landscape scales. Vegetation scale studies have mainly focused on the effects of vegetation species, communities, types, and structures on the cooling function and effect of green space from the perspectives of botany, ecology, landscape architecture, and other disciplines. Liu et al. found that different tree species exhibited significant differences in cooling, humidification, and discomfort reduction rates [
25]. Zhang et al. studied the cooling and humidifying effects of multilayer vegetation communities with different canopy densities at different times of day [
26]. Su et al. studied the relationship between the leaf area index and evapotranspiration of different vegetation types in different climate zones [
27].
Landscape scale studies mainly focus on the discussion of green quantity and green space structural indices. The study of green quantity is the focus of study of the thermal environment of green spaces. Scholars have discussed the thermal environmental effects of green quantity indicators such as green space area and rate, green coverage rate, leaf area index, tree coverage rate, three-dimensional green quantity [
28], and sky visibility [
29]. In general, the cooling effect of green space is nonlinear, with an increase in green amount, and there may be an optimal green amount. Threshold is a key issue that cannot be avoided; for example, Zhang et al.’s research shows that the greenbelt area should be between 0.6 and 0.7 km
2, or the circumference should be between 4000 and 4500 m when the internal temperature is the lowest [
30]. Pang et al. showed that there is an efficiency threshold (TVoE) of about 0.52 ha in waterless green areas of cities in cold regions of China, while there is no TVoE in green areas containing water [
31]. The thermal environmental effect of the green space structural index points to the influence of morphological, structural, and spatial layout characteristics of green space patches on the green space itself and the overall landscape environmental temperature. At present, the main research methods are based on the statistical relationship between the green space landscape pattern index and temperature. The commonly used landscape pattern indices include patch number, mean patch area, patch density index, boundary density, maximum patch index, landscape shape index, evenness index, separation index, and convergence index [
32,
33,
34,
35].
Research on the thermal environmental effect and cooling mechanism of urban green space has gradually become a popular topic, shifting from focusing on the development of a green quantity index to focusing on the structural indicators of the green space system. However, the study still has the following problems: (1) Most of the research objects are single green patches (such as park green patches), and there are few studies on urban (regional)-scale green space systems. This is directly related to the difficulty and accuracy in green space and thermal environment data acquisition. High-resolution remote sensing images may provide better research conditions. (2) At the landscape scale, the research method was limited to the landscape pattern index. Different scholars choose different research scales and indicators, thus, the research results are not highly comparable and integration with the practice of territorial spatial planning is insufficient. (3) In contrast to the convergence of green quantity research results, the impact of green space structural indicators on the thermal environment presents different or even opposite results in different studies. This is related to the differences in the climate background, urban structure, data resolution, and research and analysis methods in the study area; therefore, further research is required.
The marginal contribution of this study is as follows: (1) At the smallest scale of China’s territorial space planning practice (urban block), this study explores how structural indicators influence the cooling effect of green space. Using high-resolution remote sensing image data, the precision of green space extraction and the accuracy of the measurement results are improved. Docking with the detailed control planning scale in urban planning enhances the practical significance of green space structural optimization. (2) From the perspective of fractal theory, the fractal index of green space is quantified as its structural index, which has theoretical innovation significance. The thermal environmental effects of the green quantity index (area and perimeter) and green space structural index (grid and boundary dimensions) were compared under the same environmental conditions. (3) The inconsistency index was improved to evaluate the spatial matching relationship between the fractal and thermal environment of green space to evaluate the spatial heterogeneity of its development quality. This study is in the stage of basic theory and application of basic research, and its theoretical significance is more prominent.
In this study, GF1 and Landsat8 OLI/TIRS remote sensing image data were used as data sources. Supervised classification and atmospheric correction were applied to process the data, and green space and surface temperature data were extracted. Combined with the green space fractal model, a spatial regression analysis and inconsistency index analysis of the influence mechanism of urban green space fractal characteristics on the thermal environment is revealed. The quality of green space development at the block scale was evaluated from the perspective of cooling, and specific suggestions and optimization countermeasures are proposed for green space management and thermal environmental improvement.
3. Methodology
3.1. Surface Temperature Inversion Algorithm
The inversion of LST in this study adopts the atmospheric correction method (also known as “radiative conduction equation method”), and ENVI software is used to process Landsat data and inversion of LST. The steps of the LST inversion are as follows [
39]:
- (1)
Radiometric correction
The radiometric calibration tool under radiometric correction of ENVI software was used to conduct radiometric calibration of the multispectral and thermal infrared bands of Landsat 8 OLI/TRIS remote sensing images. In this manner, the radiation error caused by the sensor’s own characteristics, terrain, and atmosphere can be eliminated, and the noise in the image can be removed.
- (2)
Calculation of normalized difference vegetation index (NDVI)
where
NDVI represents the normalized difference vegetation index,
NDVISoil represents the
NDVI value of bare soil or non-vegetation-covered areas, and
NDVIVeg represents the
NDVI value of pixels completely covered by vegetation. Here, the simplified FVC model in
ENVI was used to calculate the
NDVI value, and the FVC image was obtained via band calculation.
- (3)
Calculation of surface emissivity
Sobrino believed that the land surface is composed of vegetation and bare land. He used
NDVI to classify the land surface and the
NDVI threshold method to calculate the specific emissivity of the land surface. On this basis, a mixed model method was used to calculate the surface emissivity [
40].
When NDVI < 0.2, the land surface was completely covered by bare land and the surface emissivity value was 0.973.
When 0.2 ≤
NDVI ≤ 0.5, the land surface includes vegetation and bare land. Here, the surface-specific emissivity is as follows:
When NDVI > 0.5, the land surface was completely covered by vegetation, and the surface emissivity value was 0.986, which is the typical emissivity value of vegetation, where Pv represents the vegetation coverage.
- (4)
Calculation of blackbody radiance
where
B(Ts) r represents the blackbody radiation brightness and I represents the thermal radiation intensity, which can be calculated according to the DN value of the thermal infrared band and is the known value [
41].
L↑ and
L↓ are the upward and downward heat radiation intensities of the atmosphere, respectively, and τ is the transmittance of the atmosphere in the thermal infrared band.
On NASA’s website (
http://atmcorr.gsfc.nasa.gov accessed on 25 June 2019), the center of shadow time, latitude and longitude, and other relevant parameters are entered, and it is concluded that the atmospheric profile information is as follows: (1) Atmospheric transmittance
τ: 0.78. (2) Atmospheric upward radiation brightness L↑: 1.81 W/(m
2·sr·μm). (3) Atmospheric downward radiation luminance L↓: 2.96 W/(m
2·sr·μm).
- (5)
Calculation of surface temperature
where
T represents the land surface temperature,
B(Ts) represents the blackbody radiation brightness,
K1 is 774.8853 W/(m
2·sr·μm), and
K2 is 1321.0789 K in the Landsat 8 OLI/TRIS remote sensing images. To eliminate spatio-temporal differences among remote sensing images, the surface temperature was normalized using range normalization.
3.2. Green Space Fractal Model
The fractal concept of green space originates from urban analysis, and is a new branch separated from urban fractal. This refers to the analysis of the morphological and structural characteristics of green spaces using fractal theory [
42]. This study mainly explores the morphological and structural characteristics of green spaces from the dual aspects of grid and boundary dimensions.
- (1)
Grid dimension
The grid dimension is primarily determined using the box counting method to measure urban land, among which box counting is the most basic method for measuring fractal curves by the covering method, which can not only be used to judge fractal features but also to calculate fractal dimensions [
43]. The calculation process of the grid dimension is as follows. First, the geographical objects, such as urban green space, are covered by a rectangular area; the side length of the rectangle
r is
L, and only a rectangular area is occupied by geographical objects, which is not empty, giving grid number
N(
L) = 1. The rectangular area is sectioned into four small rectangles of equal sizes. One side of the small rectangle
r is
L/
2, and the number of non-empty grids is
N(
L/
2). The small rectangular area is further divided, and the large rectangular area is divided into 16 equal parts. The side lengths
r of the small rectangle are
L/
4 and
L/
22, and the number of non-empty grids is
N(
L/
2n). If the urban green space has fractal characteristics, it can be shown according to fractal theory [
44]:
Conforming to the negative power function,
If the scaling invariance defined in the above equation is satisfied,
D is the fractal dimension. If there is a negative power exponential relationship between grid scale
r and the number of non-empty grids
N(
r), it can be judged that the urban green space has fractal characteristics. The value range of the grid dimension
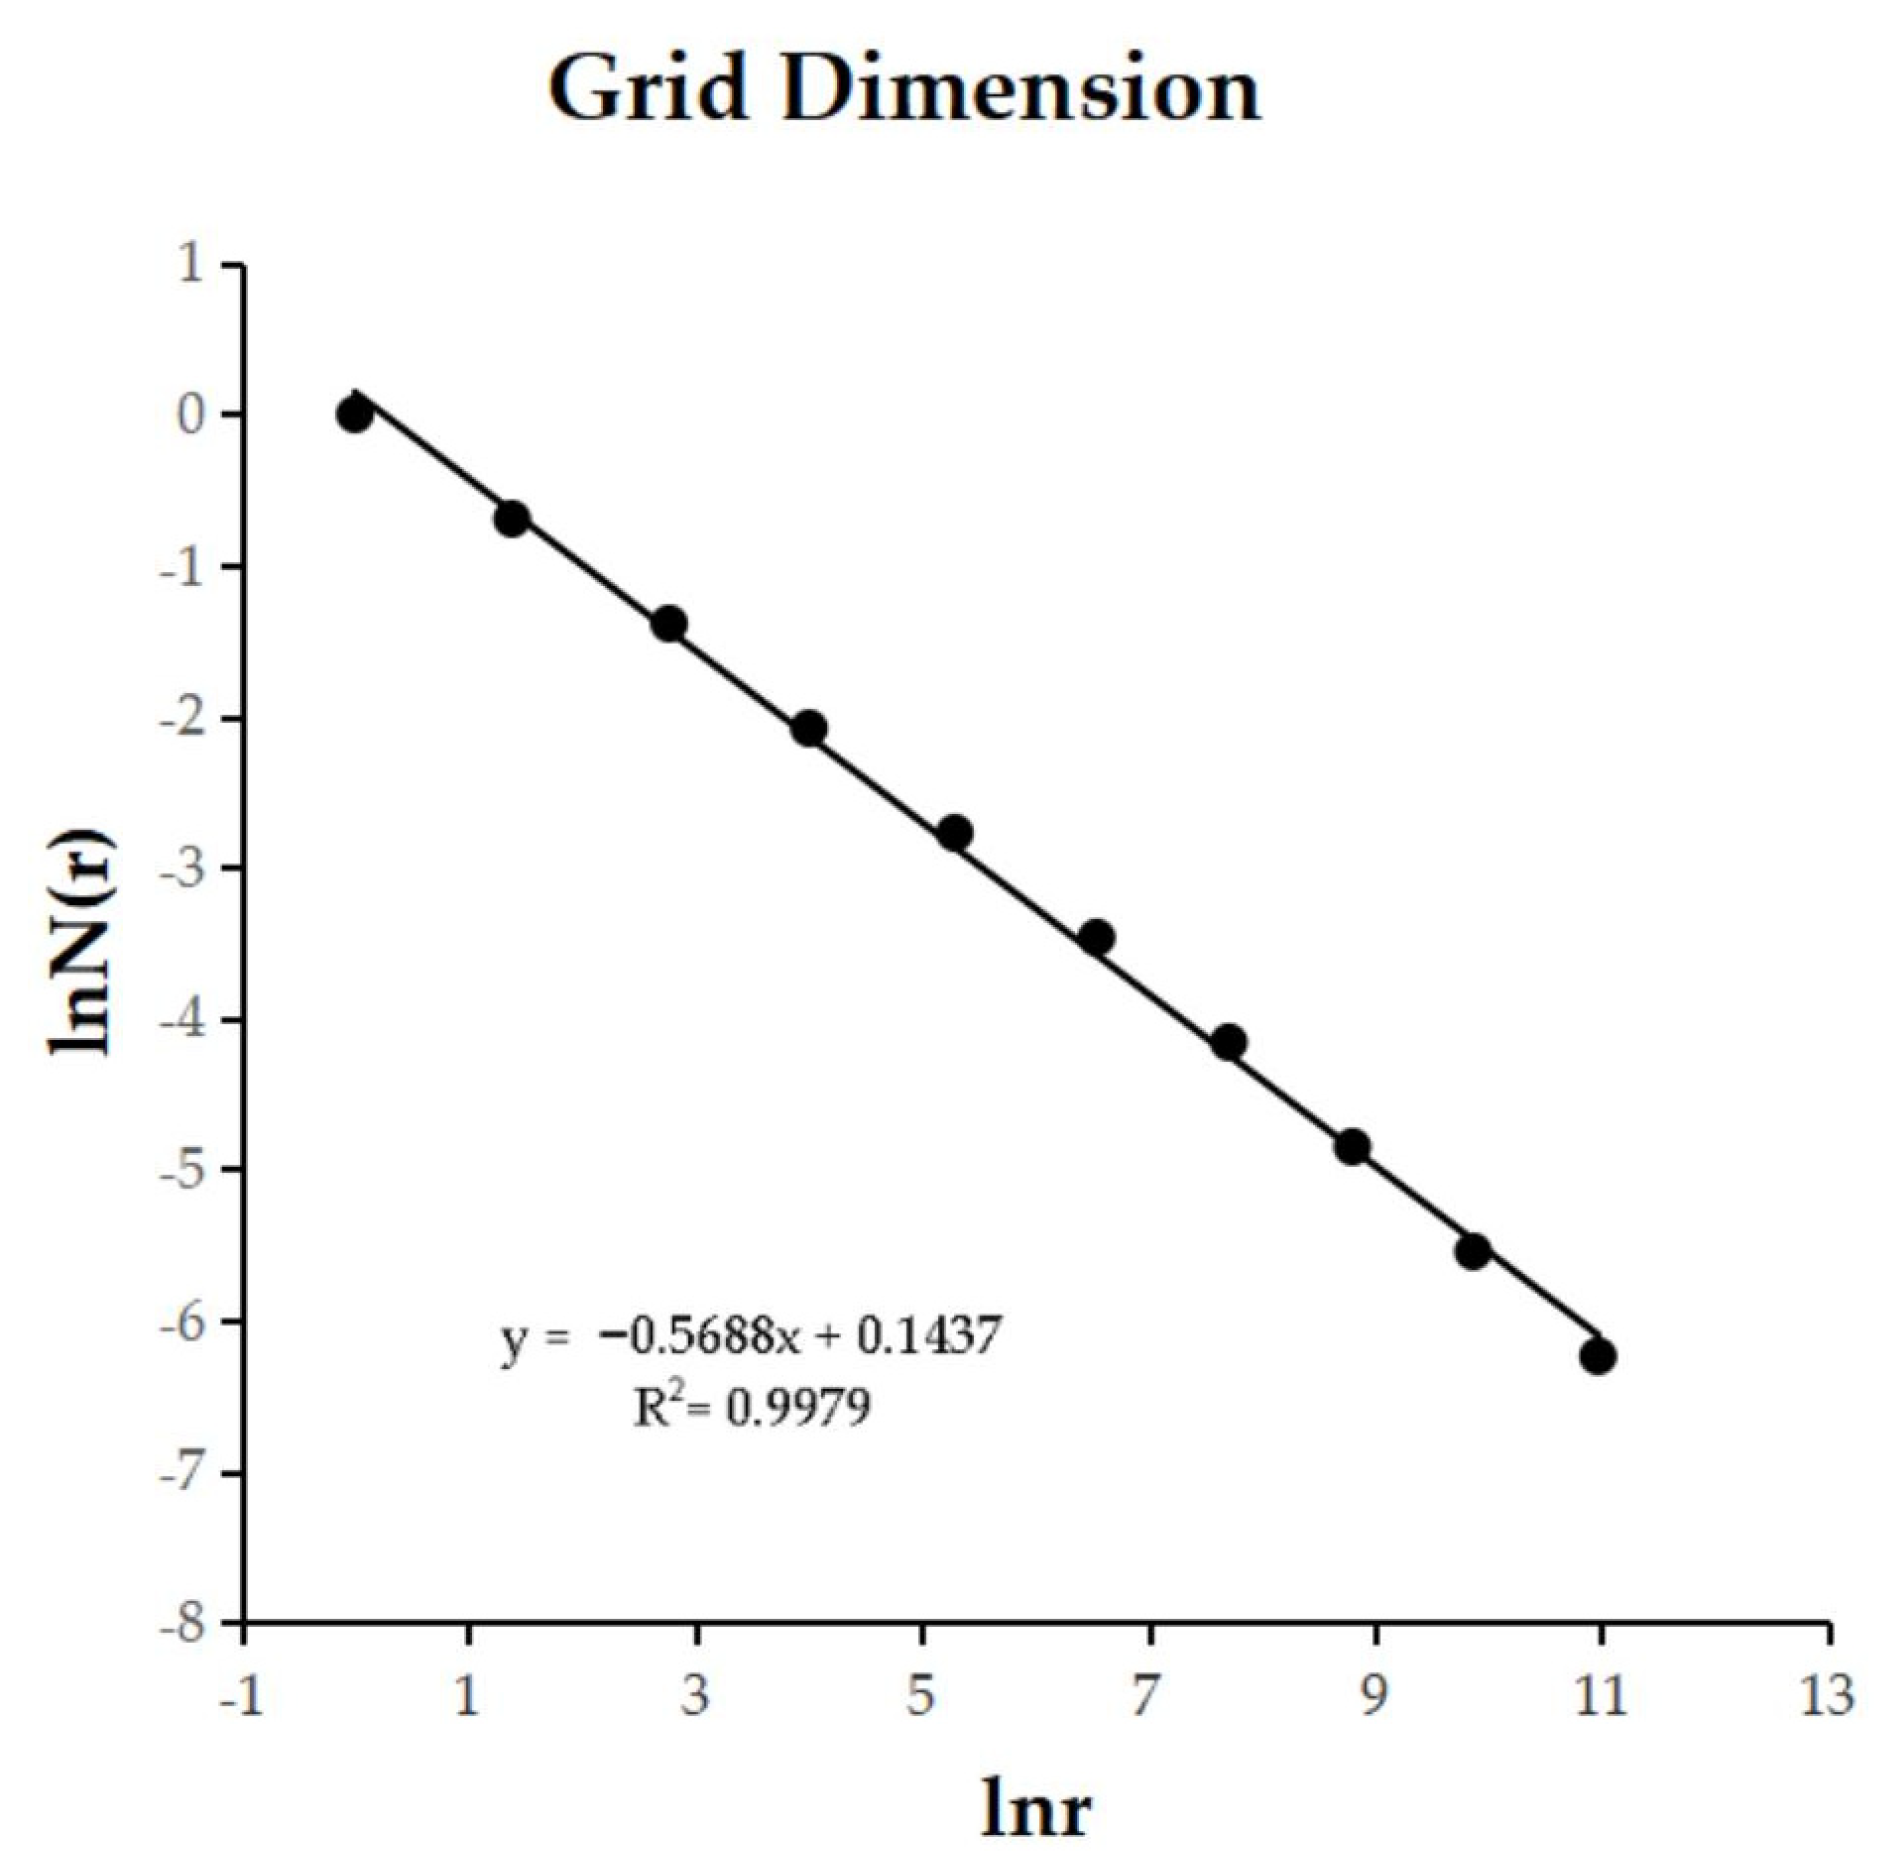
D for urban fractals was [0, 2]. In terms of geographical geometry, the grid dimension represents the filling degree of a certain urban land type and equilibrium land-use type. The larger its value, the more significant the equilibrium characteristic of the urban land spatial distribution, while the smaller its value, the more obvious the concentration characteristic of the urban land spatial distribution. In this study, Block 15 was used as an example to draw a double logarithmic diagram of the green space grid dimension. As shown in
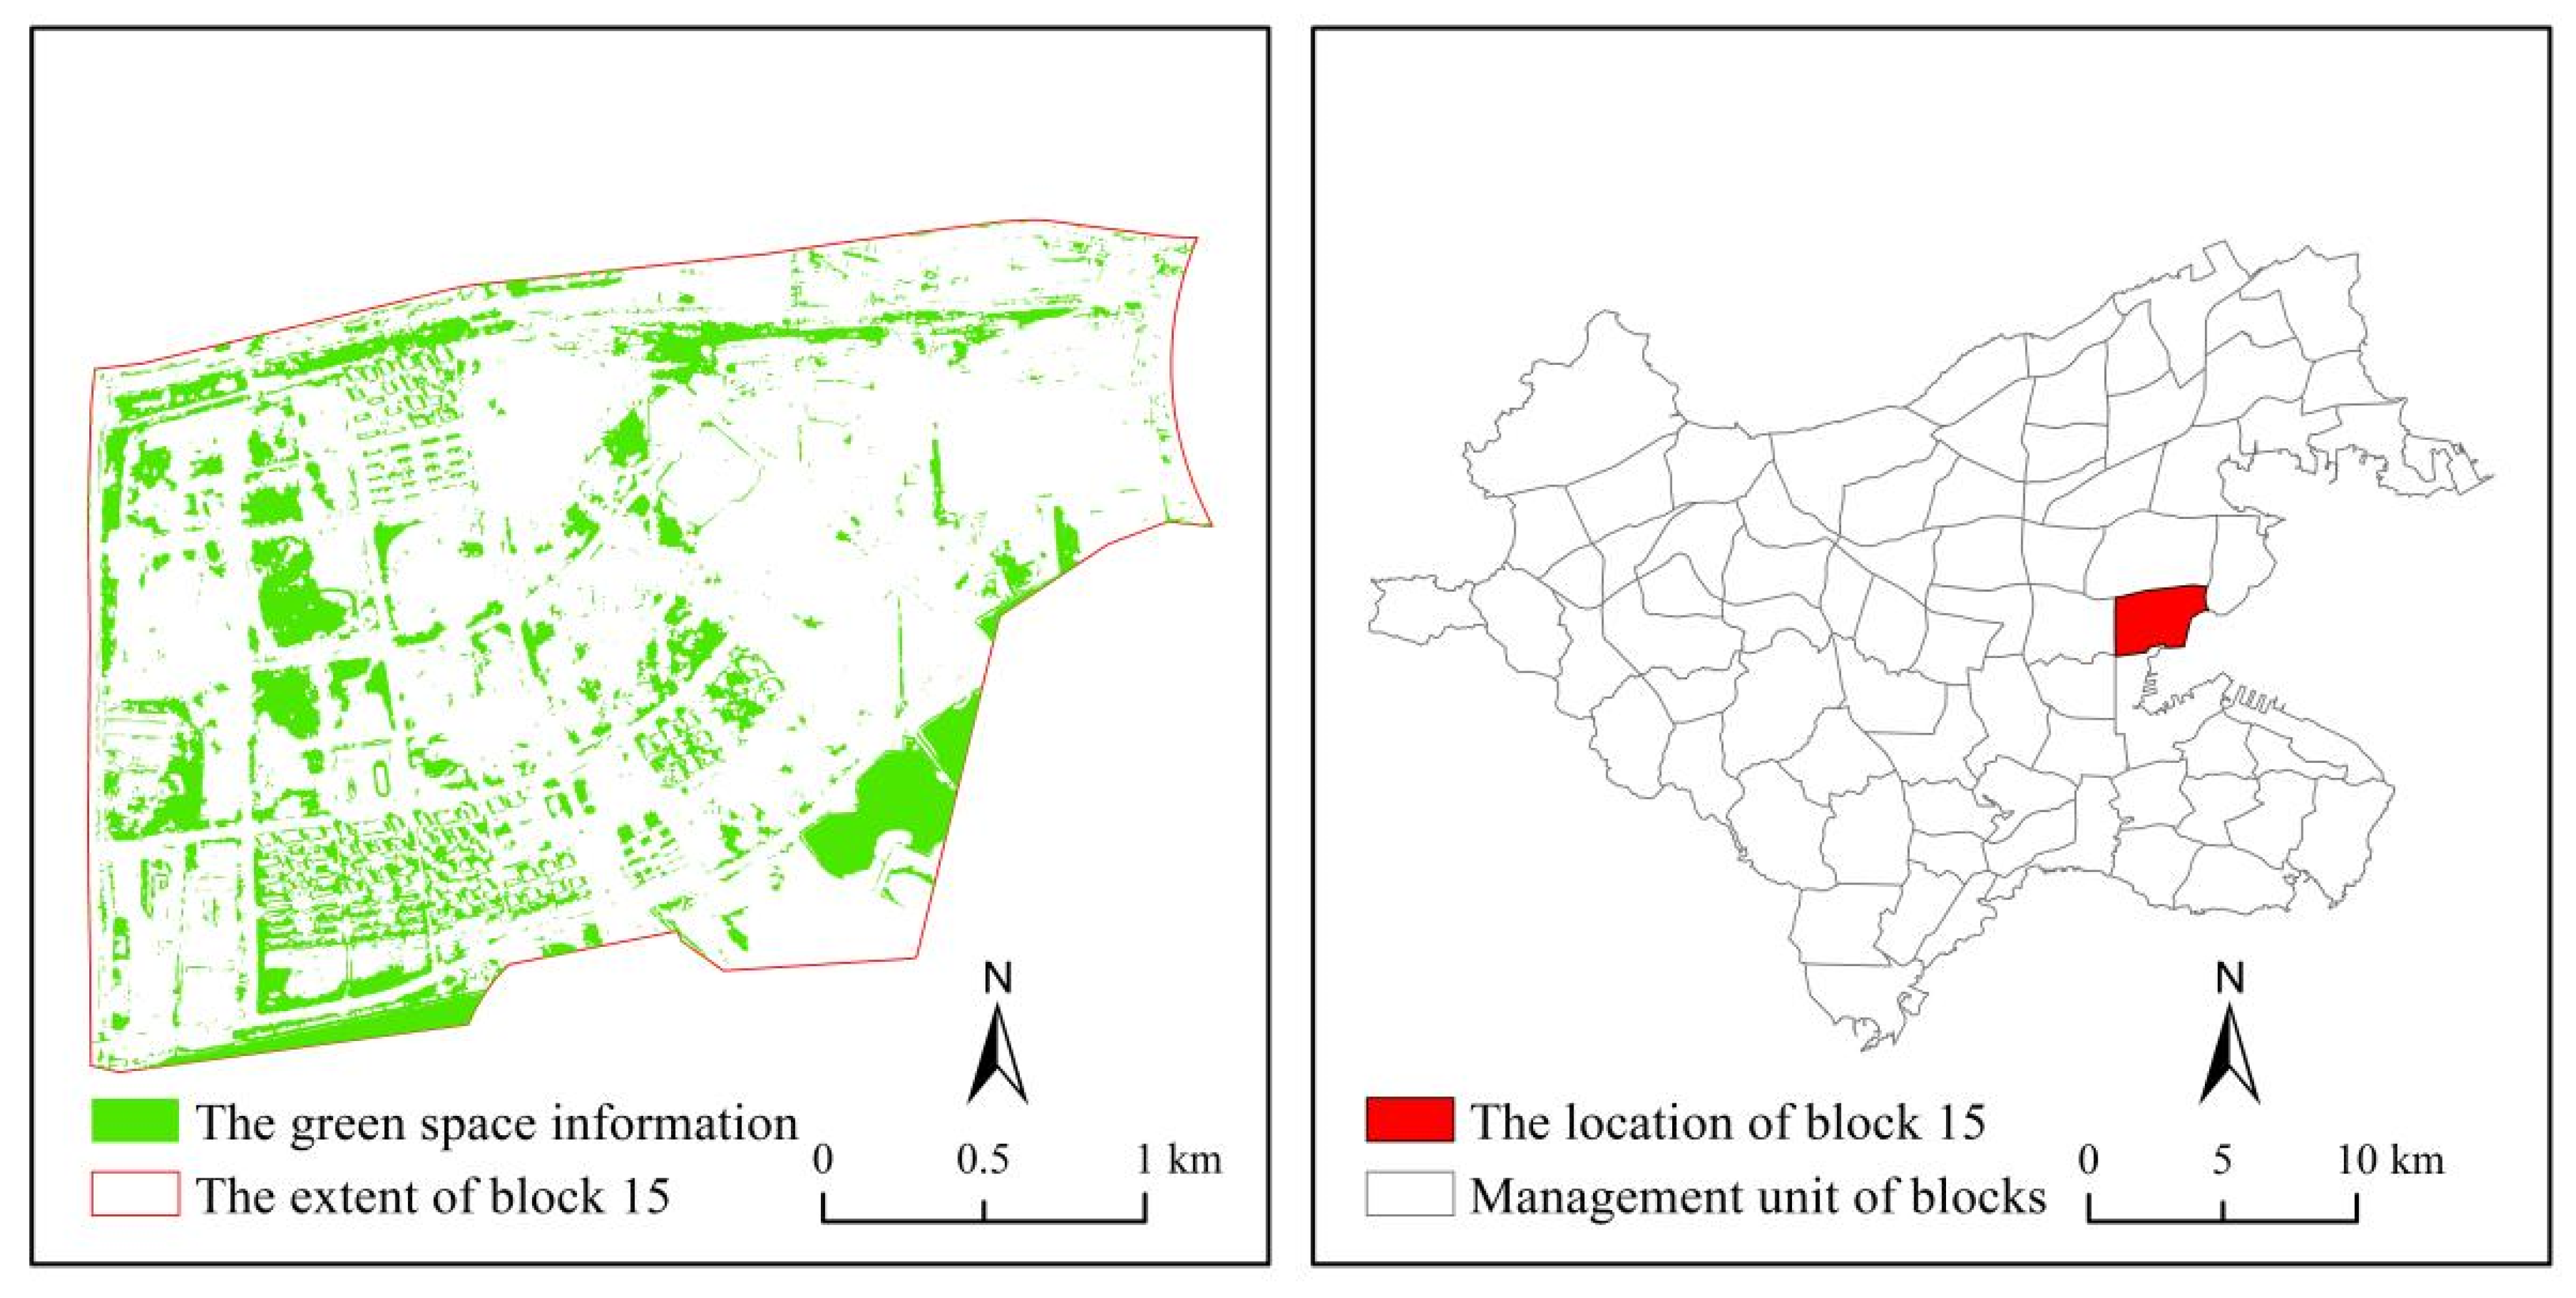
Figure 4, the goodness of fit coefficient R
2 is 0.9979, which indicates that the green space grid dimension of block 15 in Dalian City has fractal characteristics.
- (2)
Boundary dimension
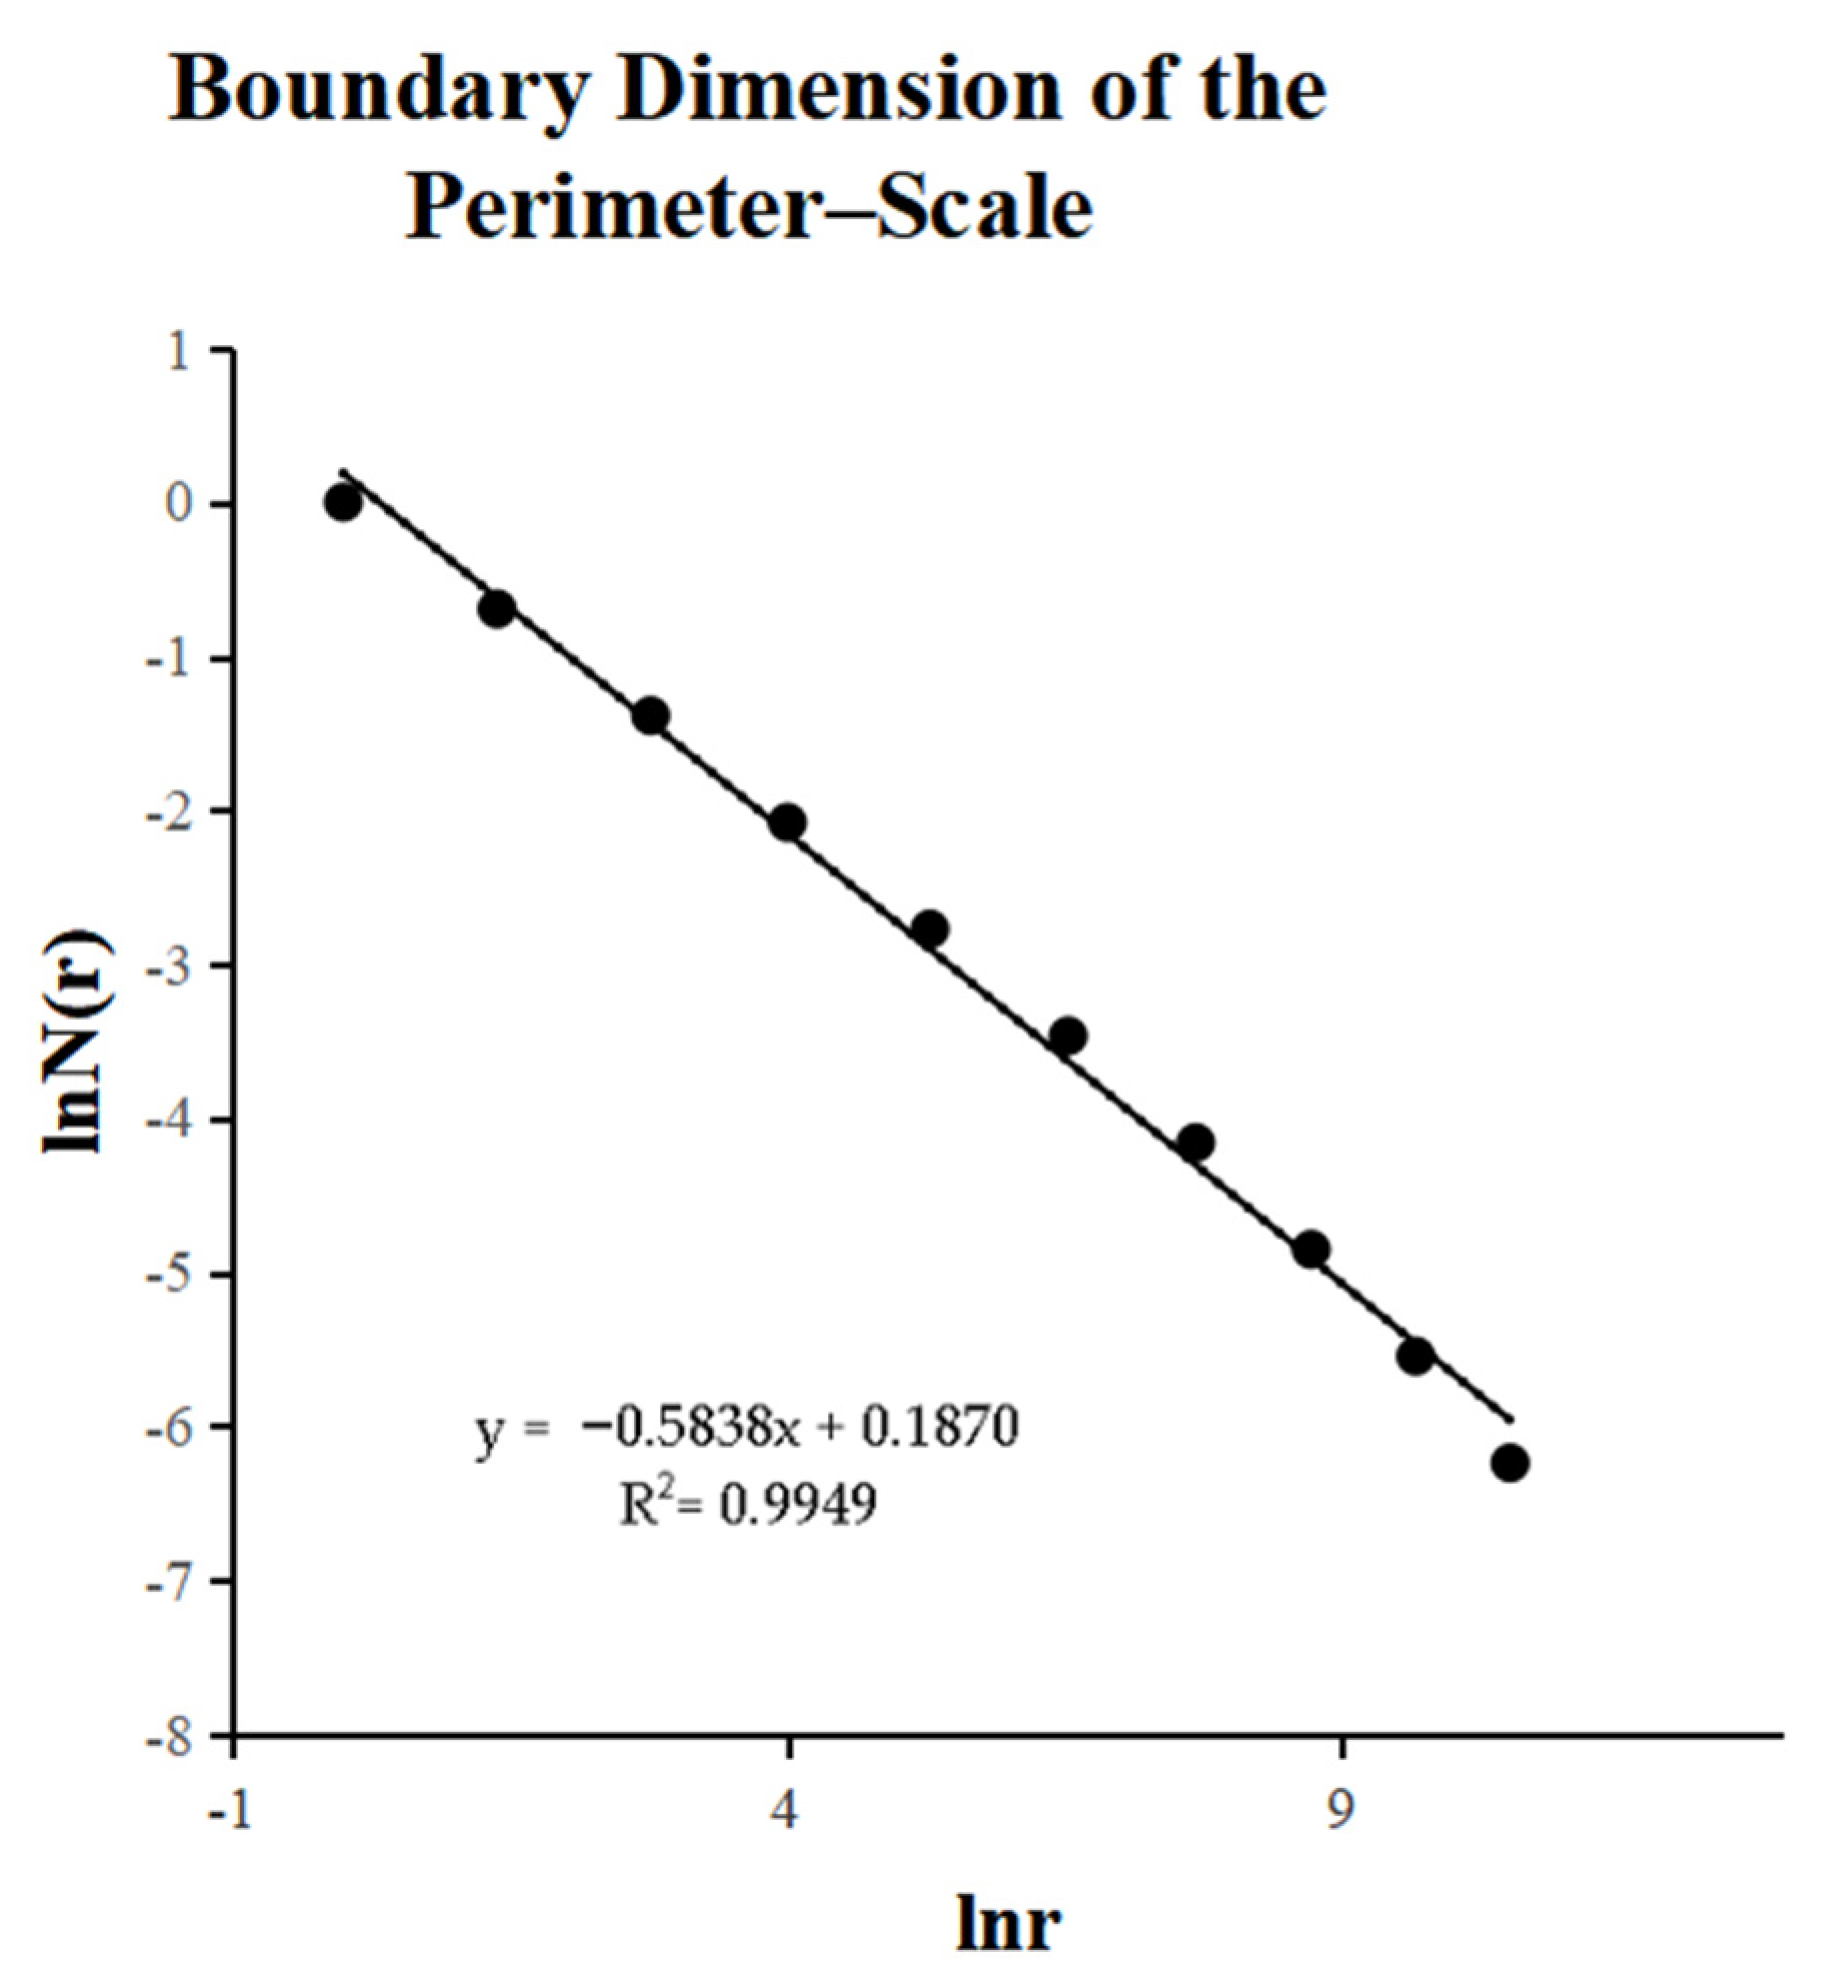
There are two ways to define the boundary dimension—based on the circumference–scale and area–perimeter relationships. The boundary dimension defined by the circumference–scale relationship can be realized by the box counting method, and the length
r of the rectangular side and the number of non-empty grids
N(
r) covering the boundary can be obtained according to fractal theory [
45]:
where
C represents an undetermined constant and
D represents the boundary dimension. As shown in
Figure 5, the goodness of fit coefficient R
2 dimension is 0.9949, which indicates that the boundary dimension of green space in block 15 of Dalian City has fractal characteristics based on the perimeter scale.
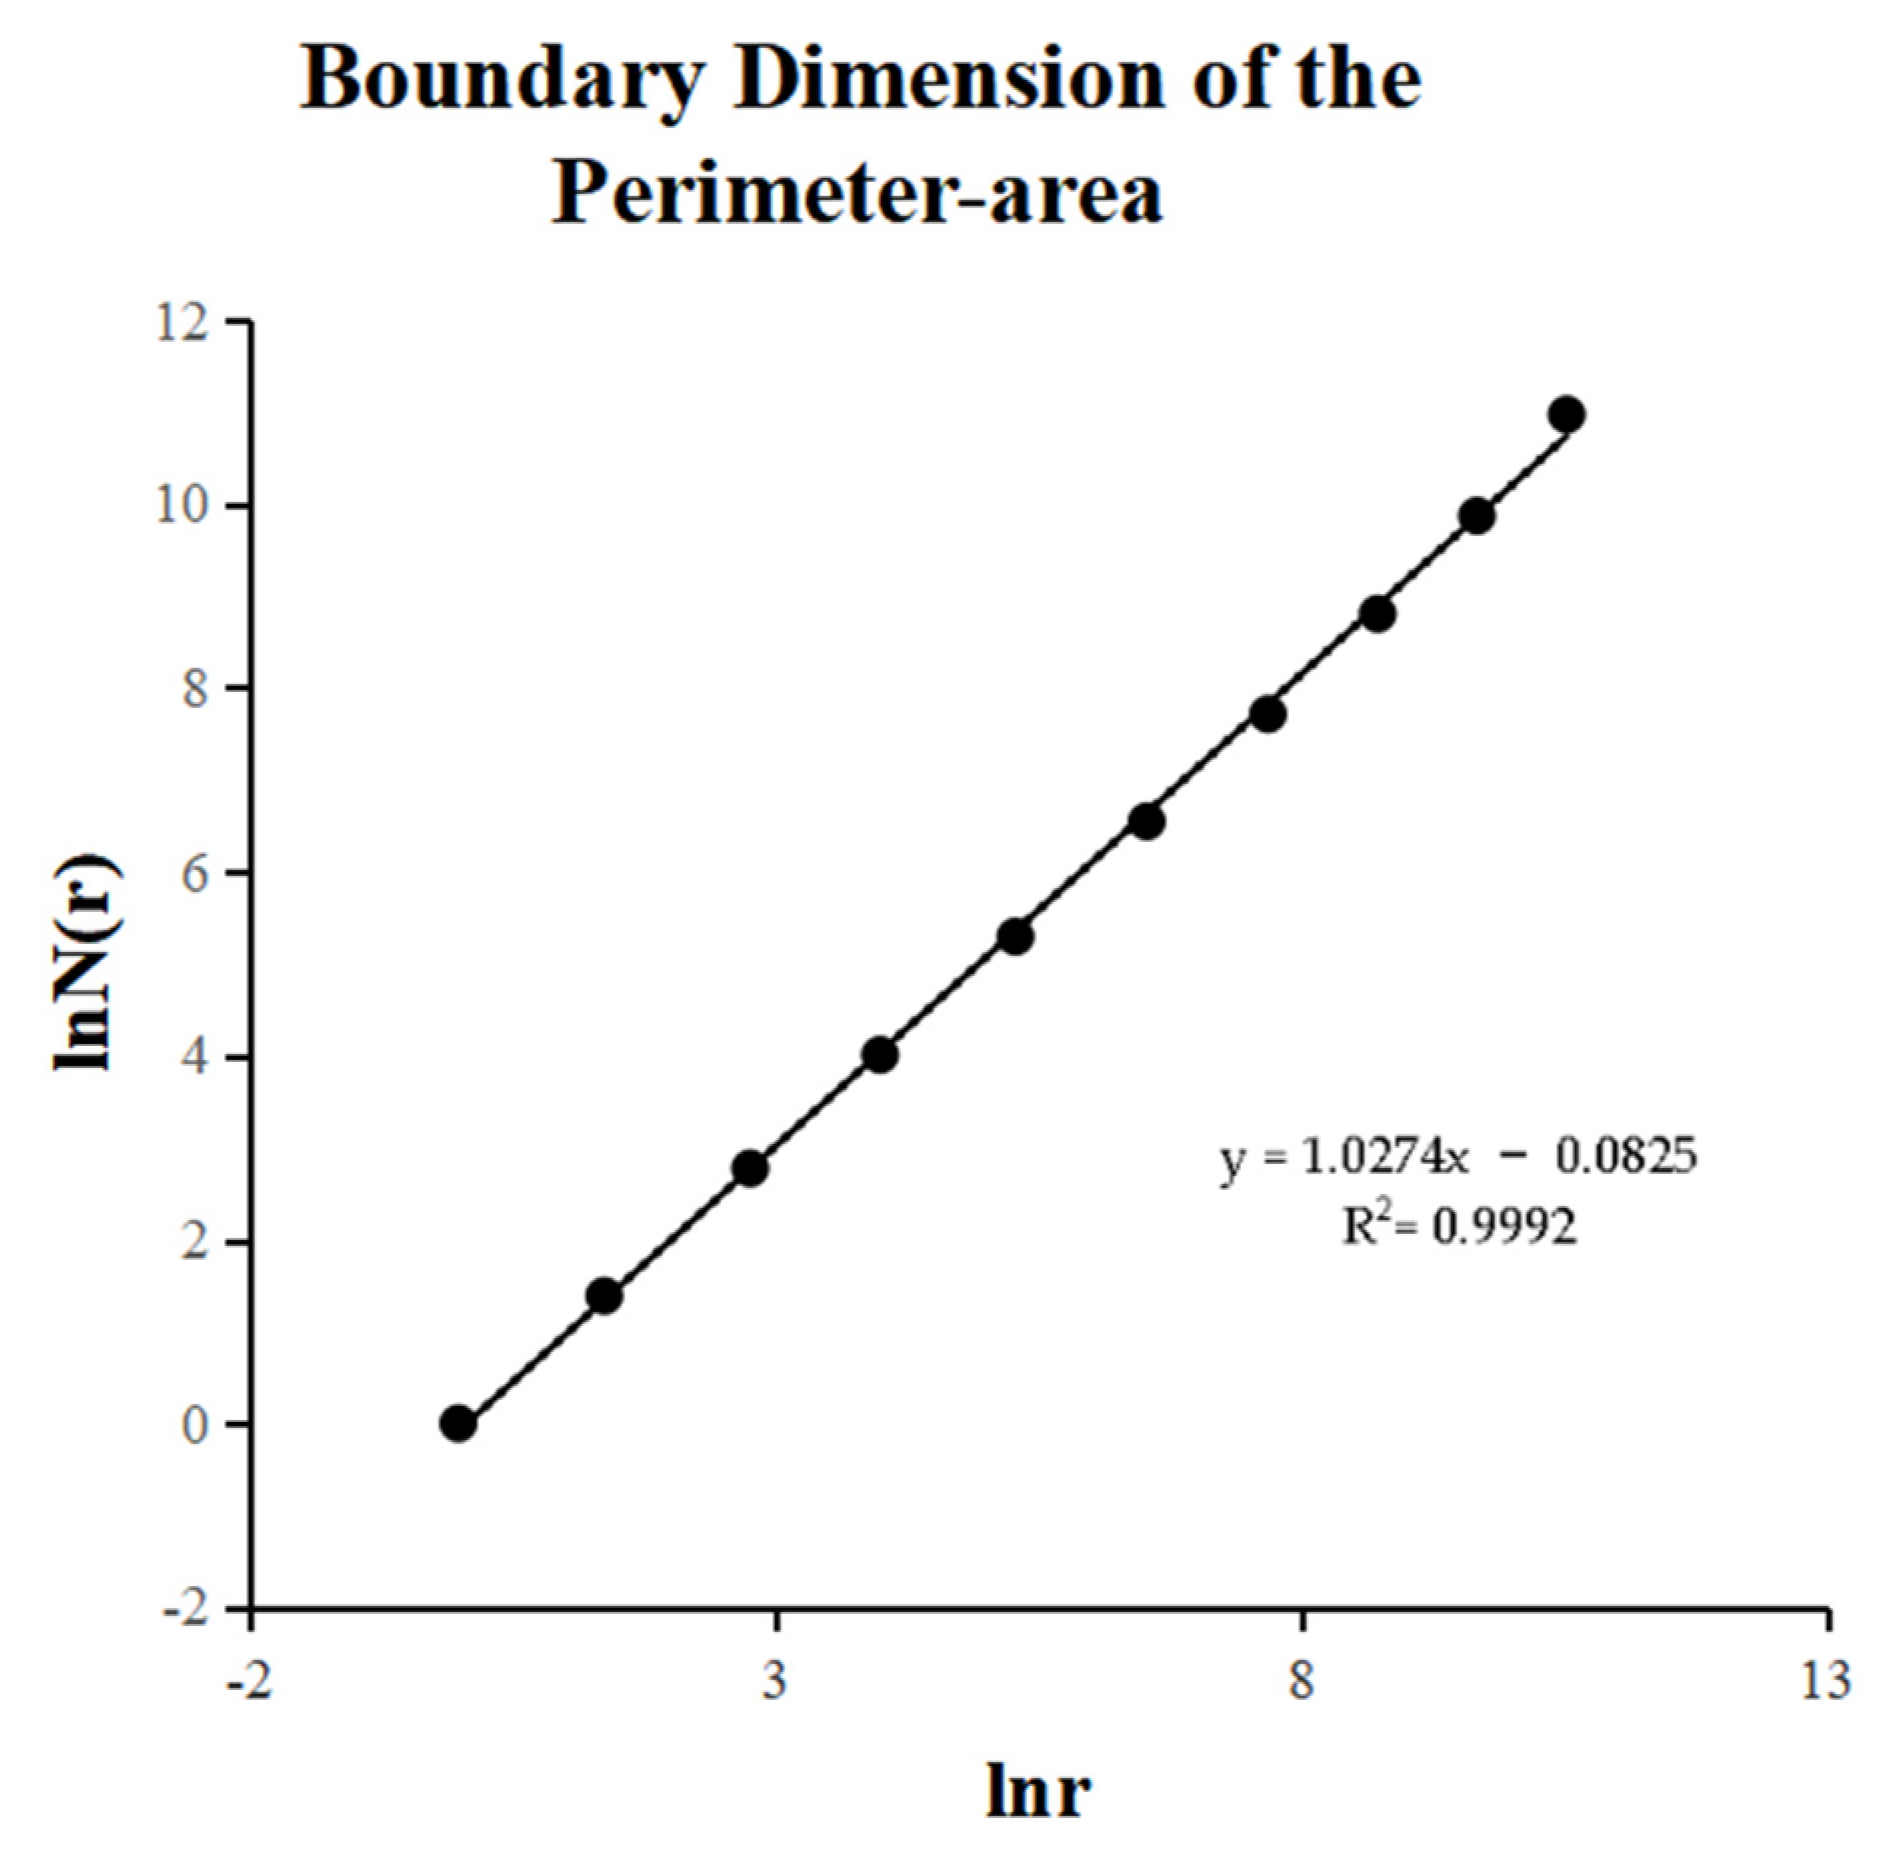
Based on the boundary dimension defined by the area–perimeter relationship, the main research premise assumes that a certain city land-use type is
a closed area, with areas
A and
P. We assume that the boundary of this area is a fractal line and is represented by dimension
D. Then, according to the geometric measurement relationship, we can obtain the following:
where
k represents a constant that needs to be determined. The double logarithmic transformation of the boundary dimension defined by the perimeter–scale relationship can be obtained as follows:
The fractal dimension was estimated using the box-counting method. The number of non-empty grids
N(
r) covering the boundary and the number of non-empty grids
M(
r) covering the area is as follows:
The boundary dimension defined by the perimeter–scale relationship can only reflect the complexity of the urban green space boundary. The larger its value, the more complex the boundary of urban green space will be. For the urban form, the value of
D ranges from 0 to 2. The boundary dimension defined by the area–perimeter relationship can reflect more information about the distribution of urban land-use to a certain extent. It can show both the complexity of the urban land-use boundary, the fragmentation degree of urban land-use, and the degree of stability of its land-use structure. Theoretically, for the overall urban land-use structure,
D is between 1 and 2. When
D < 1.50, the urban green space form is relatively simple; when
D = 1.50, the urban green space form is in a random state, similar to Brownian motion, and when
D > 1.5, the urban land-use structure is relatively complex. As shown in
Figure 6, the goodness of fit coefficient R
2 dimension is 0.9992, which indicates that the boundary dimension of the green space of block 15 in Dalian City has fractal characteristics based on the perimeter area.
3.3. Spatial Regression Analysis
This study used GeoDa 1.6 software and a spatial autoregression model to perform regression analysis on LST and the green space landscape index. Commonly used spatial autoregressive models include the spatial lag model (SLM) and spatial error model (SEM). which are calculated as follows [
46].
where
Y represents the dependent variable (LST),
X represents the independent variable (various green landscape indices),
β represents the regression coefficient,
μ and
ε are random error terms,
W represents the spatial adjacency weight matrix,
ρ represents the regression coefficient of the spatial lag term, and
λ represents the regression coefficient of the spatial residual term.
In the model index selection, the dependent variable was the urban thermal environmental index. To compare the influence of the green quality and green space structural indices on the thermal environment, two indices were added as explanatory variables. The final explanatory variables were the green space boundary dimension (X1) estimated by the perimeter–scale model, green space boundary dimension (X2) estimated by the perimeter–area model, green space grid dimension (X3), green space area (X4), and green space perimeter (X5). The fractal index of green space is a structural index that reflects the green space area and perimeter after calculation using the green space area and green space perimeter data. The green space area (X4) can be compared with the grid dimension (X3), and the green space perimeter (X5) can be compared with the boundary dimension (X1) estimated using the girth–scale model.
3.4. Inconsistency Index
The matching relationship (spatial distribution inconsistency) between the urban green space fractal characteristics and LST was quantitatively analyzed using the inconsistency index. The calculation formula is as follows [
47].
where
Ti and
Gi represent the mean surface temperature of the
ith grid and the fractal dimension of green space, respectively; ∑
Ti and ∑
Gi are the cumulative mean temperature and fractal dimension of the study area, respectively;
RTi represents the proportion of the mean surface temperature of the
ith grid in the cumulative mean temperature of the study area; and
RGi represents the proportion of the fractal dimension of the
ith grid in the sum of the studied discriminative dimensions. The higher the values of
RTi and
RGi, the higher the clustering degree of the grid to LST and the green space fractal dimension. The inconsistency index,
Ii, is the ratio of the two agglomeration indices. The closer the value is to 1, the more similar the change trend of the two agglomeration indices, and there is better synergy (consistency) between them. The more the absolute value deviates from 1, the less coordinated the spatial distribution of the two agglomeration indices.
As the city is a constantly changing system with complex characteristics, there are few cases where the inconsistency index is 1; therefore, the results of the inconsistency index calculation are divided into three types considering a dynamic error of ±5%. When Ii ≤ 0.95, the fractal agglomeration of green space is ahead of the surface temperature agglomeration; that is, green space is the leading type. When 0.95 < Ii < 1.05, it is the coordination between green space fractal and LST agglomeration, that is, the relative coordination type. When Ii ≥ 1.05, the fractal agglomeration of green space lags behind the agglomeration of LST; that is, it is a backward type of green space.
4. Result Analysis
4.1. Spatial Pattern of the Urban Thermal Environment
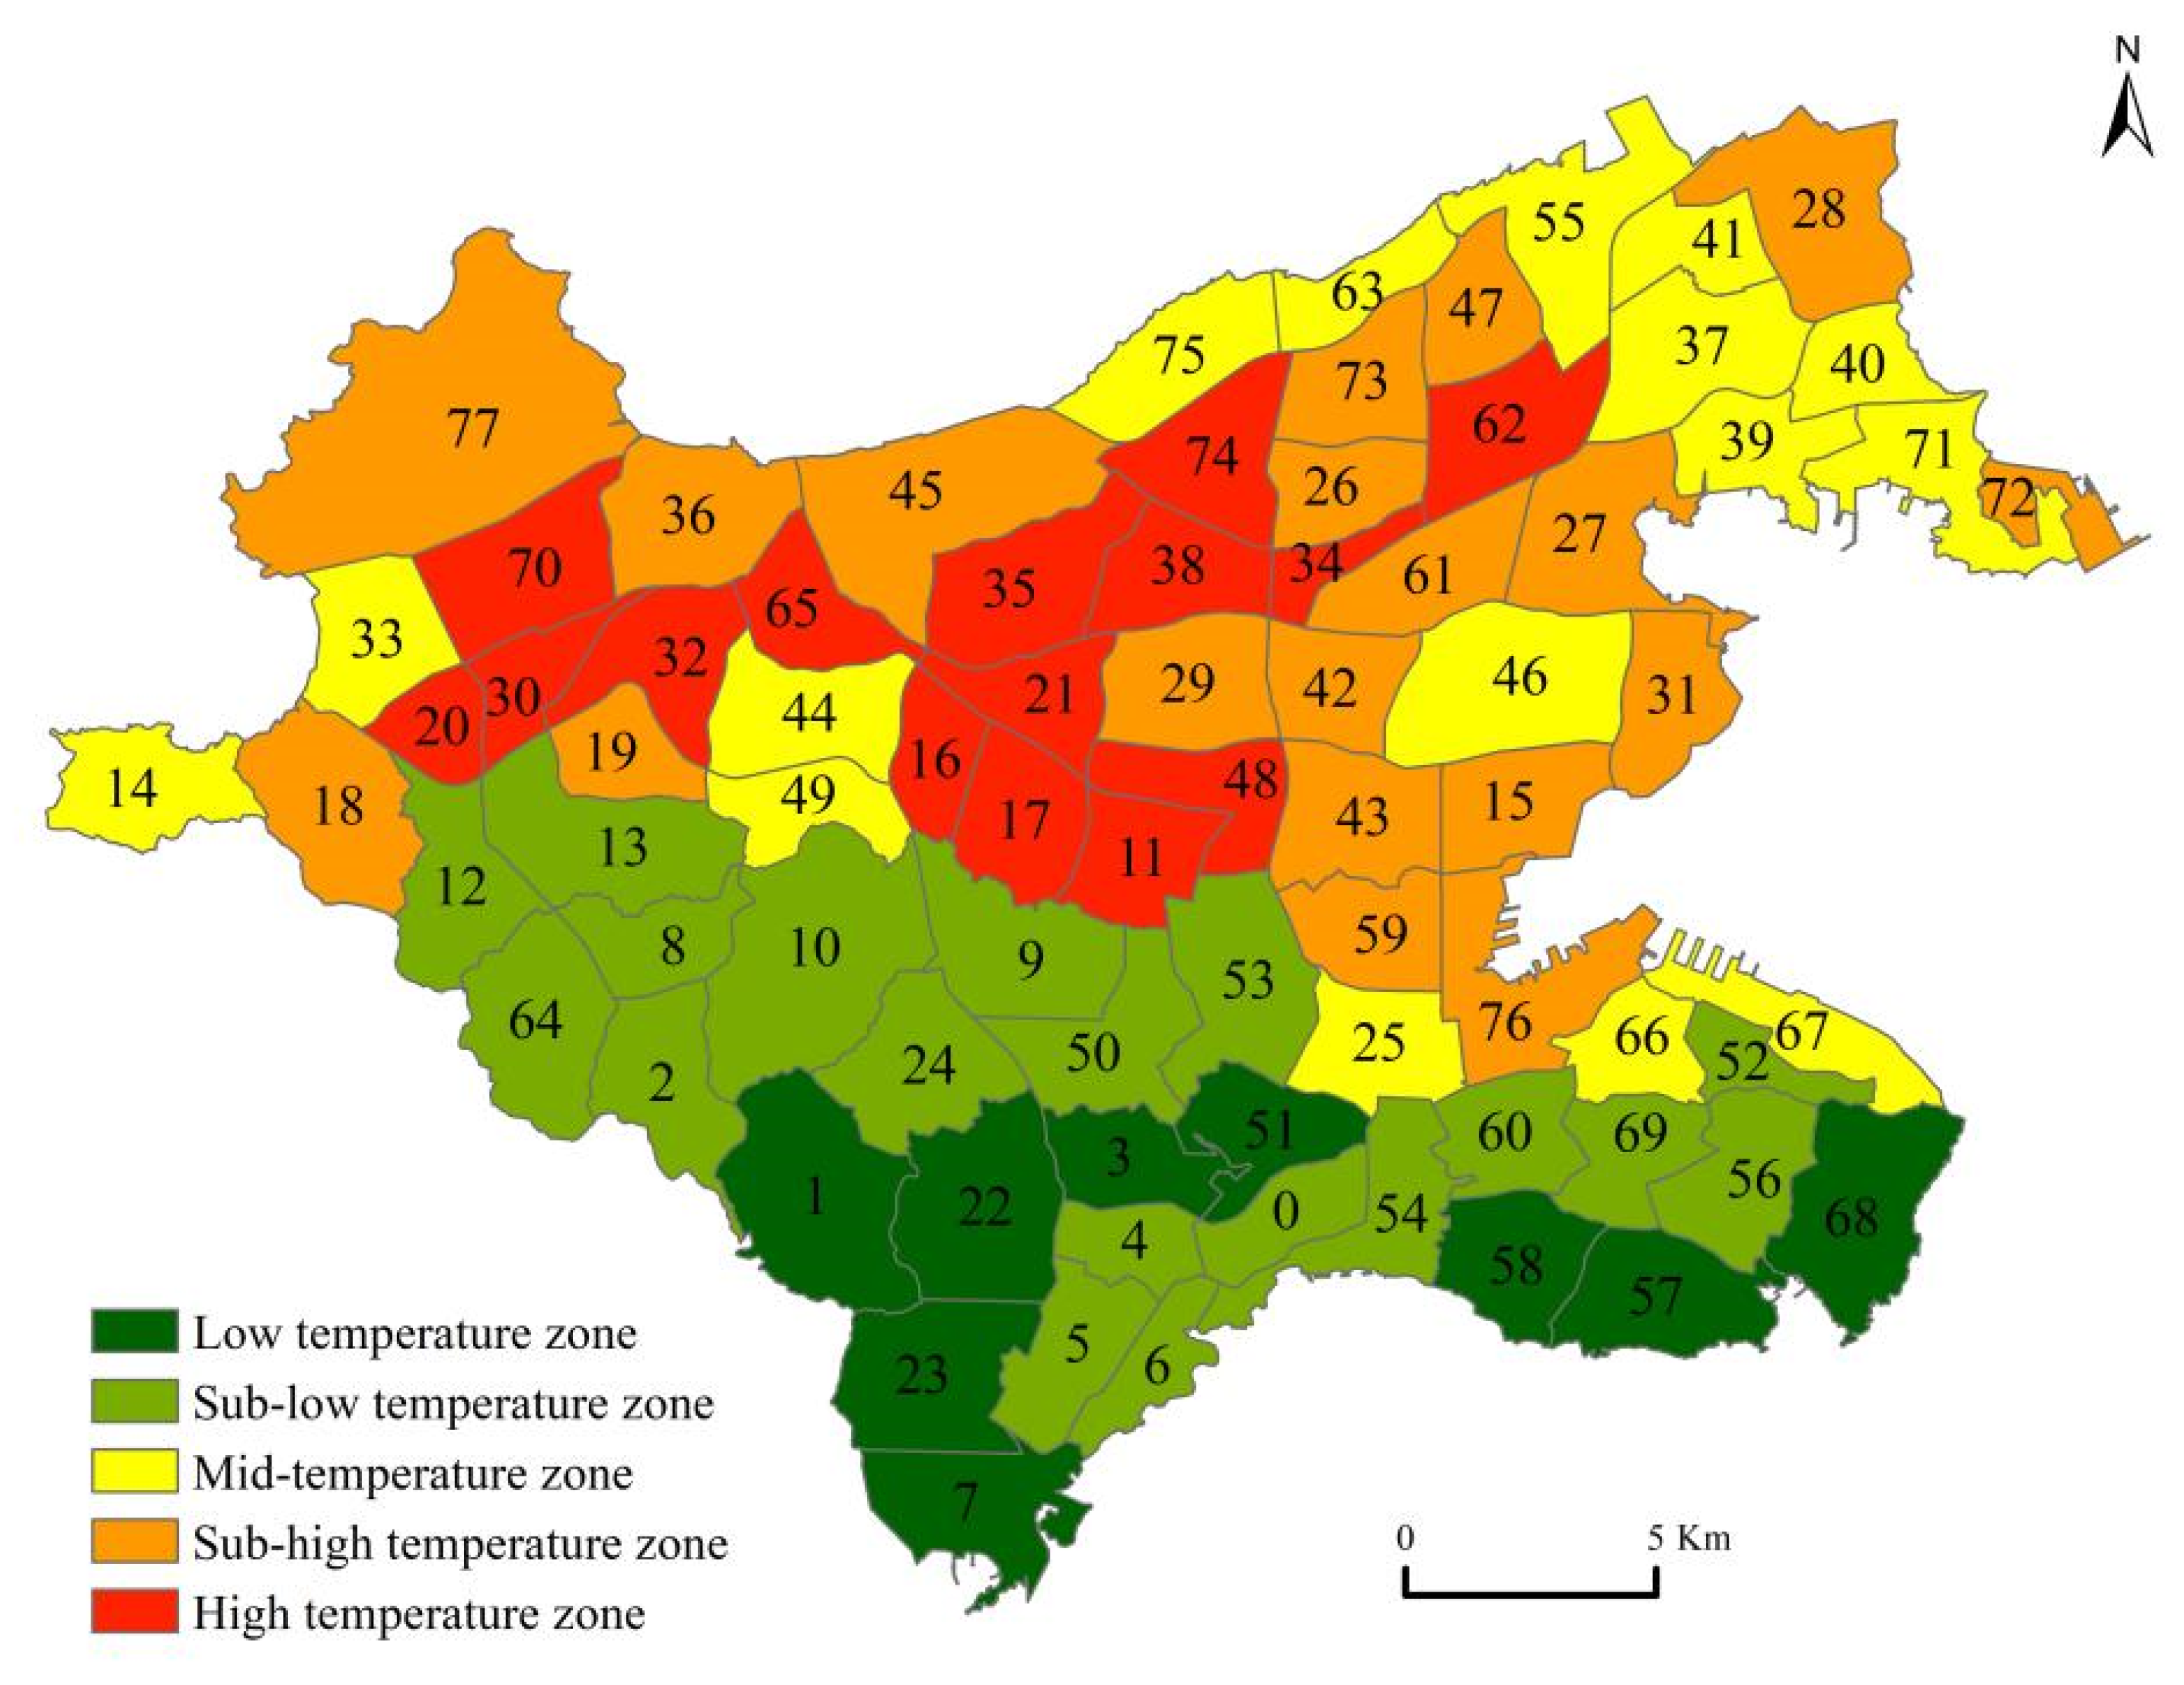
The thermal environmental effect in Dalian is notable, and there are obvious spatial differences among the different areas. Using the natural breakpoint method in ArcGIS, the average temperature of the Earth’s surface was divided into five low-temperature grades in Dalian—low temperature, sub-low temperature, medium temperature, sub-high temperature, and high temperature—to directly show the average surface temperature distribution in 2019 for each district block in Dalian (
Figure 7).
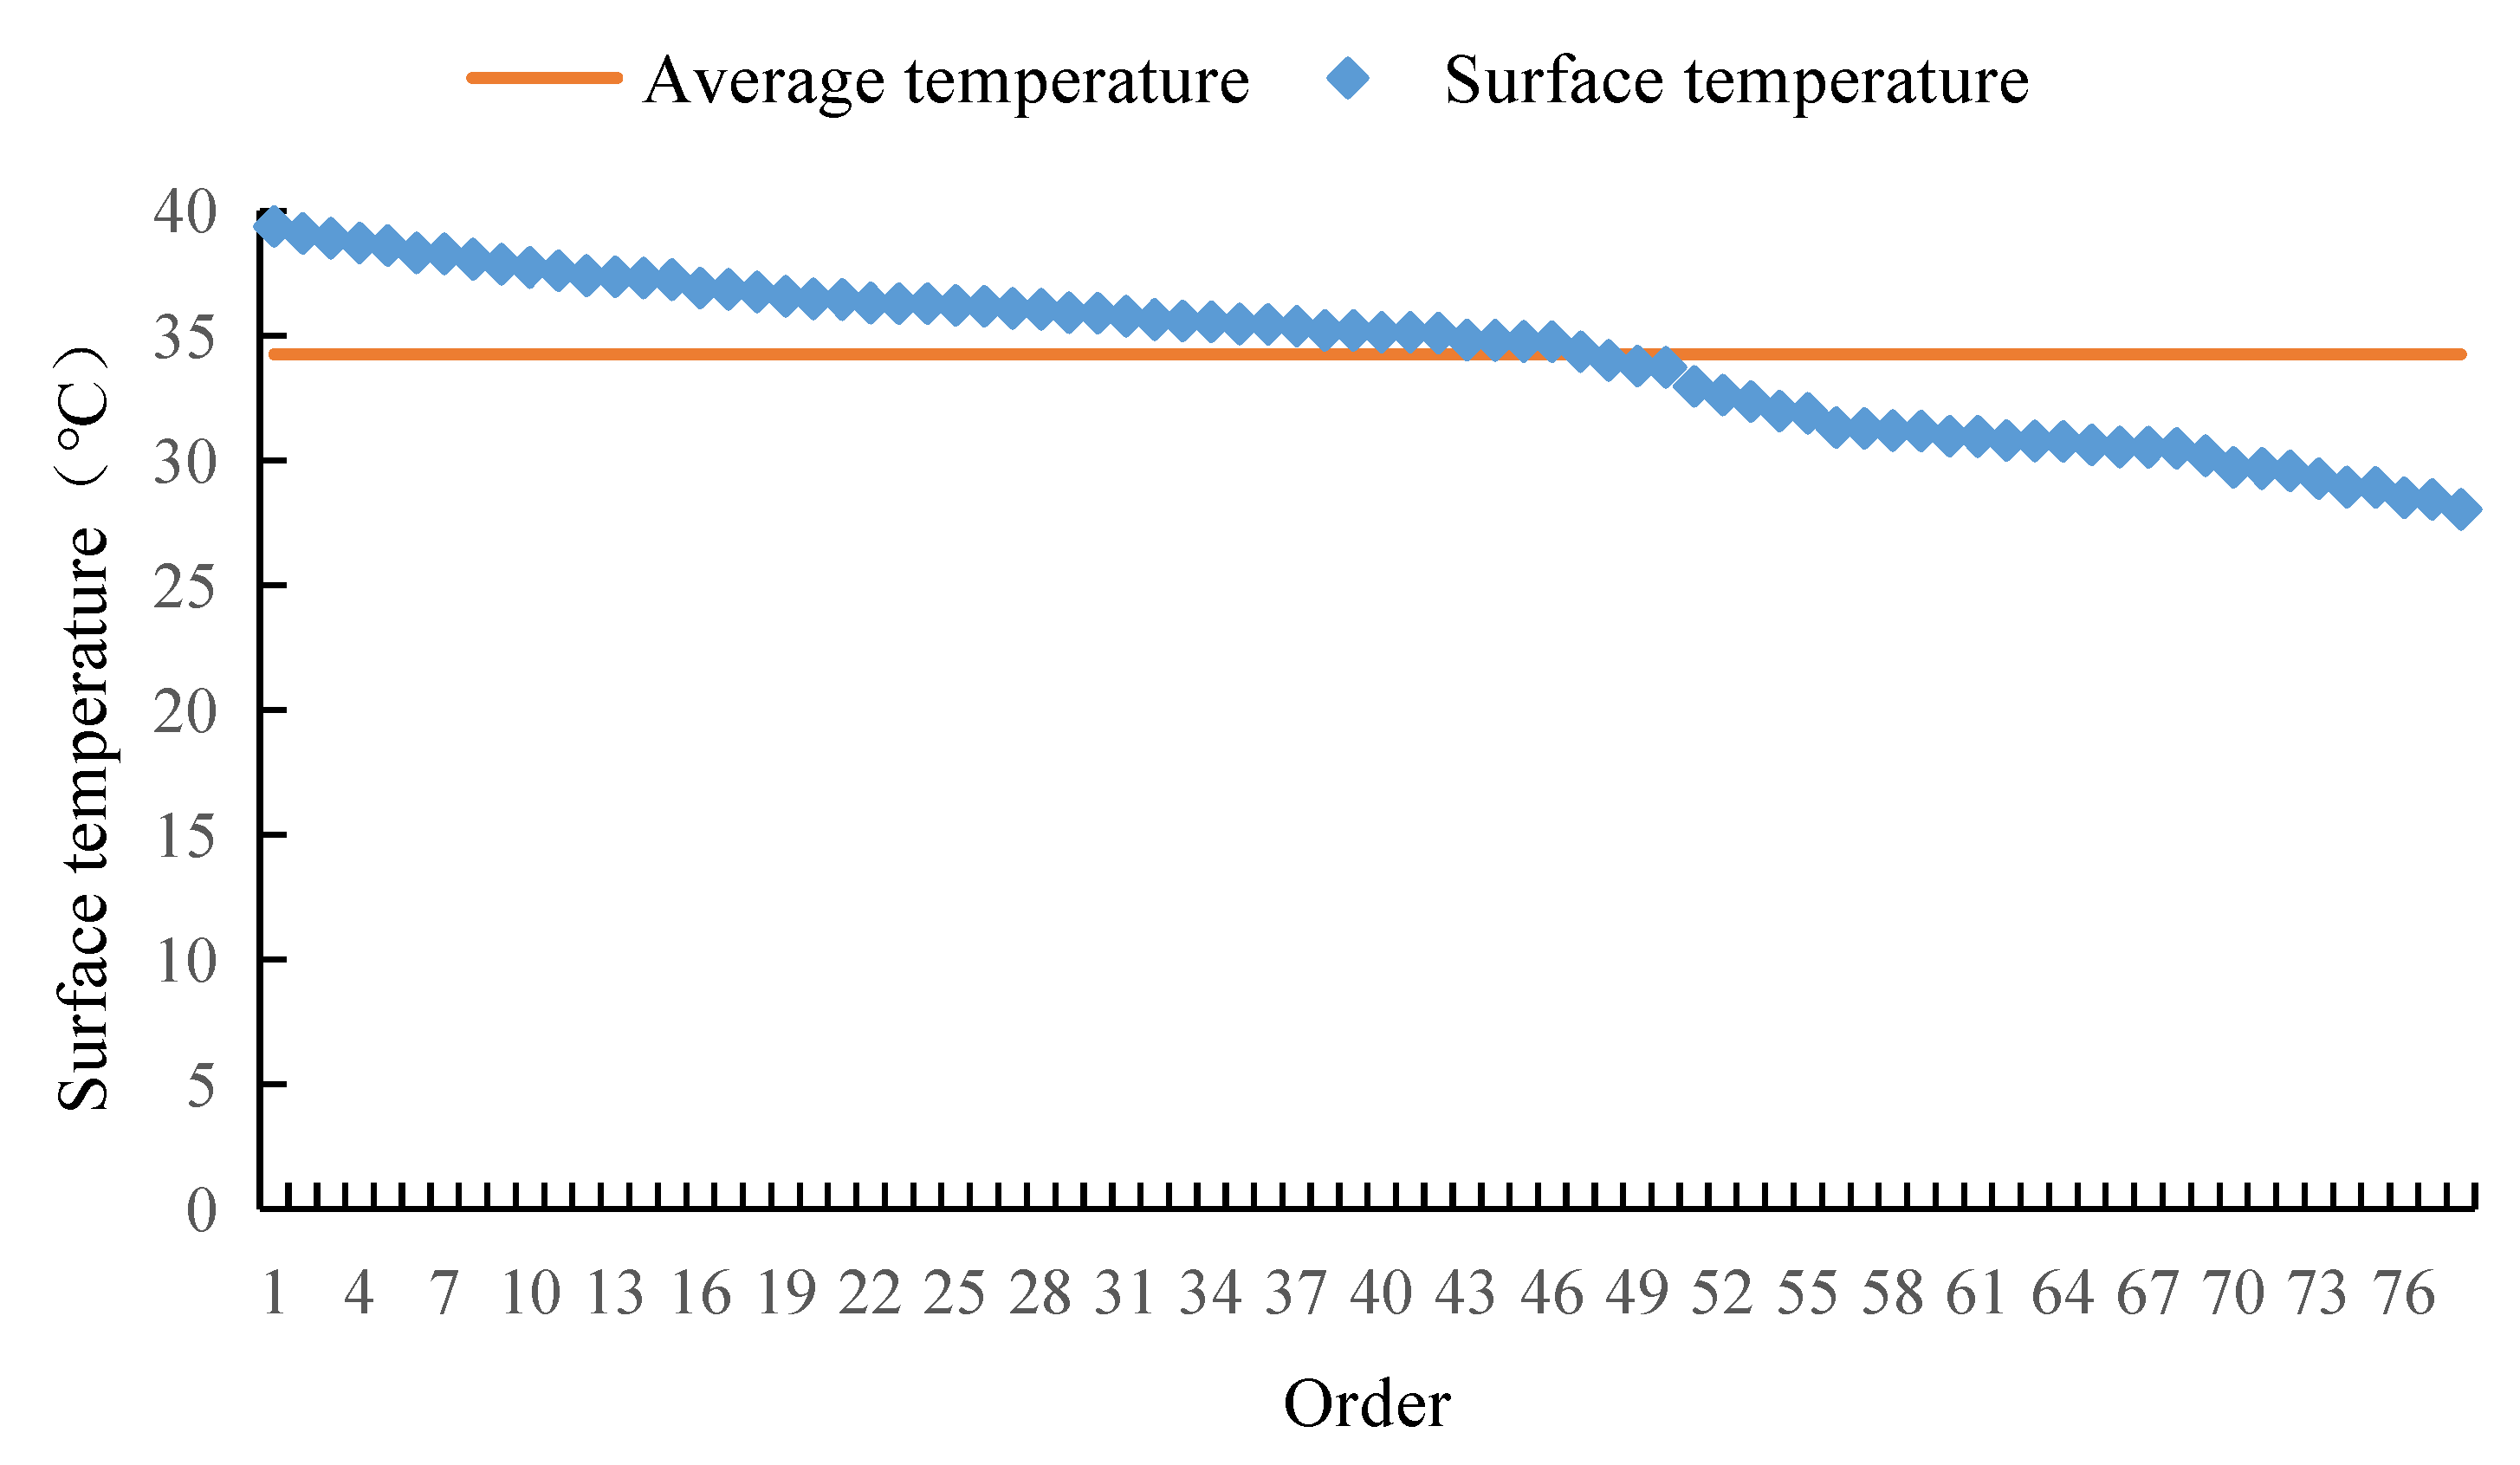
Figure 7 shows a pattern of gradual increase from the coastal low-latitude area to the inland high-latitude area, indicating a spatial distribution structure that is “high in the central area and low in the surrounding area.” Among the blocks, the high-temperature area forms a distribution pattern of continuous agglomeration in central Dalian. The highest surface temperature of the blocks in Dalian was 39.37 °C, the lowest was 28.04 °C, and the average was 34.25 °C. The surface temperatures of the 47 blocks were higher than the average surface temperature of the main urban area of Dalian, accounting for 60.26% of the total number of blocks (
Figure 8). To some extent, this shows that the surface temperature of the blocks in Dalian is relatively high, and the urban thermal environmental effect is obvious.
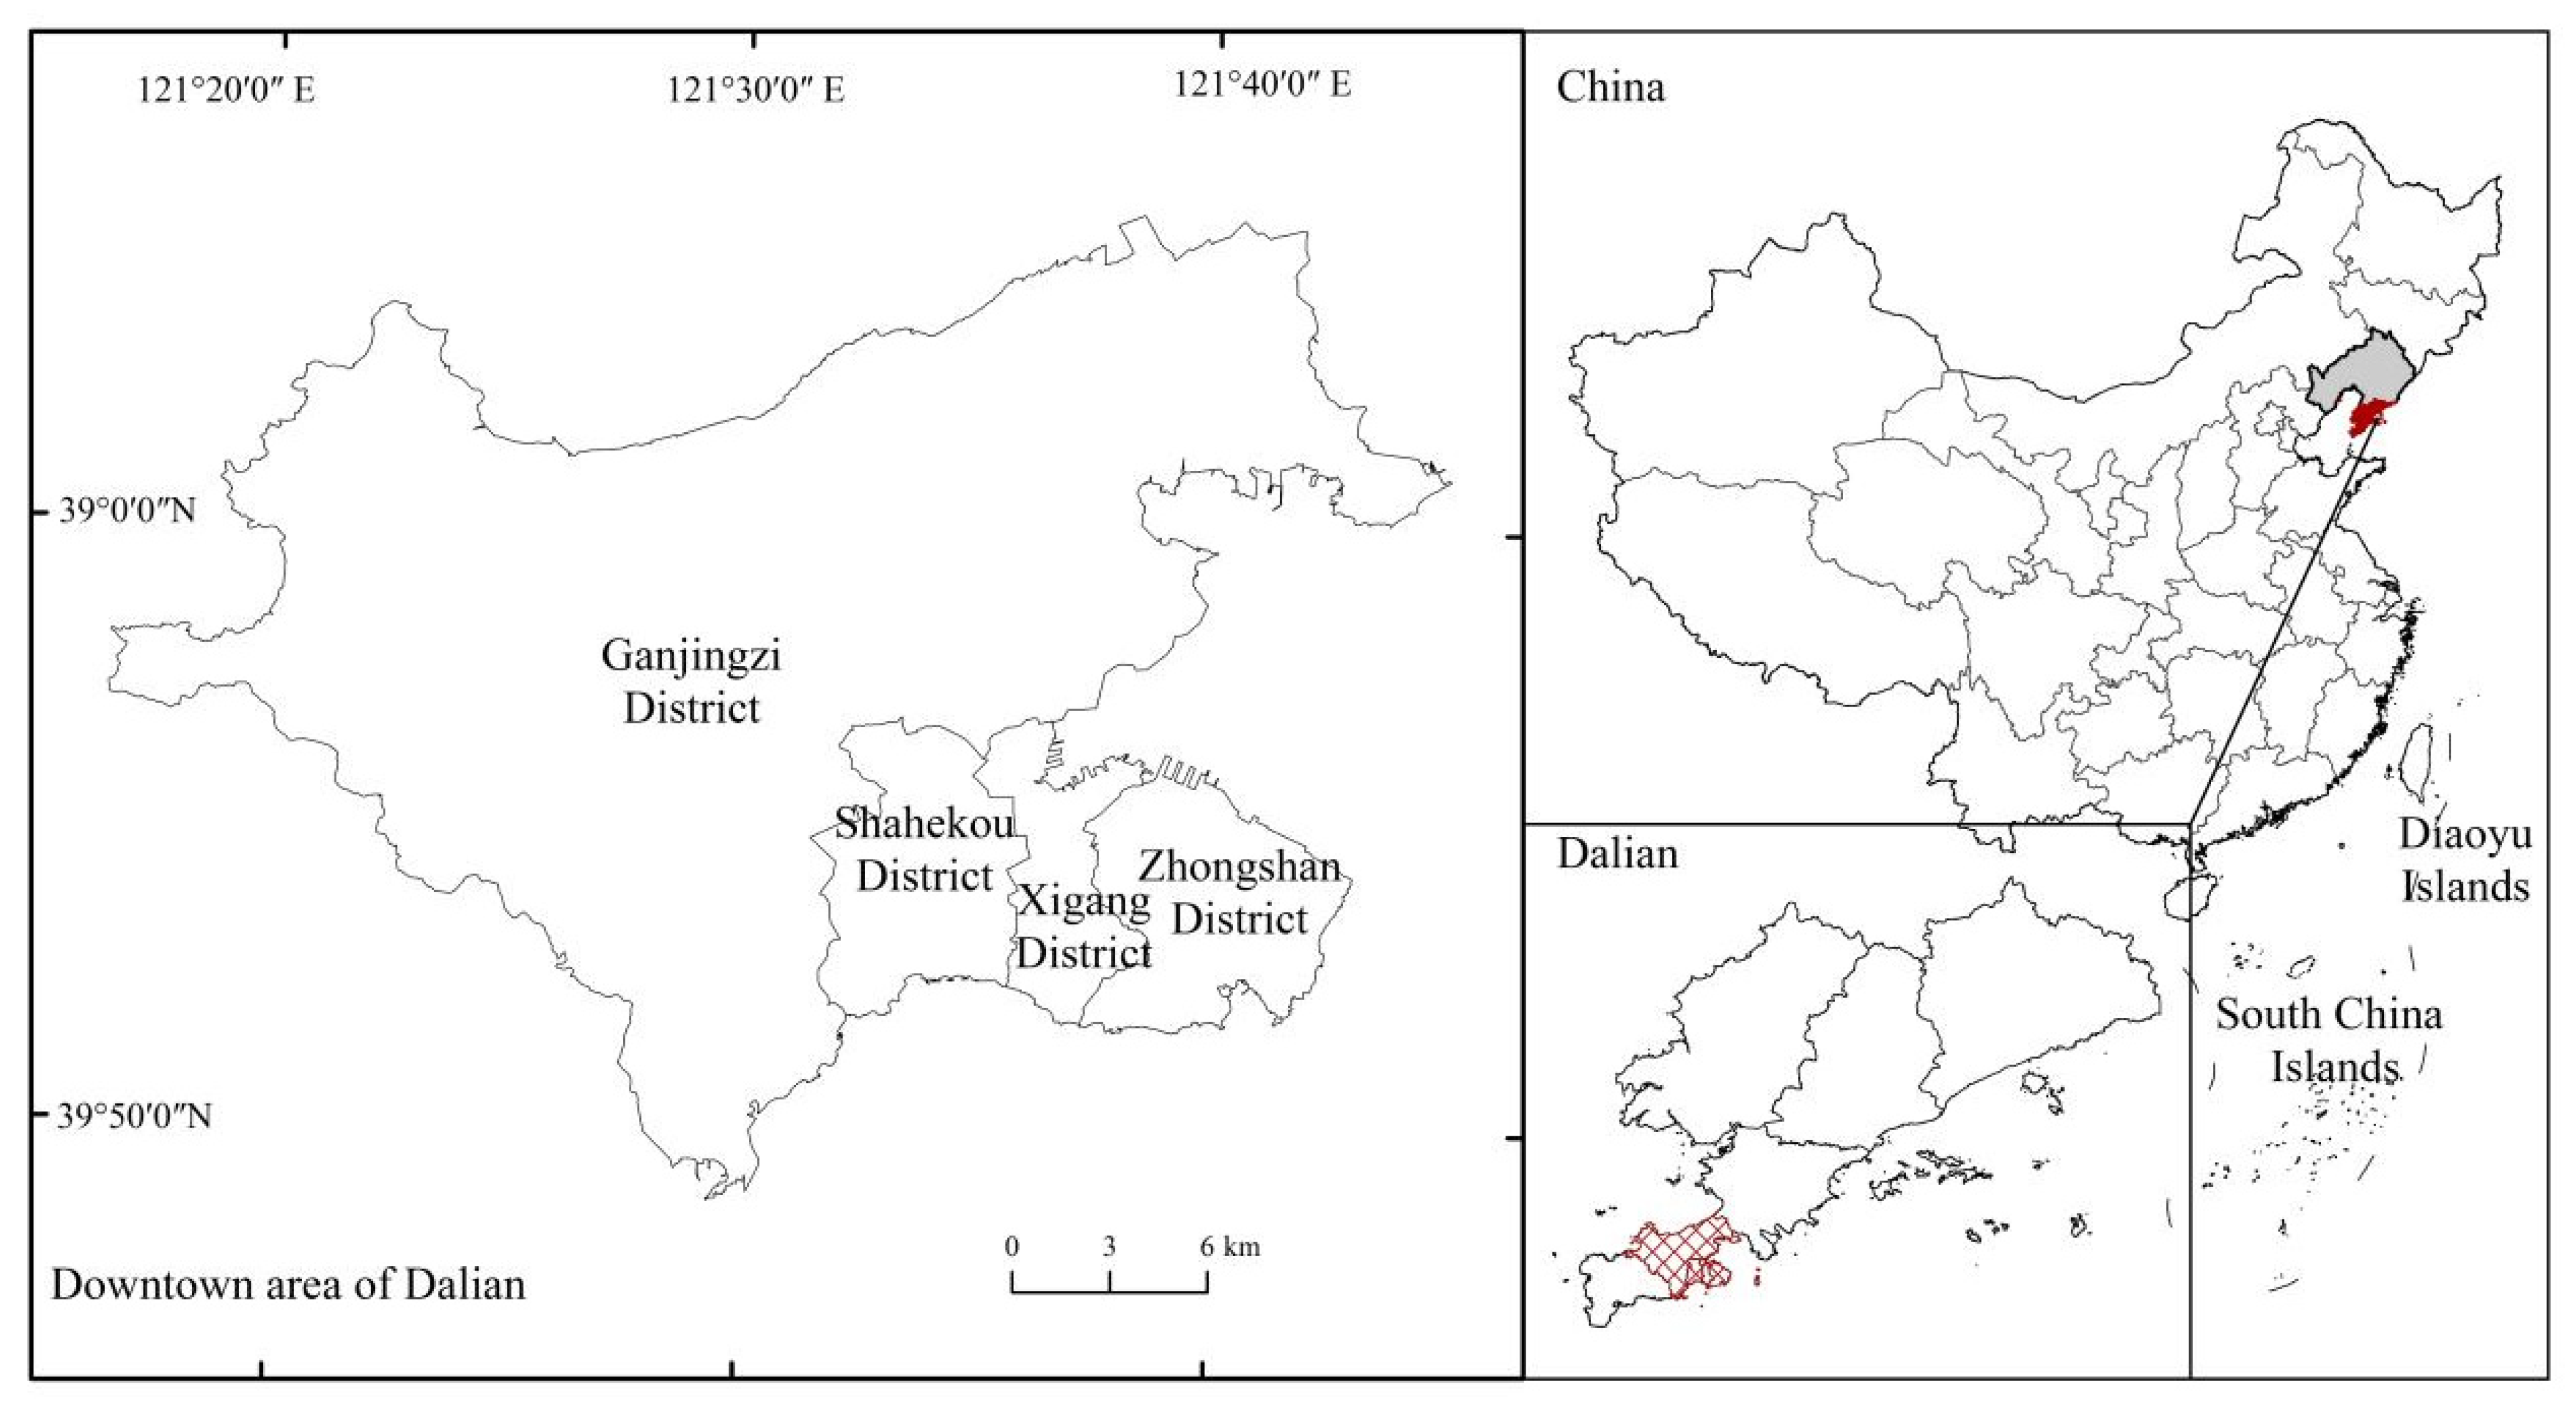
Overall, the proportion of LST at all levels in Dalian was uniform. The proportions of low temperature, sub-low temperature, medium temperature, sub-high temperature area, and high temperature areas were 11.54%, 24.36%, 20.51%, 24.36%, and 19.23%, respectively, showing that sub-high temperature and sub-low temperature areas were the main areas overall. In addition, the areas with high LST were mainly concentrated in Ganjingzi District at the edge of the downtown area, which differs from the spatial layout of the general urban heat island effect. The main reasons for the difference are as follows. First, the thermal environment index of this study is expressed by the surface temperature, which differs from the air temperature in the region. Second, there are many industrial enterprises in the area along the edge of Dalian, and the heat released by industrial production and other activity has a direct impact on surface temperature. Third, the environmental quality of green space in the area along the edge of Dalian is low, and the effect of green space on alleviating the thermal environment is not obvious.
4.2. Spatial Pattern of Urban Green Space Fractal Characteristics
4.2.1. Grid Dimension Analysis
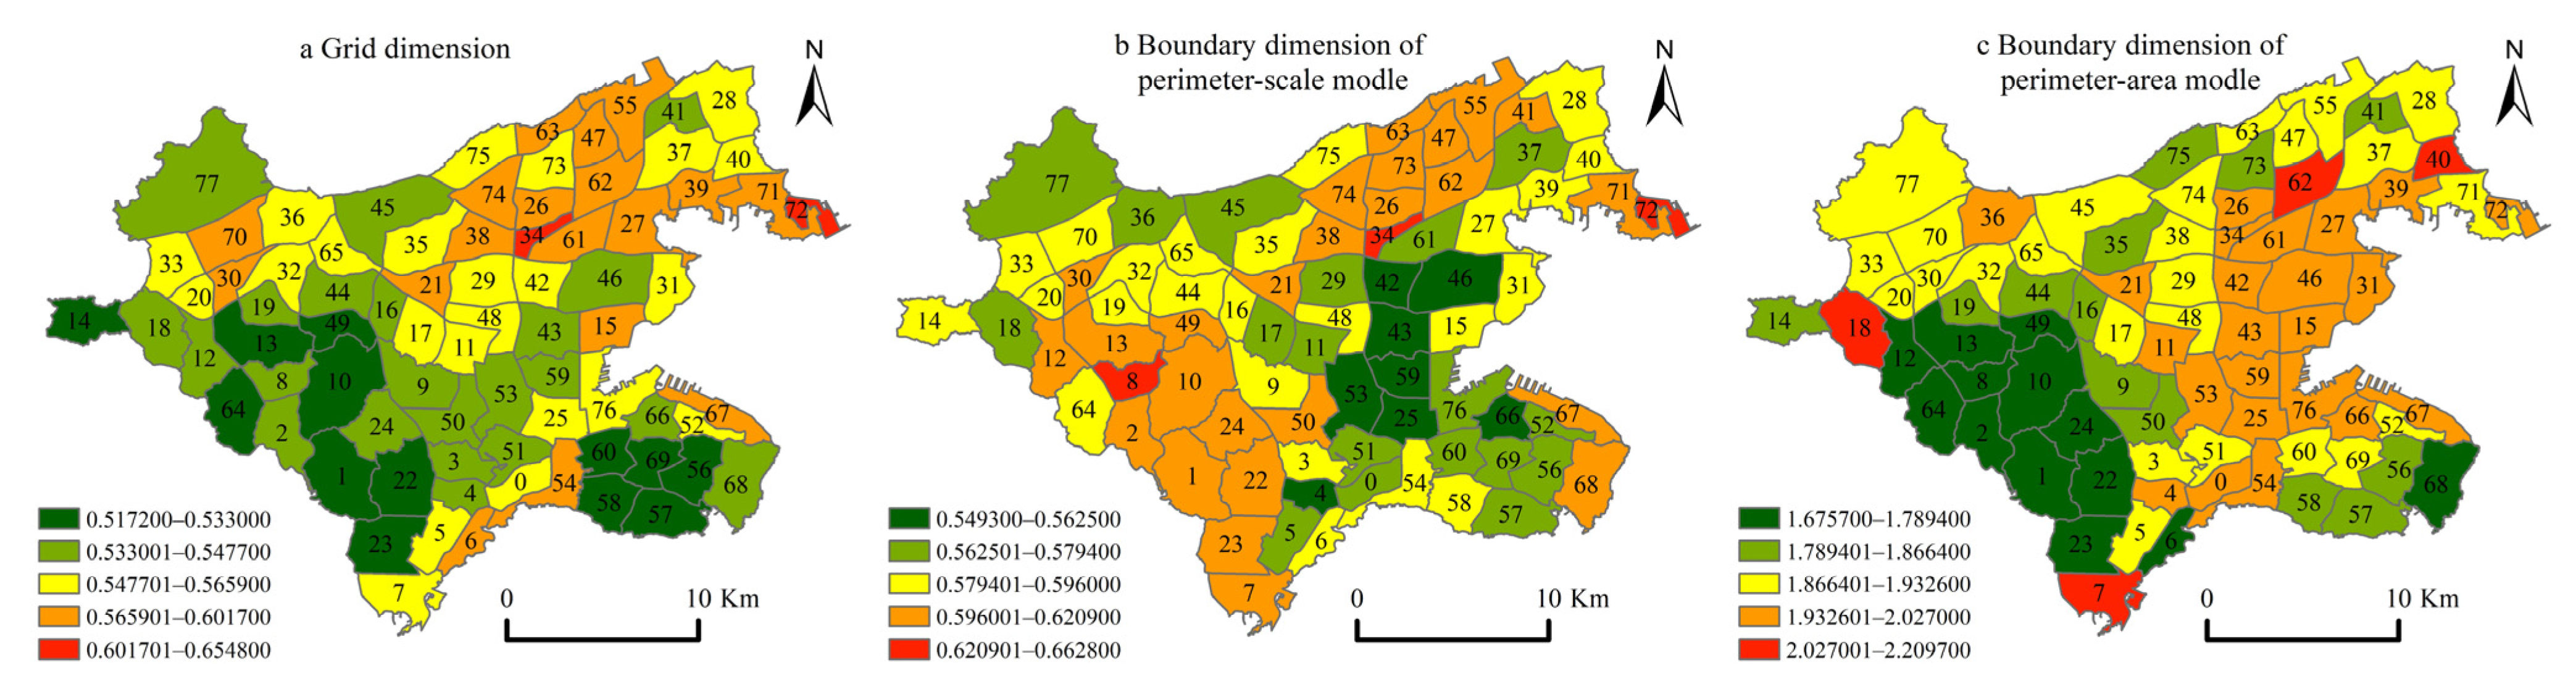
The grid dimension of green space in Dalian presents a “double core” spatial distribution structure with No. 34 and No. 72, with obvious local differences (
Figure 9). Among them, the concept of “dual core” is mainly derived from the theory of urban spatial structure, which refers to the distribution structure of two centers in the inner space of a certain geographical phenomenon [
48]. In Dalian, there were 13 blocks with values between 0.5172 and 0.5330. The green space grid dimension of 17 blocks was between 0.5330 and 0.5477, and there were 28 blocks with values between 0.5477 and 0.5659. There were 18 blocks with values between 0.5659 and 0.6017, and two blocks with values between 0.6017 and 0.6548, which shows that the grid dimension of Dalian green space has non-equilibrium characteristics.
The grid dimension of the green space in 78 blocks of Dalian was between 0.5172 and 0.6548, and the fitted R2 was greater than 0.996, showing that the fractal characteristics of the green space grid dimension at the block scale are obvious. The grid dimension represents the balance of the green space structure. The block with the highest grid dimension was No. 34, at 0.6548, indicating that this block had the highest balance of green space.
4.2.2. Boundary Dimension Analysis of the Perimeter–Scale Model
Based on the circumference–scale model, the green space boundary dimension in Dalian City presents a multi-core spatial distribution pattern centered on the blocks No. 8, 34, and 72, with obvious spatial differences (
Figure 9). Similar to the concept of “dual core,” the concept of “multi core” refers to the distribution structure of multiple centers in the inner space of a certain geographical phenomenon [
48]. There were 8 blocks in Dalian with green space boundary dimension values ranging from 0.5493 to 0.5625, 18 blocks with values ranging from 0.5625 to 0.5794, and 24 blocks with values ranging from 0.5794 to 0.5960. There were 25 blocks with values ranging from 0.5960 to 0.6209, and 3 with values ranging from 0.6209 to 0.6628, showing that the complexity of green space boundary forms in Dalian was mainly concentrated between 0.5960 and 0.6209.
Based on the perimeter–scale model, the green space boundary dimension of each block in Dalian ranged from 0.5493 to 0.6628, and the highest value was 0.6628 in the No. 34 block. The perimeter–scale model represents the complexity of the green space boundary morphology, showing that the green space morphology in block 34 was the most complex and had the highest value in the grid dimension, which is notable.
4.2.3. Boundary Dimension Analysis of the Perimeter–Area Model
Based on the perimeter–area model, the boundary dimension of green space in Dalian showed a “multi-core” spatial distribution structure with the block of No. 7, 18, 40, and 62 as the center, and some areas showed a continuous centralized distribution trend (
Figure 9). There were 13 blocks with values between 1.6757 and 1.7894, 13 blocks with values between 1.7894 and 1.8664, and 25 blocks with values between 1.8664 and 1.9326. There were 23 blocks with values between 1.9326 and 2.0270, and 4 blocks with values between 2.0270 and 2.2097.
The boundary dimensions of 78 blocks in Dalian were between 1.6757 and 2.2097, among which the boundary dimensions of No. 40, 18, 62, and 7 were greater than 2. For urban fractals, the boundary dimension calculated by the circumference-area model was between 1 and 2, and this was the first time that the boundary dimension exceeded 2 at the block scale in the fractal dimension of the urban green space system. The boundary dimension estimated by the perimeter–area model represents the fragmentation and instability of the green space structure, which shows that the green space structure is more complex and unstable at the block scale.
4.3. Correlation Analysis between Urban Thermal Environment and Green Space Fractal Characteristics
When exploring the mechanism of the fractal index of urban green spaces on the thermal environment at a block scale, it is necessary to consider the influence of their spatial correlation. This is expected to determine the most significant factors affecting the urban thermal environment at the block scale and advance effective measures to maximize the cooling effect of green space.
The spatial autoregressive model was used to calculate the action mechanism of the urban green space fractal index on the urban thermal environment, and the regression results are shown in
Table 2. As can be seen from
Table 2, the residual Moran’s I was 6.623, which shows that the residual of the least-squares method has obvious spatial dependence through the 1% significance level test. The interaction and mutual influence of different fractal indices of urban green spaces promotes the formation of a spatial pattern of an urban thermal environment. To further explore the mechanism of the fractal index of urban green space systems in urban thermal environments, a suitable spatial autoregressive model should be selected for further analysis. By comparing the LMLAG, LMERR, and other related indicators, it was noted that the SEM fit was better than that of the SLM. To some extent, it reflects the error impact of the regional thermal environment by the neighboring region thermal environment, which is stronger than that of the degree of spatial spillover.
As shown in
Table 2, the error coefficient (λ) of the SEM was 0.841, and the 1% significance level test showed that there was an obvious spatial effect on the spatial distribution of urban LST in Dalian. According to the regression results of the SEM, the influence coefficient of area (X4) and perimeter (X5) on LST was 0, indicating that the green quality index had almost no influence on LST at the block scale, and the cooling effect of green space mainly came from the comprehensive effect of the green space structural index.
At the block scale, the influence coefficient of the spatial difference pattern based on the perimeter–scale model was −20.945. Although the significance test failed, the X1 effect coefficient was significantly higher than that of X2. This shows that the complexity of the urban green space boundary line at the block scale is greater than that of the green space structure. X1 was negatively correlated with the spatial difference in the surface temperature; therefore, the higher the complexity of the green space boundary line, the lower the surface temperature, and the greater the cooling effect of the green space.
The influence coefficient of the urban green space boundary dimension estimated based on the perimeter–area model of the spatial difference pattern of LST was 1.985, which did not pass the significance test. The coefficient of X2 was much lower than that of X1 and X3, showing that the fragmentation degree of the urban green space structure has a very low influence on LST at the block scale and can be ignored. However, judging from the direction of influence, the boundary dimension of the next-week length-area model at the block scale is positively correlated with the spatial difference in LST. The higher the fragmentation of green space at the block scale, the higher the surface temperature, and the lower the cooling effect of green space.
The influence coefficient of the urban green space grid dimension on the spatial difference pattern of LST was 39.669, which passed the 1% significance level test, and the coefficient of X3 was the highest, showing that the balance of urban green space structure has the largest and most significant influence on LST at the block scale. There was a significant positive correlation between the green space grid dimensions and the spatial difference in LST at the block scale. The higher the green space equilibrium, the higher the LST, and the weaker the effect of green space in alleviating the thermal environment.
4.4. Analysis of the Inconsistency between the Urban Thermal Environment and the Fractal Characteristics of Green Spaces
To evaluate the development quality of green space in the 78 blocks of the study area, the inconsistency index method was used to calculate the spatial matching relationship between the fractal index of green space and the LST. The correlation analysis in this study showed that the green space grid dimension had the greatest influence on the thermal environmental effect of green space fractal characteristics at the block scale, and other indicators failed the significance test. Therefore, this section only discusses the spatial heterogeneity of the green space grid dimensions and LST. Through the improvement of the inconsistency index model, the calculated results of the inconsistency index were visualized using ArcGIS software, as shown in
Figure 10.
The spatial agglomeration characteristics of the inconsistency index between the green space grid dimension and the LST of the block in Dalian are significant, which basically presents the spatial pattern of concentrated contiguous distribution and roughly shows a trapezoidal structure decreasing from north to south. In terms of the number of blocks, the agglomeration green space grid dimension of 28.21% of blocks is ahead of the agglomeration surface temperature, which belongs to the “green space leading type.” The cooling effect of green space in this type of block is poor, and the quality of green space development is low. These blocks were concentrated in the northwest of Ganjingzi District. The agglomeration degree of the green space grid dimension of 41.02% of the blocks is similar to the agglomeration LST, which is in the “relatively coordinated” development stage. The development quality of green space in this type of block is relatively coordinated with the cooling effect. These blocks are distributed in northeastern Ganjingzi District and in the middle of the study area. The agglomeration green space grid dimension of 30.77% of blocks lags the agglomeration LST, which belongs to the “green space lag type.” This type of block has a good cooling effect and high green space development quality, and these blocks are distributed in the south of the study area.
5. Discussion
5.1. Governance Suggestions
Related studies have determined the cooling effect of green indicators, and this study further determined the cooling effect of the green space area structural index (grid dimension). The block scale is the basic unit to carry out territorial space planning, which has more practical significance. To improve the thermal environmental effect of urban green space at the block scale, the following relevant governance suggestions are proposed.
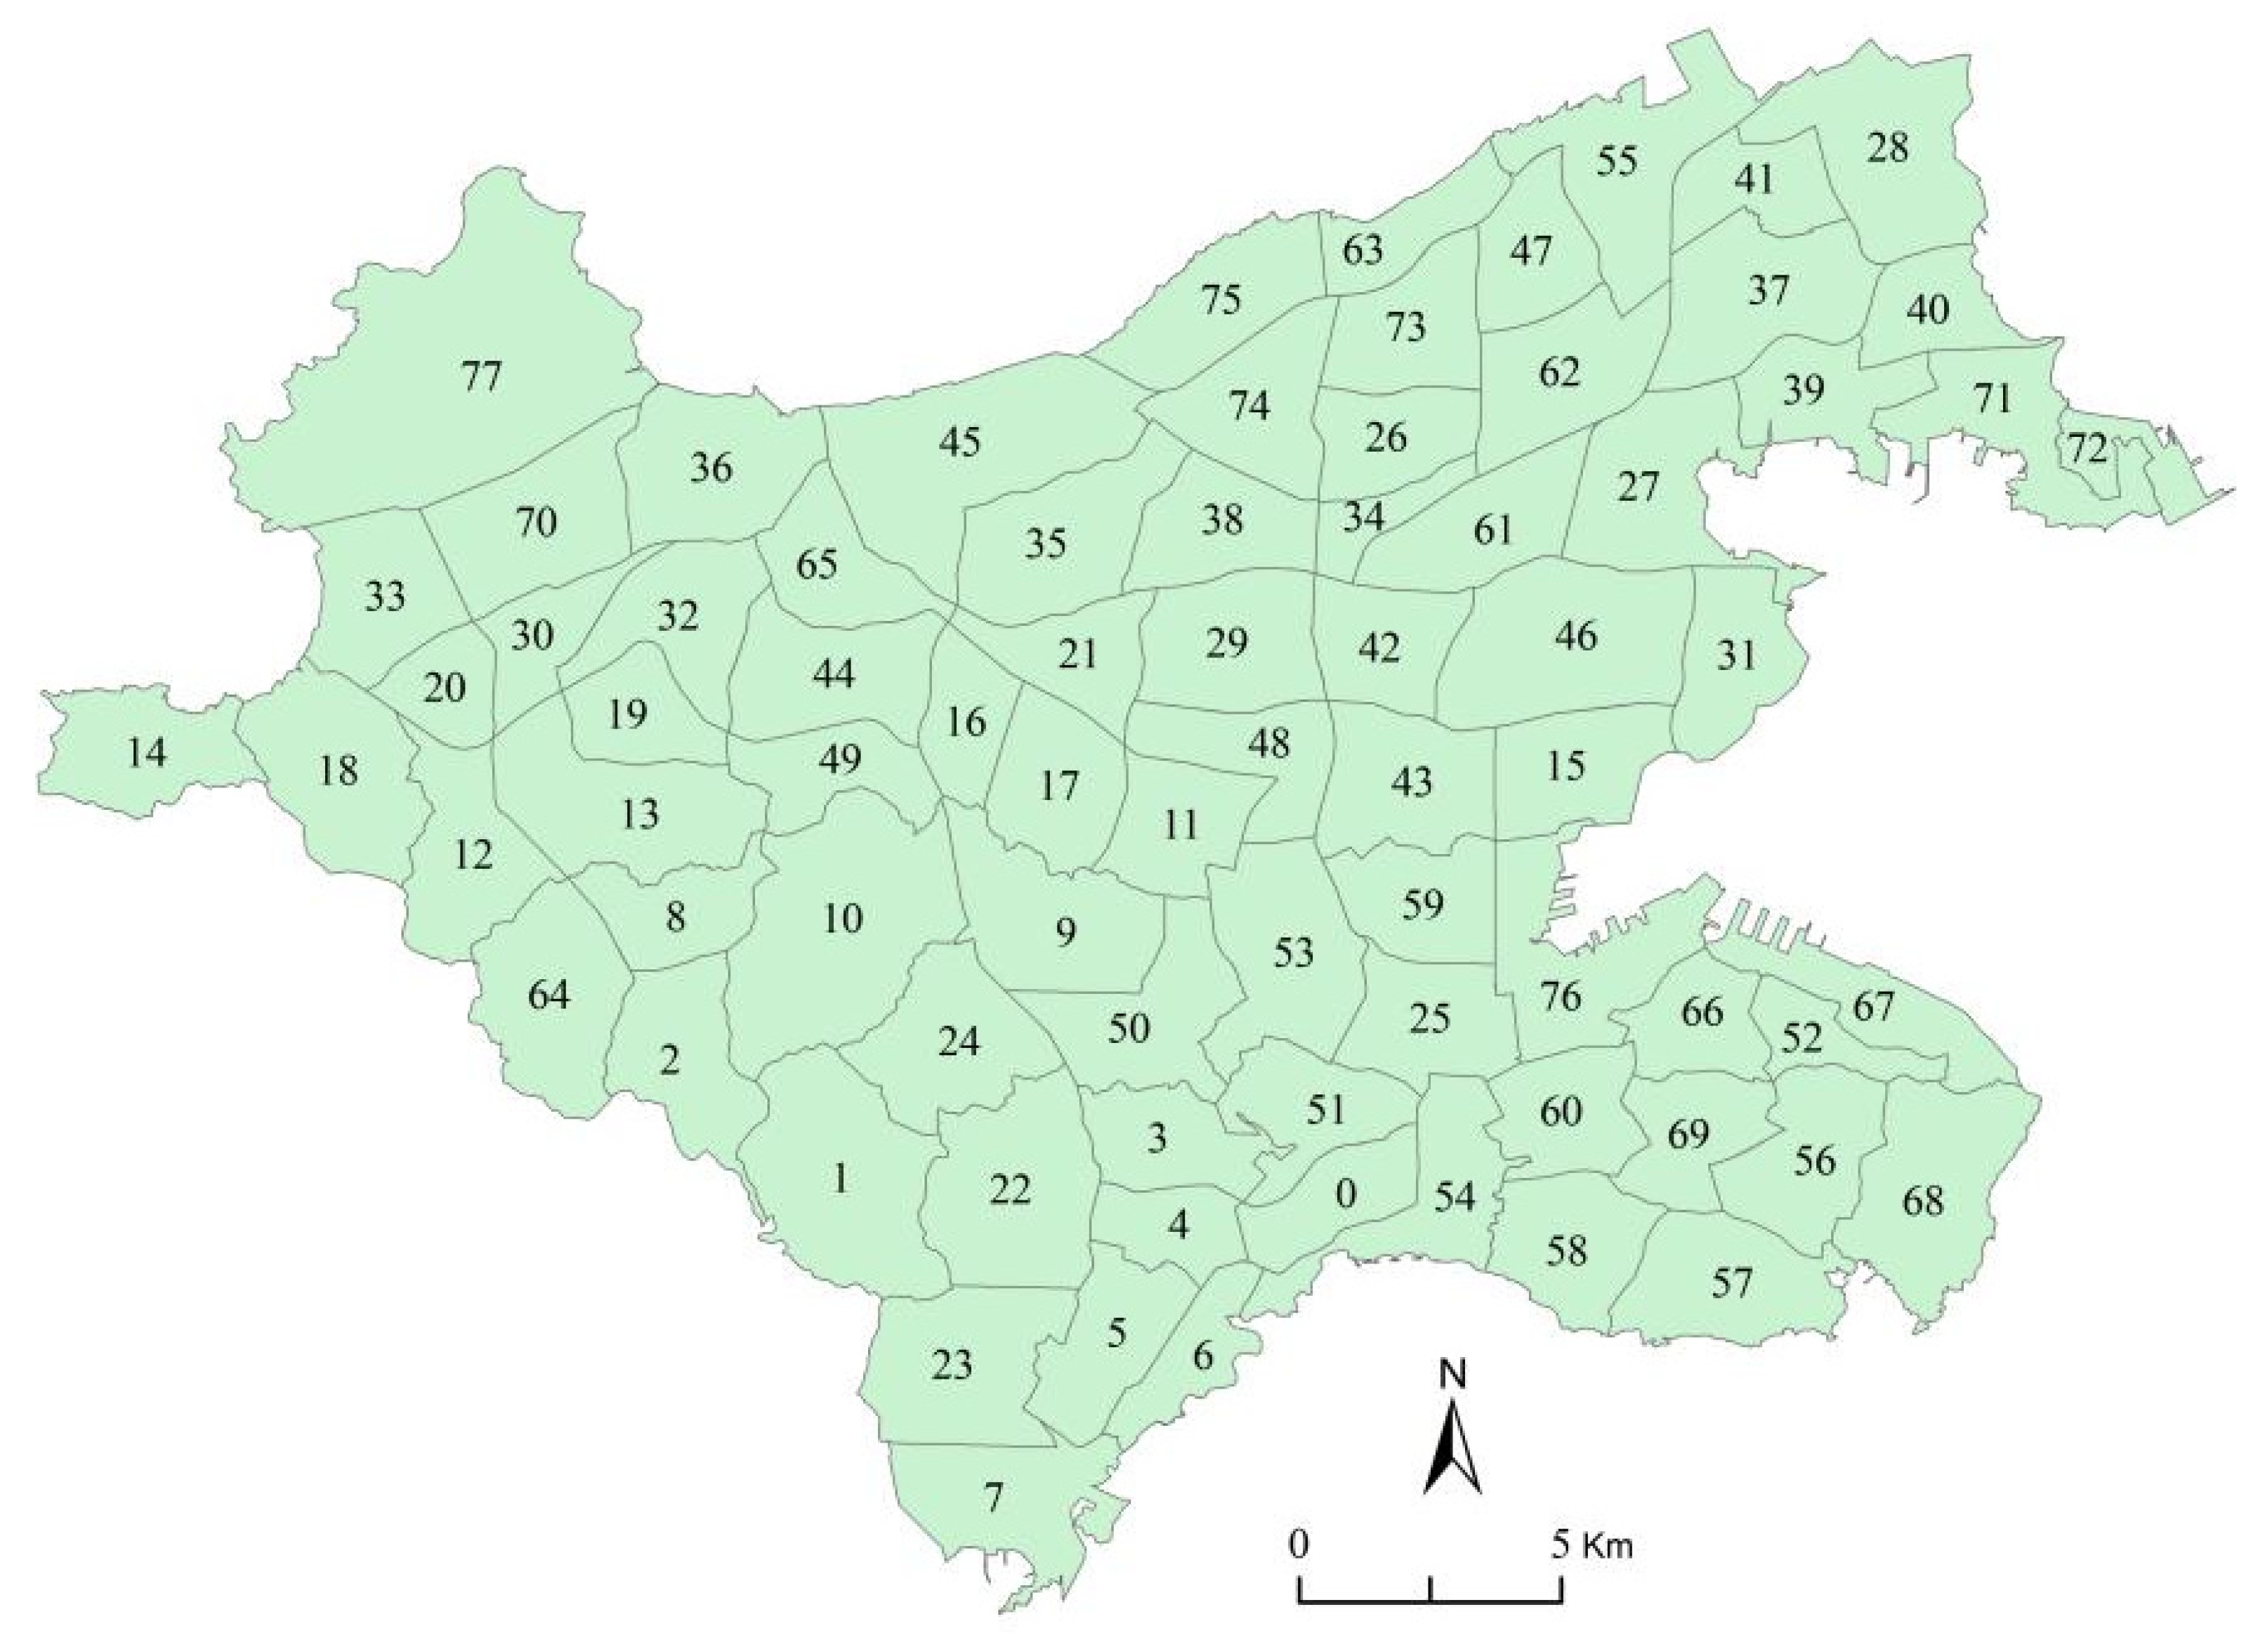
The thermal environment of Dalian in 2019 showed a gradual increase from low-latitude coastal areas to high-latitude inland areas, forming a spatial distribution structure of “high in the central and northern regions, low in the surrounding regions”. There were significant spatial differences in the thermal environmental effects of the green spaces in the blocks. The thermal environmental effect of green space in 22 blocks in northwest Ganjingzi District was poor, specifically, in blocks No. 11, 14, 16, 17, 18, 19, 20, 21, 29,30, 32, 35, 36, 38, 43, 44, 45, 48, 59, 65, 70, and 77. One improvement method is to reduce the balance of green space, so that it forms a concentrated contiguous distribution.
Green spaces are not the only factor affecting the thermal environment [
49]. In a number of recent studies, the contribution of urban blue and green spaces to urban cooling has been widely recognized, and more scholars have studied the comprehensive effects of blue and green spaces [
20,
50]. However, as this study area is a coastal city surrounded by the sea on three sides and has a temperate monsoon climate with maritime characteristics, the air humidity has hardly changed in 10 years, and the average annual relative humidity is 60–68%, so the influence of the humidity index is ignored. In addition, because its humidity conditions do not change much, green space is more significant to study compared with blue and green spaces. Furthermore, for the urban center, it is obviously more economical and effective to achieve the cooling effect by adjusting the form and structural characteristics of green space, which has practical significance.
5.2. Limitations
There remain opportunities for improvement in the current research. First, the accuracy of green space and LST data differs, which limits the selection of the research scale to a certain extent and may also limit the correlation seen in other fractal indices at the block scale, except for the grid dimension. Second, there are regional differences in the development quality of green space and the characteristics of the urban thermal environment, and this study has only covered one case site of coastal cities (Dalian), and the comparison of multiple regions and similar cities requires continuous research. In addition, this study only discusses the thermal environmental effect of the fractal index of urban green space, and other factors will have interactive effects on the heat island effect. In the future, the comprehensive effects of various influencing factors will be analyzed.


