
Numerical Investigation on the Pulling Resistant Capacity of Steel Beam-Concrete Wall Joints with T-stub Connectors

Abstract
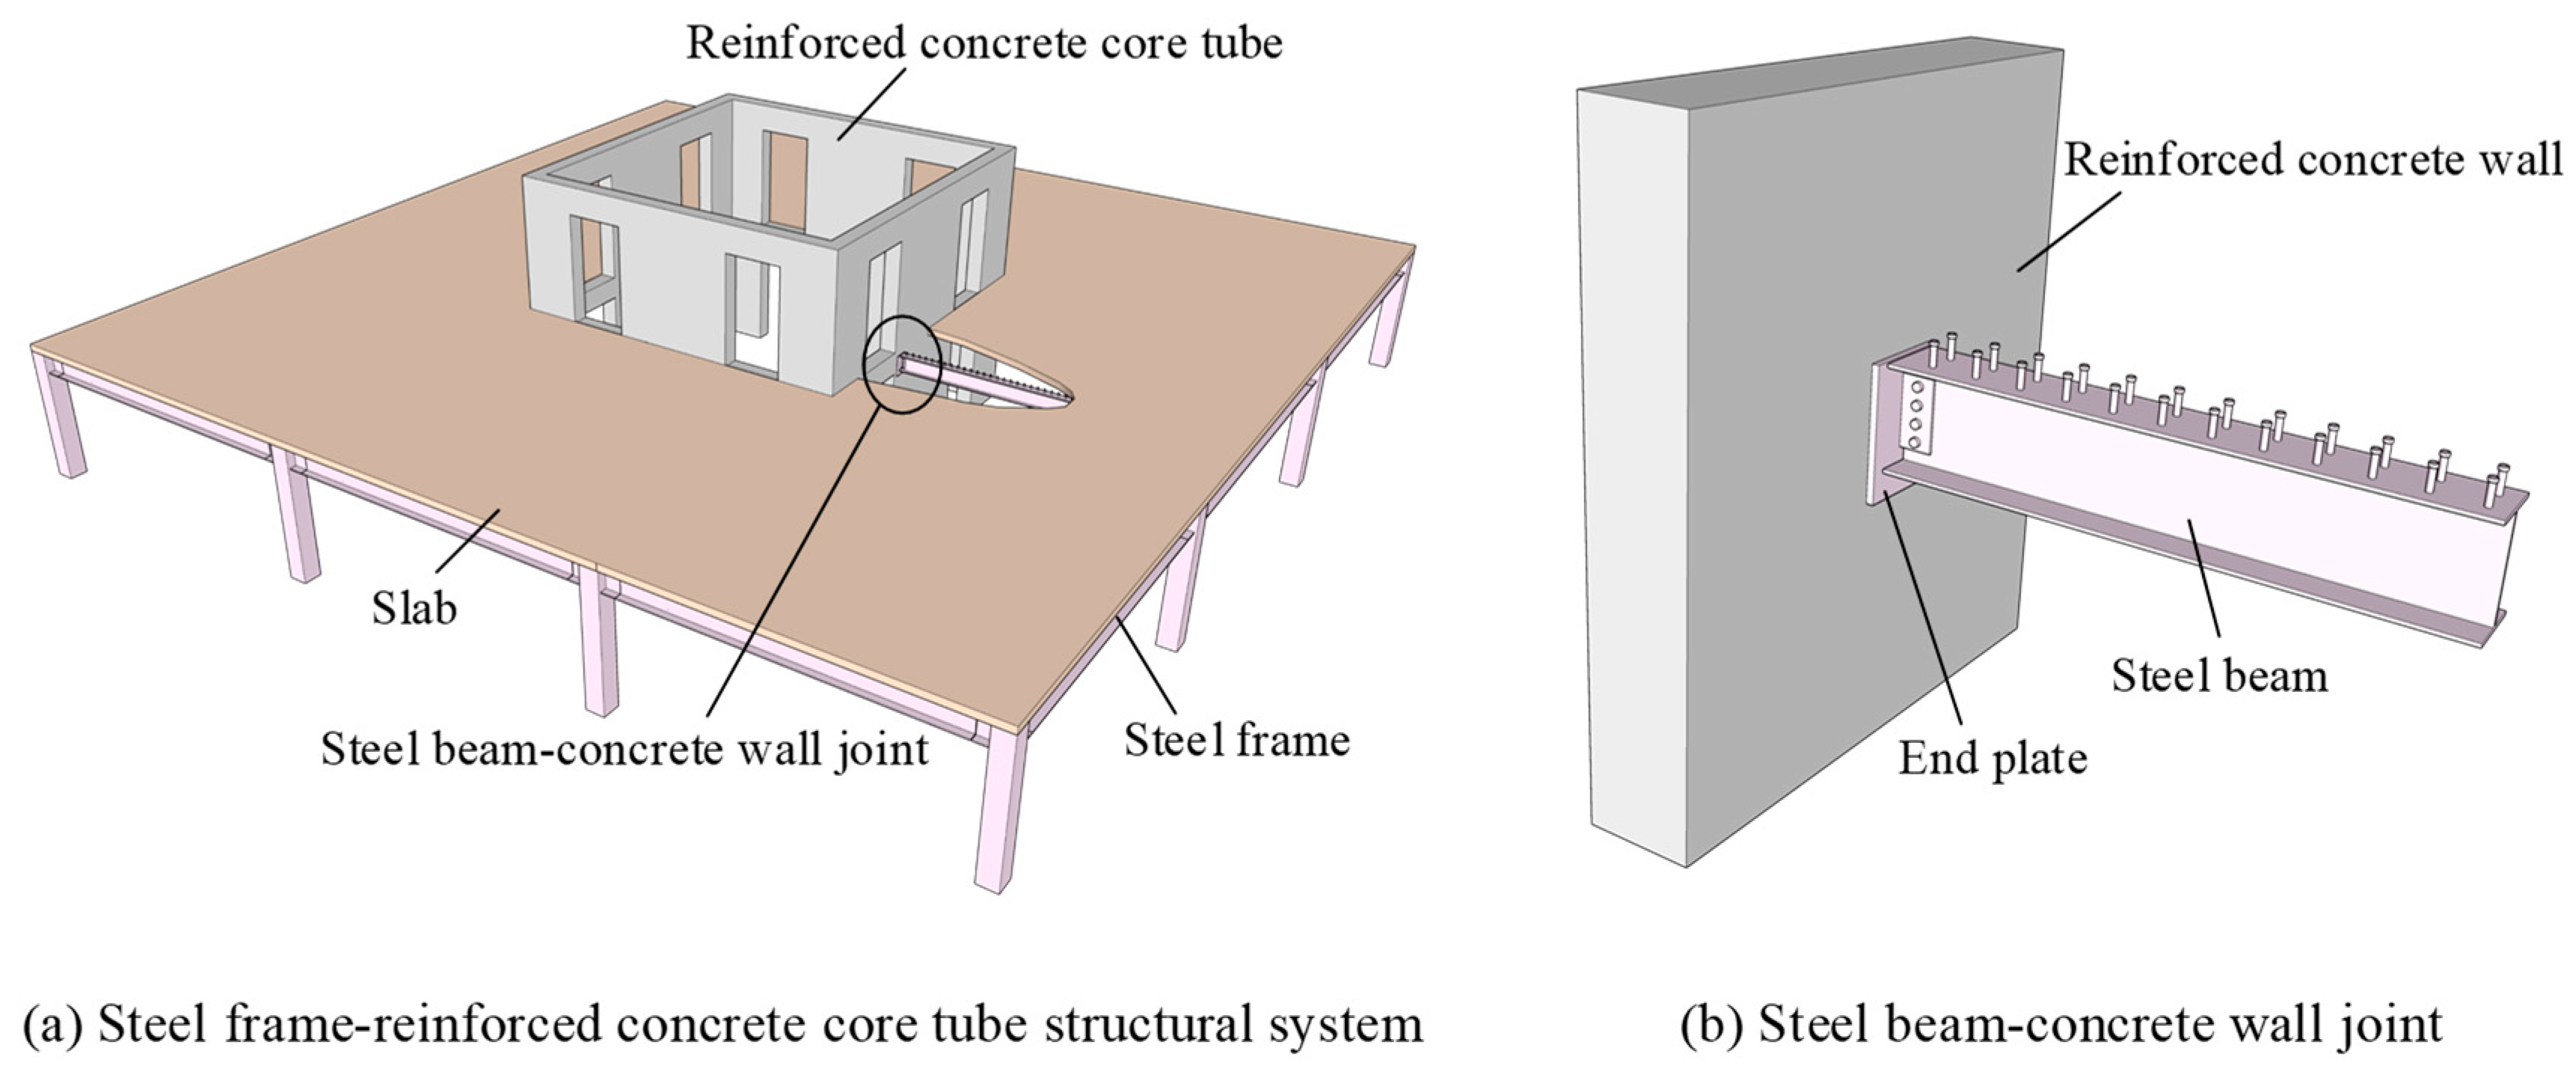
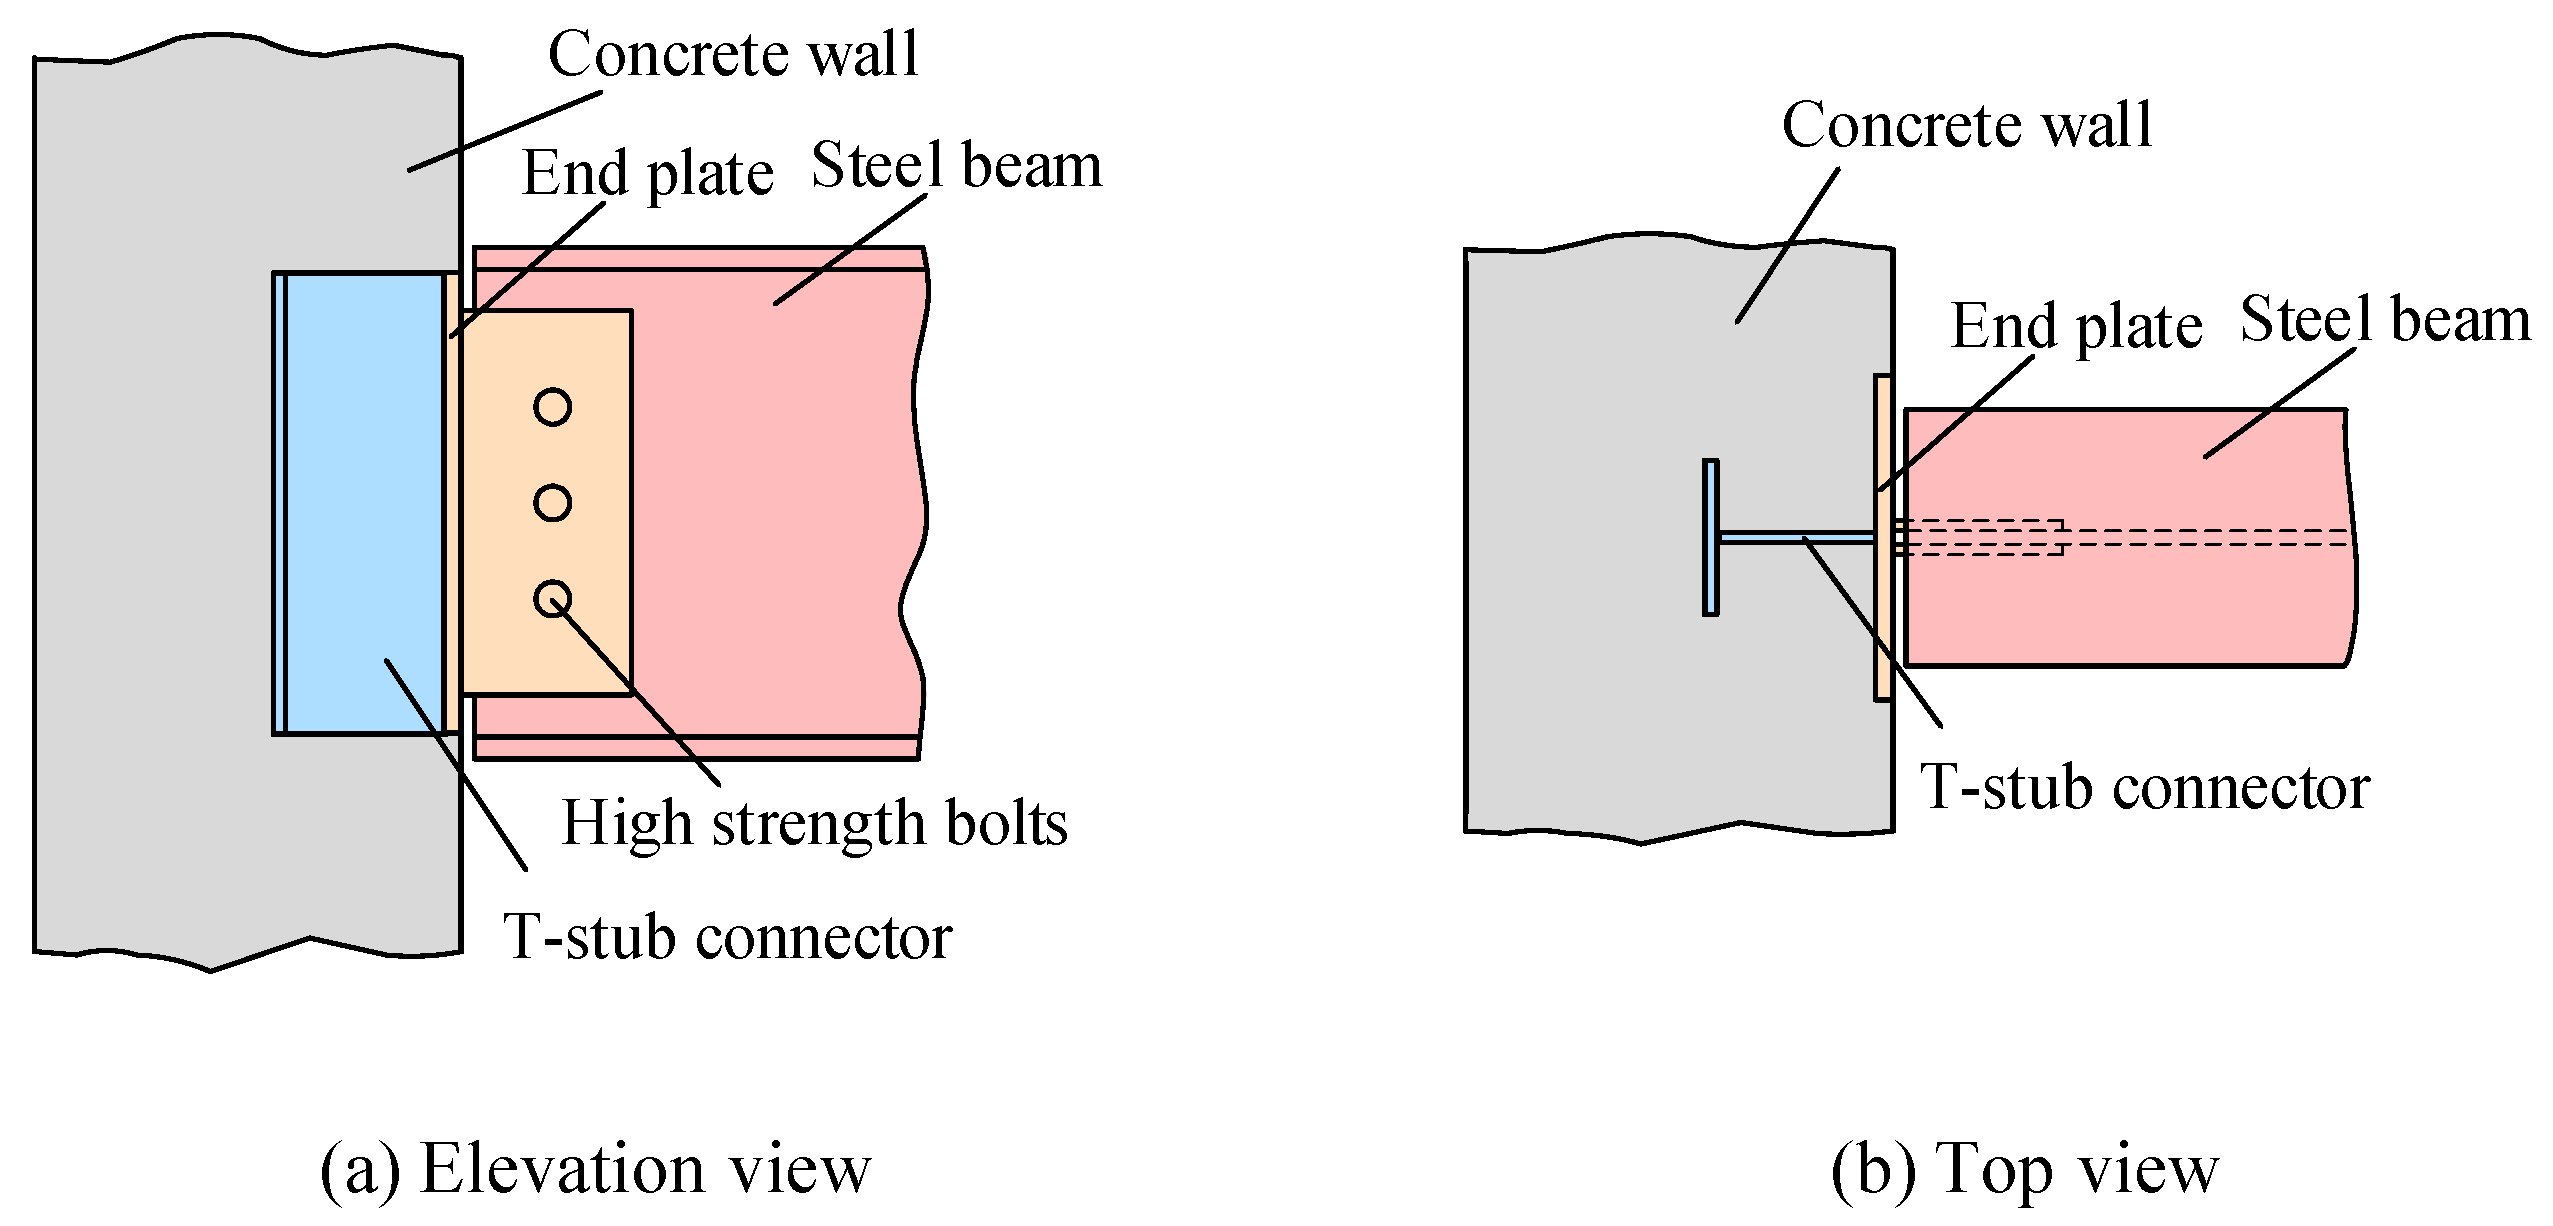
:1. Introduction
2. Aim and Scope
3. Numerical Modelling
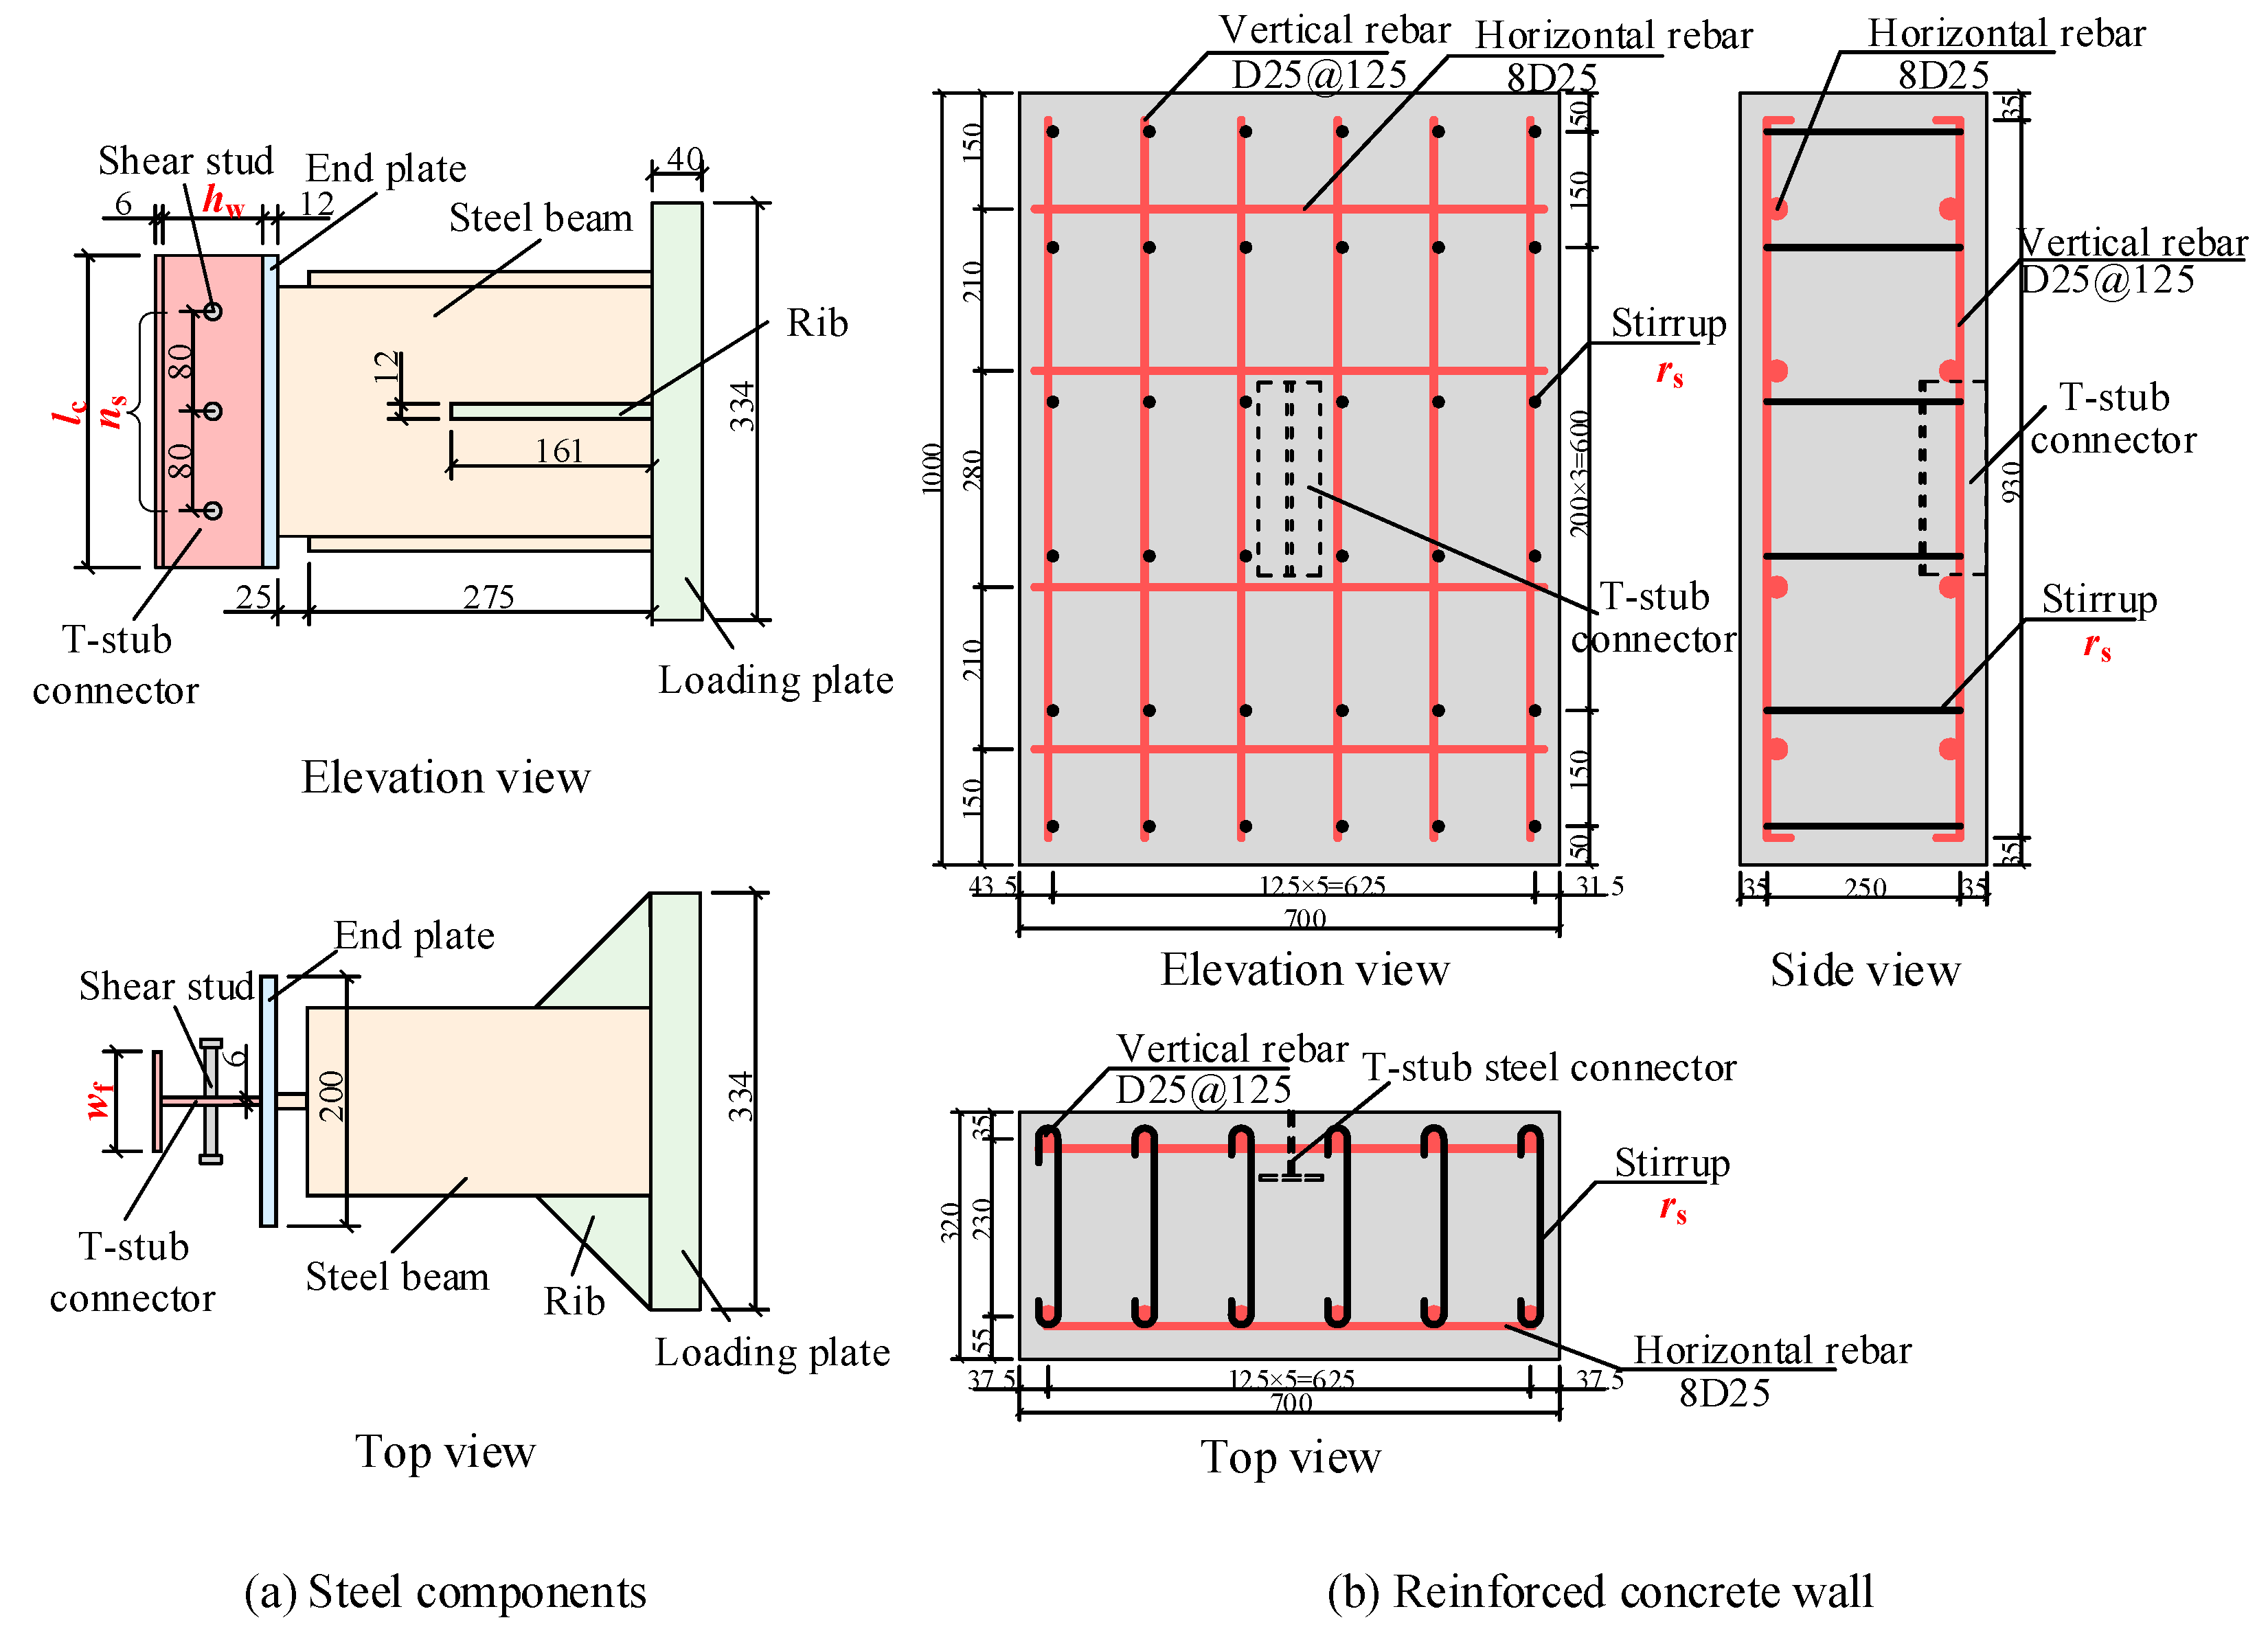
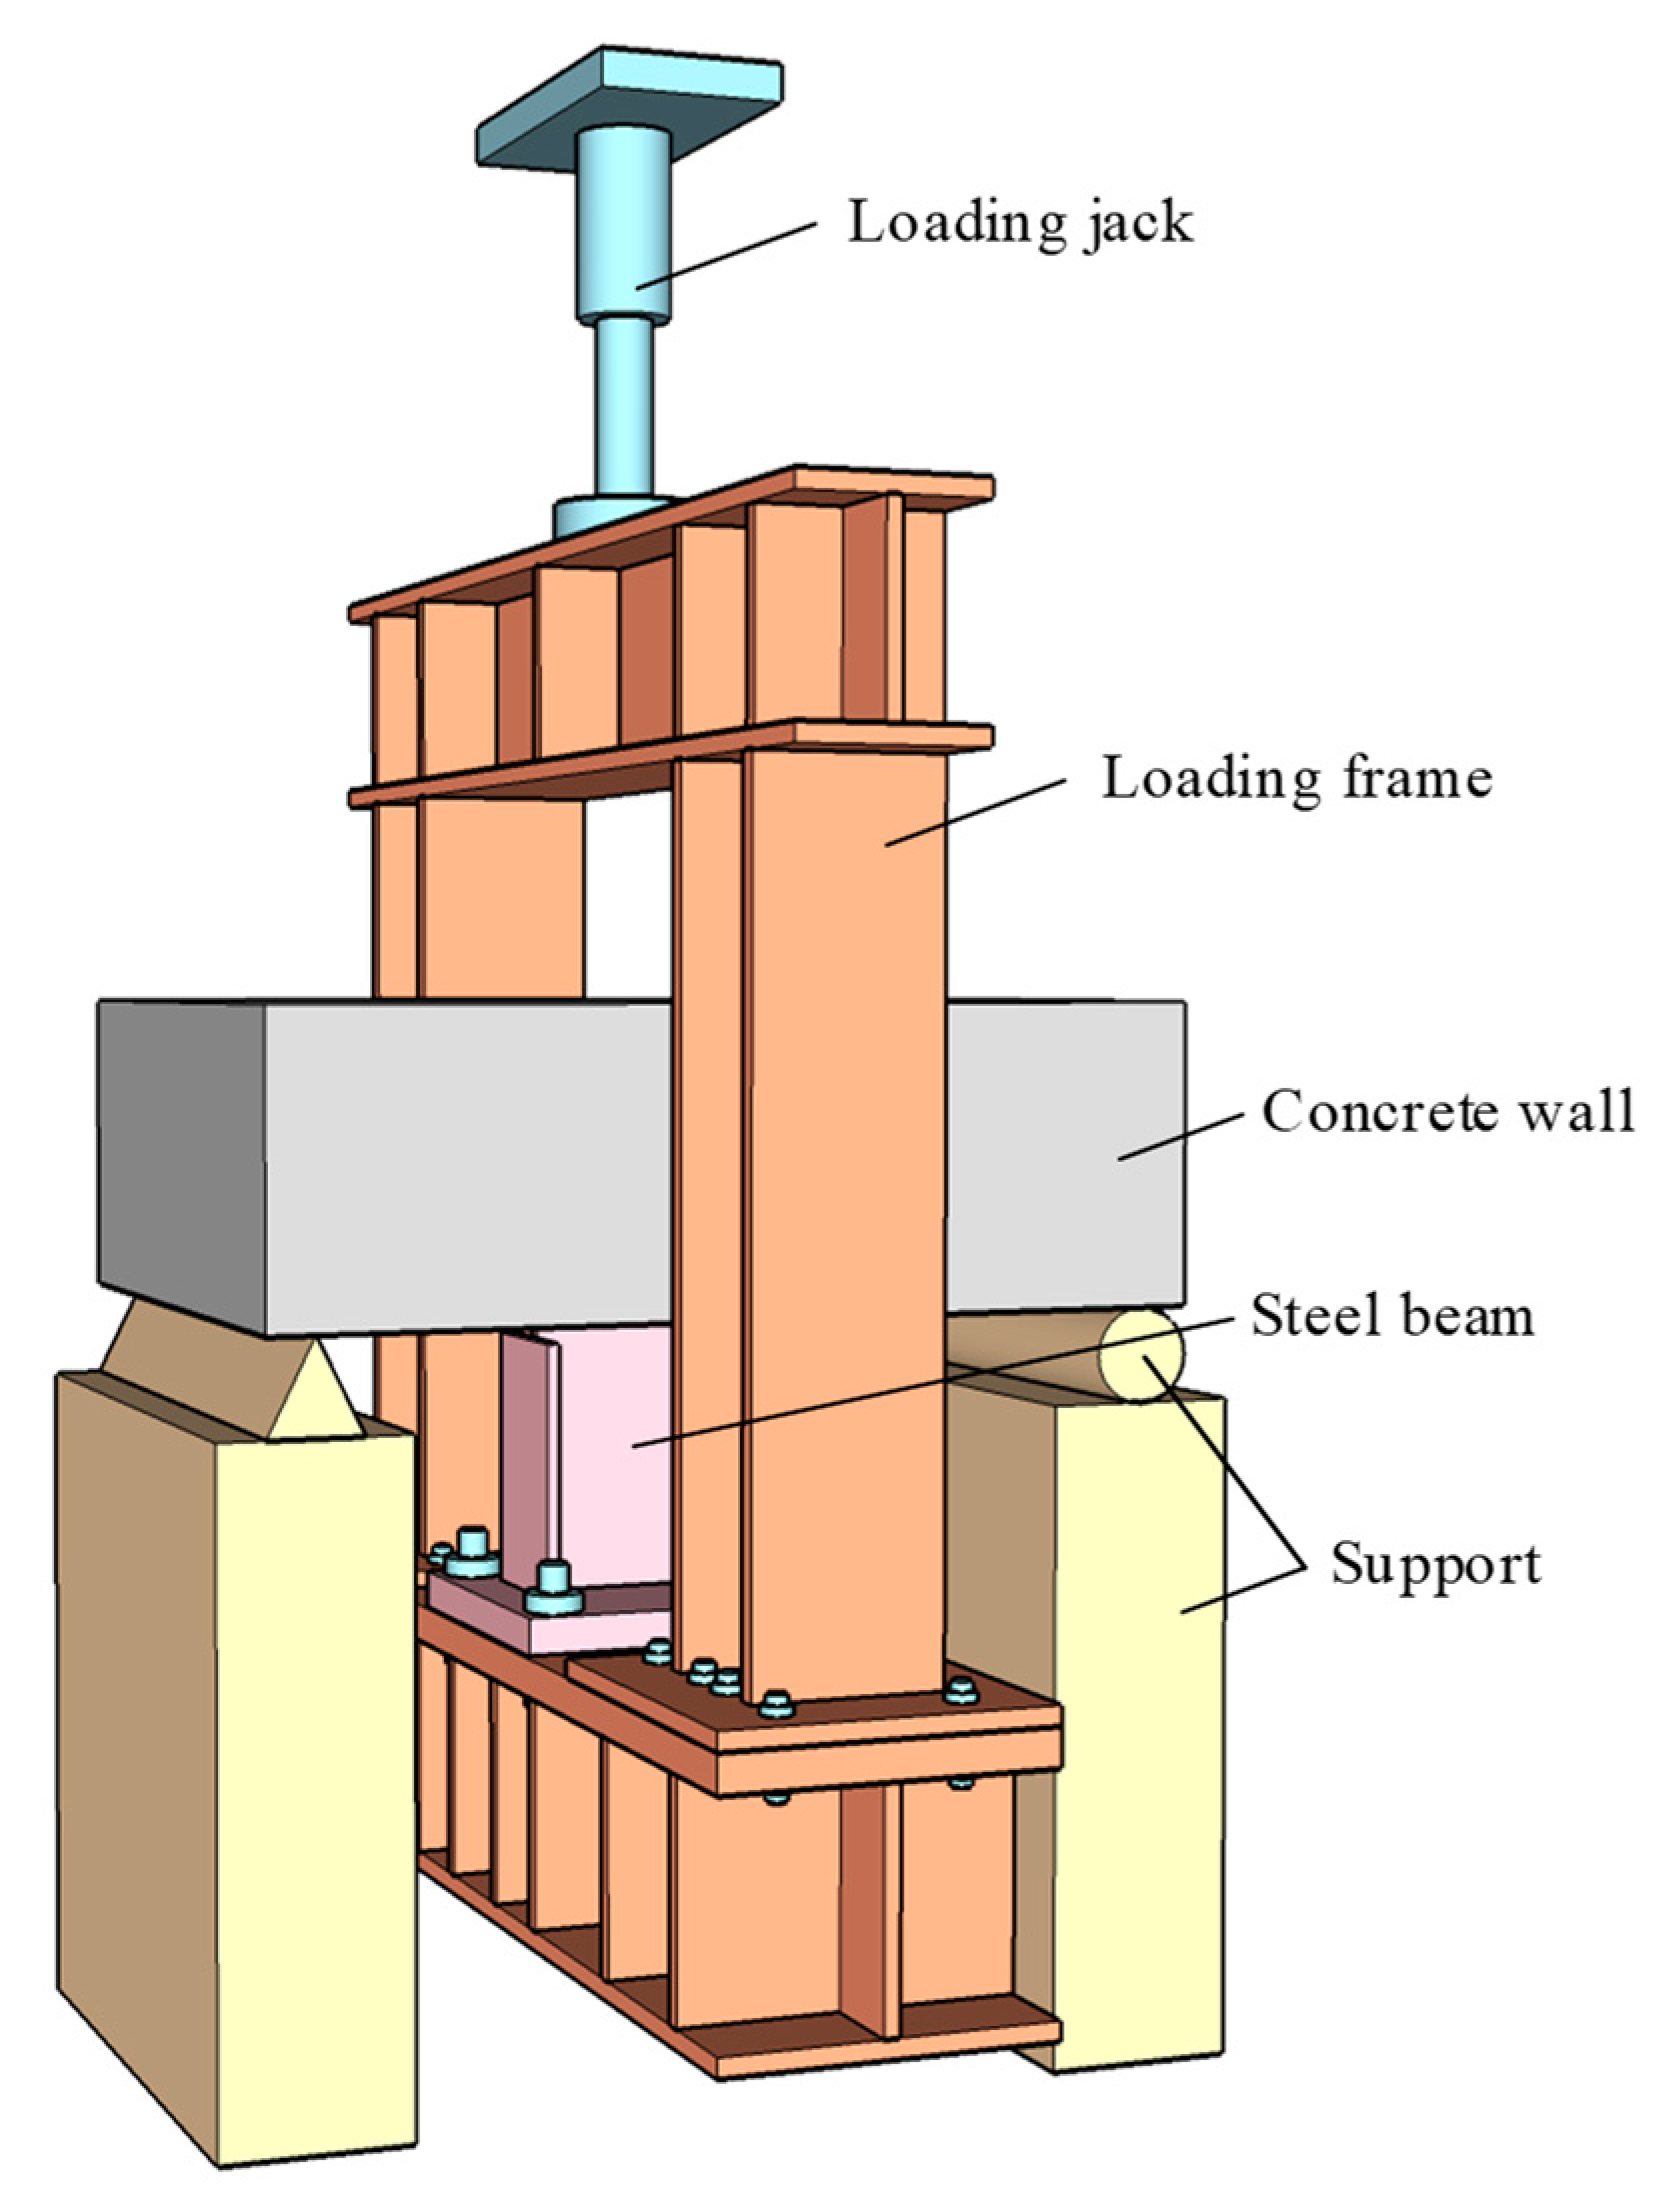
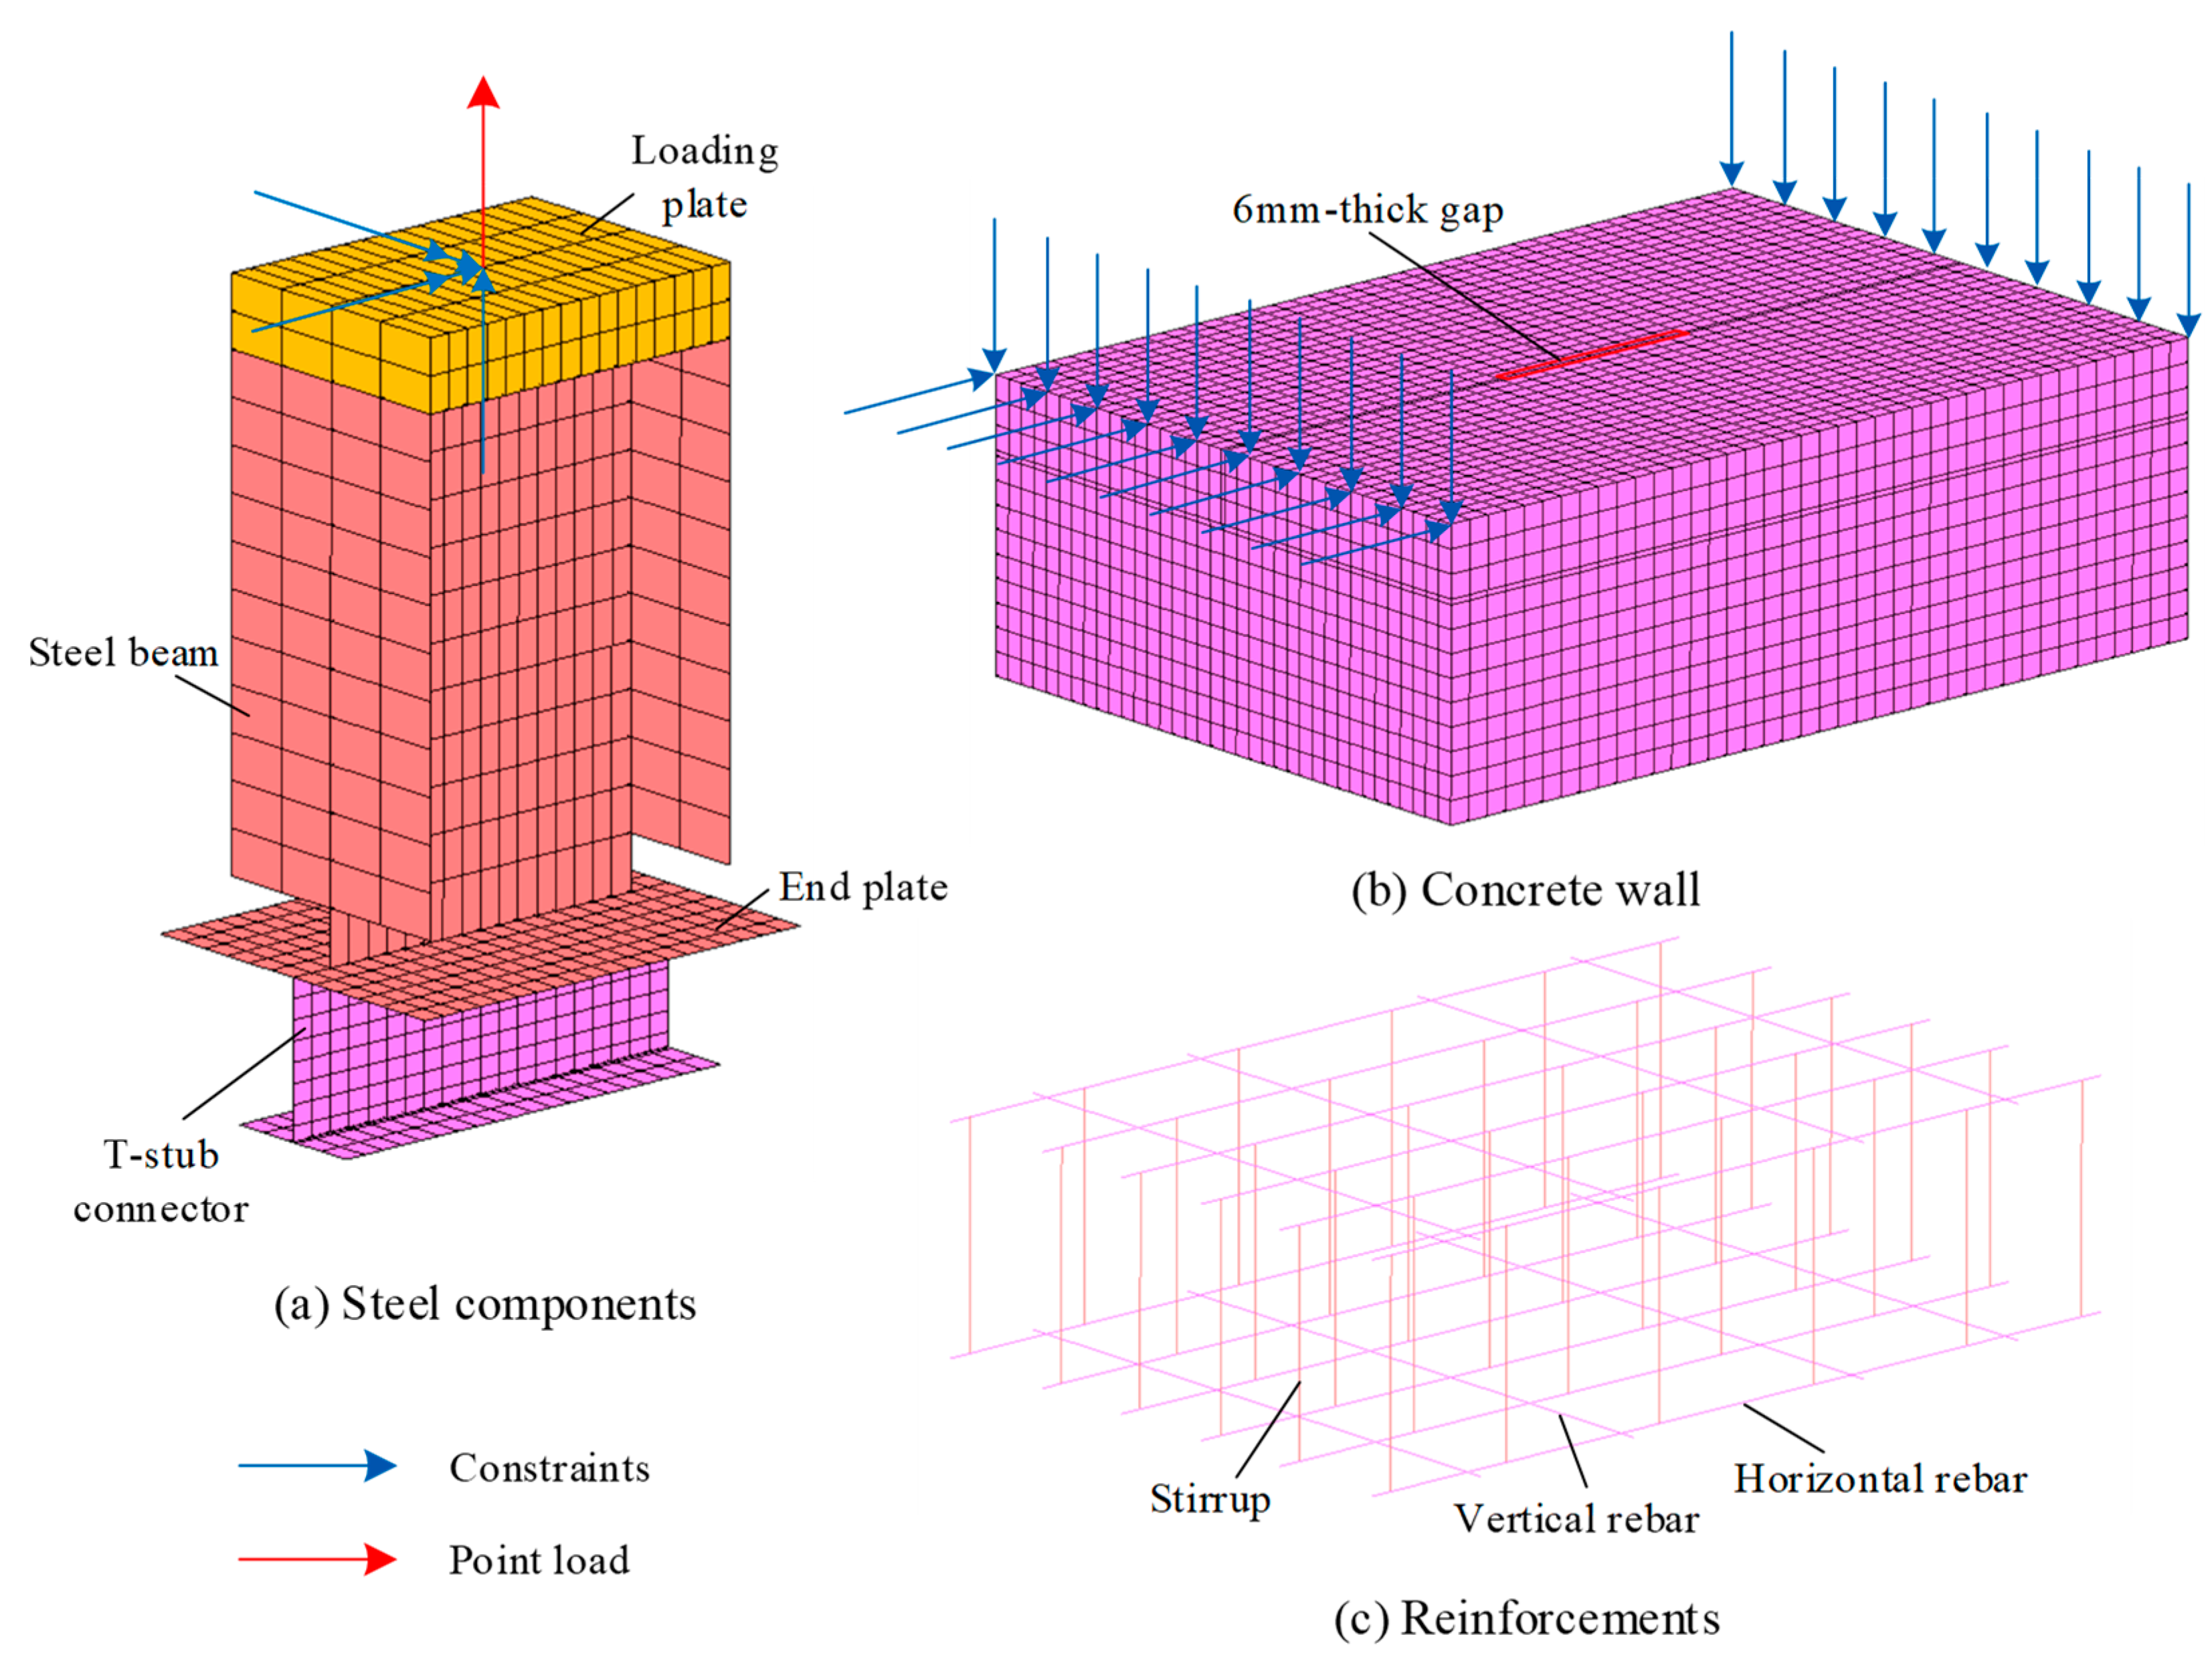
3.1. Model Setup
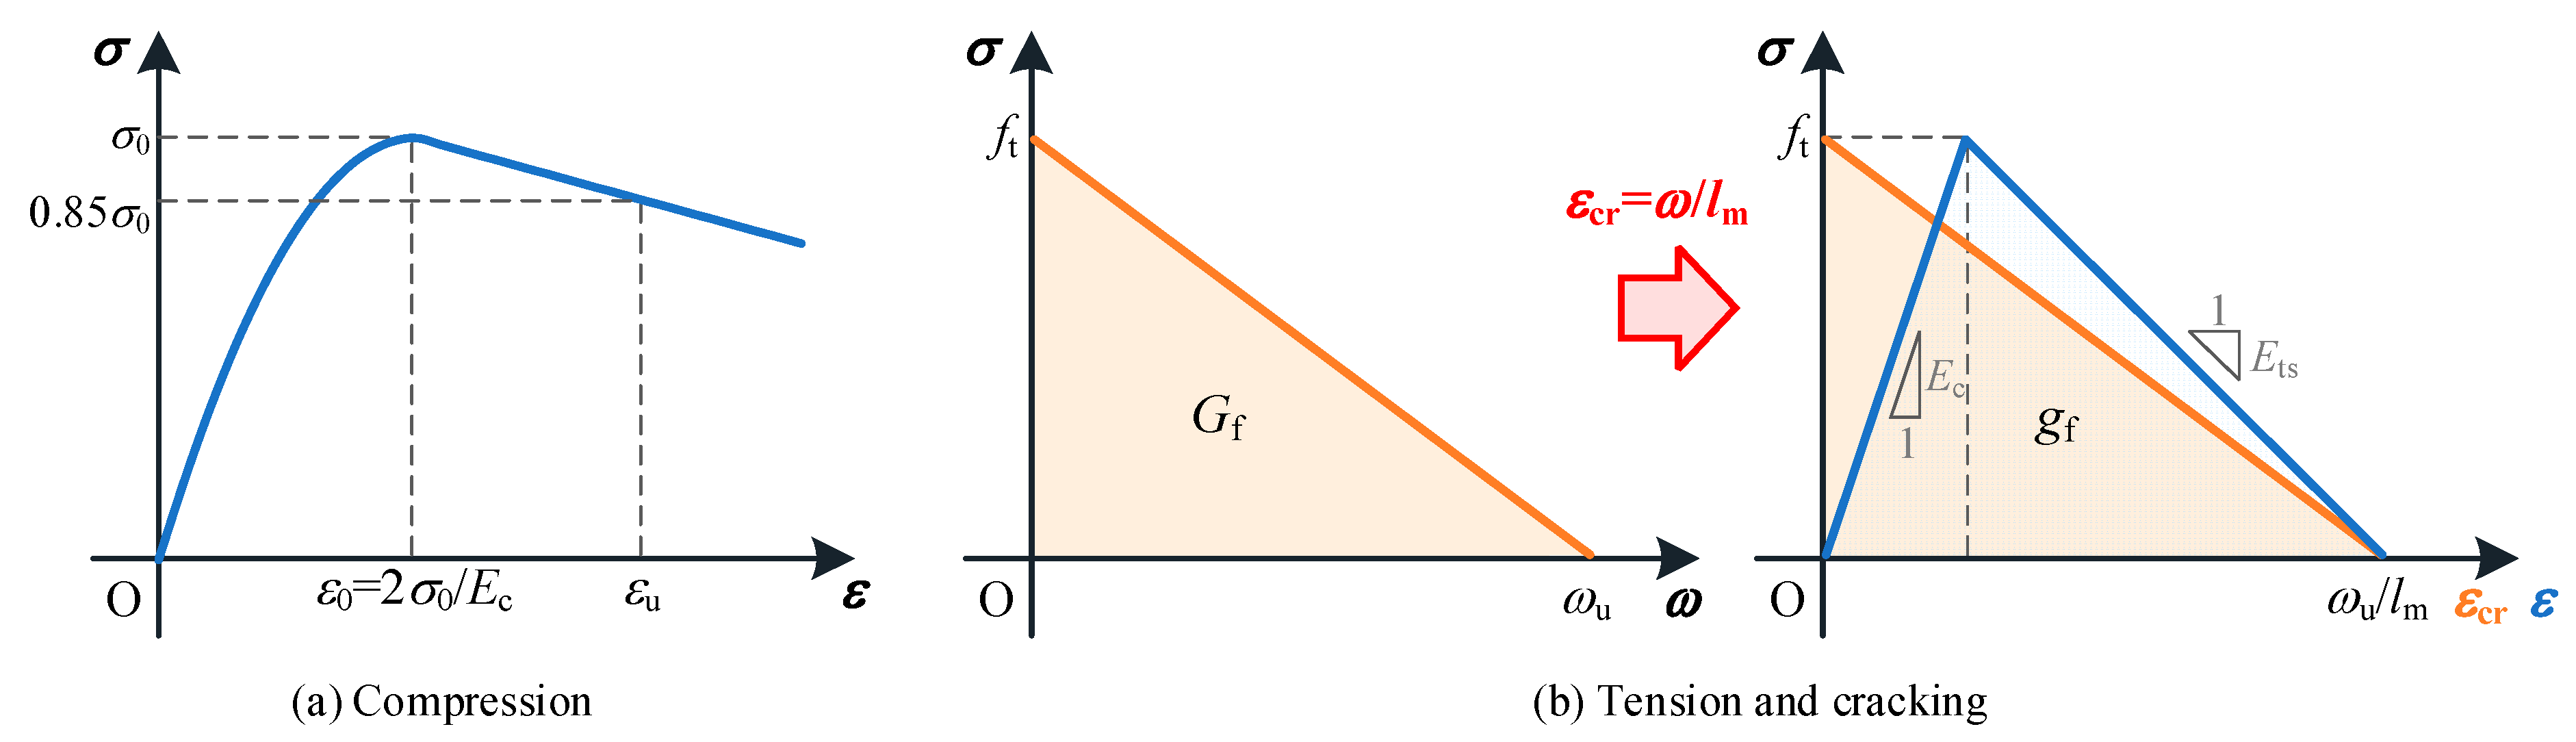
3.2. Material Properties
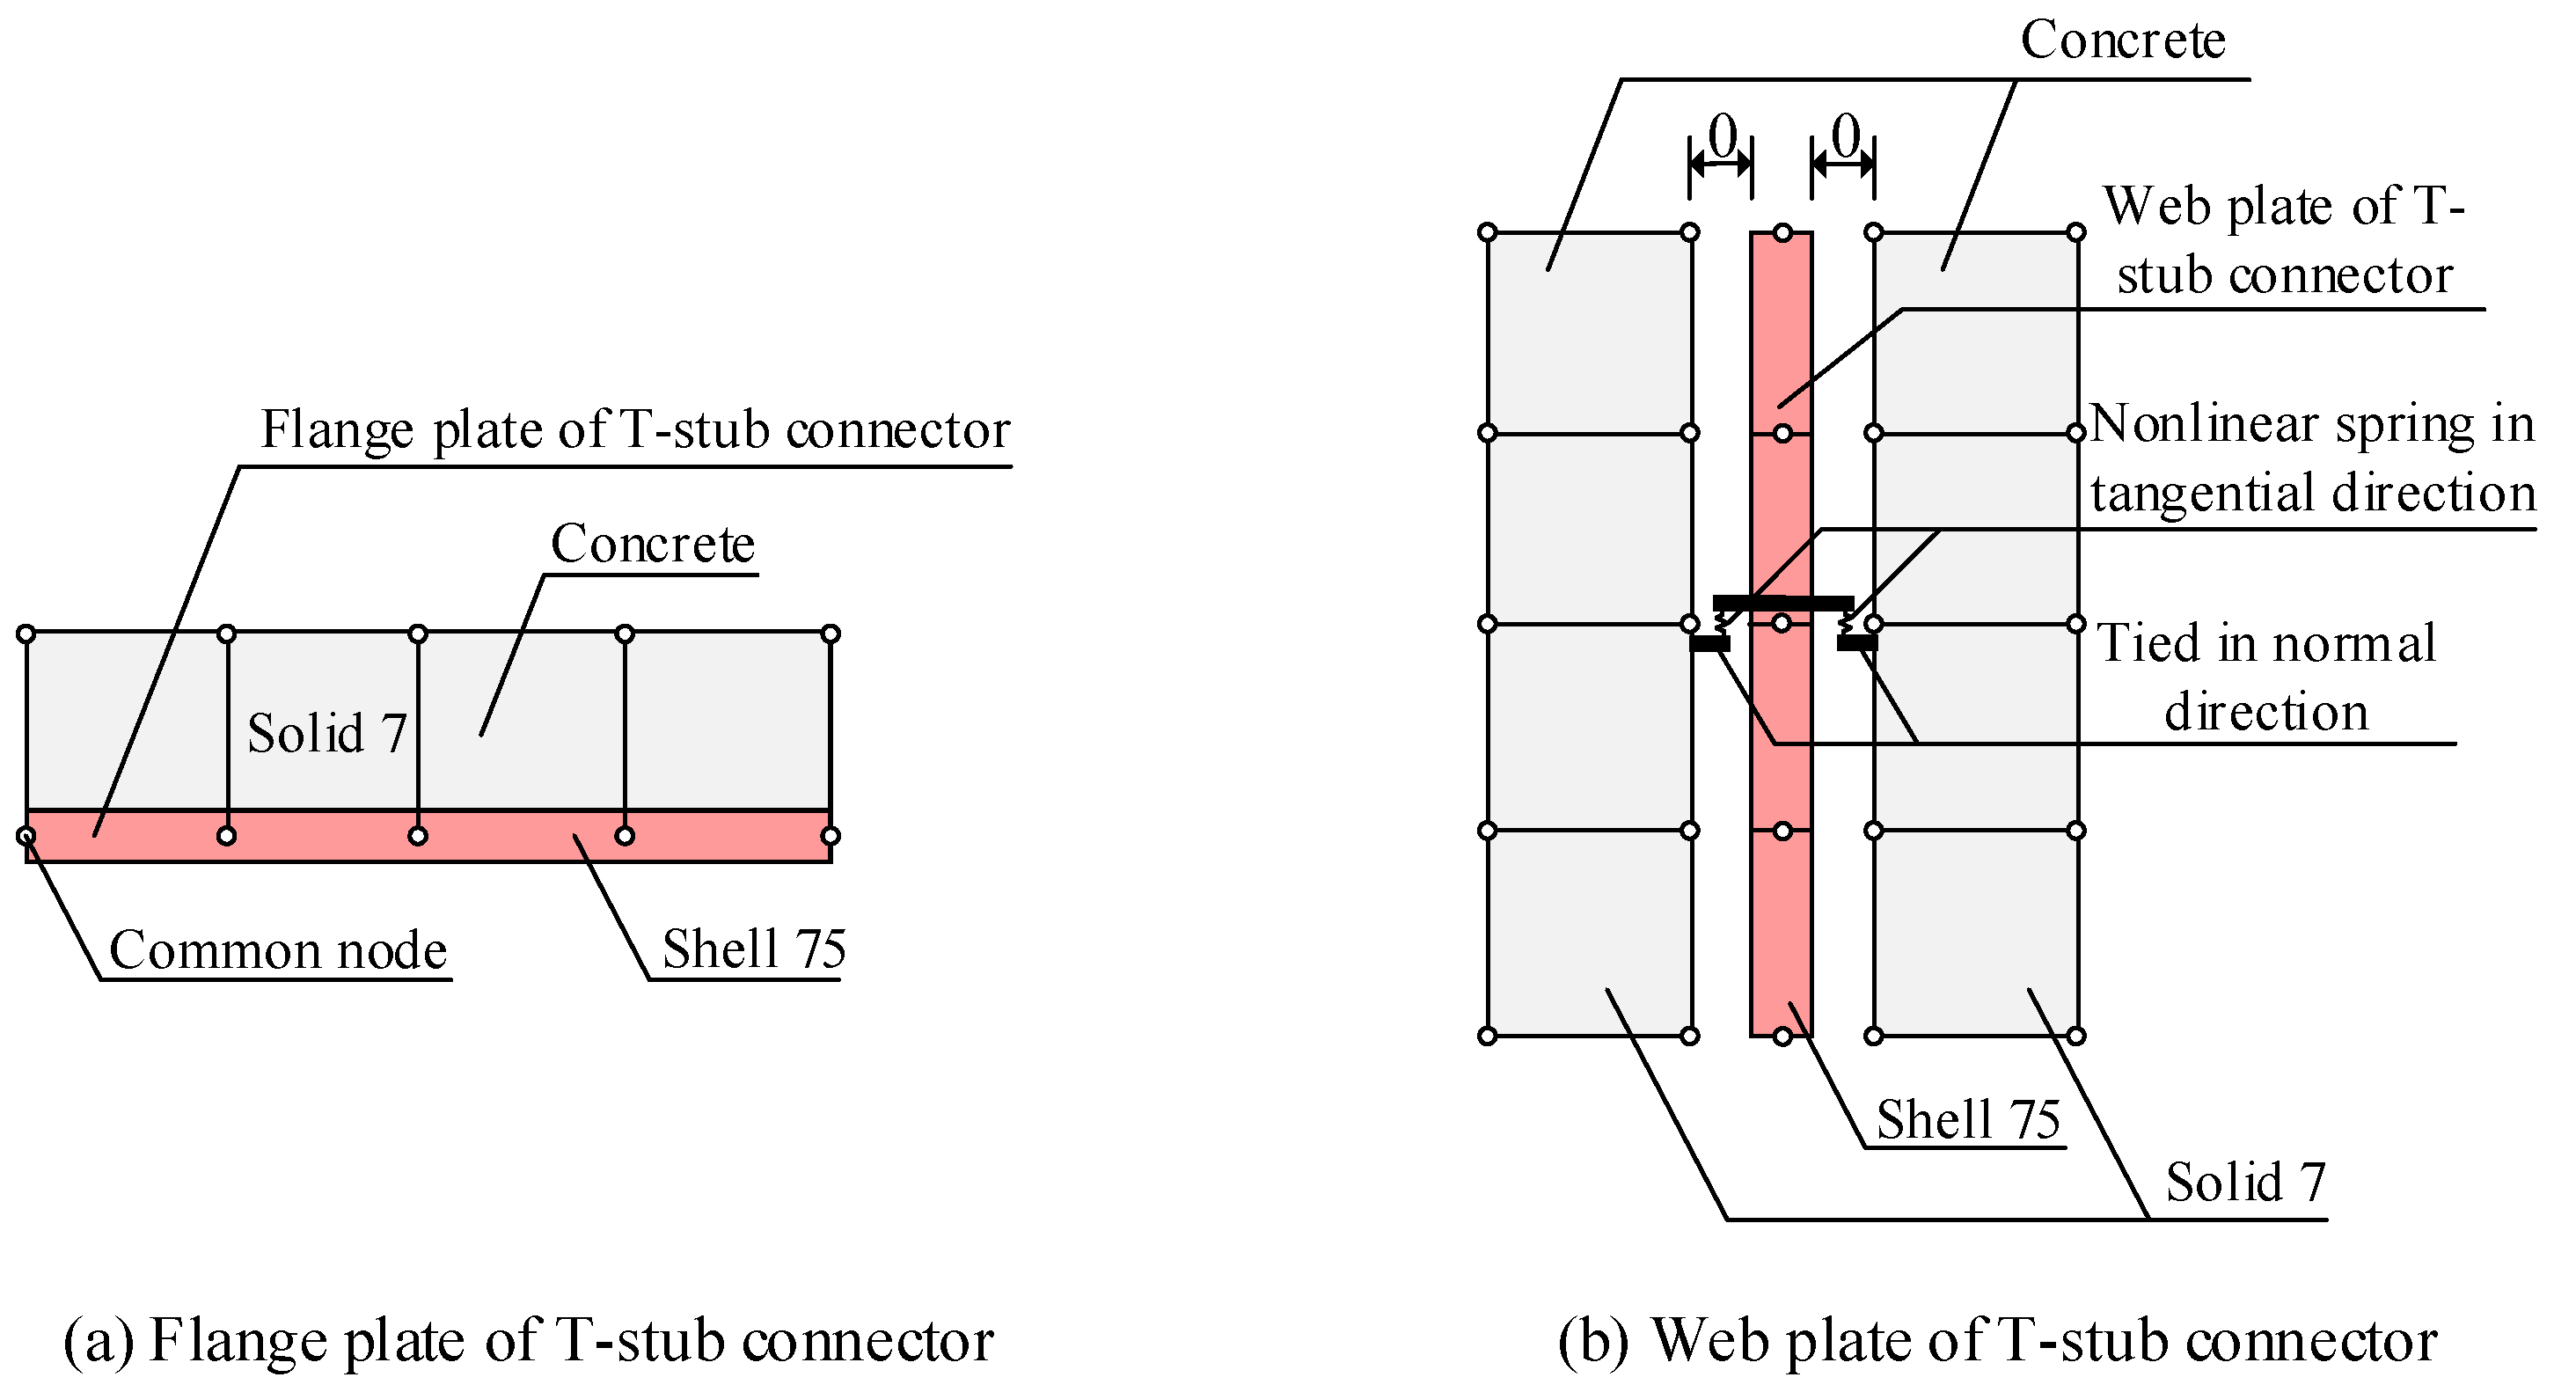
3.3. Interface
4. Numerical Modelling Results
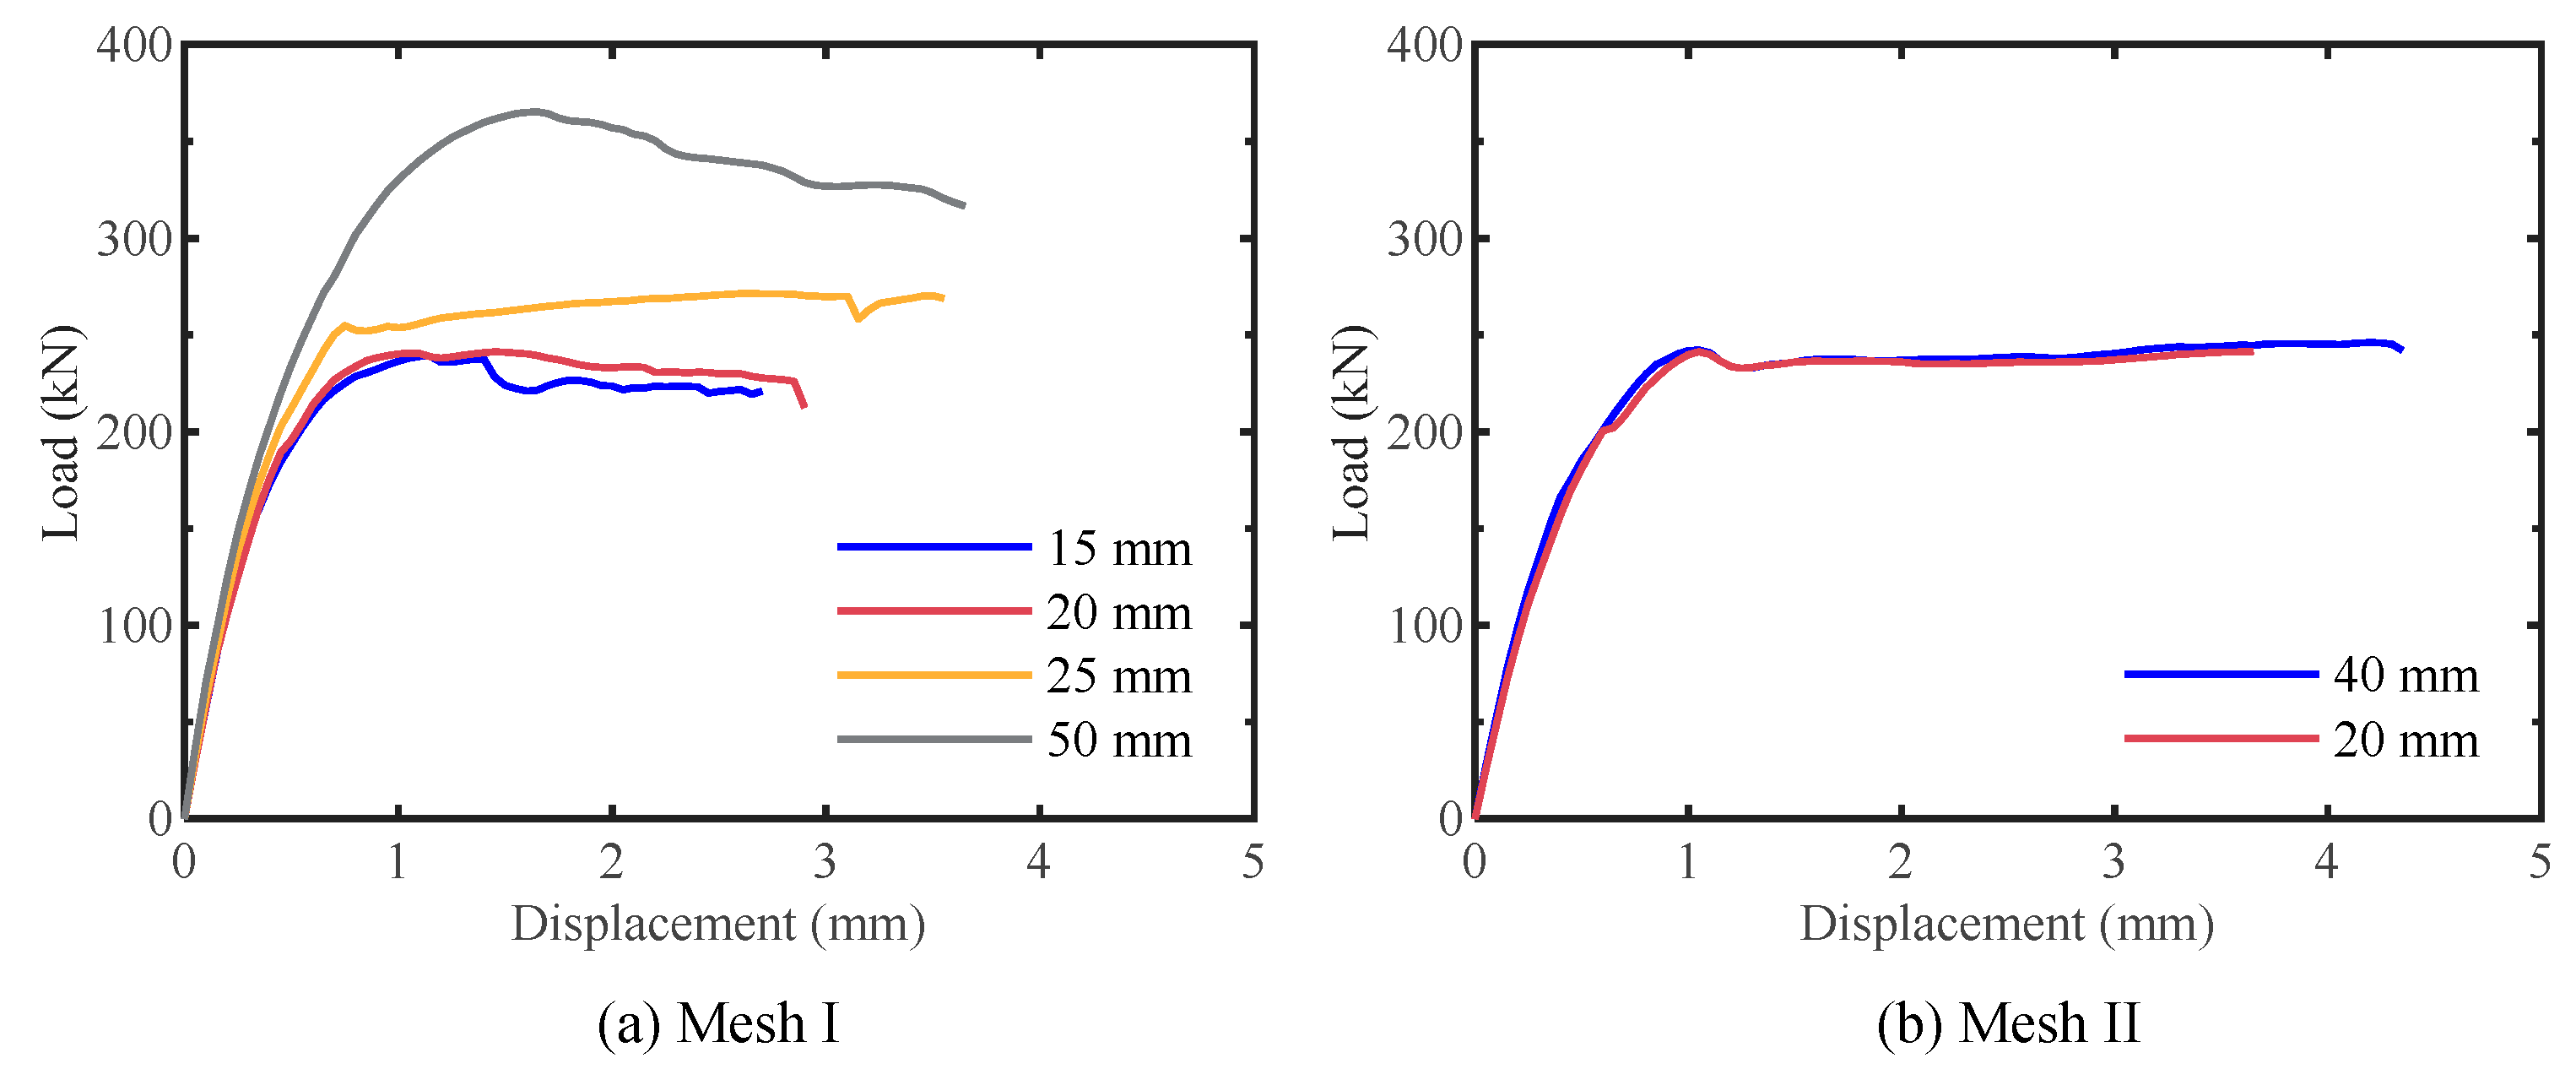
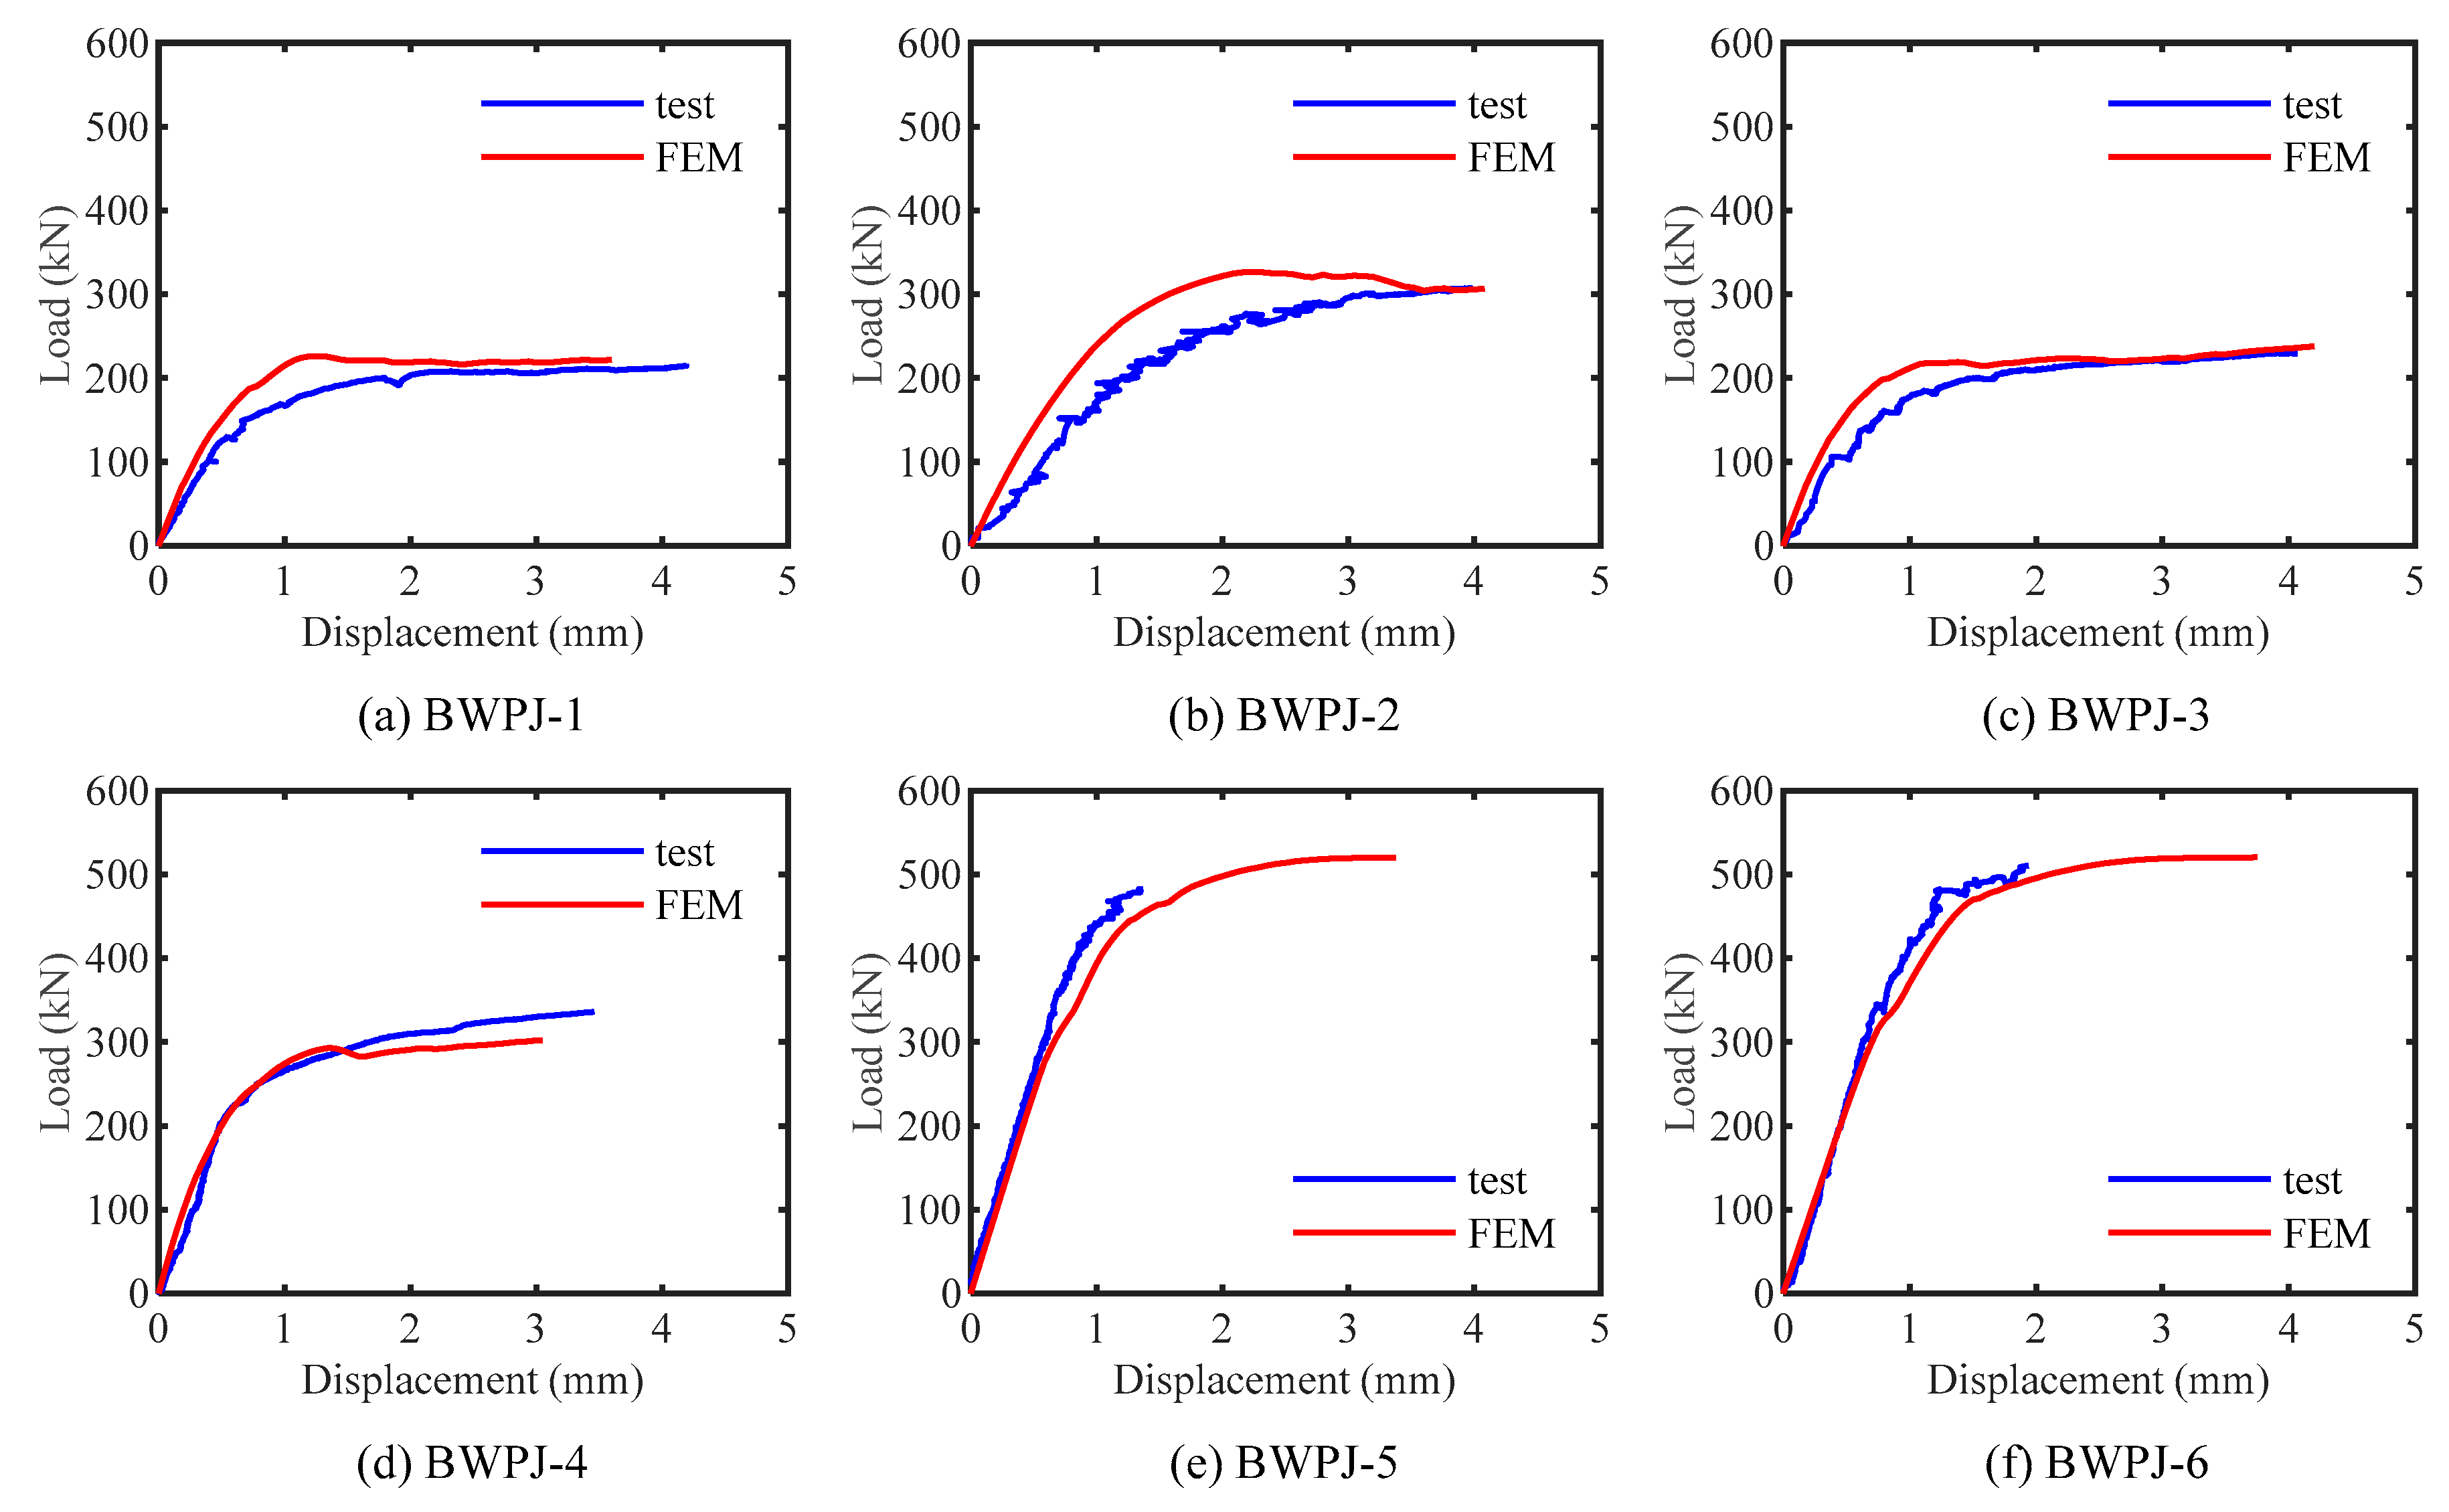
4.1. Load-Displacement Curves
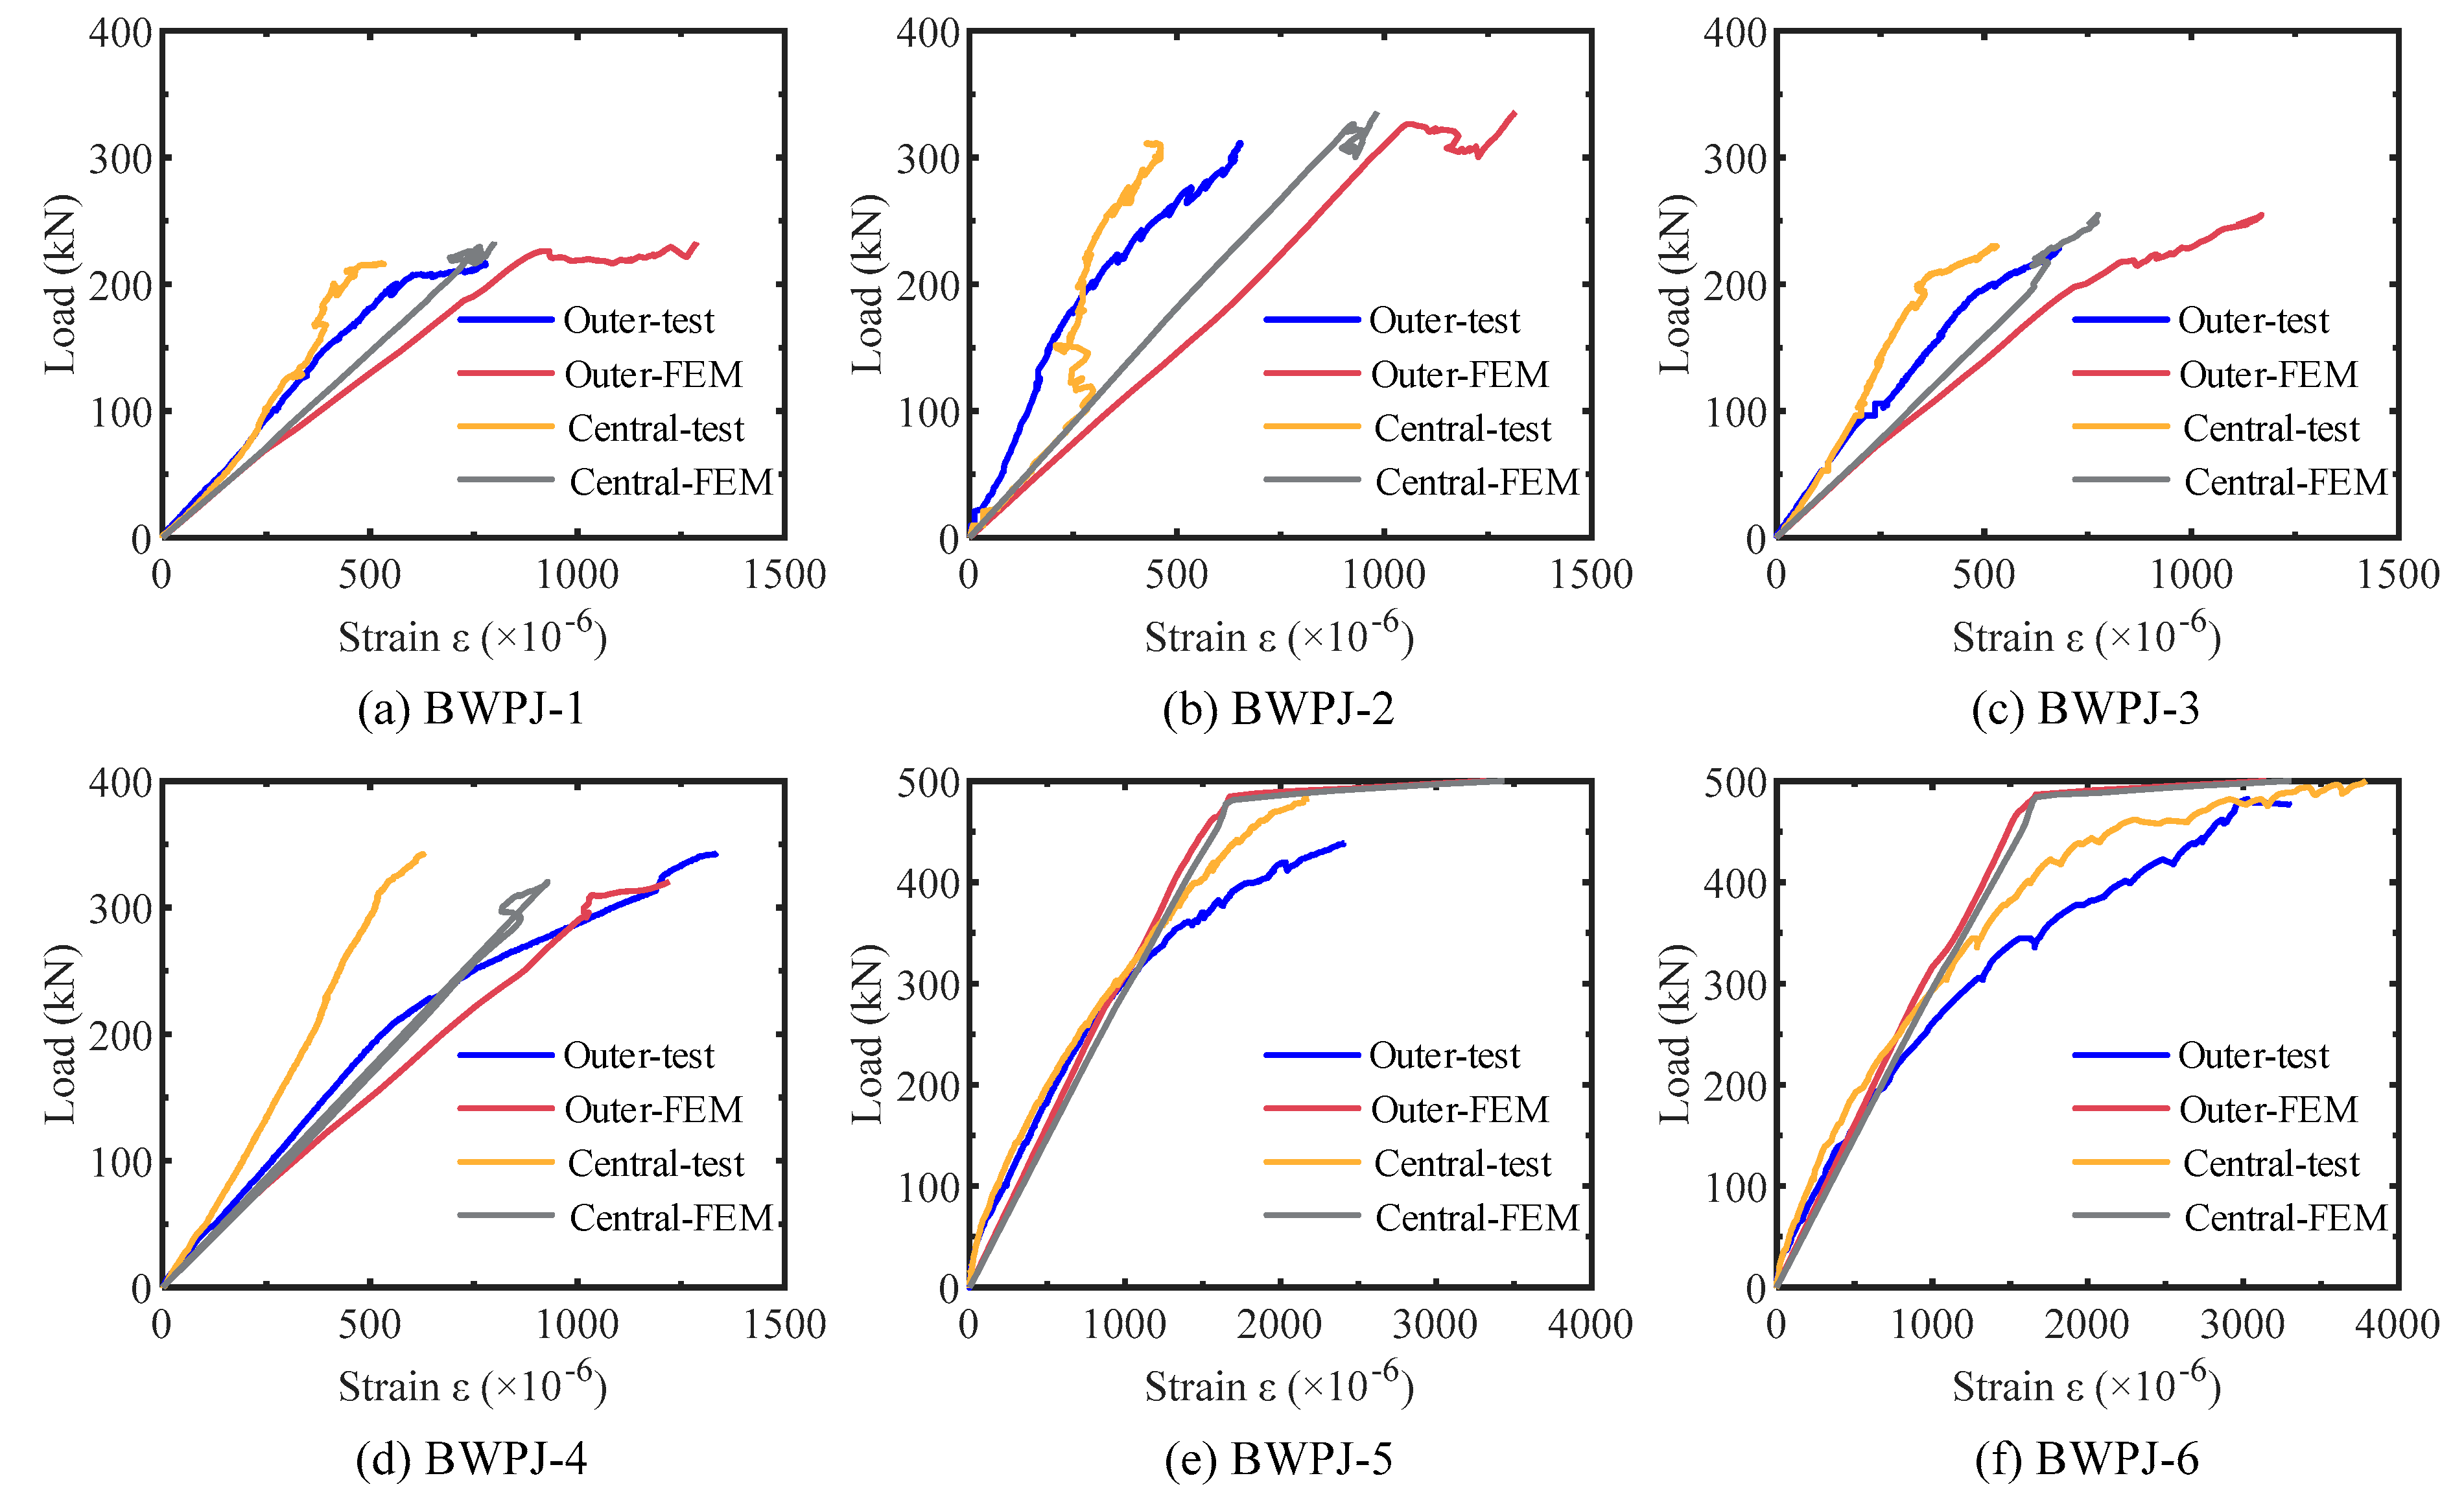
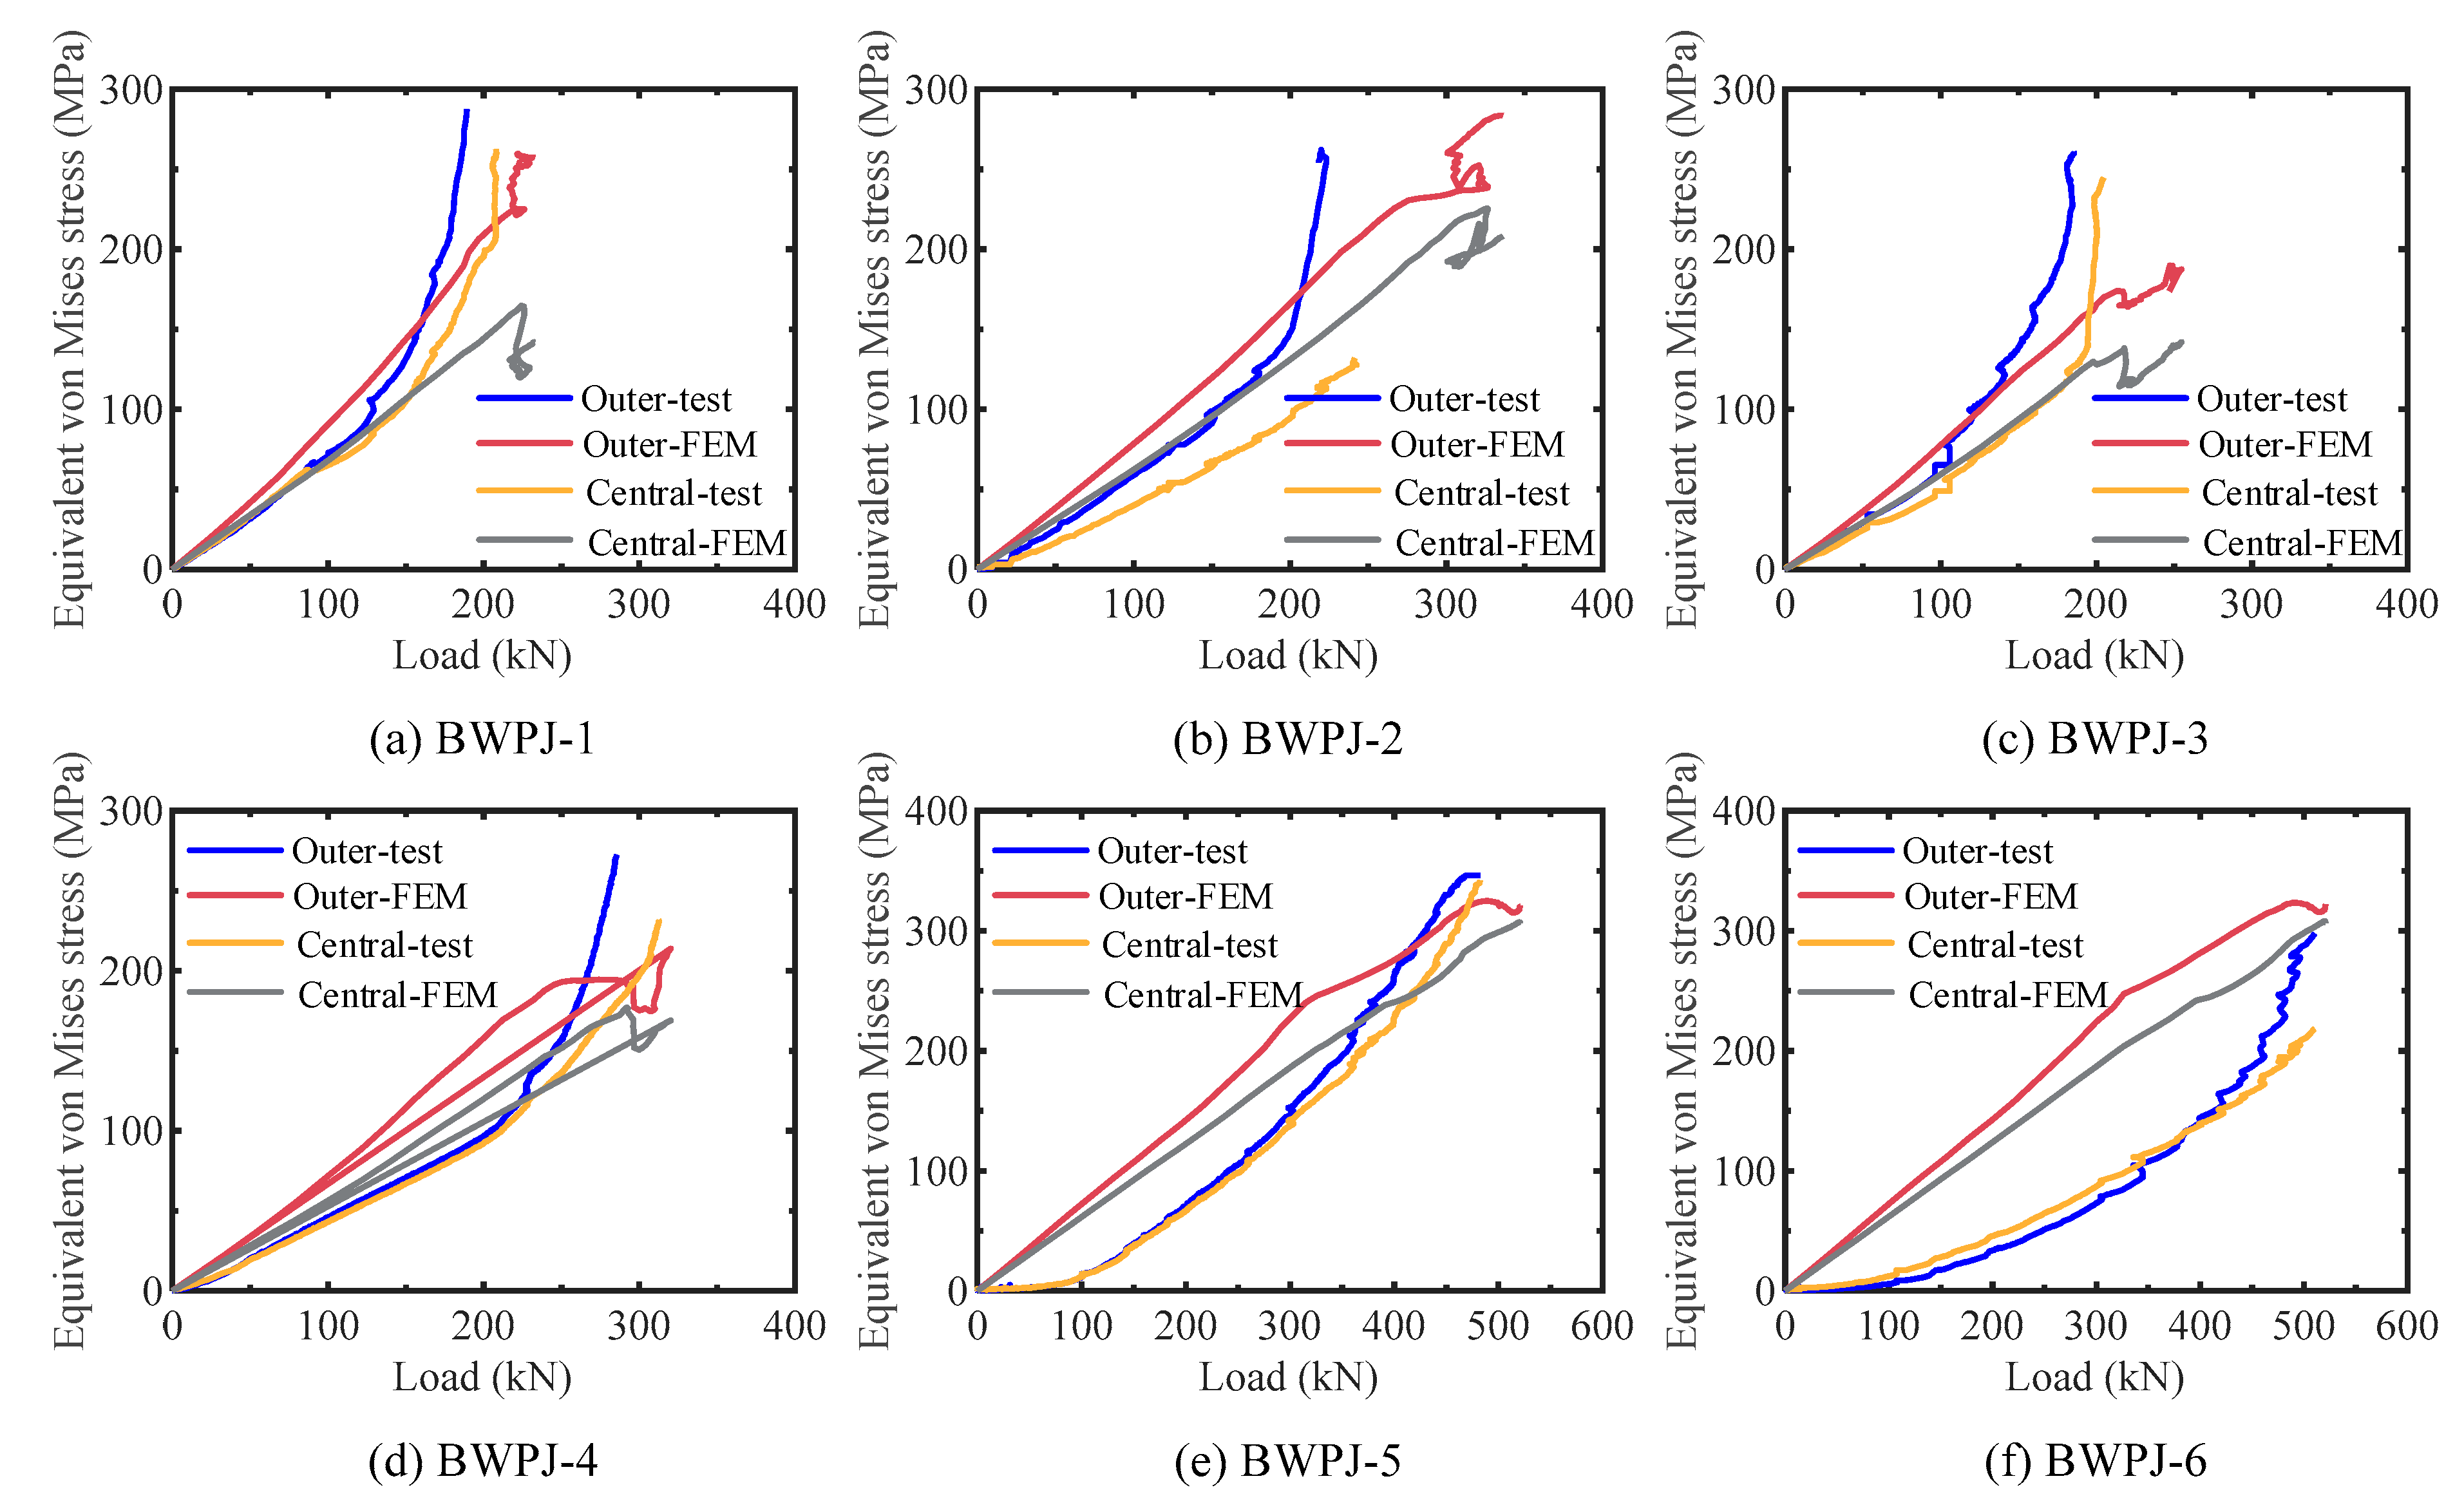
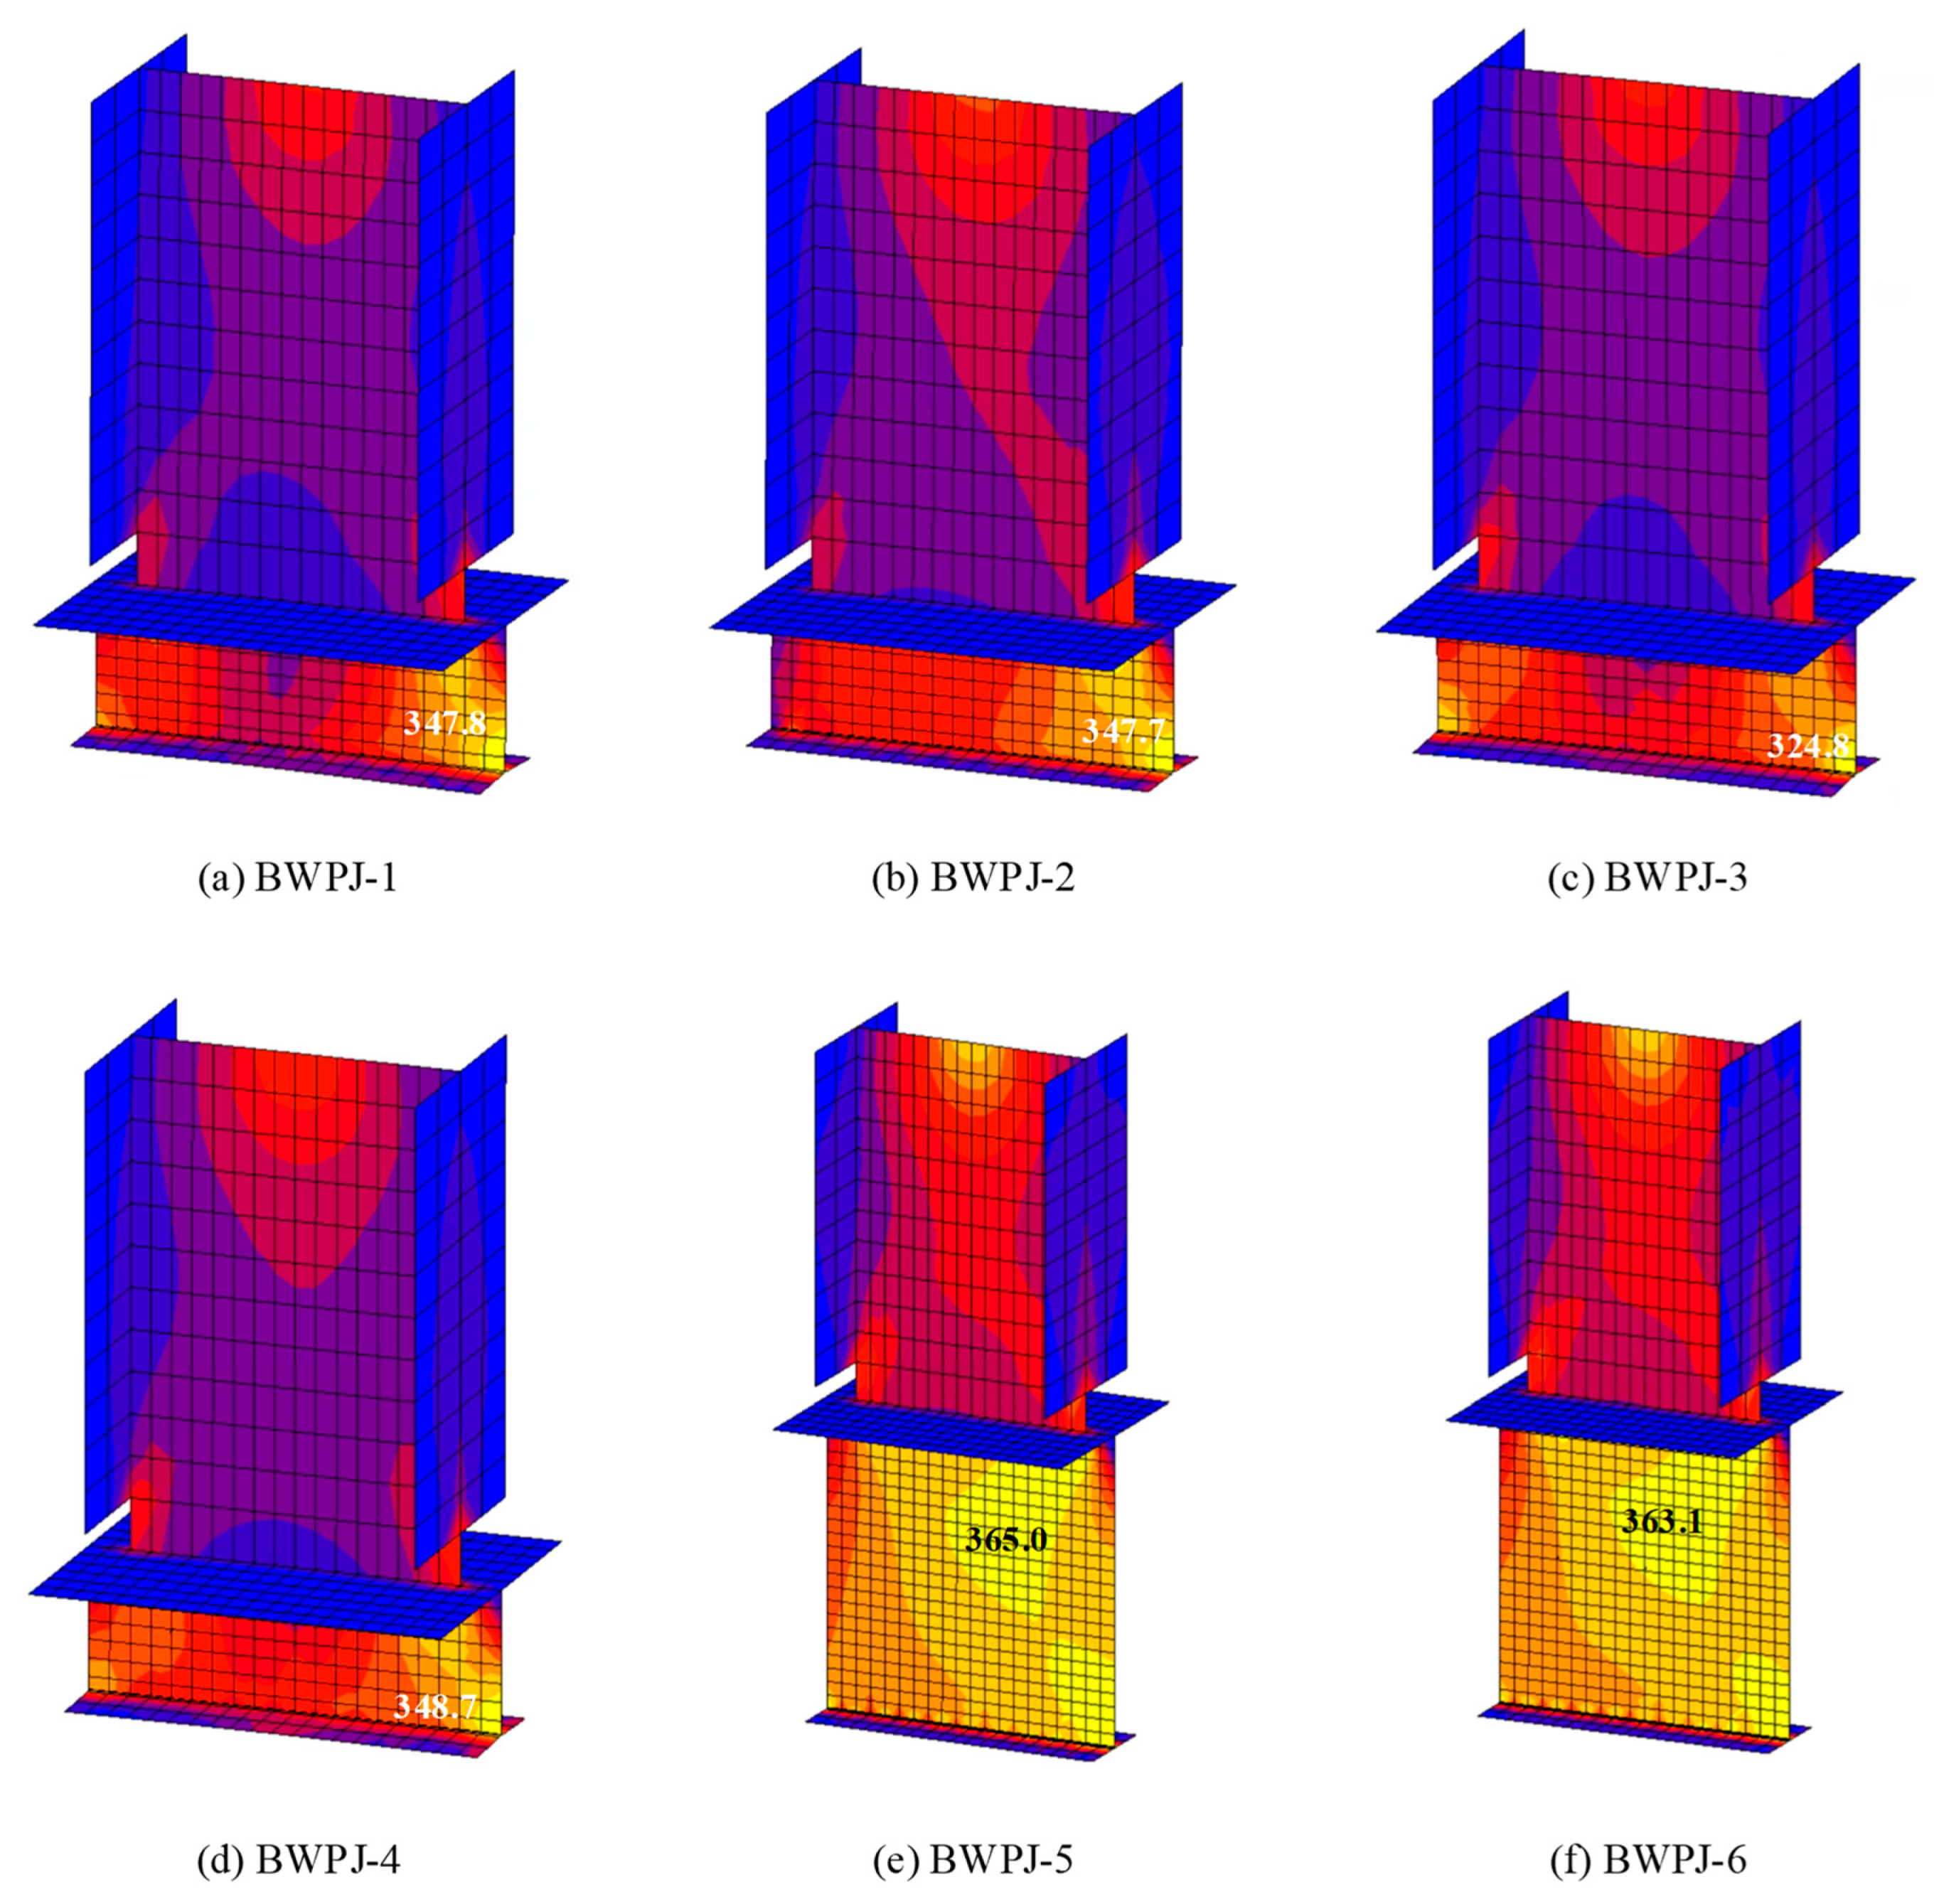
4.2. Strain and Stress Development of the T-stub Connector
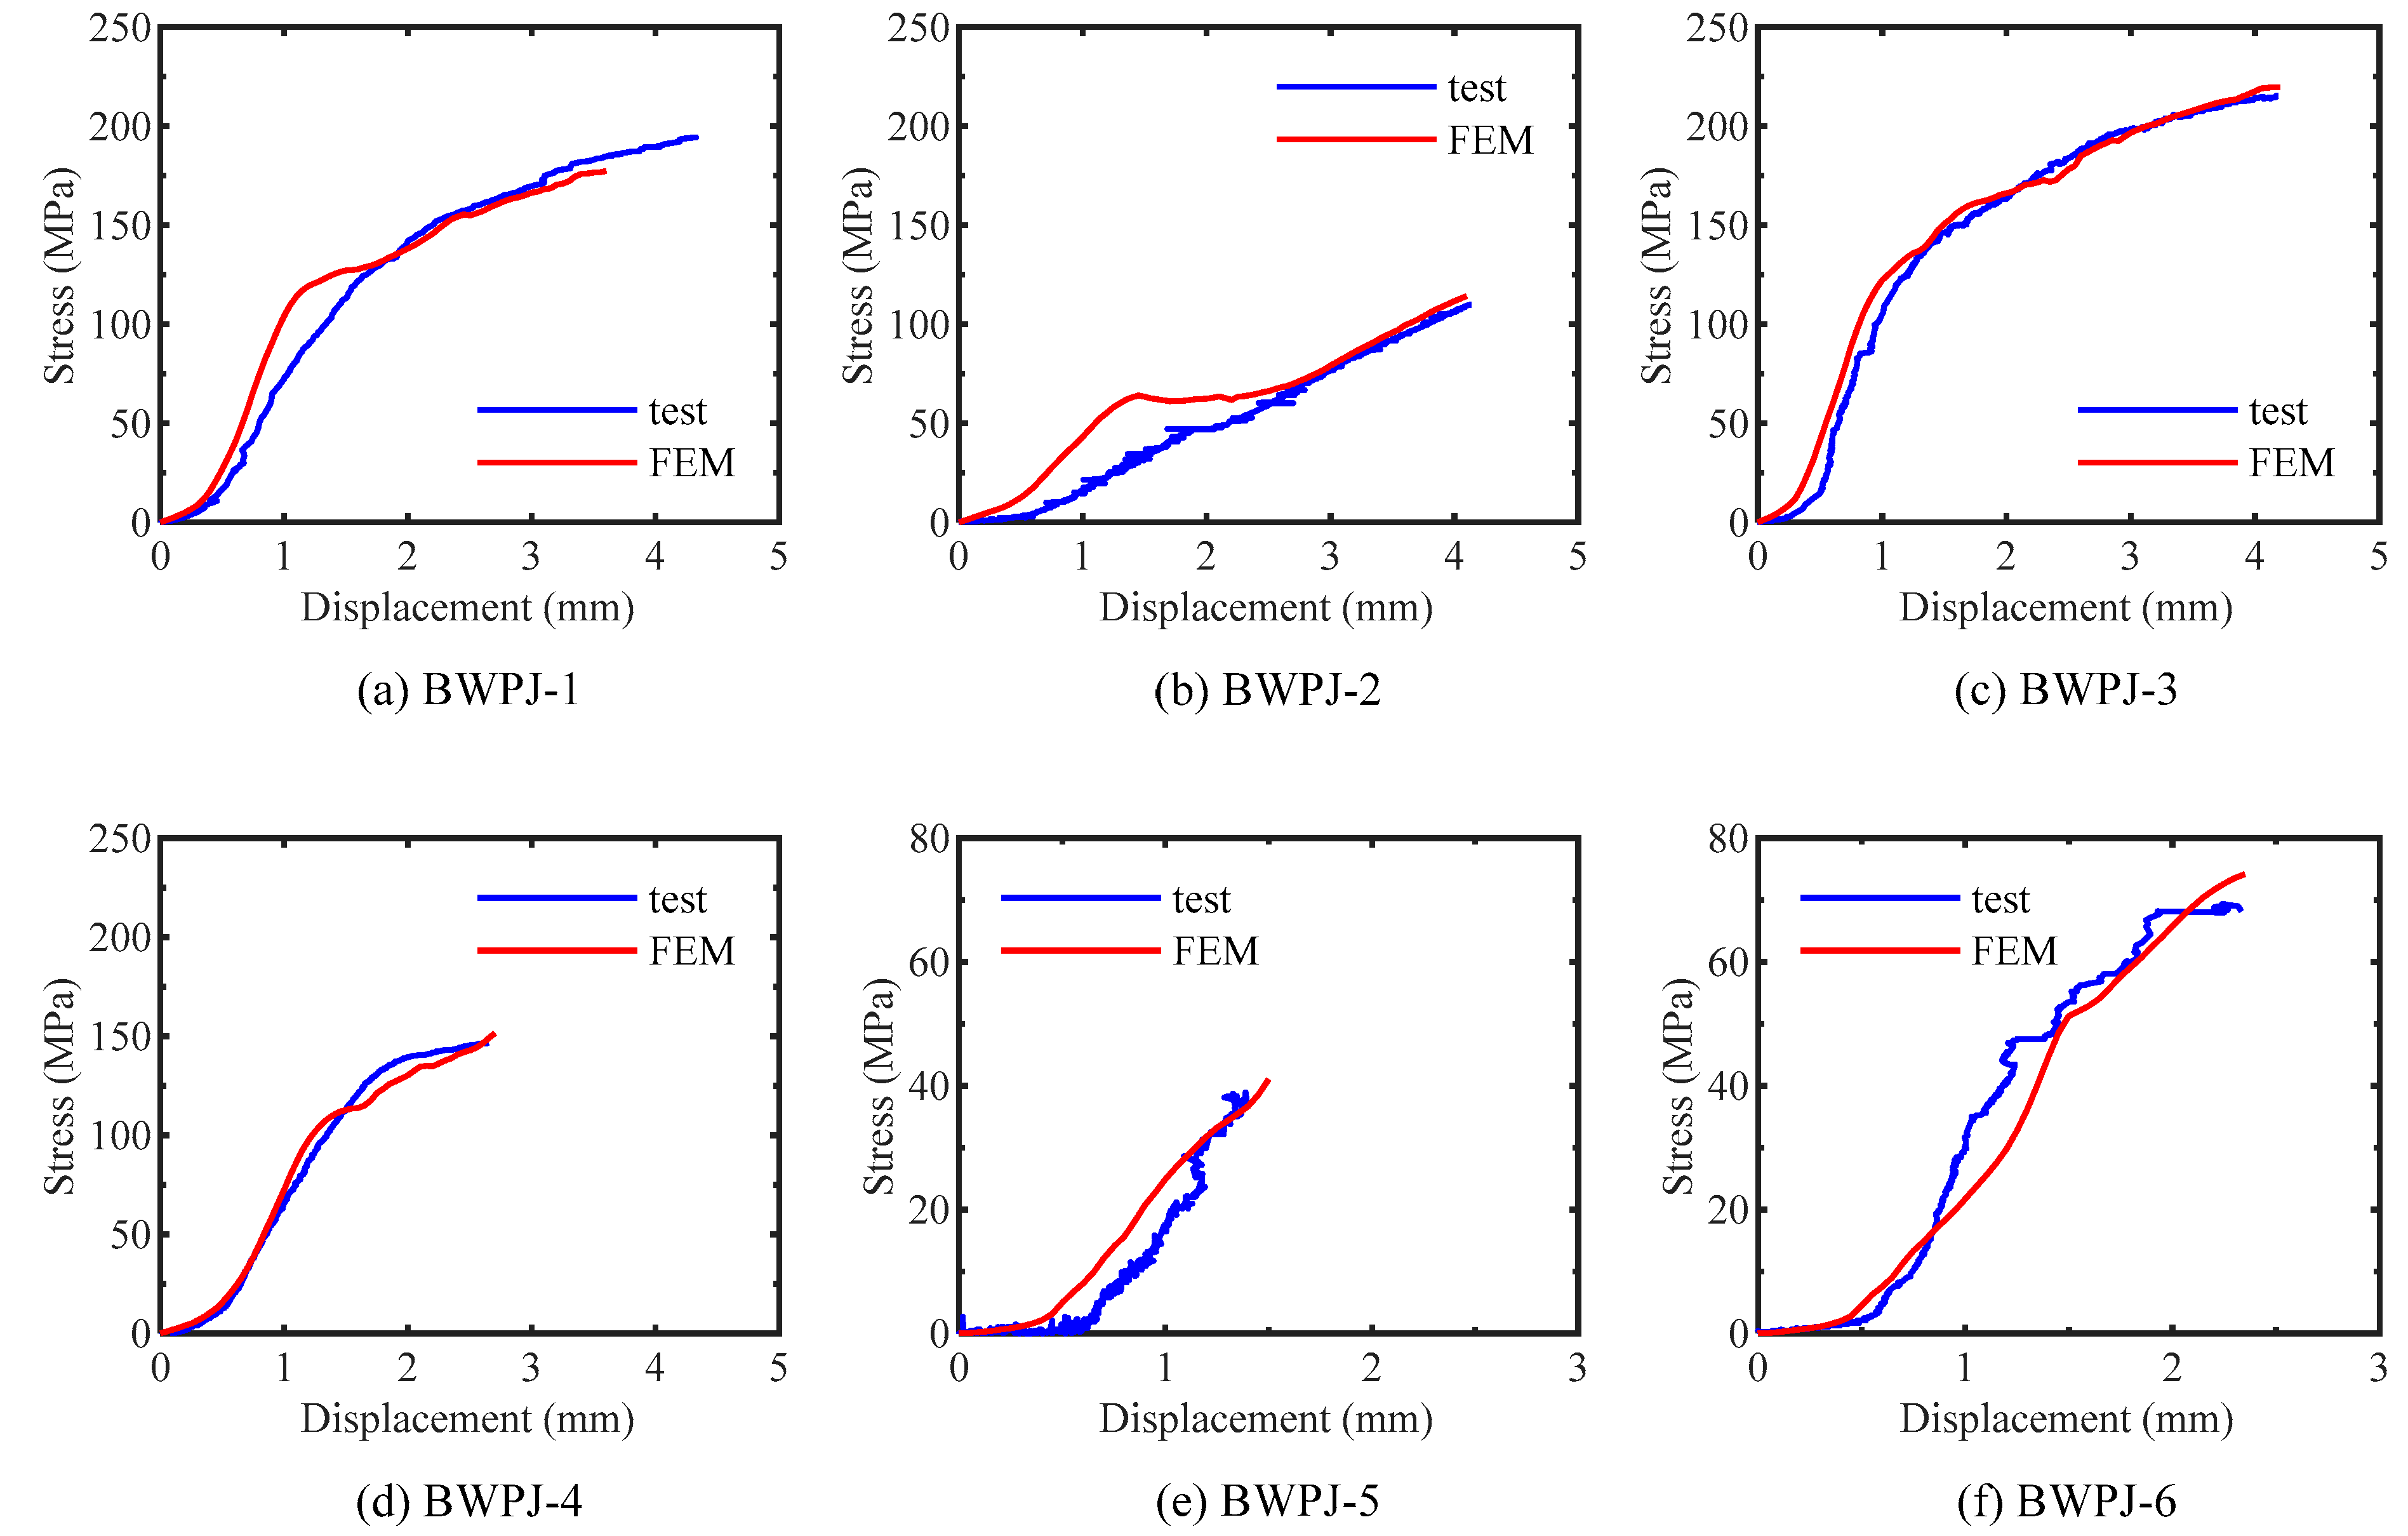
4.3. Stress Development of the Stirrups
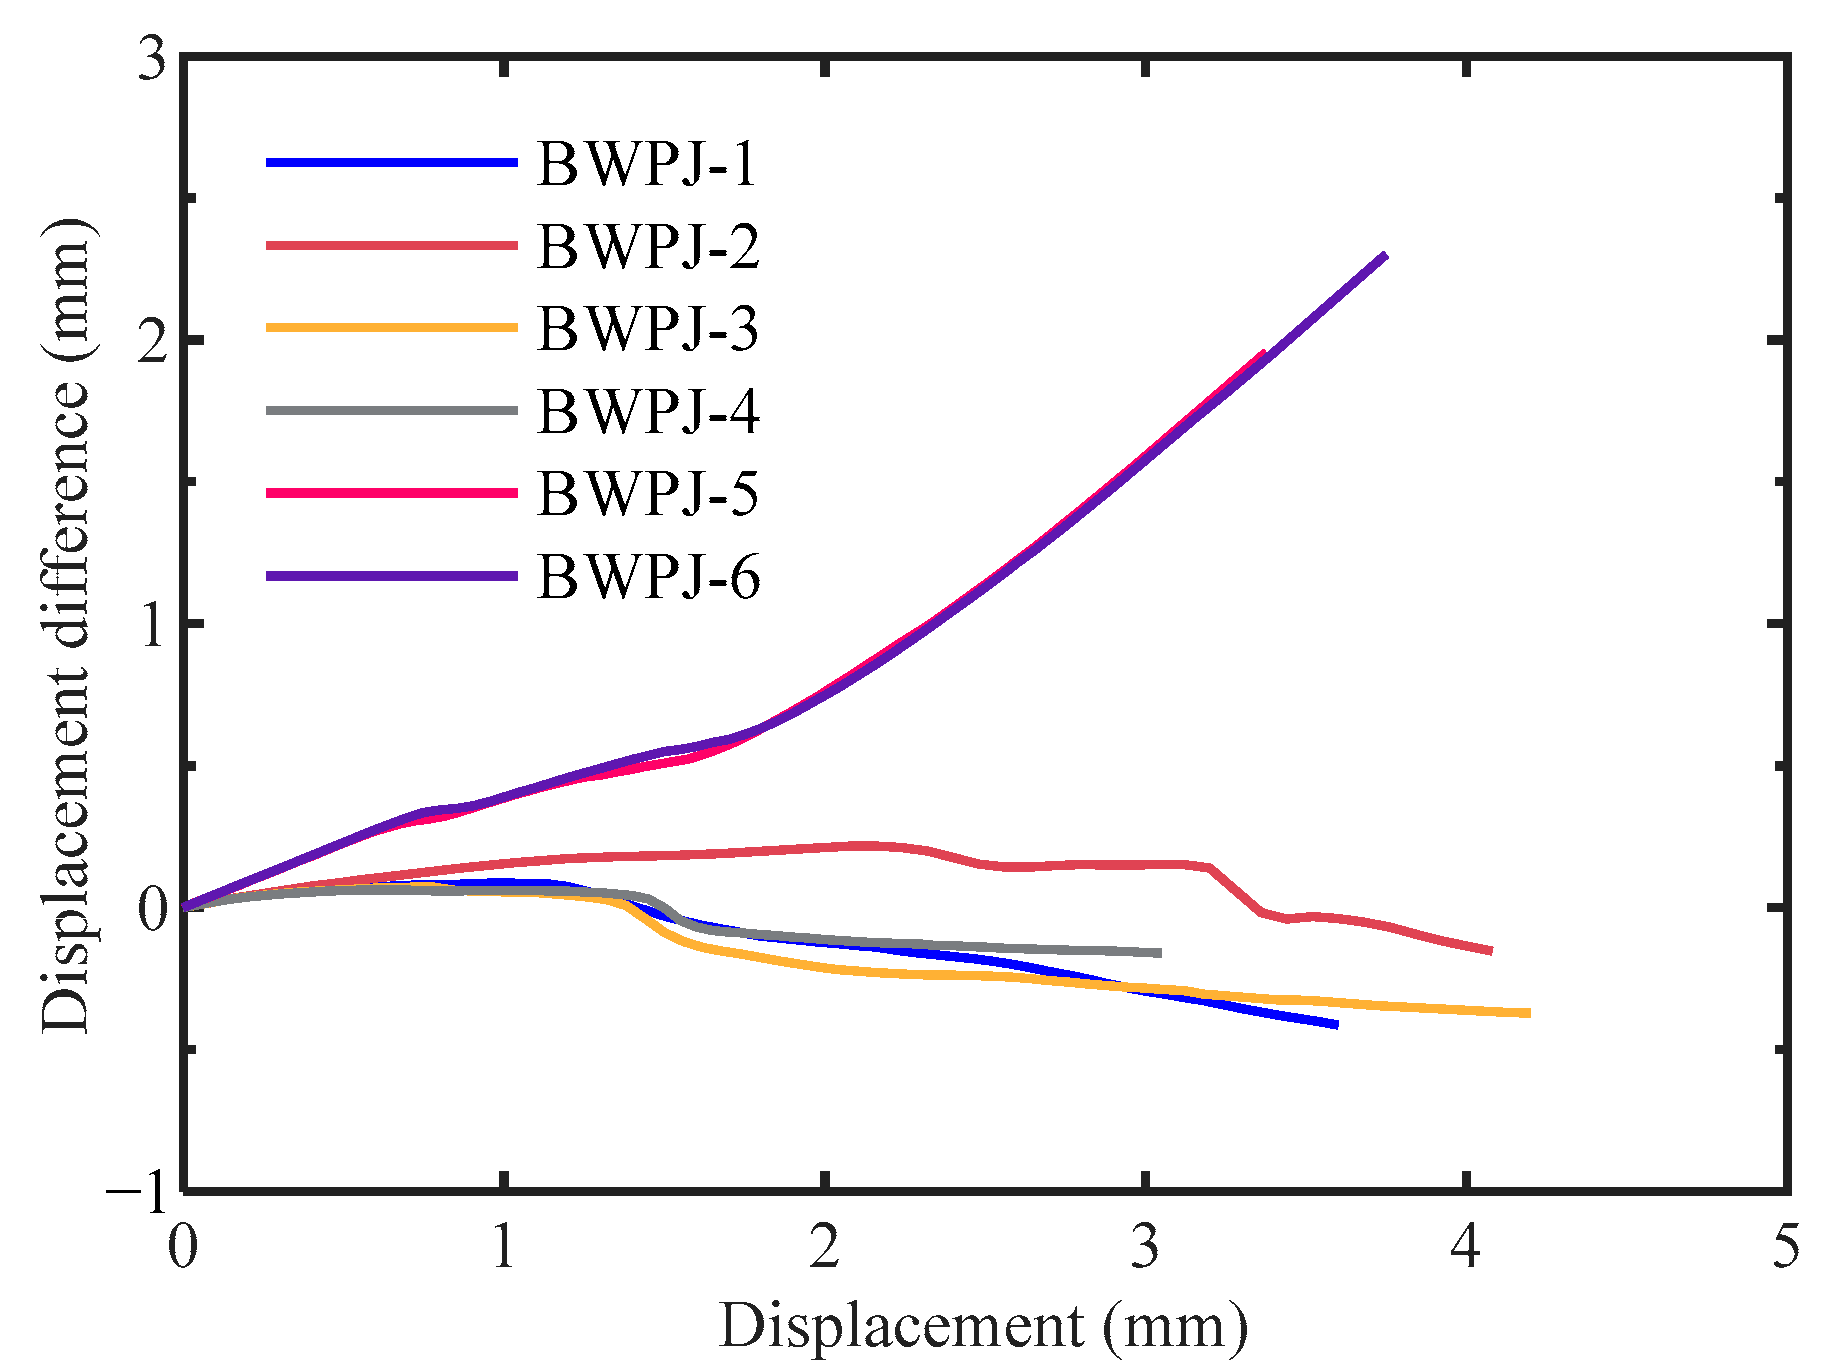
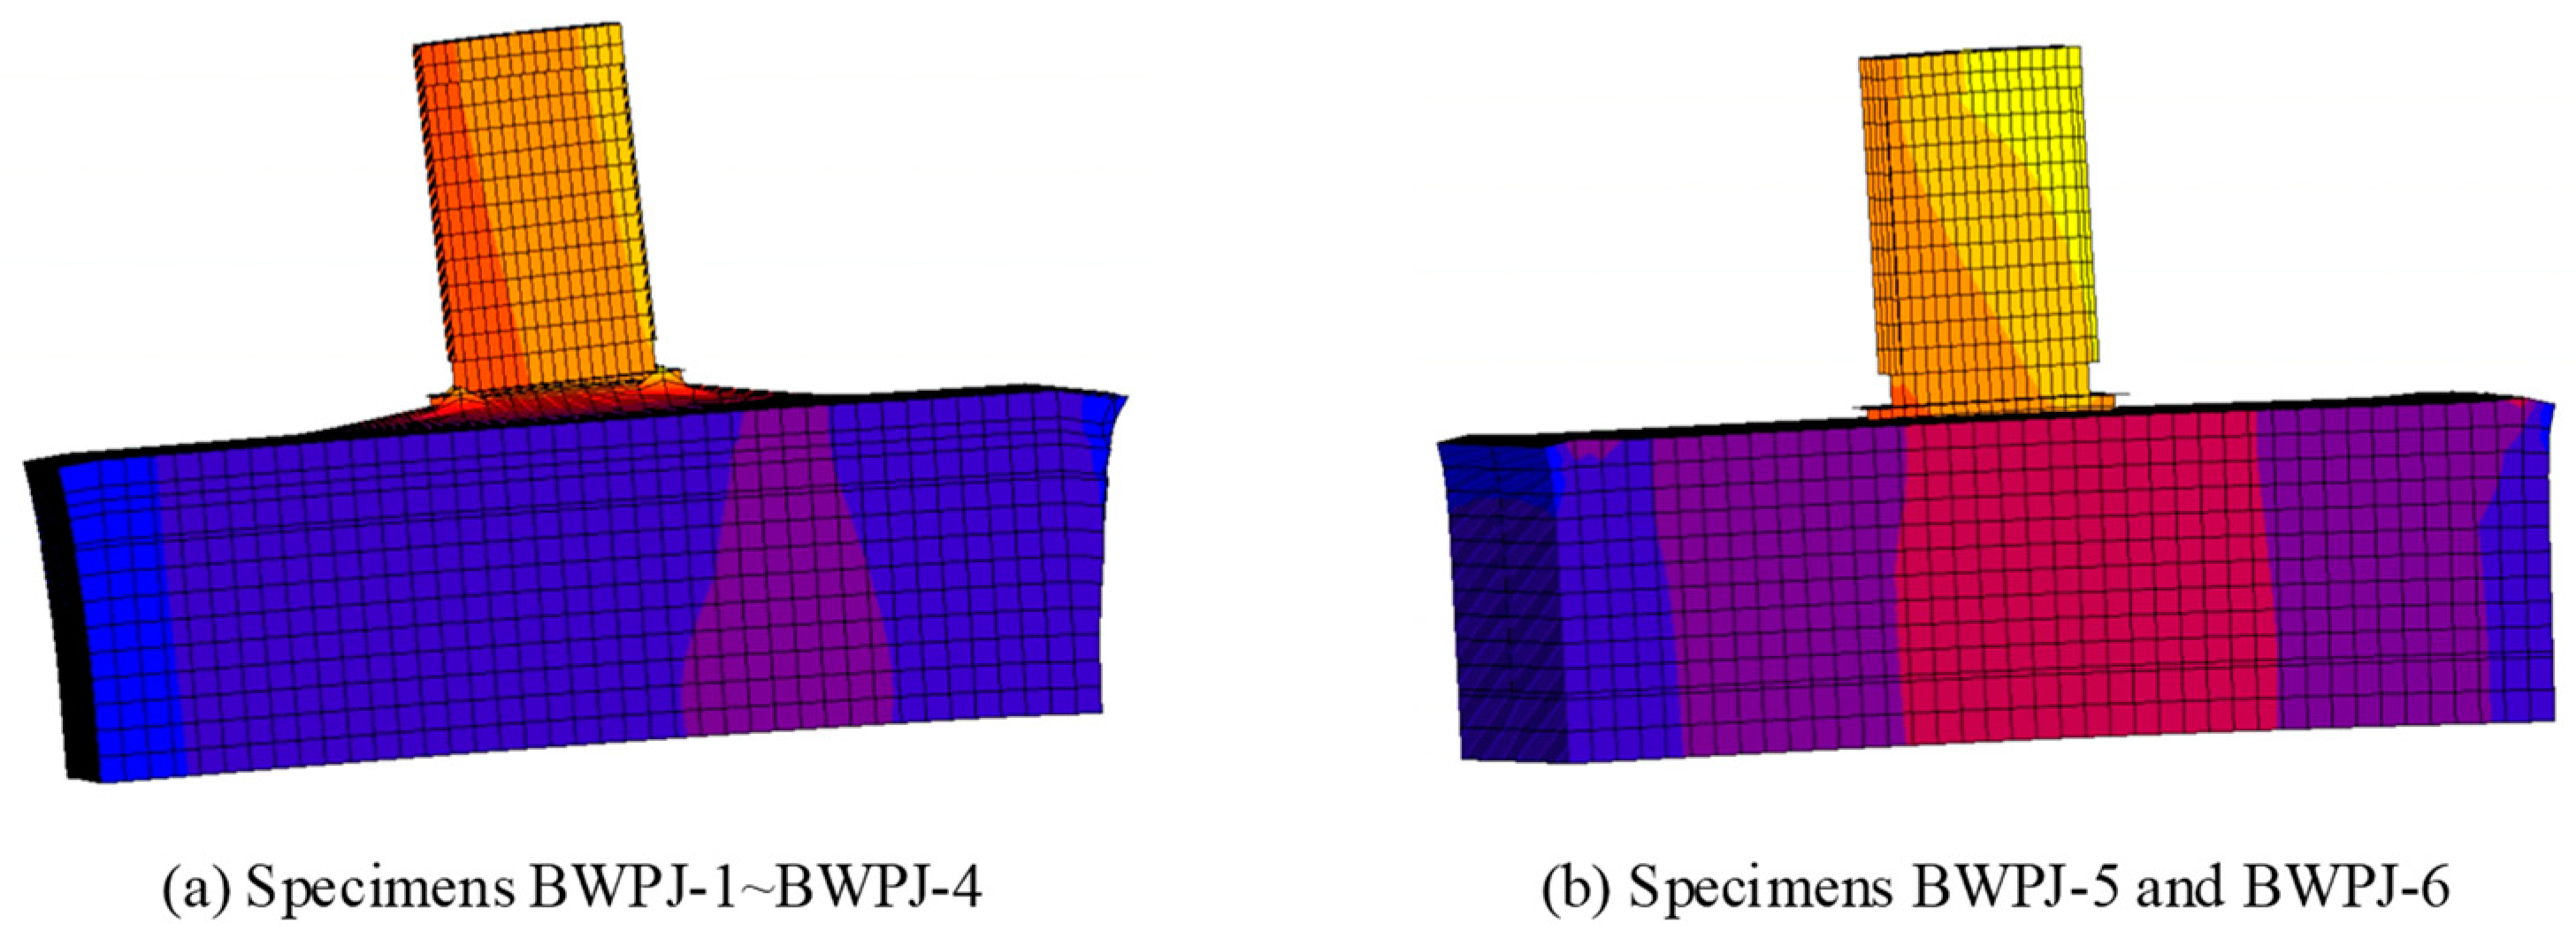
4.4. Pull-Out Deformation
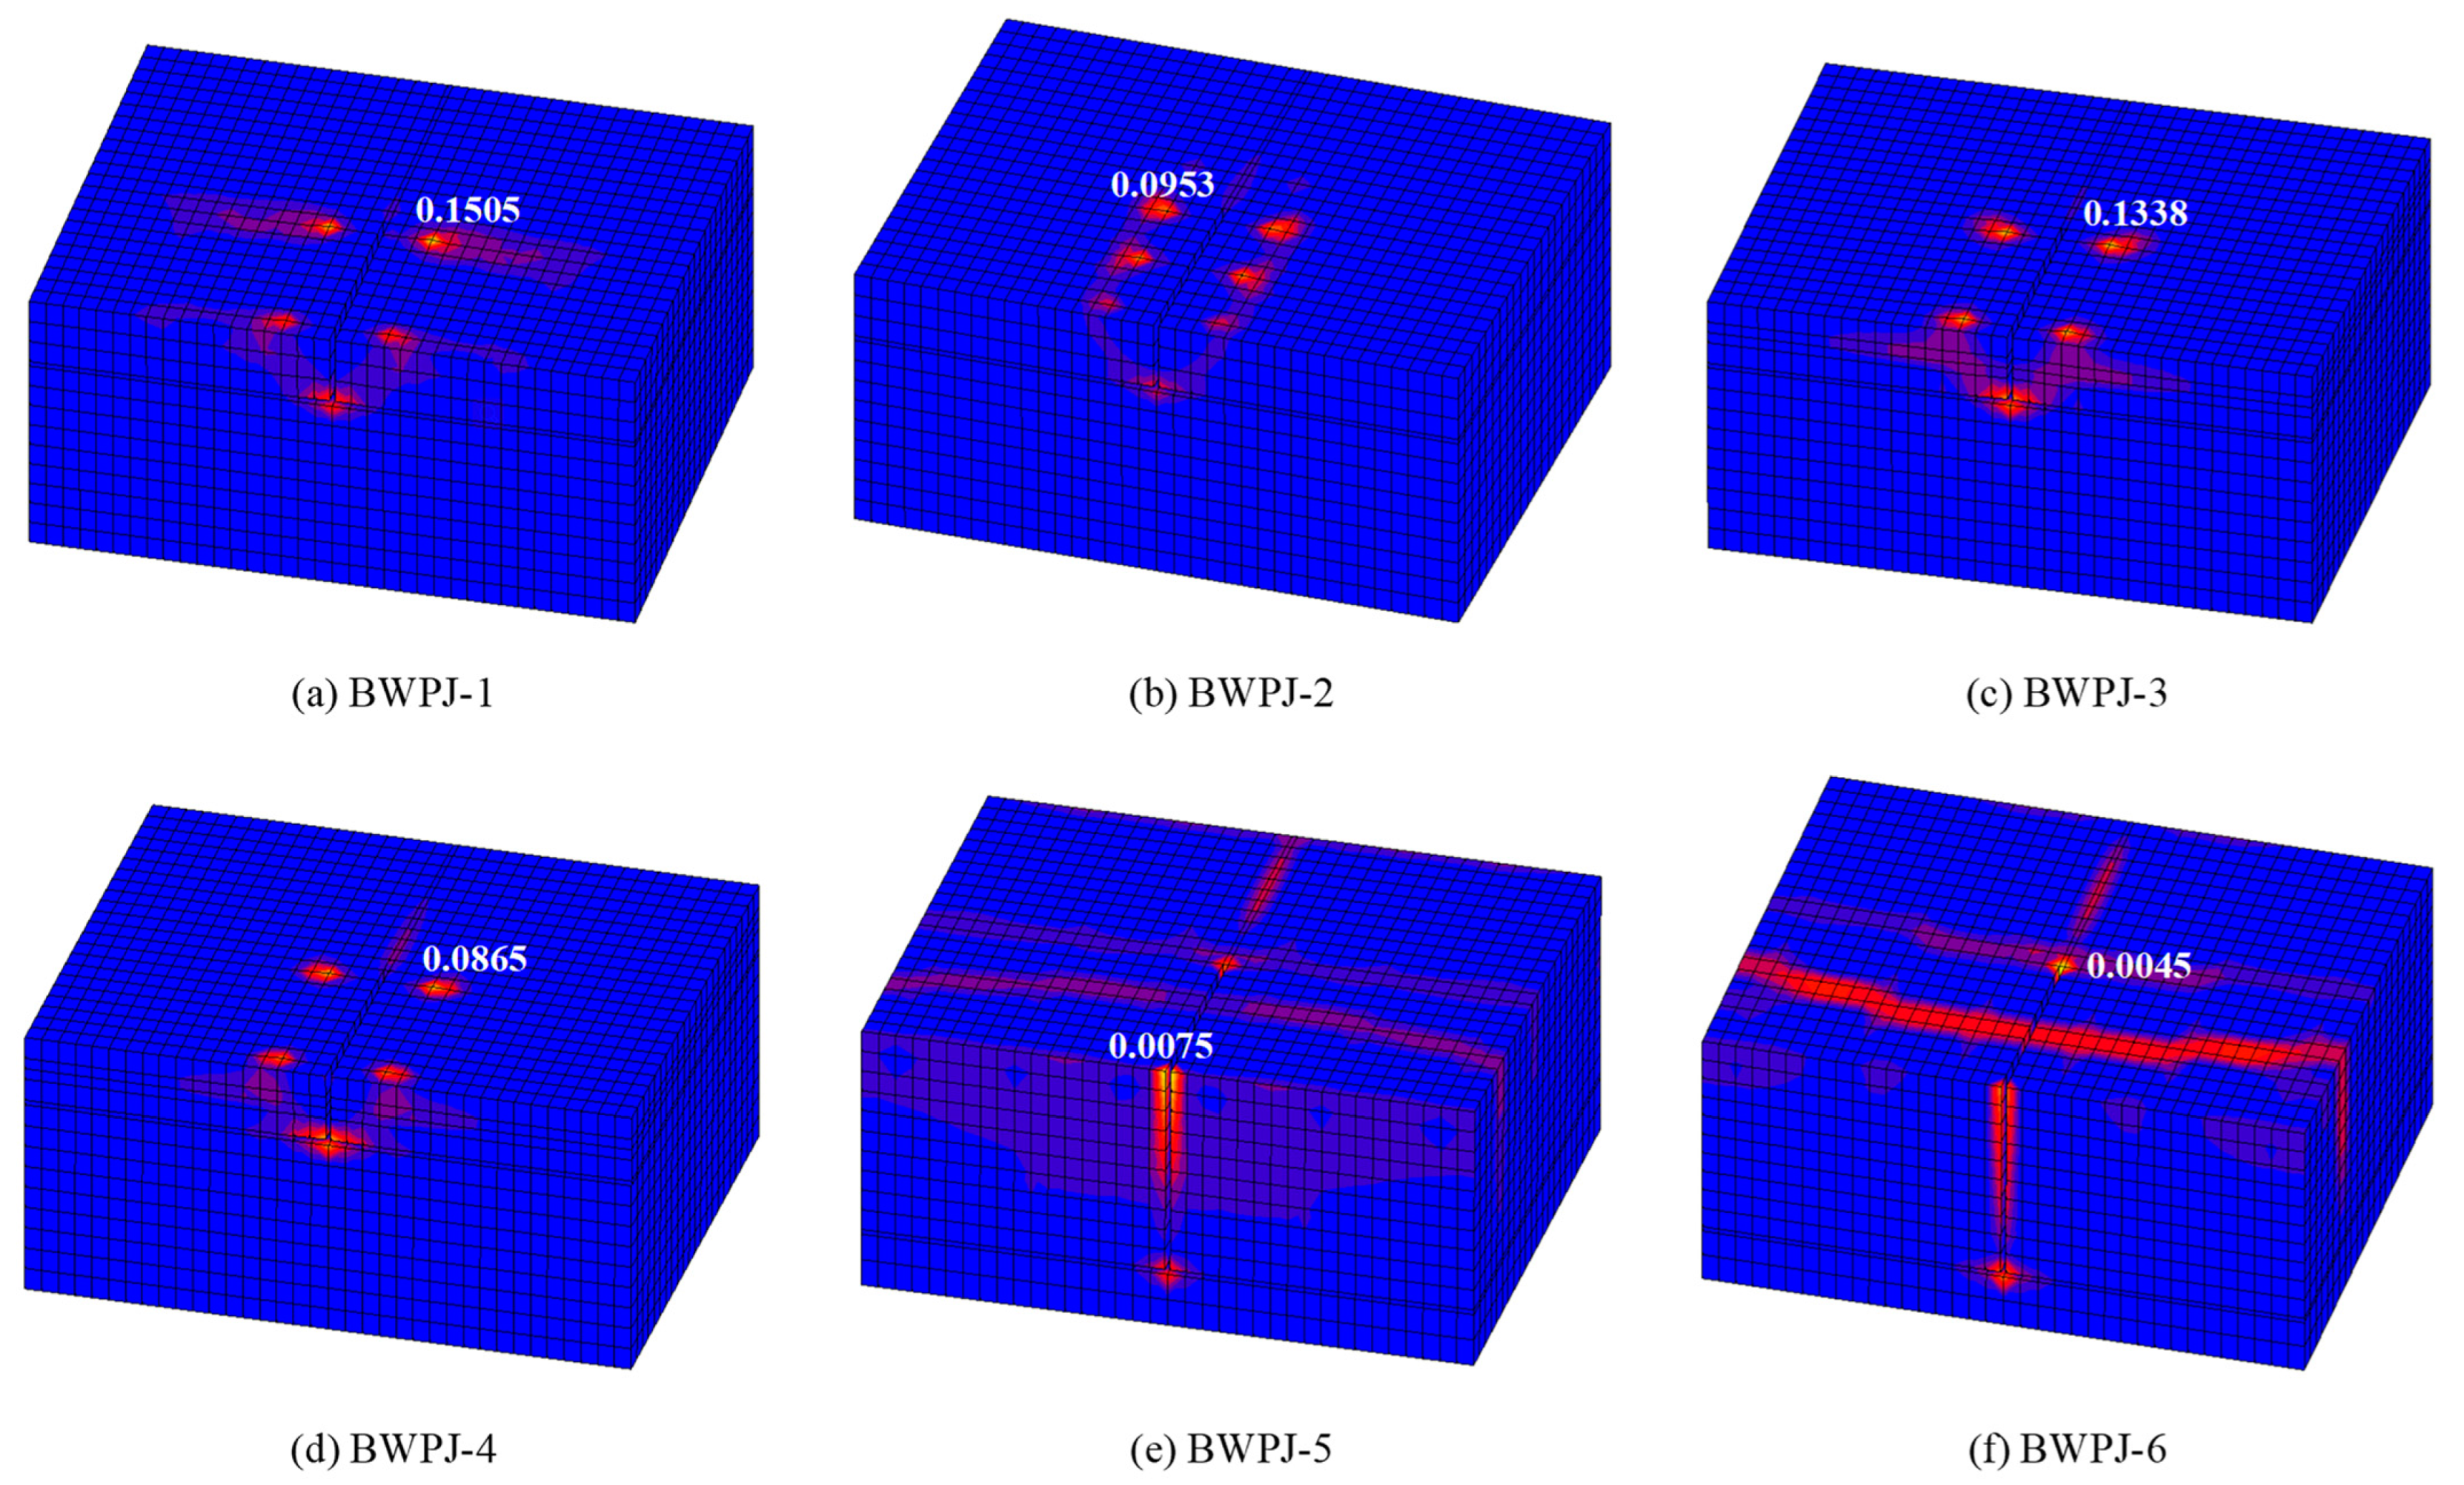
4.5. Failure Mode
5. Parametric Analyses
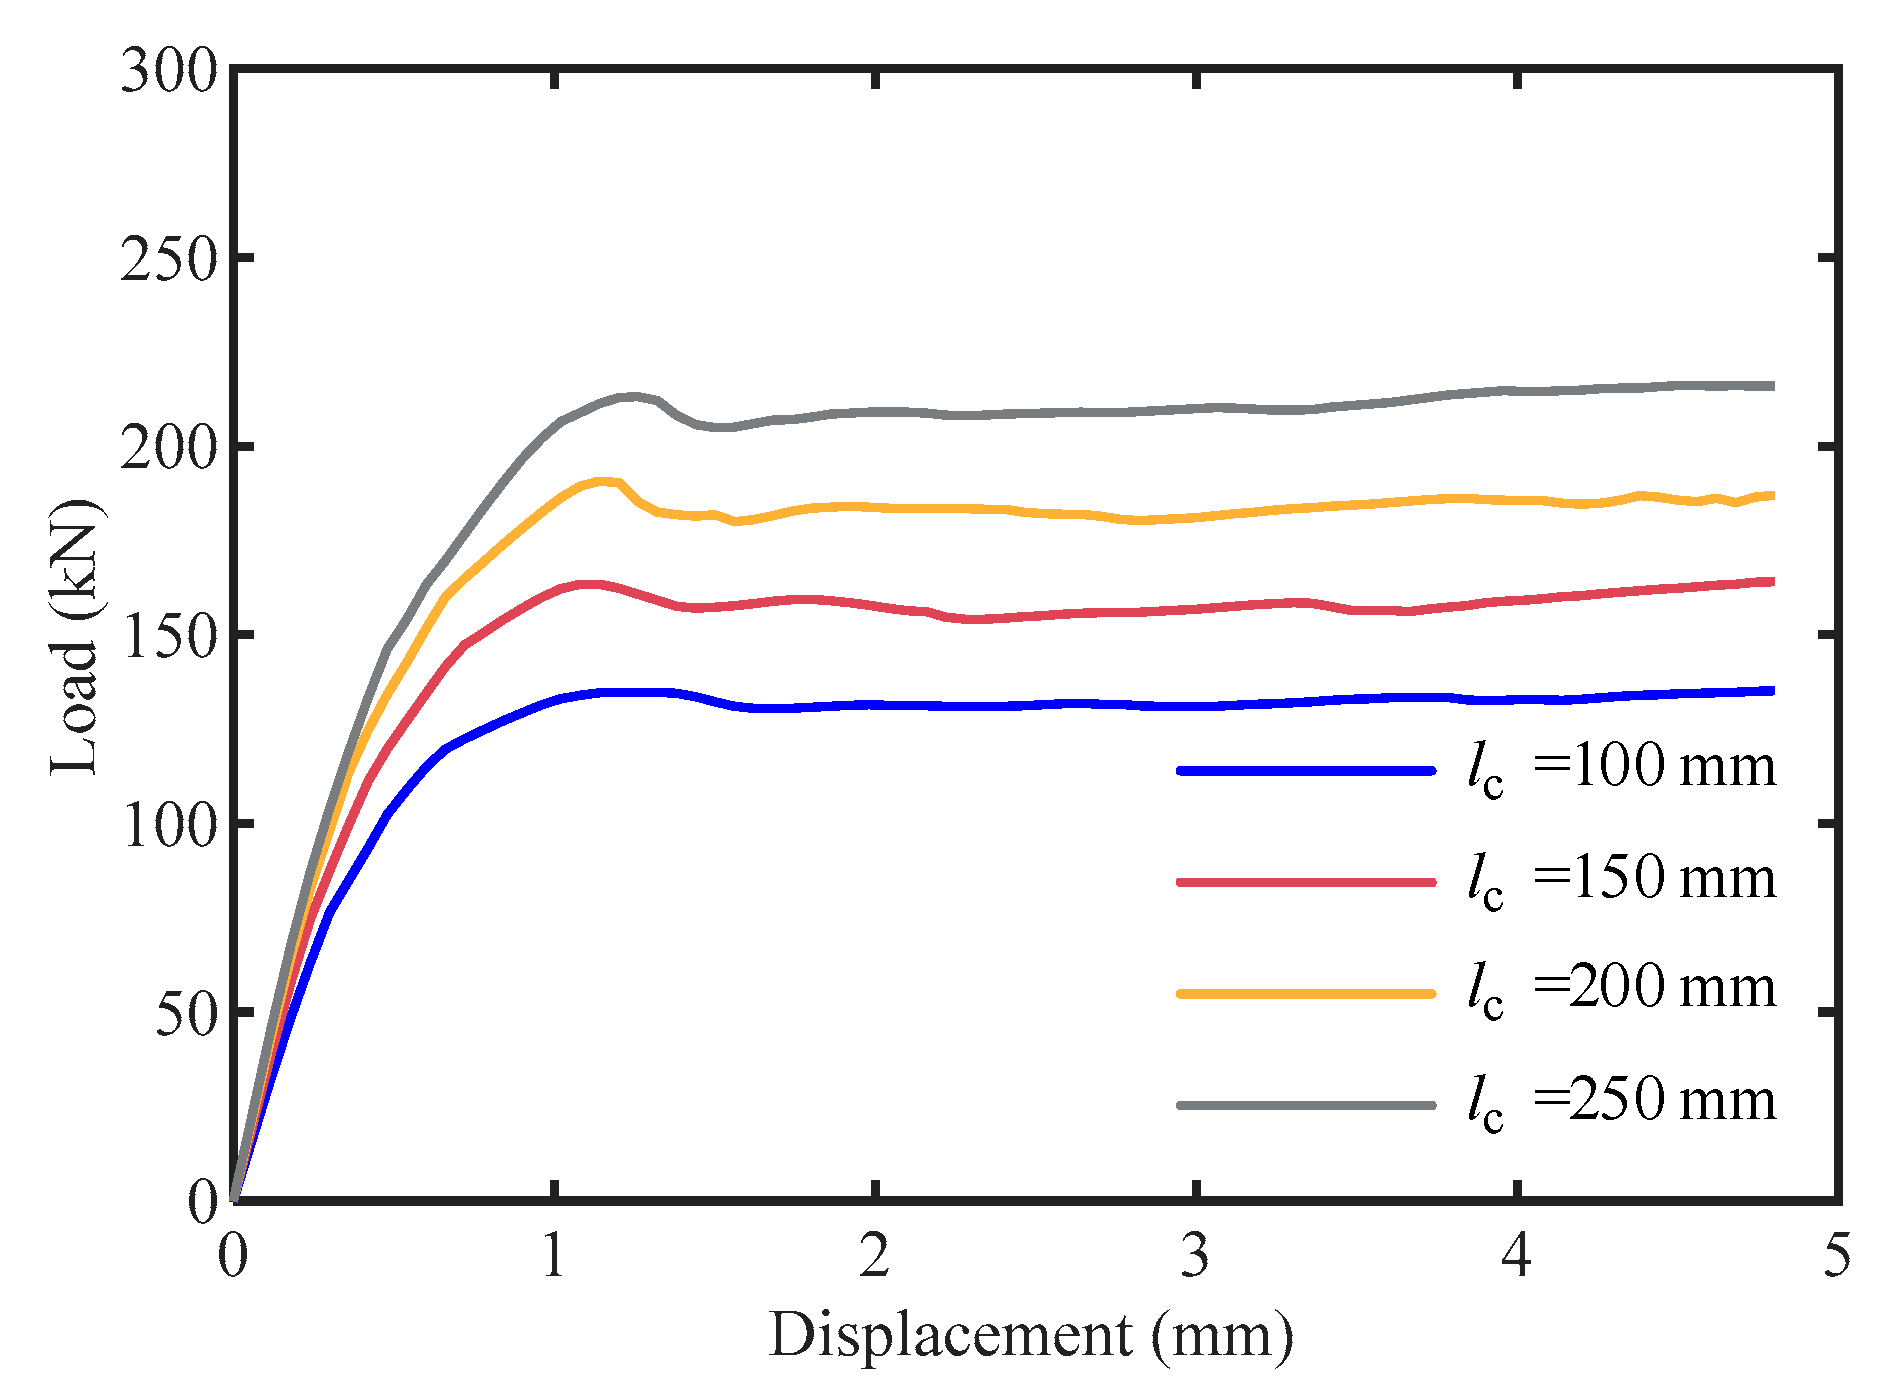
5.1. Length of the T-stub Connector lc
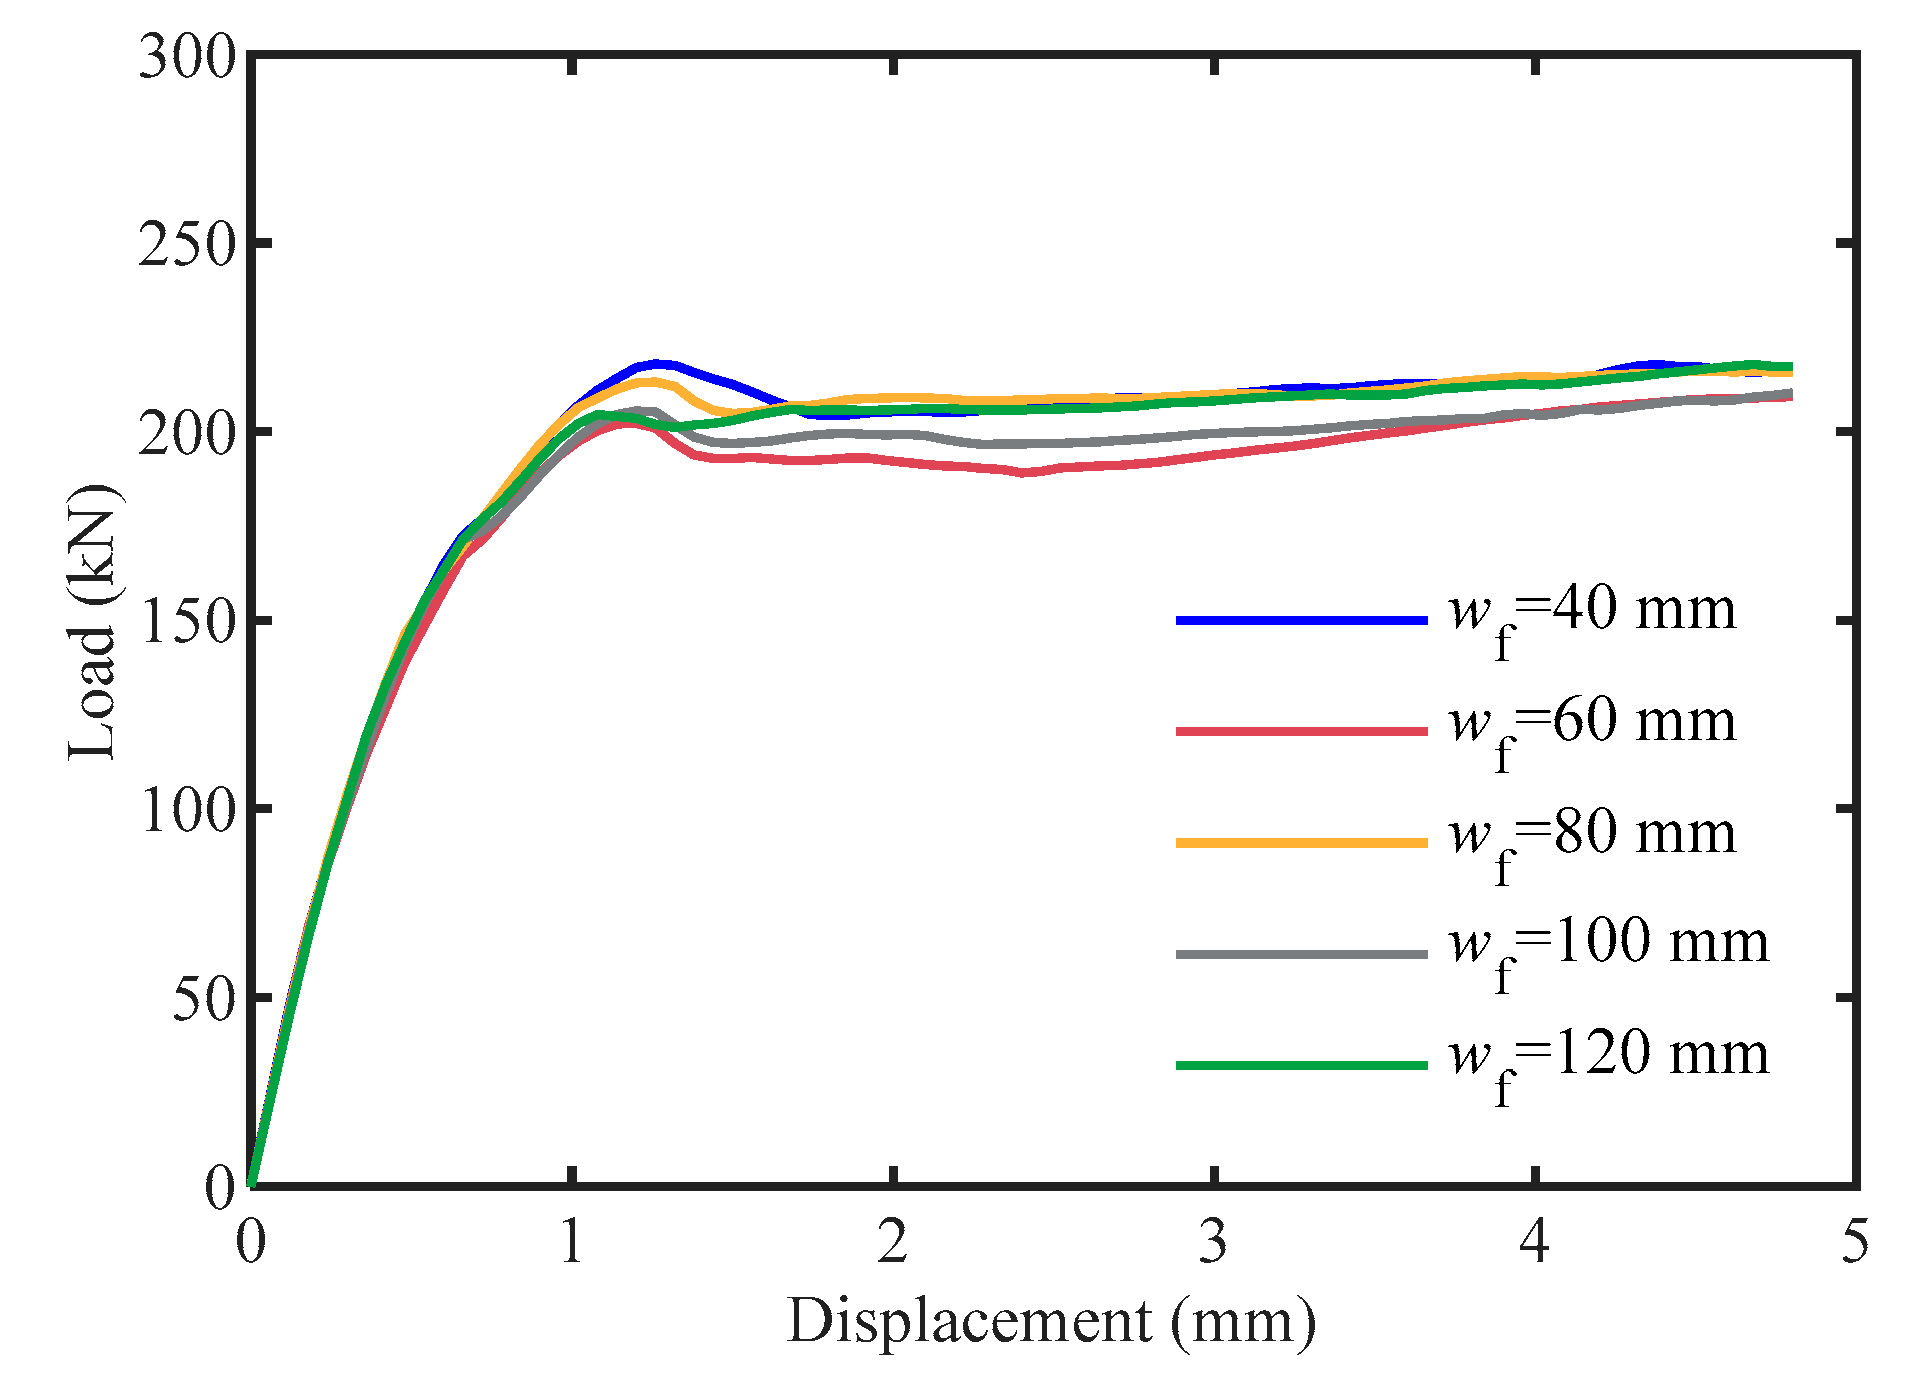
5.2. Flange width of the T-stub Connector wf
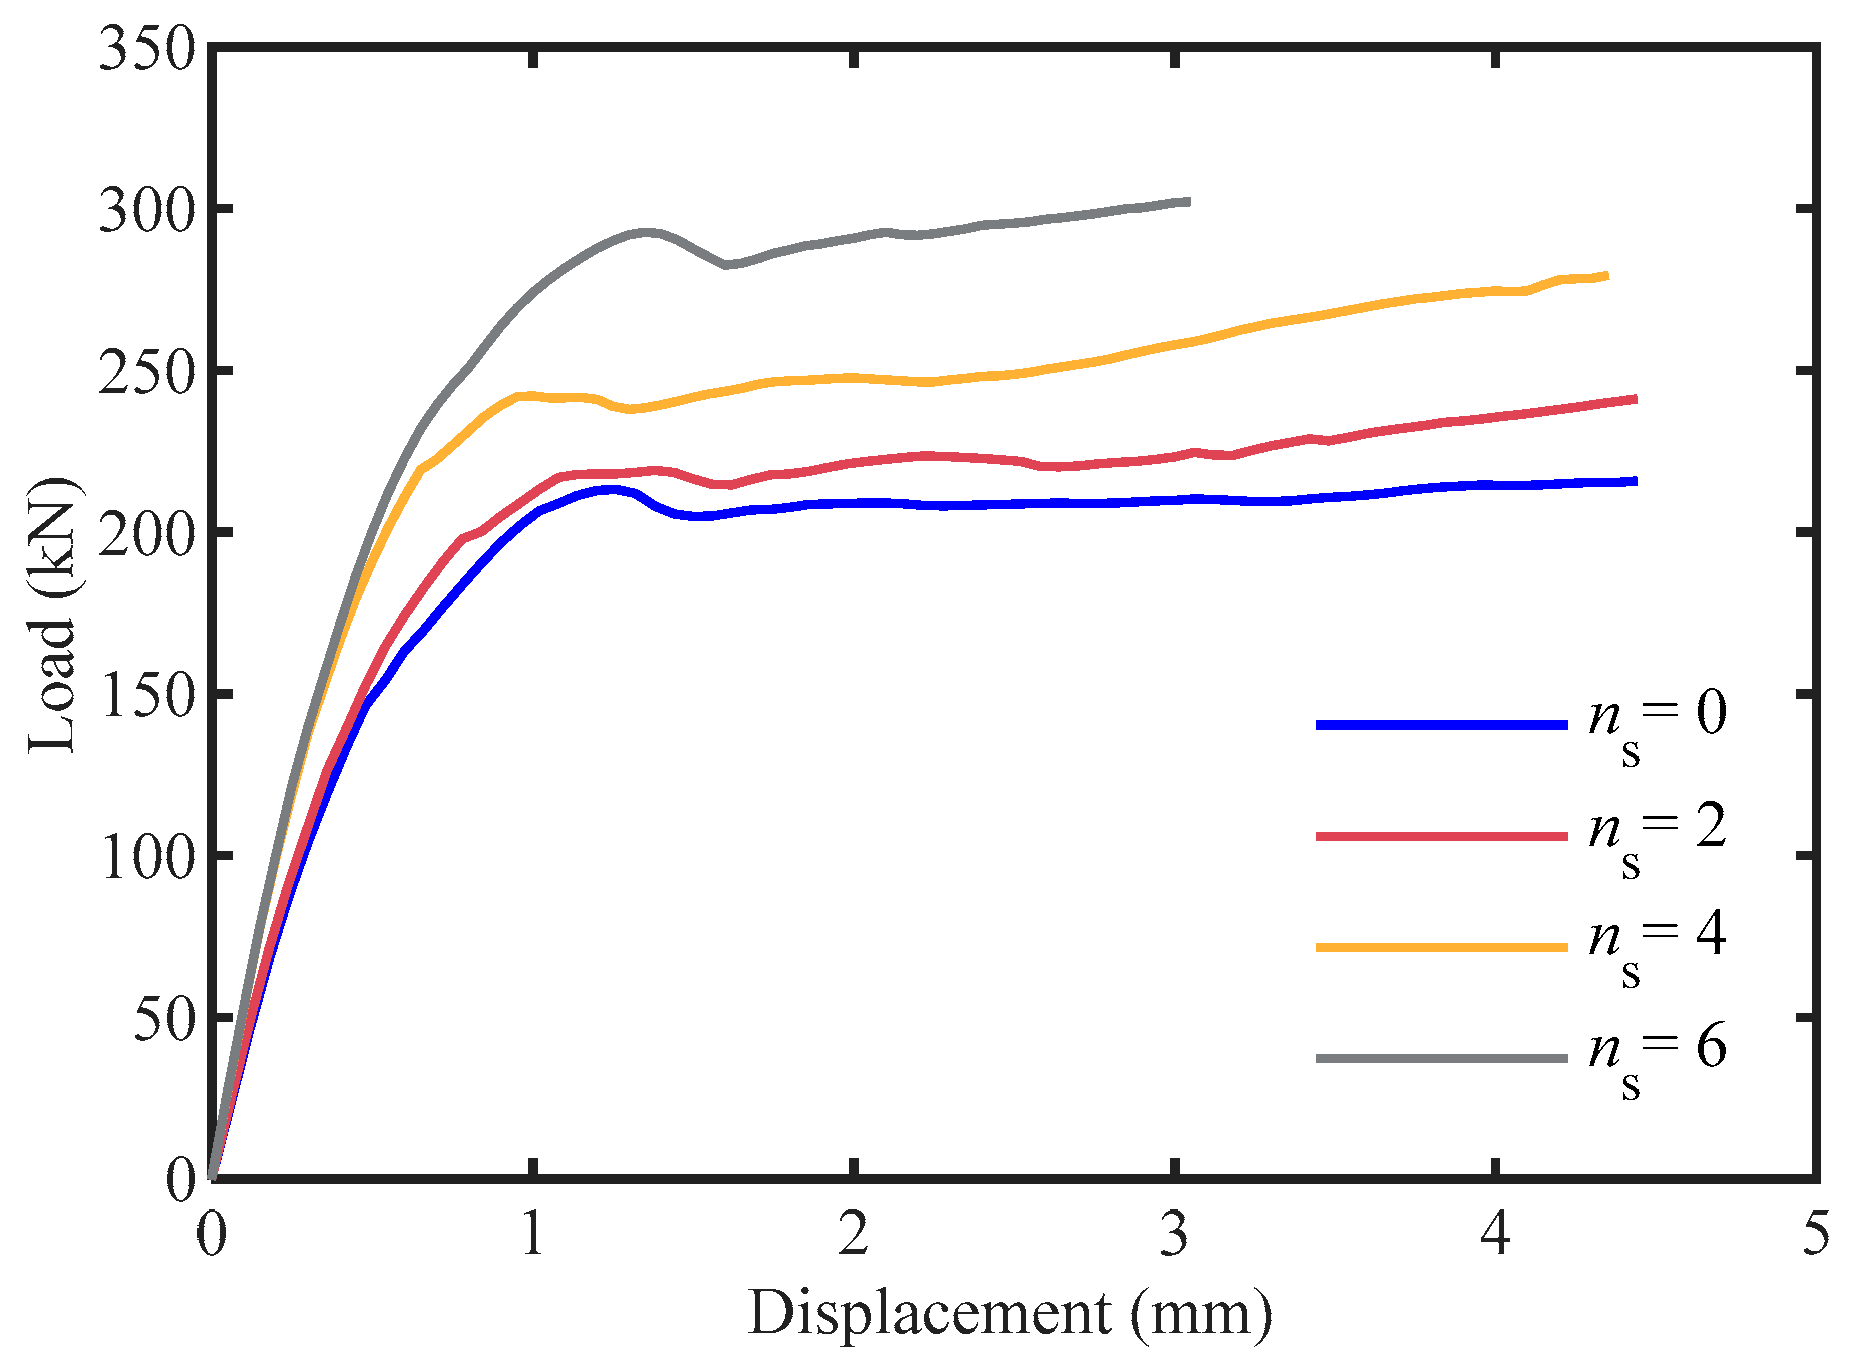
5.3. Number of Shear Studs ns
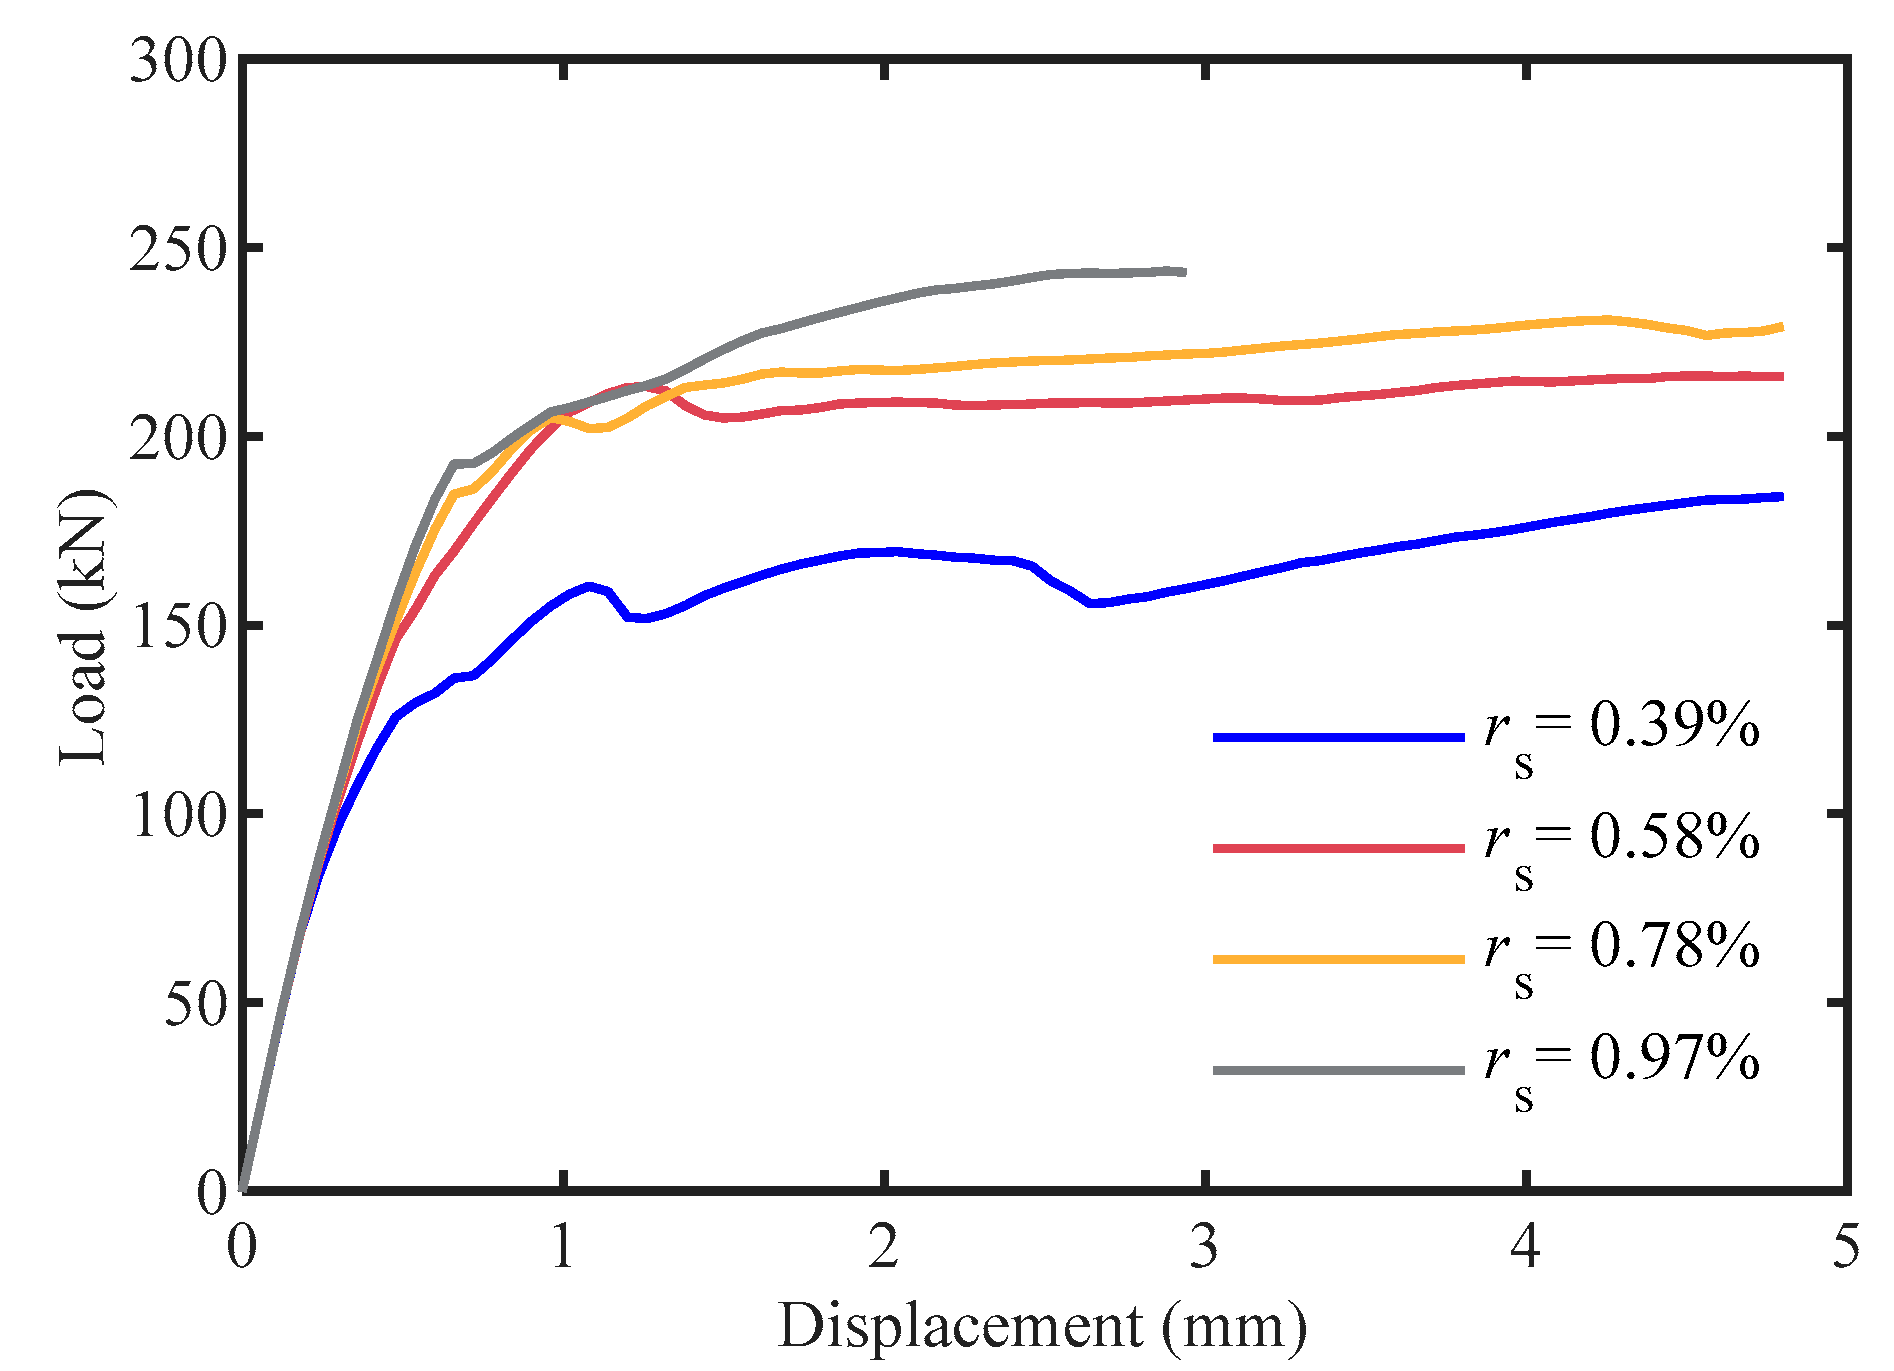
5.4. Reinforcement Ratio of Stirrups rs
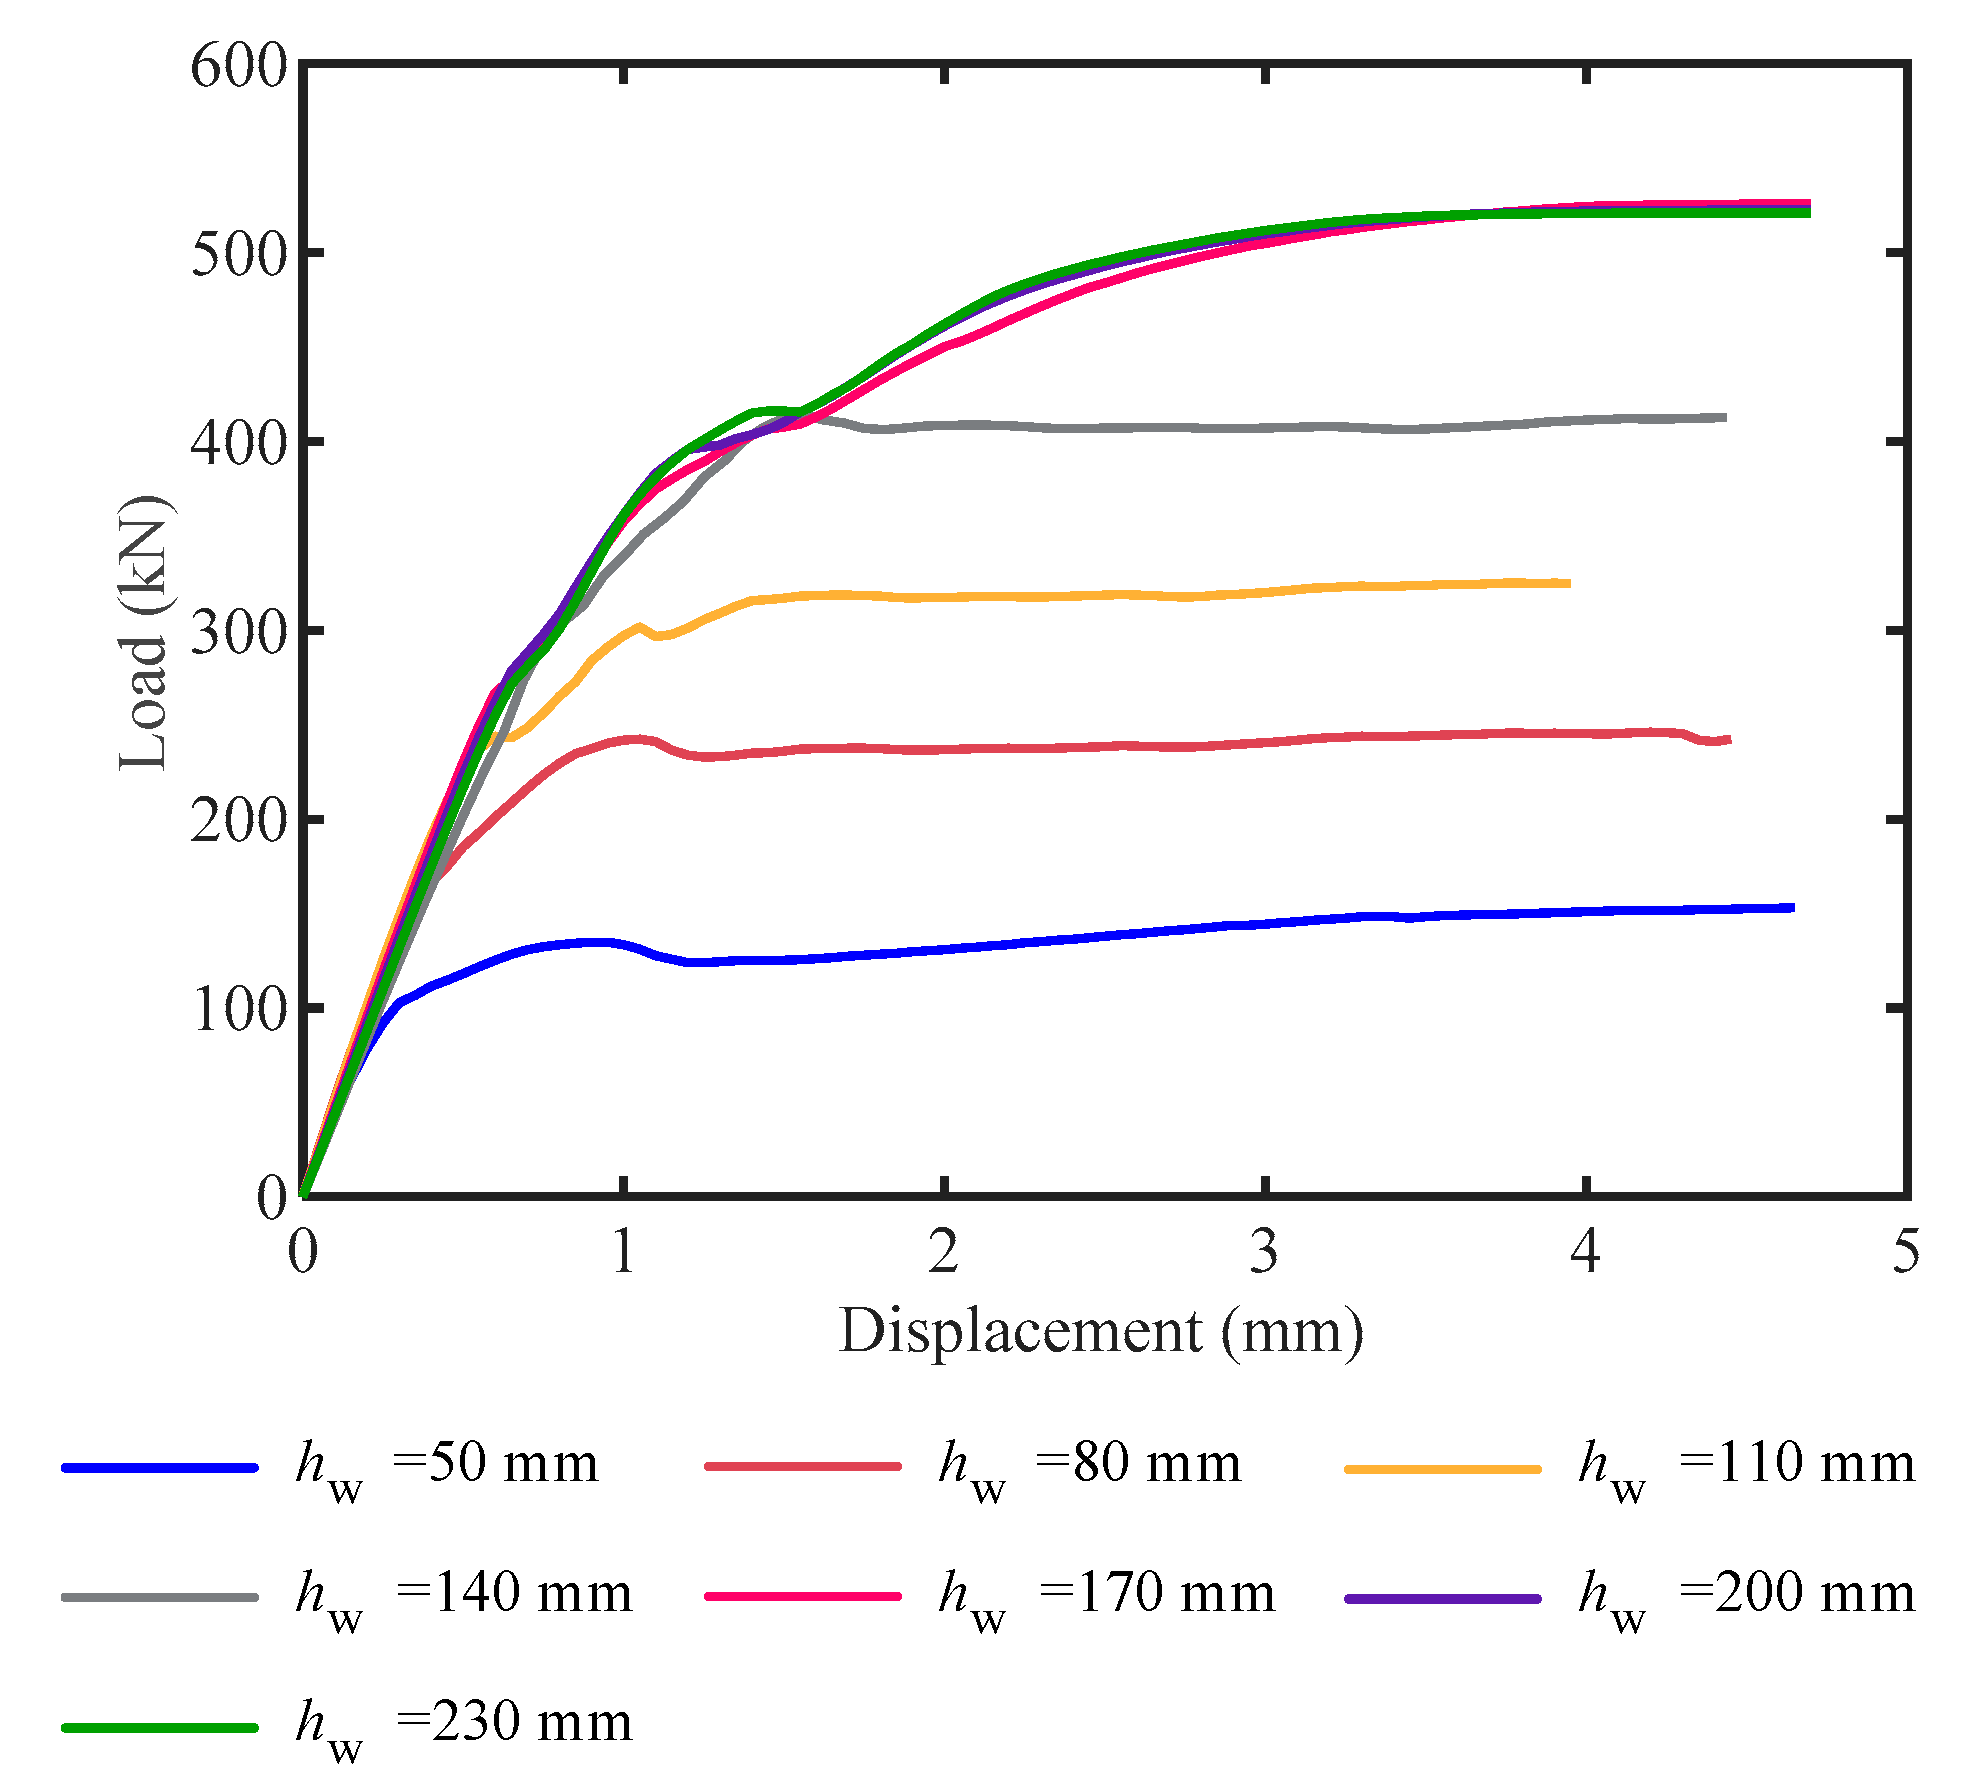
5.5. Web Height of the T-stub Connector hw
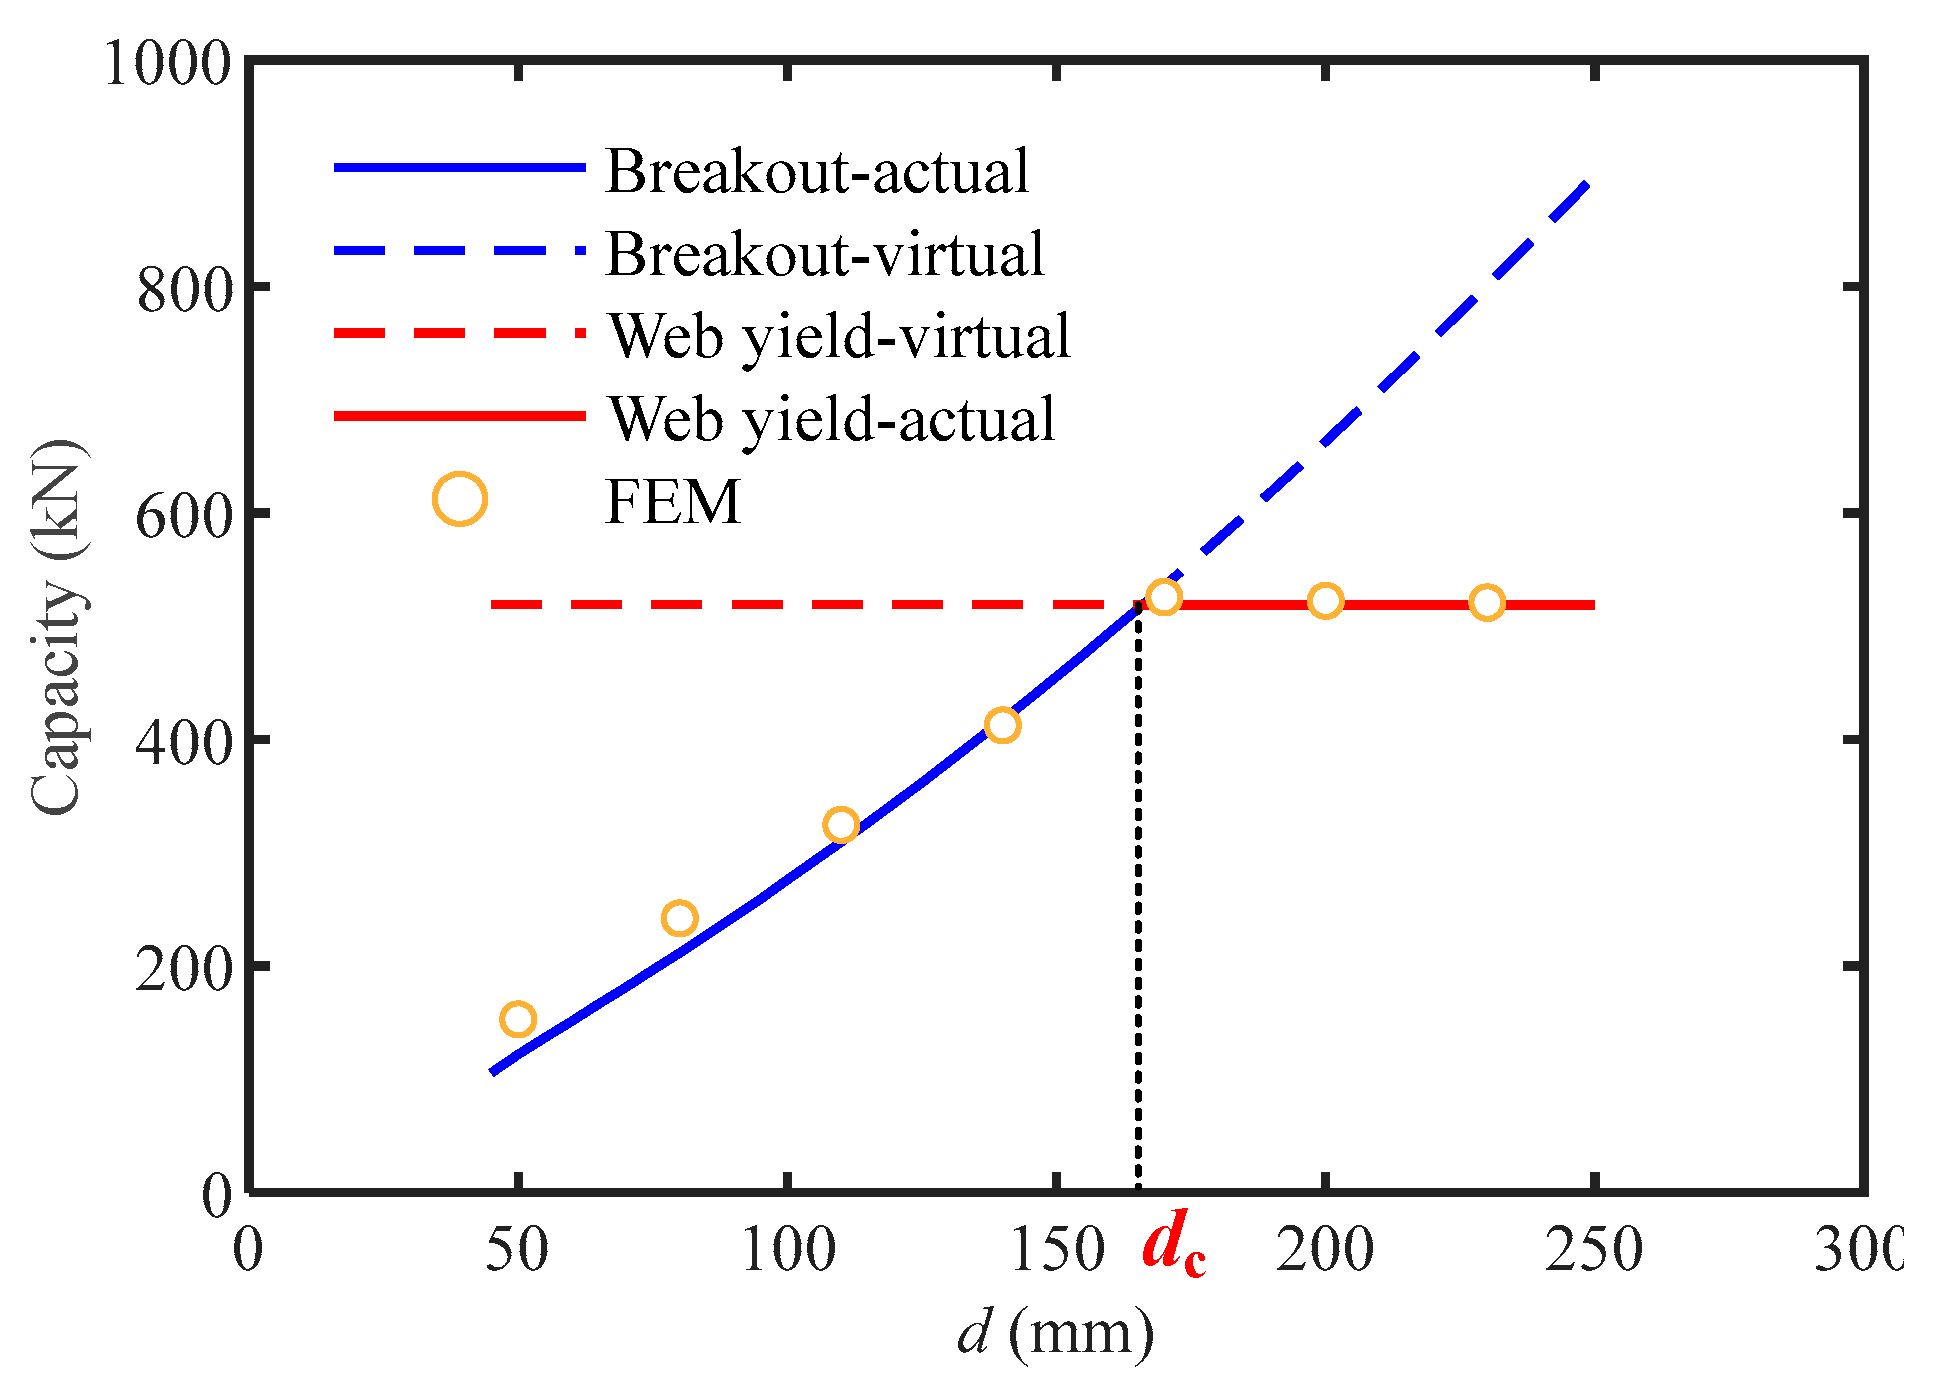
6. Discussion on the Critical Embedded Depth of the T-stub Connector
7. Conclusions
Author Contributions
Funding
Informed Consent Statement
Data Availability Statement
Acknowledgments
Conflicts of Interest
References
- Morino, S. Recent developments in hybrid structures in Japan—Research, design and construction. Eng. Struct. 1998, 20, 336–346. [Google Scholar] [CrossRef]
- Shahrooz, B.M.; Gong, B.; Tunc, G.; Deason, J.T. An overview of reinforced concrete core wall-steel frame hybrid structures. Prog. Struct. Eng. Mater. 2001, 3, 149–158. [Google Scholar] [CrossRef]
- Wang, D.S.; Zhou, J.L. Development and prospect of hybrid high-rise building structures in China. J. Build. Struct. 2010, 31, 62–70. (In Chinese) [Google Scholar]
- Wallace, J.W.; Wada, A. Hybrid wall systems: US-Japan research. In Proceedings of the 12th WCEE Conference, Auckland, New Zeland, 30 January–4 February 2000. [Google Scholar]
- Goel, S.C.; Tsai, K.C. Overview of International Cooperative Research on Seismic Performance of Composite and Hybrid Structures. In Structures 2004: Building on the Past, Securing the Future; ASCE: Reston, VA, USA, 2004; pp. 1–7. [Google Scholar]
- Zhang, B.Q. Experimental research of the single plate framing connection between truss-steel beam and concrete wall. Master’s Dissertation, Bejing University of Technology, Beijing, China, 2002. (In Chinese). [Google Scholar]
- Liu, A.M.; Zhou, D.Y. Experimental study on seismic behavior of semi-rigid connection between steel beam and concrete wall. Earthq. Eng. Eng. Vib. 2005, 4, 129–137. [Google Scholar]
- Hawkins, N.; Mitchell, D.; Roeder, C. Moment resisting connections for mixed construction. Eng. J. 1980, 17, 1–10. [Google Scholar]
- Roeder, C.; Hawkins, N. Connections between steel frames and concrete walls. Eng. J. 1981, 18, 22–29. [Google Scholar]
- Shahrooz, B.M.; Deason, J.T.; Tunc, G. Outrigger beam–wall connections. I: Component testing and development of design model. J. Struct. Eng. 2004, 130, 253–261. [Google Scholar] [CrossRef]
- Shahrooz, B.M.; Tunc, G.; Deason, J.T. Outrigger beam–wall connections. II: Subassembly testing and further modeling enhancements. J. Struct. Eng. 2004, 130, 262–270. [Google Scholar] [CrossRef]
- Li, G.Q.; Qu, B.; Sun, F.F.; He, W.M.; Guo, J.Y. Cyclic loading tests of steel beam to concrete wall joints in steel-concrete mixed structures. J. Build. Struct. 2003, 24, 1–7. (In Chinese) [Google Scholar]
- Zhu, J. Study on behavior of connection between steel beam and concrete wall with embedded section steel. Ph.D. Dissertation, Wuhan University of Technology, Wuhan, China, 2006. (In Chinese). [Google Scholar]
- Zhou, X.; Li, G. Shaking table model test of a steel-concrete composite high-rise building. J. Earthq. Eng. 2010, 14, 601–625. [Google Scholar] [CrossRef]
- Zhao, H.; Tao, M.-X.; Ding, R. Experimental study on seismic behaviour of composite frames with wide floor slabs considering the effect of floor loads. Eng. Struct. 2020, 220, 111024. [Google Scholar] [CrossRef]
- Zhao, H.; Tao, M.-X. Seismic behaviour of structural systems with separated gravity and lateral resisting systems. J. Constr. Steel Res. 2020, 174, 106315. [Google Scholar] [CrossRef]
- Zhao, H.; Nie, X.; Zhu, D.; Tao, M.-X. Mechanical properties of novel out-of-plane steel beam–concrete wall pinned joints with T-shaped steel connectors under monotonic tension load. Eng. Struct. 2019, 192, 71–85. [Google Scholar] [CrossRef]
- MSC Software Corp, MSC.Marc, version 2012; MSC Software: Newport Beach, CA, USA, 2012.
- Genikomsou, A.S.; Polak, M.A. Finite element analysis of punching shear of concrete slabs using damaged plasticity model in ABAQUS. Eng. Struct. 2015, 98, 38–48. [Google Scholar] [CrossRef]
- Wosatko, A.; Pamin, J.; Polak, M.A. Application of damage–plasticity models in finite element analysis of punching shear. Comput. Struct. 2015, 151, 73–85. [Google Scholar] [CrossRef]
- Karalar, M. Experimental and numerical investigation on flexural and crack failure of reinforced concrete beams with bottom ash and fly ash. Iran. J. Sci. Technol. Trans. Civ. Eng. 2020, 44, 331–354. [Google Scholar] [CrossRef]
- Karalar, M.; Bilir, T.; Çavuşlu, M.; Özkiliç, Y.O.; Sabri, M.M.S. Use of recycled coal bottom ash in reinforced concrete beams as replacement for aggregate. Front. Mater. 2022, 9, 1064604. [Google Scholar] [CrossRef]
- Hognestad, E.; Hanson, N.W.; McHenry, D. Concrete Stress Distribution in Ultimate Strength Design. J. Proc. 1955, 52, 455–480. [Google Scholar] [CrossRef]
- Msc.MARC (2012) Volume A-Theory and User Information; MSC.Software Corporation: Newport Beach, CA, USA, 2008.
- Comité Euro-International du Béton-Fédération International de la Précontrainte (CEB-FIP). CEB-FIP Model Code 2010: Design Code; Thomas Telford: London, UK, 2010. [Google Scholar]
- Rots, J.G.; Blaauwendraad, J. Crack models for concrete, discrete or smeared? Fixed, multi-directional or rotating? HERON 1989, 34, 1–59. [Google Scholar]
- Bažant, Z.P.; Oh, B.H. Crack band theory for fracture of concrete. Matér. Constr. 1983, 16, 155–177. [Google Scholar] [CrossRef] [Green Version]
- Wittmann, F.H.; Roelfstra, P.E.; Mihashi, H.; Huang, Y.-Y.; Zhang, X.-H.; Nomura, N. Influence of age of loading, water-cement ratio and rate of loading on fracture energy of concrete. Mater. Struct. 1987, 20, 103–110. [Google Scholar]
- Wittmann, F.H.; Rokugo, K.; Brühwiler, E.; Mihashi, H.; Simonin, P. Fracture energy and strain softening of concrete as determined by means of compact tension specimens. Mater. Struct. 1988, 21, 21–32. [Google Scholar]
- Wittmann, F.H. Crack formation and fracture energy of normal and high strength concrete. Sadhana 2002, 27, 413–423. [Google Scholar]
- du Béton, C.E.-I. CEB-FIP Model Code 1990: Design Code; Thomas Telford Publishing: London, UK, 1993. [Google Scholar]
- Nie, J.; Tao, M.; Cai, C.; Chen, G. Modeling and investigation of elasto-plastic behavior of steel–concrete composite frame systems. J. Constr. Steel Res. 2011, 67, 1973–1984. [Google Scholar] [CrossRef]
- Hu, H.-S.; Nie, J.-G.; Wang, Y.-H. Effective stiffness of rectangular concrete filled steel tubular members. J. Constr. Steel Res. 2016, 116, 233–246. [Google Scholar] [CrossRef]
- Guo, Y.-T.; Chen, J.; Nie, X.; Tao, M.-X.; Wang, J.-J.; Fan, J.-S. Investigation of the shear resistances of steel–concrete–steel composite structures with bidirectional webs. J. Constr. Steel Res. 2020, 164, 105846. [Google Scholar] [CrossRef]
- GB50010-2010; Code for Design of Concrete Structures. China Architecture & Building Press: Beijing, China, 2010. (In Chinese)
- Lu, X.; Ye, L.; Teng, J.; Jiang, J. Meso-scale finite element model for FRP sheets/plates bonded to concrete. Eng. Struct. 2005, 27, 564–575. [Google Scholar] [CrossRef]
- Lu, X.; Jiang, J.; Teng, J.; Ye, L. Finite element simulation of debonding in FRP-to-concrete bonded joints. Constr. Build. Mater. 2006, 20, 412–424. [Google Scholar] [CrossRef]
- Tao, M.-X.; Nie, J.-G. Multi-scale modeling for deformation mechanism analysis of composite joint substructures. Eng. Struct. 2016, 118, 55–73. [Google Scholar] [CrossRef]
- Ollgaard, J.G.; Slutter, R.G.; Fisher, J.W. Shear strength of stud connectors in lightweight and normal-weight concrete. AISC Eng. J. 1971, 8, 55–64. [Google Scholar]
- GB 50017-2017; Standard for Design of Steel Structures. China Architecture & Building Press: Beijing, China, 2017. (In Chinese)
- GB/T 10433-2002; Cheese Head Studs for Arc Stud Welding. China Quality and Standards Publishing & Media Co.,Ltd.: Beijing, China, 2002. (In Chinese)


| Specimen No. | lc (mm) | wf (mm) | hw (mm) | ns | rs (%) |
|---|---|---|---|---|---|
| BWPJ-1 | 250 | 80 | 80 | 0 | 0.6 |
| BWPJ-2 | 250 | 80 | 80 | 0 | 0.9 |
| BWPJ-3 | 250 | 80 | 80 | 2 | 0.6 |
| BWPJ-4 | 250 | 80 | 80 | 6 | 0.6 |
| BWPJ-5 | 250 | 80 | 250 | 0 | 0.6 |
| BWPJ-6 | 250 | 80 | 250 | 6 | 0.6 |
| Specimen No. | Failure Mode | PT (kN) 1 | PFEM (kN) 2 | errFEM 3 |
|---|---|---|---|---|
| BWPJ-1 | Concrete breakout | 216.7 | 226.2 | 4.4% |
| BWPJ-2 | Concrete breakout | 311.5 | 326.6 | 4.8% |
| BWPJ-3 | Concrete breakout | 230.3 | 238.0 | 3.3% |
| BWPJ-4 | Concrete breakout | 343.3 | 302.2 | −12.0% |
| BWPJ-5 | Steel web yield | 482.4 | 520.2 | 7.8% |
| BWPJ-6 | Steel web yield | 510.5 | 520.3 | 1.9% |
| AVE 4 | - | - | 1.7% | |
| STD 5 | - | - | 6.4% |
Disclaimer/Publisher’s Note: The statements, opinions and data contained in all publications are solely those of the individual author(s) and contributor(s) and not of MDPI and/or the editor(s). MDPI and/or the editor(s) disclaim responsibility for any injury to people or property resulting from any ideas, methods, instructions or products referred to in the content. |
© 2023 by the authors. Licensee MDPI, Basel, Switzerland. This article is an open access article distributed under the terms and conditions of the Creative Commons Attribution (CC BY) license (https://creativecommons.org/licenses/by/4.0/).
Share and Cite
Zhao, H.; Sun, L.-H.; Chen, H.-B.; Liu, X.-G. Numerical Investigation on the Pulling Resistant Capacity of Steel Beam-Concrete Wall Joints with T-stub Connectors. Buildings 2023, 13, 566. https://doi.org/10.3390/buildings13020566
Zhao H, Sun L-H, Chen H-B, Liu X-G. Numerical Investigation on the Pulling Resistant Capacity of Steel Beam-Concrete Wall Joints with T-stub Connectors. Buildings. 2023; 13(2):566. https://doi.org/10.3390/buildings13020566
Chicago/Turabian StyleZhao, He, Long-Hui Sun, Hong-Bing Chen, and Xiao-Gang Liu. 2023. "Numerical Investigation on the Pulling Resistant Capacity of Steel Beam-Concrete Wall Joints with T-stub Connectors" Buildings 13, no. 2: 566. https://doi.org/10.3390/buildings13020566