Article

Analyzing Customers’ Demands for Different Housing Features in Buildings Using a Data Mining Method

by
Abdullah Emre Keleş
* and
Yusuf Can Arıkan
Department of Civil Engineering, Adana Alparslan Türkeş Science and Technology University, 01250 Adana, Turkey
*
Author to whom correspondence should be addressed.
Buildings 2023, 13(2), 555; https://doi.org/10.3390/buildings13020555
Submission received: 23 December 2022 / Revised: 25 January 2023 / Accepted: 7 February 2023 / Published: 17 February 2023
(This article belongs to the Topic Peaceful and Secure Cities)

Abstract

:
There are many options and factors in the production phase of housing. In the marketing phase, houses are presented to the customer’s taste. Therefore, it is clear that a customer-oriented approach is necessary to establish a supply–demand balance in housing production on the basis of quality. This study aimed to determine customers’ housing demands in the construction sector. Within the scope of the study, 303 surveys were conducted in 30 different provinces of Turkey. The data obtained were analyzed by WEKA software with association rule extraction as the data mining method. The distribution of other attributes was determined according to two different class labels, namely the ownership status of the houses (tenant or homeowner) and customers’ expectations of the houses. As a result of the study, it is clear that people living in Turkey prefer a south-facing facade when purchasing a house. In addition, it is seen that the property owners demand 4 + 1 independent units. It is remarkable that individuals who are tenants want the living room to be spacious. The results of the study also revealed that female individuals have higher expectations of housing than male individuals. At the same time, it is understood that people’s expectations of housing differ according to the variables of age, education level, and the number of family members. The majority of the results in this study had a confidence value of 90% and above. This study was intended to serve as a guide for housing developers in Turkey to better understand and meet the demands of buildings’ residents.

1. Introduction

The innovations offered by technological developments increase day by day. The construction sector is among the sectors most affected by technological developments during the production phase. The building manufacturing process is a process that needs to be managed in a planned, harmonized, and systematic manner, as it depends on many components and business lines. Therefore, the importance of systematic storage and utilization of the data obtained in the construction sector is increasing day by day [1].
There are various variables in the housing sector, which is a sub-branch of the construction sector. Customers are among the most important of these variables. Houses, which have been meeting people’s need for shelter since the distant past, have also become an investment instrument today. In addition, in a globalizing world, there is an increasing interest in comfort in general, and customer expectations have become the main determining factor for companies in the production of housing. In addition, there are social and cultural factors that influence consumers’ behavior. All of these show that people’s expectations are changing, and this situation directly affects the marketing activities of businesses.
Marketing is among the most important business functions, as it enables organizations to connect with customers. All of the efforts of companies to determine the customers’ demands in order to offer appropriate products or services and to bring what they produce to the customer with the experience they have gained in this area constitute the concept of marketing [2]. The marketing methods used in the housing sector are called housing marketing. Housing marketing is the supply of products to customers who will purchase them by using marketing components such as pricing, planning, and promotion [3]. The concept of customer relationship management plays an important role in the effective use of customer-centered housing marketing.
Customer relationship management is a business strategy that enables businesses to manage their connections with customers in an organized manner [4]. Within the scope of customer relationship management, it is possible for companies to develop new strategies for before and after a sale by analyzing the demands of customers. This situation enables companies to achieve sustainability, increase customer satisfaction, and achieve higher profits with lower costs [5].
In order to effectively implement customer relationship management and housing marketing strategies in the housing sector, it is important to determine the expectations of customers. Therefore, many studies have been conducted with the help of statistical methods in the literature for this purpose. Statistical methods, which have been used in scientific fields from the past to the present, may be insufficient for analyzing large datasets and may limit researchers. Data mining, which is based on statistical methods, provides the ability to access meaningful information from data and reveal the connections among the data [6].
This study aimed to measure customers’ expectations of housing in the construction sector. The main reason for this study was interpreted by the authors as having two aspects. First of all, the expectations of customers regarding houses are the most important data for construction companies to determine because production in line with expectations means easy sales. Secondly, determining the customers’ expectations of housing helps to eliminate randomness. At the same time, customer satisfaction is increased. In these respects, the subject of this study and the analysis method used are considered to be unique.
Data mining methods were used in the analysis phase of this research, which was conducted throughout Turkey. The originality of the study and its contributions to the literature are summarized below.
  • This is the first study to analyze the housing demand of customers in the construction sector using a data mining method.
  • The purpose of data mining is to determine statistically how often survey data can be seen together in a research study. In this respect, it was thought that by determining the rules of the association, unique and useful results could be achieved in construction marketing.
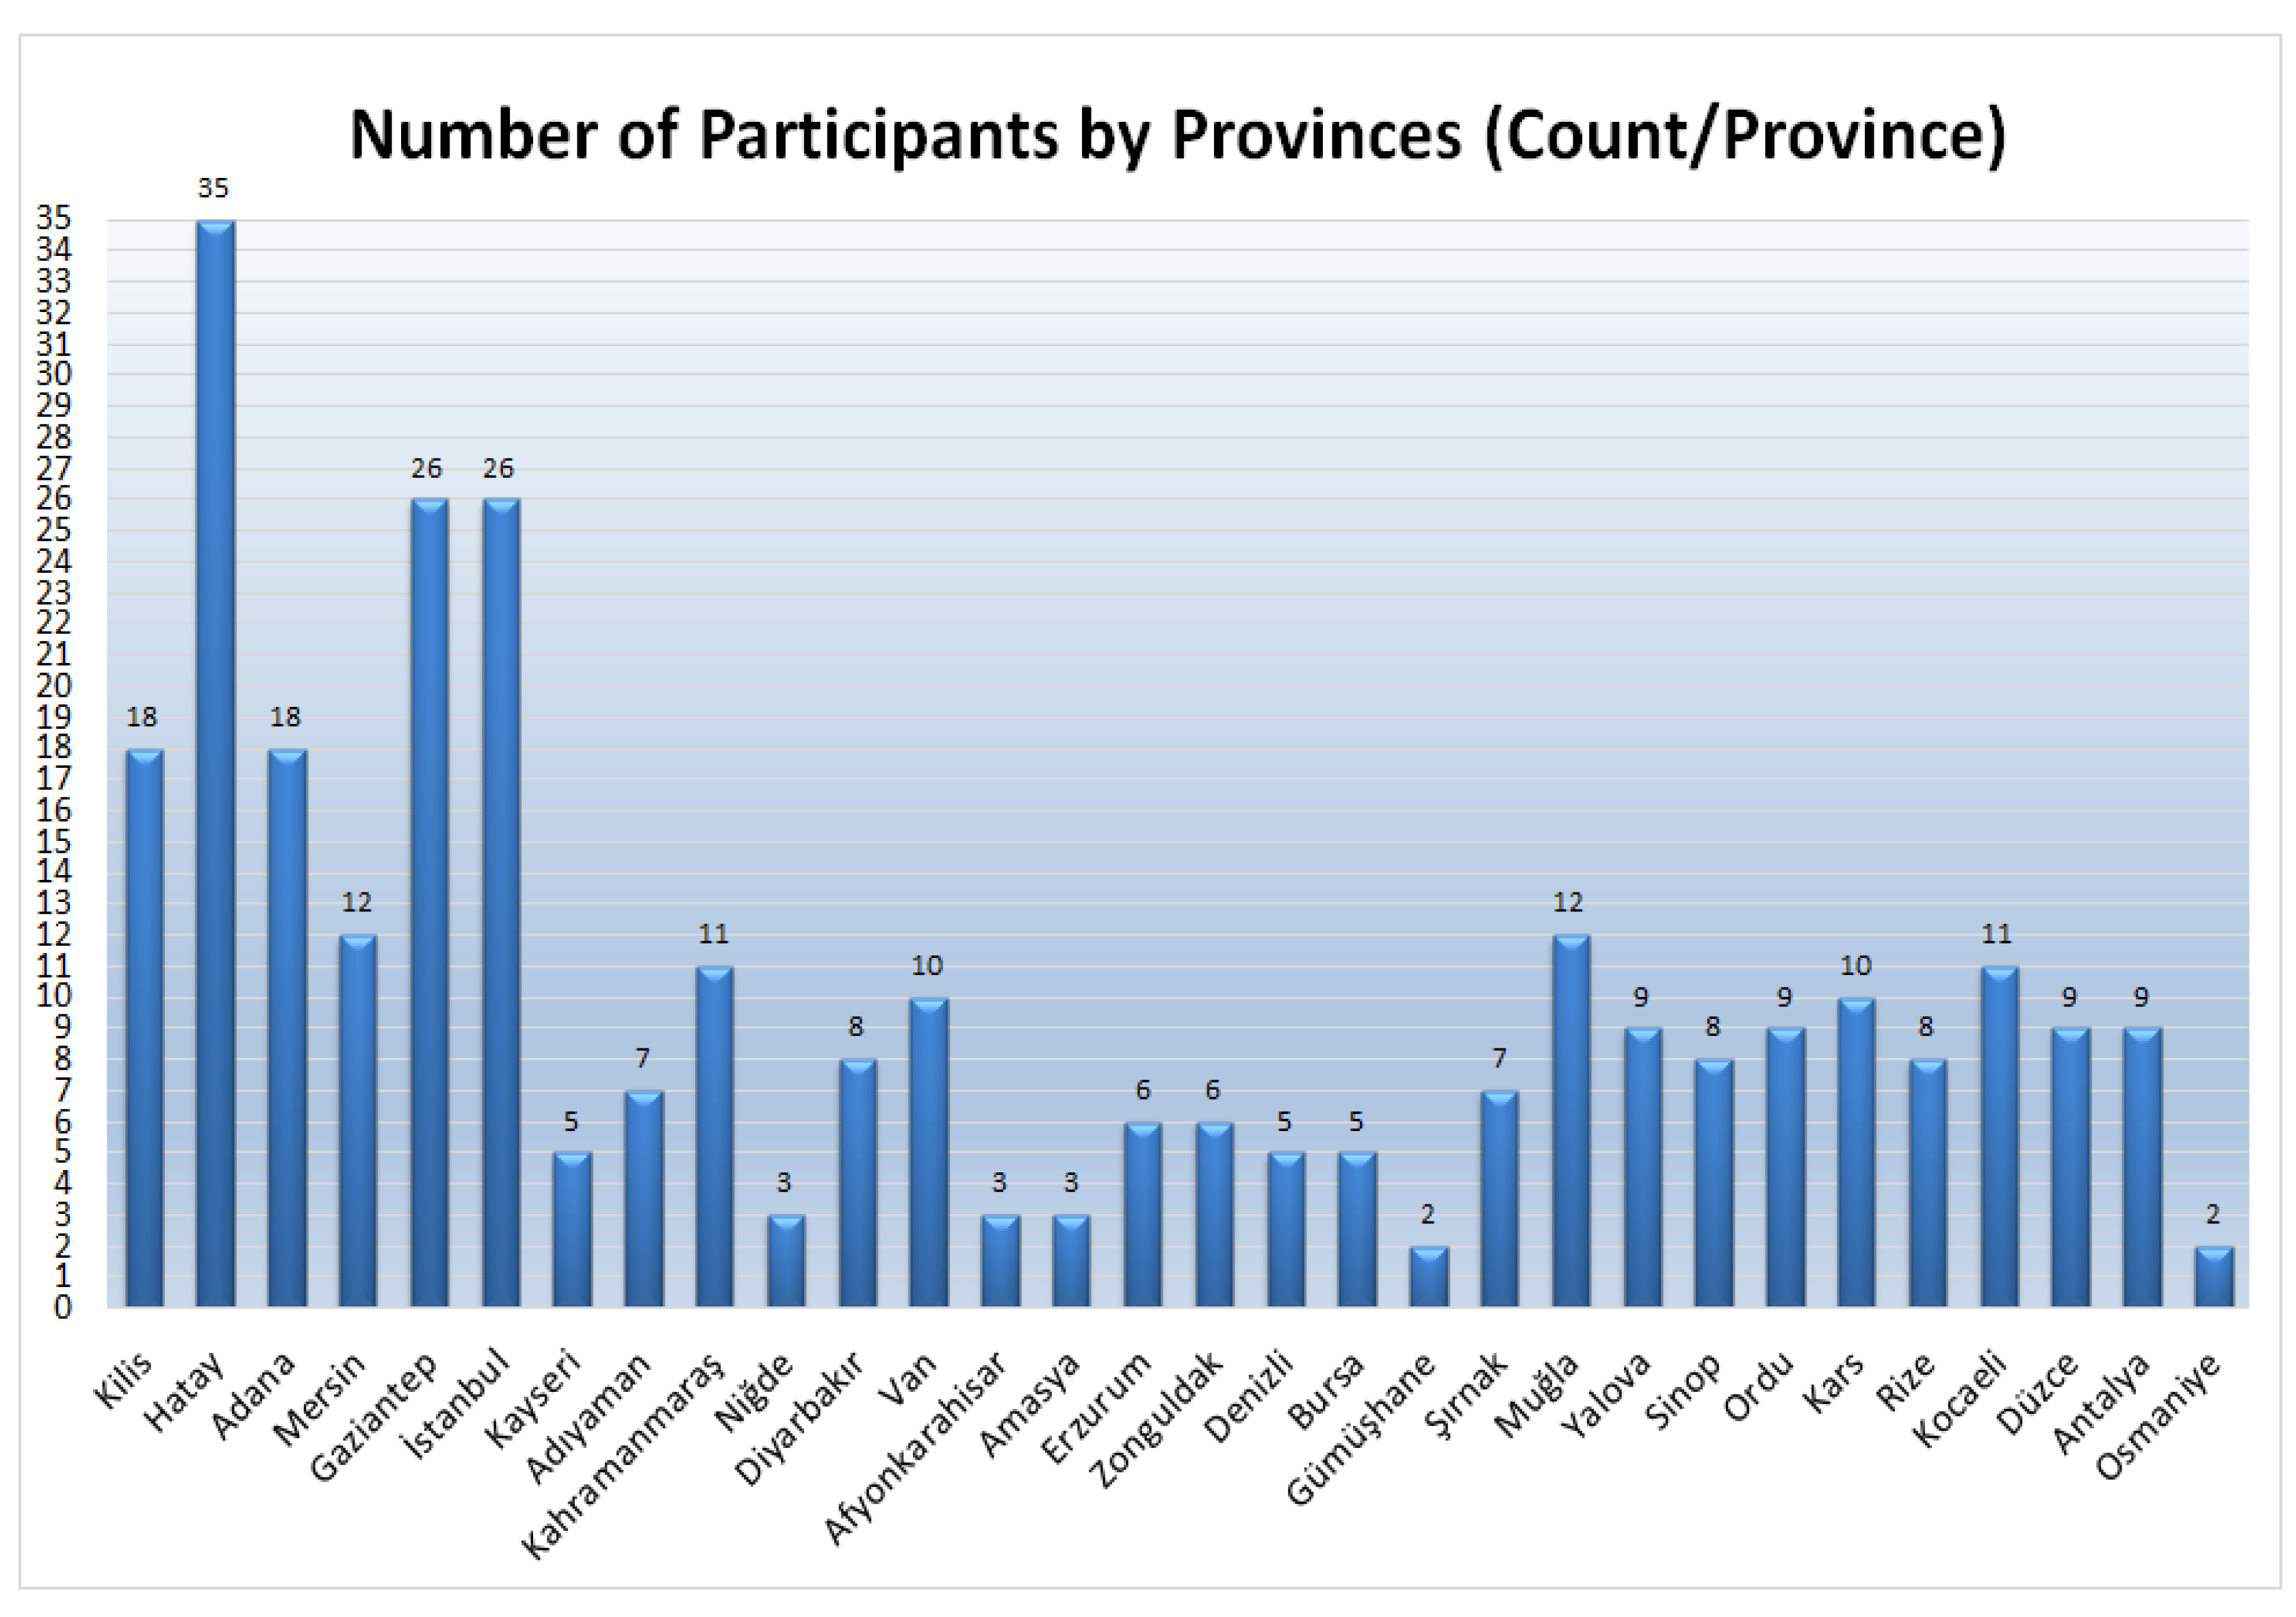
  • This research, which was conducted to determine the demands of housing customers, has a unique value. The application of 303 questionnaires in 30 provinces in all of the geographical regions of Turkey, with attention given to homogeneity, makes the original results obtained through this study more valuable.
  • In the study, the ownership status of the house and the expectations of the customers regarding the house were determined as the class labels. In the first analysis, data were obtained to determine the expectations of tenants and property owners regarding residences. In the second analysis, the level of expectation of the customers was determined according to the answers given to the 25 questions in the second part of the survey. The results of these analyses are pioneering for the Turkish housing sector. At the same time, the authors think that these new and unique results on the subject can set an example for research on a global scale.
  • As mentioned above, this study provided results that can guide the production of new houses by the construction sector. Therefore, it provides information that can be used in feasibility studies for the representatives of companies before construction and production. In this respect, the authors consider that it is unique.
In light of these factors, the purpose of the study can be described as determining the characteristics customers demand in housing marketing in the Turkish construction sector. In addition, the study will present them to the sector. For this purpose, two different class labels were determined, and the questions were “What is the status of your residence? 1 = tenant; 2 = owner” and “What is your expectation of your residence?”

2. Materials and Methods

In this study, we first analyzed the studies on customers’ demands of buildings in the construction sector in the literature. Several studies have investigated the current status of customer requests in practice with different methods. These are summarized as follows [7,8,9,10,11,12,13,14]. In a study, association rule mining (ARM) was used to identify patterns in total loss accident data. The Éclat algorithm was used to extract association rules related to accident types and accident severity from 1554 total loss accident data from the Information Handling Services (IHS) marine network database between 2010 and 2020 from the overall casualty dataset. This study showed that there was a strong correlation between total loss accidents and vessels older than 20 years of age [7]. In a paper, researchers proposed a new validation method that uses regular expressions and compressed data structures to efficiently verify whether a candidate fd is valid in an updated dataset. Using real-world datasets adapted to incremental scenarios, the proposed method is shown to be effective and is compared to a basic incremental fd discovery algorithm [8]. In another article, the researchers examined the concept of relying on machine learning models using data dependencies. The authors argued that functional dependencies characterize the existence of a function in classifying data. They contributed to the literature by showing how functional dependencies provide a tight upper bound on classification accuracy [9].
In one study, researchers examined off-site construction (OSC) strategies and identified the decision variables to build more affordable and sustainable housing to improve the quality of life for millions of families, given the growing demand for multifamily housing in the United States. The study addressed client attitudes, building performance, and indoor environmental quality. As a result, they identified social, environmental, and economic factors that influence the use of OSC in multifamily housing in the USA [10]. Another study aimed to understand the opinions and experiences of the residents of Tampere, Finland, about multi-story timber-framed apartments and timber structures through a survey. The results of the 151 surveys conducted in the study highlighted two main issues: (1) multi-story timber-framed apartments were rated as good products in terms of user satisfaction; (2) there was a demand for multi-story timber-framed housing in the market, especially in the customer segment defined as environmentally friendly [11]. Another study stated that the challenge for companies in the housing sector is to respond to the increasing diversity of customer demands in a sustainable way. The researchers assessed the relationships between items and calculated a Jaccard similarity index to understand which Construction 4.0 technologies should be implemented together to support mass customization (MC) strategies. Thus, the relationships among customers’ demands were identified [12]. Another recent study was conducted in northern China to identify farmers’ expectations of their living environment. It conducted qualitative and quantitative analyses on the factors influencing the demand for the residential environment through a questionnaire. The questionnaire included personal characteristics, daily life, dietary and environmental preferences, living customs and energy consumption, housing construction methods, and the surrounding environment. The results showed that socioeconomic status had the greatest influence on the weight of overall satisfaction among the various demands. Farmers prioritized garden planning, toilets, living rooms, the indoor thermal environment, and air quality [13]. In addition, in another study, researchers aimed to investigate the housing preferences of customers in the Malaysian housing market and emphasized the importance of understanding their preferences. The results of the study confirmed the significant relationship between monthly income and the type of home preferred and between monthly income and the affordability range of the home by using cross-tabulation analysis. The findings showed that there are important features for home buyers in Malaysia that should not be neglected [14]. These current studies are examples of the methodology of our study. The sample sizes, research topics, focus areas, and analysis methods used in these studies [7,8,9,10,11,12,13,14] helped us to form the backbone of our study. Furthermore, unlike these studies, we thought that by identifying the housing demands of customers with a data mining method, we could fill the gap in the literature in this field.
In Table 1, we summarized the studies published in the literature, especially in recent years. In addition, the novelty of this study is emphasized.
In this study, 303 surveys were applied to measure customers’ expectations of housing in the construction sector. The questionnaires were administered in 30 different provinces of Turkey. The provinces covered all of the geographical regions of Turkey (seven geographical regions). This effort ensured that the study’s data were not regionalized. Different settlements were preferred in these provinces. In other words, all of the surveys were administered to respondents living in different parts of the provinces, not in the same regions. Thus, homogeneity in the survey results was ensured.
While determining the survey population, care was taken to identify homogeneous residents of the relevant cities. Different customer groups were reached by conducting surveys in different settlements of the cities. The gender distribution of the participants was also balanced. In addition, both tenant and property owner groups were selected among the respondents in order to identify the common demands of the society to be used in the analysis. The following section of the study describes the basis on which the research was conducted and what actions were taken.

2.1. Survey Design and Implementation

Approval was obtained from the ATU (Adana Alparslan Türkeş Science and Technology University) Ethics Committee before the administration of the questionnaire. This committee was established by the ATU Senate on 3 September 2013. The committee examines scientific research in terms of whether there is any personal information and whether there are any objectionable experiments on living beings. Additionally, whether ethical and moral values are violated. It consists of seven faculty members from different faculties appointed by the rector.
This committee examined the survey’s content from technical and social aspects. Before starting the survey, 10 pilot questionnaires were administered to the participants. The survey questions were revised in terms of meaning and applied according to the feedback. The wording of some minor points that caused confusion was revised in accordance with the recommendations. Committee members approved the survey questions since they did not involve the participants’ private information or harm living beings in any way.
The data for the study were obtained from face-to-face surveys with residential customers. The literature was utilized in the formulation of the survey questions. In this direction, studies in the literature [15,16,17] were used. The survey questions used in these three studies examining the purchasing behavior of housing customers were taken into consideration. Based on the literature, a questionnaire scale was developed for this framework.
The survey consisted of 2 sections and 38 questions. The first part of the questionnaire consisted of demographic questions as well as 13 questions that determined the general preferences of the participants regarding housing. The 25 questions in the second part of the questionnaire included questions prepared according to a 5-point Likert scale in order to determine the orientation of the participants in terms of housing characteristics.
The sample size of the questionnaire provides the adequate sample size described in the literature, as presented by one of the authors in their master’s studies [18,19]. Furthermore, the WEKA analyses showed the adequacy of the sample size by obtaining many meaningful association rules at a rate of about 90%.

2.2. Analytical Methods

First of all, SPSS software was used to calculate the Cronbach’s alpha coefficient to determine the reliability of the questionnaire. SPSS is a widely used program for analyzing data by statistical methods. After determining the reliability level of the answers given by the participants to the questions, the following analyses were carried out.
Microsoft Excel was used to prepare the data for analysis, and WEKA (Waikato Environment for Knowledge Analysis) software was used for the analysis. In this context, the data obtained through the questionnaire were transferred to Microsoft Excel with the numbers 1, 2, 3, 4m and 5 symbolizing the answers “strongly disagree”, “partly disagree”, “undecided/no opinion”, “partly agree” and “strongly agree”, respectively. The data were then converted into *.arff (attribute relation file format) format to be analyzed by WEKA.
WEKA, which was used in this study for analyzing the data, is a software package developed on the Java platform under a general public license at the University of Waikato in New Zealand [20,21]. WEKA, which emerged as a project, is a machine learning and data mining program that is used by many researchers today [22].
Data mining is defined as the process of uncovering meaningful relationships in datasets with the help of developed algorithms. Data mining is based on three main algorithms: classification, clustering, and association algorithms. Accordingly, it can be used in many sectors such as health, finance, economics, production, marketing, and many more [23]. WEKA is used as a package program in data mining applications, including preprocessing, clustering, classification, visualization, feature selection, and association rule extraction for datasets. The reasons for choosing data mining in this study include the fact that data mining is a powerful tool in providing the necessary information for the business to understand itself, its customers, and the market, and that it adds value to data warehouses. Data mining and statistical techniques are used to analyze data. Statistics differ significantly from machine learning in that statistical methods are usually related to the data being analyzed and are developed based on a conceptual reference example. Although this makes statistical methods adaptive and efficient, it limits their ability to quickly adapt to methods evolving from new information technology and new machine learning applications. For this reason, statisticians have shown an interest in data mining in recent years. This has helped the development of data mining [24].
In accordance with the content and purpose of this study, association rule extraction was used as the data mining method.
The WEKA software package was used as the analysis method in this study. Our main motivations for choosing this approach are the desire to produce original results by obtaining more than 300 data points from people who live in different settlements, the determination of which is the common housing demands of users. In addition, the ability to identify patterns among big data with the help of data mining programs.

2.3. SPSS Reliability Analysis

The reliability of the dataset obtained as a result of the survey in this study could be examined. The alpha coefficient method, developed by Cronbach in 1951 to determine the reliability of a questionnaire, is an internal consistency estimation method used to determine the consistency of a test or a scale within itself.
Cronbach’s alpha coefficient is the weighted standard average change calculated by dividing the sum of the variances into the k items in the scale or the test by the general variance. There may be a single α value determined for each item or an average α value for all items in the scale. The α value obtained for all items indicates the overall reliability of that questionnaire, and it is generally accepted that this value should be 0.70 or greater. The commonly accepted ranges of the alpha coefficient are as follows [25]:
0.00 ≤ α < 0.40: the scale is not reliable;
0.40 ≤ α < 0.60: the scale has low reliability;
0.60 ≤ α < 0.80: the scale is very reliable;
0.80 ≤ α < 1.00: the scale has high reliability.

2.4. Association Rules

Association rules are a data mining method that describes the co-occurrence of events in terms of probability. The aim of this method is to identify important connections among the data [26]. This mathematical model was proposed by Agrawal et al. in 1993 and was first used on grocery basket data [27]. The association rule method is applied to discover patterns in datasets [28]. There are various algorithms used for this purpose. The most widely used algorithm is the “apriori algorithm” [29]. Each rule obtained by the apriori algorithm has a confidence value. This value expresses the consistency of the rule proportionally [30]. Association rules are helpful algorithms for revealing unknown patterns in big data. Compared to other statistical methods, it determines how often attributes occur together, which is the main reason for its use in this study.
In the Apriori algorithm, which is the most well-known algorithm in association rule inference, in order to perform association analysis, threshold values are first determined to compare support and confidence measures. The results obtained must be equal to or significantly higher than these thresholds. Support numbers are calculated for each product to be included in the analysis by scanning the database. These support numbers are compared with the threshold support number. Rows with values less than the threshold support number are excluded from the analysis and records that meet the condition are taken into consideration. The selected products are grouped in pairs this time and the repetition counts of these groups, i.e., the support counts, are obtained. These numbers are compared with the threshold support numbers. Rows with values less than the threshold are removed from the analysis. This time, groupings of three, four, etc., are made and the support numbers of these groups are obtained and compared with the threshold value. Processes are continued as long as they are in compliance with thresholds. After the product group is determined, association rules are derived based on the rule support criteria, and confidence measures are calculated for each of these rules [31]. All these steps are unique to WEKA.

3. Results

This section of the study presents the results of analyzing the collected data. First of all, the Cronbach’s alpha coefficient was determined for the reliability test of the questionnaire scale by SPSS. After the reliability of the questionnaire was ensured, the data obtained from 303 participants were analyzed with WEKA. The results are given in the subsections below.

3.1. Results of the SPSS Reliability Analysis

The questionnaire data were subjected to a reliability analysis according to Cronbach’s alpha coefficient scale in SPSS, and the value was determined to be 0.836. Because this coefficient value was between 0.80 and 1.00, it can be concluded that our survey study is highly reliable [25].
In this part of the study, the data obtained from the questionnaires are presented in pie charts. The following graphs of the frequently encountered characteristics in the findings of the study are presented: Figure 1: gender; Figure 2: number of family members; Figure 3: ownership status of the residence. In addition, a graph showing the number of participants from each of the provinces is also provided in Figure 4.
The demographic characteristics of the participants in the study were determined in line with their answers to the questions in the first part of the questionnaire. Figure 1 shows that 46% of the participants were female and 54% were male.
Figure 2 is a graph containing the findings on the number of individuals living in each family. The results show that 24% of the participants had 1–2 family members, 65% had 3–5 family members, and 11% had 6 or more family members.
Figure 3 shows the distribution of participants according to whether they were tenants in or homeowners of the housing they resided in. In this case, 45% of the respondents were tenants (137 people) and 55% were homeowners (166 people).
The distribution of the provinces where the respondents reside is presented in Figure 4. The x-axis at the bottom of the graph gives the names of the provinces. The height of the column corresponding to each province name is shown as a numerical value on the left side of the graph. These columns represent the number of respondents in the relevant province.

3.2. Results of the WEKA Analysis

In the study, association rule extraction by WEKA software was used to analyze the data. Thus, the co-occurrence of the answers given to the statements identified as class labels and the answers given to other statements were determined. In this framework, the statements determined as class labels were as follows:
  • Ownership status of the housing;
  • Customers’ expectations of housing.
In the first phase, we aimed to determine the effect of ownership status on the characteristics of housing. In this respect, the question “What is the status of your residence? 1 = tenant; 2 = owner” was set as a class label in the questionnaire and the answers to the other questions were evaluated on the basis of this question. The results and explanations under this heading are presented in Table 2 and Table 3. The second statement aimed to determine the level of expectation of the participants regarding the houses as the effect of all the other questions. For this purpose, the 25 questions in the second part of the questionnaire were categorized, and the average of the answers given by the participants to the statements, specified as the expectation status of the housing, was defined as a high expectation if the average of the answers given by the participants to the statements regarding the expectation status of the housing was 3.50 and above, and the expectation was defined as low if it was below 3.50. This determination was based on the master’s thesis study of the author [27]. In the aforementioned study, the averaging method, which is frequently used in statistics and data mining preprocessing steps, was preferred. A threshold value of 3.50 was reached by averaging the answers given by each participant to the 25 questions from 1 to 5 on a Likert scale. Since this value reflects the average of the answers, the answers above it were labeled as high expectations and the answers below it were labeled as low expectations.
In the second part of the questionnaire on housing characteristics, the respondents gave answers from 5 to 1 on a 5-point Likert scale for 25 determinative statements.
The concept of whether the rules in all the tables were in the reliable range is expressed as confidence. When the confidence value approaches 1.00, the reliability of the specified association rule is greater [32,33].
In this study, a dataset was created for two separate groups of questions with the responses obtained from the questionnaires. These questions were selected as the class labels, and their relationship with the participants’ answers was investigated. The first class label was related to the ownership status of the housing. In other words, this class label was determined in order to determine the demands of tenants and homeowners. The results of this analysis are presented in Table 2, and the explanations are given in Table 3. The second class label was defined to measure the customers’ expectations of housing. This class label aimed to reveal which respondents with which characteristics had high expectations and which had low expectations of housing. The results of this analysis are presented in Table 4, and the explanations are presented in Table 5. The data were analyzed for the two different class labels and the rules of association were revealed.
The findings obtained as a result of this analysis are given below.

3.2.1. WEKA Analysis Results for Ownership Status

Table 2 presents the results of the analysis where the class label was the ownership status of the housing.
When all of the attributes for the relevant analysis were entered into WEKA and the algorithm was run, the rules in the table were generated. Following the analysis, the rules were ranked from 1.0 to 0.0 based on their confidence values.
In this table, each row expresses a rule of association. In the first rule, it can be seen that individuals between the ages of 27 and 38 years with a bachelor’s degree who do not consider the north, east, and west facades of the house as a preference and those who especially prefer only a southern facade on the house are tenants. The confidence value of this rule is 93%. When another rule was analyzed, namely the fifth rule, the participants who wanted the house to have more than 4 + 1 rooms and especially those who want the house to have at least one large room and demand this room to be a dining room are property owners, with a confidence interval of 90%.
At the 89% confidence level, participants who prefer a certain facade but not an east facade and want more than 4 + 1 rooms are owners.
At the same time, for a different rule, namely the seventh rule in this analysis, it can be seen that the participants aged between 27 and 38 years who have a bachelor’s degree, and who have a preference for a south-facing facade but do not see east- and west-facing facades as a preference, are homeowners, with a confidence value of 89%. Table 3 presents the descriptions of the attributes in the 10 rules.

3.2.2. WEKA Analysis Results for Customers’ Expectations of Housing

The results of the analysis for this class label, which was determined as the second analysis in the study, in which customers’ expectations of housing were examined, are presented in Table 4.
In the first rule in Table 4, individuals with an associate degree who do not prefer the house to have an east-facing facade and who prefer the children’s room to be especially spacious have high expectations of a house. The confidence value of this rule is 89%.
Similarly, in the third rule, it can be seen that female individuals who demand that the house should be unused and that the kitchen and bedroom should be spacious have high expectations of the house, with a confidence value of 86%. The fifth rule in the table, participants who would prefer a south facade, who want 4 + 1 rooms, and who prefer a large room for children have high expectations of the house. The confidence value of this rule is 83%. As an interesting point, if the ninth rule is analyzed, it can be seen that the expectations of people whose gender is male with 3–5 family members who do not prefer the house to have a western facade, who prefer the living room and children’s room to be spacious, and who are the property owners of the house they reside in have low expectations of the house. The confidence value of this rule is 82%. Table 5 presents the descriptions of the attributes for the 10 rules.

4. Discussion

In this study, Cronbach’s alpha coefficient was calculated using SPSS to analyze the data collected through the questionnaire. Thus, the reliability of the questionnaire was determined. WEKA was then used to determine the demands of the customers regarding their houses.
In the light of all these findings, it is thought that the study will contribute to the literature and the sector in several ways as follows.
  • There are some studies in the literature [7,8,9,10,11,12,13,14,15,16,17,34,35,36,37,38,39,40,41] that have determined customers’ expectations of housing. However, most of these studies have been conducted regionally and used different statistical analysis methods.
  • When the aforementioned studies [7,8,9,10,11,12,13,14] were examined, it was found that although different statistical methods were used in these studies, similar findings to the results of this study were reached. In other words, in these studies, it was stated that customer demands should be at the forefront of today’s production of housing and that construction companies should produce buildings accordingly. In this case, the authors emphasized that although this study supports the information in the literature, it is innovative, especially in terms of the research methodology.
  • In the study, two different class labels were determined in accordance with the purpose of the study, and the distribution of the other questions was analyzed according to these labels. The originality of the study was enhanced by the categorization of the 25 questions in the second part of the questionnaire and the evaluation of the answers given by the participants to the statements regarding their expectations of housing. In this way, all the expectations of customers were evaluated together. This marks a first in the field of determining customers’ demands in the housing sector.
  • Houses are long-lasting products, and their construction costs are increasing day by day. In this case, today, it is mandatory to produce houses not only in terms of quantity but also in terms of quality in line with customers’ demands. Therefore, the authors of this study believe that studies to determine the demands of housing customers are important and necessary.
  • Once the customers’ demands have been determined, it is in the interest of both businesses and customers to produce housing accordingly. It is clear that a feasibility study is necessary to determine the demands. This study can also be said to be a precedent for the beginning of a precise feasibility study. At the same time, it can be said that the results of the study can serve as an example in the field of housing marketing and can guide future research. In this respect, it is of critical importance that the original results of this research are communicated to the sector’s representatives.
  • This analysis method has never been applied to the data of the country where the study was conducted. This indicates the originality of the study. In addition, the analysis of the survey data with the help of WEKA, a data mining program, is considered critical by the authors in terms of revealing which qualities housing customers expect together. It is also clear that these findings will provide housing companies in Turkey with the opportunity to build housing in line with the prioritized expectations of customers. Considering the results of this study, the authors discussed that similar studies should be developed and conducted both in Turkey and in other countries. This enables them to make significant contributions to the construction sector.
Furthermore, when analyzing the specific results of this study, the authors believe that the fact that 54% of participants are males and 46% are females in Figure 1 permits a gender-based interpretation. In other words, our sample, which included 163 males and 140 females, reflects reality in terms of gender. Approximately two-thirds (65%) of the participants have 3–5 family members based on the findings in Figure 2. Therefore, the preference for a house with large rooms is not surprising. According to Figure 3, 45% of respondents are tenants (137 people) and 55% are homeowners (166 people). In terms of ownership status, one of the study’s class labels, these data indicate a balanced distribution. Due to the lack of a significant difference in numbers, we were able to present the preferences of these people in a more homogeneous manner. The distribution of respondents’ provinces of residence is shown in Figure 4. Hatay had the most respondents, followed by Gaziantep and Istanbul. In order to obtain reliable results, face-to-face surveys were conducted in 30 provinces in all of the geographical regions of Turkey.
Unlike other studies, the authors of this study interpret the findings as follows: the majority of property owners demand 4 + 1 independent units (90% and above confidence in the rules). Interestingly, tenants want their living rooms to be spacious (the confidence value in these rules is between 80–90%). It was determined that female individuals had higher housing expectations than male individuals. In addition, the findings revealed that individual housing expectations differed based on variables such as age, education level, and the number of individuals in the family. Looking at these specific results, it was understood that the majority of the association rules obtained had a confidence value of 90% and above. This is sufficient for the reliability of the results.
From the perspective of all these findings, the innovations that this study offers to the literature and the sector, as well as the precedent it sets for future studies, show the importance of the research.

5. Conclusions

This study aimed to determine the demands of housing customers. The questionnaire prepared to measure the expectations of housing was applied throughout Turkey. Determining customers’ demands is important for the housing sector. Since each society has different lifestyles, the results of the study are valid for the country where the research was conducted. However, this study is an example for researchers in different countries where it is desirable for research to be conducted. It can guide new studies to be conducted in other countries. The limitations of the study are that it only includes results covering those living in residences in Turkey and that the researchers faced the difficulty of conducting face-to-face surveys under pandemic conditions. Some residents declined to participate in the survey due to the pandemic conditions. If this were not the case, more surveys could have been conducted in some cities. The study, however, did not suffer from this deficiency, since a sufficient number of participants were reached.
When the results of the WEKA analysis were examined, it could be seen that property owners demand houses with 4 + 1 independent sections. It is noticeable that individuals who are tenants want the living room to be spacious. In addition, two different groups, homeowners and renters, have a preference for a south-facing facade. The findings also show that female individuals have higher expectations of housing than male individuals. It can be said that the findings obtained contain important information for businesses that produce and market housing.
In conclusion, it is thought that production in line with customers’ expectations will benefit both businesses and customers. The literature also supports this idea. Therefore, it is important to share the results of this study, which was conducted for the first time in the literature via this method, with companies in the housing sector and to draw attention to customer-oriented production. At the same time, it is recommended that all stakeholders, especially researchers and construction companies, cooperate.
Some suggestions for the sector to produce housing by taking the demands of housing customers obtained from this study into account are as follows.
  • The results of the study show that housing customers have various expectations of companies. The results of this study show that the determination of these expectations by the companies at the feasibility stage of construction and producing appropriate houses will provide advantages in housing marketing and will also create customer satisfaction. In addition, this study can be viewed as a precedent for the start of a detailed feasibility study. Furthermore, the study’s results can be used as an example of housing marketing. Future research can be guided by this information. In this regard, it is crucial that the original results of this research are communicated to the sector’s representatives.
  • Moreover, this study revealed the importance of determining the expectations of different groups of customers, such as males vs. females, tenants vs. owners, and different age groups. In this context, the results can guide the construction companies that produce housing to make production plans in accordance with these characteristics of existing and potential customers.
  • It is thought that it would be useful for construction companies to organize surveys in order to determine the expectations of existing and potential customer groups while producing housing. In this respect, it is considered important to convey the results of this and similar studies to the stakeholders in this sector.
  • Finally, the authors emphasize that the abovementioned original results of this study should be disseminated not only to construction companies but also to all stakeholders in the housing sector as much as possible, and that it would be useful to work on this issue in the internal training processes of the relevant institutions.

Author Contributions

A.E.K. and Y.C.A. conceived the main idea of the paper. Y.C.A. conducted the face-to-face surveys. A.E.K. conducted the analysis. A.E.K. and Y.C.A. wrote the manuscript, and both authors contributed to improving the paper. All authors have read and agreed to the published version of the manuscript.

Funding

This research received no external funding.

Institutional Review Board Statement

Not applicable.

Informed Consent Statement

Not applicable.

Data Availability Statement

Data are available on request from the authors.

Conflicts of Interest

The authors declare no conflict of interests.

References

  1. Keleş, M.K.; Keleş, A.E. The place of data mining applications and heuristic optimization algorithms in construction management. Cukurova Univ. Eng. Archit. J. 2017, 32, 235–242. [Google Scholar] [CrossRef] [Green Version]
  2. Şahin, B. Ethical Decision Making Process of Travel Agencies’ in Marketing Activities: The Case of Istanbul. Ph.D. Thesis, Balikesir University Institute of Social Sciences, Balıkesir, Turkey, 2011. [Google Scholar]
  3. Özer, H.A. Measurement of Customer Satisfaction at Residential Marketing: Safranbolu Sample. Master’s Thesis, Karabük University Institute of Social Sciences, Karabük, Turkey, 2015. [Google Scholar]
  4. Parvatiyar, A.; Sheth, J.N. Customer relationship management: Emerging practice, process, and discipline. J. Econ. Soc. Res. 2001, 3, 1–34. [Google Scholar]
  5. Das, S.; Mishra, M. The Impact of Customer Relationship Management (CRM) Practices on Customer Satisfaction. In Business Governance and Society; Rajagopal, B.R., Ed.; Palgrave Macmillan: London, UK, 2019. [Google Scholar] [CrossRef]
  6. Emre, İ.E.; Erol, Ç.S. Statistics or Data Mining for Data Analysis. J. Inf. Technol. 2017, 10, 161–167. [Google Scholar] [CrossRef] [Green Version]
  7. Lan, H.; Ma, X.; Ma, L.; Qiao, W. Pattern investigation of total loss maritime accidents based on association rule mining. Reliab. Eng. Syst. Saf. 2023, 229, 108893. [Google Scholar] [CrossRef]
  8. Caruccio, L.; Cirillo, S.; Deufemia, V.; Polese, G. Efficient Discovery of Functional Dependencies from Incremental Databases. In Proceedings of the 23rd International Conference on Information Integration and Web Intelligence, New York, NY, USA, 29 November–1 December 2021; pp. 400–409. [Google Scholar] [CrossRef]
  9. Le Guilly, M.; Petit, J.M.; Scuturici, V.M. Evaluating Classification Feasibility Using Functional Dependencies. In Transactions on Large-Scale Data- and Knowledge-Centered Systems XLIV; Lecture Notes in Computer Science; Hameurlain, A., Tjoa, A.M., Lamarre, P., Zeitouni, K., Eds.; Springer: Berlin, Germany, 2020; p. 12380. [Google Scholar] [CrossRef]
  10. Gusmao, B.S.; Debs, L.; Elwakil, E. A review on the factors affecting the use of offsite construction in multifamily housing in the United States. Buildings 2021, 11, 5. [Google Scholar] [CrossRef]
  11. Savolainen, J.M.; Ilgın, H.E.; Oinas, E.; Karjalainen, M. Finnish multi-story timber-framed apartment buildings: Tampere residents’ perspectives. Buildings 2022, 12, 1998. [Google Scholar] [CrossRef]
  12. Conte, M.; Echeveste, M.E.S.; Formoso, C.T.; Bazzan, J. Synergies between mass customization and construction 4.0 technologies. Buildings 2022, 12, 1896. [Google Scholar] [CrossRef]
  13. Chen, B.; Chen, Y.; Chen, Y.; Gao, J. Model of demand of human settlement environment for rural houses in North China: A structural equation modeling approach. Buildings 2022, 12, 926. [Google Scholar] [CrossRef]
  14. Soon, A.; Tan, C. An analysis on housing affordability in Malaysian housing markets and the home buyers’ preference. Int. J. Hous. Mark. Anal. 2020, 13, 375–392. [Google Scholar] [CrossRef]
  15. Bahat, M.K. Factors Affecting Decision Making in Housing Purchasing. Master’s Thesis, Mimar Sinan Fine Arts University, Institute of Science, İstanbul, Turkey, 2019. [Google Scholar]
  16. Şibil, Ö. Housing Market: An Application for Measuring Housing Buying Behaviors of Consumers in Gümüşhane. Master’s Thesis, Gümüşhane University Institute of Social Sciences, Gümüşhane, Turkey, 2019. [Google Scholar]
  17. Glumac, B.; Islam, N. Housing preferences for adaptive re-use of office and industrial buildings: Demand side. Sustain. Cities Soc. 2020, 62, 102379. [Google Scholar] [CrossRef]
  18. Tabachnick, B.G.; Fidell, L.S. Using Multivariate Statistics. In Allyn and Bacon, 4th ed.; Pearson India Publishing: Boston, MA, USA, 2001. [Google Scholar]
  19. Bademci, V. Tests are Not Reliable: Adequate Attention to Measurement Reliability and Sample Size for Reliability Studies. J. Ind. Arts Educ. Gazi Univ. 2005, 17, 33–45. [Google Scholar]
  20. Keleş, M.K.; Keleş, A.E. An investigation on the productivity of construction sector employees in Adana. El-Cezerî J. Sci. Eng. 2018, 5, 605–609. [Google Scholar] [CrossRef]
  21. Keleş, A.E.; Kaya, M. The Analysis of the Factors Affecting the Productivity in the Wall Construction of the Using Apriori Data Mining Method. In Academic Informatics Conference; Proceedings Book: Mersin, Turkey, 2014; pp. 831–836. [Google Scholar]
  22. Dener, M.; Dörterler, M.; Orman, A. Open source data mining programs: Example application on WEKA. In Academic Informatics Conference; Proceedings Book: Şanlıurfa, Turkey, 2009; Volume 9, pp. 11–13. [Google Scholar]
  23. Ersöz, F. Data Mining Techniques and Applications, 3rd ed.; Seçkin Publishing: Ankara, Turkey, 2019; p. 303. [Google Scholar]
  24. Giudici, P. Applied Data Mining: Statistical Methods for Business and Industry, West Sussex; John Wiley & Sons: Hoboken, NJ, USA, 2003. [Google Scholar]
  25. Özdamar, K. Statistical Data Analysis with Package Programs, 4th ed.; Kaan Publishing: Eskişehir, Turkey, 2004; pp. 279–340. [Google Scholar]
  26. Şentürk, A. Data Mining: Concepts and Techniques, 1st ed.; Ekin Publishing: Bursa, Turkey, 2006. [Google Scholar]
  27. Agrawal, R.; Imieliński, T.; Swami, A. Mining association rules between sets of items in large databases. In Proceedings of the 1993 ACM SIGMOD International Conference on Management of Data, Washington, DC, USA, 25–28 May 1993; pp. 207–216. [Google Scholar] [CrossRef]
  28. Ateş, Y.; Karabatak, M. Multiple minimum support value for quantitative association rules. Fırat Univ. J. Eng. Sci. 2017, 29, 57–65. Available online: https://dergipark.org.tr/en/pub/fumbd/issue/31208/339546 (accessed on 22 December 2022).
  29. Agrawal, R.; Srikant, R. Fast algorithms for mining association rules in large databases. In Proceedings of the 20th International Conference on Very Large Data Bases, San Francisco, CA, USA, 12–15 September 1994; pp. 487–499. [Google Scholar]
  30. Keleş, A.E.; Önen, E.; Górecki, J. Determination of Green Building Awareness: A Study in Turkey. Sustainability 2022, 14, 11943. [Google Scholar] [CrossRef]
  31. Özkan, Y. Veri Madenciliği Yöntemleri; Papatya Yayıncılık: İstanbul, Türkiye, 2008; p. 159. [Google Scholar]
  32. Arıkan, Y.C. Investigation of Customer Housing Demand Behaviors in Construction Marketing. Master’s Thesis, Adana Alparslan Türkeş Science and Technology University, Institute of Graduate School, Adana, Turkey, 2022. [Google Scholar]
  33. Keleş, A.E.; Yılmaz, H.K. Investigation of Lean Production Knowledge among Employees in Building Inspection Organizations. Sustainability 2022, 14, 15142. [Google Scholar] [CrossRef]
  34. Ariyawansa, R.G. An empirical study of consumer behavior in housing market in Colombo. Built-Environ. Sri Lanka 2010, 8, 11–19. [Google Scholar] [CrossRef]
  35. Opoku, R.A.; Abdul-Muhmin, A.G. Housing preferences and attribute importance among low-income consumers in Saudi Arabia. Habitat Int. 2010, 34, 219–227. [Google Scholar] [CrossRef]
  36. Khair, N.; Ali, H.M.; Juhari, N.H.; Awang, M. Residential preference towards physical environment in public low-cost housing. In The Role of Service in the Tourism & Hospitality Industry; CRC Press: Boca Raton, FL, USA, 2015; pp. 13–18. [Google Scholar] [CrossRef]
  37. Maoludyo, F.T.; Aprianingsih, A. Factors influencing consumer buying intention for housing unit in Depok. J. Bus. Manag. 2015, 4, 484–493. [Google Scholar]
  38. Su, Ö. Marketing Mix Strategies for Housing Marketing. Master’s Thesis, İstanbul Aydın University Institute of Social Sciences, İstanbul, Turkey, 2016. [Google Scholar]
  39. Baytan, N. Factors Affecting Home Purchasing Decisions: Case of Çanakkale. Master’s Thesis, Yıldız Technical University Garduate School of Science and Engineering, İstanbul, Turkey, 2019. [Google Scholar]
  40. Memiş, S. Measurement of the factors affecting the housing preference of consumers by ahp: A case of Giresun province. Int. J. Euroasian Res. 2019, 7, 783–796. [Google Scholar] [CrossRef]
  41. Han, S.Y. Exploring Customer Relationship Management through Technologyenabled Experience in Virtual Environment: The Era of COVID-19. Master’s Thesis, KDI School of Public Policy and Management, Sejong, Republic of Korea, 2021. [Google Scholar]
Figure 1. Distribution of participants according to gender.
Buildings 13 00555 g001
Figure 2. Distribution of participants according to the number of family members.
Buildings 13 00555 g002
Figure 3. Distribution of participants according to the ownership status of the house.
Buildings 13 00555 g003
Figure 4. Distribution of participants by province.
Buildings 13 00555 g004
Table 1. Summarizing related studies in the literature and emphasizing the novelty of our study.
Research TitlePublication YearSummary
Evaluating Classification Feasibility Using Functional Dependencies2020It examined the concept of machine learning models, and the classification accuracy of functional dependencies was obtained.
An analysis on housing affordability in Malaysian housing markets and the home buyers’ preference2020It aimed to investigate the housing preferences of customers in the Malaysian housing market. The results confirmed a significant relationship between monthly income and preferred housing type using cross-tabulation analysis.
Efficient Discovery of Functional Dependencies from Incremental Databases2021A new validation method was proposed to efficiently verify the validity of a candidate dataset. The results demonstrated the effectiveness of the proposed method on adapted real-world datasets.
A review on the factors affecting the use of offsite construction in multifamily housing in the United States2021Off-site construction strategies were examined and decision variables for building sustainable homes in the United States were identified. As a result, social, environmental, and economic factors were identified in multi-family housing in the USA.
Finnish multi-story timber-framed apartment buildings: Tampere residents’ perspectives.2022The opinions of the residents of Tampere, Finland, about wooden structures were obtained through 151 questionnaires. It emerged that there is a demand for multi-story timber-framed houses, especially in the customer segment which was defined as environmentally friendly.
Synergies between mass customization and construction 4.0 technologies2022To understand which Construction 4.0 technologies should be implemented together, the relationships between the elements were identified. Thus, the relationships between customers’ demands were identified.
Model of demand of human settlement environment for rural houses in North China: A structural equation modeling approach2022In northern China, the expectations of farmers regarding their living environments were determined. The factors affecting housing demand were analyzed through the survey. The results showed that socioeconomic status had the greatest influence on the weight of overall satisfaction. Farmers also paid attention to gardening, toilets, living rooms, the indoor thermal environment, and air quality.
Pattern investigation of total loss maritime accidents based on association rule mining2023Association rule mining (ARM) was used to uncover potential patterns in the loss of accident data. The results showed that vessels over 20 years of age were the main contributor to total casualty accidents.
Analysing Customers’ Housing Demands in Buildings Using a Data Mining Method (Our study)-In the housing marketing of the Turkish construction industry, the relationship between the qualities demanded by the customers in the houses was determined by association rules. In this way, original results to be presented to the sector were revealed.
Table 2. Results for the ownership status of the housing.
Rule No.Association RulesReliability Value
Properties of the RulesClass Label Attribute
1Age = 2, education status = 4, Q10 preference = 2, Q10 north = 2, Q10 east = 2, Q10 west = 2Tenant/homeowner = 1conf: (0.93)
2Age = 2, education status = 4, Q10 preference = 2, Q10 south = 1, Q10 north = 2, Q10 east = 2, Q10 west = 2, Q13 preference = 2, Q13 preference = 2.1Tenant/homeowner = 1conf: (0.92)
3Age = 2, education status = 4, Q10 preference = 2, Q10 south = 1, Q10 north = 2, Q10 east = 2, Q10 west = 2, Q13 preference = 2, Q13 preference = 2.1Tenant/homeowner = 1conf: (0.92)
4Gender = 2, age = 2, Q10 preference = 2, Q10 south = 1, Q10 north = 2, Q10 west = 2, Q13 preference = 2, Q13 preference = 2.1Tenant/homeowner = 1conf: (0.92)
5Number of rooms = 6, Q13 preference = 2, Q13 preference = 2.1Tenant/homeowner = 2conf: (0.90)
6Q10 preference = 2, Q10 east = 2, number of rooms = 6Tenant/homeowner = 2conf: (0.89)
7Age = 2, education status = 4, Q10 preference = 2, Q10 south = 1, Q10 east = 2, Q10 west = 2Tenant/homeowner = 2conf: (0.89)
8Age = 2, Q10 preference = 2, Q10 south = 1, Q10 east = 2, Q10 west = 2, Q13 preference = 2, Q13 preference = 2.4Tenant/homeowner = 1conf: (0.89)
9Gender = 2, age = 2, Q10 preference = 2, Q10 north = 2, Q10 west = 2, Q13 preference = 2, Q13 preference = 2.5Tenant/homeowner = 1conf: (0.89)
10Gender = 2, age = 2, education = 2, Q10 preference = 2, Q10 north = 2, Q10 west = 2, Q13 preference = 2, Q13 preference = 2.5Tenant/homeowner = 1conf: (0.89)
Table 3. Definitions of the features for Class Label 1: Ownership status of the housing.
Features of the Association RulesDefinitions of the Features
Age = 2Participants aged 27–38 years
Education status =4Participants with a bachelor’s degree
Question 10 preference = 2Participants with a preference for a particular facade (1 = participants with no facade preference in Q10)
Question 10 preference = north, south, east or west = 1Participants whose preference is for a south-, north-, east-, or west-facing facade
Question 10 preference = north, south, east or west = 2Participants whose preference is not for a south-, north-, east-, or west-facing facade
Question 13 preference = 2Participants with a preference for a large room (1 = participants with no preference for a large room in Q13)
Question 13 preference = 2.1Participants who especially preferred a large dining room
Question 13 preference = 2.4Participants who especially preferred a large bedroom
Question 13 preference = 2.5Participants who especially preferred a large children’s room
Gender = 2Male participants
Number of rooms = 6Participants who want more than 4 + 1 rooms in the house
Education status = 2Participants with a high school degree
Ownership status = 1Participants who are tenants in their house
Ownership status = 2Participants who are the owners of their house
Table 4. Results for customers’ expectations of housing.
Rule No.Association RulesReliability Value
Properties of the RulesClass Label Attribute
1Education status = 3, Q10 preference = 2, Q10 east = 2, Q13 preference = 2, Q13 preference = 2.5High expectationsconf: (0.89)
2Education status = 3, Q10 preference = 2, Q10 north = 2, Q10 east = 2, Q13 preference = 2, Q13 preference = 2.5High expectationsconf: (0.87)
3Gender = 1, building age = 1, Q13 preference = 2, Q13 preference = 2;2, Q13 preference = 2.4High expectationsconf: (0.86)
4Gender =1, number of family members = 2, Q10 preference = 2, Q10 east = 2, Q13 preference = 2, Q13 preference = 2.2, Q13 preference = 2.3Low expectations conf: (0.85)
5Q10 preference = 2, Q10 south = 1, number of rooms = 5, Q13 preference = 2, Q13 preference = 2.5High expectationsconf: (0.83)
6Gender = 2, number of family members = 2, Q10 preference = 2, Q10 east = 2, Q13 preference = 2, Q13 preference = 2.3High expectationsconf: (0.83)
7Number of family Members = 2, Q10 preference = 2, Q10 north = 2, Q13 preference = 2, Q13 preference = 2.2, Q13 preference = 2.4, tenant/homeowner = 1High expectationsconf:(0.83)
8Number of rooms = 4, Q13 preference = 2, Q13 preference = 2.1, Q13 preference = 2.2, Q13 preference = 2.4High expectationsconf: (0.83)
9Gender = 2, number of family members = 2, Q10 preference = 2, Q10 west = 2, Q13 preference = 2, Q13 preference = 2.3, Q13 preference = 2.5, tenant/homeowner = 2Low expectationsconf: (0.82)
10Number of family members = 2, Q10 preference = 2, Q10 north = 2, Q13 preference = 2, Q13 preference = 2.1, Q13 preference = 2.4, tenant/homeowner = 2Low expectationsconf: (0.82)
Table 5. Definitions of the features for Class Label 2: Customers’ expectations of the house.
Features of the Association RulesDefinitions of Features
Education status = 3Participants with an associate degree
Question 10 preference = 2Participants with a preference for a particular facade (1 = Participants with no facade preference in Q10)
Question 10 preference = north, south, east or west = 1Participants whose preference is for a south-, north-, east-, or west-facing facade
Question 10 Preference = north, south, east or west = 2Participants whose preference is not for a south-, north-, east-, or west-facing facade
Gender = 1Female participants
Gender = 2Male participants
Building age = 1Participants who want the house to be unused
Question 13 preference = 2Participants with a preference for a large room (1 = Participants with no preference for a large room in Q13)
Question 13 preference = 2.1 Participants who especially prefer a large dining room
Question 13 preference = 2.2 Participants who especially prefer a large kitchen
Question 13 preference = 2.3 Participants who especially prefer a large living room
Question 13 preference = 2.4 Participants who especially prefer a large bedroom
Question 13 preference = 2.5 Participants who especially prefer a large children’s room
Number of rooms = 5Participants who want 4 + 1 rooms in the house
Number of family members = 2Participants with 3–5 family members
Ownership status = 1Participants who are tenants in their house
Ownership status = 2Participants who are the owners of their house
Number of rooms = 4Participants who want 3 + 1 rooms in the house
Expectations = highParticipants with an average of 3.50 and above out of 5.00.
Expectations = lowParticipants with an average of less than 3.50 out of 5.00.
Disclaimer/Publisher’s Note: The statements, opinions and data contained in all publications are solely those of the individual author(s) and contributor(s) and not of MDPI and/or the editor(s). MDPI and/or the editor(s) disclaim responsibility for any injury to people or property resulting from any ideas, methods, instructions or products referred to in the content.

