Article

Design and Parameter Optimization of the Reduction-Isolation Control System for Building Structures Based on Negative Stiffness

1
School of Civil Engineering, Anhui Jianzhu University, Hefei 230601, China
2
Key Laboratory of Intelligent Underground Detection Technology, Anhui Jianzhu University, Hefei 230601, China
*
Author to whom correspondence should be addressed.
Buildings 2023, 13(2), 489; https://doi.org/10.3390/buildings13020489
Submission received: 20 December 2022 / Revised: 8 February 2023 / Accepted: 9 February 2023 / Published: 11 February 2023

Abstract

:
In order to improve the damping capacity of building isolation system, this paper studies the damping isolation control system of the building structure based on negative stiffness. In this paper, the dynamic equation of the damping isolation control system is derived and its parameters are optimized by H2 norm theory and Monte Carlo pattern search method. Taking the 5-story building structure as an example, this paper analyzes and evaluates the damping performance of the damping isolation control system of the building structure under the actual earthquake. The results show that negative stiffness can improve the damping capacity of traditional isolation system. Additionally, the negative stiffness ratio under the condition of stability, the smaller the negative stiffness ratio, the stronger the vibration reduction ability of the negative stiffness. The damping isolation control system of building structure based on negative stiffness shows good damping effect under the actual earthquake.

1. Introduction

At present, there are three ways to solve the problem of vibration control of building structures under an earthquake: earthquake resistance, vibration reduction and isolation. Seismic isolation technology is to extend the period of the whole structure through the flexible isolation layer with a small stiffness in order to reduce the effect of seismic response, which is widely used in engineering structures. Using isolation and energy dissipation devices to mitigate structural seismic response is expected to improve structural safety and vibration reduction efficiency [1,2]. Generally, flexible materials with low stiffness are used as isolation layers, whose function is to prolong the structural cycle. In recent years, researchers have performed a lot of research on the new vibration control system which is composed of negative stiffness and isolation system. The content of most articles is to verify their conjecture by experiment and simulation. In comparison, the articles that verify the correctness of the conjecture through formula derivation and some optimization algorithms are relatively small, and most of them study the time domain. This situation shows some limitations in this field. Therefore, innovation point 1 is a two degrees of freedom isolation system with negative stiffness. The innovation point 2 is to select the H 2 norm theory and Monte Carlo pattern search method as the basis for the derivation and calculation of this paper, and study from the perspective of frequency domain.
The concept of negative stiffness has been widely used in engineering fields, such as vehicle suspension control systems [3,4], cable-stayed bridge control systems [5,6,7,8,9], building foundation isolation systems [10], magnetic flow negative stiffness dampers [11,12,13,14,15], passive control devices [16,17,18,19,20,21], dynamic vibration absorbers [22] and seismic protection of buildings [23,24,25]. Negative stiffness can reduce the response of free vibration of simple oscillator and satisfy the normal use of a precision instrument under high frequency vibration [26]. The isolation control system coupled by the negative stiffness element and the flexible isolation layer can reduce the structural displacement and acceleration response [27]. In addition, the quasi-negative stiffness control algorithm can be used to calculate the two-stage Benchmark problem of the cable-stayed bridge, and the semi-active control is better than the passive control [5]. The negative stiffness device can effectively reduce the deck displacement and base shear of the bridge [28]. Compared with a traditional damping device, a passive negative stiffness friction device has a better vibration control effect [29]. The negative stiffness based magnetorheological damper can effectively solve the vibration control problem of multi-DOF building structures [13]. The negative stiffness device can be applied not only to the multi-DOF building structure but also to the bridge vibration control problem. Dampers with negative stiffness elements can be installed on the cable of the bridge and can reduce the vibration of the cable. Compared with traditional dampers, dampers with negative stiffness elements have greater energy dissipation capacity [30]. In recent years, the performance of devices with negative stiffness and dampers has been improved significantly. The advanced control system of the isolation device can solve the vibration control problem of bridge structure. The foundation isolation system is based on leading rubber negative stiffness spring can be used for seismic design of bridge structure [31]. Negative stiffness devices (NSD) and dampers are effective for both elastic and inelastic systems [32,33]. In addition, NSD can reduce the displacement of base isolation device and base acceleration response in building base isolation [34,35,36,37,38,39]. The improved adaptive negative stiffness device can reduce the structural displacement and acceleration response under strong earthquakes [40]. Wang et al. [41] used the dual advantages of inert more inert and negative stiffness to improve the energy dissipation capacity of the damper, which could improve the performance of the negative stiffness damper by increasing the inertness and negative stiffness. Many algorithms are used in the optimization design process. The reliability of the base isolation structure optimized by a genetic algorithm has been significantly improved [42]. In the Bayesian framework, a unified method is proposed to find the optimal design results by combining the prior information or uncertainty about the statistical model of the utility function describing the experimental objectives [43]. The tribal harmony search algorithm proposed, for the first time, a new algorithm based on the harmony search algorithm, which can solve those challenging optimization problems [44]. The H 2 norm theory introduces the system transfer function specification, which can quantify the performance of building structures and dampers and solve the optimal results [45]. Particle swarm optimization (PSO) algorithm can solve complex optimization problems without any assumption on the objective function [46]. The optimization of the control system is also affected by the nonlinearity of the control system structure [47]. The vortex-induced vibration energy harvester converts vibration into electrical energy through a piezoelectric generator and finds the optimal control input of the tuned mass actuator and the piezoelectric generator, which plays an important role in the field of nonlinear vibration energy harvesting [48].
In this paper, the negative stiffness device and the isolation system are coupled into a reduction-isolation control system, which mainly studies the vibration control of building structures under earthquake action. In this paper, the dynamic equation of the isolation control system is derived, and then the parameters are optimized by H 2 theory and Monte Carlo pattern search method. Finally, the vibration reduction mechanism of the negative stiffness on the building structure is revealed by numerical analysis.

2. System Model

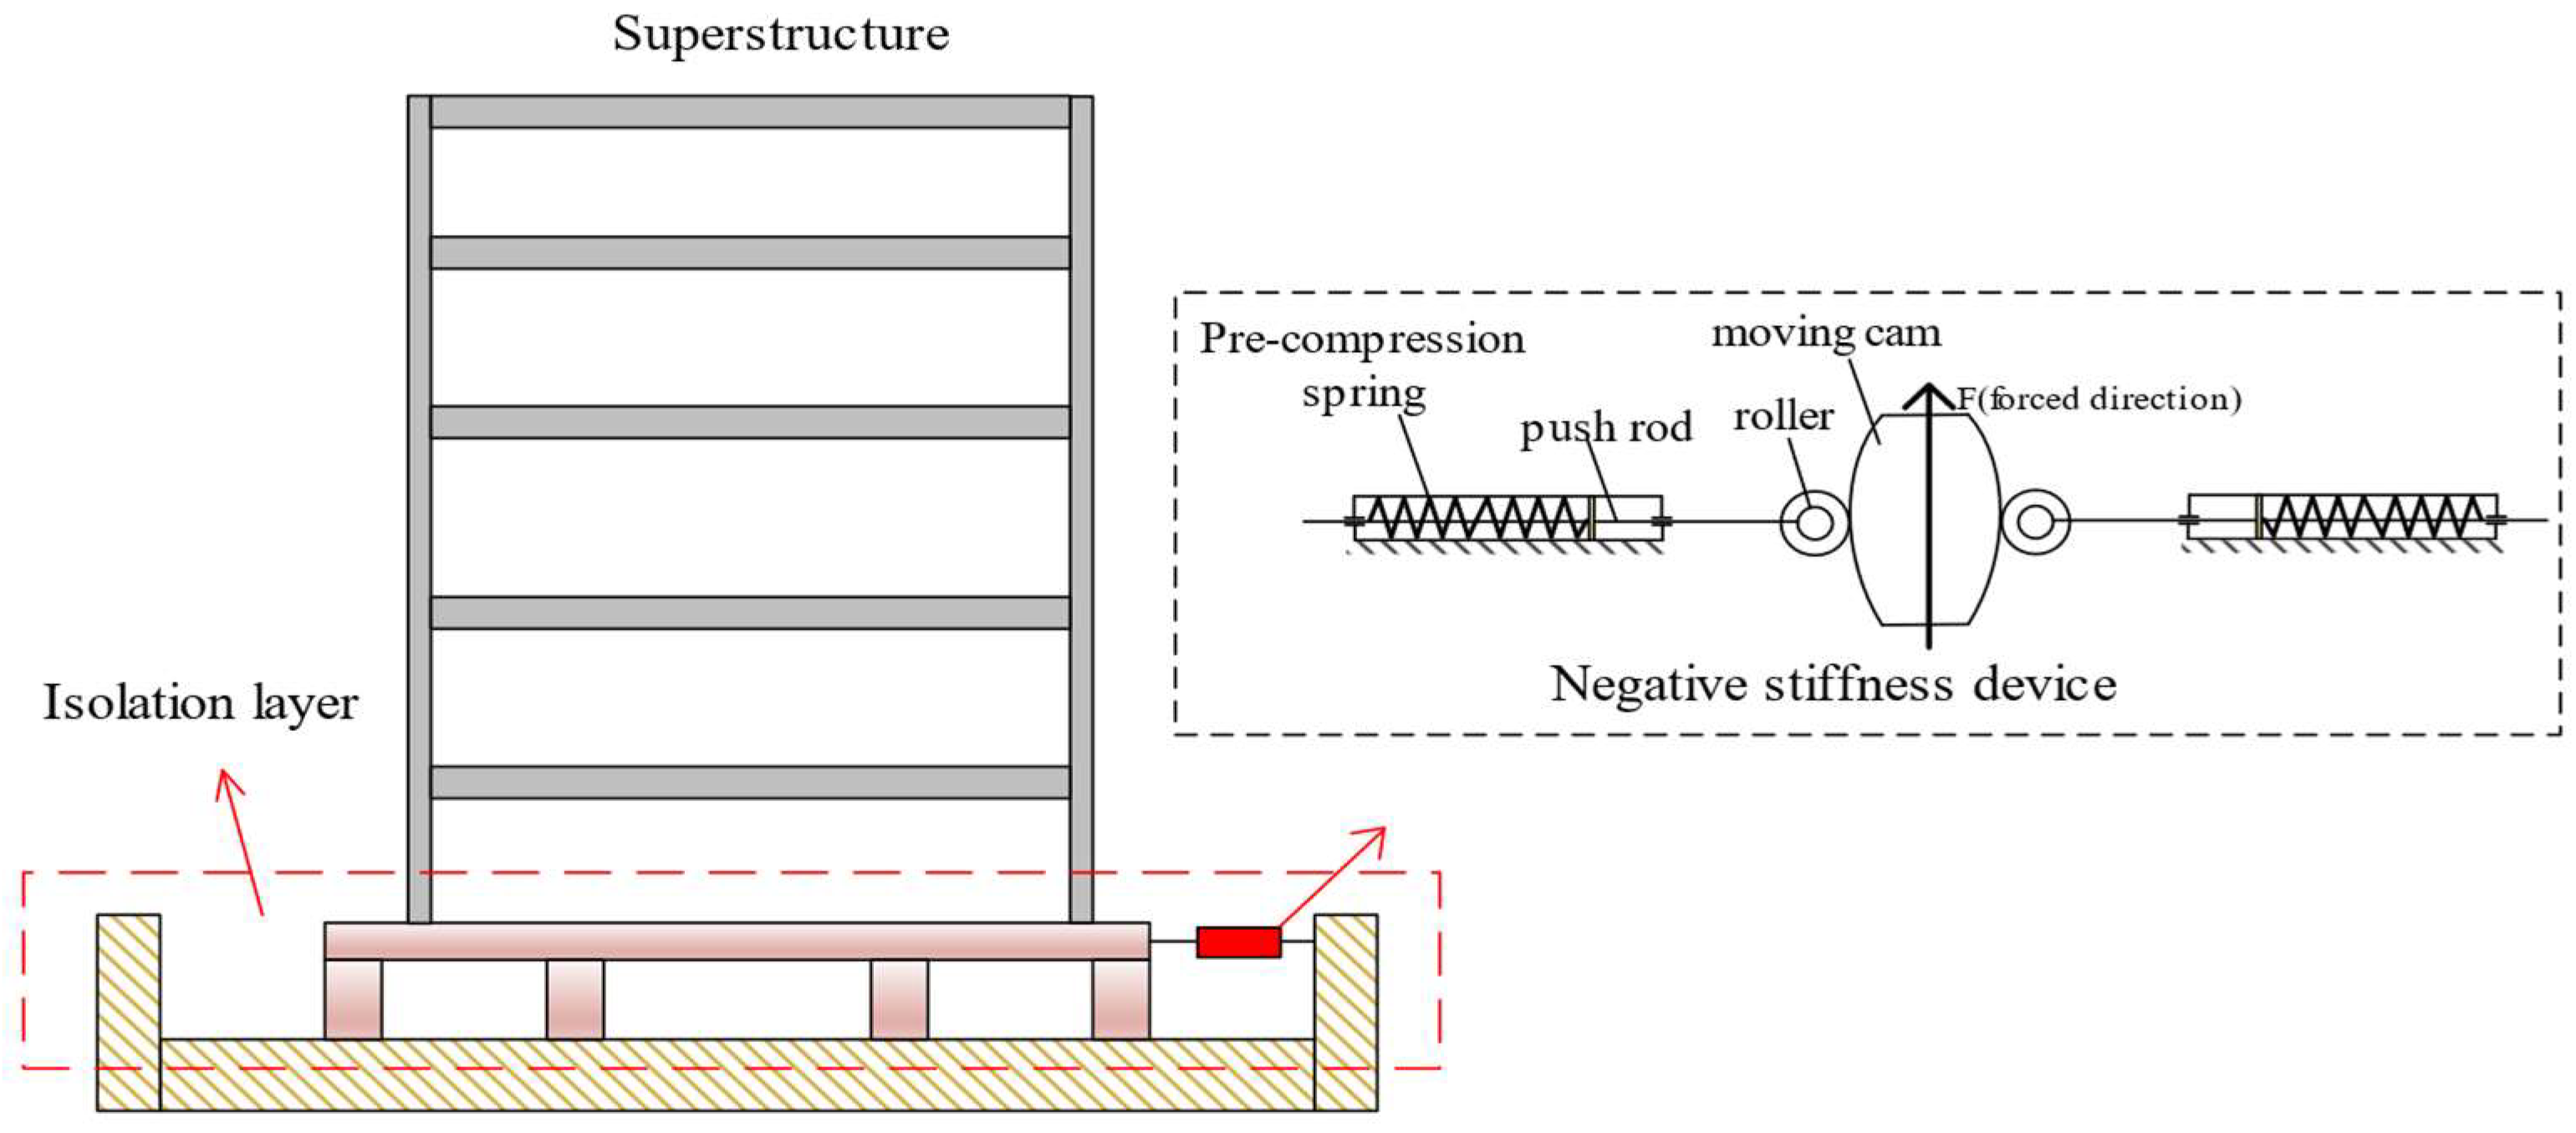
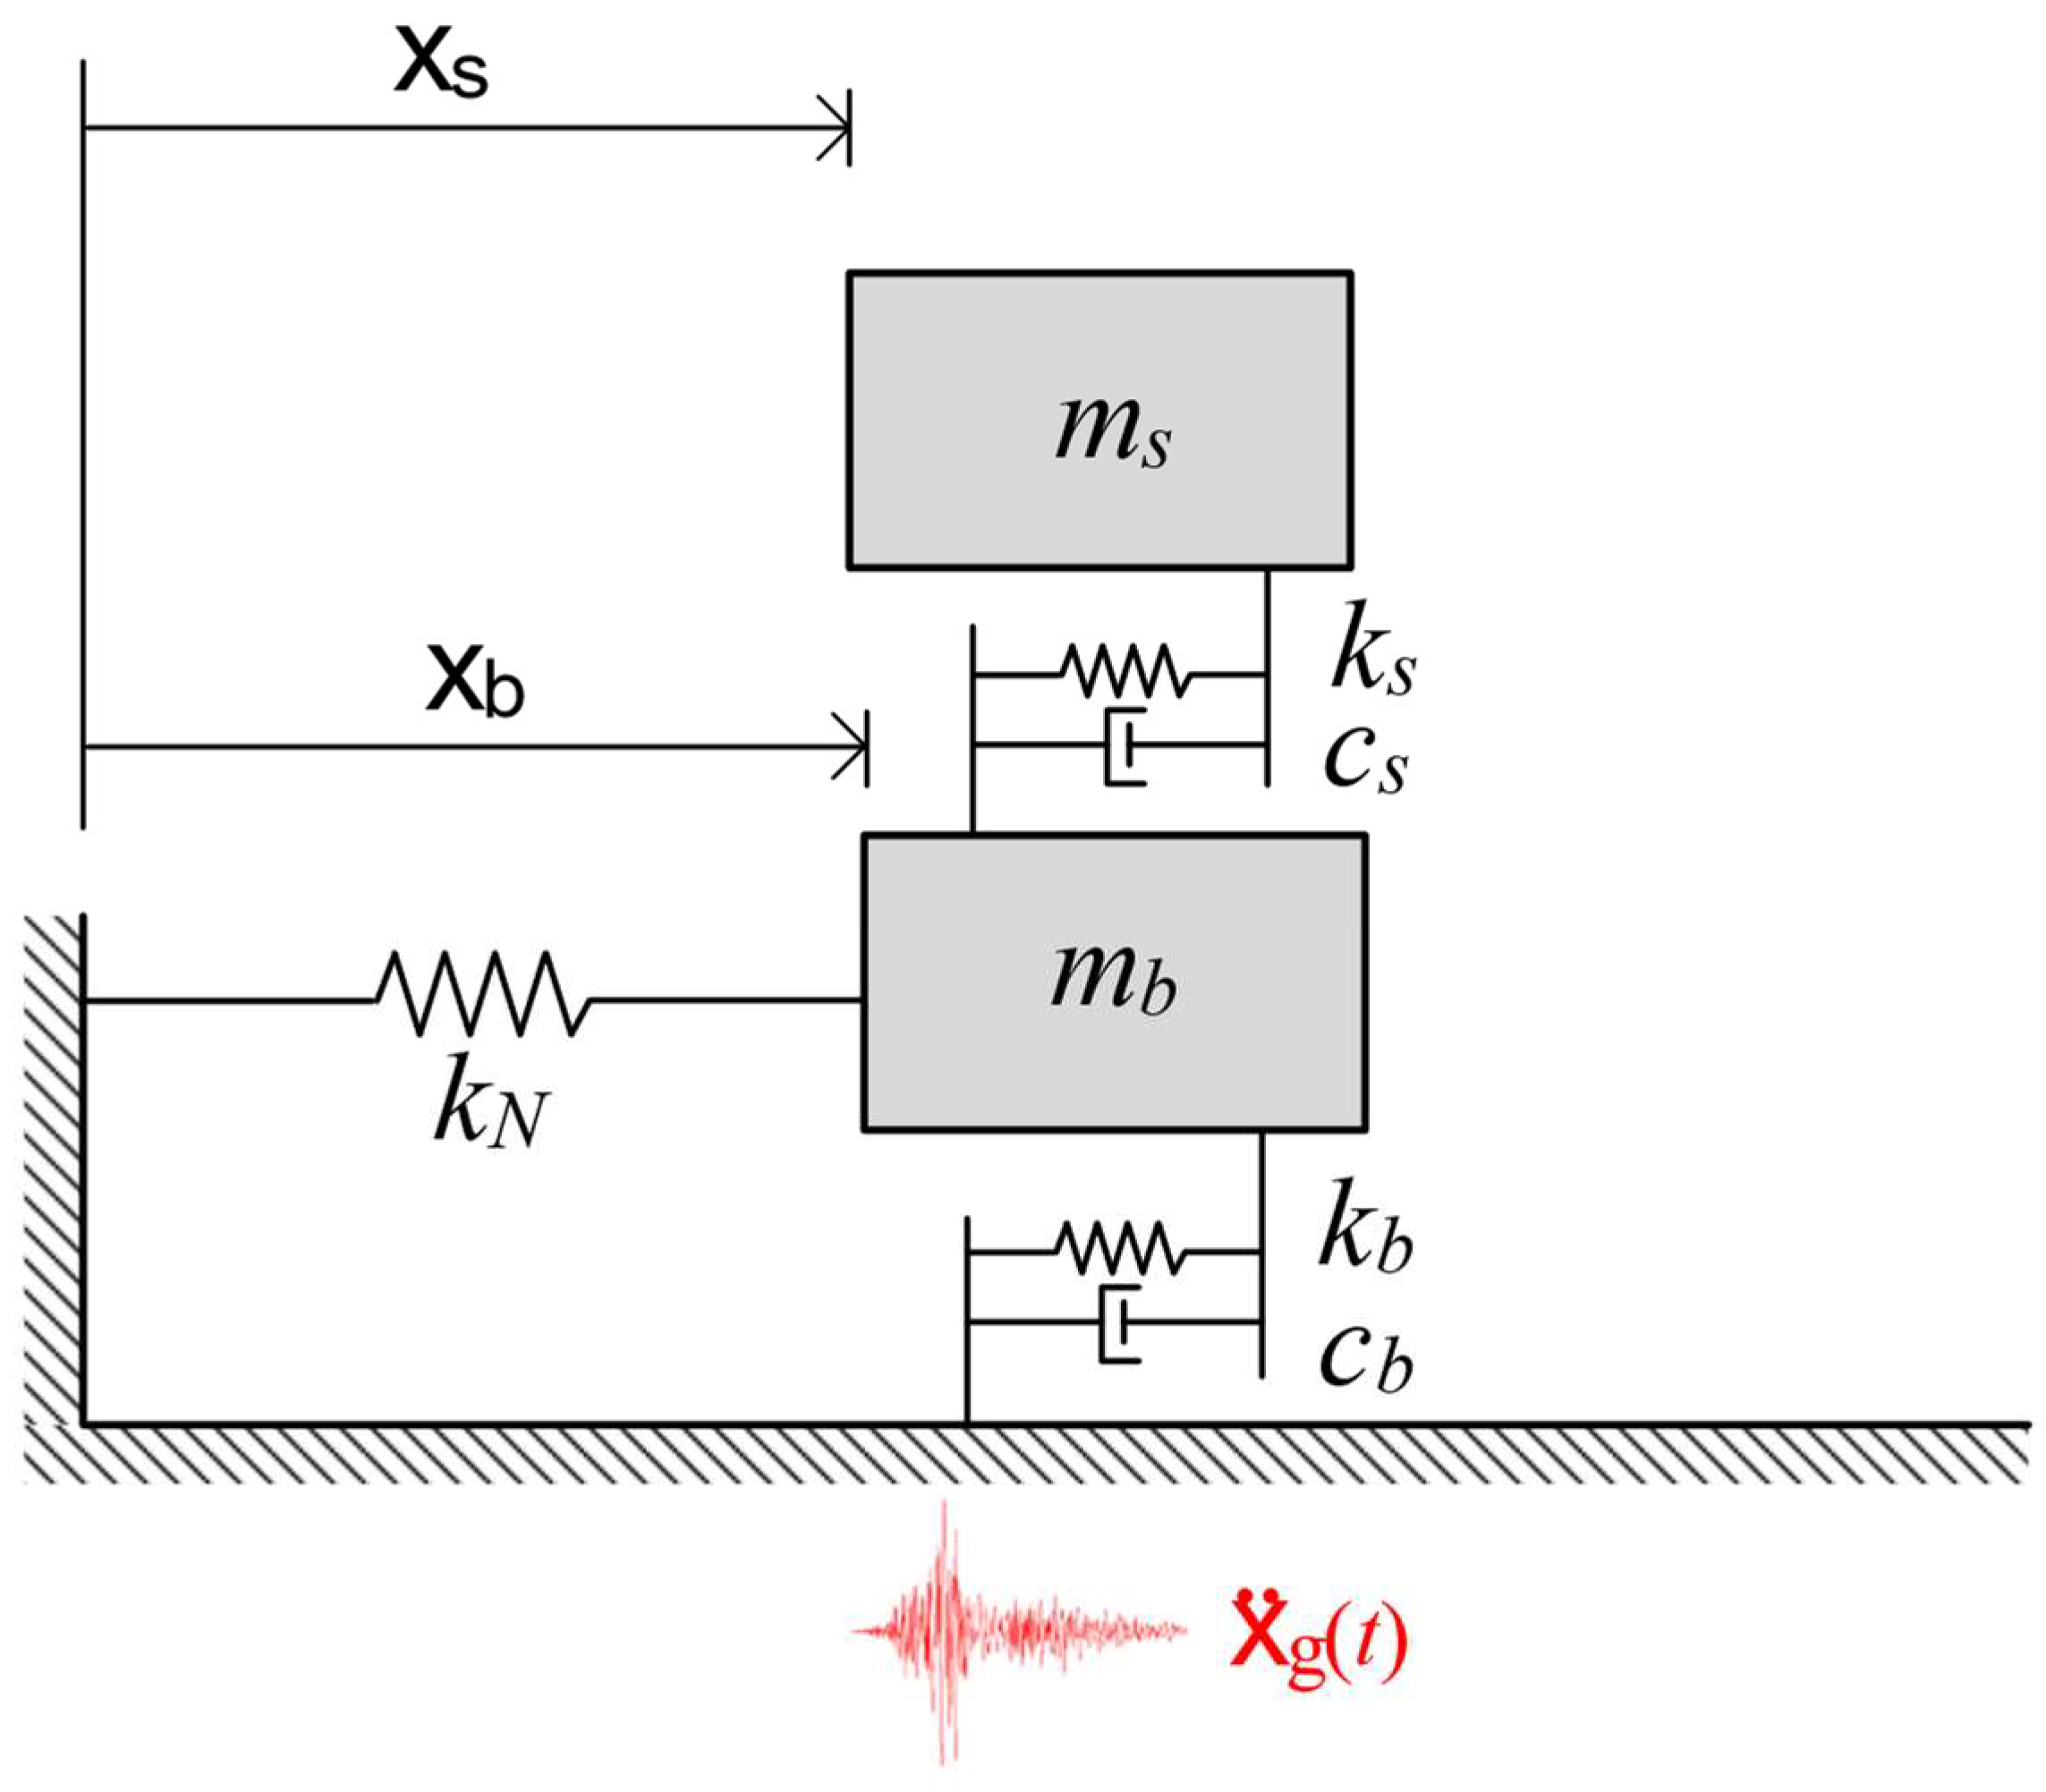
2.1. Coupled Negative Stiffness Isolation System

The seismic reduction–isolation system is a coupling system of the negative stiffness device and the base isolation layer (see in Figure 1). The seismic reduction–isolation system can reduce the stiffness of the whole building structure and exert the ability of vibration reduction on the basis of isolation. In Figure 1, the negative stiffness device consists of a roller that can be moved up and down and a pre-compressed spring, push rod and roller set symmetrically left and right. When the roller vibrates up and down, the pre-compression spring will push the horizontal movement of the push rod to generate a negative stiffness force. By designing the cam profile curve, linear negative stiffness characteristics can be achieved. When the vibration displacement of the building structure exceeds the threshold value, the negative stiffness device can play the role of reducing the stiffness of the control system. The negative stiffness device can reduce the vibration response of a building structure under earthquake excitation.
For ease of calculation, the model in Figure 1 is simplified to the model shown in Figure 2. The superstructure of the model can be simplified as a single degree of freedom force model with mass m s , stiffness k s , damping c s and relative ground displacement x s . This simplification is based on the vibration of the multi-degree-of-freedom (MDOFs) structural system, which can be approximately reduced to the main base mode vibration [49]. The base isolation layer can be simplified as a force model with mass m b , stiffness k b and damping c b relative to ground displacement x b . The stiffness of the negative stiffness element of the isolation system is k N and the ground acceleration is x ¨ g t (see in Figure 2).
When the value of k N is 0, the vibration control system of the building structure, as shown in Figure 2, becomes a traditional isolation system. When k N < 0 , the vibration control system of the building structure, as shown in Figure 2, changes into a seismic reduction–isolation system based on negative stiffness.

2.2. Theory of Calculation

The dynamic equation of the seismic reduction–isolation system can be expressed as:
M x ¨ t + C x ˙ t + K x t = M Γ x ¨ g t
where M , C and K are the mass matrix, damping matrix and stiffness matrix of the system, respectively. Γ = 1 , 1 T is the influence vector. x = x s , x b T is the vector of displacement. The M , C and K matrices can be expressed as:
M = m s 0 0 m b ; C = c s c s c s c s + c b ;   K = k s k s k s k s + k b + k N
to simplify the calculation, the following dimensionless parameters are defined:
μ = m s m b ;   ω s = k s m s ;   ω b = k b m b ;   ξ s = c s 2 k s m s ;   ξ b = c b 2 k b m b θ = k N k s ;   f = ω b ω s ;   λ = ω ω s
where μ is the mass ratio; ω s is the frequency ratio of superstructure; ω b is the mass ratio of base isolation structure; ξ s is the damping ratio of base isolation structure; ξ b is the damping ratio of base isolation structure; θ is the ratio of negative stiffness and superstructure stiffness; f is the ratio of superstructure frequency to base isolation structure frequency and λ is the ratio of seismic excitation frequency ω to superstructure frequency.
The control principle of the seismic isolation system of the building structure is to protect the superstructure by reducing the vibration and dissipating the kinetic energy caused by the ground motion. The smaller relative motion (interlayer displacement) between the superstructure and the foundation ensures that the superstructure is subjected to lower horizontal vibration, so it is safer. The relative motion between the superstructure and foundation is the focus of this paper. In addition, the displacement of the superstructure relative to the ground is also studied. Therefore, the transfer function for the above two cases is as follows:
H i λ 1 = X s x ¨ g t / ω s 2
H i λ 2 = X s X b x ¨ g t / ω s 2
where i is an imaginary number, i = 1 . X s and X b are the unknowns of x s and x b obtained by Laplace transform.

2.3. System Stability

A negative stiffness device is installed in the building structure seismic isolation system. Due to the instability of negative stiffness, in order to ensure the overall stability of the isolation system, it is necessary to ensure that the total stiffness of the system is greater than 0. The total stiffness of the system can be expressed as:
K s u m = k s k b + k N k s + k b + k N
and
K s u m > 0
Substituting Equation (3) into Equation (6) and Equation (7), we can obtain
f 2 + θ μ f 2 + μ 1 + θ > 0
By solving the inequality in Equation (8), the conditions that the negative stiffness parameters need to satisfy are
f 2 μ < θ < 0

3. H 2 Optimal Design and Results

Frequency domain analysis is a classical method to study control systems. In this section, the H 2 norm criterion is used to solve Equations (4) and (5). The frequency domain characteristics of the building structure isolation system can be obtained, and the influence of the negative stiffness parameter θ on the vibration control performance of the system can be revealed.

3.1. Relative Displacement of Superstructure Based on H 2 Norm Criterion

Substituting Equation (2) into Equation (1), the equation can be obtained as
m s 0 0 m b x ¨ s x ¨ b + c s c s c s c s + c b x ˙ s x ˙ b + k s k s k s k s + k b + k N x s x b = m s 0 0 m b 1 1 x ¨ g t
Assume that the form of the solution of Equation (10) is as follows
x s = X s e i ω t ;   x ˙ s = i ω X s e i ω t ;   x ¨ s = ω 2 X s e i ω t
x b = X b e i ω t ;   x ˙ b = i ω X b e i ω t ;   x ¨ b = ω 2 X b e i ω t
By substituting Equations (3), (11) and (12) into Equation (10), the stable state equation of the system is obtained
X s ω s 2 + 2 ξ s ω s i ω ω 2 X b ω s 2 + 2 ξ s ω s i ω = x ¨ g X b μ ω s 2 + θ ω s 2 μ + ω b 2 + 2 ξ s ω s μ i ω + 2 ξ b ω b i ω ω 2 X s μ ω s 2 + 2 ξ s ω s μ i ω = x ¨ g
By solving Equation (13) and substituting it into Equation (4), we can obtain
H i λ 1 = X s x ¨ g t / ω s 2 = B 3 λ 3 + B 2 λ 2 + B 1 λ + B 0 A 4 λ 4 + A 3 λ 3 + A 2 λ 2 + A 1 λ + A 0
where
  • A 0 = f 2 + θ μ
  • A 1 = 2 f ξ b + 2 f 2 ξ s + 2 θ μ ξ s
  • A 2 = 1 + f 2 + μ + θ μ + 4 f ξ b ξ s
  • A 3 = 2 f ξ b + 2 1 + μ ξ s
  • A 4 = 1
  • B 0 = 1 + f 2 + μ + θ μ
  • B 1 = 2 f ξ b + ξ s + μ ξ s
  • B 2 = 1
  • B 3 = 0
Because the frequency ratio f and the negative stiffness ratio θ have influence on the vibration reduction performance of building structure isolation system, we need to find the optimal value of the frequency ratio f and negative stiffness ratio θ . The optimal values of the two design parameters f and θ are obtained by minimizing the H 2 norm performance index. The minimization of the H 2 norm performance indicator is essentially equivalent to the minimization of the RMS value of the system output under the white noise input. The H 2 norm performance index of the system can be defined as
P I 1 = 1 2 π H i λ 1 2 d λ
where H i λ 1 is the amplitude of the frequency response function. The integral operation processes in Equation (14) can be seen in Appendix A. After calculation, the H 2 norm performance index can be obtained as follows
P I 1 = T 1 V 1
where
  • T 1 = 2 f 2 + θ μ f ξ b + f 2 ξ s + θ μ ξ s 4 f 2 + θ μ f ξ b + ξ s + μ ξ s 1 f 2 μ θ μ + 2 f ξ b + ξ s + μ ξ s 2 + 2 1 + f 2 + μ + θ μ 2 f ξ b + f 2 ξ s + θ μ ξ s ( f ξ b + ξ s + μ ξ s ) ( 1 + f 2 + μ + θ μ + 4 f ξ b ξ s )
  • V 1 = 4 f 2 + θ μ f 2 + θ μ ( f ξ b + ξ s + μ ξ s 2 + f ξ b + f 2 ξ s + θ μ ξ s 2 f ξ b + ξ s + μ ξ s ( f ξ b + f 2 ξ s + θ μ ξ s ) 1 + f 2 + μ + θ μ + 4 f ξ b ξ s
In order to obtain the optimal design parameters f and θ , the derivative of the performance index expression with respect to the target parameter needs to satisfy the following two conditions
P I 1 f = 0 ;             P I 1 θ = 0
By solving Equation (17), the optimal solutions of parameters f and θ ( f o p t and θ o p t ) can be obtained. However, in the process of solving Equation (17), it finds that Equation (17) is a binary system of higher-order equations, and the display expressions of f o p t and θ o p t cannot be obtained. Therefore, in this paper, Equation (17) is solved by the Monte Carlo pattern search method described in Section 3.3, and the optimal solutions of parameters f and θ can be obtained ( f o p t and θ o p t ).

3.2. Relative Displacement between Superstructure and Foundation

By solving Equation (13) and substituting it into Equation (5), we can obtain
H i λ 2 = X s X b x ¨ g t / ω s 2 = B 3 λ 3 + B 2 λ 2 + B 1 λ + B 0 A 4 λ 4 + A 3 λ 3 + A 2 λ 2 + A 1 λ + A 0
where
  • A 0 = f 2 + θ μ
  • A 1 = 2 f ξ b + 2 f 2 ξ s + 2 θ μ ξ s
  • A 2 = 1 + f 2 + μ + θ μ + 4 f ξ b ξ s
  • A 3 = 2 f ξ b + 2 1 + μ ξ s
  • A 4 = 1
  • B 0 = f 2 θ μ
  • B 1 = 2 f ξ b
  • B 2 = 0
  • B 3 = 0
The H 2 norm performance index can be calculated as
P I 2 = 1 2 π H i λ 2 2 d λ
By using the same method in Section 3.1, the integral of Equation (19) can be calculated as
P I 2 = T 2 V 2
where
  • T 2 = 4 f 2 ξ b 2 f ξ b + ξ s + μ ξ s + f 2 + θ μ f ξ b + f 2 ξ s + θ μ ξ s f ξ b + ξ s + μ ξ s ( 1 + f 2 + μ + θ μ + 4 f ξ b ξ s )
  • V 2 = 2 f 2 + θ μ f ξ b + ξ s + μ ξ s 2 + f ξ b + f 2 ξ s + θ μ ξ s 2 f ξ b + ξ s + μ ξ s ( f ξ b + f 2 ξ s + θ μ ξ s ) 1 + f 2 + μ + θ μ + 4 f ξ b ξ s
In order to obtain the optimal design parameters f and θ , the derivative of the performance index expression with respect to the target parameter needs to satisfy the following two conditions
P I 2 f = 0 ;             P I 2 θ = 0
It is difficult to solve the simultaneous Equation (21) to obtain the explicit expressions of f o p t and θ o p t . Therefore, the Monte Carlo pattern search method in Section 3.3 is used for computational analysis.

3.3. Optimization Based on H

Equations (17) and (21) are obtained based on the H 2 norm theory of system white noise input minimization, and another commonly used optimization method is H norm theory. When the building structure is subjected to harmonic excitation in all frequency ranges and wants to minimize the peak response, the H optimization criterion is usually considered to determine the design parameters [50,51,52,53]. When considering the optimization of the structural model, due to the complex expressions of the transfer functions (4) and (5), the solution of the optimal algebraic solution based on H is extremely cumbersome. Therefore, the numerical solution method is usually used in this case. Therefore, a set of assuming mass ratios is given for numerical optimization.
Considering the equation of motion (1) of the model, the objective function based on H norm theory is obtained:
minimize { J } subject   to   [ f θ ]   0 < f f u ,     θ u θ < 0
In (22), f u and θ u are the upper and lower bounds of f and θ , respectively, and J is defined as:
J = H ω Ω m a x i λ
where H i λ is the absolute value of the system transfer function. In the case of a given objective function, the model is numerically optimized by using MATLAB [54] numerical optimization solver fmincon.

3.4. Parameter Optimization Based on Monte Carlo Pattern Search Method

The mode search method is a direct optimization method. Compared with the derivative-based optimization method, its convergence speed is slower, but it does not calculate the partial derivative of the objective function, and the iteration is simpler. For the formula that we cannot easily find the partial derivative of the parameter, the pattern search method has great advantages. However, since the pattern search method can only search for the extreme points that are most related to the starting point, that is, local optimum, it is difficult to achieve a global optimum. The search results are directly related to the selection of the initial base point. In order to solve this shortcoming, this paper selects the Monte Carlo method to generate multiple base points and selects the optimal value in the optimization results.
The Monte Carlo method is essentially a numerical method to solve some dynamic problems by using probability theory through a large number of random sampling tests. In this paper, the Monte Carlo method is used to generate m different initial basis points in the global range, and the mode search method is optimized based on each basis point, and the optimal value is selected from the results. For the determination of the initial base point, the number of random initial points can be generated by setting the function in MATLAB [54]. The larger the value of m, the more accurate the results are. Here, we set m = 10,000.
Based on the objective function f (x1, x2, …, xn) with n variables, the optimization process of pattern search method is as follows [49]:
Step 1: given an initial value x(1), the unit search vector m1, m2, …mn, step size δ , acceleration coefficient α 1 , step size reduction rate β 0 , 1 , allowable error ε > 0 . Set y(1) = x(1), k = 1, j = 1, where the axial search vectors m1, m2, …mn have the following form:
P I 2 m 1 = ( 1 , 0 ,   , 0 ) 1 n m 2 = ( 0 , 1 ,   , 0 ) 1 n m n = ( 0 , 1 ,   , 0 ) 1 n
Step 2: if f(y(j) + δm(j)) < f(y(j)), then set y(j+1) = y(j) + δm(j), turn the fourth step; otherwise, turn to the third step;
Step 3: if f(y(j)δm(j)) < f(y(j)), then set y(j+1) = y(j)δm(j), otherwise, set y(j+1) = y(j), if j < n, then set j = j + 1, turn the second step;
Step 4: If (y(n+1)) < ((k)), then the fifth step; otherwise, take the sixth step;
Step 5: set x(k+1) = y(n+1), set y(1) = x(k+1) + α(x(k+1)x(k)), and then take the seventh step;
Step 6: if δε, then end the iteration and get (k); otherwise, set δ = βδ, y(1) =x(k), x(k+1) = x(k), take the seventh step;
Step 7: Set k = k + 1, j = 1 and go to the second step.
However, the Hooke–Jeeves search method also has its own shortcomings, it can only find the local optimal solution, it is difficult to achieve the global optimal solution of the function, the selection of initial basis points is closely linked with the search results. Generally combined with the optimization process of the Monte Carlo pattern search method, the optimization results obtained are not optimal, but they are also satisfactory quasi-optimal conditions.

3.4.1. H i λ 1

In this section, the relative displacement H i λ 1 of superstructure is solved and its parameters are analyzed. Firstly, the mass ratio μ is discussed. The frequency response function curves without negative stiffness and with negative stiffness are plotted for different mass ratios μ . Equation (9) gives the range of negative stiffness ratio θ . When the damping ratio of superstructure ξ s = 0.01 , the damping ratio of the base isolation layer ξ b = 0.02 and frequency ratio f = 0.8 , the frequency response function (see in Figure 3) of traditional isolation systems with mass ratios of μ = 0.5 , μ = 1 , μ = 2 , μ = 3 and μ = 4 (negative stiffness ratio θ = 0 ) and of building structures based on negative stiffness reduction and reduction–isolation system (negative stiffness ratio θ = 0.1 ) are plotted, respectively. In Figure 3, the solid line represents a negative stiffness-based reduction–isolation system for building structures (negative stiffness ratio θ = 0.1 ), while the dashed line represents a non-negative stiffness isolation system (negative stiffness ratio θ = 0 ). It can be seen from the curve trend in Figure 3 that when the mass ratio μ = 0.5 , the negative stiffness device can play a role in vibration control of the building structure. With the increase in mass ratio μ value, the vibration reduction effect of negative stiffness device is not good.
From Figure 4a, a curve of negative stiffness ratio θ and amplitude of transfer function can be obtained when the given mass ratio μ = 3 , damping ratio ξ s = 0.01 of superstructure, damping ratio ξ b = 0.02 of base isolation layer and frequency ratio f = 0.8 . When the negative stiffness ratio θ is smaller, the amplitude of the transfer function is larger, and the effect of the negative stiffness device is general. From Figure 4b, given mass ratio μ = 3 , damping ratio ξ s = 0.01 of superstructure, damping ratio ξ b = 0.02 of base isolation layer and negative stiffness ratio θ = 0.1 , a curve of frequency ratio f and amplitude of transfer function can also be obtained. When f 3 , the negative stiffness device can play a strong control role. When the frequency ratio f increases, the amplitude of the transfer function of the two isolation systems is significantly reduced regardless of the negative stiffness device. When f = 0.5 (negative stiffness ratio θ = 0 ), the value of displacement frequency response is 898.223. With the increase in frequency ratio f , the displacement frequency response values of f = 1 , f = 1.5 , f = 2 and f = 3 are reduced by 67.14%, 79.18%, 84.29% and 89.40%, respectively, compared with f = 0.5 . When f = 0.5 (negative stiffness ratio = 0.1 ), the displacement frequency response is 1406.26. When f = 1 , f = 1.5 , f = 2 and f = 3 , the values of displacement frequency response are reduced by 76.92%, 86.47%, 89.73% and 92.76%, respectively, compared with f = 0.5 . Therefore, the structural frequency design of the foundation isolation layer is appropriate, and the negative stiffness device can play a strong vibration control role on the superstructure of the building.

3.4.2. H i λ 2

In this section, the relative displacement H i λ 2 between the superstructure and the foundation isolation layer is solved and its parameters are analyzed. When the damping ratio of superstructure ξ s = 0.01 , the damping ratio of base isolation layer ξ b = 0.02 and frequency ratio f = 0.8 ,the frequency response function (see in Figure 5) of traditional isolation systems with mass ratios of μ = 3 , μ = 4 , μ = 5 and μ = 6 (negative stiffness ratio θ = 0 ) and of the seismic reduction-isolation system of building structure based on Negative Stiffness (negative stiffness ratio θ = 0.1 ) are plotted, respectively. It can be seen from Figure 5 that the amplitude of the transfer function of the traditional isolation system without negative stiffness increases approximately linearly with the increase of the mass ratio μ value. The increase in the amplitude of the transfer function is not beneficial to the isolation of high-rise buildings. However, the amplitude of the transfer function of the damping isolation system based on negative stiffness decreases linearly with the increase in the mass ratio μ value. When the mass ratio μ = 3 , the transfer function amplitude of the seismic reduction–isolation system based on negative stiffness is 30.93% less than that of the traditional isolation system without negative stiffness; When the mass ratio μ = 4 , the amplitude of the transfer function decreases by 42.35%; When the mass ratio μ = 5, the amplitude of the transfer function is reduced by 56.09%, and when the mass ratio μ = 6, the amplitude of the transfer function is reduced by 76.39%. The larger the mass ratio μ , the stronger the vibration controls effect of the negative stiffness device. Therefore, negative stiffness can play a role in vibration control of multi-storey or high-rise buildings.
Figure 6a,b can be obtained by parameter analysis of negative stiffness ratio θ and frequency ratio f . Curves of different negative stiffness ratios θ were plotted separately considering structural stability (see in Figure 6a). From Figure 6a, it can be concluded that the smaller the negative stiffness ratio θ , the smaller the amplitude of the transfer function and the stronger the vibration control ability. When negative stiffness ratio θ = 0.1 , the transfer function amplitude decreases by 31.68%, when negative stiffness ratio θ = 0.15 , the transfer function amplitude decreases by 50.33% and when negative stiffness ratio θ = 0.2 , the transfer function amplitude decreases by 78.49%. Therefore, the optimization results of negative stiffness ratio θ can be obtained from Figure 6a,
θ o p t = θ m i n ;       θ θ m i n   , 0    
where θ m i n is defined as the upper minimum that satisfies the stability condition of Equation (9).
It can be seen from Figure 6b that when the frequency ratio f increases, the vibration control ability of the negative stiffness device gradually weakens. When f = 0.5 , the vibration reduction effect reaches 60.29%; when f = 1 , the damping effect is 20.24%; when f = 1.5 , the damping effect is 7.47% and when f = 2 , the damping effect is reduced to 2.73%. When the frequency ratio f > 2 , the traditional isolation system without negative stiffness can better control the structural vibration. The optimal frequency ratio f o p t = 0.5 can be obtained by calculation. In addition, the increase in the frequency ratio f makes the transfer function amplitude of the two isolation systems in this paper increase first and then decrease.
In addition, this section draws the contours of the negative stiffness ratio θ and the frequency ratio f based on the method proposed in this paper and the H norm theory (see Figure 7a). In Figure 7, the solid black line is the dividing line, and the area above the dividing line is the parameter value that meets the stability condition of the building structure. Moreover, the optimal parameter ranges of the two optimization methods with mass ratios μ = 1 , μ = 2 , μ = 3 and μ = 4 are marked by black dots and blue triangles in Figure 7.
When μ = 1 , the optimal parameter values f o p t = 0.723 and θ o p t = 0.156 are obtained by the optimization method in this paper; the optimal parameter values f o p t = 0.722 and θ o p t = 0.157 are obtained by H norm theory. When μ = 2 , the optimal parameter values f o p t = 0.786 and θ o p t = 0.135 are obtained by the optimization method in this paper; the optimal parameter values f o p t = 0.785 and θ o p t = 0.136 are obtained by H norm theory. When μ = 3 , the optimal parameter values f o p t = 0.802 and θ o p t = 0.121 are obtained by the optimization method in this paper; the optimal parameter values f o p t = 0.796 and θ o p t = 0.122 are obtained by H norm theory. When μ = 4 , the optimal parameter values f o p t = 0.832 and θ o p t = 0.105 are obtained by the optimization method in this paper; the optimal parameter values f o p t = 0.830 and θ o p t = 0.107 are obtained by H norm theory. It can be seen from Figure 7 that the range of numerical solutions obtained by the two optimization methods is similar, so it is feasible to optimize by the method in this paper. Additionally, compared with the use of H norm theory optimization, the results obtained by the method in this paper are more intuitive and faster.
In addition, the three-dimensional frequency response diagrams at mass ratios μ = 1 , μ = 2 , μ = 3 and μ = 4 are plotted (see in Figure 8). From Figure 8, it can be found that the larger the mass ratio μ is, the more sensitive the displacement frequency response H i λ 2 is to the negative stiffness ratio θ , and the closer the negative stiffness ratio θ of the first trough of H i λ 2 is to 0. When the mass ratio μ = 3 and negative stiffness ratio θ are −0.1, H i λ 2 shows an obvious trough, and the optimum value of negative stiffness ratio θ can be confirmed.
The expression given by Equation (5) can prove the superiority of the reduction–isolation system based on the negative stiffness. It can be seen from Figure 9 that the increase of the damping ratio will only increase the energy dissipation capacity of the structure, and the combination of damping and negative stiffness device can better control the structural vibration. When ξ s = 0.01 , the vibration reduction ability of negative stiffness device is improved by 30.9%. When ξ s = 0.1 , the vibration reduction ability of negative stiffness device is improved by 12.27%. However, when ξ s 0.25 , negative stiffness devices play a moderate role. Therefore, in the case of μ = 3 , ξ b = 0.02 , f = 0.8 and θ = 0.1 , the applicable range of the damping ratio ξ s of the superstructure is 0 < ξ s < 0.25 . When the damping ratio of the lower base isolation layer ξ b is 0.01, the vibration reduction ability of the negative stiffness device is improved by 28.23%. When ξ b = 0.1 , the vibration reduction effect of negative stiffness device is strengthened, which can increase the vibration reduction ability of 33.84%. When ξ b = 0.25 and ξ b = 0.5 , the vibration reduction ability is increased by 31.68% and 20.46%, respectively. Therefore, ξ b = 0.1 is the optimal design value under the parameter conditions of μ = 3 , ξ s = 0.01 , f = 0.8 and θ = 0.1 . In this section, two other self-defined parameters, damping ratio of superstructure ξ s and damping ratio of base isolation layer ξ b , are analyzed, and the influence of different values of parameters θ and f on transfer function is discussed, respectively.

4. Verification in the Time Domain

In Section 3, the effectiveness of the negative stiffness device for the reduction–isolation system based on negative stiffness is analyzed from the perspective of frequency domain, and the optimal parameters are calculated by Monte Carlo-pattern search method. In this section, the feasibility and superiority of innovation point 1 will be verified by loading real seismic excitation.
First of all, this paper selects the four classical seismic waves ‘EL Centro‘ wave [55], ‘Chi-Chi‘ wave [56], ‘Imperial Valley‘ wave and ‘San Fernando‘ wave [57] (see in Figure 10) from the literature on time domain analysis. The four seismic waves selected according to the literature can effectively prove the reliability of the time domain analysis results. Secondly, the initial stiffness of the base isolation layer is k b , and the stiffness of the negative stiffness device is k N . When the displacement of the building structure caused by the earthquake exceeds the threshold value, the negative stiffness device begins to play the vibration control role, and the stiffness of the combined structure becomes K = k b k N . At this time, the stiffness of the foundation isolation layer begins to reduce, and the isolation effect under the lower isolation layer stiffness is realized. In addition, other parameters are set as mass ratio μ = 3 , negative stiffness ratio θ = 0.1 , frequency ratio f = 0.8 , damping ratio of superstructure ξ s = 0.01 and damping ratio of base isolation layer ξ b = 0.02 . The structure of the upper five floors of the building was simplified in MATLAB, the mass of superstructure m s = 17.691 × 10 4   kg , mass of the lower base isolation layer m b = 5.897 × 10 4   kg , damping ratio of superstructure c s = 1.122 × 10 5 kN · s / m , damping ratio of the lower base isolation layer c b = 6.72 × 10 4   kN × s / m , the stiffness of the superstructure k s = 17.81 × 10 7   kN / m , the stiffness of the lower foundation isolation layer k b = 4.81 × 10 7 kN / m and the stiffness of the negative stiffness device k N = 1.781 × 10 7   kN / m . The time history results of two isolation systems ( k N = 0   and   k N = 1.781 × 10 7   kN / m ) are obtained by analysis and calculation (see in Figure 11, Figure 12 and Figure 13). Table 1 lists the different peaks of displacement, relative displacement and superstructure acceleration response of the two isolation systems ( k N = 0   and   k N = 1.781 × 10 7   kN / m ) in this paper under different seismic excitation.
The black lines in Figure 11, Figure 12 and Figure 13 represent the response results of the reduction-isolation control system of the building structure based on the negative stiffness device, while the red lines represent the response results of the traditional isolation system without negative stiffness. Under the four kinds of seismic excitation, the relative displacement between the superstructure and the foundation isolation layer is obviously controlled, and the peak displacement is reduced. In the above three kinds of time history response results, the control effect of base isolation layer displacement is the most significant. In the whole process of loading seismic excitation, the base isolation layer displacement of the building structure seismic reduction–isolation control system based on negative stiffness is less than that of traditional seismic isolation system. In addition, the main function of the negative stiffness device is to control the stiffness of the structure, lengthen the natural vibration period of the structure, reduce the frequency of the structure and control the structure acceleration. It can be proved by Figure 13 that the negative stiffness device plays a role in reducing the structural stiffness and effectively controls the acceleration response of the superstructure. Moreover, through the peak results listed in Table 1, it can be found that the results of time history analysis are consistent with those of frequency domain analysis. In the “EL Centro “ wave, “ Imperial Valley “ wave and “San Fernando” wave, the building structure seismic reduction–isolation control system based on negative stiffness plays a good damping effect. The peak of foundation displacement, relative displacement and acceleration response have the most obvious control effect in the “EL Centro “ wave, and the reduction degree is 56.53%, 36% and 31.81%, respectively. However, in the “Chi-Chi “ wave, the negative stiffness has a general effect, but it has a better control effect on the displacement of the foundation. Through calculation and parameter analysis, it is proved that the negative stiffness has vibration control effect on the interlayer displacement of isolated building structure.

5. Conclusions

In this paper, the damping performance of the reduction-isolation control system for building structures based on negative stiffness is analyzed. Through H 2 norm criterion and Monte Carlo-pattern search method, it is concluded that negative stiffness can reduce the displacement frequency response amplitude of the isolation system and control the vibration of the building structure. In addition, by loading the real seismic excitation, it is verified that the negative stiffness can control the natural vibration period of the building structure. Thus, weakening the acceleration response of the building structure. After calculation and analysis in the above sections, the following conclusions are reached:
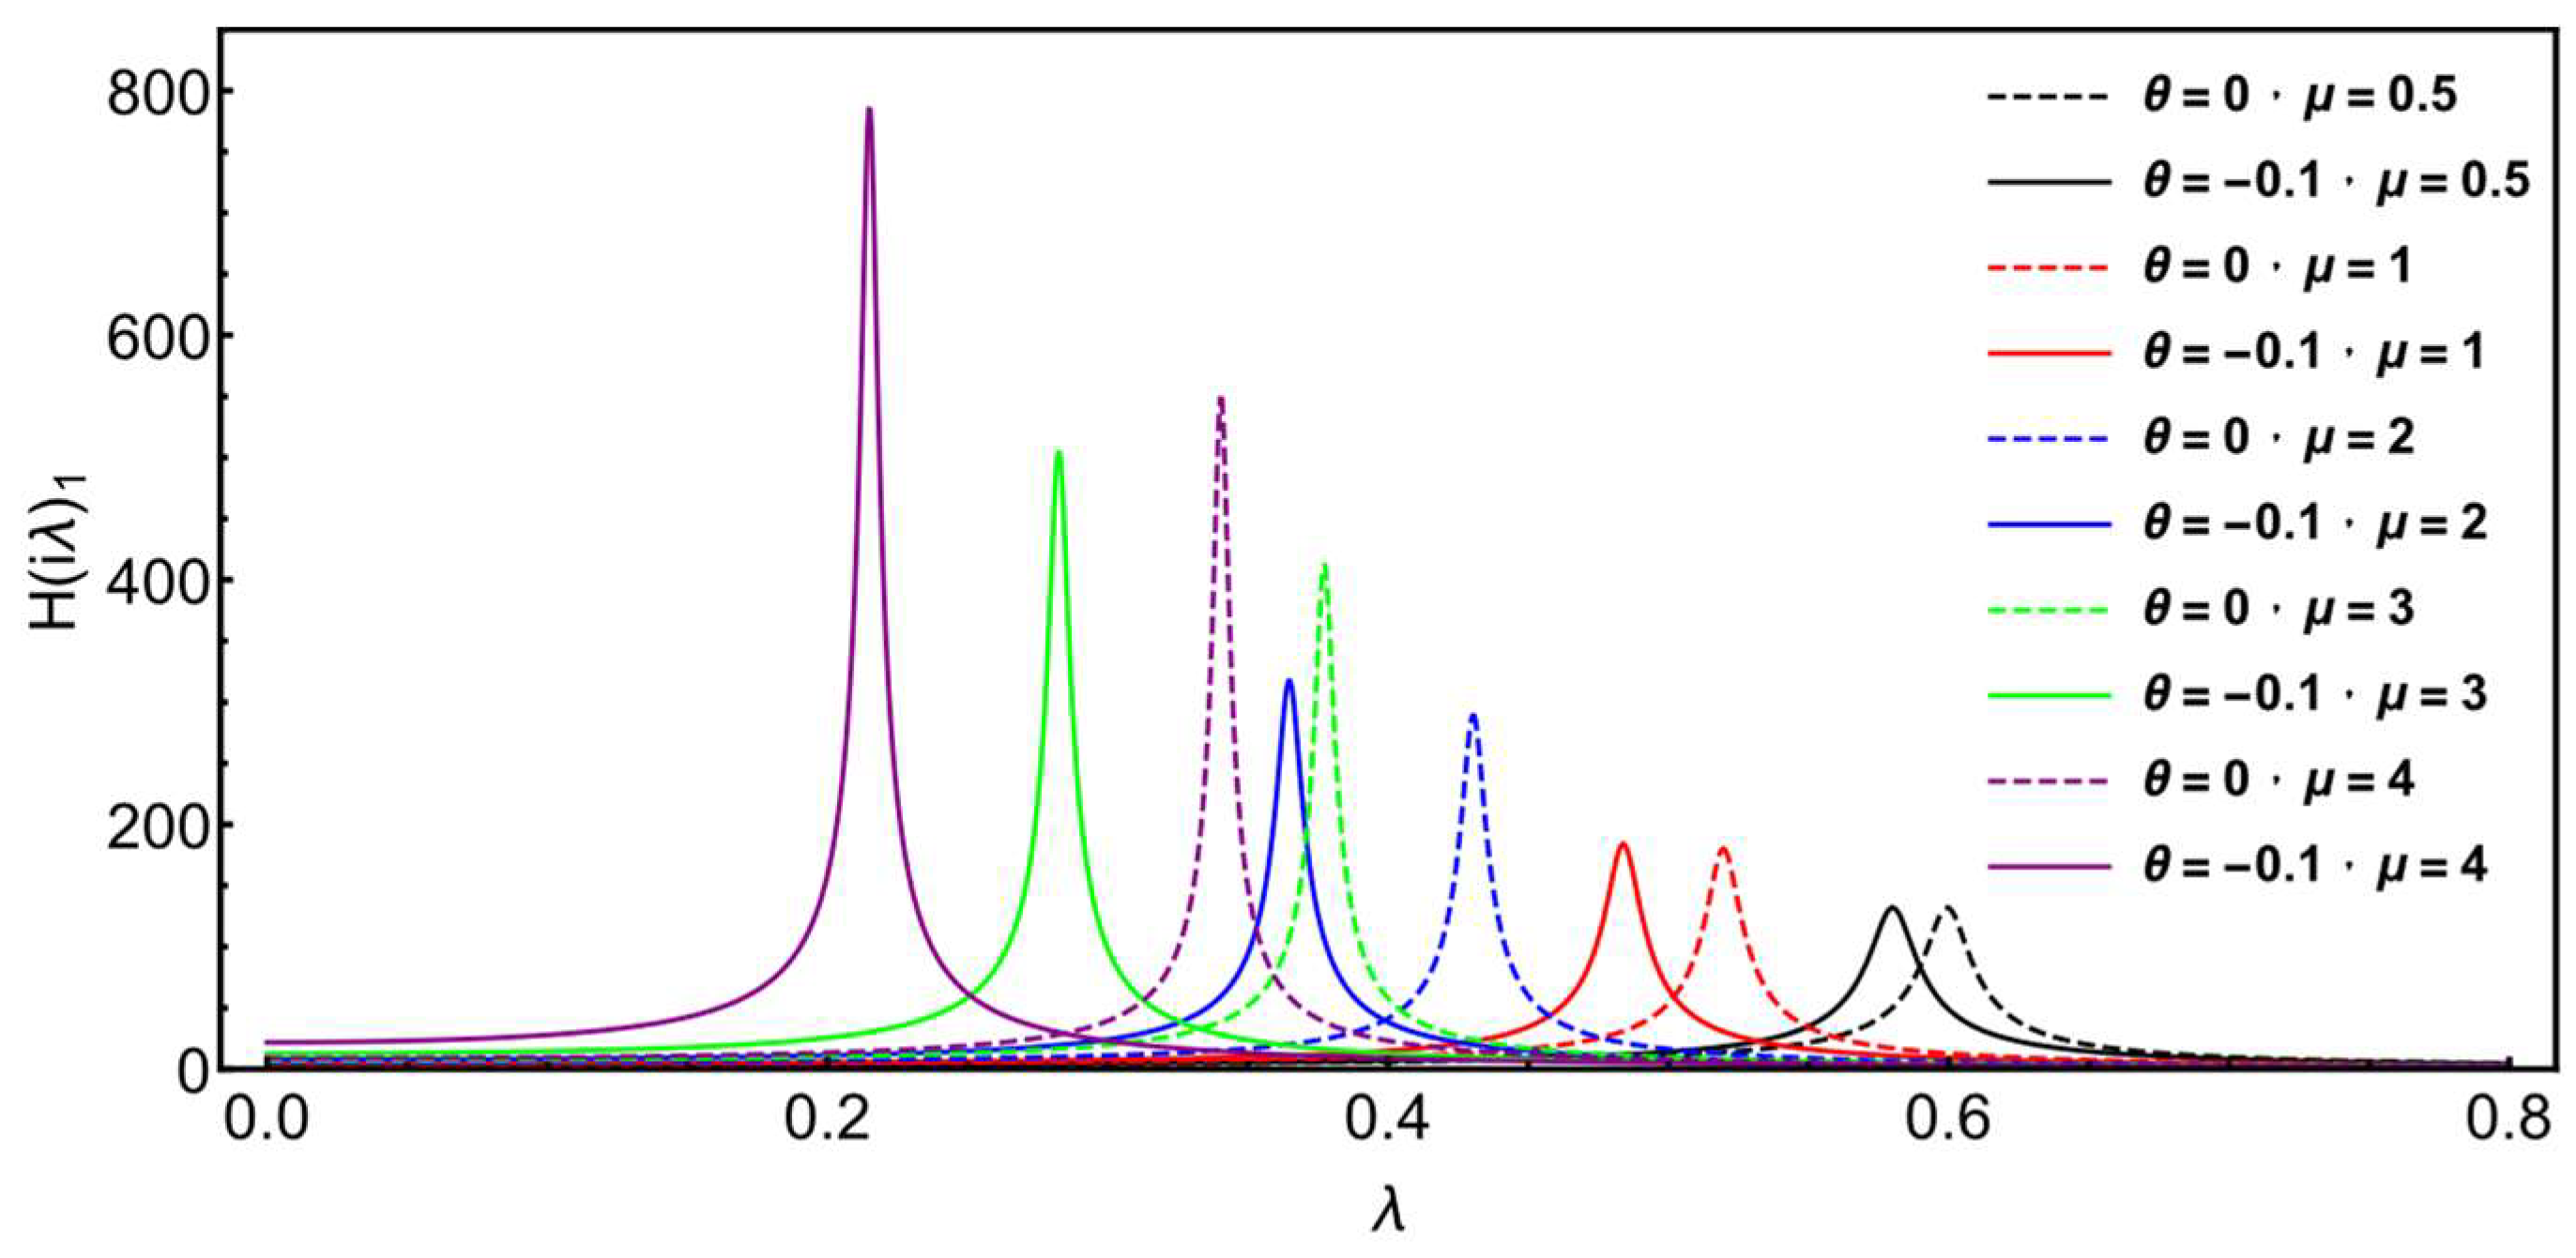
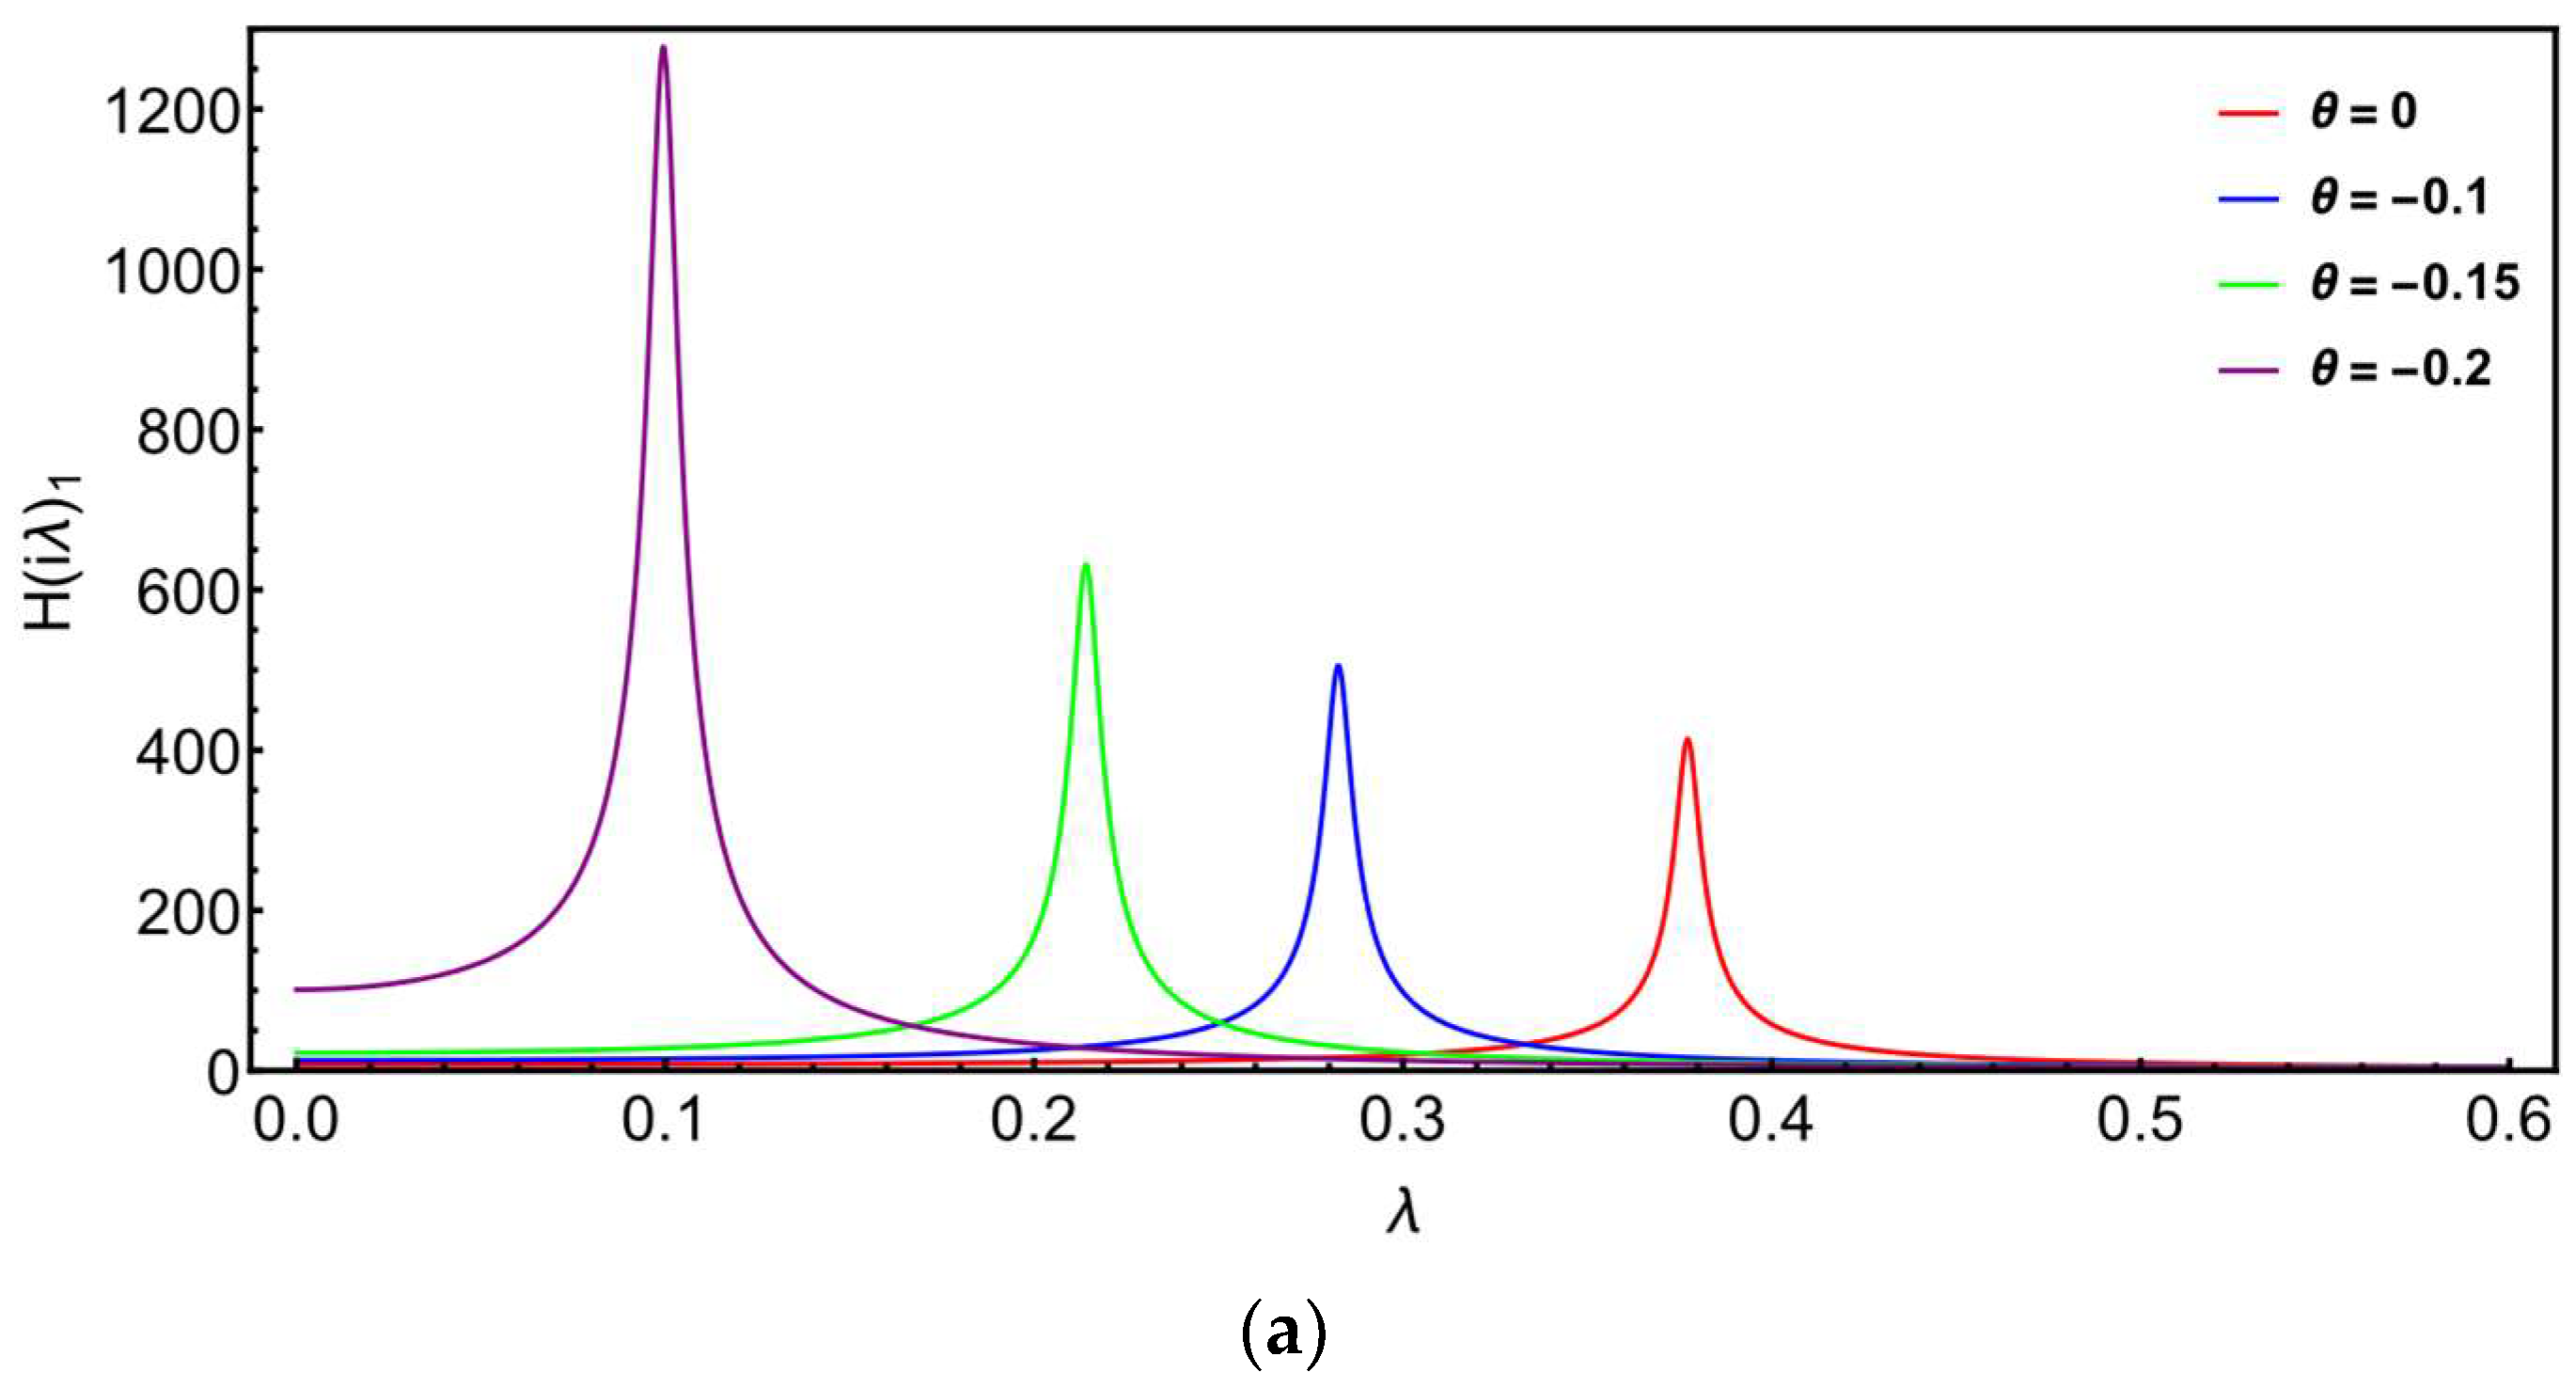
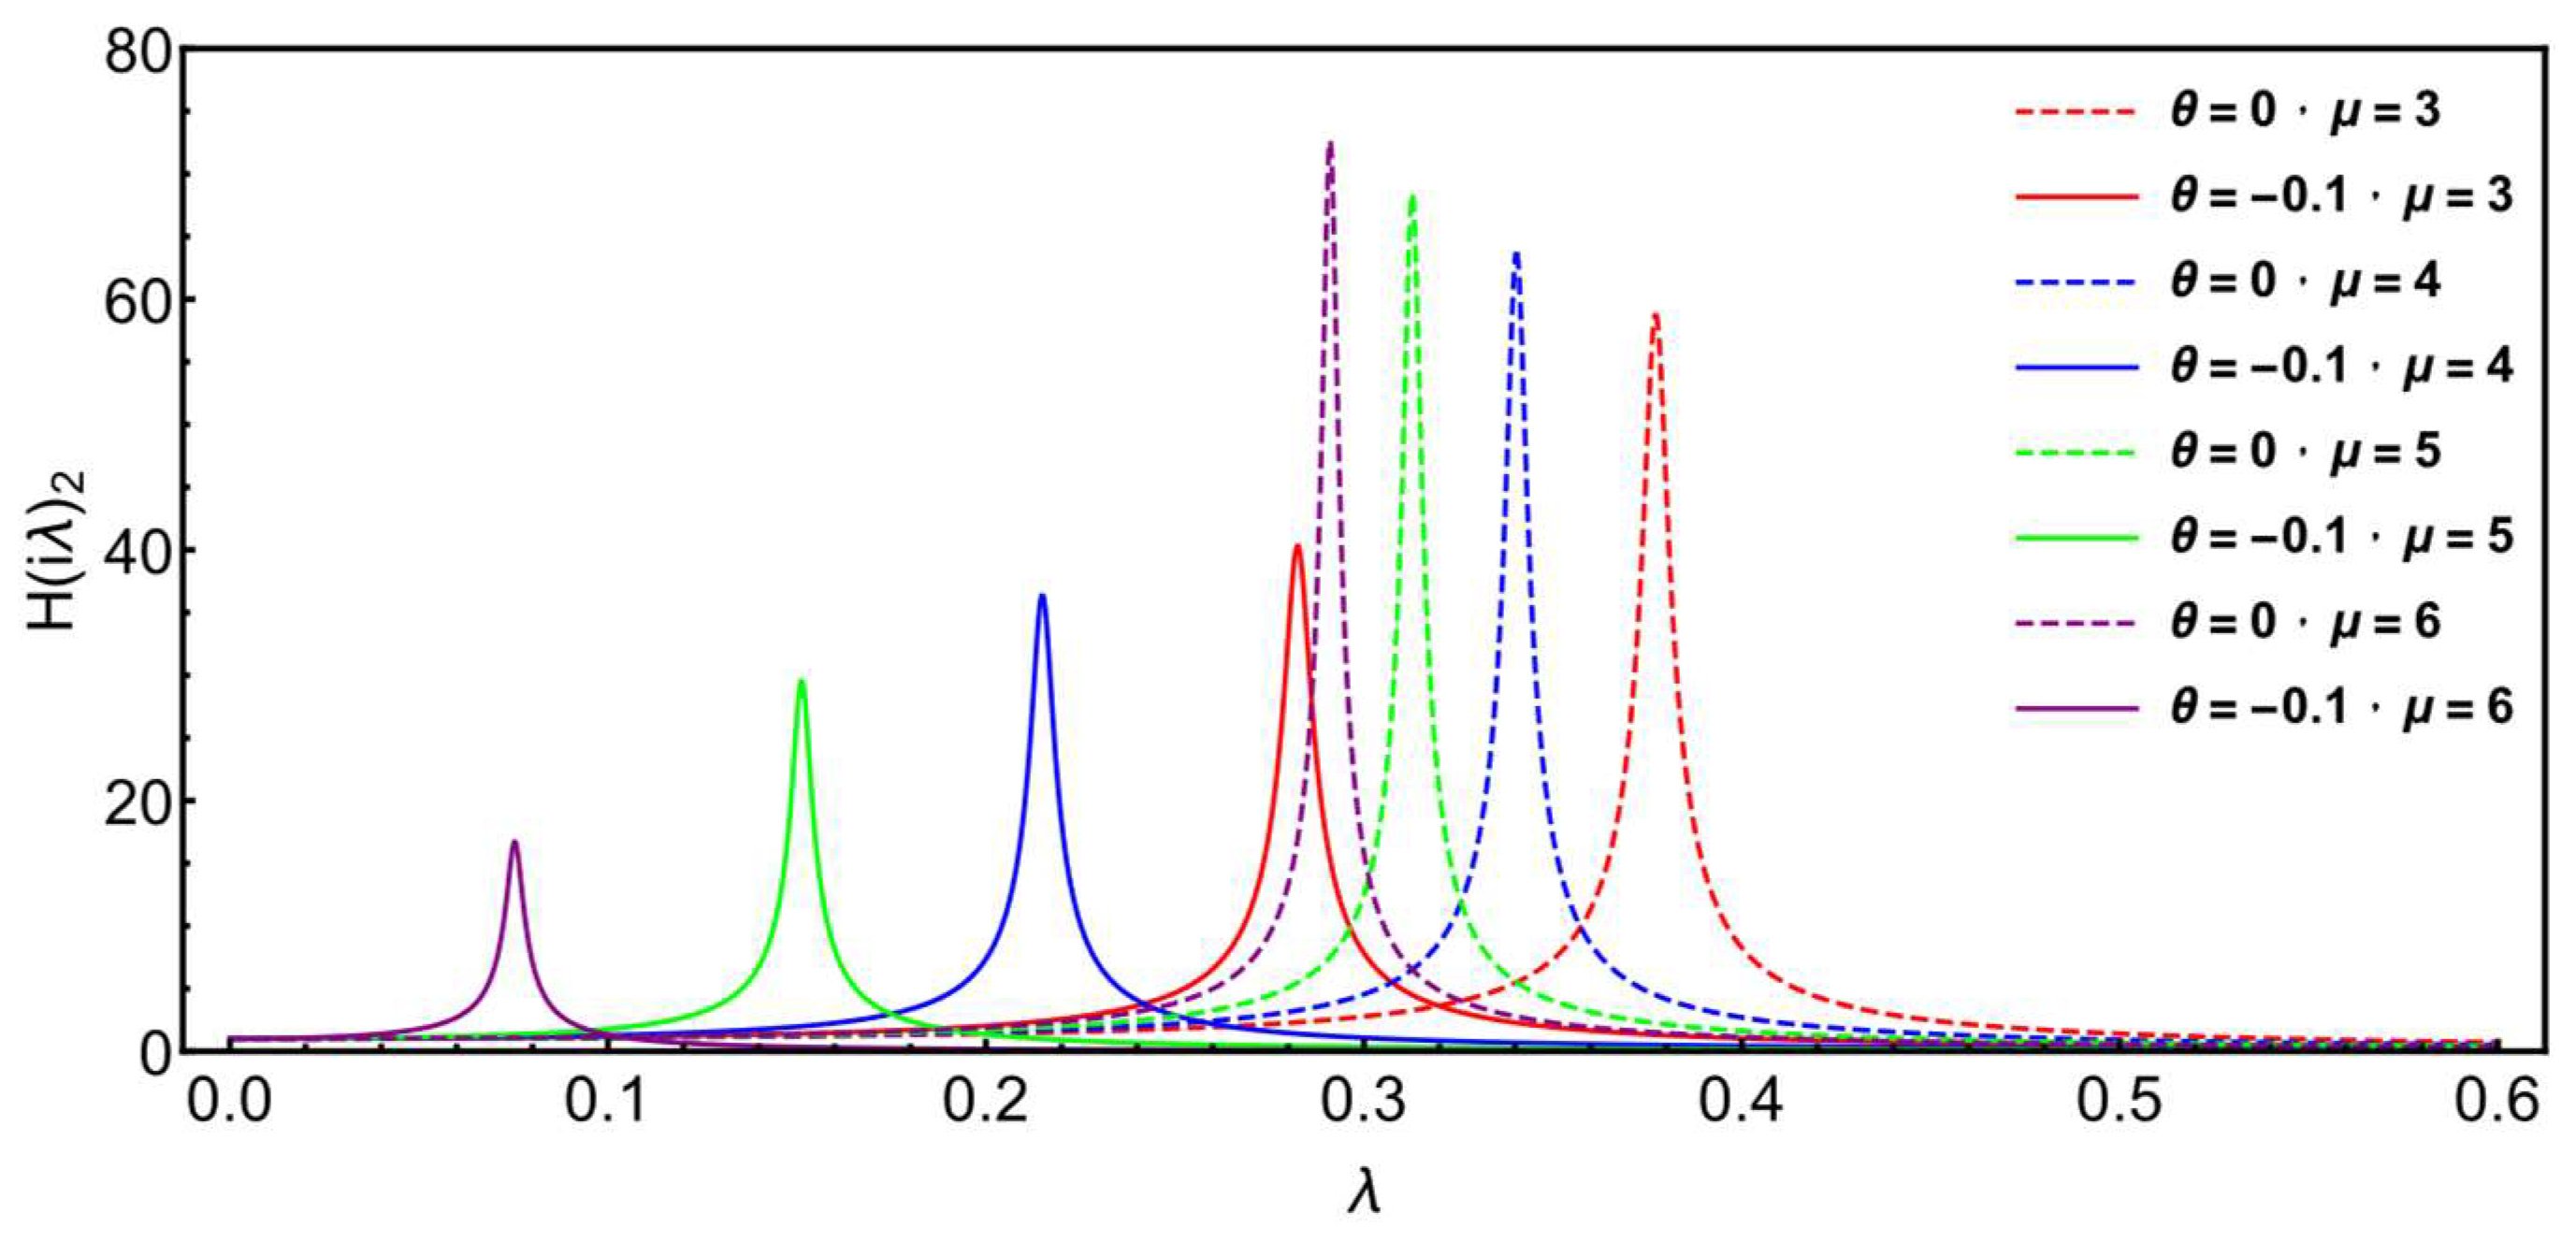
  • When the stability condition is satisfied and the mass ratio μ is given, the smaller the negative stiffness ratio θ is, the stronger the vibration control effect of the negative stiffness device is, and the optimal mass ratio θ o p t = θ m i n ;   Θ θ m i n   ,   0   .
  • Given other dimensionless parameters. The influence of the ratio of the frequency of the superstructure to the frequency of the base isolation layer f on the amplitude of the system frequency response function is: With the increase in frequency ratio f , the vibration control ability of the isolation system with negative stiffness is gradually weakened. However, negative stiffness can still play a role in vibration control of building structures.
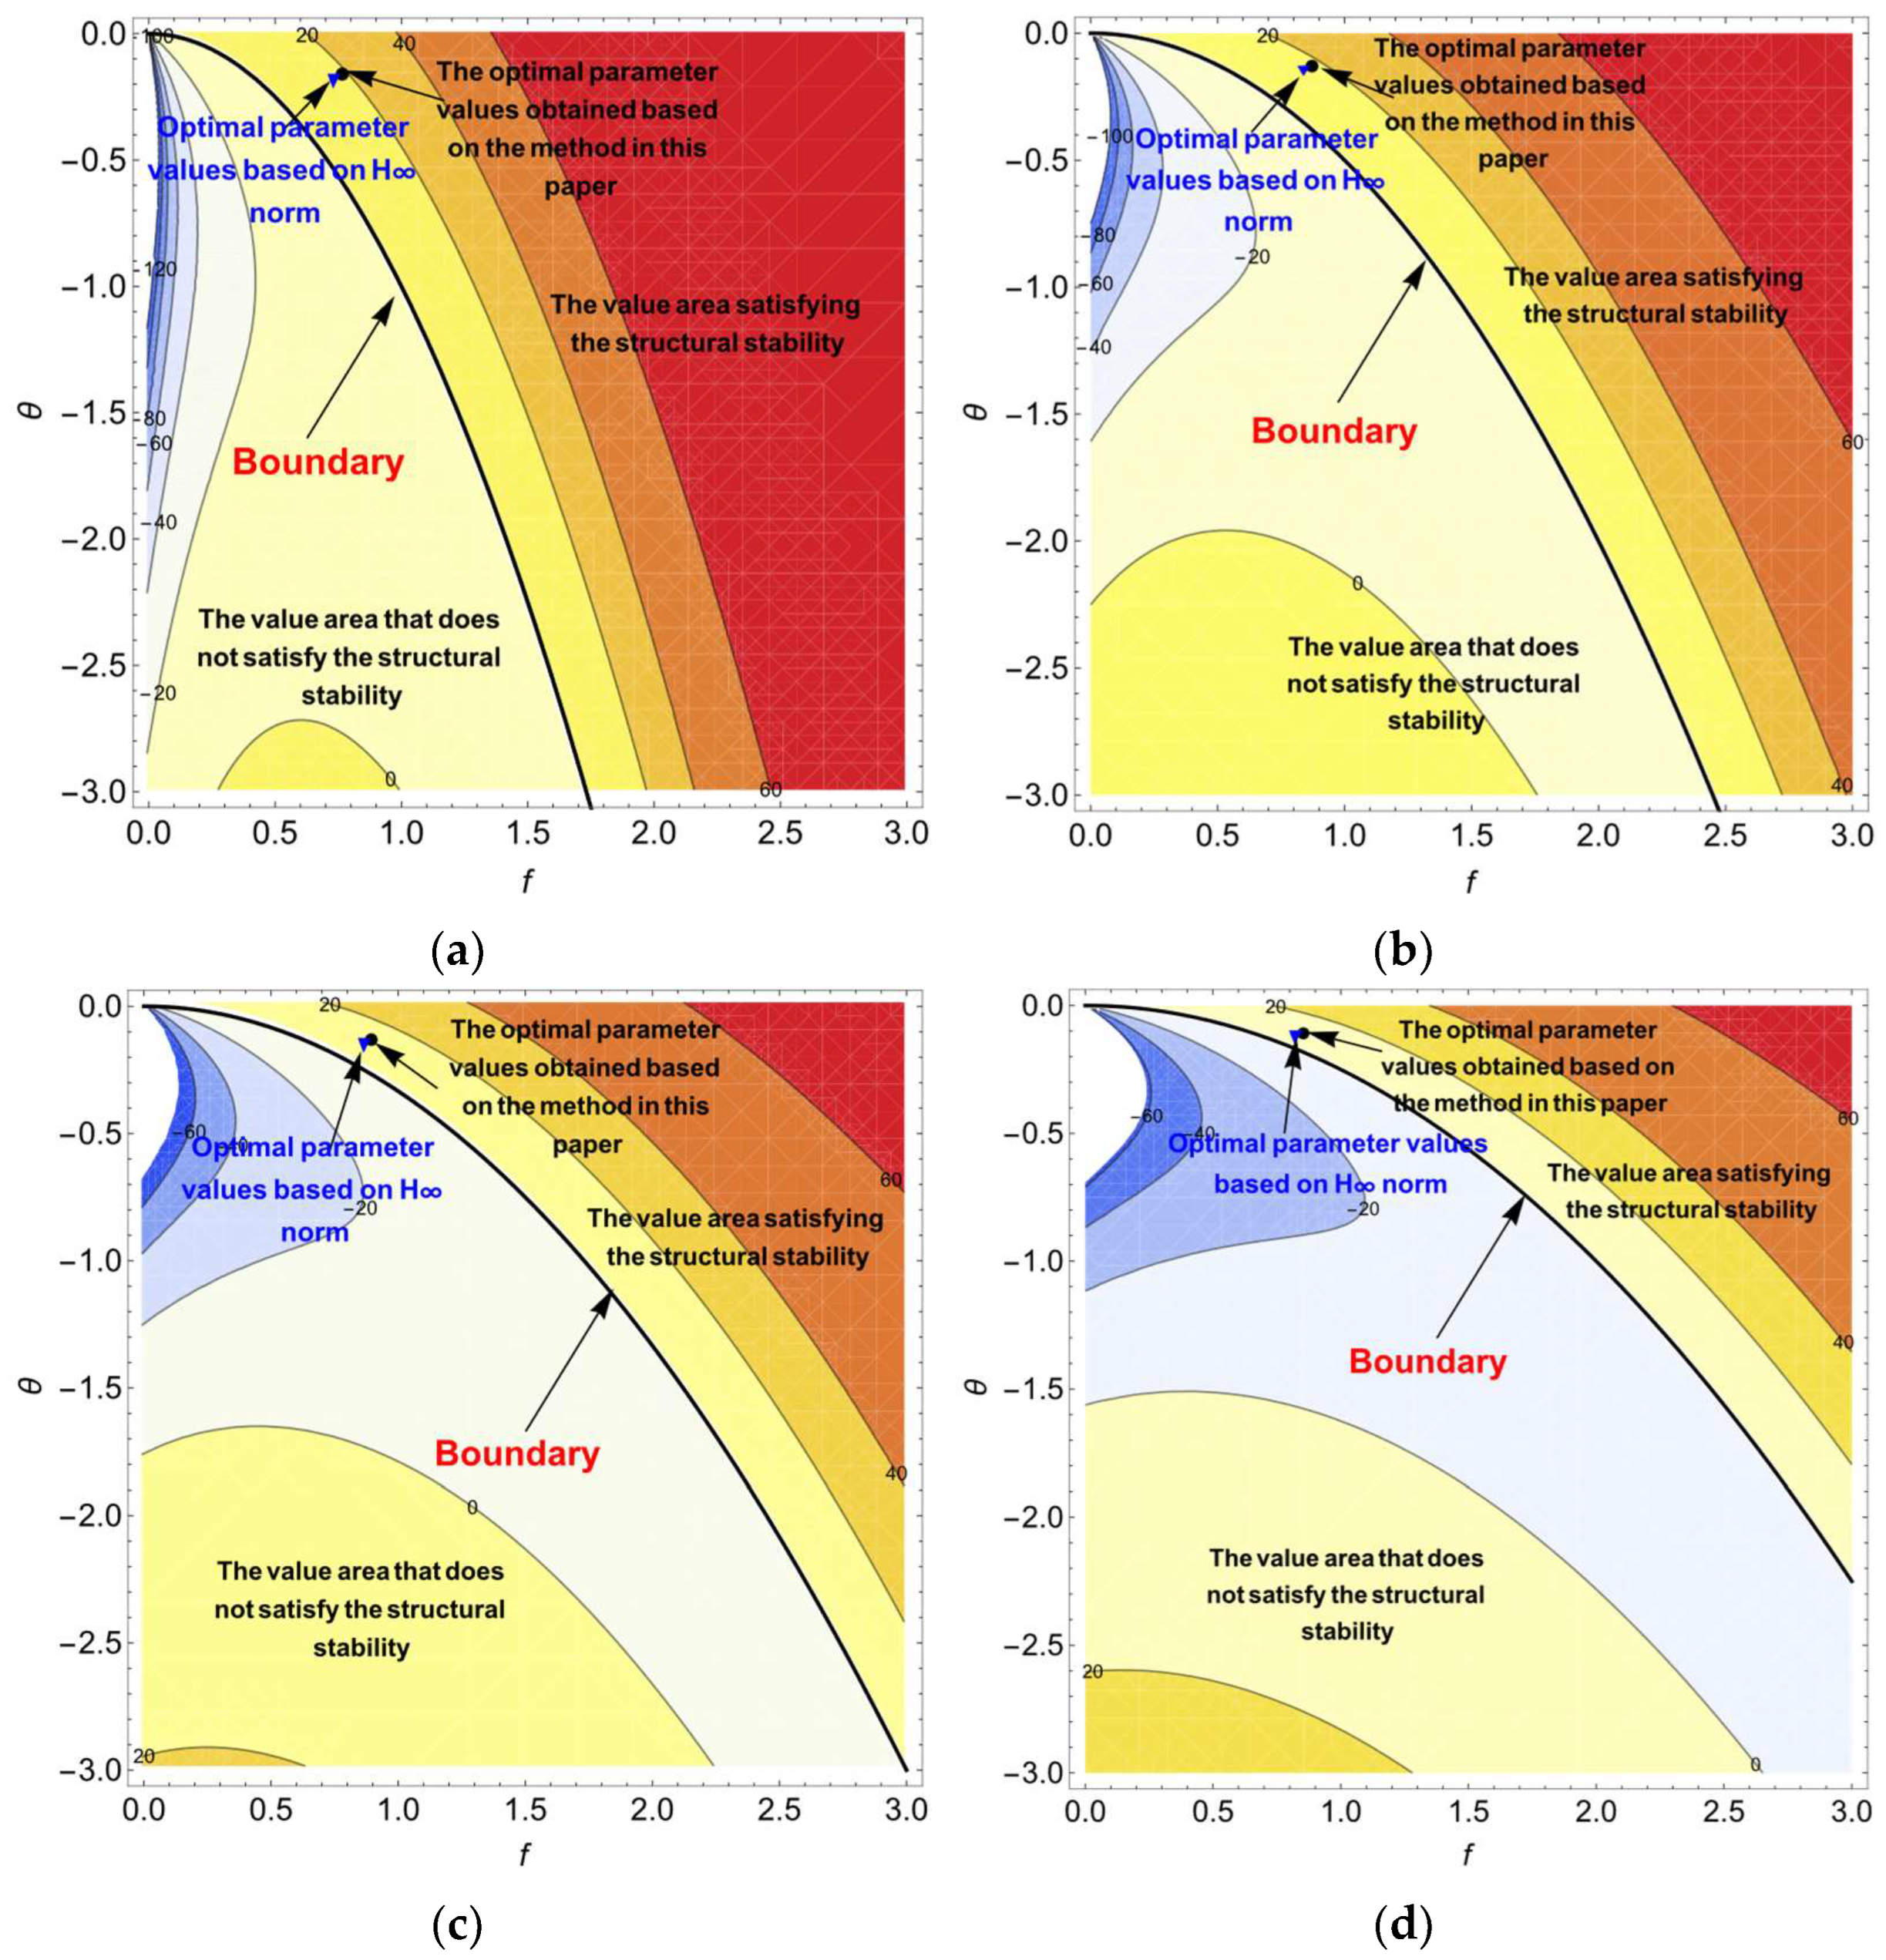
  • The parameters defined in this paper are mass ratio μ = 3 , negative stiffness ratio θ = 0.1 , frequency ratio f = 0.8 , damping ratio of superstructure ξ s = 0.01 and damping ratio of base isolation layer ξ b = 0.02 . The optimal frequency ratio f o p t = 0.5 was obtained by calculation and analysis.
  • The structural damping ratio ξ s and ξ b can influence the energy dissipation capacity of building structures. When the damping ratio increases, the energy dissipation capacity of the building structure is enhanced, and the amplitude of the frequency response function of the two isolation systems is significantly reduced. On the contrary, the energy dissipation capacity is weakened. The change of structural damping ratio will not cause the change of resonance frequency between the building structure and seismic excitation.
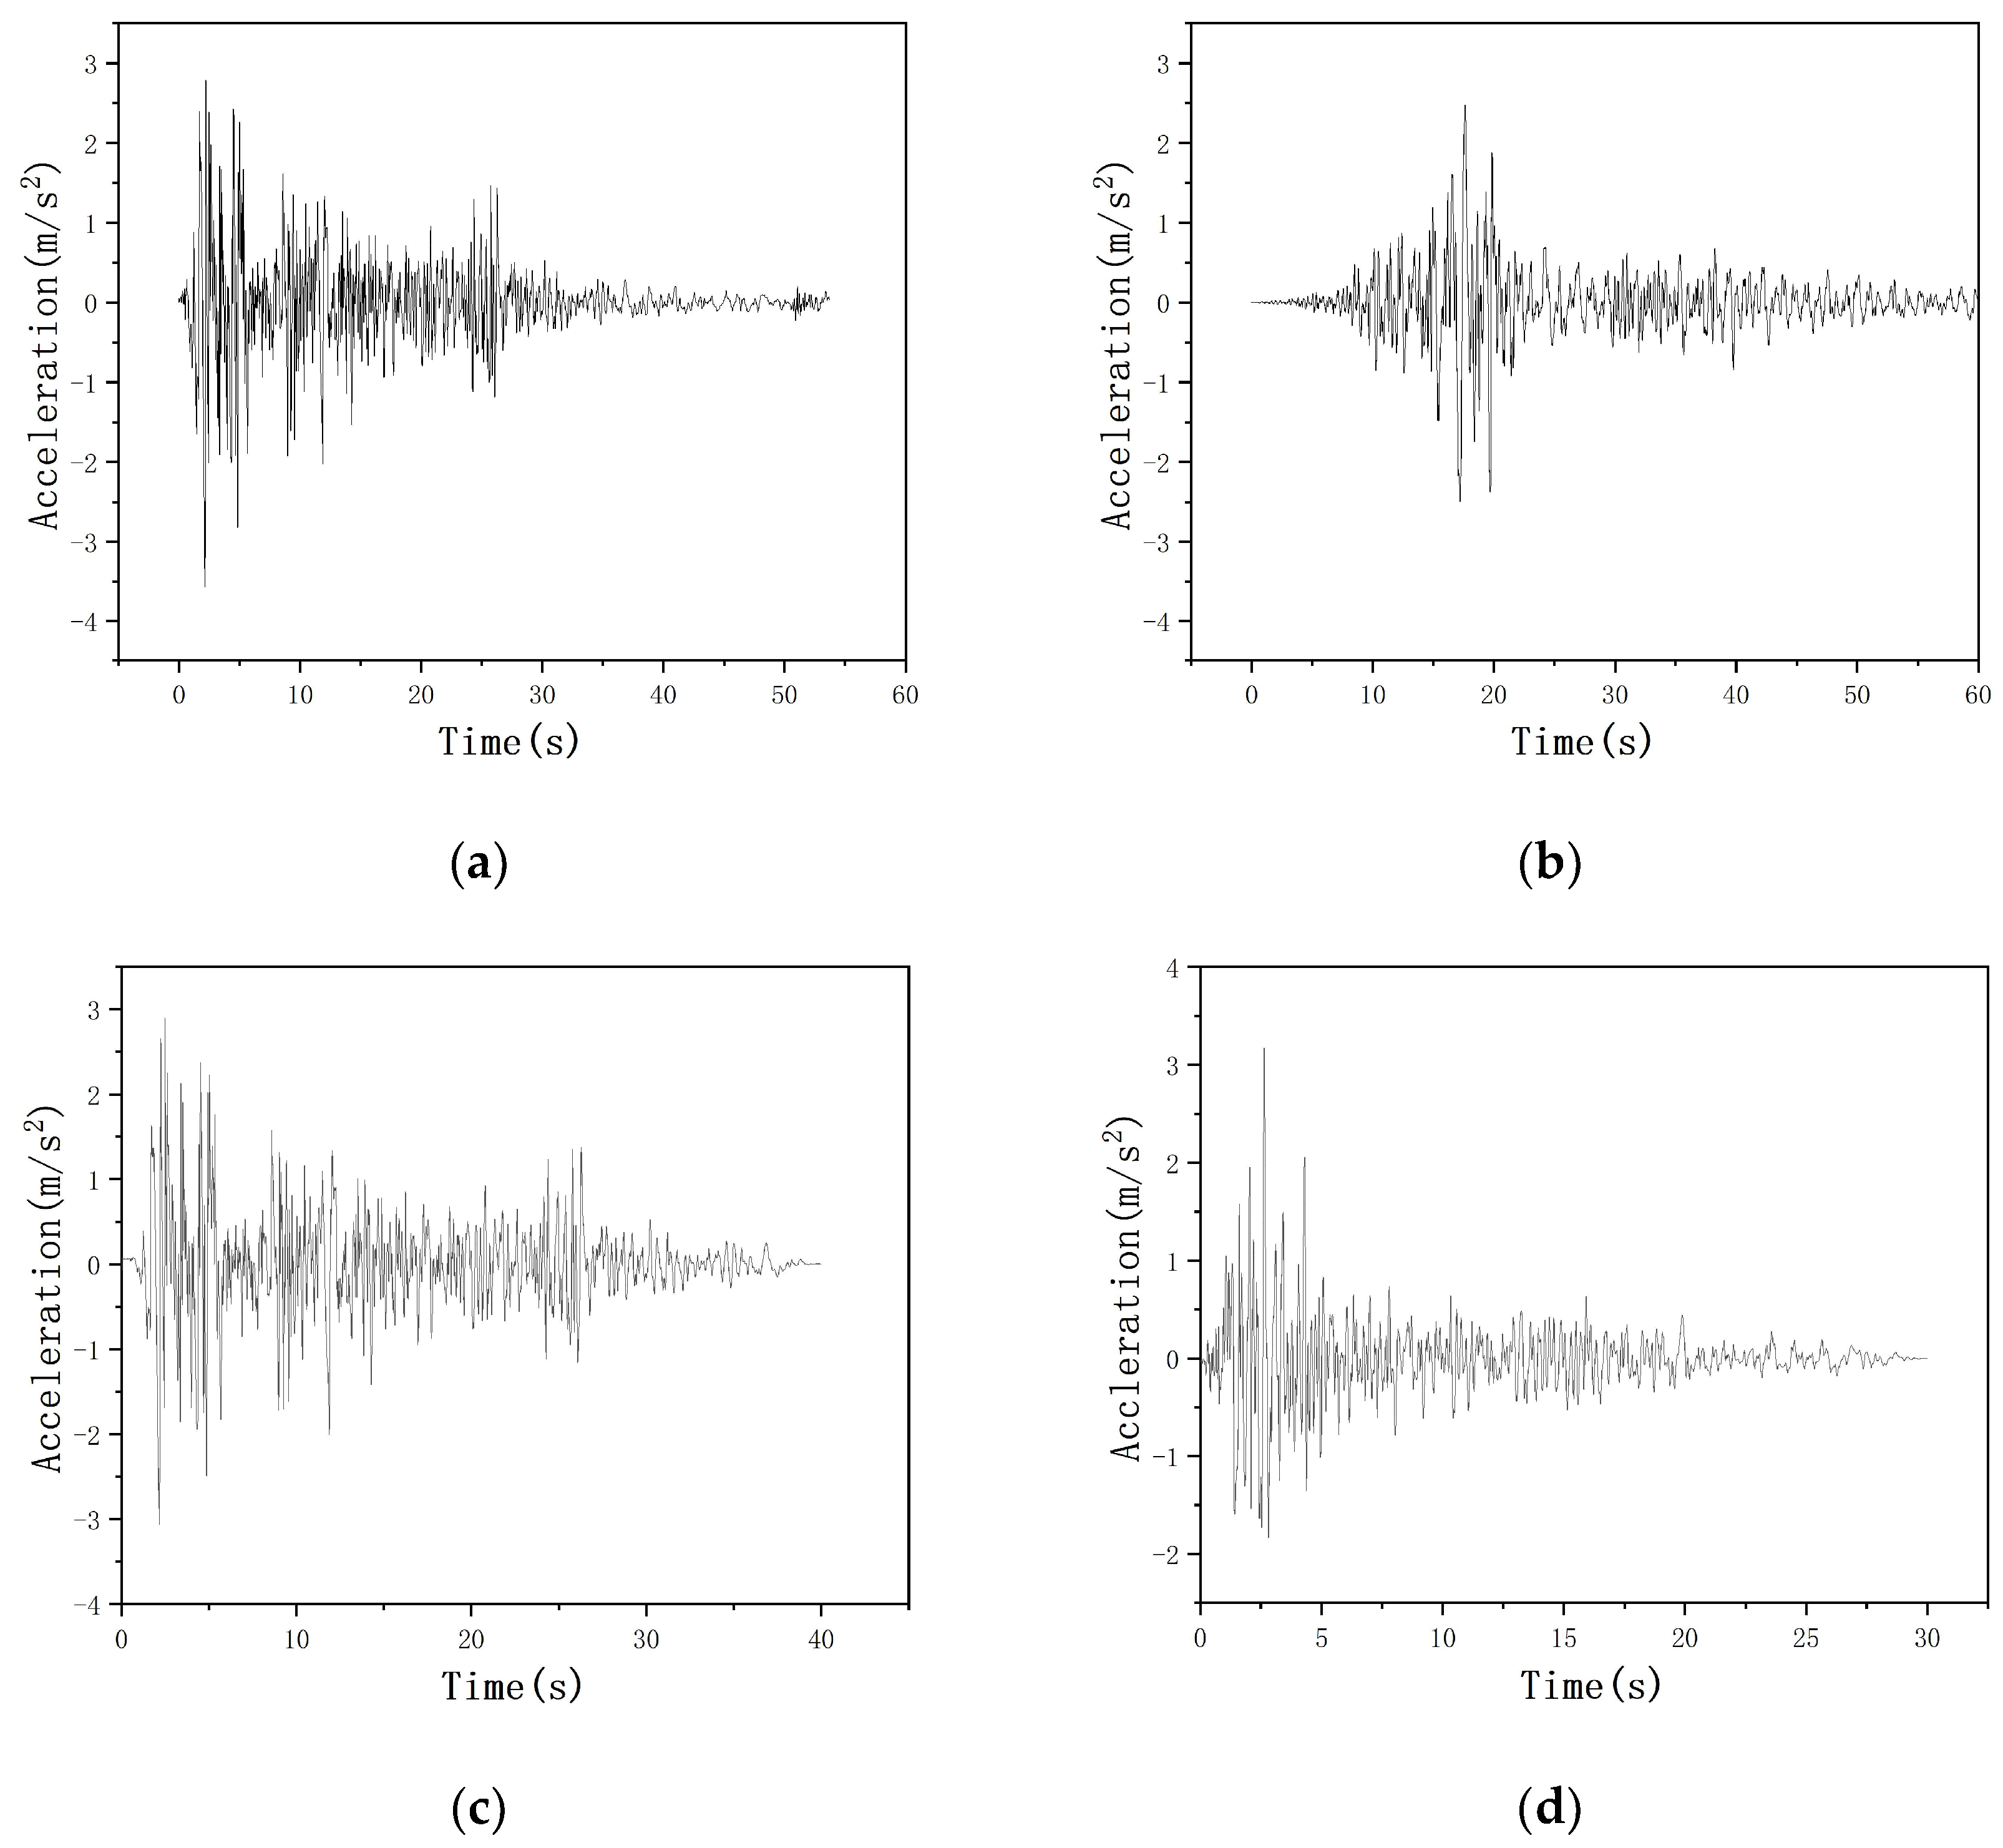
  • Through the analysis of the time–history response results, it can be seen that the negative stiffness device achieves the expected role of controlling the natural vibration period of the structure and reducing the floor acceleration of the superstructure.

Author Contributions

Conceptualization, X.K.; Data curation, S.L.; Formal analysis, S.L.; Investigation, X.K. and S.L.; Methodology, X.K., S.L. and J.H.; Supervision, X.K. and J.H.; Validation, X.K.; Writing—Original draft, X.K. and S.L.; Writing—Review–editing, S.L. and J.H. All authors have read and agreed to the published version of the manuscript.

Funding

This research was funded by the Anhui Provincial Natural Science Foundation (Grant No. 2008085QE245), the Natural Science Research Project of Higher Education Institutions in Anhui Province (Grant No. 2022AH040045), the Project of Science and Technology Plan of Department of Housing and Urban-Rural Development of Anhui Province (Grant No. 2021-YF22), the National College Student Innovation and Entrepreneurship Training Program Project (Grant No. 202210878005).

Data Availability Statement

No new data were created or analyzed in this study. Data sharing is not applicable to this article.

Conflicts of Interest

The authors declare that they have no conflicts of interest.

Appendix A

P I = 1 2 π H i λ 2 d λ = A 0 B 3 2 A 0 A 3 A 1 A 2 + A 0 A 1 A 4 2 B 1 B 3 B 2 2 A 0 A 3 A 4 B 1 2 2 B 0 B 2 + A 4 B 0 2 A 1 A 4 A 2 A 3 A 0 A 4 A 0 A 3 2 + A 1 2 A 4 A 1 A 2 A 3

References

  1. Bai, J.; Chen, H.; Zhao, J.; Liu, M.; Jin, S. Seismic design and subassemblage tests of buckling-restrained braced RC frames with shear connector gusset connections. Eng. Struct. 2021, 234, 112018. [Google Scholar] [CrossRef]
  2. Spencer, B.F.; Nagarajaiah, S. State of the art of structural control. J. Struct. Eng. 2003, 129, 845–856. [Google Scholar] [CrossRef]
  3. Platus, D.L. Negative-stiffness-mechanism vibration isolation systems. Vib. Control Microelectron. Opt. Metrol. 1992, 1619, 44–54. [Google Scholar]
  4. Mizuno, T.; Toumiya, T.; Takasaki, M. Vibration isolation system using negative stiffness. JSME Int. J. 2003, 46, 807–812. [Google Scholar] [CrossRef]
  5. Iemura, H.; Pradono, M.H. Passive and semi-active seismic response control of a cable-stayed bridge. Struct. Control Health Monit. 2002, 9, 189–204. [Google Scholar] [CrossRef]
  6. Iemura, H.; Pradono, M.H. Simple algorithm for semi-active seismic response control of cable-stayed bridges. Earthq. Eng. Struct. Dyn. 2005, 34, 409–423. [Google Scholar] [CrossRef]
  7. Li, H.; Liu, J.; Ou, J. Seismic response control of a cable-stayed bridge using negative stiffness dampers. Struct. Control Health Monit. 2011, 18, 265–288. [Google Scholar] [CrossRef]
  8. Li, H.; Liu, M.; Ou, J. Negative stiffness characteristics of active and semi-active control systems for stay cables. Struct. Control Health Monit. 2008, 15, 120–142. [Google Scholar] [CrossRef]
  9. Weber, F.; Distl, H. Semi-active damping with negative stiffness for multi-mode cable vibration mitigation: Approximate collocated control solution. Smart Mater. Struct. 2015, 24, 115015. [Google Scholar] [CrossRef]
  10. Gong, W.; Xiong, S. A new filter-based pseudo-negative-stiffness control for base-isolated buildings. Struct. Control Health Monit. 2017, 24, e1912. [Google Scholar] [CrossRef]
  11. Hogsberg, J. The role of negative stiffness in semi-active control of magneto-rheological dampers. Struct. Control Health Monit. 2011, 18, 289–304. [Google Scholar] [CrossRef]
  12. Weber, F.; Boston, C. Clipped viscous damping with negative stiffness for semi-active cable damping. Smart Mater. Struct. 2011, 20, 045007. [Google Scholar] [CrossRef]
  13. Wu, B.; Shi, P.; Ou, J. Seismic performance of structures incorporating magnetorheological dampers with pseudo-negative stiffness. Struct. Control Health Monit. 2013, 20, 405–421. [Google Scholar] [CrossRef]
  14. Shi, X.; Zhu, S. Magnetic negative stiffness dampers. Smart Mater. Struct. 2015, 24, 072002. [Google Scholar] [CrossRef]
  15. Shi, X.; Zhu, S. Simulation and optimization of magnetic negative stiffness dampers. Sens. Actuator A Phys. 2017, 259, 14–33. [Google Scholar] [CrossRef]
  16. Chen, L.; Sun, L.; Nagarajaiah, S. Cable with discrete negative stiffness device and viscous damper: Passive realization and general characteristics. Smart Struct. Syst. 2015, 15, 627–643. [Google Scholar] [CrossRef]
  17. Antoniadis, I.; Chronopoulos, D.; Spitas, V.; Koulocheris, D. Hyper-damping properties of a stiff and stable linear oscillator with a negative stiffness element. J. Sound Vib. 2015, 346, 37–52. [Google Scholar] [CrossRef]
  18. Kalathur, H.; Lakes, R.S. Column dampers with negative stiffness: High damping at small amplitude. Smart Mater. Struct. 2013, 22, 084013. [Google Scholar] [CrossRef]
  19. Dong, L.; Lakes, R. Advanced damper with high stiffness and high hysteresis damping based on negative structural stiffness. Int. J. Solids Struct. 2013, 50, 2416–2423. [Google Scholar] [CrossRef]
  20. Wang, M.; Sun, F.; Jin, H. Performance evaluation of existing isolated buildings with supplemental passive pseudo-negative stiffness devices. Eng. Struct. 2018, 177, 30–46. [Google Scholar] [CrossRef]
  21. Lai, Z.; Sun, T.; Nagarajaiah, S. Adjustable template stiffness device and SDOF nonlinear frequency response. Nonlinear Dyn. 2019, 96, 1559–1573. [Google Scholar] [CrossRef]
  22. Shen, Y.; Peng, H.; Li, X.; Yang, S. Analytically optimal parameters of dynamic vibration absorber with negative stiffness. Mech. Syst. Signal Process 2017, 85, 193–203. [Google Scholar] [CrossRef]
  23. Walsh, K.K.; Boso, E.; Steinberg, E.P.; Haftman, J.T.; Littell, W.N. Variable negative stiffness device for seismic protection of building structures through apparent weakening. J. Eng. Mech. 2018, 144, 04018090. [Google Scholar] [CrossRef]
  24. Wang, M.; Sun, F.; Yang, J.; Nagarajaiah, S. Seismic protection of SDOF systems with a negative stiffness amplifying damper. Eng. Struct. 2019, 190, 128–141. [Google Scholar] [CrossRef]
  25. Mathew, G.; Jangid, R.S. Seismic response control of a building by negative stiffness devices. Asian J. Civ. Eng. 2018, 19, 849–866. [Google Scholar] [CrossRef]
  26. Carrella, A.; Brennan, M.J.; Waters, T.P. Demonstrator to show the effects of negative stiffness on the natural frequency of a simple oscillator. Proc. Inst. Mech. Eng. C J. Mech. Eng. Sci. 2008, 222, 1189–1192. [Google Scholar] [CrossRef]
  27. Iemura, H.; Igarashi, A.; Pradono, M.H.; Kalantari, A. Negative stiffness friction damping for seismically isolated structures. Struct. Control Health Monit. 2006, 13, 775–791. [Google Scholar] [CrossRef]
  28. Attray, N.; Symans, M.; Nagarajaiah, S.; Reinhorn, A.M.; Constantinou, M.C.; Taylor, D.; Sarlis, A.A.; Pasala, D.T.R. Application of Negative Stiffness Devices for Seismic Protection of Bridge Structures. In Proceedings of the Structures Congress 2012, Chicago, IL, USA, 29–31 March 2012. [Google Scholar]
  29. Toyooka, A.; Kouchiyama, O.; Iemura, H.; IKEDA, M. Development of the passive negative stiffness friction device and its verification through shaking table. Doboku Gakkai ROnbunshuu A 2010, 66, 148–162. [Google Scholar] [CrossRef]
  30. Zhou, P.; Li, H. Modeling and control performance of a negative stiffness damper for suppressing stay cable vibrations. Struct. Control Health Monit. 2016, 23, 764–782. [Google Scholar] [CrossRef]
  31. Chen, X.; Ikago, K.; Guan, Z.; Li, J.; Wang, X. Lead-rubber-bearing with negative stiffness springs (LRB-NS) for base-isolation seismic design of resilient bridges: A theoretical feasibility study. Eng. Struct. 2022, 266, 114601. [Google Scholar] [CrossRef]
  32. Pasala, D.T.R.; Sarlis, A.A.; Reinhorn, A.M.; Nagarajaiah, S.; Constantinou, M.C.; Taylor, D. Simulated bilinear-elastic behavior in a SDOF elastic structure using negative stiffness device: Experimental and analytical study. J. Struct. Eng. 2014, 140, 04013049. [Google Scholar] [CrossRef]
  33. Pasala, D.T.R.; Sarlis, A.A.; Reinhorn, A.M.; Nagarajaiah, S.; Constantinou, M.C.; Taylor, D. Apparent weakening in SDOF yielding structures using a negative stiffness device: Experimental and analytical study. J. Struct. Eng. 2015, 141, 04014130. [Google Scholar] [CrossRef]
  34. Luo, H.; Ikago, K.; Chong, C.; Keivan, A.; Phillips, B.M. Performance of low-frequency structures incorporated with rate-independent linear damping. Eng. Struct. 2019, 181, 324–335. [Google Scholar] [CrossRef]
  35. Luo, H.; Ikago, K. Unifying causal model of rate-independent linear damping for effectively reducing seismic response in low-frequency structures. Earthq. Eng. Struct. Dyn. 2021, 50, 2355–2378. [Google Scholar] [CrossRef]
  36. Liu, W.; Ikago, K. Feasibility study of the physical implementation of rate-independent linear damping for the protection of low-frequency structures. J. Build. Eng. 2021, 44, 103319. [Google Scholar] [CrossRef]
  37. Liu, W.; Ikago, K. Feasibility study of a passive rate-independent damping device for the seismic protection of low-frequency structures. Structures 2021, 34, 2499–2514. [Google Scholar] [CrossRef]
  38. Liu, W.; Ikago, K. Experimental study of earthquake input energy of low-frequency structures equipped with a passive rate-independent damping device. Struct. Control Health Monit. 2022, 29, e2883. [Google Scholar] [CrossRef]
  39. Liu, W.; Ikago, K. Causal implementation of rate-independent linear damping for the seismic protection of low-frequency structures. Structures 2022, 35, 274–288. [Google Scholar] [CrossRef]
  40. Li, H.; Li, J.; Yu, Y.; Li, Y. Modified adaptive negative stiffness device with variable negative stiffness and geometrically nonlinear damping for seismic protection of structures. Int. J. Struct. Stab. Dyn. 2021, 21, 2150107. [Google Scholar] [CrossRef]
  41. Wang, H.; Gao, H.; Li, J.; Wang, Z.; Ni, Y.; Liang, R. Optimum design and performance evaluation of the tuned inerter-negative-stiffness damper for seismic protection of single-degree-of-freedom structures. Int. J. Mech. Sci. 2021, 212, 106805. [Google Scholar] [CrossRef]
  42. Peng, Y.; Ma, Y.; Huang, T.; Domenico, D.D. Reliability-based design optimization of adaptive sliding base isolation system for improving seismic performance of structures. Reliab. Eng. Syst. Saf. 2021, 205, 107167. [Google Scholar]
  43. Ryan, E.G.; Drovandi, C.C.; McGree, J.M.; Pettitt, A.N. A Review of Modern Computational Algorithms for Bayesian Optimal Design. Int. Stat. Rev. 2016, 84, 128–154. [Google Scholar] [CrossRef]
  44. Azizi, M.; Talatahari, S.; Basiri, M.; Shishehgarkhaneh, M.B. Optimal design of low- and high-rise building structures by Tribe-Harmony Search algorithm. Decis. Anal. 2022, 3, 100067. [Google Scholar] [CrossRef]
  45. Jin, L.; Li, B.; Lin, S.; Li, G. Optimal Design Formula for Tuned Mass Damper Based on an Analytical Solution of Interaction between Soil and Structure with Rigid Foundation Subjected to Plane SH-Waves. Buildings 2023, 13, 17. [Google Scholar]
  46. Li, C.; Coster, D.C. Improved Particle Swarm Optimization Algorithms for Optimal Designs with Various Decision Criteria. Mathematics 2022, 10, 2310. [Google Scholar] [CrossRef]
  47. Zhang, M.; Xu, F. Tuned mass damper for self-excited vibration control: Optimization involving nonlinear aeroelastic effect. J. Wind. Eng. Ind. Aerodyn. 2022, 220, 104836. [Google Scholar] [CrossRef]
  48. Yazdi, A.E. Optimal control of a broadband vortex-induced vibration energy harvester. J. Intell. Mater. Syst. Struct. 2020, 31, 137–151. [Google Scholar] [CrossRef]
  49. De Domenico, D.; Ricciardi, G. Improving the dynamic performance of base-isolated structures via tuned mass damper and inerter devices: A comparative study. Struct. Control Health Monit. 2018, 25, e2234. [Google Scholar] [CrossRef]
  50. Asami, T.; Nishihara, O.; Baz, A.M. Analytical Solutions to H and H2 Optimization of Dynamic Vibration Absorbers Attached to Damped Linear Systems. J. Vib. Acoust. 2002, 124, 284–295. [Google Scholar]
  51. Abe, M.; Fujino, Y. Dynamic Characterization of Multiple Tuned Mass Dampers and Some Design Formulas. Earthq. Eng. Struct. Dyn. 1994, 23, 813–835. [Google Scholar] [CrossRef]
  52. Zuo, L.; Nayfeh, S.A. The Two-Degree-of-Freedom Tuned-Mass Damper for Suppression of Single-Mode Vibration Under Random and Harmonic Excitation. J. Vib. Acoust. 2006, 128, 56–65. [Google Scholar] [CrossRef]
  53. Cheung, Y.L.; Wong, W.O. H and H2 Optimizations of a Dynamic Vibration Absorber for Suppressing Vibrations in Plates. J. Sound Vib. 2009, 320, 29–42. [Google Scholar] [CrossRef]
  54. MathWorks. MATLAB R2016b-Academic Use; The Mathworks Inc.: Natick, MA, USA, 2016. [Google Scholar]
  55. Luo, Y.; Sun, H.; Wang, X.; Chen, A.; Zuo, L. Parametric optimization of electromagnetic tuned inerter damper for structural vibration suppression. Struct. Control Health Monit. 2021, 28, e2711. [Google Scholar] [CrossRef]
  56. Lin, C.C.; Chen, C.L.; Wang, J.F. Vibration Control of Structures with Initially Accelerated Passive Tuned Mass Dampers under Near-Fault Earthquake Excitation. Comput.-Aided Civ. Infrastruct. Eng. 2010, 25, 69–75. [Google Scholar] [CrossRef]
  57. Martínez, C.A.; Curadelli, O. Testing and performance of a new friction damper for seismic vibration control. J. Sound Vib. 2017, 399, 60–74. [Google Scholar] [CrossRef]
Figure 1. Reduction-isolation system based on negative stiffness device.
Buildings 13 00489 g001
Figure 2. Simplified force model of seismic reduction-isolation system based on negative stiffness device.
Buildings 13 00489 g002
Figure 3. H i λ 1 displacement frequency response diagram ( ξ s = 0.01 , ξ b = 0.02 and f = 0.8 ).
Buildings 13 00489 g003
Figure 4. (a) Influence of negative stiffness ratio θ on displacement frequency response H i λ 1 ( μ = 3 , ξ s = 0.01 , ξ b = 0.02 and f = 0.8 ); (b) Influence of frequency ratio f on displacement frequency response H i λ 1 ( μ = 3 , ξ s = 0.01 and ξ b = 0.02 ).
Buildings 13 00489 g004aBuildings 13 00489 g004b
Figure 5. H i λ 2 displacement frequency response diagram ( ξ s = 0.01 , ξ b = 0.02 and f = 0.8 ).
Buildings 13 00489 g005
Figure 6. (a) Influence of negative stiffness ratio θ on displacement frequency response H i λ 2 ( μ = 3 , ξ s = 0.01 , ξ b = 0.02 and f = 0.8 ); (b) Influence of frequency ratio f on displacement frequency response H i λ 2 ( μ = 3 , ξ s = 0.01 and ξ b = 0.02 ).
Buildings 13 00489 g006
Figure 7. Contour plot of mass ratio θ and frequency ratio f ( ξ s = 0.01 and ξ b = 0.02 ): (a) μ = 1 ; (b) μ = 2 ; (c) μ = 3 ; (d) μ = 4 .
Buildings 13 00489 g007
Figure 8. Three-dimensional description of negative stiffness ratio θ ( ξ s = 0.01 , ξ b = 0.02 and f = 0.8 ): (a) μ = 1 ; (b) μ = 2 ; (c) μ = 3 ; (d) μ = 4 .
Buildings 13 00489 g008
Figure 9. (a) Diagram of influence of damping ratio of superstructure ξ s on displacement frequency response H i λ 2 ( μ = 3 , ξ b = 0.02 and f = 0.8 ); (b) Diagram of influence of damping ratio of lower base isolation layer ξ b on displacement frequency response H i λ 2 ( μ = 3 , ξ s = 0.01 and f = 0.8 ).
Buildings 13 00489 g009
Figure 10. Seismic wave (a)EL Centro; (b) Chi-Chi; (c) Imperial Valley; (d) San Fernando.
Buildings 13 00489 g010
Figure 11. Relative displacement between superstructure and base isolation layer (a)EL Centro; (b) Chi-Chi; (c) Imperial Valley; (d) San Fernando.
Buildings 13 00489 g011
Figure 12. Displacement of base isolation layer (a)EL Centro; (b) Chi-Chi; (c) Imperial Valley; (d) San Fernando.
Buildings 13 00489 g012aBuildings 13 00489 g012b
Figure 13. Acceleration response of superstructure (a)EL Centro; (b) Chi-Chi; (c) Imperial Valley; (d) San Fernando.
Buildings 13 00489 g013
Table 1. Time history response peak.
EarthquakeMaximum Displacement of Foundation (m)Maximum Relative Displacement (m)Maximum Acceleration Response of Superstructure (m/s2)
Negative StiffnessNo Negative StiffnessNegative StiffnessNo Negative StiffnessNegative StiffnessNo Negative Stiffness
EL Centro 0.03060.07040.00960.0150−10.040614.7249
(56.53%) (36%) (31.81%)
Chi-Chi 0.04090.04820.01210.0102−11.6249−10.3546
(15.15%) (−18.63%) (−12.27%)
Imperial Valley0.03080.059870.00900.0128−10.0423−12.5145
(48.55%) (29.69%) (19.75%)
SanFernando 0.02560.048490.00750.01038.0344−11.0387
(47.21%) (27.18%) (27.22%)
Note: ‘*’ in parentheses of (*) is the percentage of reduction in the peak time-history response of the reduction-isolation control system based on the negative stiffness compared to the peak time-history response of the traditional isolation control system.
Disclaimer/Publisher’s Note: The statements, opinions and data contained in all publications are solely those of the individual author(s) and contributor(s) and not of MDPI and/or the editor(s). MDPI and/or the editor(s) disclaim responsibility for any injury to people or property resulting from any ideas, methods, instructions or products referred to in the content.

