Article

Investigation of Air Change Rate in a Single Room Using Multiple Carbon Dioxide Breathing Models in China: Verification by Field Measurement

1
Department of Building Environment and Energy Engineering, School of Environment and Architecture, University of Shanghai for Science and Technology, Shanghai 200093, China
2
College of Environmental Science and Engineering, Donghua University, Shanghai 201620, China
3
Institute for Health and Environment, Chongqing University of Science and Technology, Chongqing 401331, China
4
Chongqing Energy Investment Group Science and Technology Co., Ltd., Chongqing 400061, China
*
Author to whom correspondence should be addressed.
Buildings 2023, 13(2), 459; https://doi.org/10.3390/buildings13020459
Submission received: 7 January 2023 / Revised: 3 February 2023 / Accepted: 4 February 2023 / Published: 7 February 2023
(This article belongs to the Topic Ventilation and Indoor Air Quality, 2nd Volume)

Abstract

:
It is difficult to accurately measure the air exchange rate (AER) in residential and office buildings during occupation via on-site field measurement. The tracer gas method was widely applied to estimate the AER in these buildings, and human metabolic carbon dioxide (CO2) was often used as a tracer gas in different models. This study introduced three models (the ASHRAE model, the ASHRAE China-specific modified model, and the BMR model), which were proposed to estimate the AER based on exhaled CO2. We verified these models by comparing the exhaled CO2-based AER with AER from field measurements using sulfur hexafluoride (SF6) as a tracer gas. We also analyzed the potential factors that could affect the uniformity of the indoor tracer gas distribution. Our results indicate that the ASHRAE China-specific modified model has the best performance with an average deviation of −6.67% and a maximum deviation of −14.6% with multiple measurement points, a stable personnel activity, and proper Parameter settings in a single room in China.

1. Introduction

As one of the common ways of passive ventilation in civil buildings, infiltration has a non-negligible impact on the energy consumption, thermal comfort, and indoor air quality of buildings [1,2,3]. It is very difficult to accurately and rapidly measure the infiltration rate in air changes per hour (ACH), although the development of the tracer gas technique provides ways for solving this problem for about 40 years [4]. In 1979, the International Energy Agency (IEA) inaugurated an Air Infiltration and Ventilation Centre (AIVC) to recognize of the impact of ventilation on energy use and indoor air quality. The AIVC has been offering technical support for industry and research organizations who aim at optimizing ventilation technology [5]. The AIVC and several other organizations found that the most perfect tracer gas is sulfur hexafluoride (SF6), which is chemically stable and is normally not found in the natural environment as it is man-made [5,6,7,8]. As a result, a small amount of SF6 can be used to quickly estimate the infiltration air change rate in a closed room [8,9]. Some studies have shown that the average calculation error of air exchange rate (AER) could be controlled within 8% using the SF6 concentration decay method when the rate of infiltration air change is artificially controlled and the indoor fan stirring is enabled [10]. However, SF6 is a powerful greenhouse gas, and SF6 itself along with the measuring instruments is very expensive [11]. Therefore, the SF6 concentration decay method is not suitable for long-term or large-scale use in civil building and practical engineering [5,11].
In comparison with SF6, carbon dioxide (CO2) is cheap to manufacture, easy to measure, and less harmful to the environment than SF6. The primary advantage of CO2 is that the human body can be used as its release source. Several previous studies have investigated the AER in a single room of a school, residence, and office by using trace gas methods and human metabolic CO2-based models in different countries or regions since 1980 [4]. Specifically, Hou and colleagues used the constant release of the CO2 concentration method to estimate the AER during the night using the 24 h concentration of CO2 in bedrooms and living rooms of 399 households in Tianjin and Cangzhou, China, and found that the median AER was 0.25–0.37 ACH during sleeping time for different seasons in the child’s bedroom with a closed window and door [12]. Zhang and colleagues applied the CO2 tracer gas method and found that the AERs ranged from 2.27 to 89.2 m3/h in winter in the offices of a university in China [13]. Cheng et al., based on a single zone mass balance equation and the human metabolic CO2-based model, found that the AER ranged from 0.05 to 1.32 ACH in the bedrooms of 202 residences in Guangzhou, China [14]. Stavova found that the error with this method was less than 15% under controlled conditions [15]. However, Bekö and colleagues used a similar method to measure the AERs in five households in the Copenhagen area, Denmark, and compared them with the measurement results for active trace gases, and found that there was a big difference in the AER in the bedroom at night between estimation with active tracer gas (0.49/h) and estimation with CO2 (1.2/h) [16]. Smith and colleagues proposed that the errors arising from using the human body as the release source of CO2 to measure AER normally come from four sources: changes in ventilation rate, instrument measurement errors, poor uniformity, and calculation deviation of human CO2 generation rate [17]. Mahyuddin and Awbi summarized the effects of measurement practices and sampling locations on indoor CO2 concentrations, and suggested that the reasonable and representative sampling location was the middle of an occupied room with heights of 1.0–1.2 m, which was closed to the recognized breathing zone [18].
With respect to the human CO2 generation rate, previous studies generally used the empirical calculation formula that was listed in the ASHRAE (American Society of Heating, Refrigerating, and Air-Conditioning Engineers) Fundamentals Handbook (referred to as the ASHRAE model) [19]. The construction of this model involved a range of factors, such as sex, height, weight, activity status, and dietary structure. This formula was based on data from European and American populations, which has not been revised since 1980 [20]. However, studies showed that the ASHRAE model could significantly overestimate the CO2 emission among Chinese youths [21,22]. Qi and colleagues, based on the actual measurement among Chinese youths, established a ASHRAE modified model, which was considered to be more suitable for the physique of Chinese people than the ASHRAE model [23]. The ASHRAE modified model suggested that a correction coefficient of 0.85/0.75 should be applied for Chinese based on the calculation results from the ASHRAE model [23]. Besides, Persily and colleagues also established a new calculation model (basal metabolic rate (BMR) model) based on human CO2 emission by combining the metabolic rate and introducing the BMR based on sex, age, and weight data to the model [24]. Compared with the original ASHRAE model, the advantage of this BMR model was that it distinguished differences among individuals, especially for the age factor, and also considered the influence of temperature and atmospheric pressure on the calculation result. However, both the ASHRAE modified model and the BMR model were based on laboratory standards. These models could still show differences in practical engineering and scientific experiments among people from different countries.
In this article, based on an on-site field experiment, we analyze the distribution of the tracer gases (both SF6 and CO2) in a single closed room, as well as compare the accuracy and deviation of the three human metabolic CO2-based models (ASHRAE model, ASHRAE China-specific modified model, BMR model) on the AER estimation in a closed single room in China. We also analyze the influence of different measurement locations and the human breathing zone on the accuracy of the three human metabolic CO2-based models. Several suggestions are also made to facilitate the practical application in follow-up engineering experiments among Chinese people.

2. Materials and Methods

2.1. Methods for AER Calculation

The AER calculation using tracer gas is based on the law of conservation of mass, on the basis that the amount of air exfiltration equals the amount of air infiltration plus the amount of air generated by the personnel or equipment (Figure 1). According to different air release methods, there are three different approaches, namely, the steady-state method, the build-up method, and the concentration decay.
The build-up method is also called the constant release concentration method, as it requires a continuous and stable release of tracer gas into the room. The use of the human body to release CO2 can also adopt this method. Assuming that the tracer gas can quickly and evenly diffuse within the entire space after being released, the ventilation volume of the room after a period of time is:
Q ( τ ) = F C τ C o u t V τ [ ln ( C τ C o u t ) ln ( C 1 C o u t ) ]
In this formula, Q(τ) is the amount of room ventilation (m3/s), F is the release rate of tracer gas (m3/s), Cτ is the concentration of tracer gas in the room at time τ (ppm), Cout is the concentration of outdoor tracer gas (ppm), C1 is the initial concentration of tracer gas before tracer gas release (ppm), V is the room volume (m3), and τ is the measurement time (s).
The concentration decay method is also called the tracer gas concentration attenuation method. In the method, a certain amount of tracer gas is first released into the room, and this is stirred fully to ensure even mixing with the room air. In comparison with Formula (1), the release rate is F = 0, and the calculation formula for infiltration air volume in the room is as follows:
Q ( τ ) = V τ [ ln ( C 1 C o u t ) ln ( C τ C o u t ) ]
Since the concentration decay method is simple and easy to control, this method generally uses SF6 as tracer gas. When the physical activity of the human body is stable, the release of CO2 is basically constant. As a result, this can be regarded as a suitable condition for calculation using the concentration decay method.

2.2. The Calculation Models Based on Human CO2 Emission

2.2.1. ASHRAE Model

Human CO2 emission is affected by many factors. The 2017 ASHRAE Fundamentals Handbook provides the human body oxygen consumption calculation formula derived by Nishi and colleagues [19,25]:
F O 2 = 0.00000276 A D M 58.1 ( 0.23 R Q + 0.77 )
In this formula,  F O 2 is the volume of oxygen consumed by the human body per unit time under the conditions of 0 °C and 101.325 kPa (m3/s), and M is the metabolic rate and has a large range of variation that is dependent on the person, exercise type, and state (W/m2). Table 1 provides the typical metabolic rate for adults in different exercise states; RQ is the respiratory entropy, the ratio of the number of moles of carbon dioxide produced by the human body to the amount of oxygen consumed at the same time, which is related to the composition of the human diet and muscle strength, and this value is equal to 0.85 for people with a normal mixed diet. AD is the surface area of the human skin (m2).
The ASHRAE Handbook provides a widely used formula for calculating the surface area of the human skin, which originated from the study of Dubois and colleagues [26]:
A D = 0.202 H 0.725 W 0.425
where H is the person’s height in m and W is the person’s weight in kg.
The volume of CO2 produced by the human body (m3/s) can be calculated by combining Equations (3) and (4):
F C O 2 = F O 2 R Q = R Q 0.00000055752 H 0.725 W 0.425 58.1 ( 0.23 R Q + 0.77 )

2.2.2. ASHRAE China-Specific Modified Model

The ASHRAE model is based on population data from Europe and America and has not been revised since 1980. Qi et al. measured the CO2 release rate for 44 Chinese youths and proposed that a correction factor ε (0.85 for men and 0.75 for women) should be added to Equation (5) [23]. This China-specific modified model results in a more suitable calculation model for CO2 generation by the Chinese:
F C O 2 = ε R Q 0.00000055752 H 0.725 W 0.425 58.1 ( 0.23 R Q + 0.77 )

2.2.3. BMR Model

Research into human metabolism and exercise physiology introduced the BMR (basal metabolic rate) based on gender, age, and weight [24]. After determining the BMR value, similar to the ASHRAE model, the corresponding physical activity ratio PAR (physical activity ratio) is selected according to the exercise status. Temperature and atmospheric pressure are also taken into account. The calculation method for the BMR model is shown in the following Equation:
F C O 2 = 0.00211 R Q ( T P ) B M R P A R
where BMR refers to the energy metabolism rate of the human body in a state of the human body being awake and extremely quiet, not affected by muscle activity, environmental temperature, food, and mental stress, (MJ/day); PAR is the energy consumption of an activity per unit time (1 min or 1 h), expressed in multiples of BMR; T is the air temperature (K); and P is the atmospheric pressure (kPa). Table 2 and Table 3 show the metabolic rates for adult men under different activity intensities and the BMR values used to calculate the rate of CO2 production, respectively.

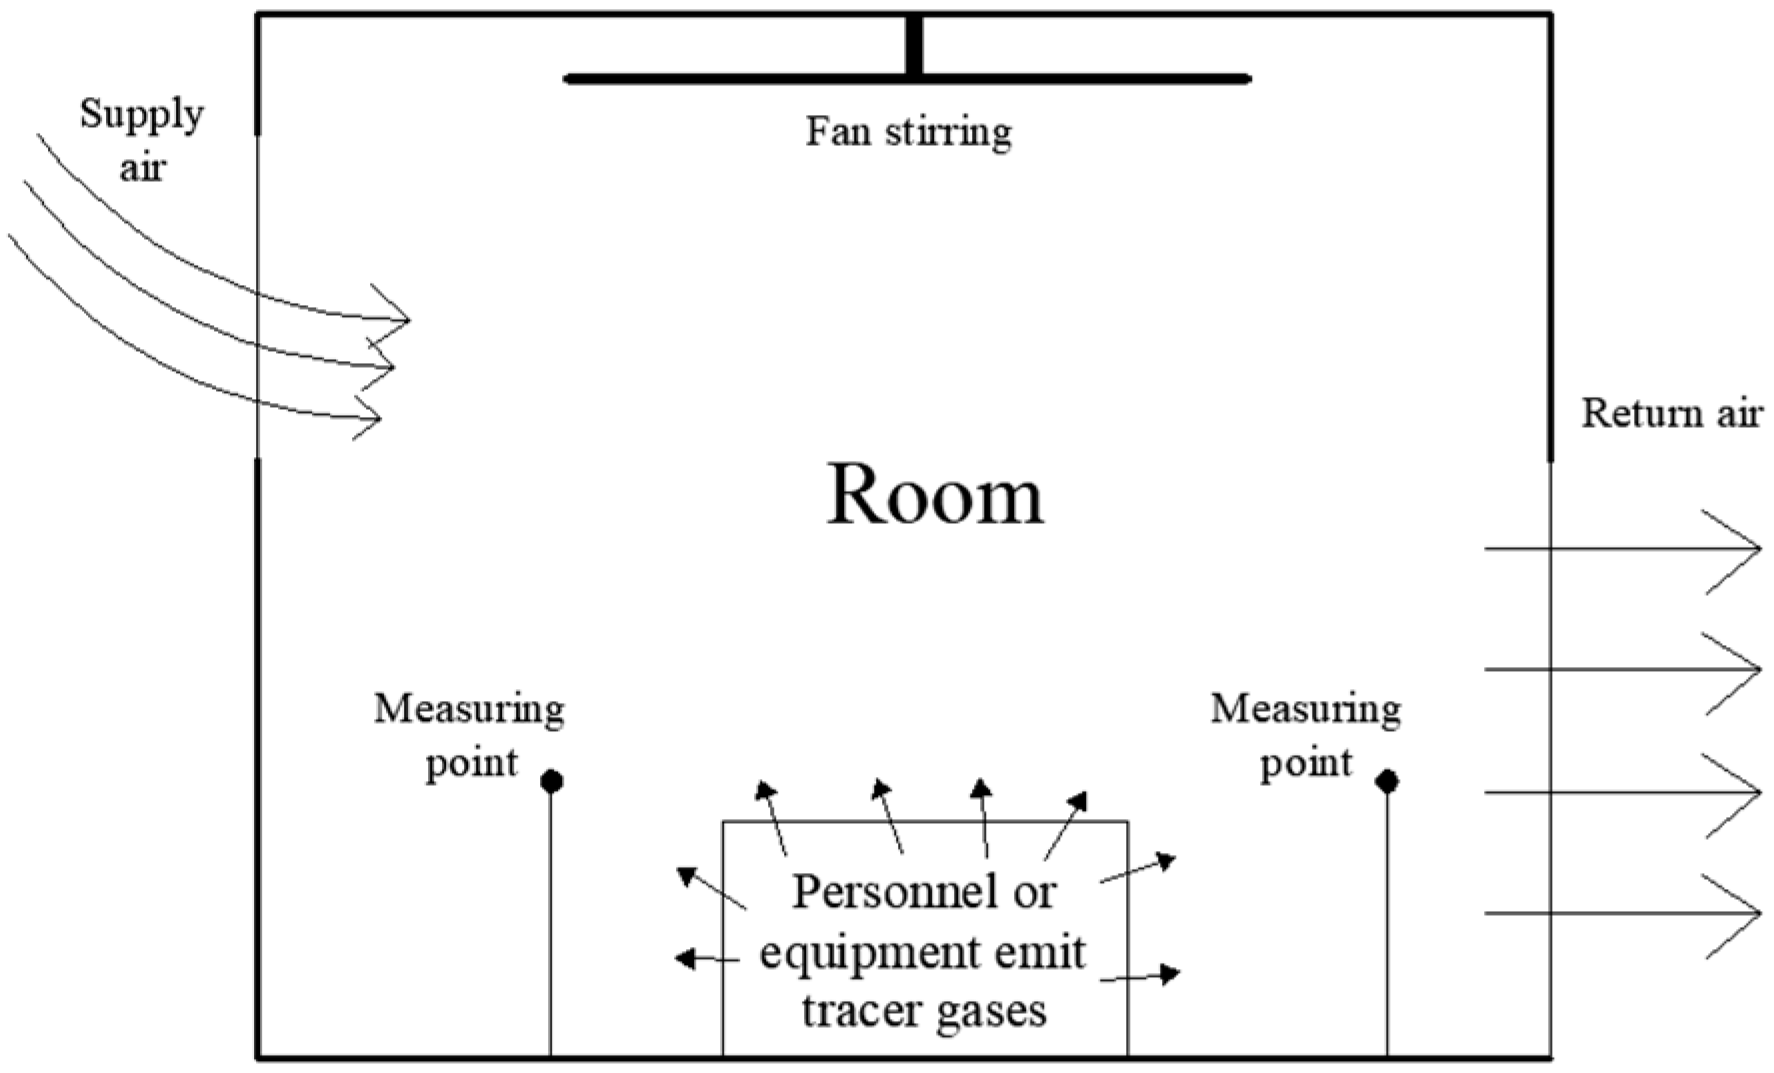
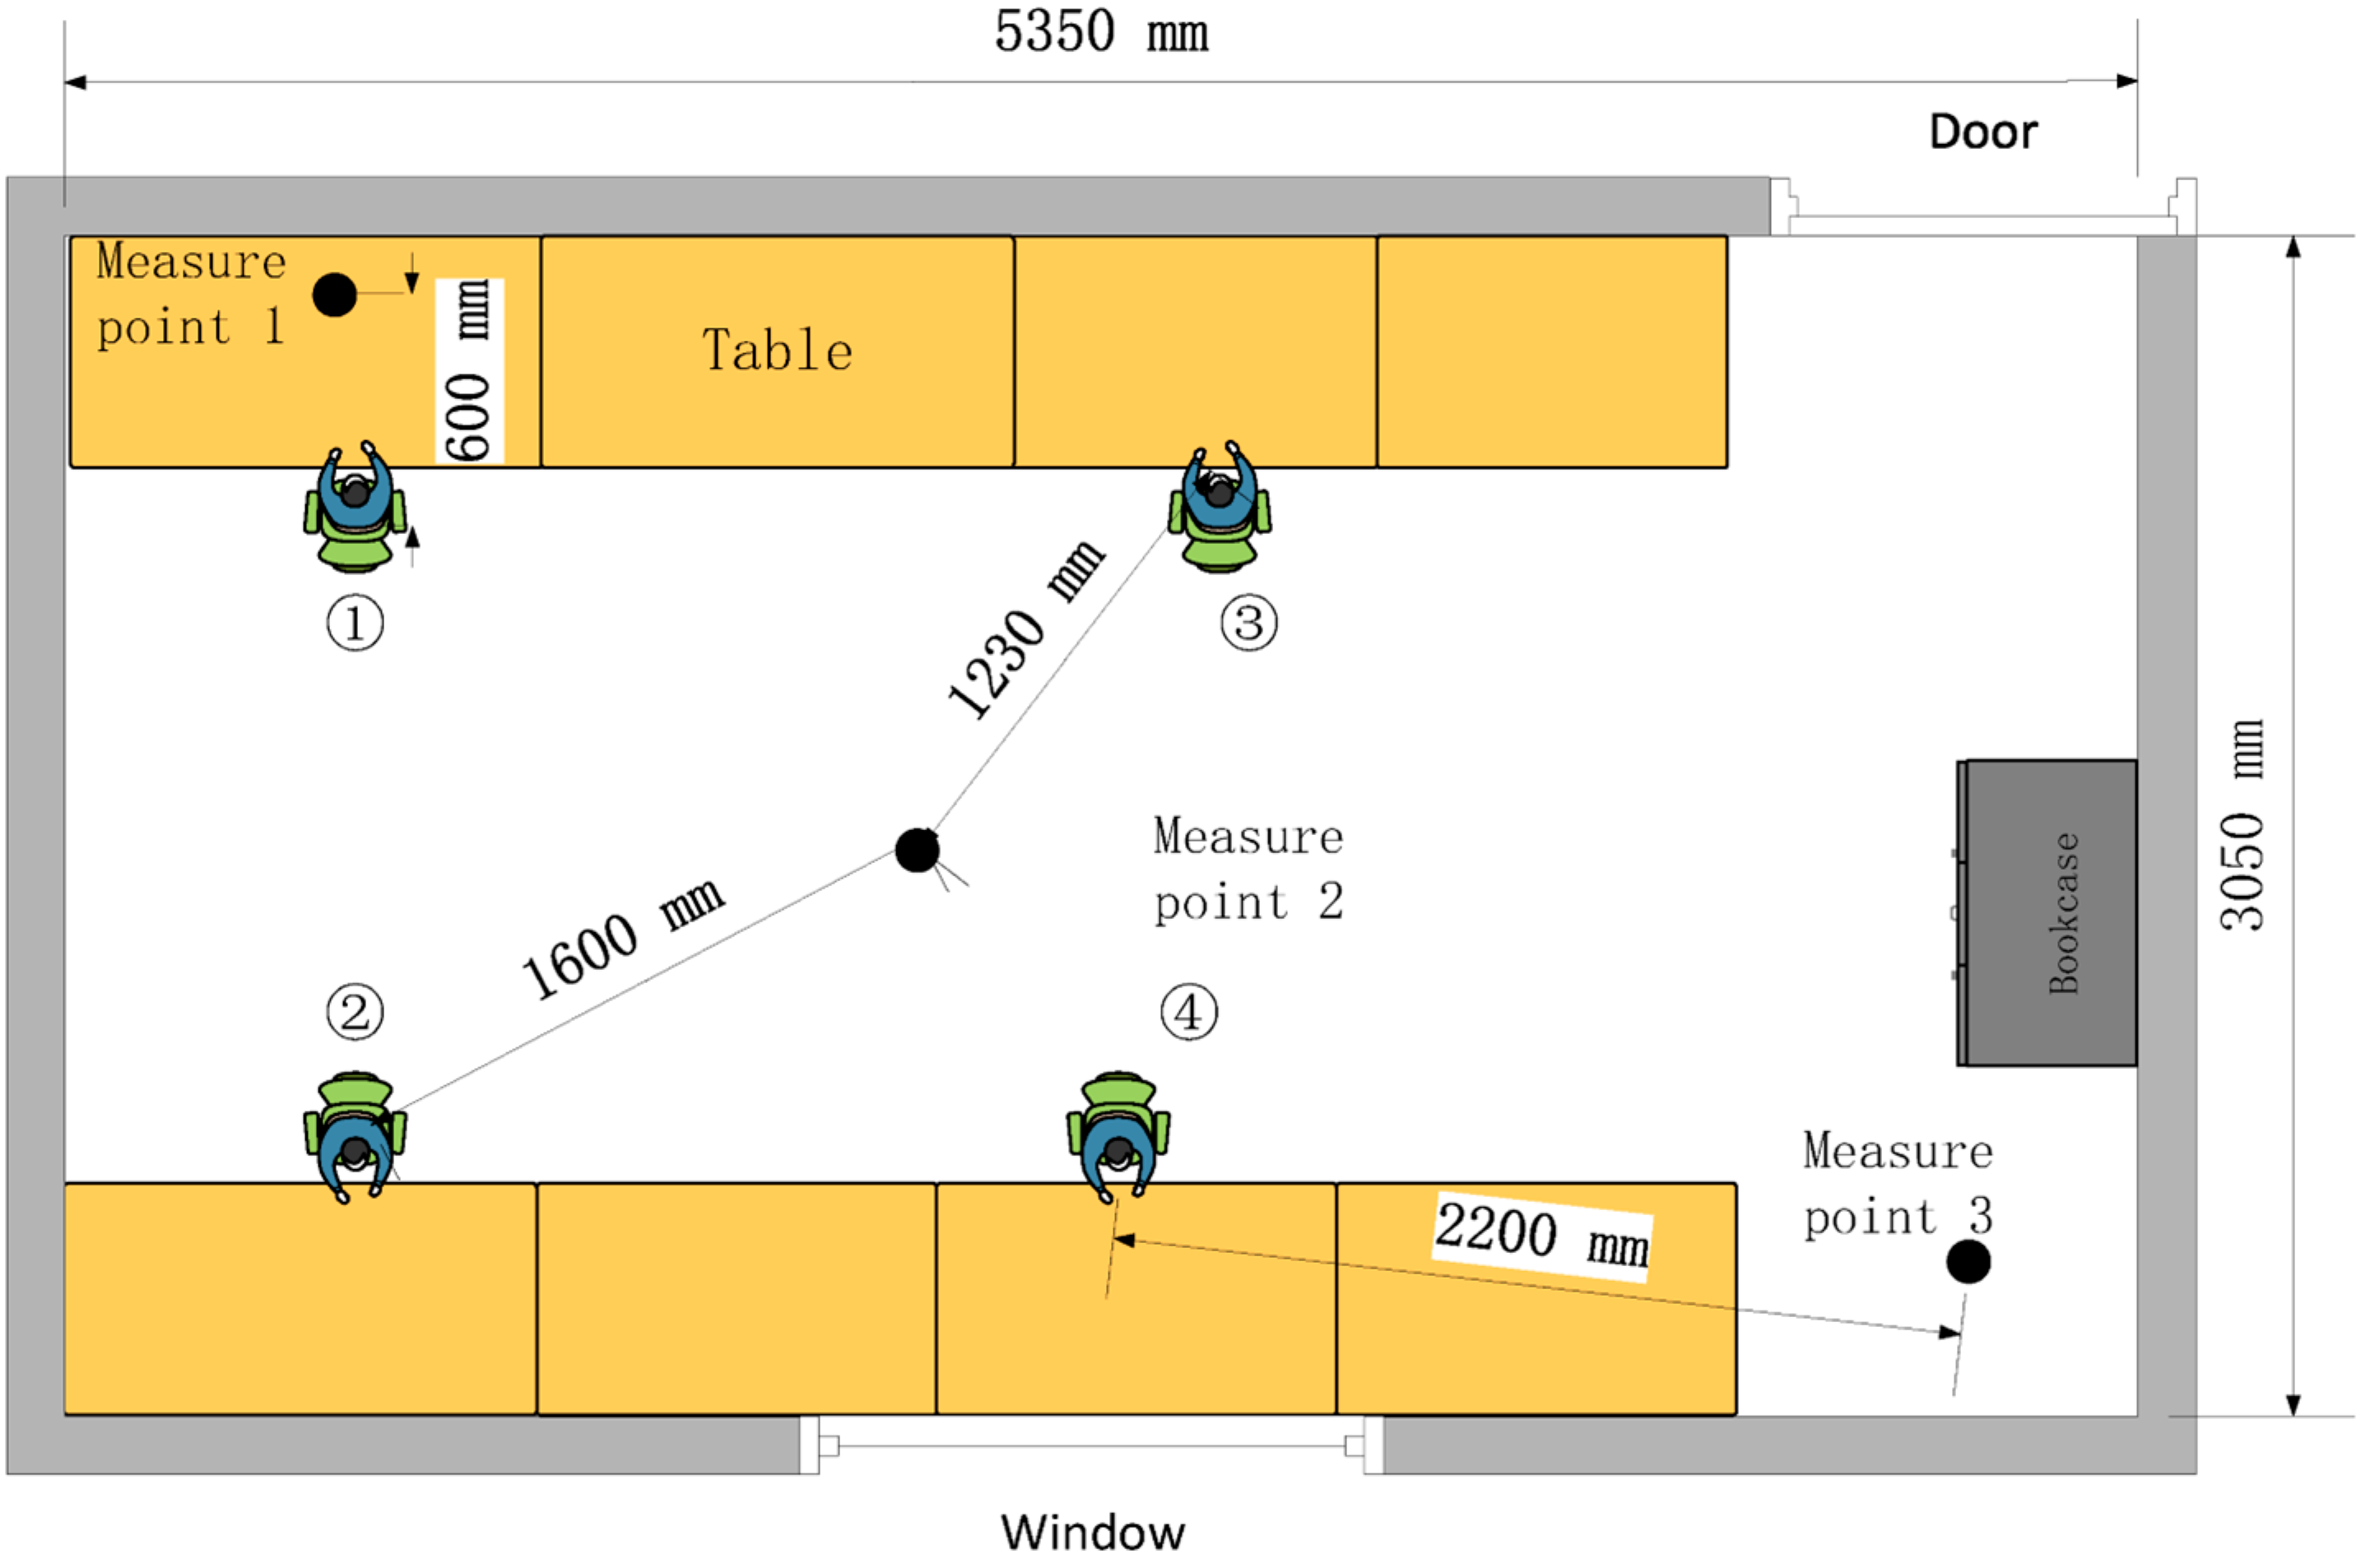
2.3. Experimental System for Field Measurement

This experiment used both SF6 and CO2 to measure the AER in a single and closed room. The experiment was conducted in a university office in Shanghai. The volume of the office was 44.9 m3 (5.35 m × 3.05 m × 2.739 m), and the room was equipped with ceiling fans for air mixing. The layout of the experimental room is shown in Figure 2. The three measuring points for SF6 and CO2 were coincided and were aligned along a diagonal of the room. The height of the measuring points was 0.8 m. A CO2 sensor and a sensor of external air velocity were also set up outdoors near the experimental room. The parameters of the sensors for SF6 and CO2 are shown in Table 4. All equipment and instruments were calibrated and intercalibrated before the experiment to ensure their reliability.
According to Cui and colleagues’ study, when CO2 is used as a tracer gas, the shortest measurement time should be longer than 8 min when the air change rate is 7.8 times/h [28]. In this experiment, the measurement duration was 1–1.5 h, which would meet the time requirement.
Before the experiment, the room was adequately ventilated to make sure that the indoor concentration of CO2 was equal to the outdoor CO2 concentration. All windows and doors were then closed, and SF6 was released. The fans were operated to ensure good mixing of room air and SF6. The time when to turn off the fan and turn on the sensor to test the concentration of the tracer gas was based on the experimental conditions. Since SF6 gas is a powerful greenhouse gas, its released amount is strictly controlled during the experiment (<30 ppm). To avoid its harm to human health and the environment, the released amount of SF6 during the experiment is lower than the recommended maximum value of 1000 ppm in the International Chemical Safety Cards [29].
The experimental conditions are shown in Table 5. The subjects were males and aged 20–30 years-old. During the experiment, all doors and windows were fully closed, and the personnel remained sitting and working without verbal communication. The temperature in the room was controlled between 20 and 25 °C, and the atmospheric pressure was 108.3 kPa. During each experiment, we made sure that no occupants stayed nearby and thus warranted that no heat and human metabolic CO2 were being infiltrated in the experimental room from the surrounding spaces.

2.4. Evaluation of the Uniformity of CO2 Distribution

To analyze the factors affecting the uniformity of CO2, the dispersion coefficient KC is proposed for quantitative evaluation. Suppose that the concentration of each sampling point at time τ is Cp(τ) (p = 1, 2, 3, 4, …, n), where n is the number of sampling points, then the average concentration of all measuring points at the same time is  C a ( τ ) ¯ . The overall standard deviation of the concentration at all measuring points τ is δCp(τ):
C a ( τ ) ¯ = p = 1 n C p ( τ ) n
δ C p ( τ ) = p = 1 n ( C p ( τ ) C a ( τ ) ¯ ) 2 n
Dispersion coefficient KC (τ) at time τ:
K c ( τ ) = δ C p ( τ ) C a ( τ ) ¯ × 100 %
Besides, the correlation between the dispersion coefficient and the measured volume per capita (calculated volume of the room/number of people) and the air change rate under the corresponding working conditions is established. The calculation method for the correlation coefficient is shown in Equation (11) (assuming X and Y are two variables):
r X Y = C o v ( X , Y ) Var [ X ] Var [ Y ]

3. Results and Discussion

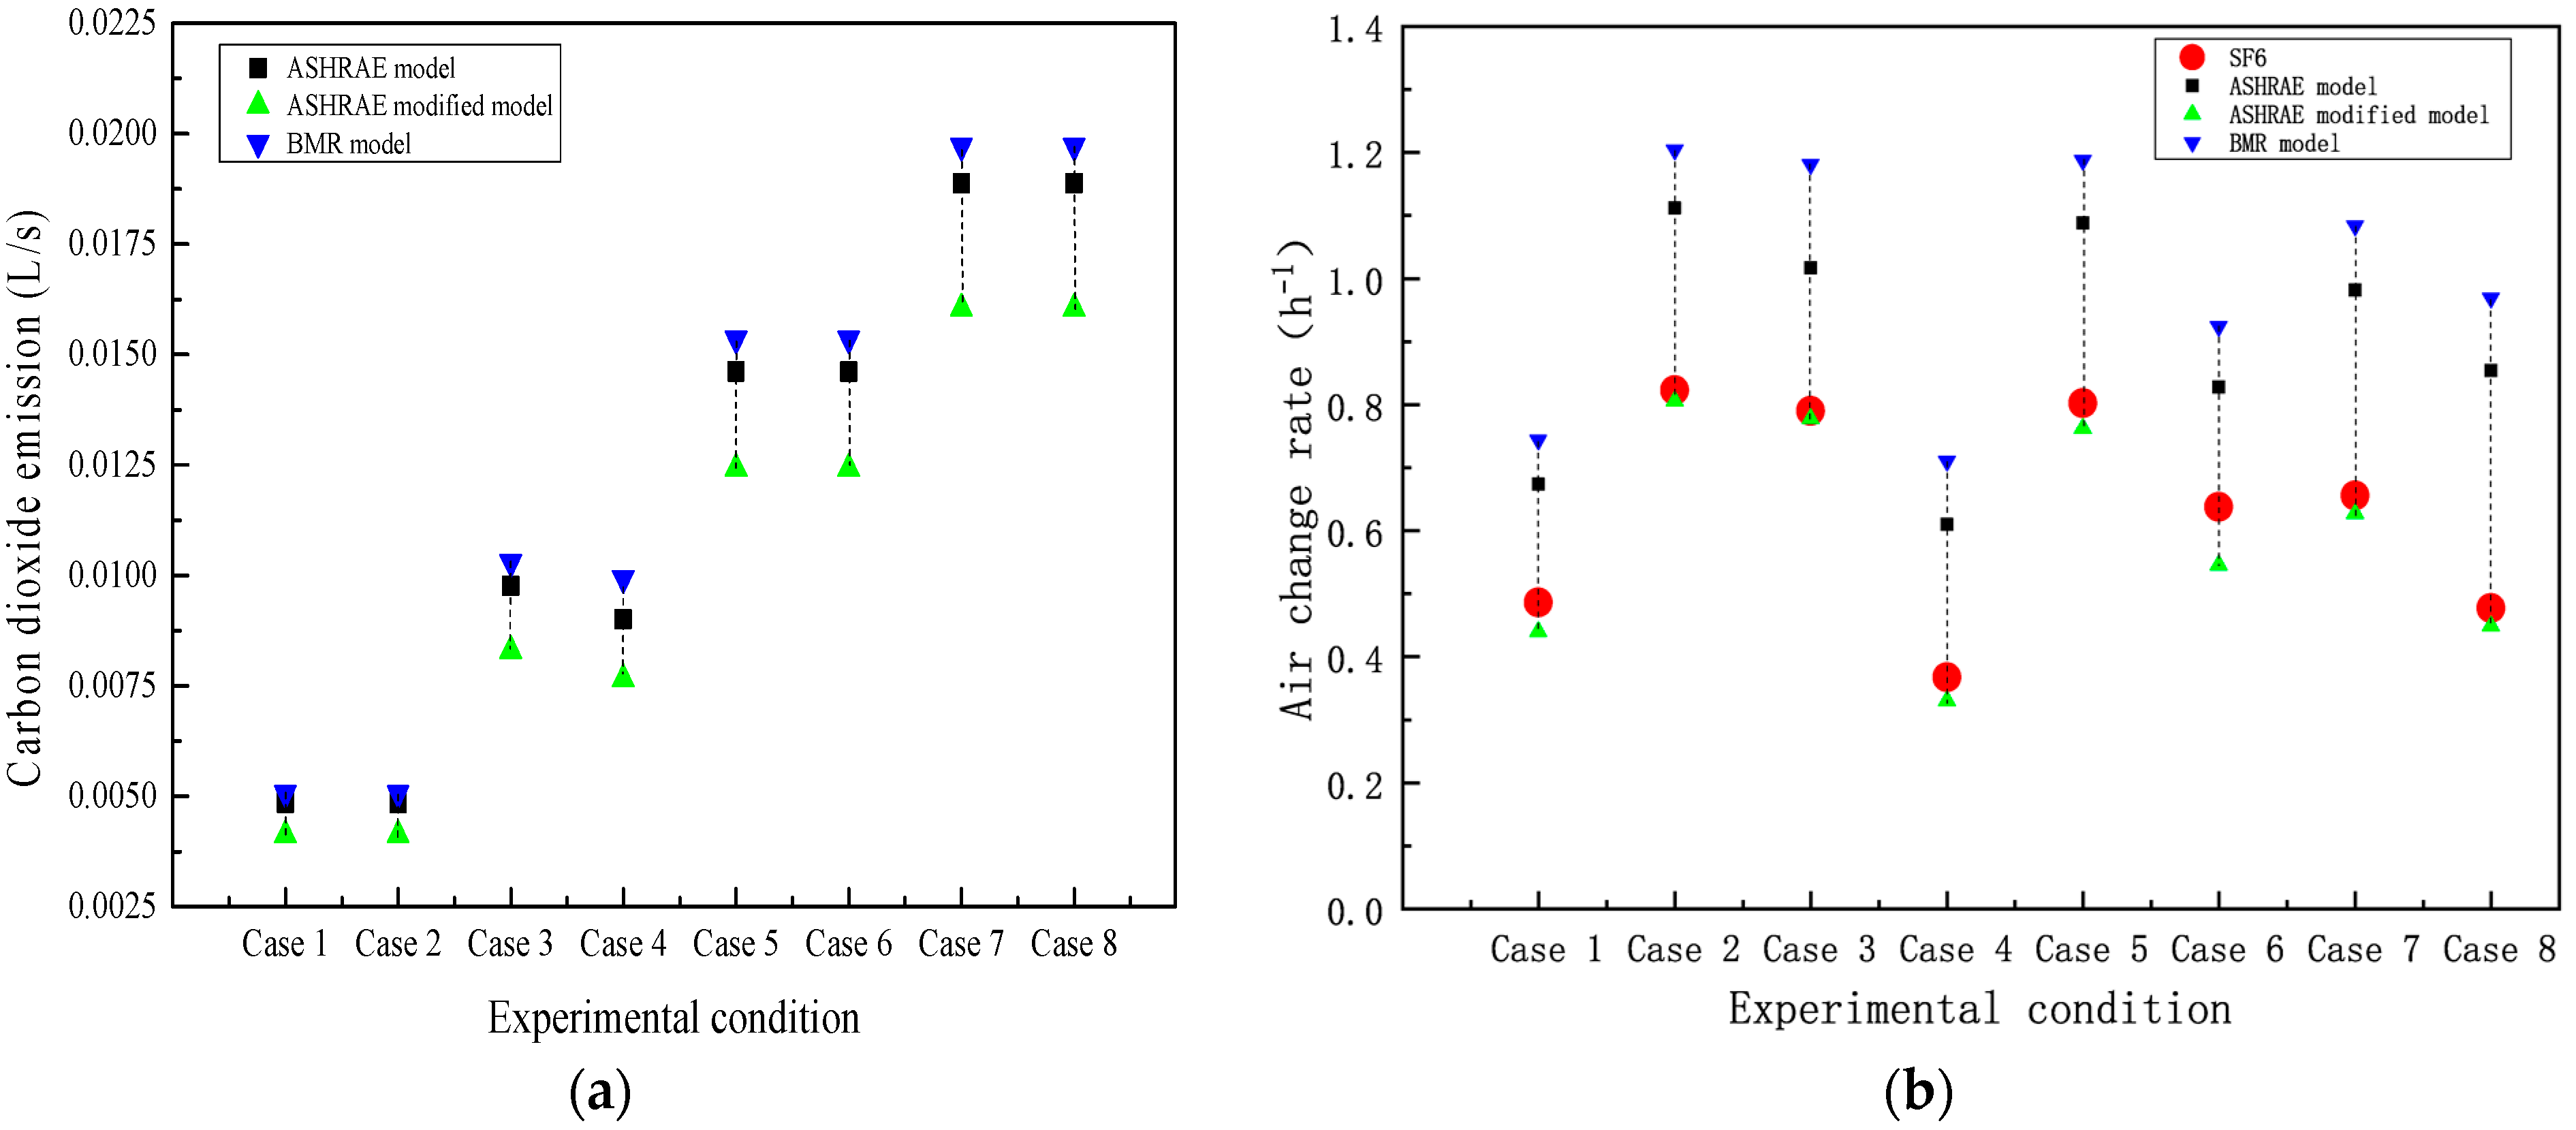
3.1. Deviations of AER Based on SF6 in Different Experimental Conditions

The critical element in the process of using tracer gas to measure the air change rate is to ensure the uniformity of tracer gas in the space. The indoor airflow decreases when the doors and windows are closed, so it is necessary to verify the uniformity of tracer gas. As a result, the concentration decay method was applied to verify the uniformity of SF6. The air change rate per hour ni was calculated using a regression calculation based on the data from each measurement point. The averaged air change rate per hour for the room was calculated from the three points  n ¯ . The processing results from the data and the corresponding deviations are shown in Table 6.
The test results in Table 6 show that the AER in the room is between 0.3 and 0.9 ACH (air changes per hour). When the fan is not turned on, the data from the individual measurement points show a greater degree of deviation. The maximum deviation reaches 15%, which is within the acceptable range. Additionally, it is of interest that the point where the maximum deviation occurs is not fixed, and this may be related to the location of the personnel and the unorganized airflow of indoor infiltration air, which may affect the human body as the tracer gas source of CO2. When the fan is turned on, the deviation between the measurements from each point is less than 2%.
The AER in this study is similar to several previous studies [14,17,30,31,32,33]. The study in the natural ventilated bedrooms of 202 residences in Guangzhou in China found that their AERs ranged from 0.05 to 1.32 ACH (mean: 0.41 ACH) [14]. A study in 15 bedrooms of a residential building in Portugal found that: when indoor mechanical extraction ventilation was on and off, their AERs ranged from 0.45 to 0.90 ACH and from 0.18 to 0.53 ACH, respectively [30]. The AERs in 500 bedrooms during the night among Danish preschoolers during sleeping averaged at 0.46 ACH (geometric mean). These ACH values are highly matched with our results in different situations.
Besides, our finding, that the AER deviations among different points are notably lower when an indoor ventilation fan is turned on than when an indoor ventilation fan is turned off, is also consistent with the previous studies [4,20]. This finding indicates that turning on the ventilation fan during the on-site experiment can make indoor tracer gas more uniform and thus improve the measurement accuracy of AER in a single room.

3.2. AER in Different CO2 Breathing Models

The determination of the model calculation parameters has a significant influence on the calculation results, and therefore, it is necessary to specify the value of each PARAMETER based on the on-site actual measurement conditions. The volume of the experimental room is 44.9 m3. After correcting for the space occupied by furniture and equipment, the calculated volume of the room is 40 m3. The room temperature is 28 °C, and the atmospheric pressure is 108.3 kPa.
During the experiment, the occupant kept sitting and working. According to the recommended values given in Table 1 and Table 3, the metabolic rate (M) is 65 W/m2 for the ASHRAE model and the ASHRAE modified model. A value of 1.45 is used in the BMR model as the physical activity ratio (PMR) for calculation. To improve the calculation accuracy, the CO2 calculation data are determined using the three-point average value at the same time. The calculation results are shown in Figure 3a.
According to results of the air change rate based on the different models shown in Figure 3b, there are clear differences between the three CO2-based models when compared with the results from the SF6 concentration decay method. The ASHRAE modified model has the most accurate result since the results from this model for all cases are closest to the values obtained when using SF6. Although the values from the ASHRAE modified model are slightly lower, with a −6.67% average deviation and a maximum −14.6% deviation, the calculation values are suitable for the requirements of engineering applications.
Besides, the estimated air change rates in cases 1, 4, and 8 are much lower than in other cases (Figure 3b). This result probably is related to the following reasons: (1) In cases 4 and 8, the fan was turned off, and thus, the estimated air change rates should be lower than the corresponding cases when the fan was turned on. (2) In case 1, although the fan was turned on, the outdoor wind speed (0.1 m/s) was much lower than in the corresponding case 2 (1.2 m/s). Therefore, the occupant-released CO2 was stored in the room, and the estimated air change rate in case 1 was much lower than in case 2. (3) It is important to note that the conditions for the above conclusions are based on preset model parameters, which included the M and PMR values. These two values relate to the activity state of the personnel in the room. During the measurement, it is difficult to rigorously control the long-term activity state of the personnel. In cases 1, 4, and 8, the occupants’ metabolism could be more active, and the released CO2 could be higher than in the corresponding cases.
Hence, to improve the estimation accuracy, it is necessary to closely monitor the activity states of occupants and to match these activities with the given Parameters in Table 1 and Table 3. However, the subjective matching process introduces certain uncertainties. Taking this experiment as an example, the values of M and PMR are determined by averaging the three typical activity states of personnel in an office (reading, typing, and filing), and these states cannot accurately represent the actual activity state of all occupants. With the development of technology, it is possible to use wearable devices to actually monitor the activity states of each occupant to further improve the accuracy of AER estimation using the CO2-based models.
On the other hand, the calculation results from the ASHRAE model and the BMR model show relatively large deviations from the SF6 concentration decay method. The average deviations using these two models reached 45.3% and 66.5%, respectively. In extreme cases, the deviations even exceed 100%, which significantly overestimates the CO2 release of personnel in the room. These findings are consistent with several previous studies [20,33,34,35], and further suggest that the ASHRAE modified model is the best model to estimate human CO2 release among Chinese people in the AER estimation of s single room in civil buildings.

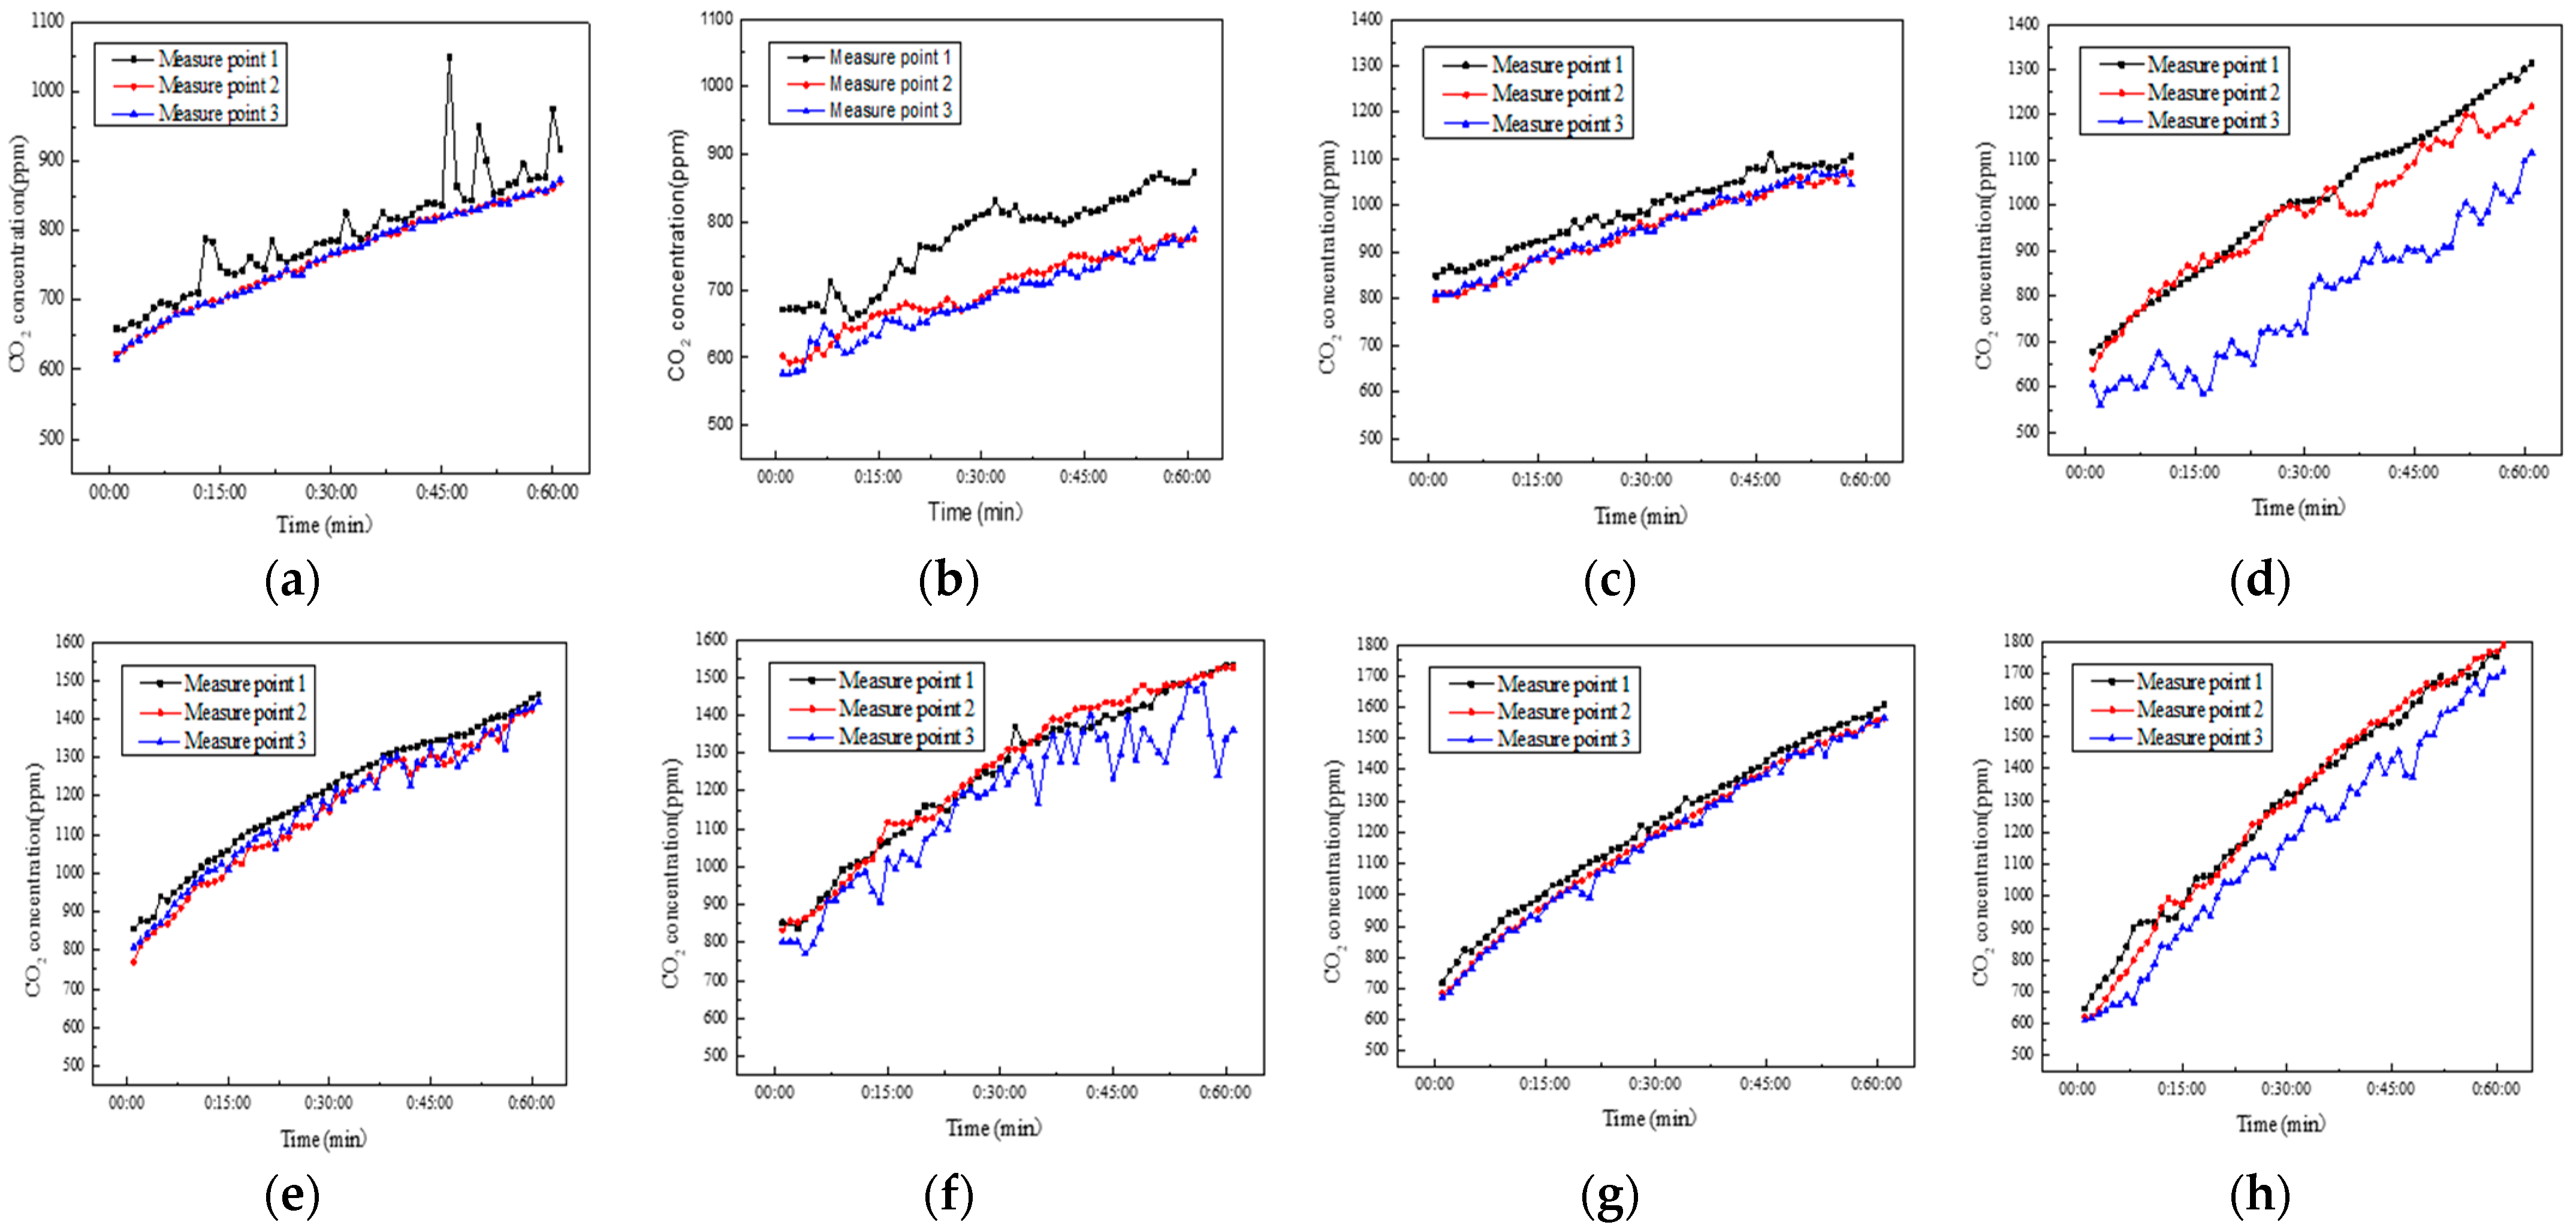
3.3. CO2 Concentration Uniformity in Different Conditions

According to Bulińska et al.’s research on the CO2 distribution generated by human breathing during sleep, the distribution of indoor CO2 concentration formed a radial shape that was centered on the human body [36]. Bulińska et al. also suggested to place the monitoring instrument in the center of the room to reduce measurement error [36]. However, actual measurement conditions could be influenced by many factors, such as room structure, personnel locations, outdoor wind speed, and external air direction. These factors could make the actual measurement become very complex. Given that the human breathing model still needs to be demonstrated. Here, we only discussed the concentration of CO2 at each point in the room. Figure 4 shows the measured CO2 data for the various cases.
In Figure 4, the measurements of CO2 concentration at each point also confirm the effect of fan operation. When the fan is turned on (cases 1, 3, 5, and 7), the CO2 concentrations at point 1 are relatively higher. There are two reasons for this. First, this measurement point is close to the wall. In Bulińska et al.’s study [36], it was also suggested that the measurement point should be set in the center of the room and should not be too close to the wall. The second is about the concept of the breathing zone. When the sensor is too close to the human body, that is, within the range of the human body’s breathing zone, the sensor is affected by the airflow produced by breathing, resulting in higher values. The influence is more obvious when the fan is turned off. As a result, when comparing the four cases (2, 4, 6, and 8) with the fan turned off, it is seen that the range of the breathing zone generated by a single person is limited in case 2. Consequently, the influence of the breathing zone only affects the data from measurement point 1 in case 2.
However, in the condition of case 8 where the number of personnel increases to two, the data from measurement points 1 and 2 vary considerably from that for measurement point 3. In cases 6 and 8, the data from measurement point 3 approach the value at measurement point 1 due to the influence of the increased number of personnel, but there are some obvious fluctuations. These could be attributed to irregular wind seepage through the window gaps and the weakened breathing zone. After calculation, when the doors and windows are closed, the breathing zone of a single person is within 1.3–1.5 m, and the overlapping range for two people exceeds 2 m. Hence, it is recommended that the measuring point locations should be set reasonably according to the number and location of the personnel. When onsite conditions do not permit multipoint measurement and it is not possible to increase mixing, the sensor should be placed in the center of the experimental room, and the personnel should be dispersed to improve the measurement accuracy.
The mean value of the dispersion coefficient KC(τ) at all times for a certain experimental condition is taken to obtain the dispersion coefficient KC, which is used to describe the uniformity of CO2 distribution in this case or experimental condition (Table 7). It shows that the dispersion coefficients in the cases when the indoor fan is turned on are significantly lower than in the cases when the indoor fan is turned off. These findings on CO2 concentration uniformity in a single room in different conditions agree with previous similar studies [20,35,37,38,39,40].
The correlation analysis results in Figure 5 also show that when the fan is turned off, the degree of dispersal of CO2 has a certain correlation to the measured volume per capita; that is, as the number of people increases, the indoor CO2 distribution becomes more uniform. At the same time, the air change rate has practically no influence on the uniformity of the CO2 distribution. However, when the fan is turned off, the conditions change and the air change rate plays an important role in the distribution of CO2 in the room. The lower the air change rate, the less uniform the distribution of CO2 in the space. This increases the influence of random indoor infiltration air on the air circulation. Consequently, it is recommended that the number of personnel should be increased to improve the uniformity of indoor CO2 distribution during the on-site experiment.
In summary, our findings indicate that using a fan to stir indoor air and adding indoor occupants during the on-site CO2 measurement are effective methods to increase the CO2 concentration uniformity in different conditions.

3.4. AER Deviation among Different Measuring Points

The above calculation results show that when the model parameters are set reasonably and the three-point average value of CO2 is substituted into the ASHRAE modified model, the deviation in air change rate is less than 15% compared with SF6. As a result, it is recommended to use multipoint measurement or fan stirring to improve measurement accuracy. However, in most conditions, the method is limited by the quantity of equipment and on-site conditions, which may not meet the above requirements. Therefore, Table 8 shows the calculation results for a single measurement point when using the ASHRAE modified model to evaluate the calculation stability of the modified model using a single measurement point.
The results in Table 8 show a considerable improvement in accuracy when the fan is turned on. Measurement point 2 demonstrates the most accurate results when the fan is turned on. The average deviation is controlled within ±10% for four cases. Measurement point 1 is within the range of the frontal breathing zone, and the calculation results are generally low but can be controlled within 15%. When the fan is turned off, the calculation results at all measurement points increase. Due to the combined influence of the number of personnel and the number of air changes, the calculation results for case 4 show a considerable deviation with values exceeding 50%. Therefore, the calculation results for case 4 are excluded. As a result, the final average deviation for measuring points 1, 2, and 3 are −15.1%, −15%, and 18.2%, respectively, which can meet the requirements for engineering measurement. At the same time, similar to SF6 in this study and findings in some previous studies [20,38], it is shown that the calculation deviation of CO2 does not show a significant correlation with the measurement location, indicating the random flow of infiltration air into the closed room.
Overall, when the fan is turned on, the calculation deviation in the center of the room can be controlled to within 10%. Without fan mixing, the average deviation at the midpoint position is −26.3%, and this may exceed 50% in some unfavorable scenarios. These findings are consistent with some previous studies [38,40]. Specifically, several studies have summarized the uncertainty sources of human metabolic CO2-based models including unstable ventilation rates in the actual buildings, nonhomogeneous mixing of CO2 in indoor space, errors in CO2 measurement during the on-site experiment, and errors in the estimated CO2 emission [20,40]. Here, unstable ventilation rates in the actual buildings and errors in CO2 measurement during the on-site experiment are common in the tracer gas methods. Due to the fact that the real release dose of CO2 is unable to be precisely controlled, nonhomogeneous mixing of CO2 in indoor space is more critical for human metabolic CO2-based methods. Therefore, as in the findings we have discussed in the above sections, to reduce nonhomogeneous mixing of CO2, it is also recommended to use a fan to stir indoor air during the on-site CO2 measurement.

4. Conclusions

This study analyzed the distribution of the tracer gases SF6 and CO2 in a single closed room and the influence of the human breathing zone on the sampling of the latter based on experimental data measurements in a single room in China. The article also discussed the effect of using different human metabolic CO2-based models to estimate the AER in a single room. Finally, the calculation deviations for single measuring point data for different conditions were compared. Our findings indicated that:
(1) The AER is low when the doors and windows are closed. Fan mixing plays an important role in the uniformity of tracer gases. In comparison with the average three-point calculation result, using a fan could decrease the calculation deviation for SF6 from 5% to 0.6% and controlled the maximum deviation from within 15% to within 2% in a single room in China.
(2) The analysis of the data for the uniformity of CO2 distribution in the room shows that measurement accuracy can be improved by placing the measuring equipment in the center of the room and scattering personnel. The breathing zone of a single person is from 1.3 to 1.5 m, and the overlapping range of double breathing zones exceeds 2 m in a single room in China.
(3) Using reasonable preset experimental parameters, the calculation effect of the ASHRAE China-specific modified model is the best of the three models. The largest deviation of the ASHRAE China-specific modified model is less than 15%, and the average deviation is −6.6%. This model can meet the requirements for engineering applications in China. The ASHRAE model and the BMR model both overestimate the amount of CO2 released by personnel, with average measurement deviations of 45.3% and 62.9%, respectively.
(4) The calculation results using a single measurement point with the ASHRAE China-specific modified model show that the midpoint calculation deviation is less than 10% when the fan is turned on. When the fan is turned off, all measurement points have a relatively large degree of deviation. The average deviation at the midpoint position is −15%, and the maximum deviation is about −32%. It is recommended to take necessary stirring measures in any follow-up study to improve the measurement accuracy.

Author Contributions

Conceptualization, H.Z. and Z.Z. (Zhijun Zou); methodology, H.Z. and Z.Z. (Zhijun Zou); software, H.Z., Z.Z. (Zhijun Zou), L.W., Z.Z. (Zhenyang Zhao) and X.G.; validation, H.Z., Z.Z. (Zhijun Zou), L.W., Z.Z. (Zhenyang Zhao), X.G., J.C. and W.L.; formal analysis, H.Z. and Z.Z. (Zhijun Zou); investigation, H.Z., Z.Z. (Zhijun Zou), L.W., Z.Z. (Zhenyang Zhao) and X.G.; resources, Z.Z. (Zhijun Zou); data curation, H.Z., Z.Z. (Zhijun Zou), L.W., Z.Z. (Zhenyang Zhao) and X.G.; writing—original draft preparation, H.Z., Z.Z. (Zhijun Zou), J.C. and W.L.; writing—review and editing, Z.Z. (Zhijun Zou), J.C. and W.L.; visualization, H.Z., Z.Z. (Zhijun Zou), J.C. and W.L.; supervision, Z.Z. (Zhijun Zou); project administration, Z.Z. (Zhijun Zou); funding acquisition, Z.Z. (Zhijun Zou) and W.L. All authors have read and agreed to the published version of the manuscript.

Funding

This research was funded by the National Key Research and Development Program (2017YFC0702700) and the National Natural Science Foundation of China (51708347).

Institutional Review Board Statement

Not applicable.

Informed Consent Statement

Not applicable.

Data Availability Statement

Not applicable.

Conflicts of Interest

The authors declare no conflict of interest. The funders had no role in the design of the study; in the collection, analyses, or interpretation of data; in the writing of the manuscript; or in the decision to publish the results.

References

  1. Ji, Y.; Duanmu, L.; Liu, Y.; Dong, H. Air infiltration rate of typical zones of public buildings under natural conditions. Sustain. Cities Soc. 2020, 61, 102290. [Google Scholar] [CrossRef]
  2. Lu, Y.; Xiang, Y.; Chen, G.; Liu, J.; Wang, Y. On-site measurement and zonal simulation on winter indoor environment and air infiltration in an atrium in a severe cold region. Energy Build. 2020, 223, 110160. [Google Scholar] [CrossRef]
  3. Fernández-Agüera, J.; Domínguez-Amarillo, S.; Alonso, C.; Martín-Consuegra, F. Thermal comfort and indoor air quality in low-income housing in Spain: The influence of airtightness and occupant behaviour. Energy Build. 2019, 199, 102–114. [Google Scholar] [CrossRef]
  4. Sherman, M.H. Tracer-gas techniques for measuring ventilation in a single zone. Build. Environ. 1990, 25, 365–374. [Google Scholar] [CrossRef]
  5. Air infiltration and Ventilation Centre. Available online: https://www.aivc.org/ (accessed on 6 December 2022).
  6. Ikeguchi, A.; Hideki, M. Measurement method of ventilation rate with tracer gas method in open type livestock houses. In Proceedings of the XVIIth World Congress of the International Commission of Agricultural Engineering, Québec City, QC, Canada, 13–17 June 2010. [Google Scholar]
  7. Caciolo, M.; Stabat, P.; Marchio, D. Full scale experimental study of single-sided ventilation: Analysis of stack and wind effects. Energy Build. 2011, 43, 1765–1773. [Google Scholar] [CrossRef]
  8. Laporthe, S.; Virgone, J.; Castanet, S. A comparative study of two tracer gases: SF6 and N2O. Build. Environ. 2001, 36, 313–320. [Google Scholar] [CrossRef]
  9. Johnson, T.; Myers, J.; Kelly, T.; Wisbith, A.; Ollison, W. A pilot study using scripted ventilation conditions to identify key factors affecting indoor pollutant concentration and air exchange rate in a residence. J. Expo. Sci. Environ. Epidemiol. 2004, 14, 1–22. [Google Scholar] [CrossRef]
  10. Shi, Y.P.; Zou, Z.J.; Huang, C. Test Effect of Different Tracer Gases on Room Ventilation. Build. Energy Effic. 2019, 47, 66–69. (In Chinese) [Google Scholar]
  11. Yu, J. Progress in Alternative Technology of Greenhouse Gas Sulfur Hexafluoride. Chem. Propellants Polym. Mater. 2012, 10, 41–48. (In Chinese) [Google Scholar]
  12. Hou, J.; Zhang, Y.; Sun, Y.; Wang, P.; Zhang, Q.; Kong, X.; Sundell, J. Air change rates at night in northeast Chinese homes. Build. Environ. 2018, 132, 273–281. [Google Scholar] [CrossRef]
  13. Zhang, W.; Wang, L.; Ji, Z.; Ma, L.; Hui, Y. Test on ventilation rates of dormitories and offices in university by the CO2 tracer gas method. Procedia Eng. 2015, 121, 662–666. [Google Scholar] [CrossRef]
  14. Cheng, P.L.; Li, X.F. Air infiltration rates in the bedrooms of 202 residences and estimated parametric infiltration rate distribution in Guangzhou, China. Energy Build. 2018, 164, 219–225. [Google Scholar] [CrossRef]
  15. Ing, P.Š. Experimental Evaluation of Ventilation in Dwellings by Tracer Gas CO2. Ph.D. Thesis, Czech Technical University, Prague, Czech Republic, 2011. [Google Scholar]
  16. Bekö, G.; Gustavsen, S.; Frederiksen, M.; Bergsøe, N.C.; Kolarik, B.; Gunnarsen, L.; Toftum, J.; Clausen, G. Diurnal and seasonal variation in air exchange rates and interzonal airflows measured by active and passive tracer gas in homes. Build. Environ. 2016, 104, 178–187. [Google Scholar] [CrossRef]
  17. Smith, P.N. Determination of ventilation rates in occupied buildings from metabolic CO2 concentrations and production rates. Build. Environ. 1988, 23, 95–102. [Google Scholar] [CrossRef]
  18. Mahyuddin, N.; Awbi, H. A review of CO2 measurement procedures in ventilation research. Int. J. Vent. 2012, 10, 353–370. [Google Scholar]
  19. ASHRAE. Handbook-Fundamentals; American Society of Heating, Refrigerating and Air Conditioning Engineers Inc.: Atlanta, GA, USA, 2017. [Google Scholar]
  20. Remion, G.; Moujalled, B.; El Mankibi, M. Review of tracer gas-based methods for the characterization of natural ventilation performance: Comparative analysis of their accuracy. Build. Environ. 2019, 160, 106180. [Google Scholar] [CrossRef]
  21. Zou, Z.J.; Liang, Y.; Wang, X. Experimental investigation on CO2 concentration by human activities. J. Cent. South Univ. Sci. Technol. 2012, 43, 62. (In Chinese) [Google Scholar]
  22. Qi, M.W.; Li, X.F.; Huang, H. Discussion on measuring ventilation rates of dorms through tracer gas method with human body as CO2 release source. Build. Sci. 2013, 29, 52–57. (In Chinese) [Google Scholar]
  23. Qi, M.W.; Li, X.F.; Weschler, L.B.; Sundell, J. CO2 generation rate in Chinese people. Indoor Air 2014, 24, 559–566. [Google Scholar] [CrossRef]
  24. Persily, A.; de Jonge, L. Carbon dioxide generation rates for building occupants. Indoor Air 2017, 27, 868–879. [Google Scholar] [CrossRef]
  25. Nishi, Y.J. Chapter 2: Measurement of Thermal Balance of Man. Stud. Environ. Sci. 1981, 10, 29–39. [Google Scholar]
  26. Du, B.D.; Du, B.E.F. A formula to estimate the approximate surface area if height and weight be known. 1916. Nutrition 1989, 5, 303–311. [Google Scholar]
  27. FAO. Requirements HE. Report of a Joint FAO/WHO/UNU Expert Consultation Geneva: Food and Agriculture Organization of the United Nations; Food and Nutrition Technical Report Series 1; FAO: Rome, Italy, 2001. [Google Scholar]
  28. Cui, S.; Cohen, M.; Stabat, P.; Marchio, D. CO2 tracer gas concentration decay method for measuring air change rate. Build. Environ. 2015, 84, 162–169. [Google Scholar] [CrossRef]
  29. International Chemical Safety Card. Sulfur Hexafluoride. Available online: http://icsc.brici.ac.cn/card.asp?text01=0571&hid1=icsc_id&botton01=%E6%9F%A5%E8%AF%A (accessed on 3 February 2023).
  30. Pereira, P.F.; Ramos, N.M.M. The impact of mechanical ventilation operation strategies on indoor CO2 concentration and air exchange rates in residential buildings. Indoor Built Environ. 2021, 30, 1516–1530. [Google Scholar] [CrossRef]
  31. Dimitroulopoulou, C. Ventilation in European dwellings: A review. Build. Environ. 2012, 47, 109–125. [Google Scholar] [CrossRef]
  32. Bekö, G.; Lund, T.; Nors, F.; Toftum, J.; Clausen, G. Ventilation rates in the bedrooms of 500 Danish children. Build. Environ. 2010, 45, 2289–2295. [Google Scholar] [CrossRef]
  33. Nowak, K.; Nowak-Dzieszko, K.; Marcinowski, A. Analysis of ventilation air exchange rate and indoor air quality in the office room using metabolically generated CO2. IOP Conf. Series Mater. Sci. Eng. 2018, 415, 012028. [Google Scholar] [CrossRef]
  34. Men, C.; Wang, S.; Zou, Z. Experimental study on tracer gas method for building infiltration rate measurement. Build. Serv. Eng. Res. Technol. 2020, 41, 745–757. [Google Scholar] [CrossRef]
  35. Batterman, S. Review and extension of CO2-based methods to determine ventilation rates with application to school classrooms. Int. J. Environ. Res. Public Health 2017, 14, 145. [Google Scholar] [CrossRef]
  36. Bulińska, A.; Popiołek, Z.; Buliński, Z. Experimentally validated CFD analysis on sampling region determination of average indoor carbon dioxide concentration in occupied space. Build. Environ. 2014, 72, 319–331. [Google Scholar] [CrossRef]
  37. Duarte, R.; Glória-Gomes, M.; Moret-Rodrigues, A. Estimating ventilation rates in a window-aired room using Kalman filtering and considering uncertain measurements of occupancy and CO2 concentration. Build. Environ. 2018, 143, 691–700. [Google Scholar] [CrossRef]
  38. Lu, T.; Knuutila, A.; Viljanen, M.; Lu, X. A novel methodology for estimating space air change rates and occupant CO2 generation rates from measurements in mechanically-ventilated buildings. Build. Environ. 2010, 45, 1161–1172. [Google Scholar] [CrossRef]
  39. Turanjanin, V.; Vučićević, B.; Jovanović, M.; Mirkov, N.; Lazović, I. Indoor CO2 measurements in Serbian schools and ventilation rate calculation. Energy 2014, 77, 290–296. [Google Scholar] [CrossRef]
  40. Gough, H.; Luo, Z.; Halios, C.; King, M.-F.; Noakes, C.; Grimmond, C.; Barlow, J.; Hoxey, R.; Quinn, A. Field measurement of natural ventilation rate in an idealised full-scale building located in a staggered urban array: Comparison between tracer gas and pressure-based methods. Build. Environ. 2018, 137, 246–256. [Google Scholar] [CrossRef]
Figure 1. Schematic diagram of the tracer gas measurement room.
Buildings 13 00459 g001
Figure 2. Layout of the experimental room. The black dots indicate measure points. The numbers ①–④ mark the staff position.
Buildings 13 00459 g002
Figure 3. The CO2 release rates and estimated air change rates in different models and in different experimental conditions (M = 65 W/m2, PMR = 1.45). (a) CO2 release rate; (b) estimated air exchange rate (AER).
Buildings 13 00459 g003
Figure 4. CO2 concentrations in different points in different cases. (a) Case 1, (b) case 2, (c) case 3, (d) case 4, (e) case 5, (f) case 6, (g) case 7, (h) case 8.
Buildings 13 00459 g004
Figure 5. Correlation analysis results.
Buildings 13 00459 g005
Table 1. Typical metabolic heat generation for various activities.
ActivityMetabolic Rate (W/m2) 1
Sleeping40
Reading, seated55
Typing, seated65
Filing, seated70
Standing, relaxed70
Walking about100
1 The data come from the ASHRAE Handbook [19].
Table 2. Schofield BMR values (W is body mass in units of kg) [24].
AgeFemaleMale
0–30.244 W − 0.1300.249 W − 0.127
3–100.085 W + 2.0330.095 W + 2.110
10–180.056 W + 2.8980.074 W + 2.754
18–300.062 W + 2.0360.063 W + 2.896
30–600.034 W + 3.5380.048 W + 3.653
≥600.038 W + 2.7550.049 W + 2.459
Table 3. PAR values for various activities [27].
ActivityFemaleMale
Sleeping1.01.0
Office worker—reading1.51.3
Office worker—typing1.81.8
Office worker—filing1.51.3
Standing1.51.4
Walking around/strolling2.52.1
Table 4. The sensor Parameters.
Gas TypeEquipment ModelAccuracyRangeSampling Interval
CO2Testo 160 IAQ±50 ppm0–5000 ppm1 min
SF6INNOVA 1412----1.5 min
Table 5. The experimental conditions.
Experimental ConditionOccupant NumberFanStaff Position
(Marked in Figure 2)
Case 11ON
Case 21OFF
Case 32ON①②
Case 42OFF①②
Case 53ON①②③
Case 63OFF①②③
Case 74ON①②③④
Case 84OFF①②③④
Table 6. Estimated results and deviations of AER in different experimental conditions based on SF6.
Experimental ConditionFanMean ACHMeasure Point 1Measure Point 2Measure Point 3
ACHDeviationACHDeviationACHDeviation
Case 1ON0.486 0.495 1.85%0.483 −0.62%0.479 −1.44%
Case 2OFF0.823 0.893 8.51%0.814 −1.09%0.764 −7.17%
Case 3ON0.790 0.789 −0.13%0.785 −0.63%0.799 1.14%
Case 4OFF0.368 0.357 −2.99%0.354 −3.80%0.394 7.09%
Case 5ON0.802 0.800 −0.25%0.802 0.00%0.802 0.00%
Case 6OFF0.638 0.627 −1.72%0.640 0.31%0.645 1.10%
Case 7ON0.656 0.656 0.00%0.650 −0.91%0.661 0.76%
Case 8OFF0.477 0.438 −8.18%0.548 14.88%0.446 −6.50%
Note: Deviation calculation formula: deviation = (ni −  n ¯ )/ n ¯ .
Table 7. Dispersion coefficient KC at various experimental conditions.
NumberCase 1Case 2Case 3Case 4Case 5Case 6Case 7Case 8
KC2.04%5.56%2.11%10.80%1.96%3.14%1.93%4.85%
Table 8. AER calculation results using a single measurement point in the ASHRAE modified model.
Experimental
Condition
SF6
ACH
Measure Point 1Measure Point 2Measure Point 3
ACHDeviationACHDeviationACHDeviation
Case 10.4860.43−10.98%0.46−5.26%0.43−11.67%
Case 20.8230.65−21.41%0.9616.25%0.9313.34%
Case 30.7900.70−11.93%0.835.03%0.76−3.21%
Case 40.3680.15−58.40%0.15−60.29%0.94155.17%
Case 50.8020.77−3.62%0.73−8.79%0.78−2.71%
Case 60.6380.53−16.92%0.45−29.11%0.663.86%
Case 70.6560.60−8.60%0.64−2.48%0.64−1.96%
Case 80.4770.44−7.03%0.32−32.17%0.6537.31%
Disclaimer/Publisher’s Note: The statements, opinions and data contained in all publications are solely those of the individual author(s) and contributor(s) and not of MDPI and/or the editor(s). MDPI and/or the editor(s) disclaim responsibility for any injury to people or property resulting from any ideas, methods, instructions or products referred to in the content.

