
Exploring the Potential of iPad-LiDAR Technology for Building Renovation Diagnosis: A Case Study


Abstract
:1. Introduction
2. Method
3. Literature Review
3.1. Twining Green and Digital
3.2. Waste Audit
3.3. The LiDAR Technology
3.4. LiDAR for Diagnosis and Renovation Using iPad
4. Experiment/Case Study
4.1. Case Presentation and Objectives
4.2. Mobile Device Characterization
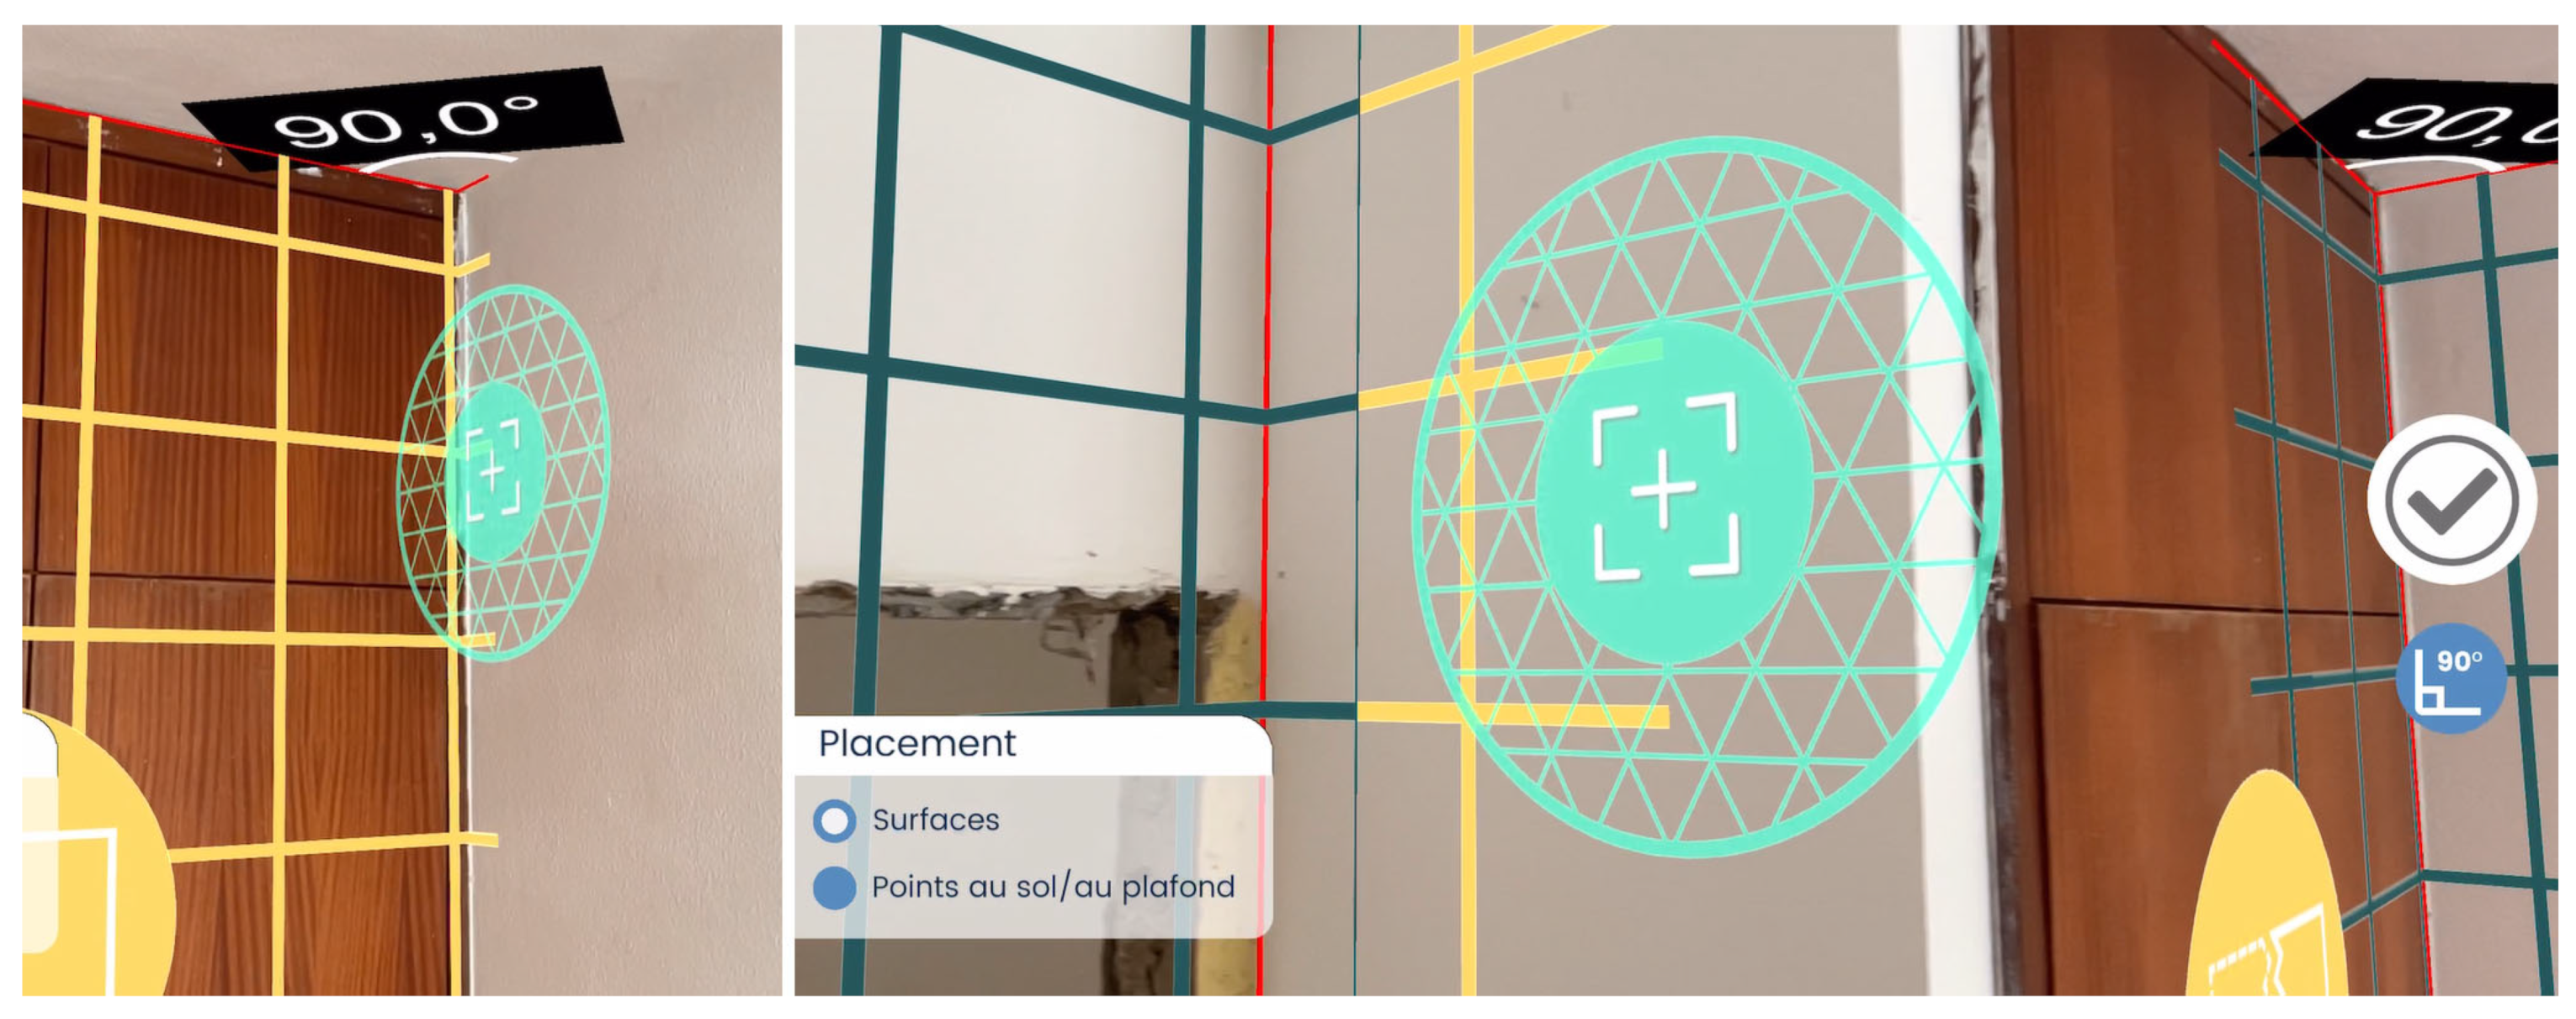
4.3. Scan Process
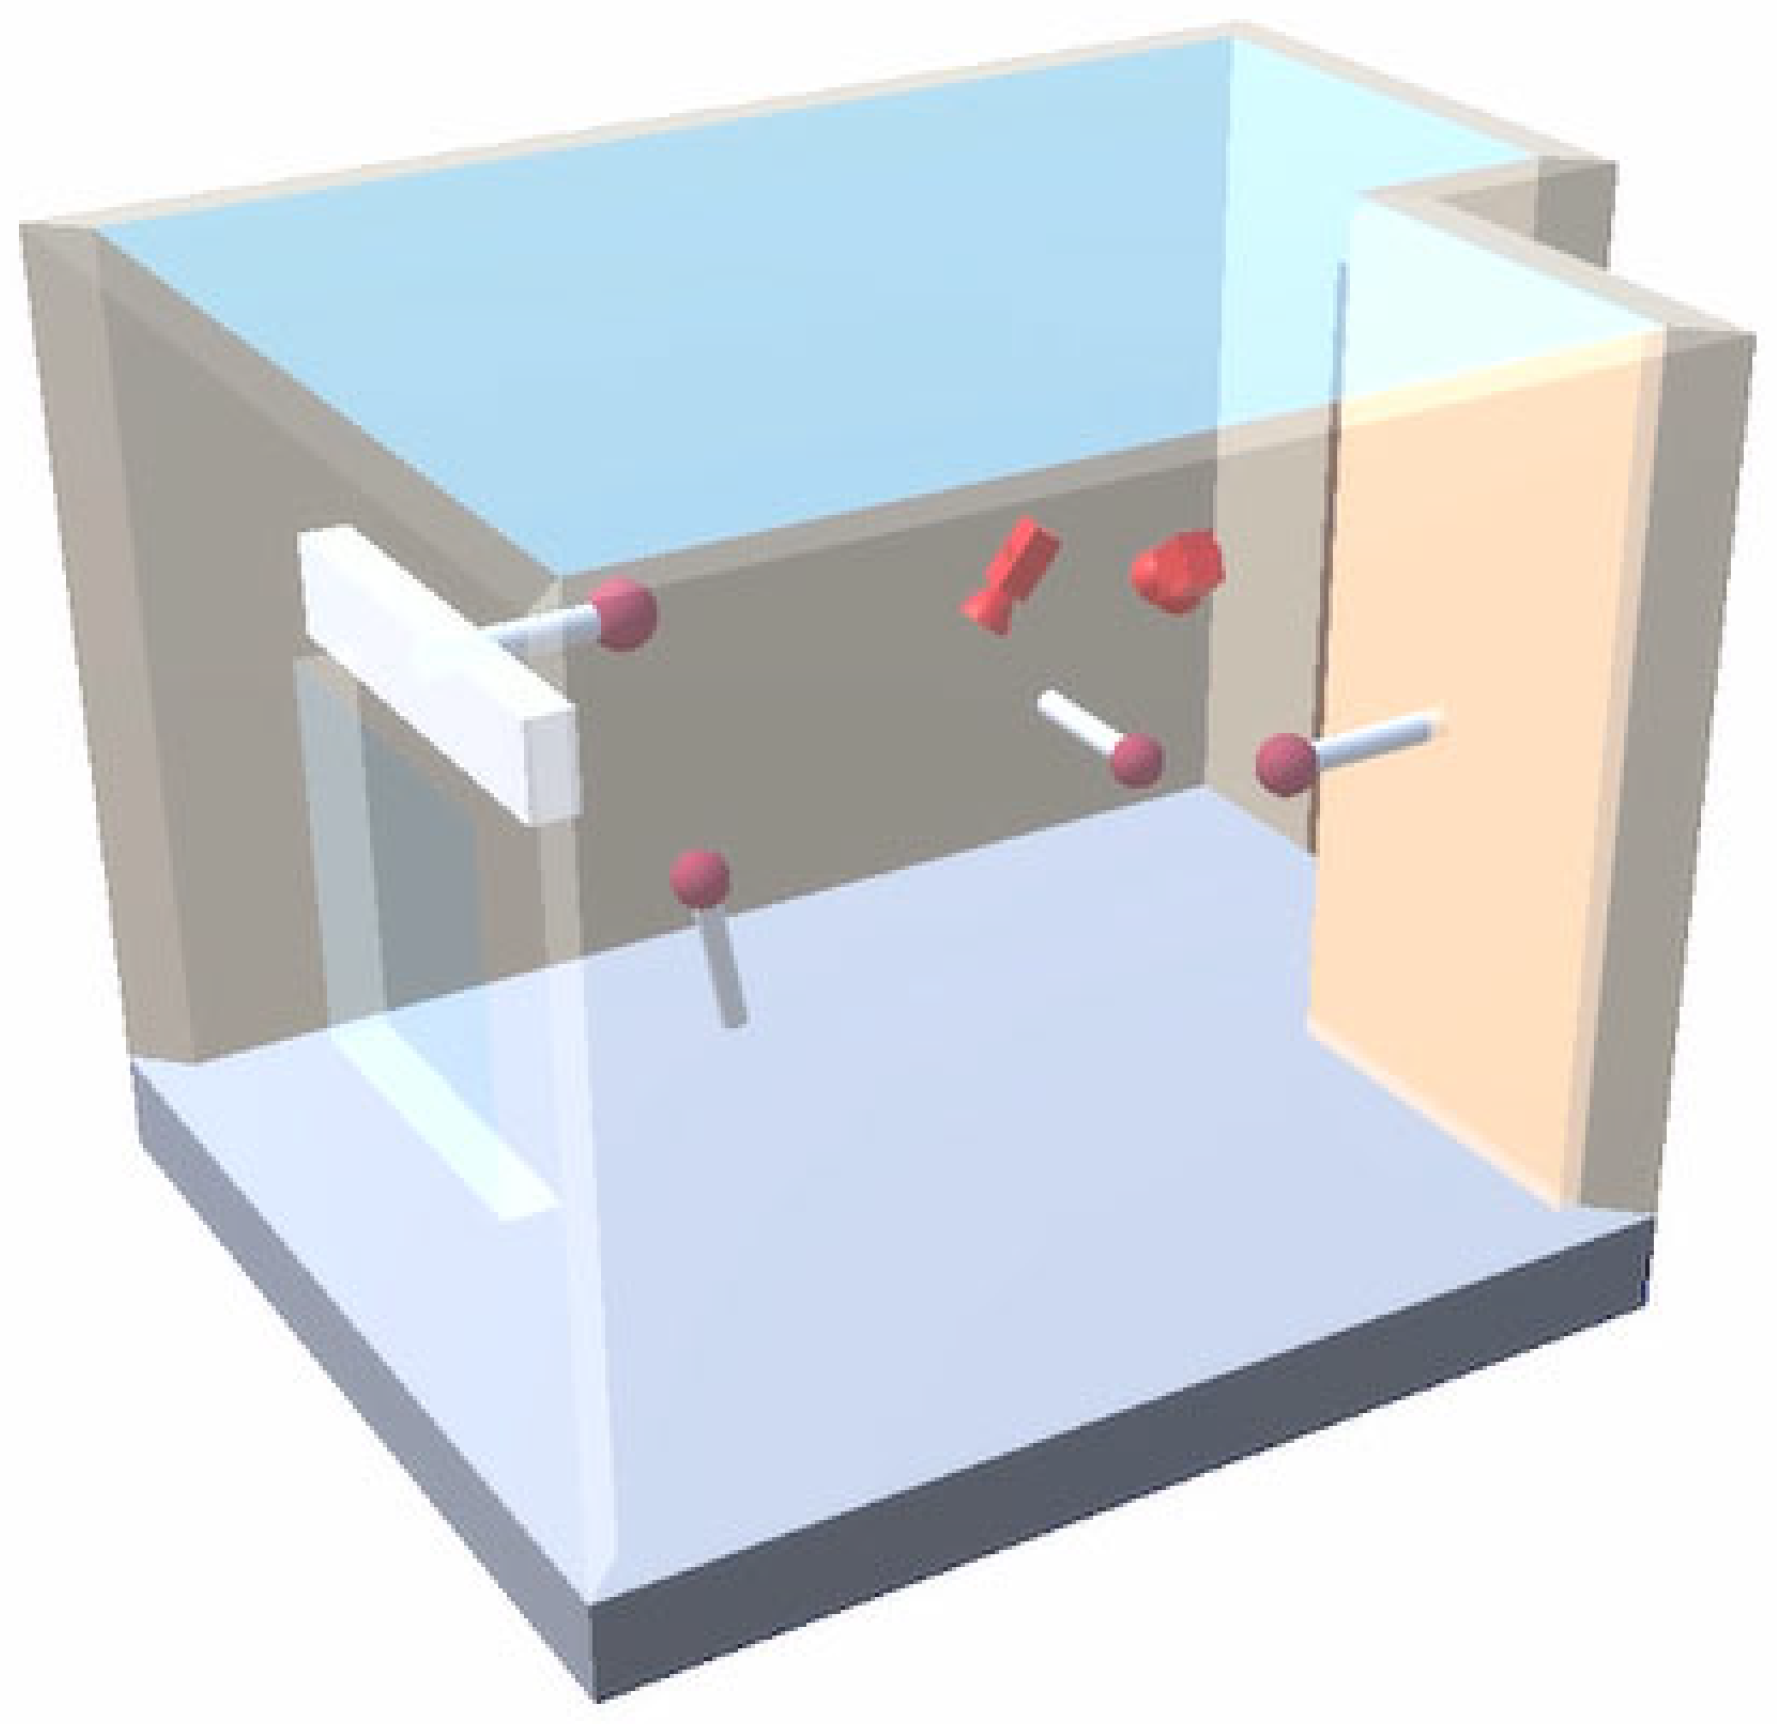
4.4. Data Enrichment
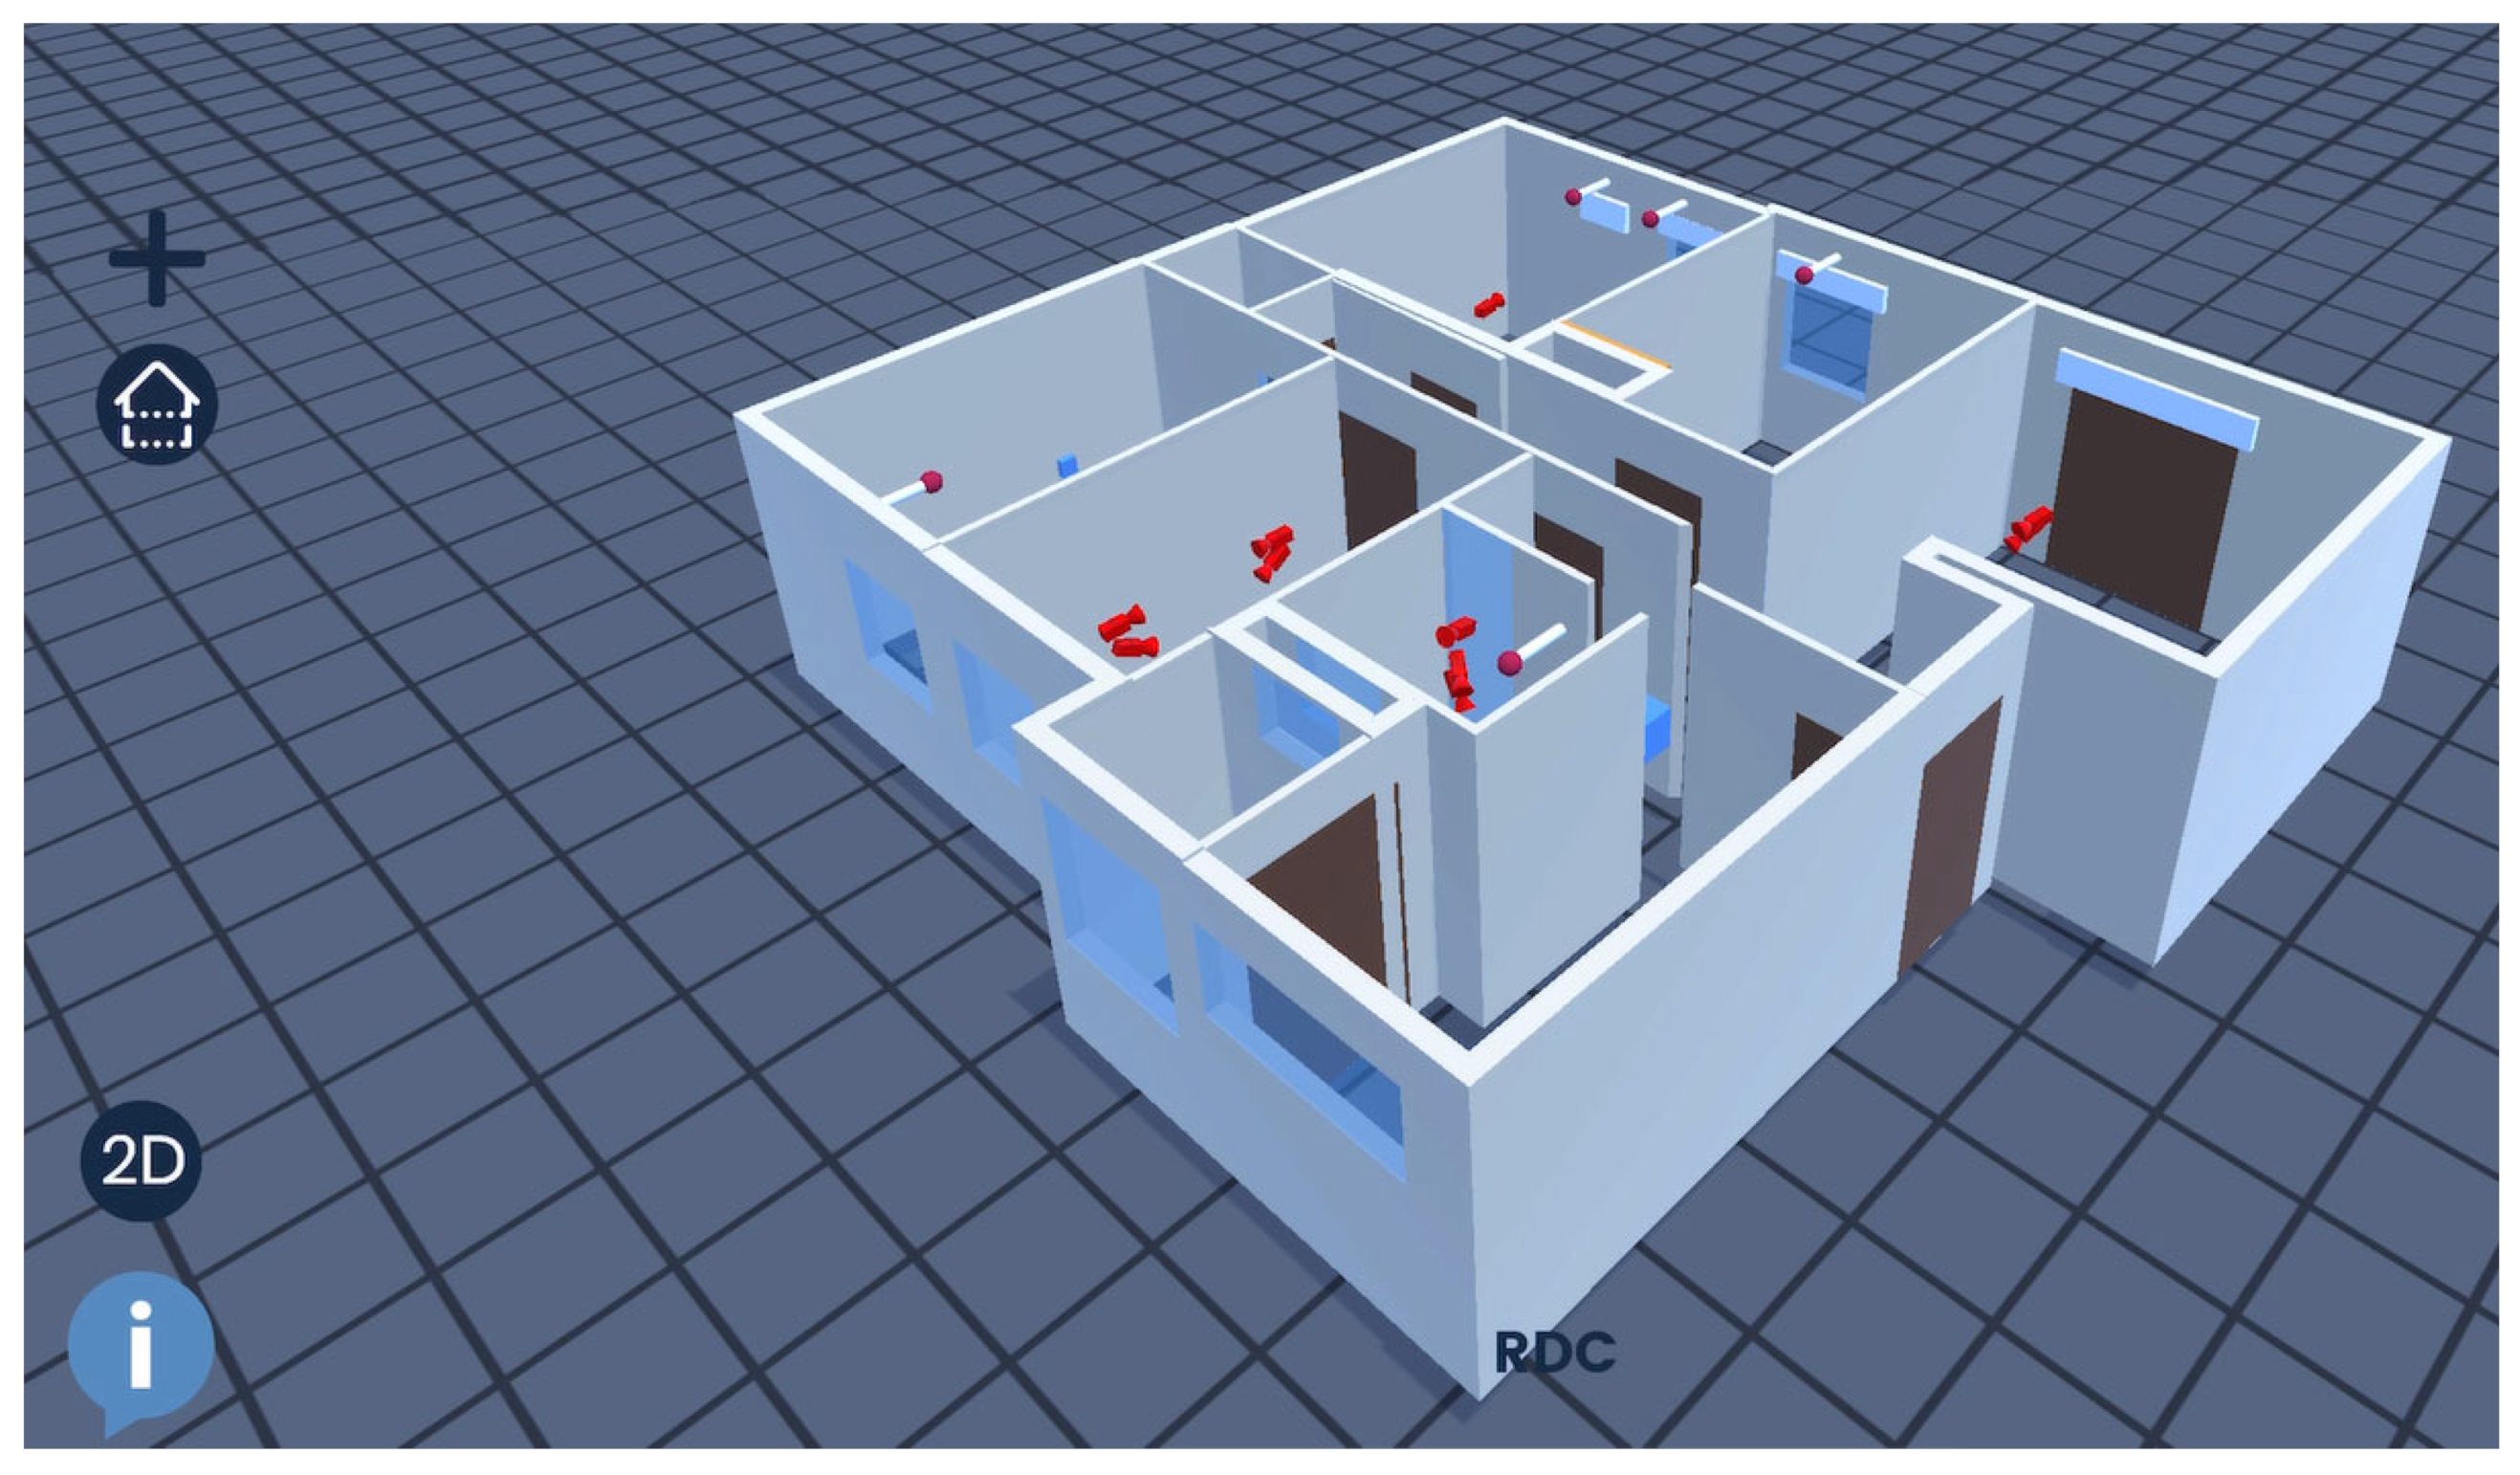
4.5. Postprocessing
4.6. Remarks
5. Findings and Limitations
6. Conclusions
Author Contributions
Funding
Data Availability Statement
Acknowledgments
Conflicts of Interest
References
- Mêda, P.; Hjelseth, E.; Calvetti, D.; Sousa, H. Enabling circular construction information flows using data templates—Conceptual frameworks based on waste audit action. In Proceedings of the 2021 EC3—European Conference on Computing in Construction, Online, 19–28 July 2021; pp. 398–405. [Google Scholar] [CrossRef]
- European Construction Sector Observatory. Digitalisation in the Construction Sector. 2021. Available online: https://ec.europa.eu/docsroom/documents/45547/attachments/1/translations/en/renditions/native (accessed on 20 September 2022).
- European Commission. The European Green Deal; European Commission: Brussels, Belgium, 2019. [Google Scholar]
- Chen, X.; Chang-Richards, A.Y.; Pelosi, A.; Jia, Y.; Shen, X.; Siddiqui, M.K.; Yang, N. Implementation of technologies in the construction industry: A systematic review. Eng. Constr. Archit. Manag. 2022, 29, 3181–3209. [Google Scholar] [CrossRef]
- Derenzi, D.; de Sousa, P.S.; de Oliveira, S.A.; Herdeiro, M.A.N.; Albernaz, J.R.; Valadares, A. A successful approach in integrating people, process, and technology inside collaborative environments: A practical view of challenges and lessons learned. Digit. Energy Conf. Exhib. 2009, 2009, 268–277. [Google Scholar] [CrossRef]
- Karmakar, A.; Delhi, V.S.K. Construction 4.0: What we know and where we are headed? Next Generation ICT—How distant is ubiquitous computing? J. Inf. Technol. Constr. 2021, 26, 526–545. [Google Scholar] [CrossRef]
- Harty, C. Implementing innovation in construction: Contexts, relative boundedness and actor-network theory. Constr. Manag. Econ. 2008, 26, 1029–1041. [Google Scholar] [CrossRef]
- Turk, Ž. Construction 4.0—Digital Transformation of One of the Oldest Industries. Econ. Bus. Rev. 2019, 21, 393–410. [Google Scholar] [CrossRef]
- Duhovnik, J. Računalniško Projektiranje (CAD) Gradbenih Konstrukcij; Fakulteta: Ljubljana, Slovenia, 1984; Available online: https://plus.cobiss.net/cobiss/si/sl/bib/47410 (accessed on 29 November 2022).
- Forum, W.E. Shaping the Future of Construction—A Breakthrough in Mindset and Technology; World Economic Forum: Geneva, Switzerland, 2016; Available online: https://www.weforum.org/reports/shaping-the-future-of-construction-inspiring-innovators-redefine-the-industry (accessed on 26 September 2022).
- Forbes, L.H.; Ahmed, S.M. Construction Integration and Innovation Through Lean Methods and E-Business Applications. In Proceedings of the Contruction Research Congress, Winds of Change: Integration and Innovation in Construction, Proceedings of the Congress, Honolulu, HI, USA, 19–21 March 2003; pp. 337–346. [Google Scholar] [CrossRef]
- European Construction Sector Observatory. Building Information Modelling in the EU Construction Sector; European Construction Sector Observatory: Brussels, Belgium, 2019; Available online: https://www.google.com/url?sa=t&rct=j&q=&esrc=s&source=web&cd=&ved=2ahUKEwiPpvmmjP77AhWLTaQEHVHbCPUQFnoECA0QAQ&url=https%3A%2F%2Fwww.efbww.eu%2Fstream%2Fd7c22ce7-4297-40a9-ae3c-2ada75333c83&usg=AOvVaw3Y68j1bUB6nh9nmCQbpmIQ (accessed on 26 September 2022).
- Staff, C. Scenarios for a Transition Pathway for a Resilient, Greener and More Digital Construction Ecosystem (Ares(2021)7679109) Final); European Commission: Brussels, Belgium, 2021. [Google Scholar]
- Project, S. Towards a Unified Reference Architecture in AECOO Industry; Technical Insight: Barcelona, Spain, 2020; Available online: https://sphere-project.eu/publication-results/project-deliverables/ (accessed on 29 November 2022).
- Calvetti, D.; Sanhudo, L.; Mêda, P.; Martins, J.P.; Gonçalves, M.C.; Sousa, H. Construction Tasks Electronic Process Monitoring: Laboratory Circuit-Based Simulation Deployment. Buildings 2022, 12, 1174. [Google Scholar] [CrossRef]
- Calvetti, D.; Mêda, P.; Sousa, H.; Gonçalves, M.C. Human Data Interaction in Sensored Sites, Challenges of the Craft Workforce Dimension. In Proceedings of the 2021 European Conference on Computing in Construction, Rhodes, Greece, 19–28 July 2021; pp. 173–180. [Google Scholar] [CrossRef]
- Quiñones, R.; Llatas, C.; Montes, M.V.; Cortés, I. A multiplatform bim-integrated construction waste quantification model during design phase. The case of the structural system in a spanish building. Recycling 2021, 6, 62. [Google Scholar] [CrossRef]
- Calvetti, D.; Goncalves, M.; Vahl, F.; Meda, P.; de Sousa, H. Labour productivity as a means for assessing environmental impact in the construction industry. Environ. Eng. Manag. J. 2021, 5, 781–790. [Google Scholar] [CrossRef]
- Kovacic, I.; Honic, M.; Sreckovic, M. Digital platform for circular economy in aec industry. Eng. Proj. Organ. J. 2020, 9, 1–16. [Google Scholar] [CrossRef]
- Çetin, S.; De Wolf, C.; Bocken, N. Circular digital built environment: An emerging framework. Sustainability 2021, 13, 6348. [Google Scholar] [CrossRef]
- Mêda, P.; Calvetti, D.; Hjelseth, E.; Sousa, H. Incremental Digital Twin Conceptualisations Targeting Data-Driven Circular Construction. Buildings 2021, 11, 554. [Google Scholar] [CrossRef]
- Magalhães, P.M.; Calvetti, D.; Kifokeris, D.; Kassem, M. A Process-Based Framework for Digital Building Logbooks. In Proceedings of the 2022 European Conference on Computing in Construction, Rhodes, Greece, 24–26 July 2022; p. 8. [Google Scholar] [CrossRef]
- Nativi, S.; Delipetrev, B.; Craglia, M. Destination Earth Survey on “Digital Twins” Technologies and Activities, in the Green Deal Area; Publications Office of the European Union: Luxembourg, 2020. [Google Scholar] [CrossRef]
- Muench, F.; Stoermer, S.; Jensen, E.; Asikainen, K.; Salvi, T.; Scapolo, M. Towards a Green and Digital Future; Publications Office of the European Union: Brussels, Belgium, 2022. [Google Scholar] [CrossRef]
- Comission, E. A New Circular Economy Action Plan for a Cleaner and More Competitive Europe; European Commission: Brussels, Belgium, 2020. [Google Scholar]
- European Commission. A Renovation Wave for Europe; European Commission: Brussels, Belgium, 2020. [Google Scholar]
- Uotila, U.; Saari, A.; Junnonen, J.-M. Investigating the barriers to laser scanning implementation in building refurbishment. J. Inf. Technol. Constr. 2021, 26, 249–262. [Google Scholar] [CrossRef]
- Cameron, S.; Sankaran, R. Mixed Methods Research in Project Management. In Design Methods and Practices for Research of Project Management; Gower, B.A., Pasian, B., Eds.; Routledge: New York, NY, USA, 2017; pp. 273–285. [Google Scholar] [CrossRef]
- Sovacool, B.K.; Axsen, J.; Sorrell, S. Promoting novelty, rigor, and style in energy social science: Towards codes of practice for appropriate methods and research design. Energy Res. Soc. Sci. 2018, 45, 12–42. [Google Scholar] [CrossRef]
- Arksey, H.; O’Malley, L. Scoping studies: Towards a methodological framework. Int. J. Soc. Res. Methodol. Theory Pract. 2005, 8, 19–32. [Google Scholar] [CrossRef]
- Fellows, R.; Liu, A. Research Methods for Construction; Wiley-Blac: Oxford, UK, 2022. [Google Scholar]
- Hallgren, M. Novel or Incremental Contributions: The Construction of Research Questions. In Design Methods and Practices for Research of Project Management; Gower, B.A., Pasian, B., Eds.; Routledge: New York, NY, USA, 2017; pp. 107–118. [Google Scholar] [CrossRef]
- O’Donnell, J.; Truong-Hong, L.; Boyle, N.; Corry, E.; Cao, J.; Laefer, D.F. LiDAR point-cloud mapping of building façades for building energy performance simulation. Autom. Constr. 2019, 107, 102905. [Google Scholar] [CrossRef]
- da Construção, I.-I. GrowingCircle Project—Building Case Study. Available online: https://growingcircle.netlify.app/cases/matosinhoshabit (accessed on 20 September 2022).
- European Commission. Guidelines for the Waste Audits before Demolition and Renovation Works of Buildings. UE Construction and Demolition Waste Management; European Commission: Brussels, Belgium, 2018; Available online: https://ec.europa.eu/docsroom/documents/31521/attachments/1/translations/en/renditions/native (accessed on 20 July 2022).
- European Construction Sector Observatory. EU Construction Sector: In Transition towards Circular Economy; European Construction Sector Observatory: Brussels, Belgium, 2019. [Google Scholar]
- Liu, Z.; Lu, Y.; Shen, M.; Peh, L.C. Transition from building information modeling (BIM) to integrated digital delivery (IDD) in sustainable building management: A knowledge discovery approach based review. J. Clean. Prod. 2021, 291, 125223. [Google Scholar] [CrossRef]
- De Wolf, C.; Cordella, M.; Dodd, N.; Byers, B.; Donatello, S. Whole life cycle environmental impact assessment of buildings: Developing software tool and database support for the EU framework Level(s). Resour. Conserv. Recycl. 2023, 188, 106642. [Google Scholar] [CrossRef]
- Çetin, S.; Gruis, V.; Straub, A. Digitalization for a circular economy in the building industry: Multiple-case study of Dutch social housing organizations. Resour. Conserv. Recycl. Adv. 2022, 15, 200110. [Google Scholar] [CrossRef]
- European Parliament and European Union Council. 2022 Strategic Foresight Report—Twinning the Green and Digital Transitions in the New Geopolitical Context (COM(2022) 289 Final); European Parliament and European Union Council: Brussels, Belgium, 2022. [Google Scholar]
- Centre for Digital Built Britain; Jalia, A.; Bakker, R.; Zomer, T.; Lamb, K.; Boulton, C.; Neely, A.; Repository, I.; Infrastructure, S. Capability Framework and Research Agenda for a Digital Built Britain; Centre for Digital Built Britain: Cambridge, UK, 2019. [Google Scholar] [CrossRef]
- Joensuu, T.; Edelman, H.; Saari, A. Circular economy practices in the built environment. J. Clean. Prod. 2020, 276, 124215. [Google Scholar] [CrossRef]
- Tsay, G.S.; Staub-French, S.; Poirier, É. BIM for Facilities Management: An Investigation into the Asset Information Delivery Process and the Associated Challenges. Appl. Sci. 2022, 12, 9542. [Google Scholar] [CrossRef]
- European Commission. Directive (EU) 2018/851 of the European Parliament and of the Council of 30 May 2018 amending Directive 2008/98/EC on waste. Off. J. Eur. Union 2018, 14, L-150/109-140. Available online: https://eur-lex.europa.eu/legal-content/EN/TXT/?uri=CELEX:32018L0851 (accessed on 20 July 2022).
- Saura-Gómez, P.; Spairani-Berrio, Y.; Huesca-Tortosa, J.A.; Spairani-Berrio, S.; Rizo-Maestre, C. Advances in the restoration of buildings with lidar technology and 3d reconstruction: Forged and vaults of the refectory of santo domingo de orihuela (16th century). Appl. Sci. 2021, 11, 8541. [Google Scholar] [CrossRef]
- Díaz-Vilariño, L.; Tran, H.; Frías, E.; Balado, J.; Khoshelham, K. 3D Mapping of Indoor and Outdoor Environments Using Apple Smart Devices. Int. Arch. Photogramm. Remote Sens. Spat. Inf. Sci. ISPRS Arch. 2022, 43, 303–308. [Google Scholar] [CrossRef]
- Stein, S. Lidar is One of the iPhone and iPad Pro’s Coolest Tricks: Here’s What Else it Can Do. CNET—Your Guide to a Better Future. 2022. Available online: https://www.cnet.com/tech/mobile/lidar-is-one-of-the-iphone-ipad-coolest-tricks-its-only-getting-better/ (accessed on 26 September 2022).
- Di Stefano, F.; Chiappini, S.; Gorreja, A.; Balestra, M.; Pierdicca, R. Mobile 3D scan LiDAR: A literature review. Geomat. Nat. Hazards Risk 2021, 12, 2387–2429. [Google Scholar] [CrossRef]
- Lv, D.; Ying, X.; Cui, Y.; Song, J.; Qian, K.; Li, M. Research on the technology of LIDAR data processing. In Proceedings of the 1st International Conference on Electronics Instrumentation & Information Systems (EIIS 2017), Harbin, China, 3–5 June 2017; pp. 1–5. [Google Scholar] [CrossRef]
- Lopac, N.; Jurdana, I.; Brnelić, A.; Krljan, T. Application of Laser Systems for Detection and Ranging in the Modern Road Transportation and Maritime Sector. Sensors 2022, 22, 5946. [Google Scholar] [CrossRef] [PubMed]
- Soilán, M.; Nóvoa, A.; Sánchez-Rodríguez, A.; Justo, A.; Riveiro, B. Fully automated methodology for the delineation of railway lanes and the generation of IFC alignment models using 3D point cloud data. Autom. Constr. 2021, 126, 103684. [Google Scholar] [CrossRef]
- Ren, Y.; Ai, C.; Lu, P.; Dai, Z.; Wang, H. An Automated Rail Extraction Framework for Low-Density LiDAR Data Without Sensor Configuration Information. IEEE Sensors J. 2022, 22, 13234–13243. [Google Scholar] [CrossRef]
- Puri, N.; Turkan, Y. Bridge construction progress monitoring using lidar and 4D design models. Autom. Constr. 2020, 109, 102961. [Google Scholar] [CrossRef]
- Xiong, X.; Adan, A.; Akinci, B.; Huber, D. Automatic creation of semantically rich 3D building models from laser scanner data. Autom. Constr. 2013, 31, 325–337. [Google Scholar] [CrossRef]
- Benarab, D.; Derigent, W.; Brie, D.; Bombardier, V.; Thomas, A. All-Automatic 3D BIM Modeling of Existing Buildings; Springer International Publishing: Cham, Switzerland, 2018; Volume 540. [Google Scholar] [CrossRef]
- Hajeb, M.; Karimzadeh, S.; Matsuoka, M. SAR and LIDAR datasets for building damage evaluation based on support vector machine and random forest algorithms—A case study of Kumamoto earthquake, Japan. Appl. Sci. 2020, 10, 8932. [Google Scholar] [CrossRef]
- Błaszczak-Bąk, W.; Suchocki, C.; Janicka, J.; Dumalski, A.; Duchnowski, R.; Sobieraj-Żłobińska, A. Automatic threat detection for historic buildings in dark places based on the modified OPTD method. ISPRS Int. J. Geo-Information 2020, 9, 123. [Google Scholar] [CrossRef]
- Dedík, L.; Minaroviech, J. Project of the digital monuments funds: Digitization of the cultural heritage of Slovakia. Stud. Digit. Herit. 2017, 1, 590–606. [Google Scholar] [CrossRef]
- Ékes, C. Inspecting Twin 42 Reinforced Concrete Pipes with Pipe Penetrating Radar Supplemented by LiDAR. In Proceedings of the Pipelines 2021: Planning—Proceedings of Sessions of the Pipelines 2021 Conference, Online, 3–6 August 2021; pp. 236–241. [Google Scholar] [CrossRef]
- Kumar, G.A.; Patil, A.K.; Kang, T.W.; Chai, Y.H. Sensor fusion based pipeline inspection for the augmented reality system. Symmetry 2019, 11, 1325. [Google Scholar] [CrossRef]
- Aijazi, A.K.; Malaterre, L.; Trassoudaine, L.; Chateau, T.; Checchin, P. Automatic detection and modeling of underground pipes using a porTable 3D LiDAR system. Sensors 2019, 19, 5345. [Google Scholar] [CrossRef] [PubMed]
- Car, M.; Markovic, L.; Ivanovic, A.; Orsag, M.; Bogdan, S. Autonomous Wind-Turbine Blade Inspection Using LiDAR-Equipped Unmanned Aerial Vehicle. IEEE Access 2020, 8, 131380–131387. [Google Scholar] [CrossRef]
- Mansor, H.; Shukor, S.A.A.; Wong, R. An overview of object detection from building point cloud data. J. Phys. Conf. Ser. 2021, 1878, 012058. [Google Scholar] [CrossRef]
- Orsulic, J.; Milijas, R.; Batinovic, A.; Markovic, L.; Ivanovic, A.; Bogdan, S. Flying with Cartographer: Adapting the Cartographer 3D Graph SLAM Stack for UAV Navigation. In Proceedings of the AIRPHARO 2021—1st AIRPHARO Workshop on Aerial Robotic Systems Physically Interacting with the Environment, Biograd na Moru, Croatia, 4–5 October 2021. [Google Scholar] [CrossRef]
- Costantino, D.; Vozza, G.; Pepe, M.; Alfio, V.S. Smartphone LiDAR Technologies for Surveying and Reality Modelling in Urban Scenarios: Evaluation Methods, Performance and Challenges. Appl. Syst. Innov. 2022, 5, 63. [Google Scholar] [CrossRef]
- Spreafico, A.; Chiabrando, F.; Losè, L.T.; Tonolo, F.G. The ipad pro built-in lidar sensor: 3D rapid mapping tests and quality assessment. Int. Arch. Photogramm. Remote Sens. Spat. Inf. Sci. ISPRS Arch. 2021, 43, 63–69. [Google Scholar] [CrossRef]
- Losè, L.T.; Spreafico, A.; Chiabrando, F.; Tonolo, F.G. Apple LiDAR Sensor for 3D Surveying: Tests and Results in the Cultural Heritage Domain. Remote. Sens. 2022, 14, 4157. [Google Scholar] [CrossRef]
- Meegan, E.; Murphy, M.; Corns, A.; Shaw, R.; Lionáin, C.N.; Keenaghan, G. Tripping the light fantastic: Using light-based techniques to digitally document megalithic architecture. Int. Arch. Photogramm. Remote Sens. Spat. Inf. Sci. ISPRS Arch. 2022, 46, 373–379. [Google Scholar] [CrossRef]
- Balado, J.; Frías, E.; González-Collazo, S.M.; Díaz-Vilariño, L. New Trends in Laser Scanning for Cultural Heritage; Springer: Singapore, 2022; Volume 258. [Google Scholar] [CrossRef]
- Murtiyoso, A.; Grussenmeyer, P.; Landes, T.; Macher, H. First assessments into the use of commercial-grade solid state lidar for low cost heritage documentation. Int. Arch. Photogramm. Remote Sens. Spat. Inf. Sci. ISPRS Arch. 2021, 43, 599–604. [Google Scholar] [CrossRef]
- Díaz-Vilariño, L.; González-Jorge, H.; Martínez-Sánchez, J.; Lorenzo, H. Automatic LiDAR-based lighting inventory in buildings. Meas. J. Int. Meas. Confed. 2015, 73, 544–550. [Google Scholar] [CrossRef]
- Li, Y.; Li, W.; Tang, S.; Darwish, W.; Hu, Y.; Chen, W. Automatic indoor as-built building information models generation by using low-cost RGB-D sensors. Sensors 2020, 20, 293. [Google Scholar] [CrossRef]
- Tavani, S.; Billi, A.; Corradetti, A.; Mercuri, M.; Bosman, A.; Cuffaro, M.; Seers, T.; Carminati, E. Smartphone assisted fieldwork: Towards the digital transition of geoscience fieldwork using LiDAR-equipped iPhones. Earth-Science Rev. 2022, 227, 103969. [Google Scholar] [CrossRef]
- Birch, C.; Olivier, A. Narrow, tabular stope 3d scanning in deep-level gold mines using an ipad pro lidar. In Proceedings of the 27th International Mining Congress and Exhibition of Turkey, IMCET 2022, Antalya, Turkey, 22–25 March 2022; pp. 658–669. [Google Scholar]
- Luetzenburg, G.; Kroon, A.; Bjørk, A.A. Evaluation of the Apple iPhone 12 Pro LiDAR for an Application in Geosciences. Sci. Rep. 2021, 11, 1–9. [Google Scholar] [CrossRef]
- Valla, M.; Gueguen, P.; Augère, B.; Goular, D.; Perrault, M. Remote Modal Study of Reinforced Concrete Buildings Using a Multipath Lidar Vibrometer. J. Struct. Eng. 2015, 141, D4014005. [Google Scholar] [CrossRef]
- Bertolini-Cestari, C.; Chiabrando, F.; Invernizzi, S.; Marzi, T.; Spanò, A. Terrestrial laser scanning and settled techniques: A support to detect pathologies and safety conditions of timber structures. Adv. Mater. Res. 2013, 778, 350–357. [Google Scholar] [CrossRef] [Green Version]
- Sánchez-Rodríguez, A.; Riveiro, B.; Conde, B.; Soilán, M. Detection of structural faults in piers of masonry arch bridges through automated processing of laser scanning data. Struct. Control. Health Monit. 2018, 25, e2126. [Google Scholar] [CrossRef]
- Murakami, T.; Saito, N.; Michikawa, T.; Komachi, Y.; Sakasita, M.; Kogure, S.; Kase, K.; Wada, S.; Midorikawa, K. Extending the exposure time in high-resolution mobile tunnel lidar. Opt. InfoBase Conf. Pap. 2019, Part F140, 7281. [Google Scholar]
- Costamagna, E.; Quintero, M.S.; Bianchini, N.; Mendes, N.; Lourenço, P.B.; Su, S.; Paik, Y.M.; Min, A. Advanced non-destructive techniques for the diagnosis of historic buildings: The Loka-Hteik-Pan temple in Bagan. J. Cult. Herit. 2020, 43, 108–117. [Google Scholar] [CrossRef]
- Akhlaghi, M.M.; Bose, S.; Mohammadi, M.E.; Moaveni, B.; Stavridis, A.; Wood, R.L. Post-earthquake damage identification of an RC school building in Nepal using ambient vibration and point cloud data. Eng. Struct. 2021, 227, 111413. [Google Scholar] [CrossRef]
- Marzouk, M. Using 3D laser scanning to analyze heritage structures: The case study of egyptian palace. J. Civ. Eng. Manag. 2020, 26, 53–65. [Google Scholar] [CrossRef]
- Cardani, G.; Angjeliu, G. Integrated use of measurements for the structural diagnosis in historical vaulted buildings. Sensors 2020, 20, 4290. [Google Scholar] [CrossRef]
- Aristipini, P.; Colao, F.; Fantoni, R.; Fiorani, L.; Palucci, A. Scanning lidar fluorosensor for cultural heritage diagnostics. Adv. Laser Technol. 2005, 5850, 196–203. [Google Scholar] [CrossRef]
- Chen, F.; Lasaponara, R.; Masini, N. An overview of satellite synthetic aperture radar remote sensing in archaeology: From site detection to monitoring. J. Cult. Herit. 2017, 23, 5–11. [Google Scholar] [CrossRef]
- Fantoni, R.; Caneve, L.; Colao, F.; Fiorani, L.; Palucci, A.; Dell’Erba, R.; Fassina, V. Laser-induced fluorescence study of medieval frescoes by Giusto de’ Menabuoi. J. Cult. Herit. 2013, 14, S59–S65. [Google Scholar] [CrossRef]
- Ngaruiya, J.; Ngigi, M. Diagnosis of wind turbine misalignment through SCADA Data. Diagnostyka 2017, 18, 17–24. [Google Scholar]
- García-Ayllón, S. Retro-diagnosis methodology for land consumption analysis towards sustainable future scenarios: Application to a mediterranean coastal area. J. Clean. Prod. 2018, 195, 1408–1421. [Google Scholar] [CrossRef]
- González, P.V.; Medina-Cetina, Z. Risk Assessment for Landslides Using Bayesian Networks and Remote Sensing Data. Geo-Risk 2017, 2017, 113–123. [Google Scholar] [CrossRef]
- Balado, J.; Díaz-Vilariño, L.; Arias, P.; González-Jorge, H. Automatic classification of urban ground elements from mobile laser scanning data. Autom. Constr. 2018, 86, 226–239. [Google Scholar] [CrossRef]
- Southern Housing Group. Spatial Hierarchy & Unique Property Reference Number (UPRN) Procedures; Southern Housing Group: London, UK, 2021; Available online: https://www.ordnancesurvey.co.uk/business-government/tools-support/uprn (accessed on 20 July 2022).
- Chiabrando, F.; Nex, F.; Piatti, D.; Rinaudo, F. UAV and RPV systems for photogrammetric surveys in archaelogical areas: Two tests in the Piedmont region (Italy). J. Archaeol. Sci. 2011, 38, 697–710. [Google Scholar] [CrossRef]
- BIMeo, “BIMeo—ARtoBuild”. Available online: https://www.bimeo.fr/artobuild (accessed on 29 November 2022).
- Heinrichs, B.E.; Yang, M. Bias and Repeatability of Measurements from 3D Scans Made Using iOS-Based Lidar. SAE Tech. Pap. 2021, 2021, 2219–2226. [Google Scholar] [CrossRef]
- European Commission. Directive (EU) 2018/851 of the European Parliament and of the Council of 30 May 2018; EU member-states; European Commission: Brussels, Belgium, 2008; Volume L312, pp. 1–59. Available online: http://eur-lex.europa.eu/LexUriServ/LexUriServ.do?uri=OJ:L:2008:312:0003:01:ES:HTML (accessed on 20 July 2022).


| Scope/Construction Entity | Activity | Hardware | Works | References |
|---|---|---|---|---|
| Buildings | Creation of 3D models | Laser scan | 3 | [54,55,56] |
| Historical buildings | Threat detection, damage evaluation | Leica C-10 scanner, UAV | 2 | [57,58] |
| Pipelines/Wind turbine | Inspection | Radar, optical systems, Laser scan, UAV | 4 | [59,60,61,62] |
| Buildings | Object detection | Laser scan | 1 | [63] |
| Cartography | Measurement | UAV | 1 | [64] |
| Scope/Construction Entity | Activity | Hardware | Works | References |
|---|---|---|---|---|
| Architectural objects | 3D model, 3D point clouds, 3D rapid mapping | iPad Pro, iPhone 12 Pro, Huawei P30 Pro | 2 | [65,66] |
| Cultural Heritage/Archaeology | 3D positional accuracy, 3D scanning, elements individualization | iPhone 12 Pro, iPad Pro, Faro X330, Zeb-Go | 4 | [67,68,69,70] |
| Indoor and outdoor environments | 3D mapping, BIM | iPhone 12 Pro, iPad Pro, data collection equipment, Structure sensor | 2 | [71,72] |
| Geological fieldwork and mines | 3D outcrop sharing, 3D scan/model, accuracy analysis | iPhone 12 Pro, iPad Pro | 3 | [73,74,75] |
| Scope/Construction Entity | Activity | Hardware | Works | References |
|---|---|---|---|---|
| Structures (reinforced concrete, timber, masonry bridges, civil) | Risk/damage identification/assessment, 3D model, maintenance | Riegl LMS Z-390i | 4 | [76,77,78,79] |
| Historical buildings | Diagnosis, 3D model, risk assessment, damage identification | Z+F 3D laser scanner, OS1-64 | 5 | [80,81,82,83,84] |
| Archeology/artwork | Monitoring, assessment | 2 | [85,86] | |
| Wind turbine | Misalignments | 1 | [87] | |
| Territory, soil, urban environment | Risk assessment, mobility, erosion | 3 | [88,89,90] |
| Object | Type of Scan | Number of Scanned Items |
|---|---|---|
| Door | 2D | 1 |
| Window | 2D | 1 |
| Roller blind box | 3D | 1 |
| Closet | 2D | 1 |
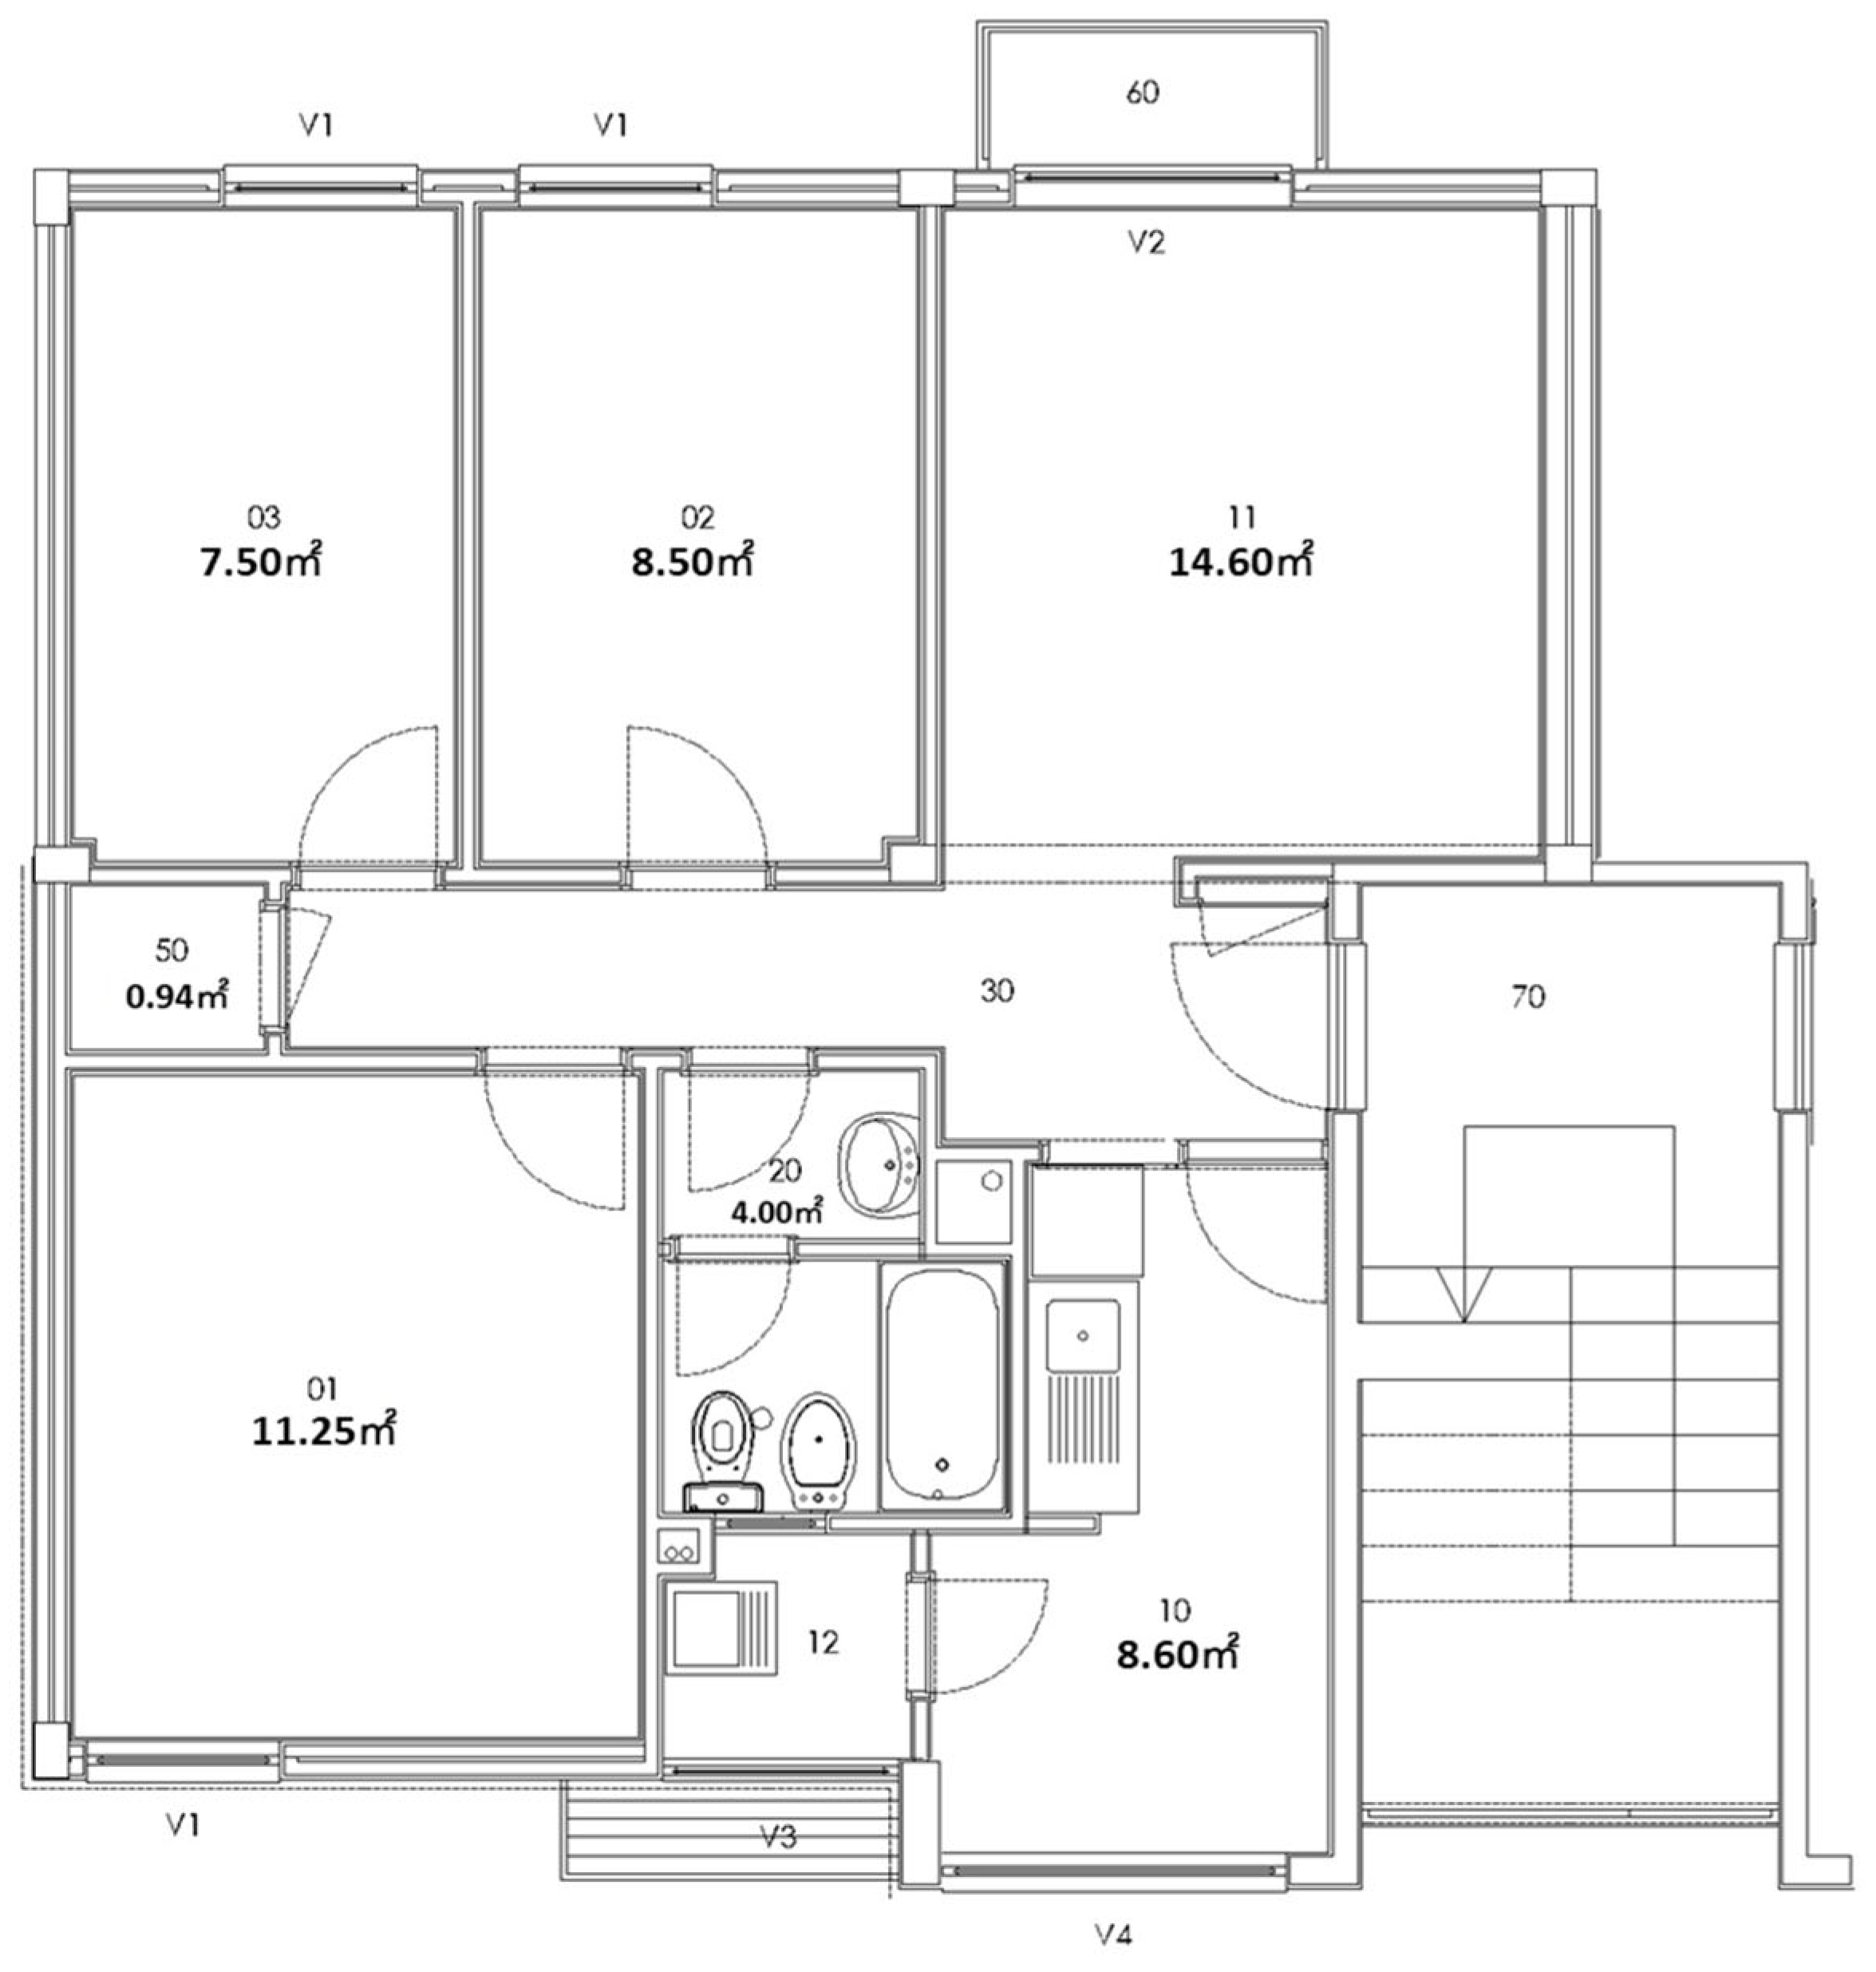
| Division | Area (m2) | Object Types | Total Number | Photos | Annotations | Approximate Scan Time |
|---|---|---|---|---|---|---|
| Division 30 | 7.00 | 2 | 9 | 2 | 2 | 9:00 |
| Division 11 | 14.60 | 3 | 3 | 2 | 1 | 6:00 |
| Division 02 | 8.50 | 4 | 4 | 2 | 4 | 7:00 |
| Division 03 | 7.50 | 4 | 4 | 2 | 2 | 6:00 |
| Division 50 | 0.94 | 1 | 1 | 1 | 0 | 4:00 |
| Division 01 | 11.25 | 4 | 9 | 0 | 3 | 6:00 |
| Division 20 | 4.60 | 5 | 6 | 4 | 7 | 12:00 |
| Division 10 | 8.60 | 5 | 5 | 2 | 2 | 10:00 |
| Division 12 | 1.50 | 3 | 3 | 2 | 1 | 6:00 |
Disclaimer/Publisher’s Note: The statements, opinions and data contained in all publications are solely those of the individual author(s) and contributor(s) and not of MDPI and/or the editor(s). MDPI and/or the editor(s) disclaim responsibility for any injury to people or property resulting from any ideas, methods, instructions or products referred to in the content. |
© 2023 by the authors. Licensee MDPI, Basel, Switzerland. This article is an open access article distributed under the terms and conditions of the Creative Commons Attribution (CC BY) license (https://creativecommons.org/licenses/by/4.0/).
Share and Cite
Mêda, P.; Calvetti, D.; Sousa, H. Exploring the Potential of iPad-LiDAR Technology for Building Renovation Diagnosis: A Case Study. Buildings 2023, 13, 456. https://doi.org/10.3390/buildings13020456
Mêda P, Calvetti D, Sousa H. Exploring the Potential of iPad-LiDAR Technology for Building Renovation Diagnosis: A Case Study. Buildings. 2023; 13(2):456. https://doi.org/10.3390/buildings13020456
Chicago/Turabian StyleMêda, Pedro, Diego Calvetti, and Hipólito Sousa. 2023. "Exploring the Potential of iPad-LiDAR Technology for Building Renovation Diagnosis: A Case Study" Buildings 13, no. 2: 456. https://doi.org/10.3390/buildings13020456