1. Introduction
Ready-mix concrete is one of the riskiest supplier categories in the construction arena, yet this is an area that many researchers have not yet paid enough attention to, especially regarding the RMC production aspect [
1]. Just-in-Time (JIT) is the main production method in the RMC industry. It ensures that the customer receives the product on time, at the right quality and at the right quantity with a multi-tasking workforce to reduce the wastage of inventory and on-site finished goods as well as increase the productivity of the production process [
2,
3,
4,
5,
6,
7,
8,
9]. However, it is common in the RMC industry to have frequent production delays due to machine breakdowns/inefficiencies and inefficiency in human activities. It ultimately causes high customer dissatisfaction, which associates high costs with idle time and low quality at the client site [
10,
11,
12,
13,
14].The primary root cause for these issues in the RMC industry is that production starts close to 2 h before the delivery time of the client because ready-mix concrete is perishable, and it is a must to deliver the order within 2 h to the client’s premises, which means there should not be any production failure within this short period [
15]. Any slight delay in production causes delivery delays, and it is essential to take a risk-responsive method to prevent such production disruptions. Nevertheless, it is highly complex to implement technologically driven improvements for the RMC industry because the construction industry is one of the least digitalized industries [
16].
The digital twin (DT) is a potential tool to manage this issue well in RMC plants. It is a decision support system that can get updated by real-time data from different data sources using the IoT system and then predict the present and future performance of physical components, such as machinery, in real-time [
17,
18]. However, digital twin-related research is still in an early stage and is very scarce with respect to infrastructure, assets, operations and maintenance from the construction industry’s point of view [
19,
20].
To fill this gap, our research introduces the first ever digital twin application for ready-mix concrete plants, especially to solve its most significant problems, which are known as the operational risks associated with its production. Our proposed solution gives analytical insights on production process performance and predictive maintenance to identify potential production bottlenecks and disruptions beforehand and notify the plant engineers to rectify them before any production breakdowns happen. Our solution’s benefits are avoidance of unplanned downtime, reduction of planned downtime, increased productivity, optimized maintenance resources, improved asset health and performance, increased customer satisfaction and risk responsiveness whilst reducing client idle time in the RMC supply chain [
21,
22].
Past studies discussed digital twin applications for many industries, including construction, but there are no studies done for developing a digital twin-driven risk management system for the ready-mix concrete industry though it is at high risk of disruption in production operations. Thus, the key contribution of our study is to develop a digital twin system to evaluate its applicability to managing the production risks of ready-mix concrete plants.
The product archetype was developed to give a high-level overview of the proposed digital twin model for RMC production by interviewing industrial experts. The product in development consists of three sub-systems: (1) an IoT system, (2) a digital twin operation model and (3) an advanced analytical dashboard. The IoT system was developed to get real-time actual production cycle time data of the entire RMC production process from the plant itself. The digital twin operational model was built to identify the bottlenecks and compare the actual vs. standard cycle times of the process with different analytical visualizations. An analytical dashboard was built to give insights about potential production disruptions by using predictive maintenance tools such as anomaly detection and production process time forecasting to make the digital twin operational model into an advanced system. To run the digital twin, a combination of agent-based and discrete event simulation methods was used to represent the actual RMC producer’s operational model by considering the standard cycle time and the distribution of each operation within its production. The product was validated for its technical feasibility using simulated data and expert opinions concerning its effectiveness in real-world RMC operations. Then, the business value of the developed product was identified as a solution for five risk scenarios in addition to other benefits that emphasize its value, and challenges were identified when implementing such a product in the RMC plant itself.
The significance of our study is that it introduces the first digital twin real-time risk management system for RMC plants to manage their production operations more risk-responsively. Moreover, timely deliveries and quality can be ensured to reduce the disruptions to operations at client sites. In addition, the maintenance team can make analytically and scientifically justified disruption signals instead of making decisions based on their gut feelings.
The remainder of our research paper is structured as follows.
Section 2 discusses the related literature and theoretical foundations.
Section 3 provides a comprehensive explanation of the methodology employed in our study.
Section 4 comprises detailed results and discussion of the developed digital twin product development with its business value and challenges. Finally,
Section 5 summarizes the conclusion of our study.
3. Methods and Data
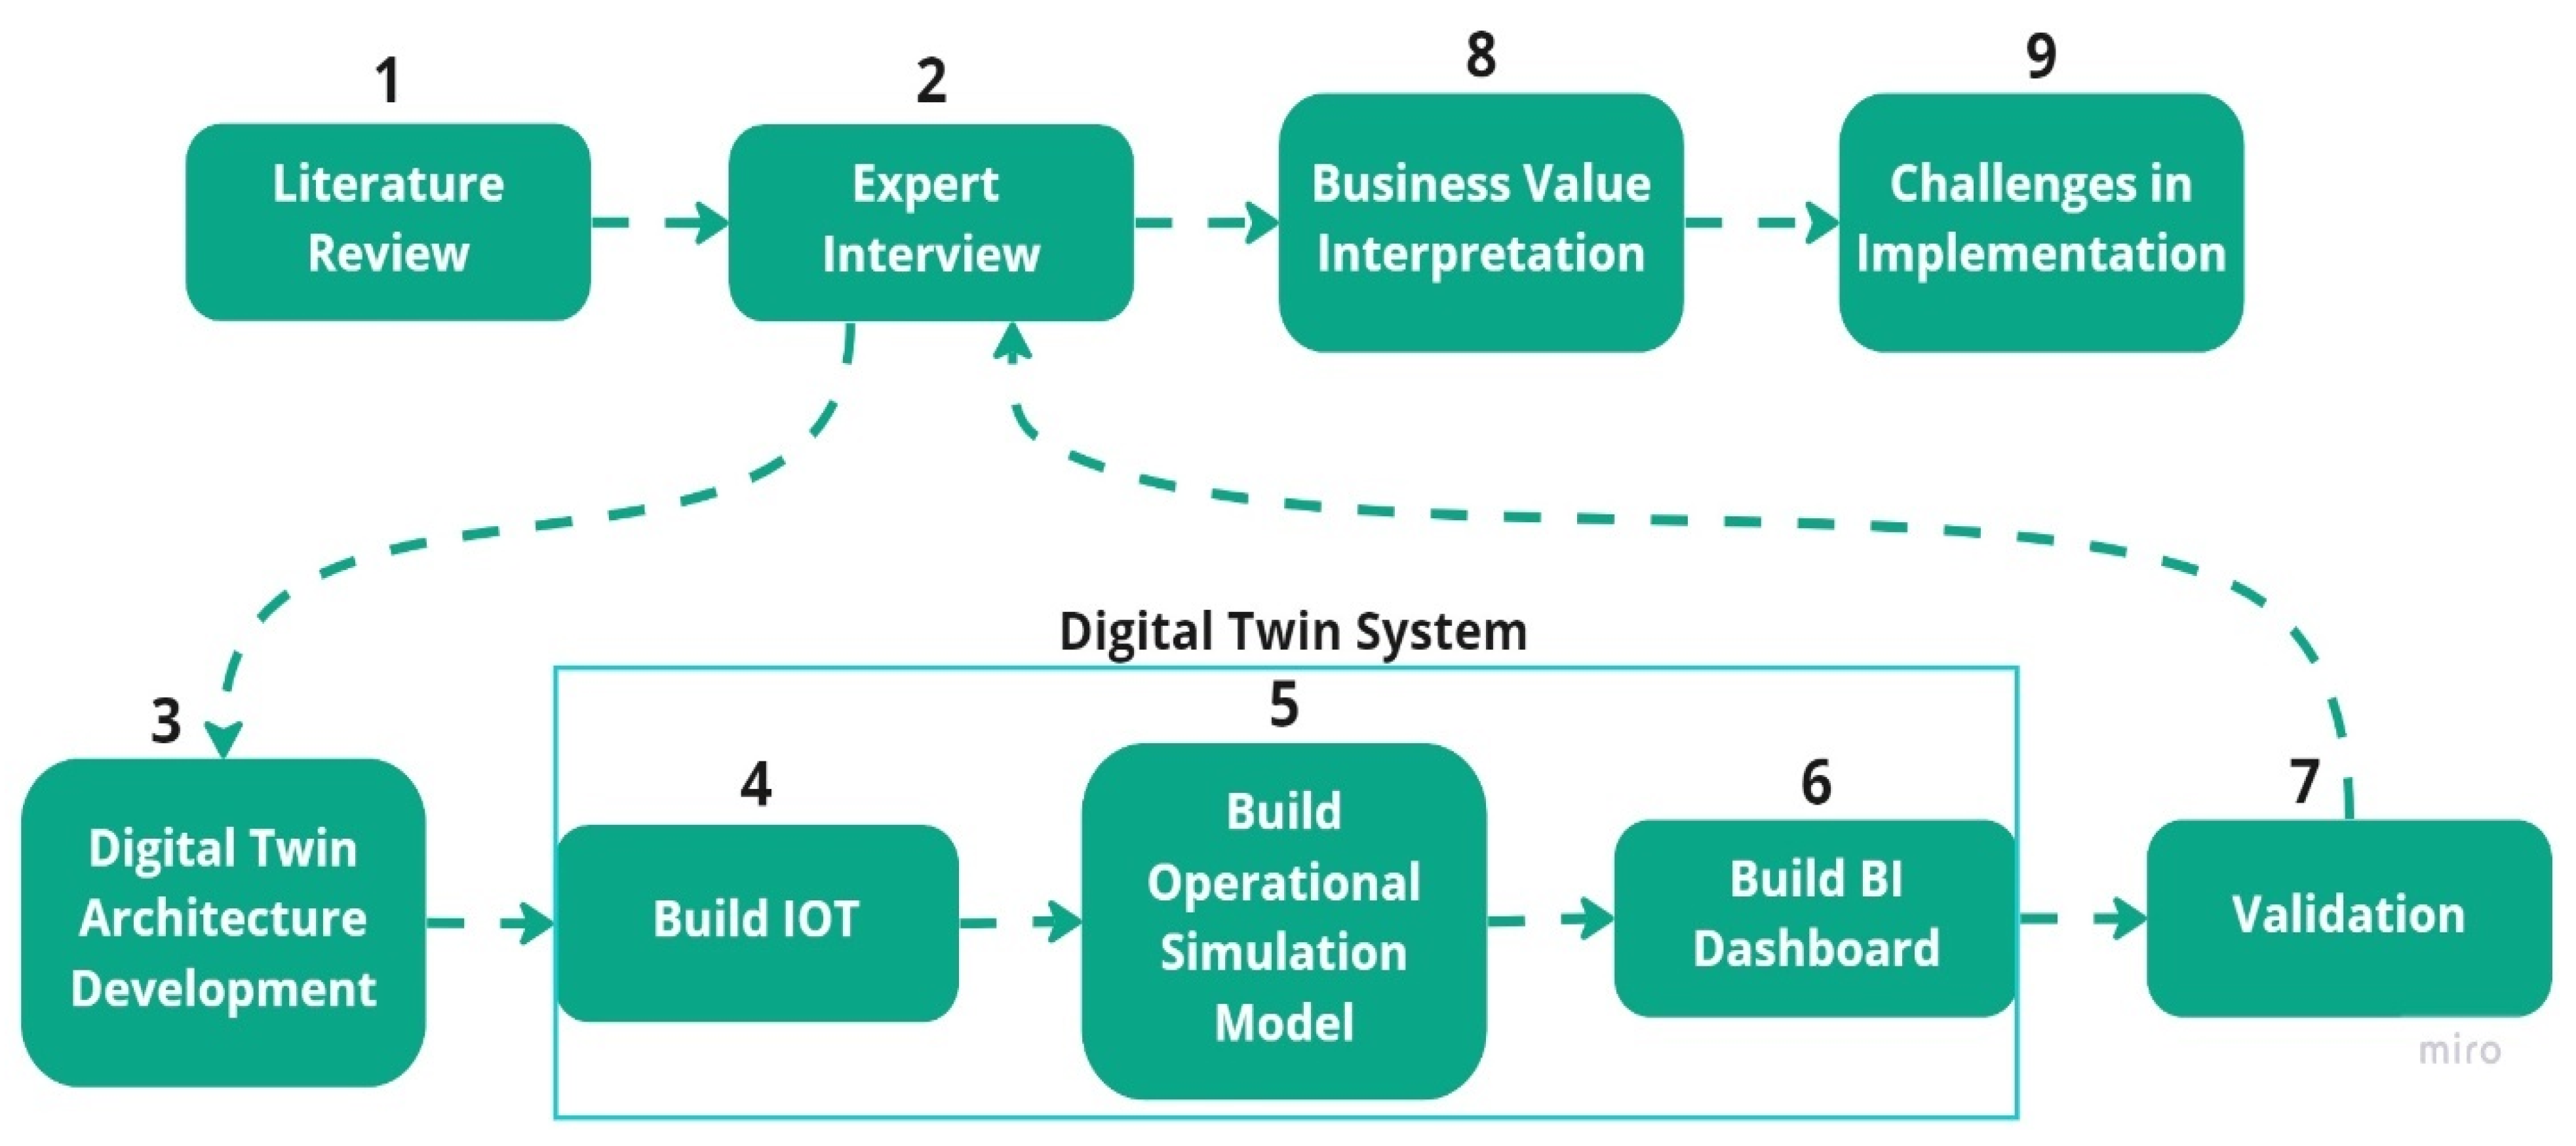
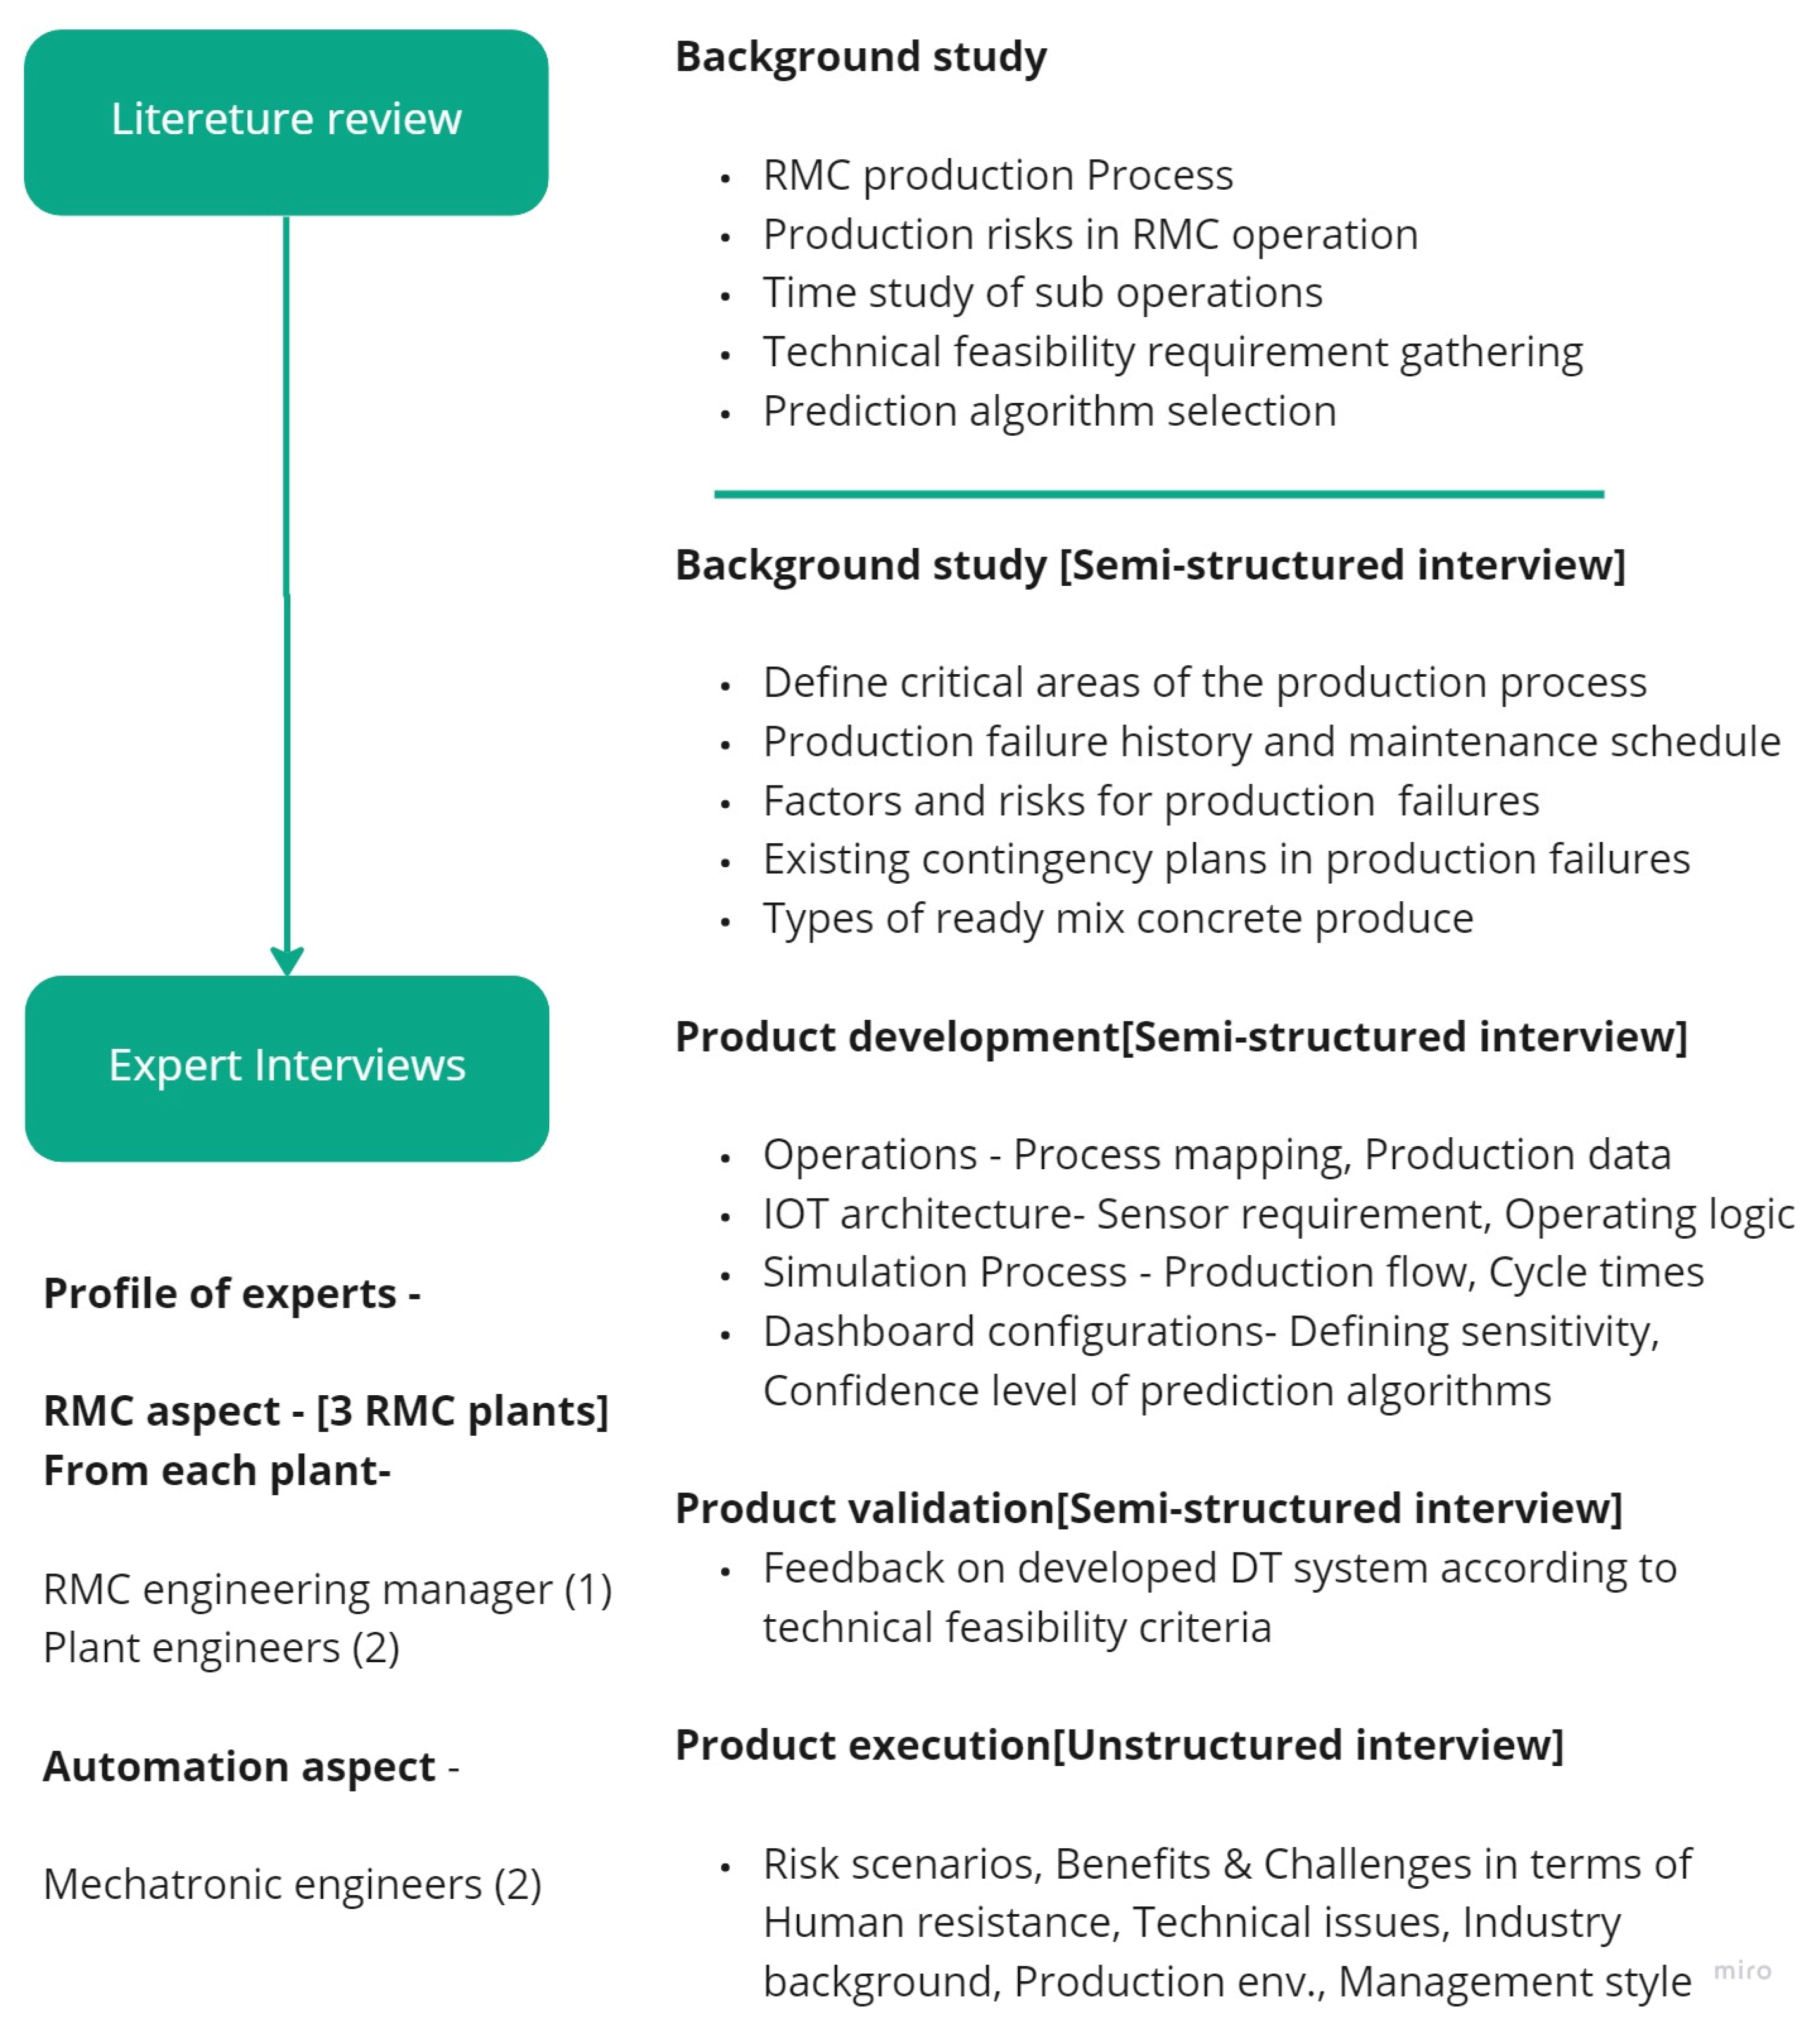
Our methodology consists of 9 steps, as shown in
Figure 4. First, current literature and expert interviews were analyzed to study the RMC plant and its operations to explore the current findings around the research scope. Then, the digital twin model was developed in three segments. As the first step of development, we designed an IoT architecture to get real-time data from the RMC operation. The second stage was to develop the digital twin operational model that represents the production process and provides insights on production bottlenecks and production time distribution. The third step was to develop the analytical dashboard to power the digital twin operational model with predictive analytics, such as anomaly detection and production process forecasting within the RMC operation. Then, with experts’ feedback, the technical feasibility of the proposed product was validated, the business value of the product was discussed as a case study and challenges were identified when implementing it in the real-world RMC plant.
3.1. Literature Review and Expert Interview
3.1.1. Literature Reviews
Literature reviews were mainly studied to understand the nature of the RMC business production and gather operational data. Initially, the RMC production process was analyzed using RMC value mappings in previous studies related to RMC plants. Then, critical production risks were identified with their root causes, such as machinery breakdowns, human inefficiency, etc.
Next, the RMC production cycle times for each operational component were taken for the simulation system to simulate a realistic production operation. Then, criteria were identified to check what factors needed to be fulfilled for the product to be technically feasible. Afterward, the prediction algorithms were evaluated based on their accuracy and applicability for RMC production.
3.1.2. Expert Interviews
Under expert interviews, we used a qualitative approach with the collaboration of 3 RMC plants and an automation company. From each RMC plant, three experts were selected, including one engineering manager and two plant engineers, and two experts from the automation company, both of whom were automation engineers. In total, eleven experts contributed to expert interviews for the following different stages of the project: information gathering of the production process, product development, product validation in terms of feasibility and the identification of benefits and challenges. For effective expert interviews, 5 to 50 experts are sufficient [
47]. Expert interviews were conducted virtually using different expert interview methods, such as semi-structured (used for background study, product development and product evaluation) and unstructured (used for risk scenarios, benefits and implementation challenges identification), in different stages of the project. Moreover, the same experts were used throughout the project for all of the interviews.
Further, the purposive sampling method was used to select experts who work in RMC plants to get specific details on the RMC production process. In this sampling method, a very small population is needed with expert knowledge in RMC rather than deriving statistical inferences with a larger population [
48].
Figure 5 elaborates the literature review and expert interview comprehensively by explaining topics covered in each stage and expert profiles used for interviews.
Semi-Structured Interviews
Expert interviews were conducted as semi-structured interviews for the background study, product development and product validation stages. Semi-structured interviews are most suitable for getting information from experts within the given focus area, with the ability to ask further follow-up questions to reveal underlying facts that need to be considered, especially in the product development stage [
49]. For background study and product development, our expectation was to revalidate the operational data that we found from our literature study and gather additional information to customize the revalidated data into our DT product development in an effective way.
Background study—Expert interviews were conducted as semi-structured interviews to identify the critical areas of the production process, production failure history, maintenance schedule, risk factors in production, existing contingency plans for production failures and the types of ready-mix concrete offered to clients.
Product development—To develop the digital twin system, expert interviews were conducted as semi-structured interviews to gather operational data in each plant where the experts worked as well as IoT system development-related data collection from automation engineers. RMC operational data was mainly composed of production cycle times, production capacity, and production sub-operation mapping were taken, and for IoT development data, various sensors were identified to develop the logical flow of the IoT system to get the real-time data for each sub-operation. Finally, parameters such as sensitivity and confidence levels for predictive algorithms were discussed and adjusted by aligning with the customer service levels of the RMC plants.
Product validation–Experts were asked to give their feedback to validate the product by considering factors such as product feature evaluation, the likability of the product, and overall product functionality [
50] using a 5-point Likert scale method for each of the criteria given by Nebraska University [
51]. This was done to evaluate the technical feasibility of different aspects of the project, such as having a design for the production process, a working model of the product, the design of the product and measuring how the product will perform.
Unstructured Interviews
In the final step of our study, product execution, the risk scenarios where the proposed solution can effectively contribute and the benefits it will thereby bring to the RMC business were identified. Moreover, the challenges identified should be considered when implementing the proposed product in the RMC plant.
Because these aspects are based on the judgement of experts, the unstructured interview method was chosen because this method is highly flexible, and experts can comfortably answer with new ideas and have the chance to ask follow-up questions to derive conclusions in totally new and specific areas [
52]. Narrative analysis was used to get valuable insights from the RMC experts’ personal stories and experiences to connect with the proposed DT solution and identify the risk scenarios, benefits and challenges regarding implementation [
53].
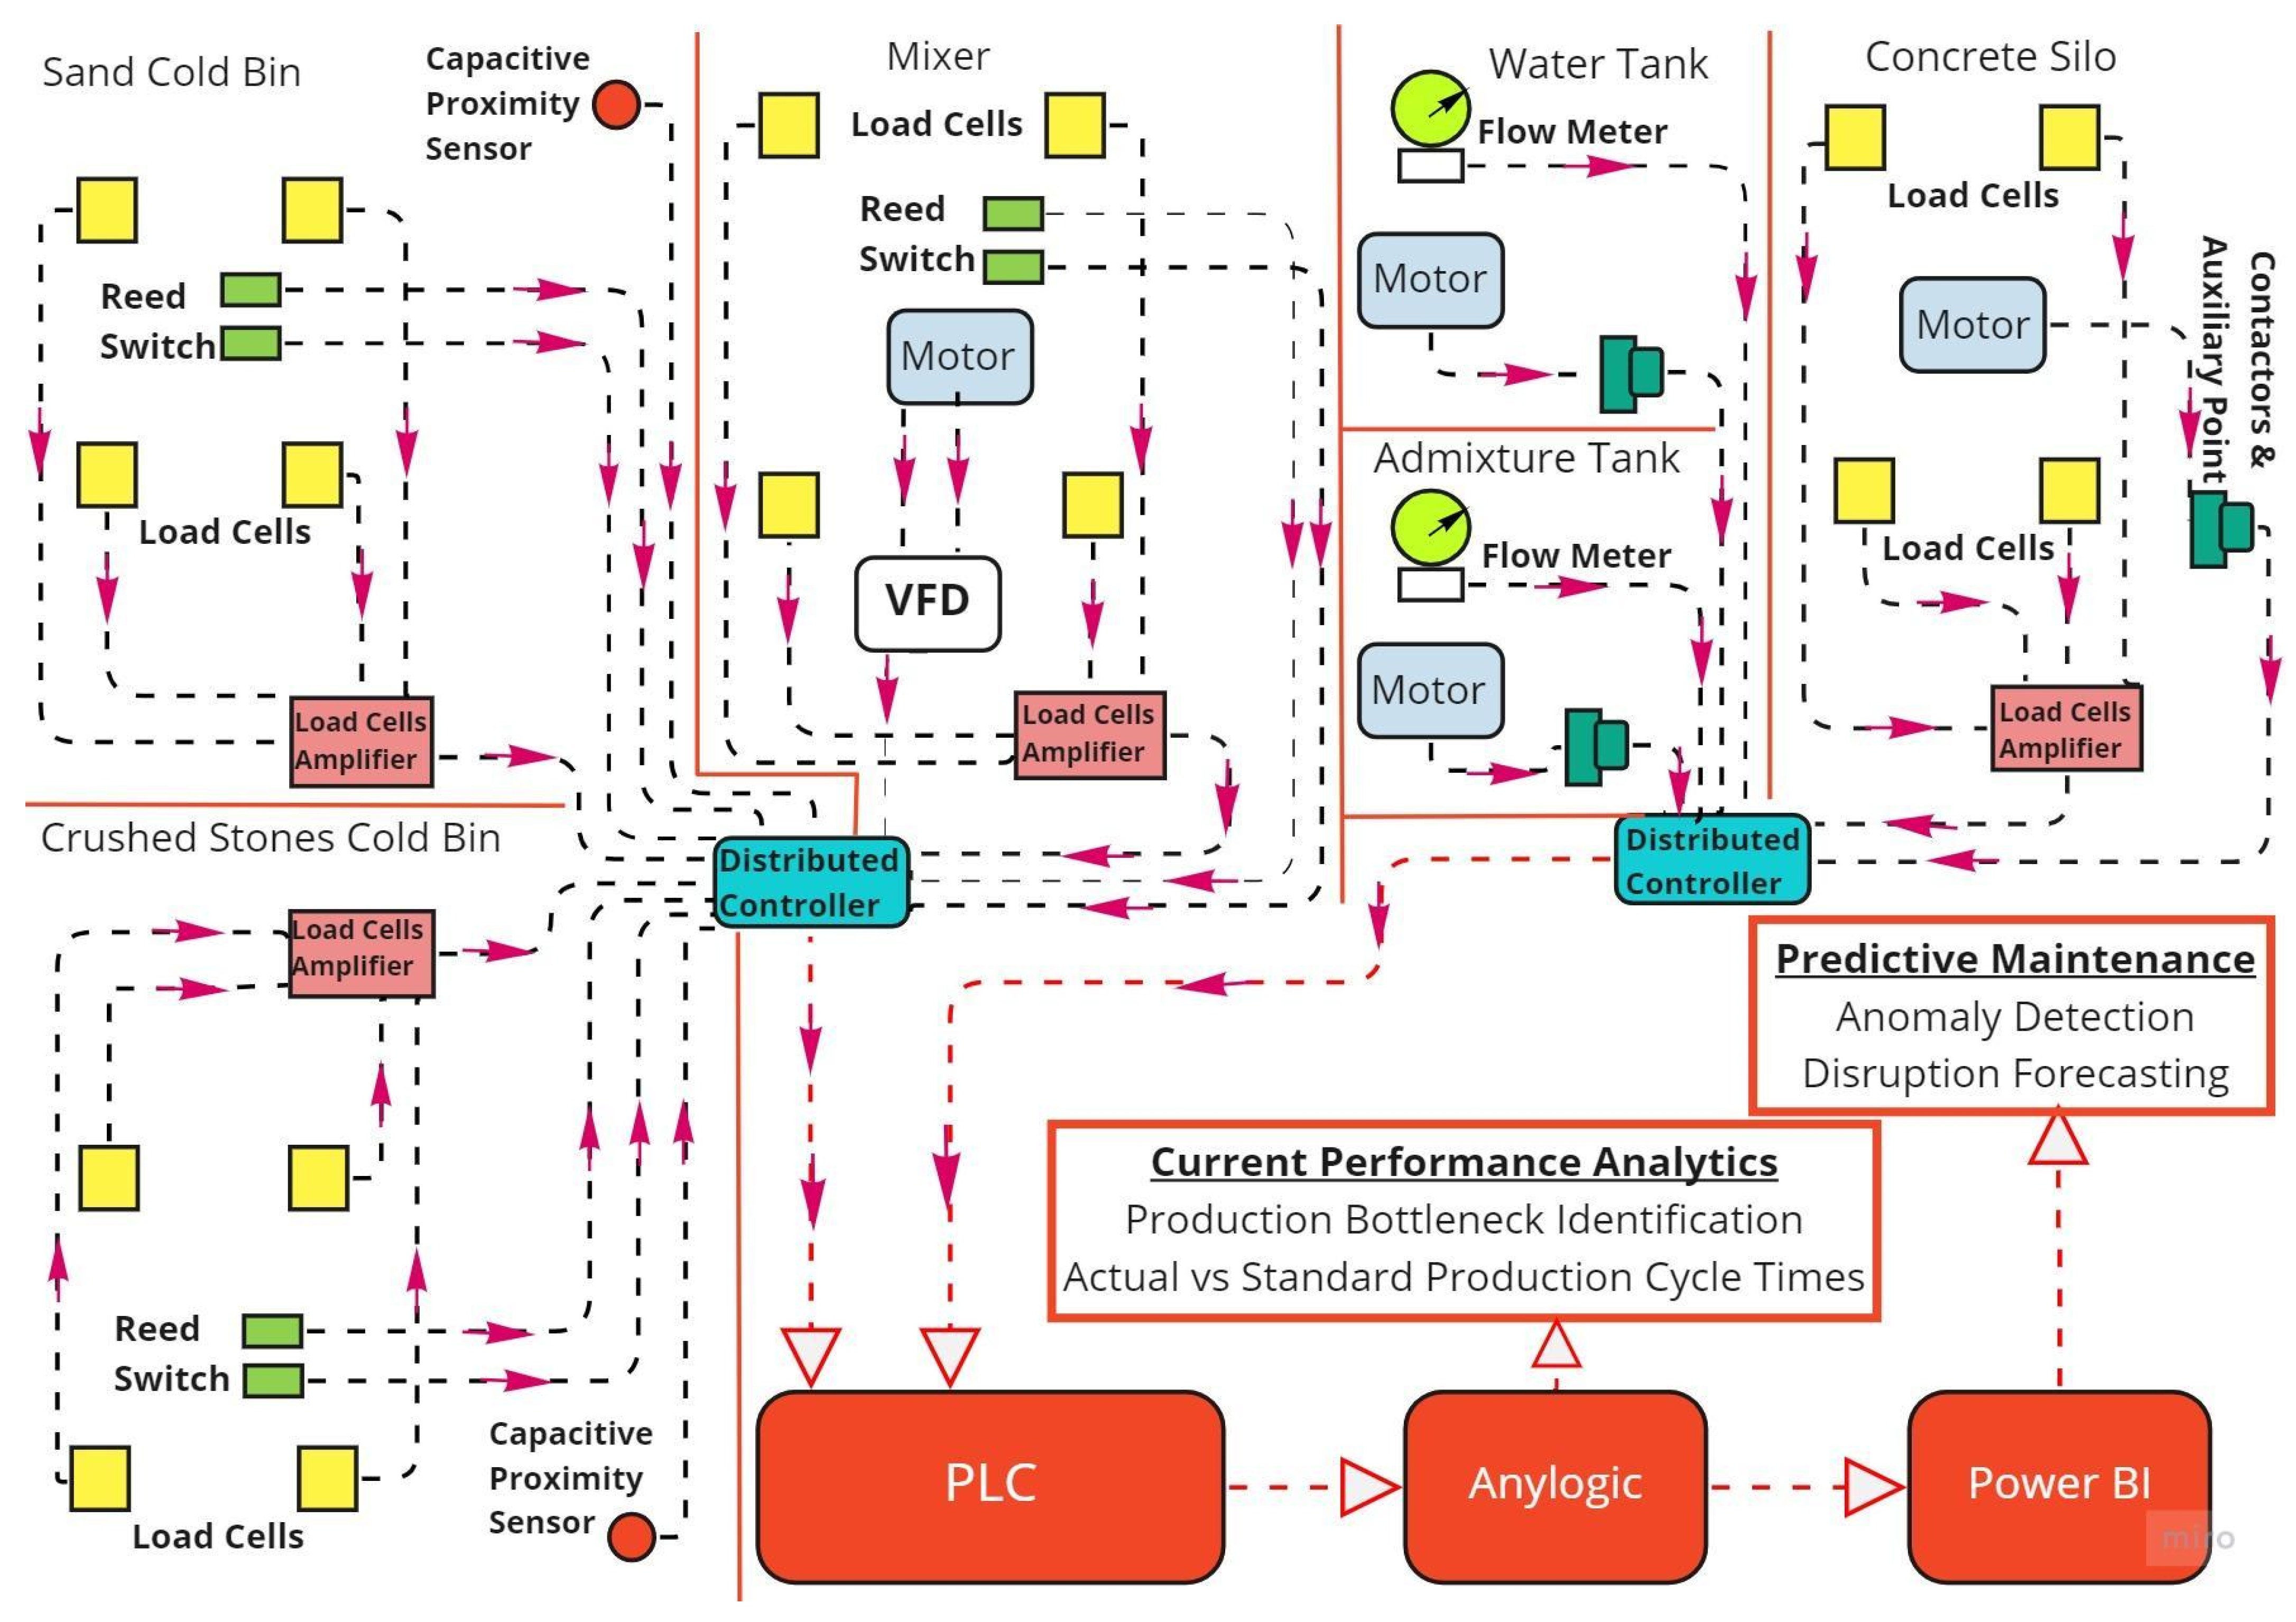
3.2. Digital Twin System Architecture for RMC Production Process in Plant Layout
The RMC production process is an integration of multiple sub-production operations that connects with different assets, utilities and people. Therefore, extensive deployment of an ICT system is a primary requirement to collect real-time insights from different asset groups. The hierarchical digital twin product architecture for a ready-mix concrete plant can be developed as an integration of five layers: a data acquisition layer, a transmission layer, a digital modeling layer, a data/model integration layer and a service layer [
17,
21].
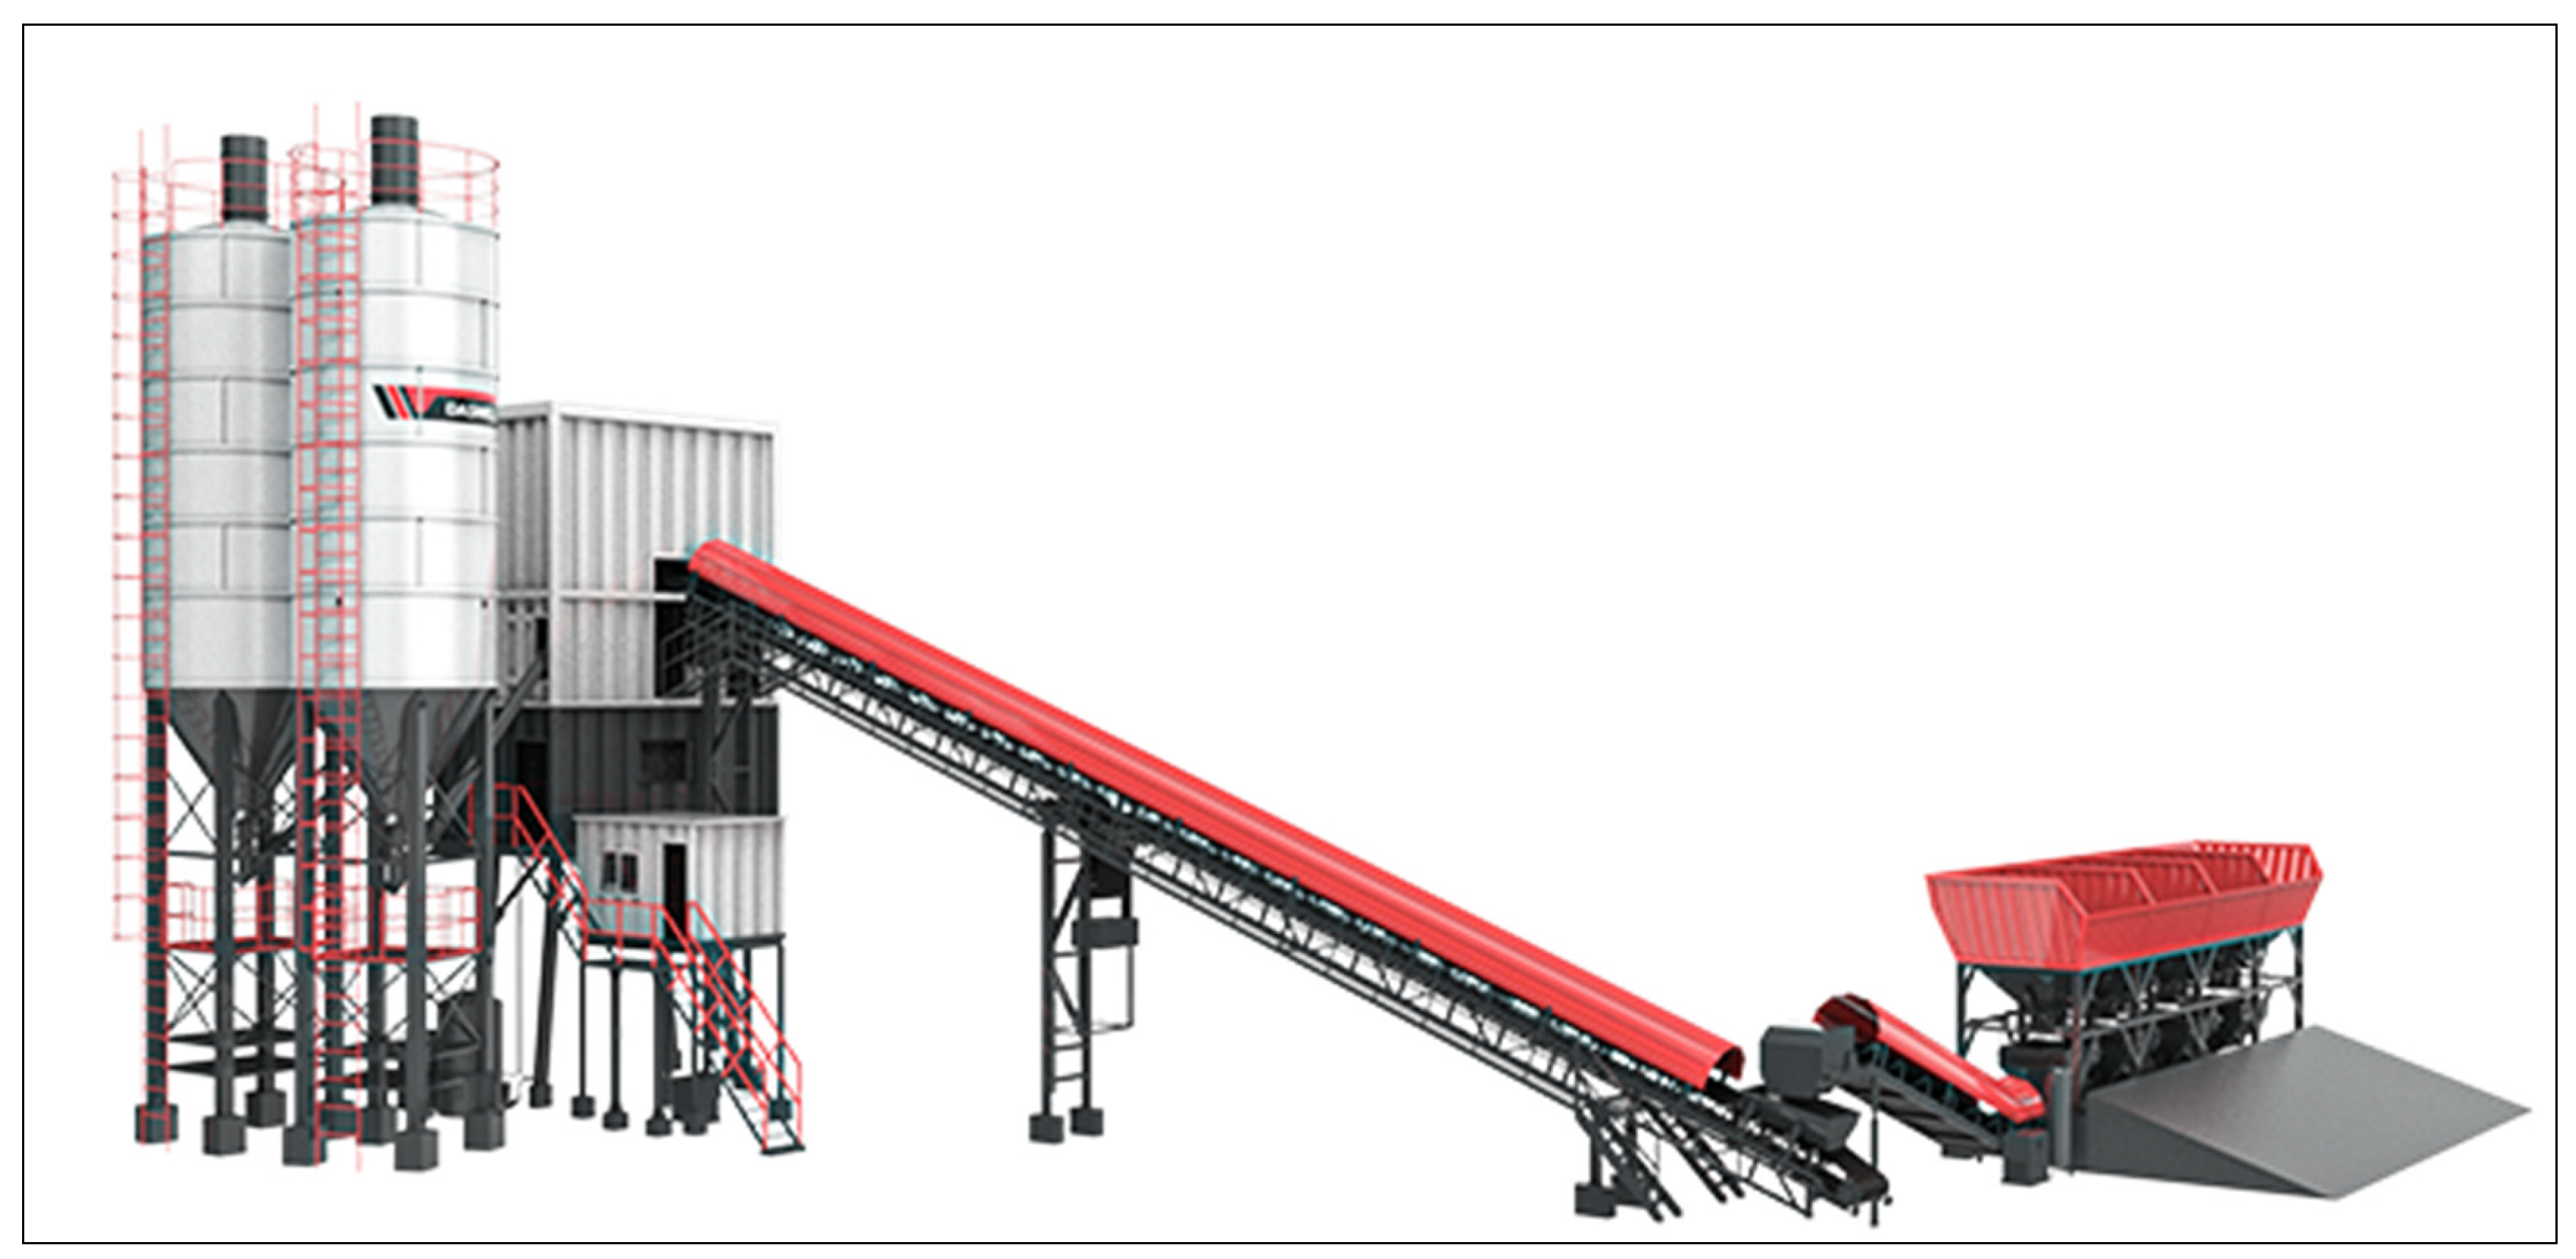
3.3. Development of IoT System to Extract Real Time Operational Data
IoT system is an essential part of digital twins to get real-time production data from the plant itself using customized sensors to analyze and evaluate the actual condition of the physical components [
54]. The IoT system was developed by analyzing each sub-production operation (
Appendix A.1) and identifying the parameter data that need to be taken to feed to the digital twin for decision-making, such as the time of each sub-operation and speed of mechanical components. Many parameters can be used to generate insights related to predictive maintenance. Moreover, one of the effective methods is by calculating the production cycle times of operations, a process in which dynamic data such as production start and end times are taken to calculate cycle times and generate predictive maintenance alerts for potential failures [
55]. Because it was mainly the time parameter, sensor usage for these operations was customized to give the required signals to calculate the sub-production operation time and, finally, get the total production time of the entire production cycle. To design an IoT system, it is necessary to identify which sensors and mechanical components are needed to get real-time data from each sub-production operation. Using a block diagram, the IoT product was developed to get a rough idea about the information flow of the entire product archetype.
Schematic diagrams were developed to represent how each sensor is connected in electronic aspects to support the entire IoT system. Then, a logical flow diagram was developed to present how each sensor is being used and what type of data is expected from each sensor as well as to make them synchronize in a way that makes it work as a program that supports the calculation of the production time of each component and directs them into the database.
3.4. Building the Digital Twin Operational Model
Anylogic software is one of the main tools used to successfully develop and deploy digital twin simulation models [
56]. Therefore, our proposed digital twin operational model was also developed in Anylogic 8.7.7 version according to actual RMC production operations (
Appendix A.1 and
Appendix A.2). The data can be fed in real-time by directly connecting the IoT database with the built-in Anylogic database. After extracting the actual live production times from each sub-production operation in the RMC production plant, the respective production times are linked to each sub-production operational component of the digital twin model that is built on Anylogic. Then, the entire actual operation can be seen in real-time from the Anylogic platform itself. The proposed digital twin operational model is equipped with real-time analytics to visualize production bottlenecks in terms of time variables, use histograms as the primary analyzing method to identify actual cycle times compared to the standard cycle times and analyze the distribution of actual time for each sub-production operation.
Using the simulation function in Anylogic, the digital twin model was run to validate it using the behaviors of operational data reported by experts and in the literature. The RMC industry is still traditional, and getting actual field data from the IoT system to validate the proposed DT model was a hassle. Therefore, simulation was the right option to validate the DT model more efficiently and effectively [
57]. The simulation technique is used especially for instances such as risk management in the construction industry. We cannot create risks and evaluate them in a physical environment due to the high cost and randomness of the risk occurrence. Therefore, using simulations, we can systematically create risk scenarios and evaluate them more effectively [
58]. The multi-method simulation was used as a combination of discrete event and agent-based methods to effectively represent the production’s operations and interact with customer order data, respectively.
As outputs, the operational times of each sub-production operation and the total production time were taken and pushed into the database of the BI dashboard developed with Power BI version 2.112.1161.0.
The following primary data were considered when developing the digital twin operational model:
The capacity of the mixer or quantity per production cycle: 1 m3
Monthly company targets in terms of quantity: 2500 m3 (used as no. of production cycles for the simulation)
Per day target in terms of quantity of production: 100 m3 (if there are 25 working days)
Average production cycle time: 2 to 3 min
Avg. interarrival production time: 2.5 min (when the production is run continuously for more than 1 m3 customer orders, an interarrival time of 2.5 min was also used for the simulation)
Table 2 shows the minimum, average and maximum cycle times of each sub-production operation with its probability distribution in actual time. The behavior of the actual times of each sub-production operation have a “triangular” distribution pattern [
23].
This data table was validated by ready-mix concrete industry experts for the most demanded concrete type, which is called “Grade 25” [
23].
3.5. Predictive Analytics-Driven Dashboard to Advance the Digital Twin Operational Model
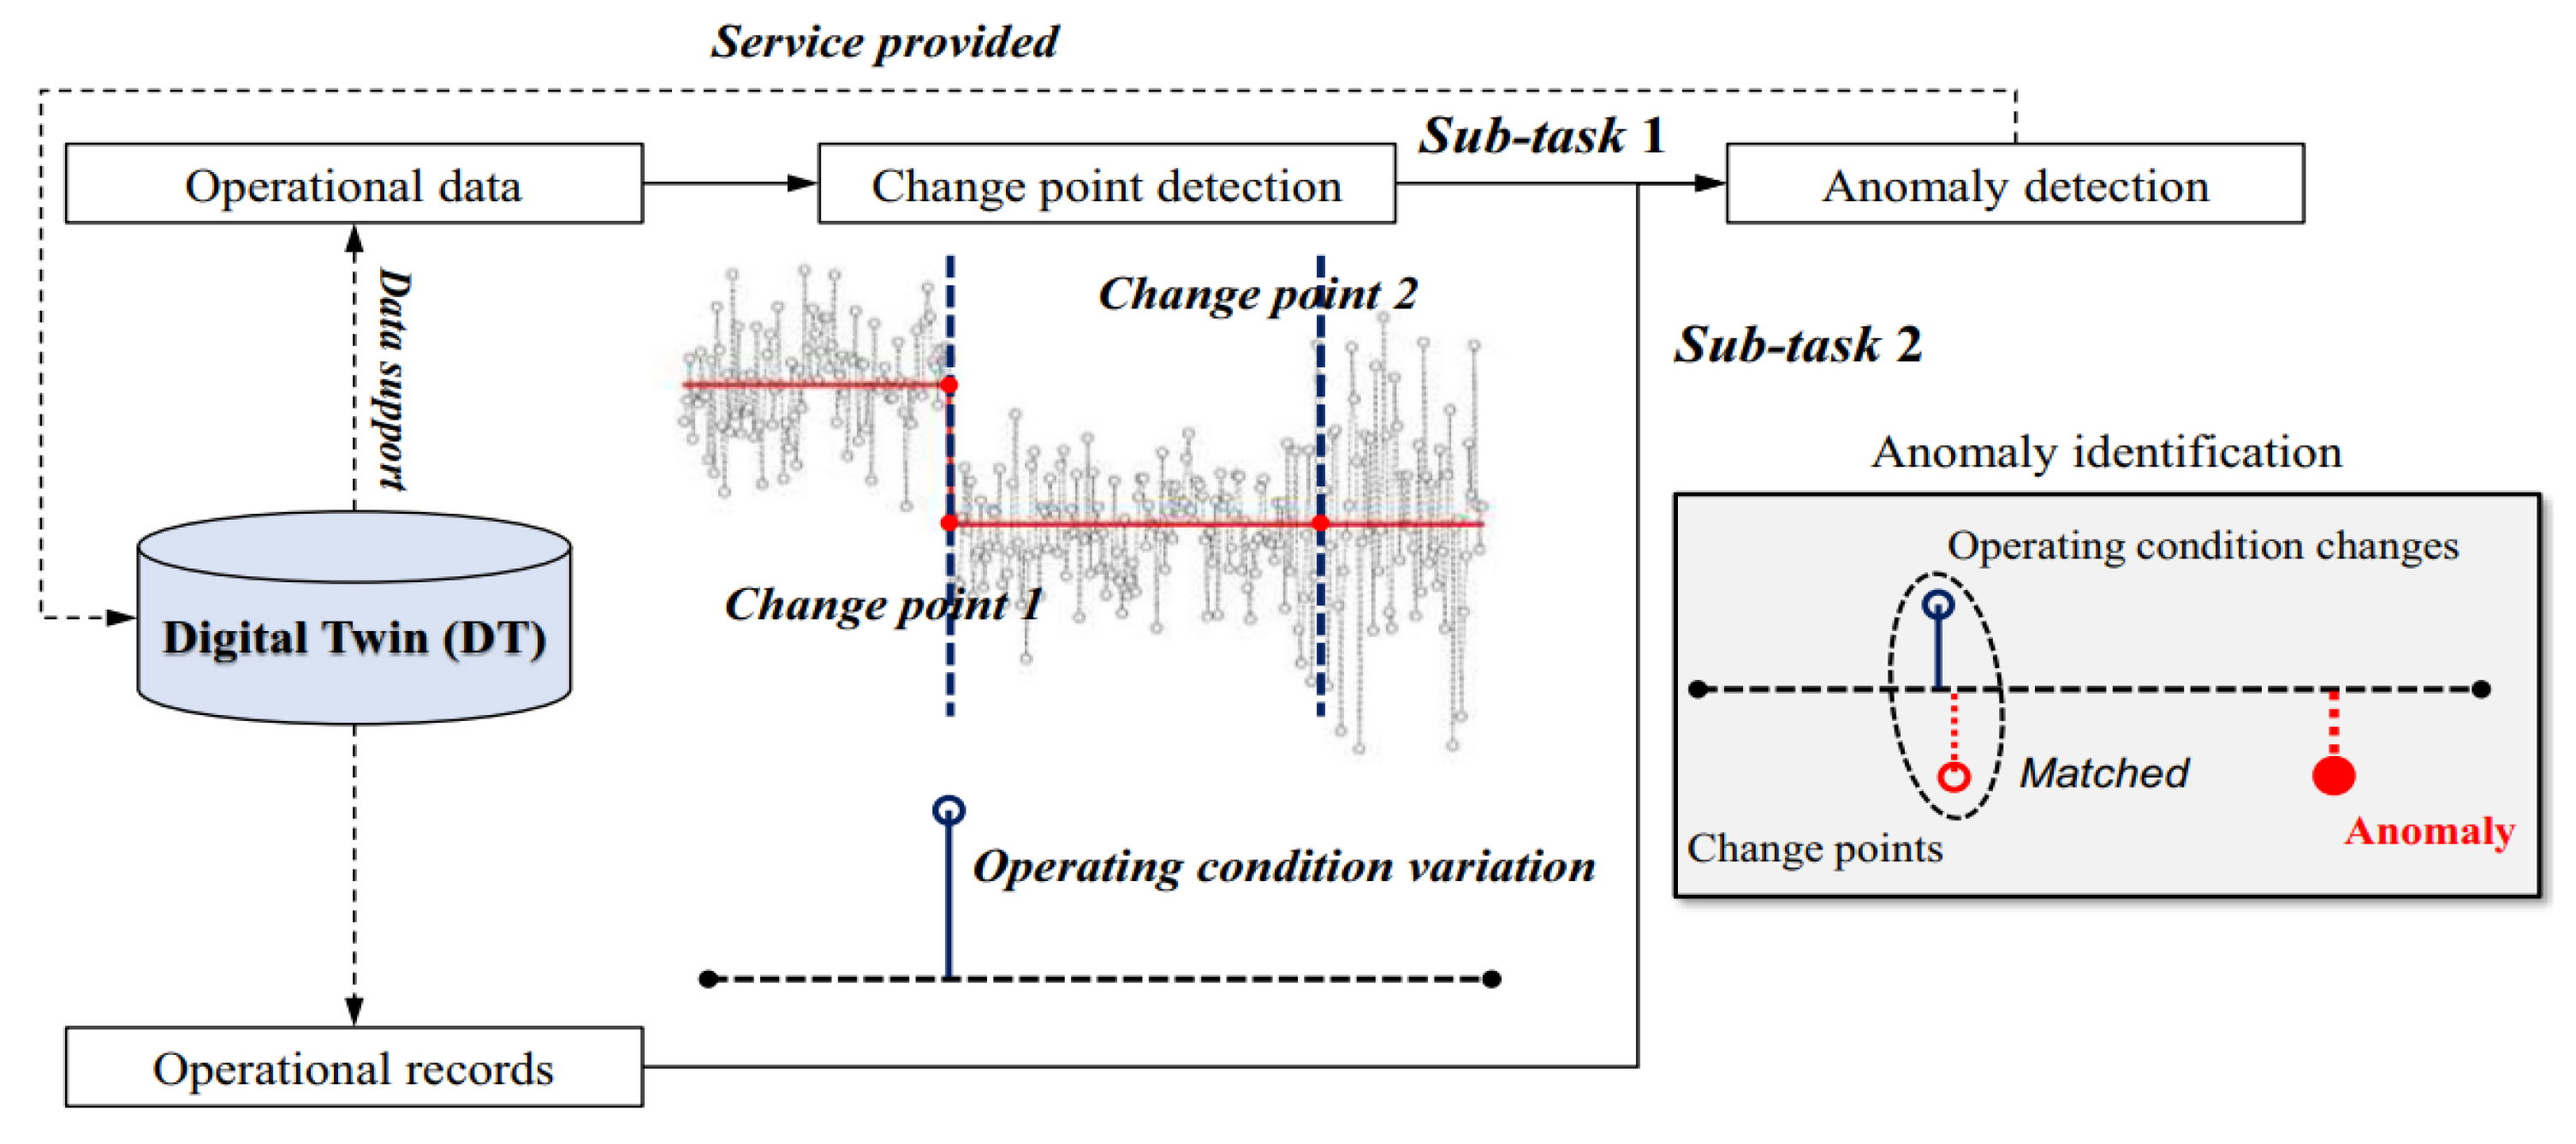
The BI dashboard segment of the digital twin system is connected to simulated data taken from the digital twin operational model developed in Anylogic. To depict the advanced analytical insights in the dashboard, we only took 50 data points on graphs to represent orders produced in 4 h. (Daily target =100, operation h =8). Here, we assumed that the time gap between each order production cycle’s starting times is fixed and that all of the orders in a day are produced continuously. Therefore, we defined the X-axis as the order number and the Y-axis as the total production time for each order. Two graphs were used to visualize predictive maintenance insights for each sub-production operation by using two methods, which were anomaly detection and production time forecasting for upcoming production cycles.
Anomaly detection was used to identify production time anomalies, and outliers were identified as potential bottlenecks. To identify anomalies, a combination of Spectral Residual (SR) and Convolutional Neural Network (CNN) algorithms were used, which are proven highly accurate models introduced by Microsoft. Moreover, these algorithms apply well to different patterns, making this an efficient solution for all general scenarios. The functionality of this combination of algorithms is, first, SR’s transformation from the visual saliency detection domain to get the anomalies from the result, generalize the scenario and then apply the CNN to the results given by the SR model [
59]. This model can be configured via the sensitivity parameter, which makes this algorithm sensitive to changes in data. High sensitivity has high anomalies, and low sensitivity produces low anomalies. The necessary sensitivity of anomalies depends on the customer service level in the company and the type of machinery used in each sub-production operation.
The process forecasting function predicts the next 10 production cycles, and the trend line of the production time’s forecast is used to indicate whether the production line is safe or not. If it has an upward or downward trend, then potential production inefficiencies or final product quality issues, respectively, can happen. If the trend line is horizontal, then it indicates that the production process is safe (10 production cycles were forecasted because it usually takes around 45 min for the maintenance team to prepare and inspect potential production bottlenecks).
As the forecasting function, we used the Exponential Smoothening (ES) technique developed by Microsoft. Here, it assigns exponentially decreasing weights for newest to oldest data points. Furthermore, trend and seasonality components are embedded for exponential smoothening and better accuracy. In addition, it is more appropriate for short-length forecasts, and it is a proven method for better results. Parameters such as confidence level and seasonality must also be specified [
60,
61,
62,
63]. The confidence level, 95%, specifies the upper and lower boundaries of the forecast. Seasonality was taken as 50 because 50 orders are usually processed in 4 h of time. To evaluate the accuracy of the production process forecasting model for disruption prediction, we mainly used RMSE and MAPE formulas. These two models are popular methods used for better forecasting in most industries. Here, we took the forecasting time interval as 10 periods and compared it with actuals. For RMSE, its value must be close to 0 for the forecasting model to be a good model, and for MAPE, it is as follows in
Table 3 [
64,
65].
3.6. Technical Feasibility of the Proposed Digital Twin
The proposed digital twin of the RMC operational risk management system was evaluated by experts for its technical feasibility by how well it fulfilled the below needs:
Having a working model of the product
Measuring how the product will perform
Design for the production process
Design of the product [
51]
3.7. Business Value of the Solution for the RMC
The business value aspect for the RMC plant, was identified and further discussed how the proposed solution benefits both the RMC plant and clients with experts in RMC. The business value was interpreted by highlighting risk scenarios that the proposed system can manage and the benefits that it can bring to the ready-mix concrete business through expert interviews.
3.8. Challenges in Implementation
A fishbone diagram was developed to cover the five main challenges in the implementation stages of this product in the RMC business with experts in RMC. Those challenges, namely human restrictions, technical issues, industry background, production environment and management style were analyzed as well as their root causes to actively work on critical areas of implantation more effectively and efficiently.
4. Results and Discussion
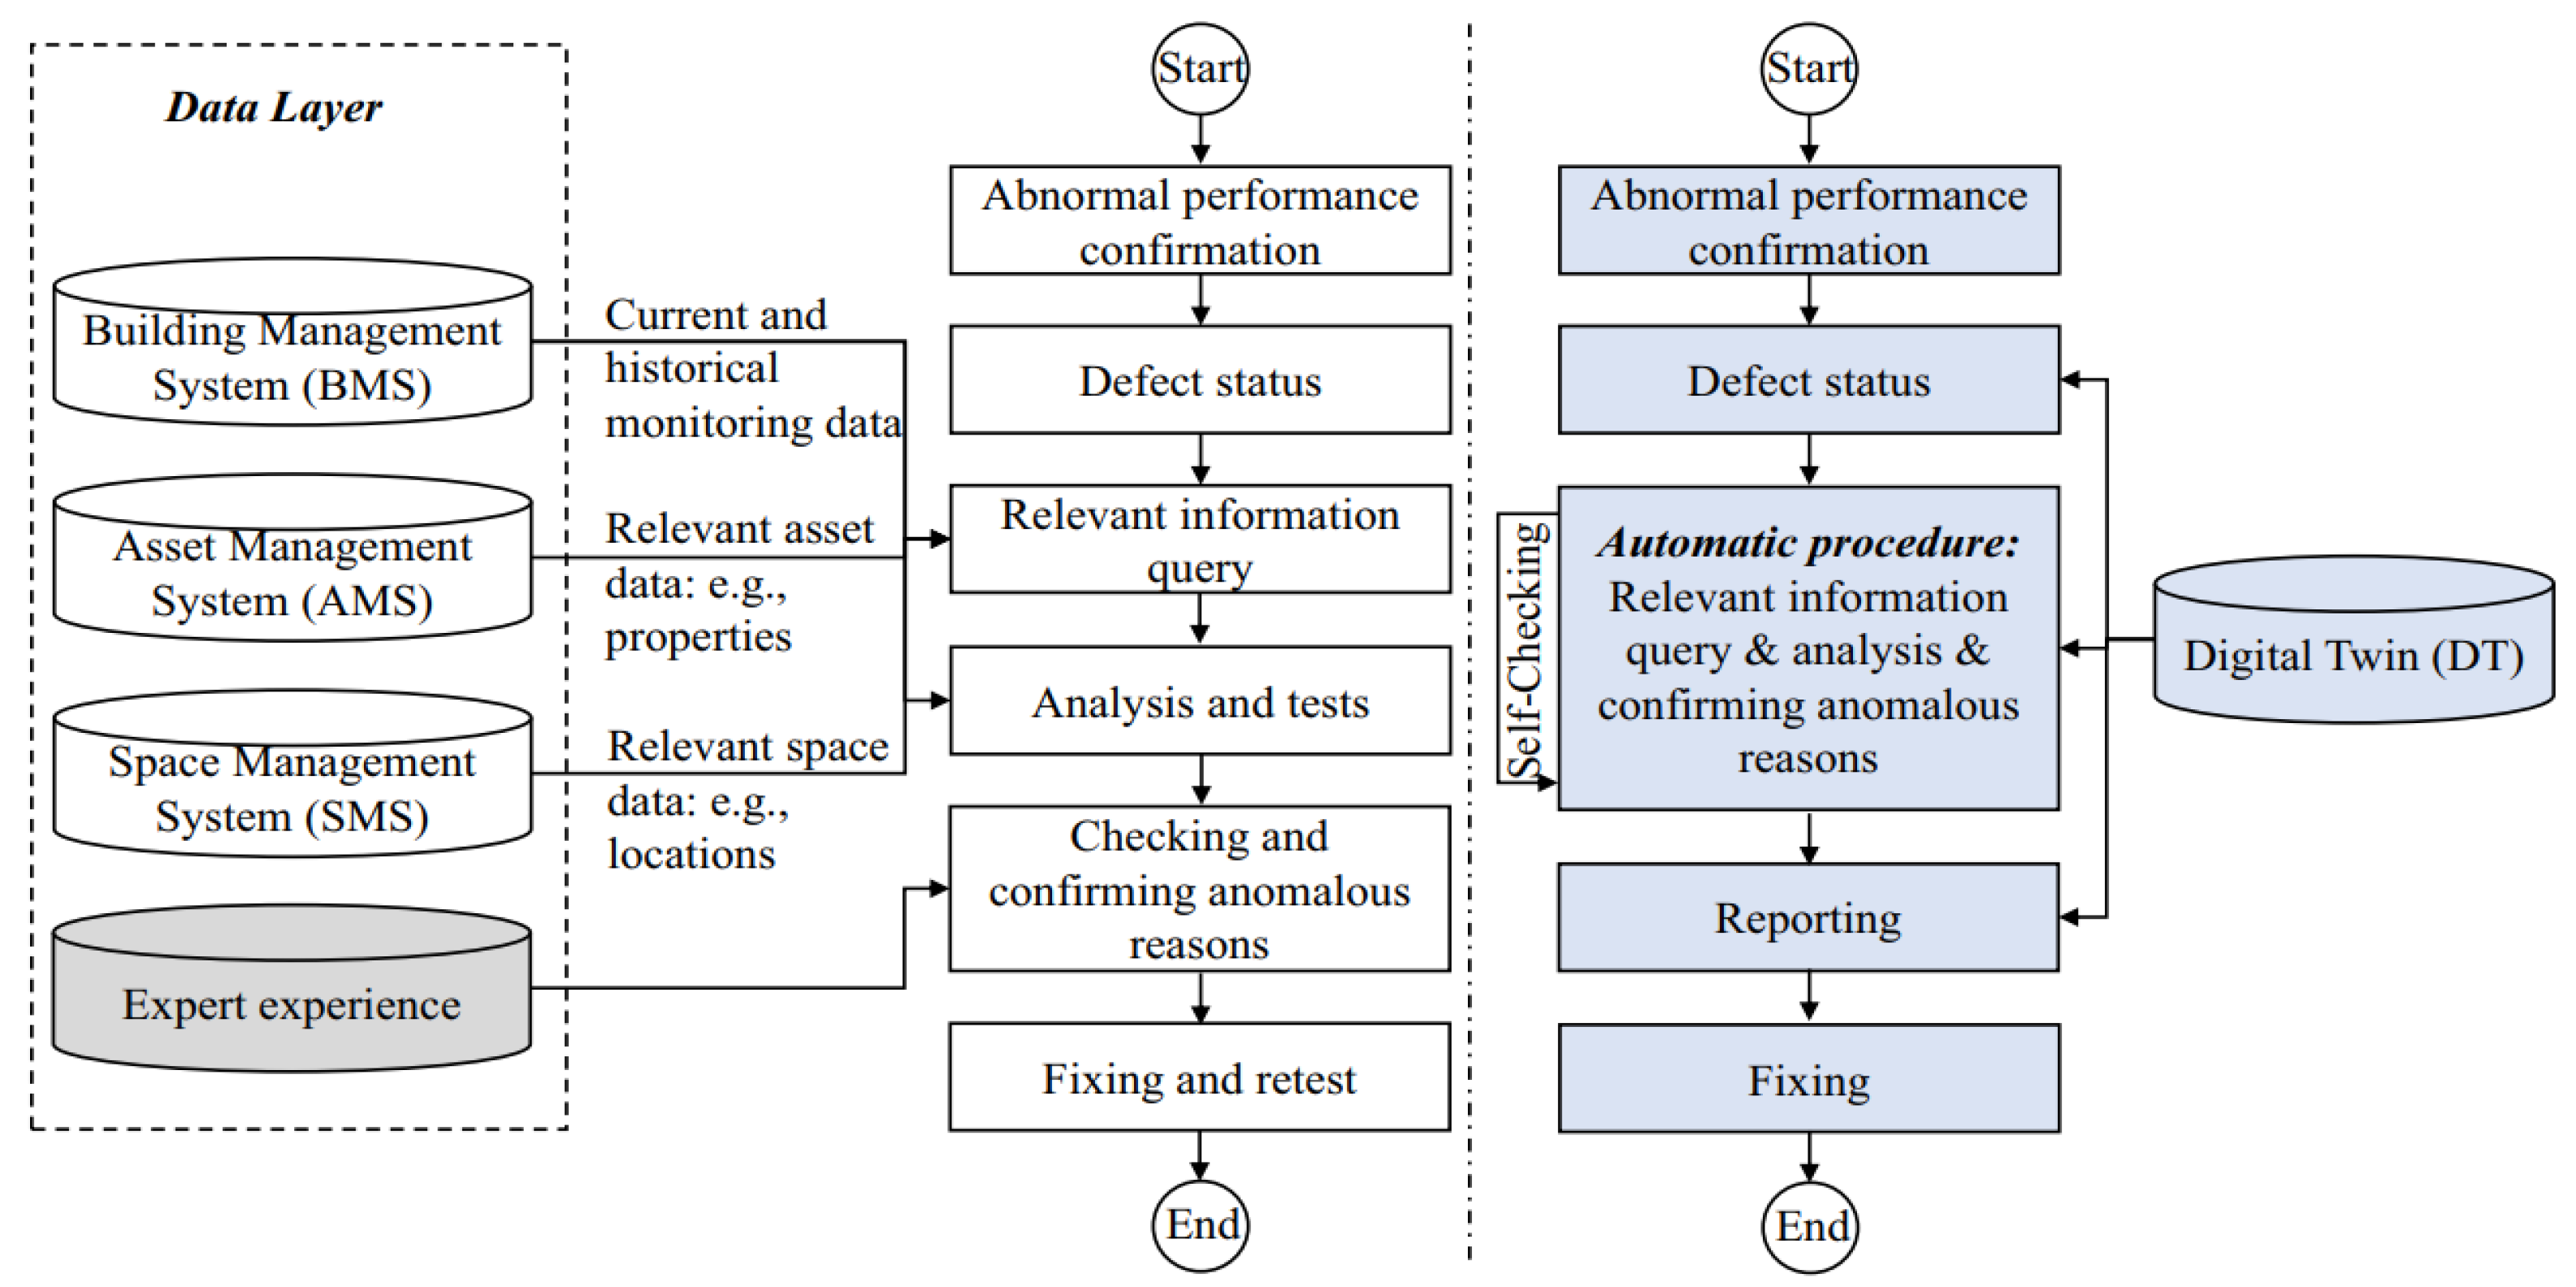
4.1. Digital Twin Product Architecture
As shown in
Figure 6, this digital twin hierarchical architecture shows a comprehensive interpretation of the application and functional aspects of digital twin development, which was customized for the ready-mix concrete plant layout and production operation. Each layer has its own functionality to build and run the DT as follows.
Service Layer—The service layer ensures the interaction between the maintenance team and the data/model integration layer with the support of the knowledge insights produced with Knowledge Engines (KE). The service layer provides the required production operational insights for maintenance engineers to be alerted to potential breakdowns and operational inefficiencies, allowing them to react on time to ensure a seamless operational flow. Moreover, top management can evaluate the actual service level that their RMC company can offer to customers.
Data/Model Integration Level—This is the core of the entire architecture, which integrates all of the data and does additional functions such as data manipulation, storage, analysis, processing and learning to interpret decision support insights (e.g., asset anomaly detection) by utilizing tools such as artificial intelligence, machine learning and simulation by using extracted data.
Digital Modeling Layer—The digital modeling layer contributes to the upper layer for real-time monitoring and managing assets by functioning in two ways with both as a digital model and supplemental information. The digital model is the digital replica of the physical asset (e.g., the asset information model and building information model), and it uses supplementary information (operational time, speed of the motor in the mixer).
Transmission Layer—The transmission layer is the segment that transfers the acquired data into upper levels for advanced modeling and analysis. Various methods are used for communication, such as short-range coverage access network technologies as well as wider-coverage and on-field data transmission techniques (e.g., PROFINET wires). PROFINET wires have been used for our research study because they are commonly used in rough environments, even in harsh environmental conditions. They support 100 Mbps ethernet at a 100 m distance without any interruptions or data breaches [
66].
Data Acquisition Layer—The data acquisition layer is the base of the digital twin system; it extracts real-time data in large volumes to feed and sort into the upper levels by the processing type, format, source and content of the data, which are collected with different techniques such as distributed sensor systems and wire communication.
4.2. IoT System Architecture
As shown in
Table 4, by placing the different sensors (e.g., reed switches) and machinery components (e.g., flow meters and load cells) in the machines of the plant, they generate digital and analog signals to indicate the performance of each sub-production operation within the entire production operation (
Appendix A.1). Then, a programmable logic controller (PLC) processes the data in a way that allows the data to be readily used as a database.
This dataset is connected to the Anylogic internal database to feed the real time operational data to the digital twin operational working model created in the Anylogic platform.
The Anylogic database is linked to Power BI to derive advanced analytical insights for key performance indicators (KPIs) in the dashboard and make accurate decisions for predictive maintenance by analyzing process anomalies and forecasting the production process to spot potential disruptions.
Figure 7 shows the IoT product architecture.
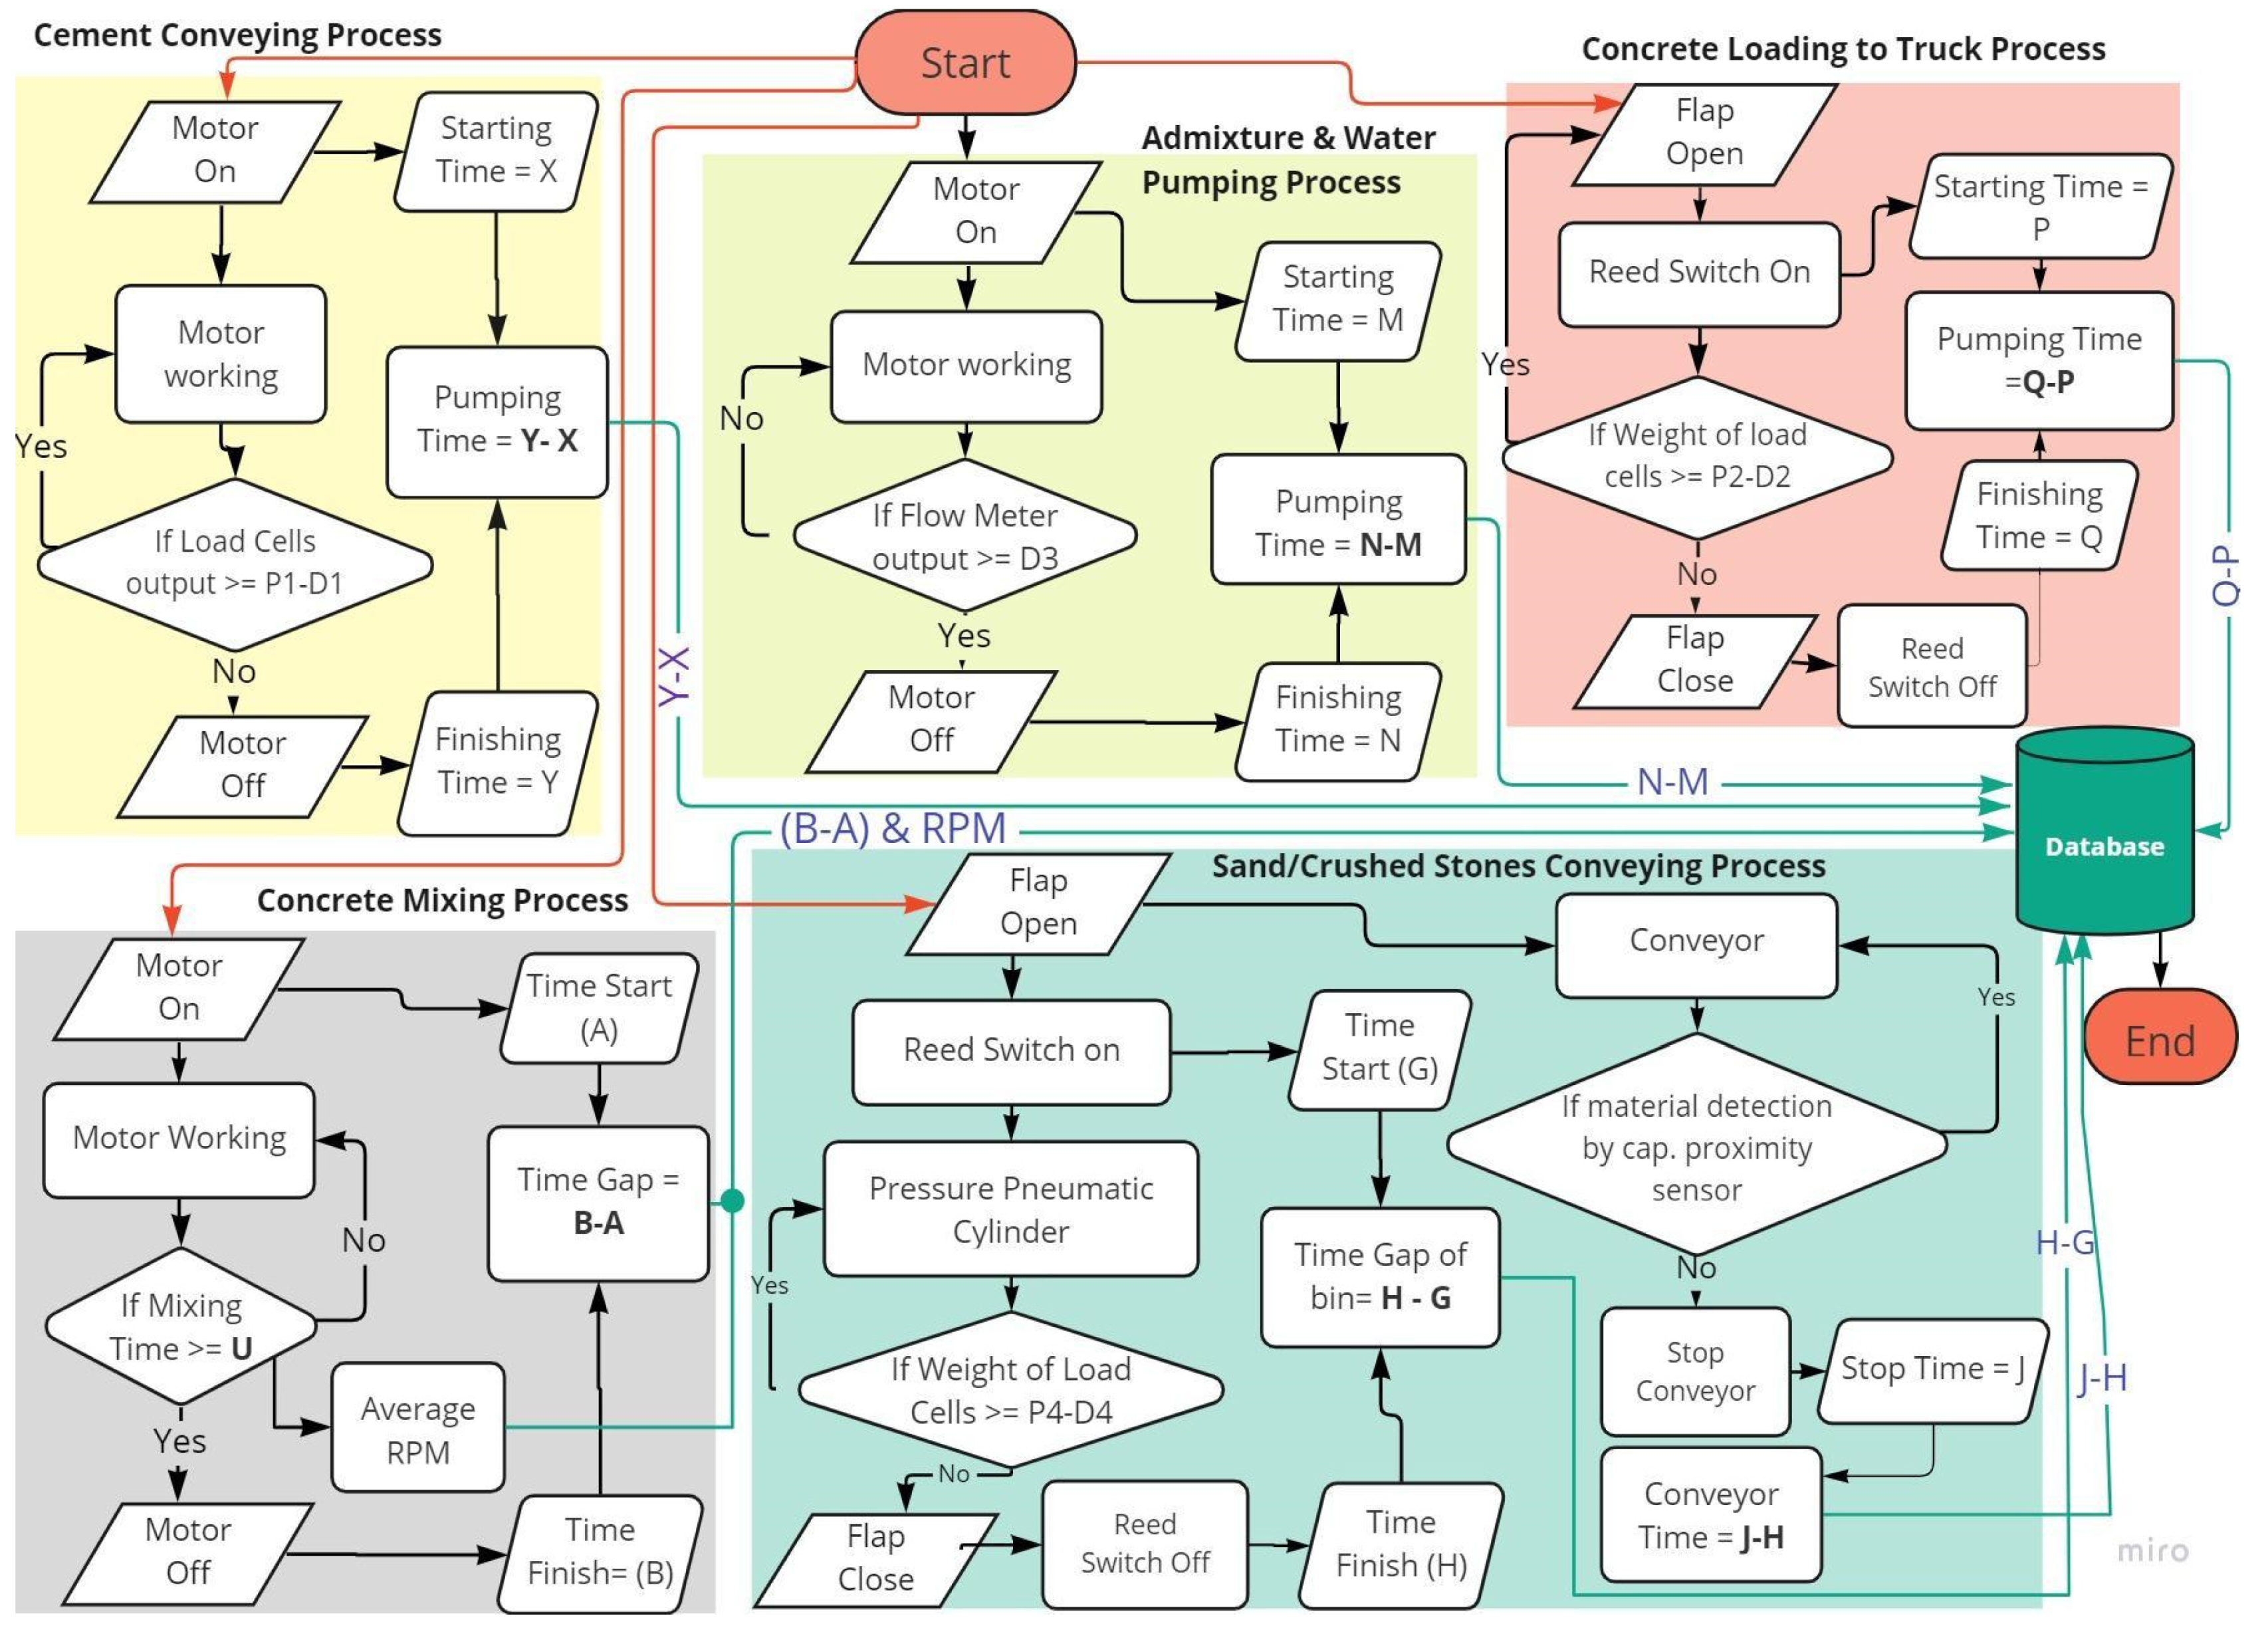
4.3. Logical Flow of IoT System
Figure 8 represent the entire logical flow of the IoT system, which helps implementers to code the PLC to make it is functionable properly.
Table 5 indicates the operational parameters used in the RMC production operation which consists of cement conveying, water/admixture pumping, sand/aggregate conveying, mixing and loading concrete into the truck, whilst
Table 6 shows the completion time of the each sub-production operation. Then, the completion times are directed to the database to provide the required data to the digital twin platforms, including for the Anylogic operational model and Power BI dashboard.
4.4. IoT System Functionality in Sub-Production Operations
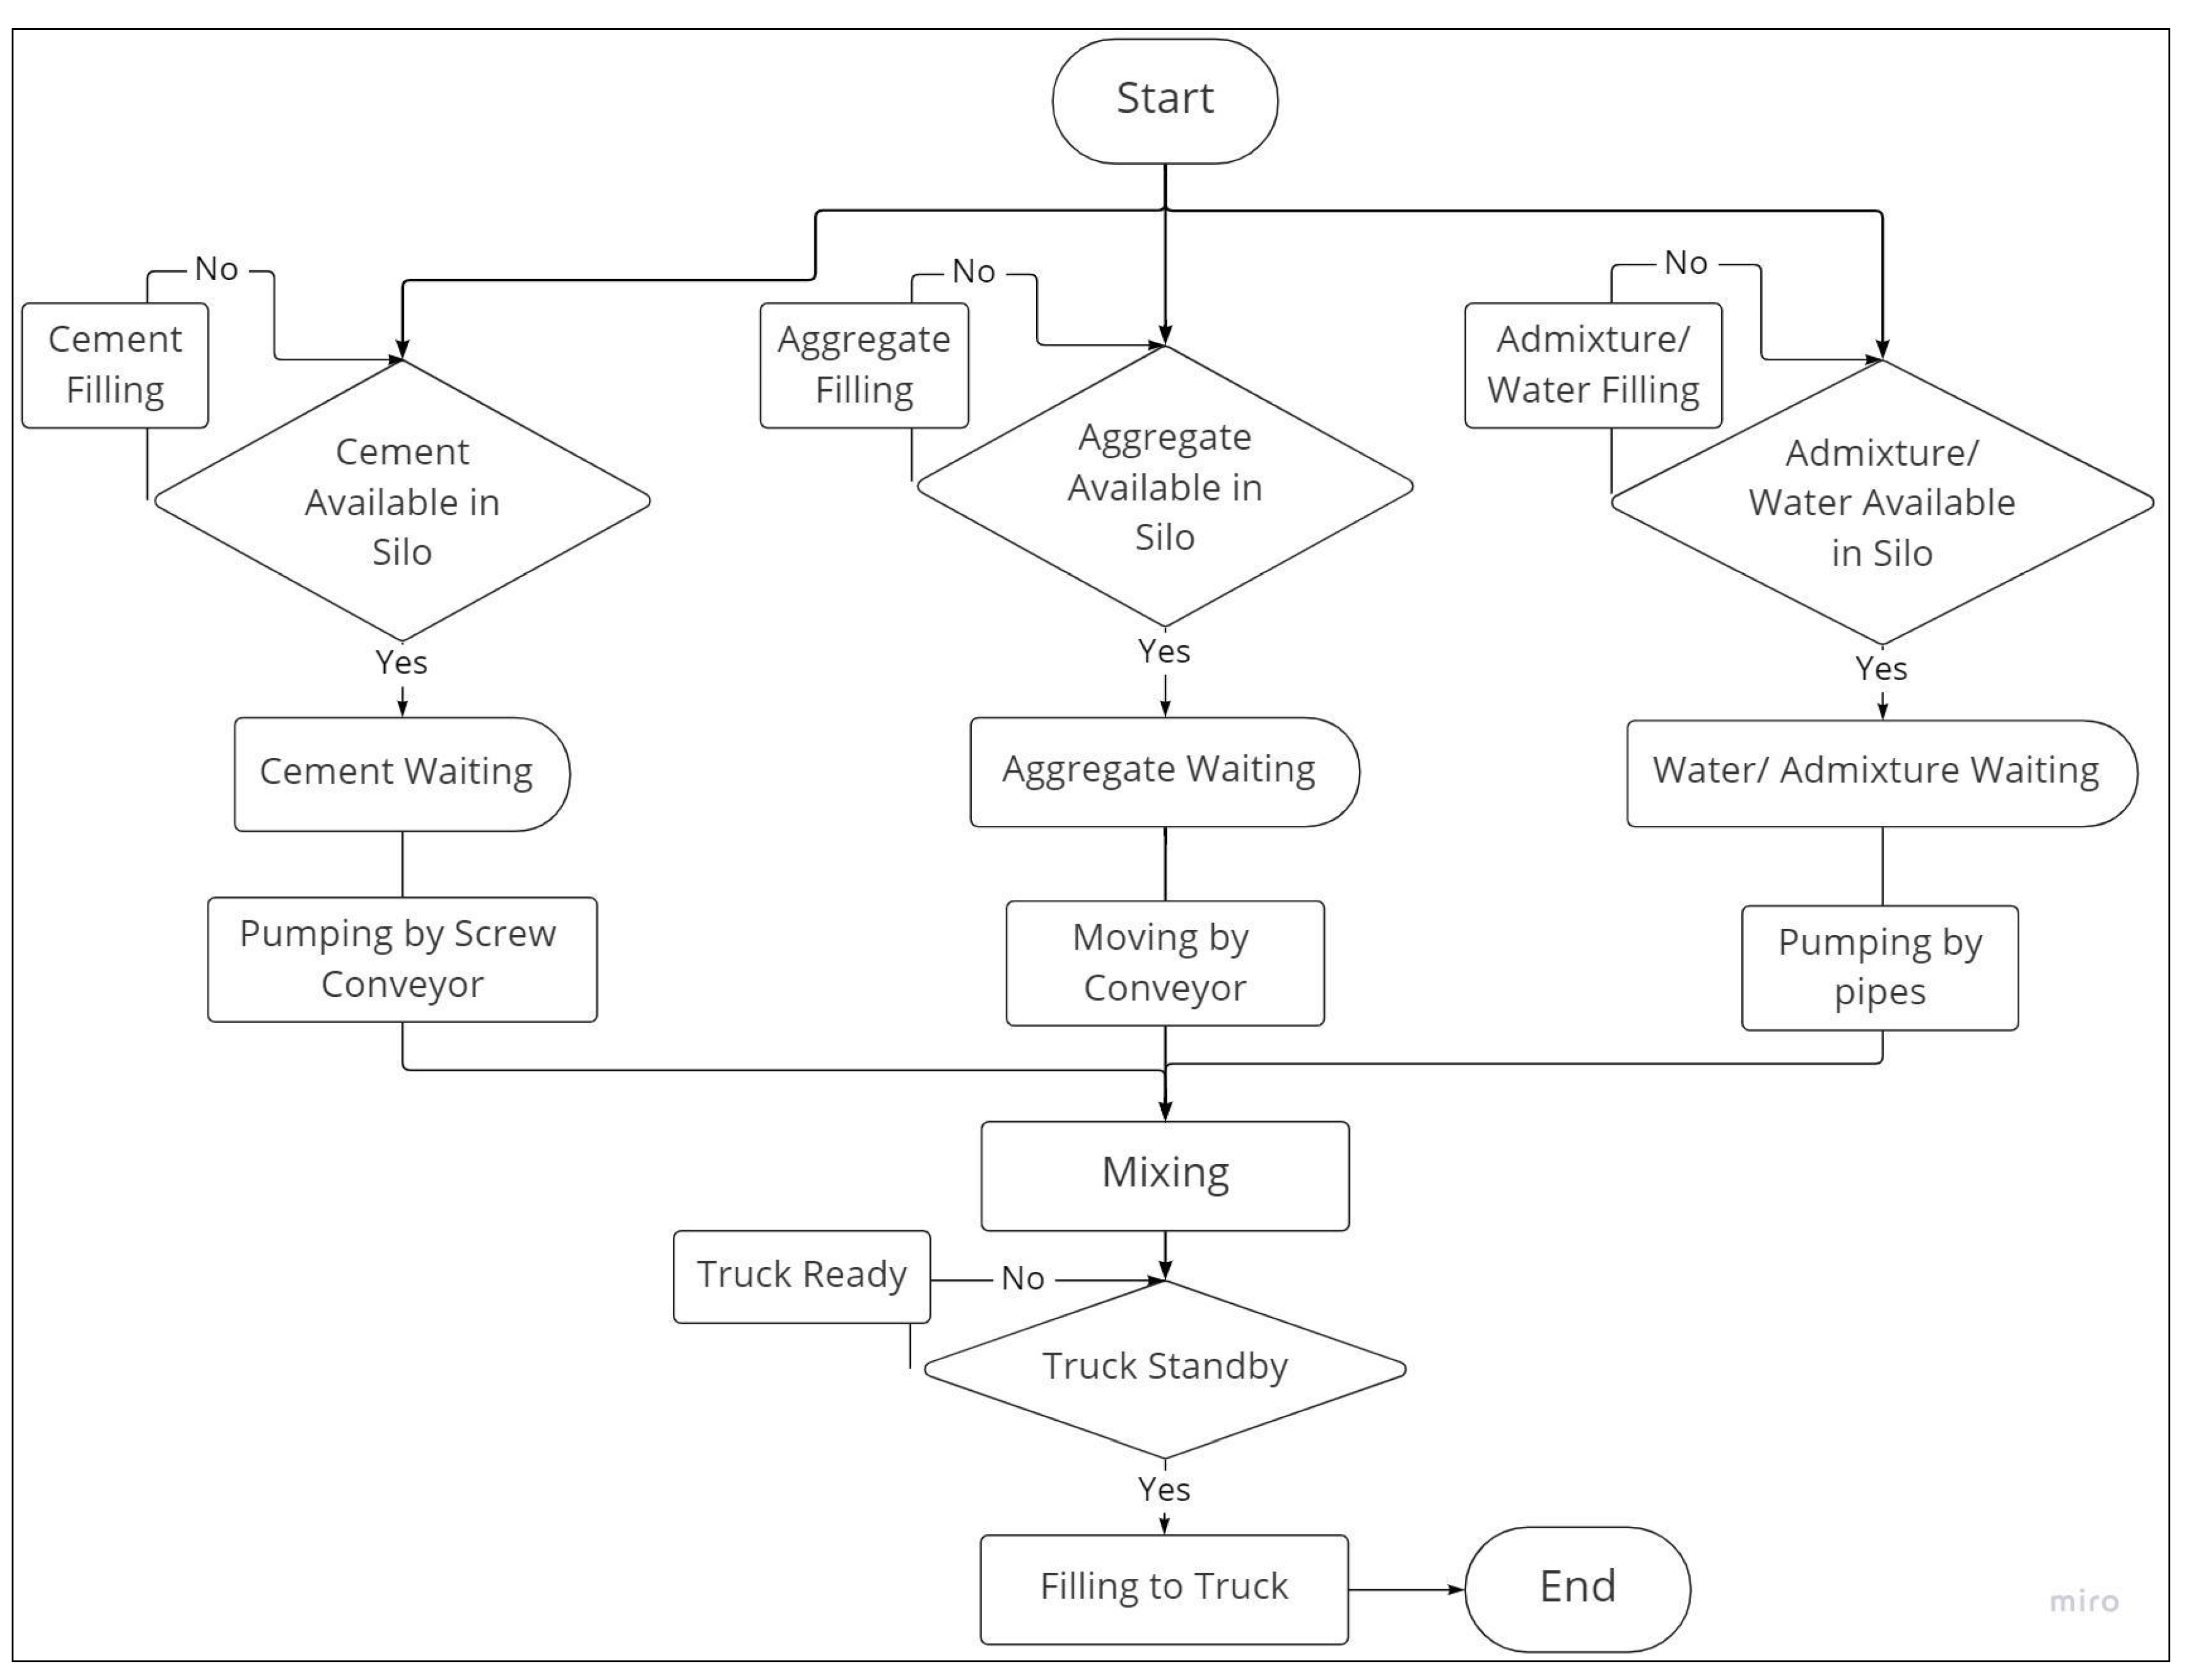
4.4.1. Cement Weighing and Conveying Process
In the cement conveying process as shown in
Figure 9, a signal is generated by the auxiliary point and sent to the PLC through a distributive controller when the motor of the screw conveyor starts/stops its operation. When cement is moving through the screw conveyor, the load cell amplifier shows the average weight of all four load cells, which is the total weight of the cement silo at any given time. The motor stops when the load cell amplifier shows the weight reduction of cement weight as per the order specification from the initial weight of the cement silo. The PLC collects the motor’s start and stop times and calculates the difference to get the total production time, as shown in the logical flow in
Figure 8.
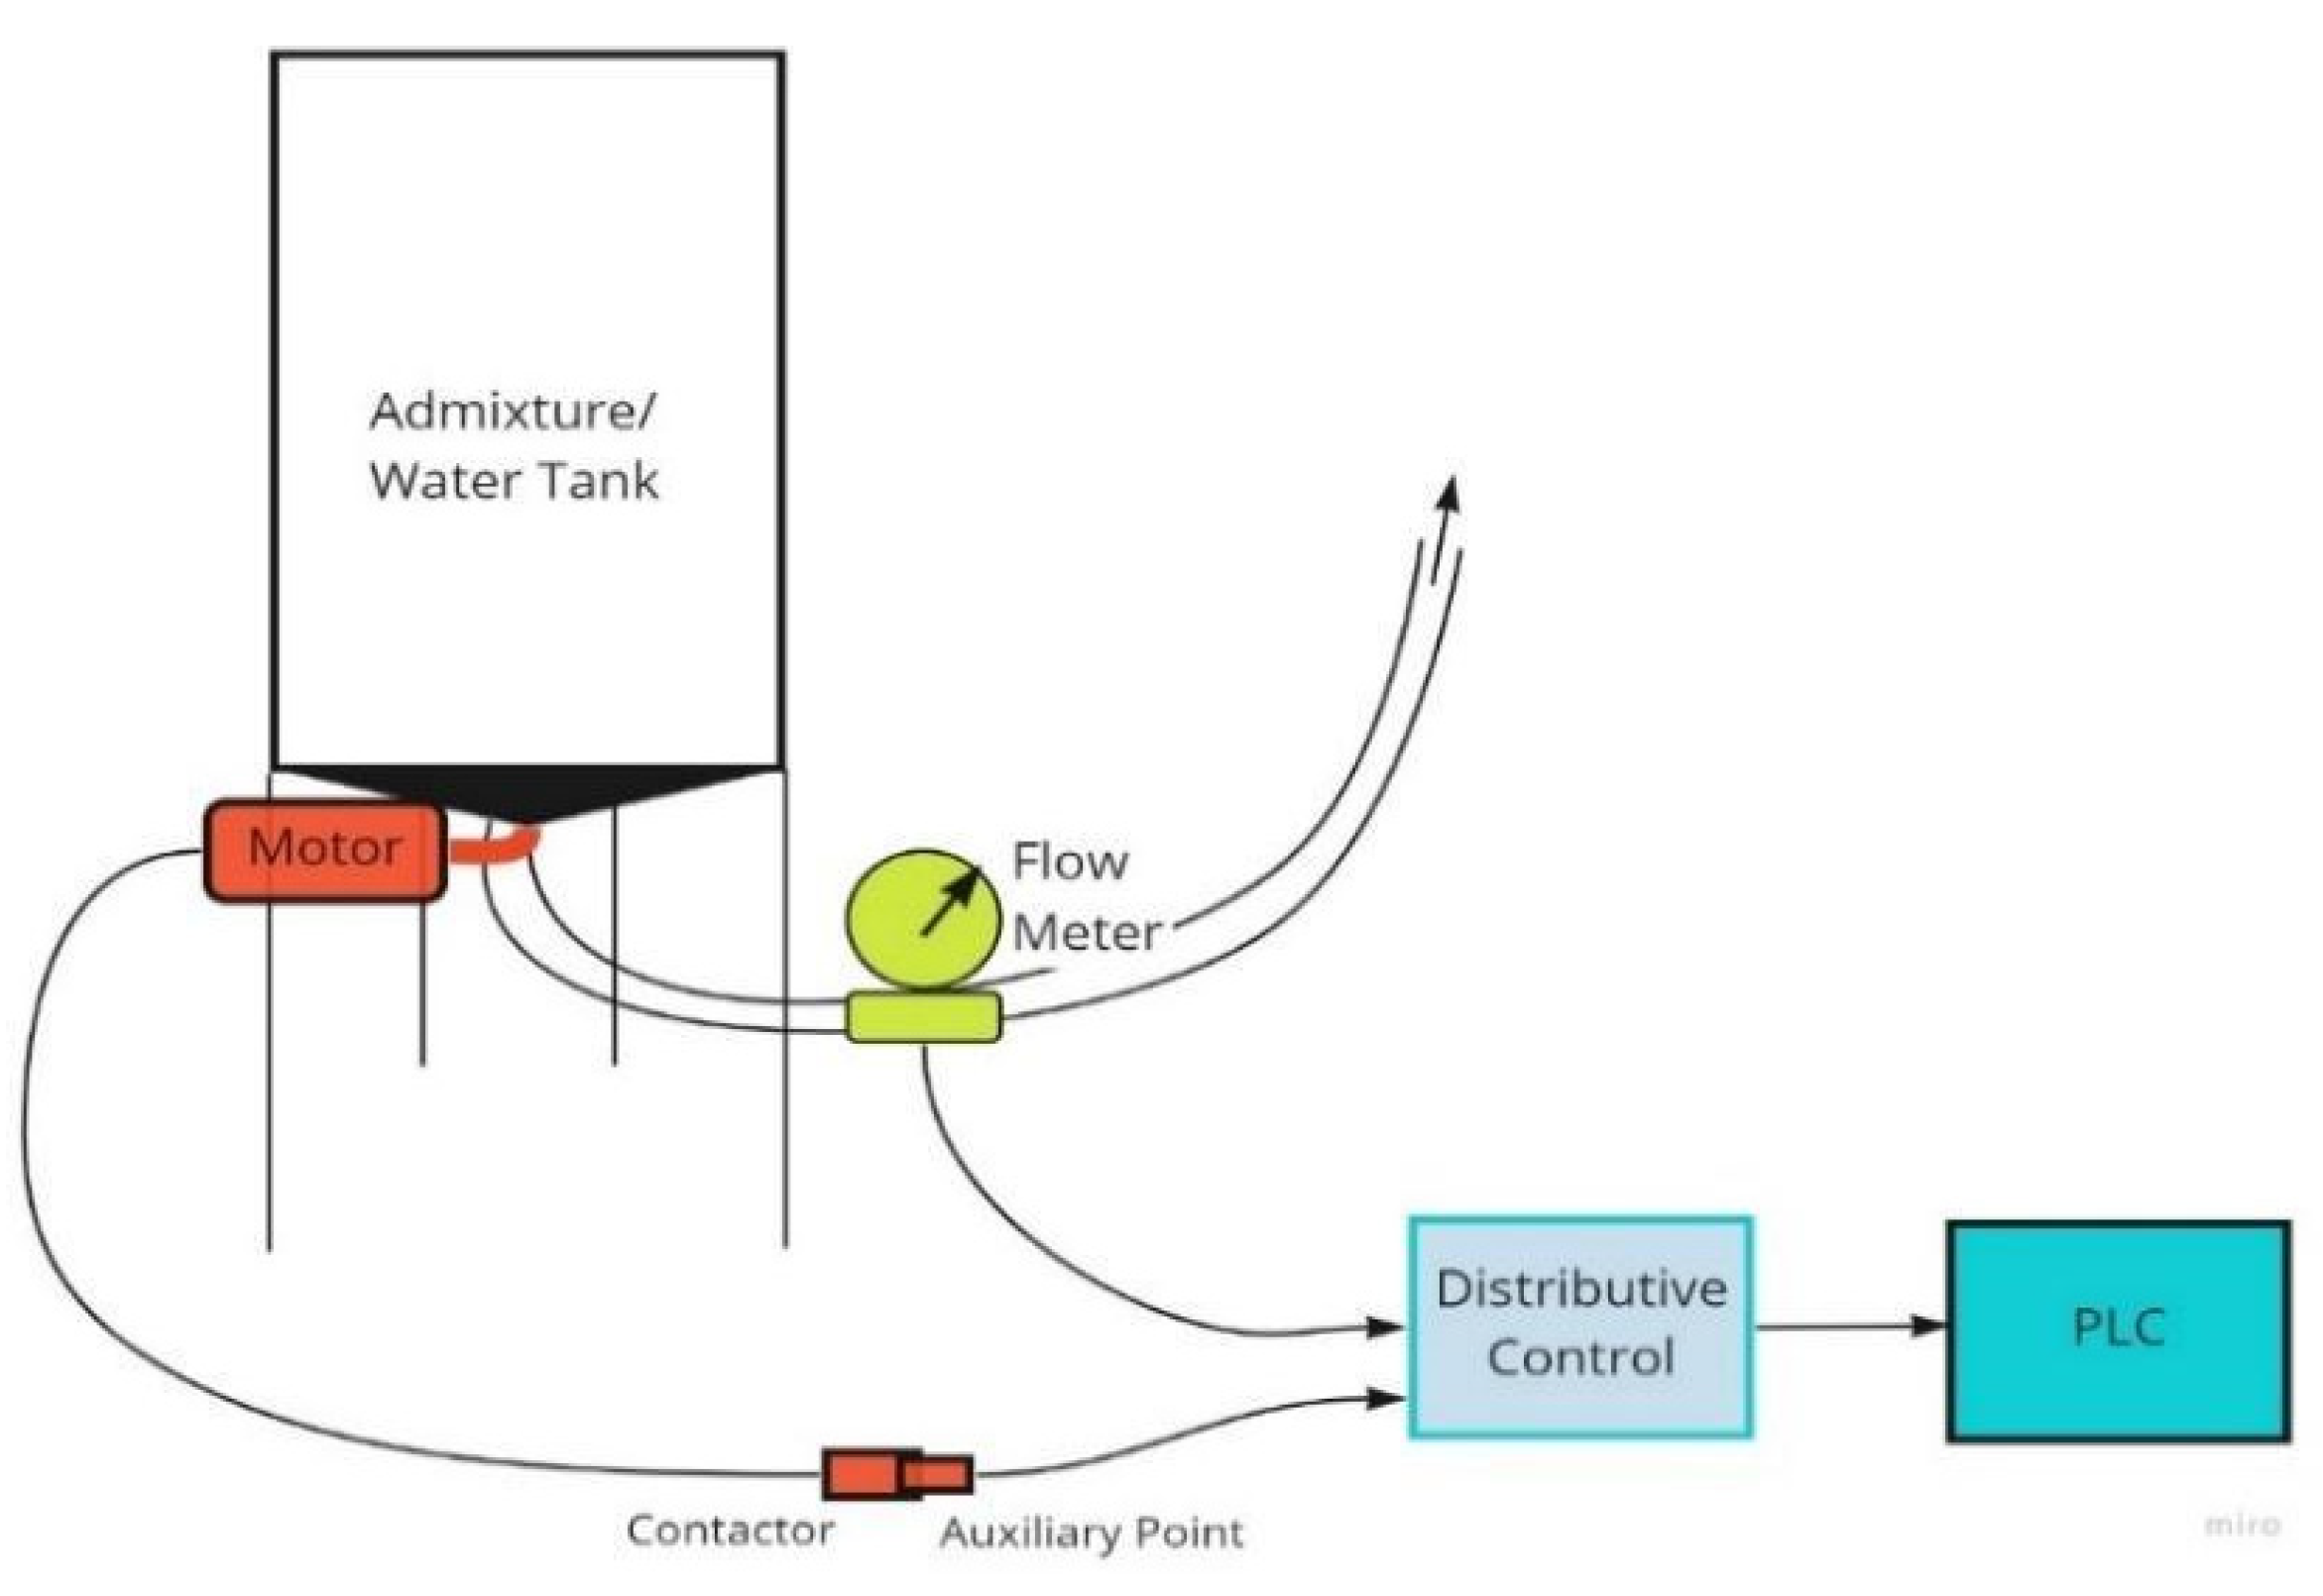
4.4.2. Admixture (Chemicals) and Water Pumping Process
In the admixture/water pumping process as shown in
Figure 10, a signal is generated from the auxiliary point and sent to the PLC through the distributive controller when the pumping motor starts/stops its operation. The flow meter shows the volume that went through the pump, and the motor stops once the flow meter indicates the right volume of admixture/water. The PLC collects the motor’s start and stop times and calculates the difference to get the total production time, as shown in the logical flow in
Figure 8.
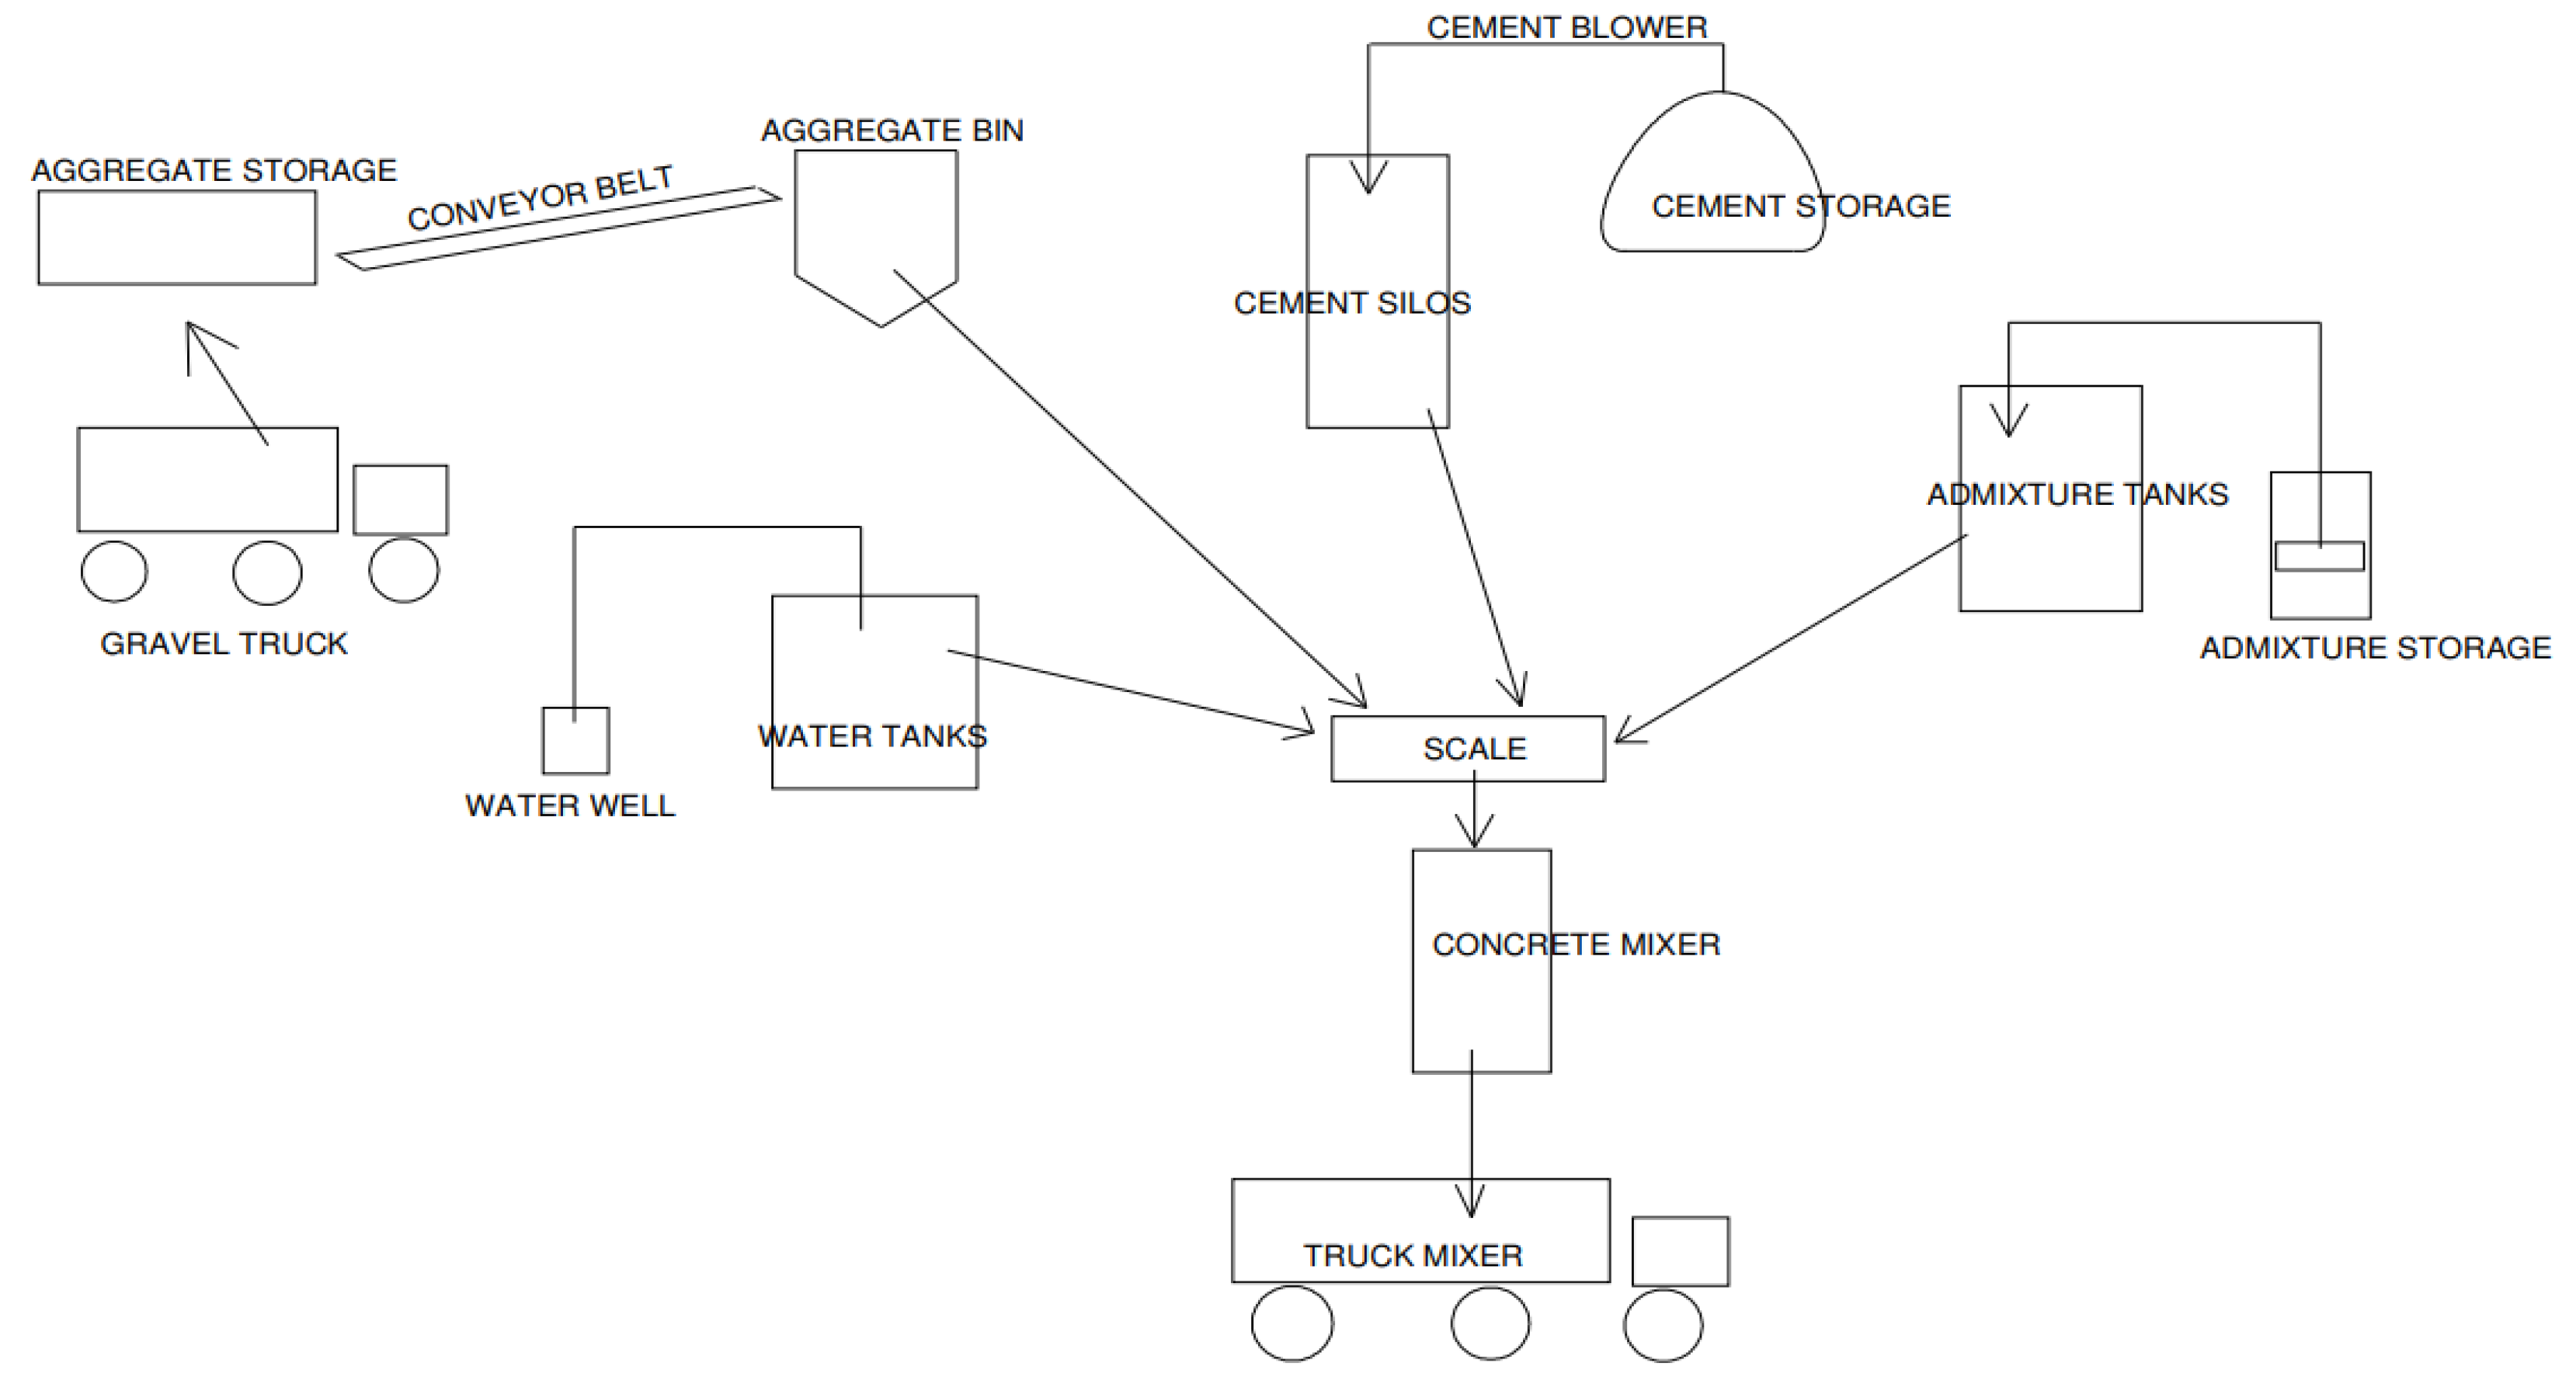
4.4.3. Sand/Crushed Stone (Aggregate) Weighing and Conveying Process
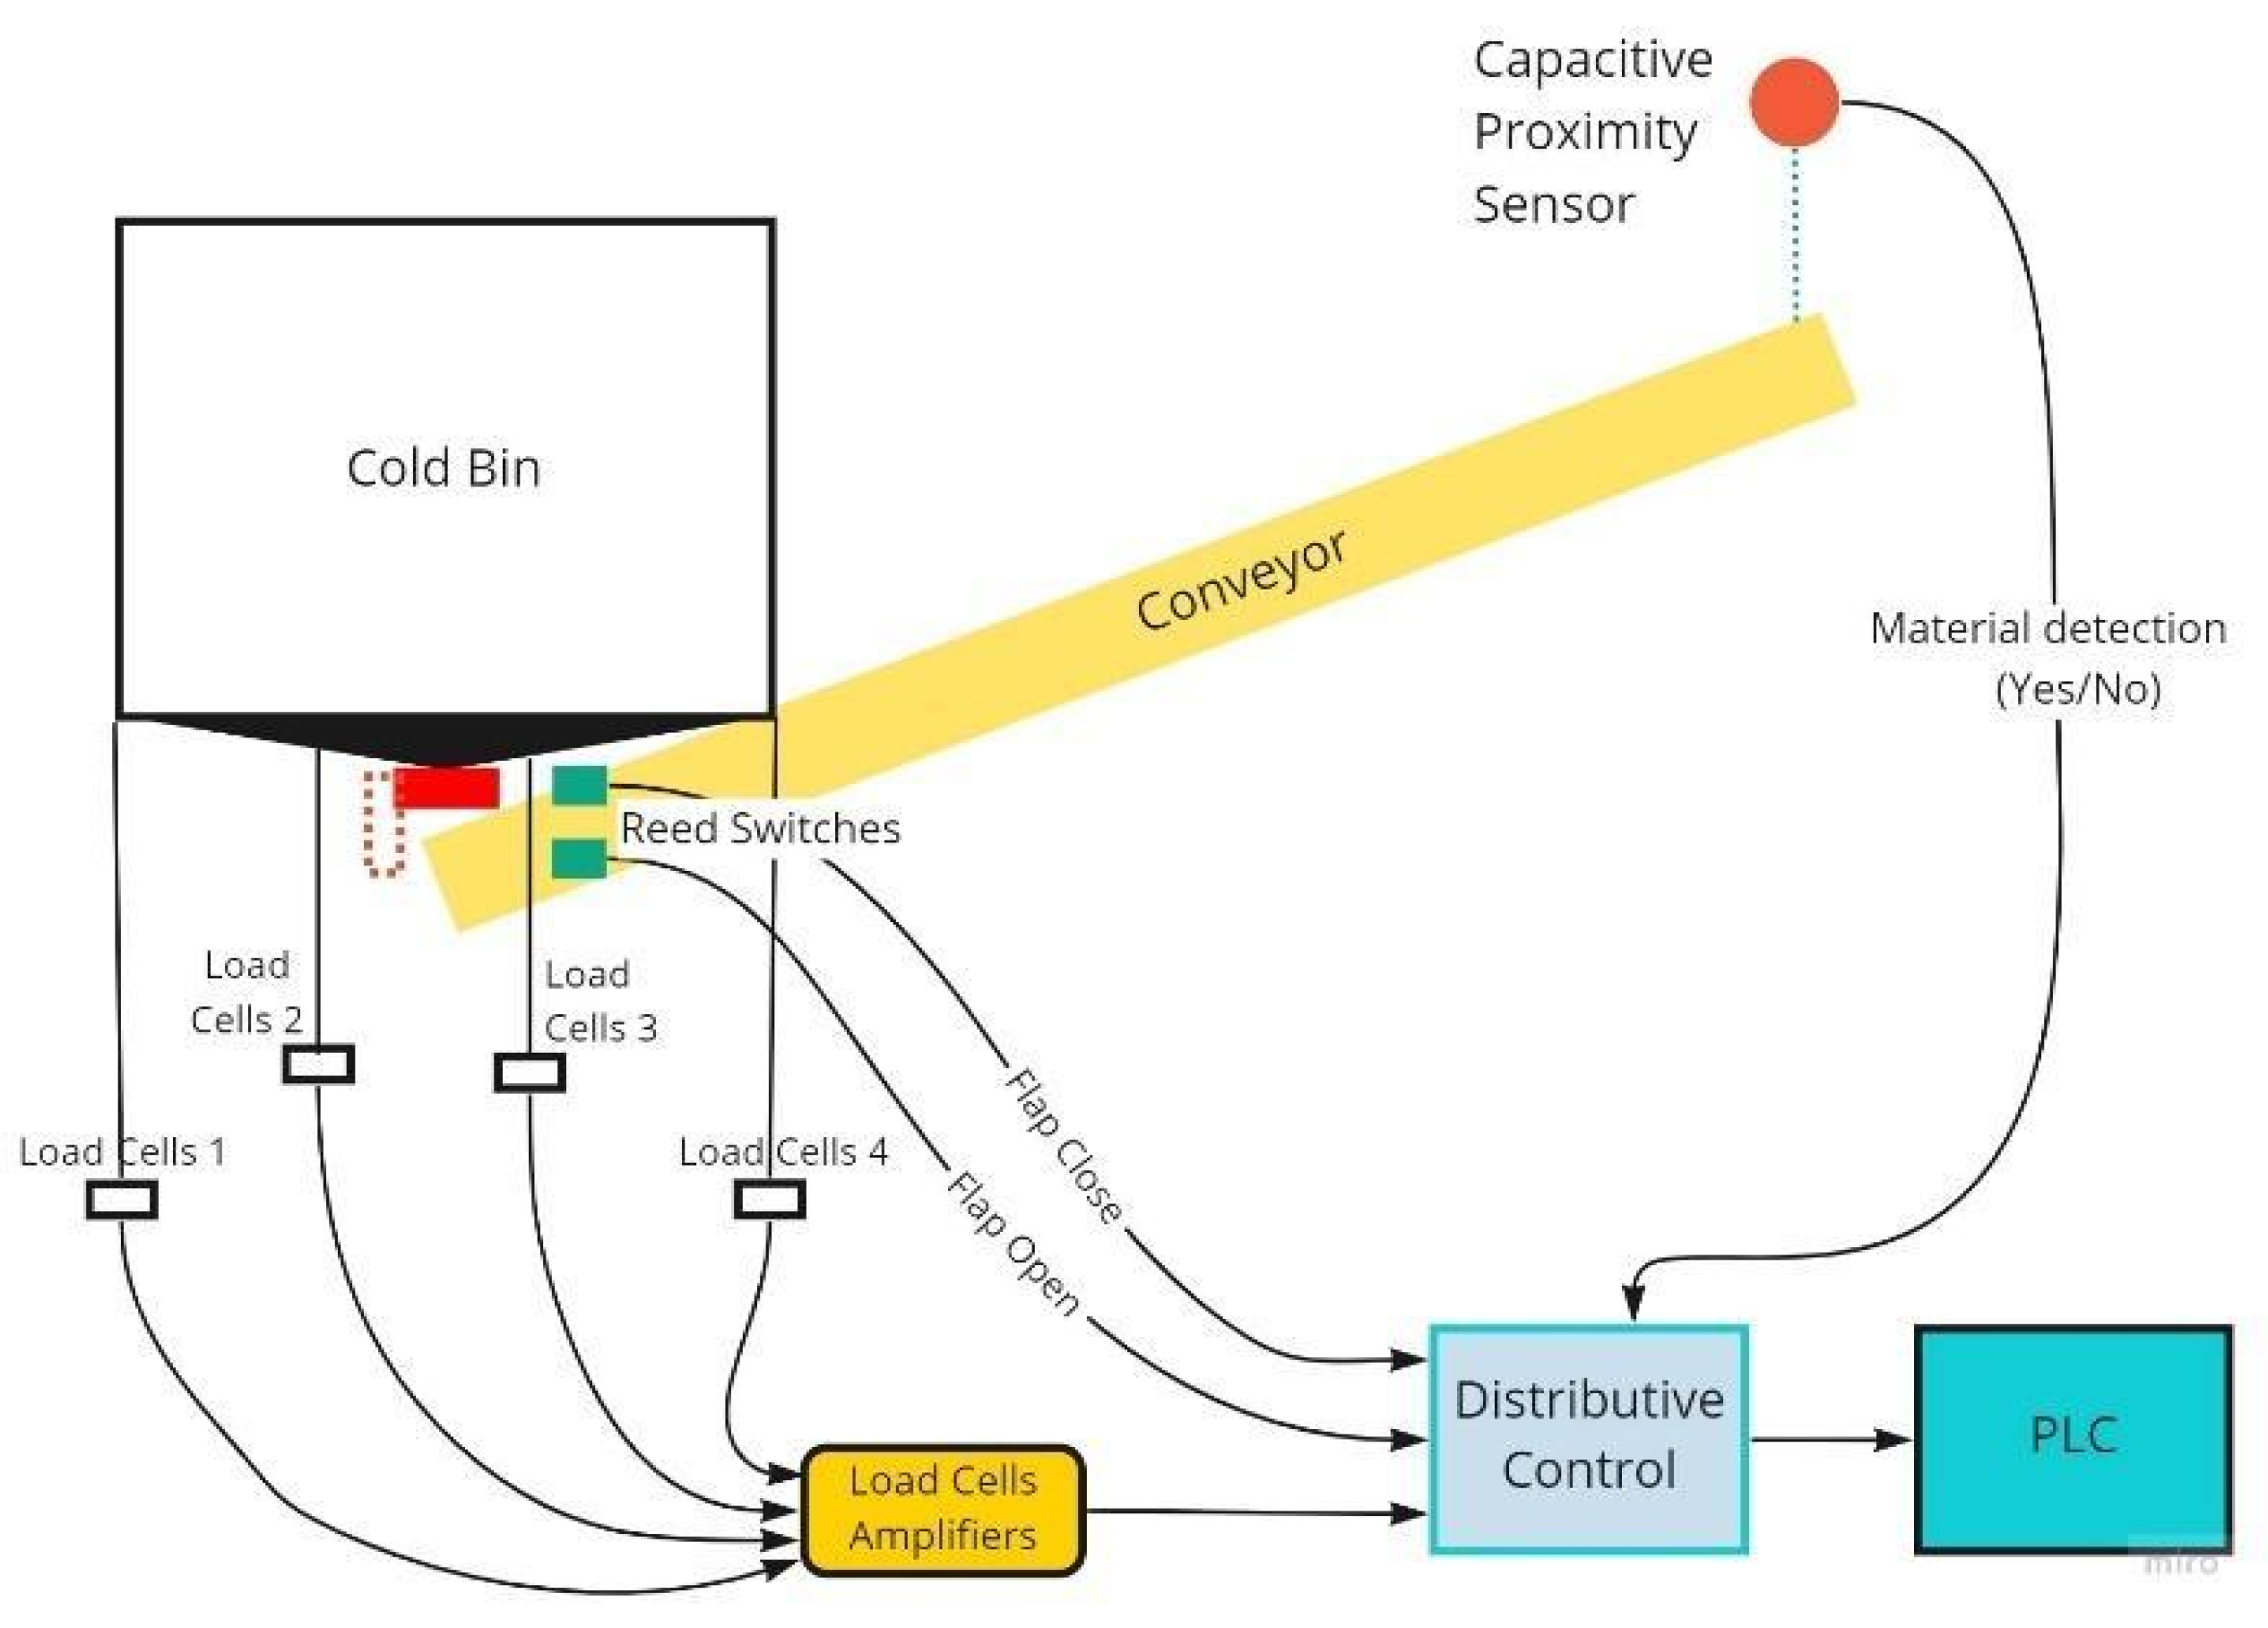
In the sand/crushed stone conveying process as shown in
Figure 11, two reed switches are there to detect if the flap of the cold bin is open or closed. When the operation starts, the reed switch detects that the flap is open, and load cell amplifiers show the average total weight of the cold bin at any given time. The flap is closed when the load cell amplifier reaches the total weight as per the order quantity.
In most of the RMC plants, the aggregate cold bins are located considerably far away from the mixer, and the time that the aggregates stay on the conveyor after the flap of the cold bin is closed is a significant part of the total operational time. This is unlike other operations, such as cement and admixture/water conveying, because the infrastructure of these are located near the mixer. Therefore, after the flap is closed, the conveyor running time is calculated and added to the time that the flap was kept open in the cold bins to get the total operational time. That capacity proximity sensor is used to identify whether the aggregate is still on the conveyor belt or not. Then, the clock time is taken once the capacity proximity sensor detects the point that the aggregate leaves the conveyor belt. The PLC gets the difference of the clock times of the flap opening and closing and adds the difference of the flap’s closing time and the clock time given by the capacity proximity sensor when the material leaves. Then, these two differences are added together to get the total operational time.
4.4.4. Concrete Mixing and Loading Process to the Truck
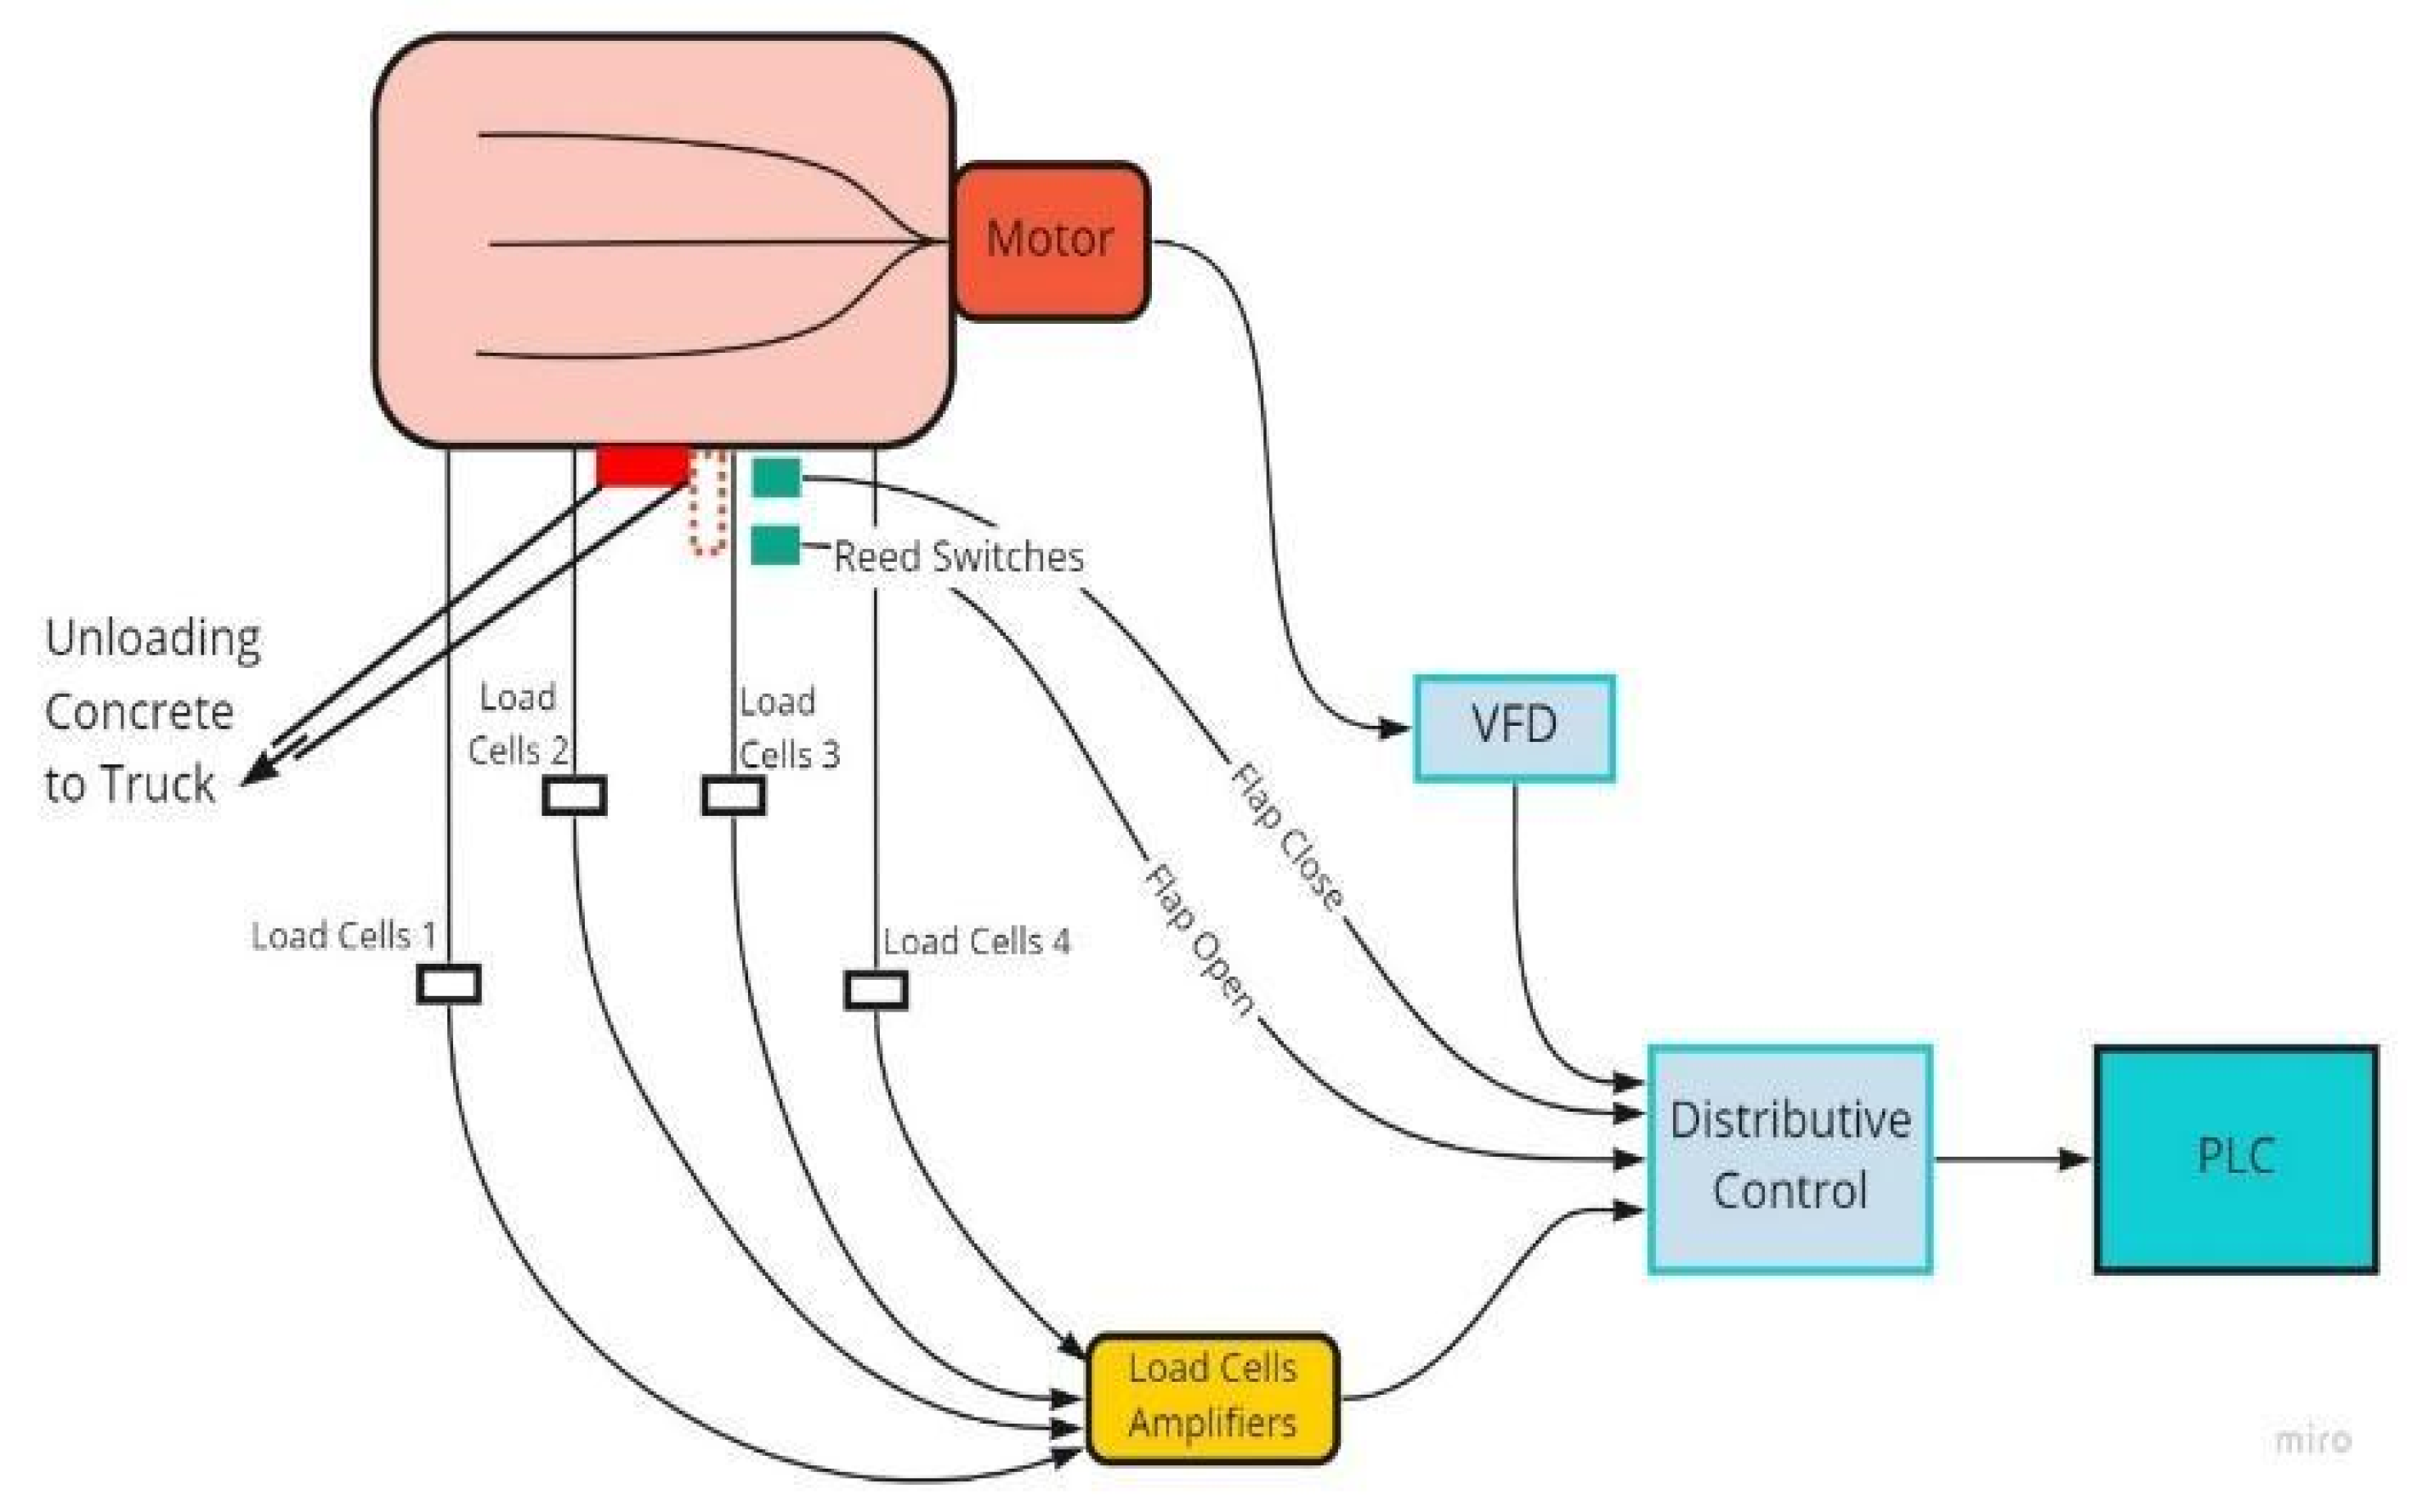
As shown in
Figure 12, the mixing operation starts when the motor starts and mixes all of the materials for a standard time. Then, the motor switches off for unloading. The VFD gives the relevant data of the motor such as speed, to PLC via the distributive control. When the flap opens, the reed switches generate a signal that the flap is open, and the clock time is recorded. Then, concrete goes into the truck, and the flap closes when the load cell amplifier shows above 95% of the total mixer has gone into the truck. After the flap closes, the difference between the flap’s open and close times and the difference between the motor switch’s on and off times are added together to give the total operational time.
4.5. Electrical Schematic Diagrams of IoT System in Proposed DT System
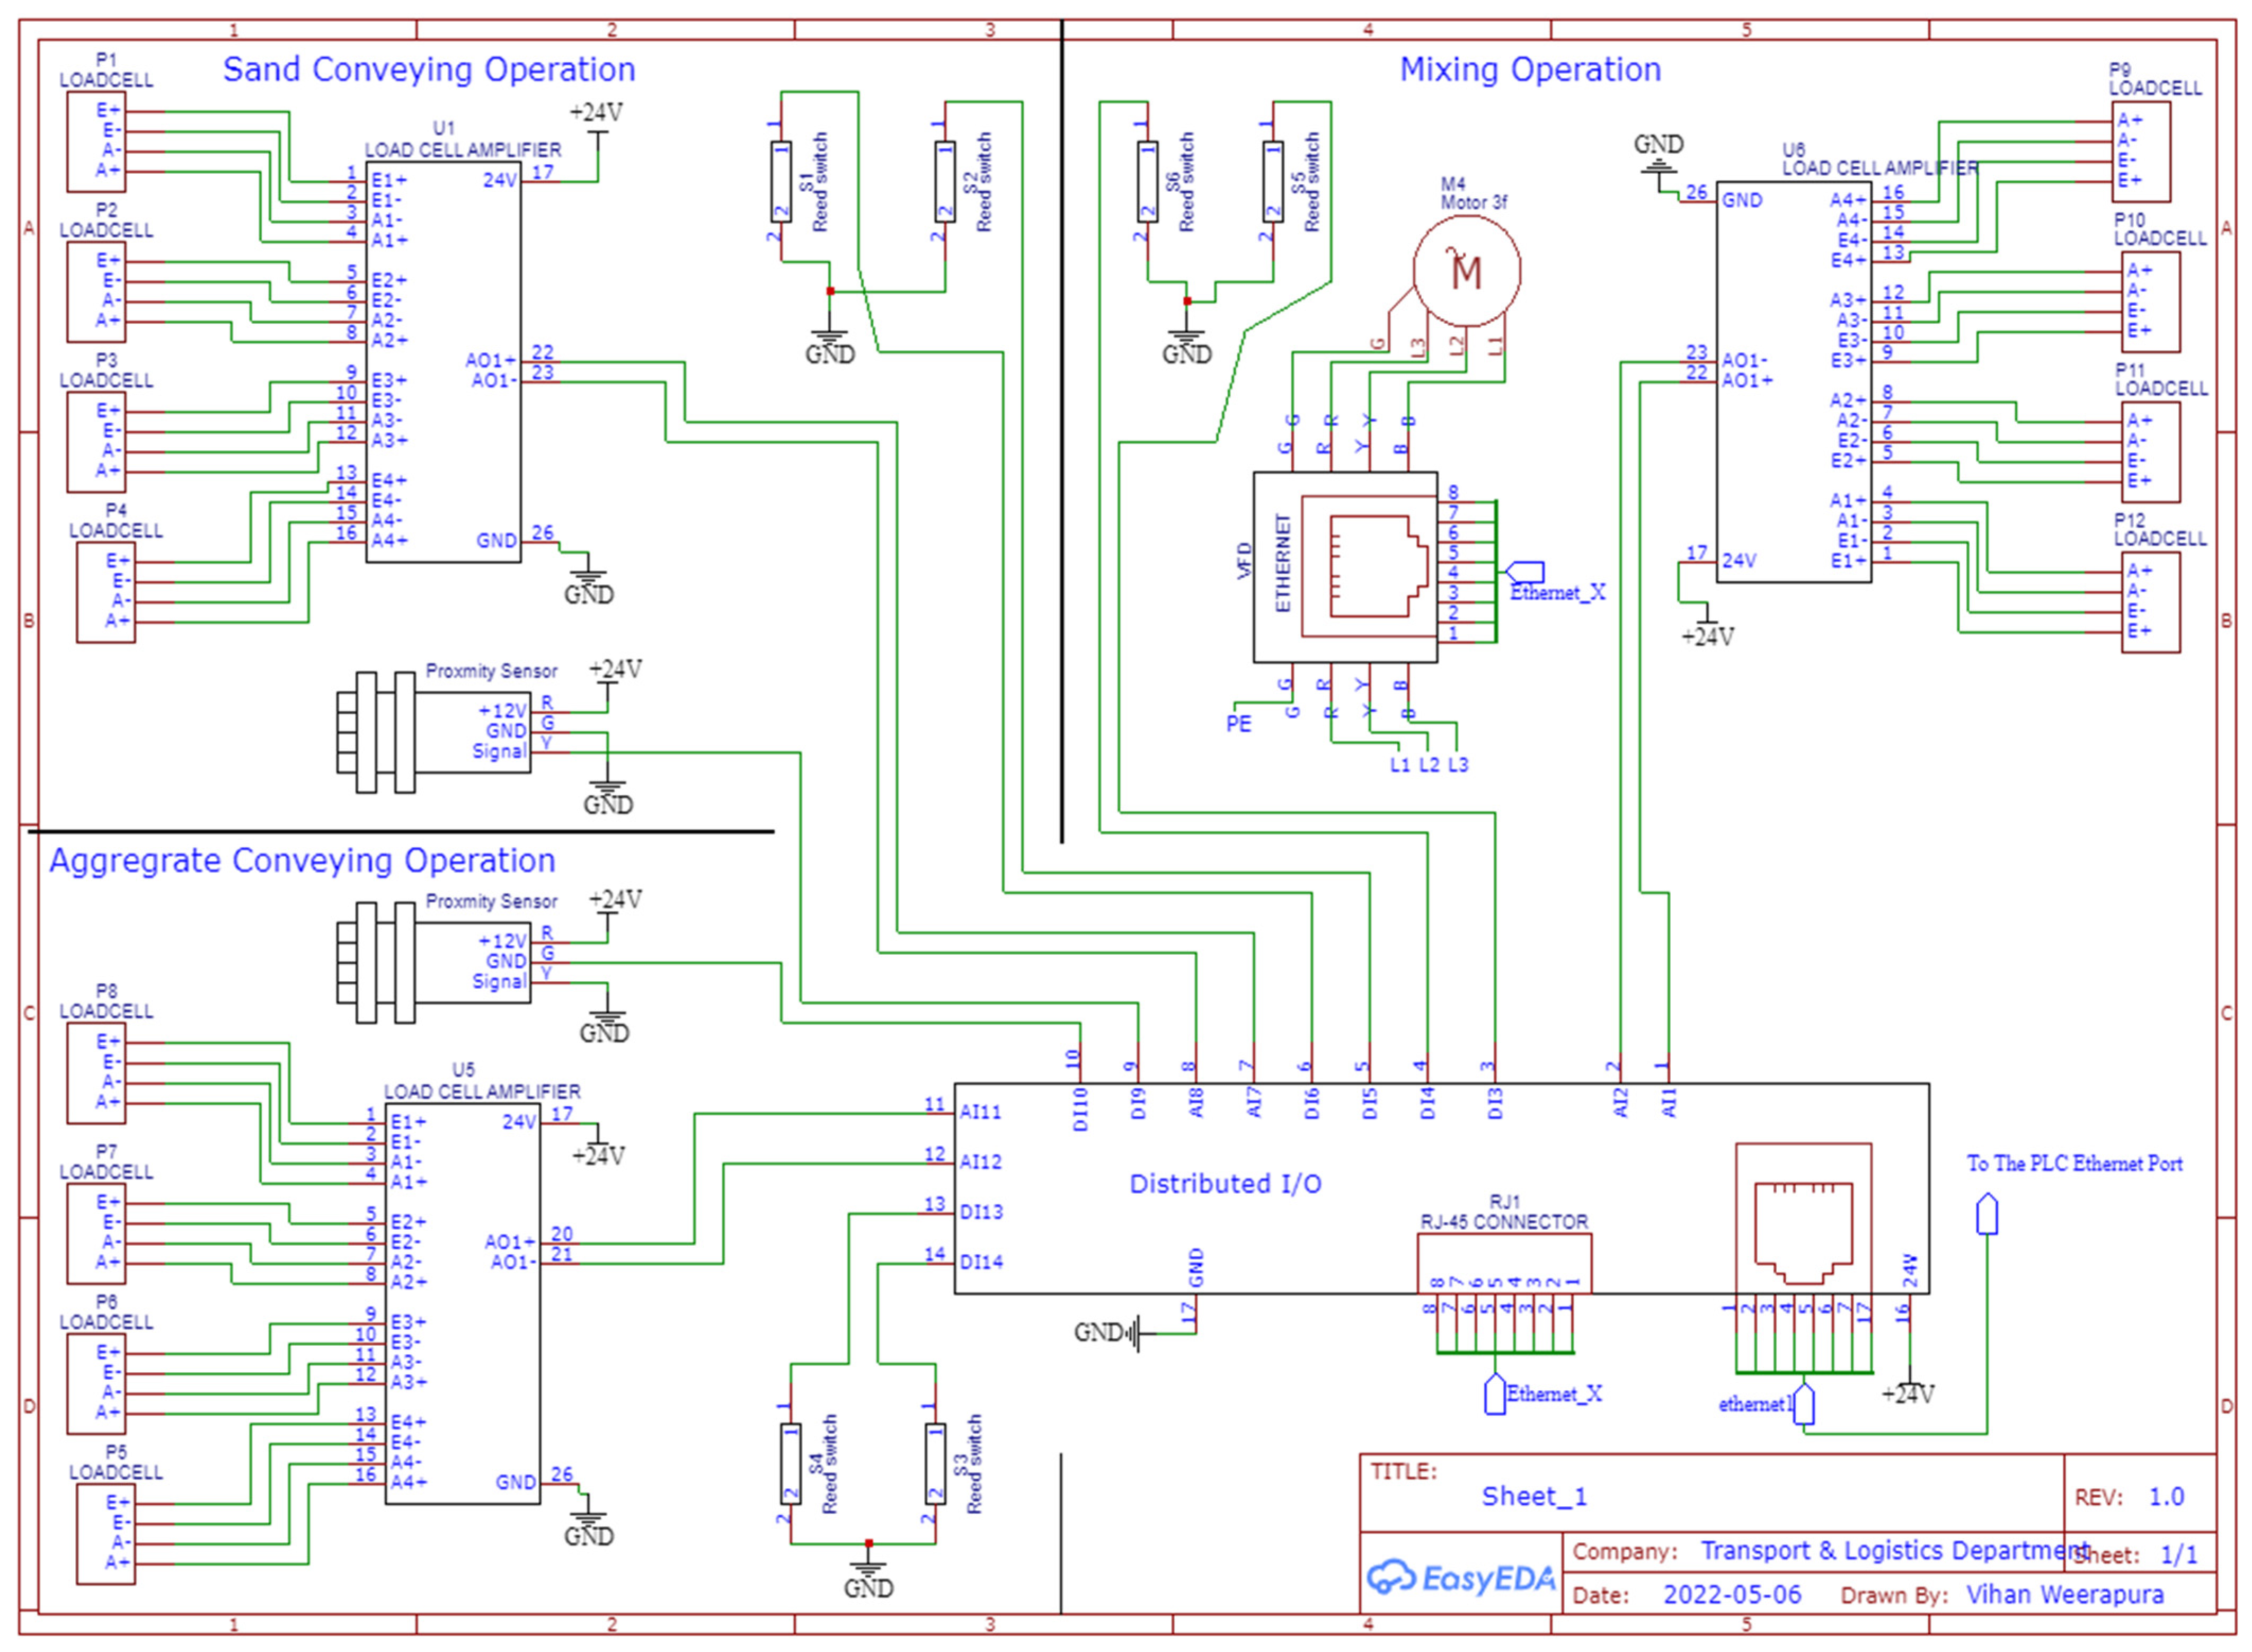
4.5.1. Schematic Diagram 1
The schematic diagram in
Figure 13 consists of three sub-production operations within the entire production and its operations: the sand unloading and conveying operation, the aggregate unloading and conveying operation and the mixing operation. Regarding the distributive I/O, the cold bins and mixer locations and their respective sensors and machinery components are covered based on ease of integration.
The motor of the mixing operation is connected to the VFD to get data on the actual RPM and motor on/off times. The VFD also connects with the distributive I/O via a PROFINET wire through the ethernet port. Moreover, the distributive I/O is connected to the PLC, which is the central controlling unit, via another PROFINET wire through its ethernet ports. The distributive I/O consists of pins that receive both digital and analog signal outputs generated by sensors and mechanical components, respectively.
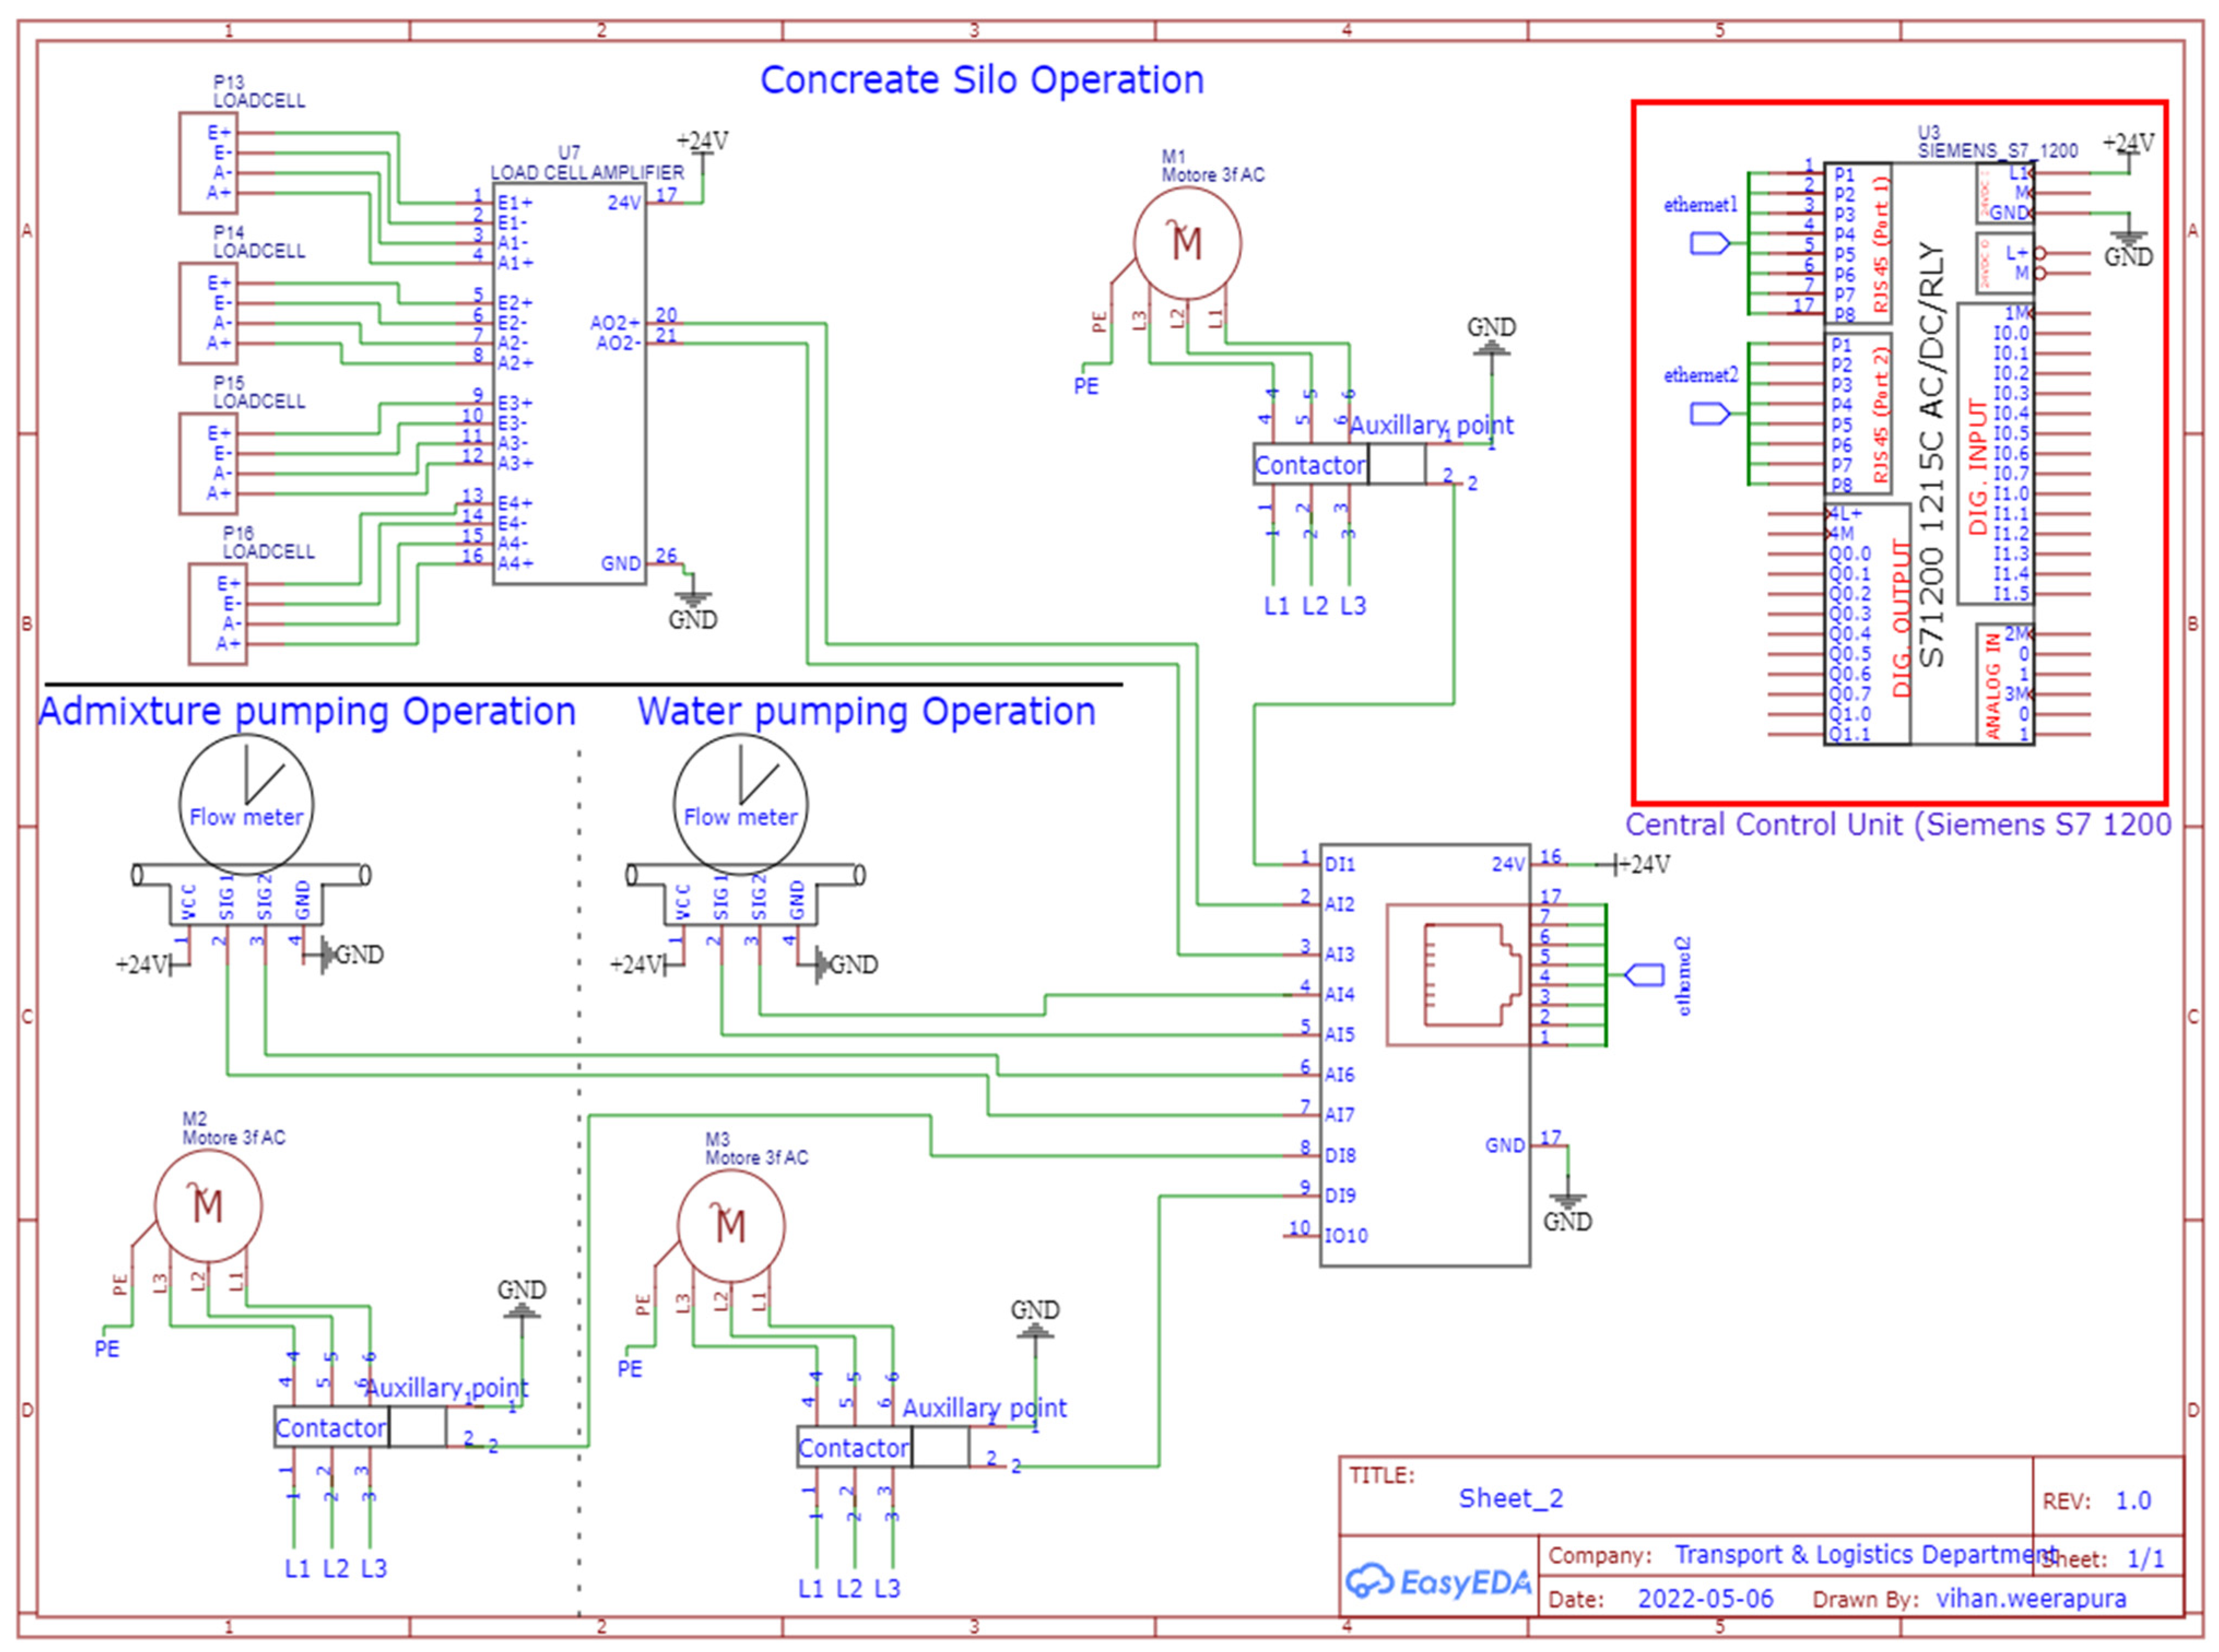
4.5.2. Schematic Diagram 2
The schematic diagram in
Figure 14, only consists of three sub-production operations of the entire production and its operations: water pumping, admixture pumping and cement pumping operations. Regarding distributive I/O, the water tank, admixture tank and cement silo locations and their sensors and machinery components are covered. Moreover, the distributive I/O is connected to the PLC via another PROFINET wire through its ethernet ports.
4.6. Digital Twin Operational System of RMC Operational Risk Management
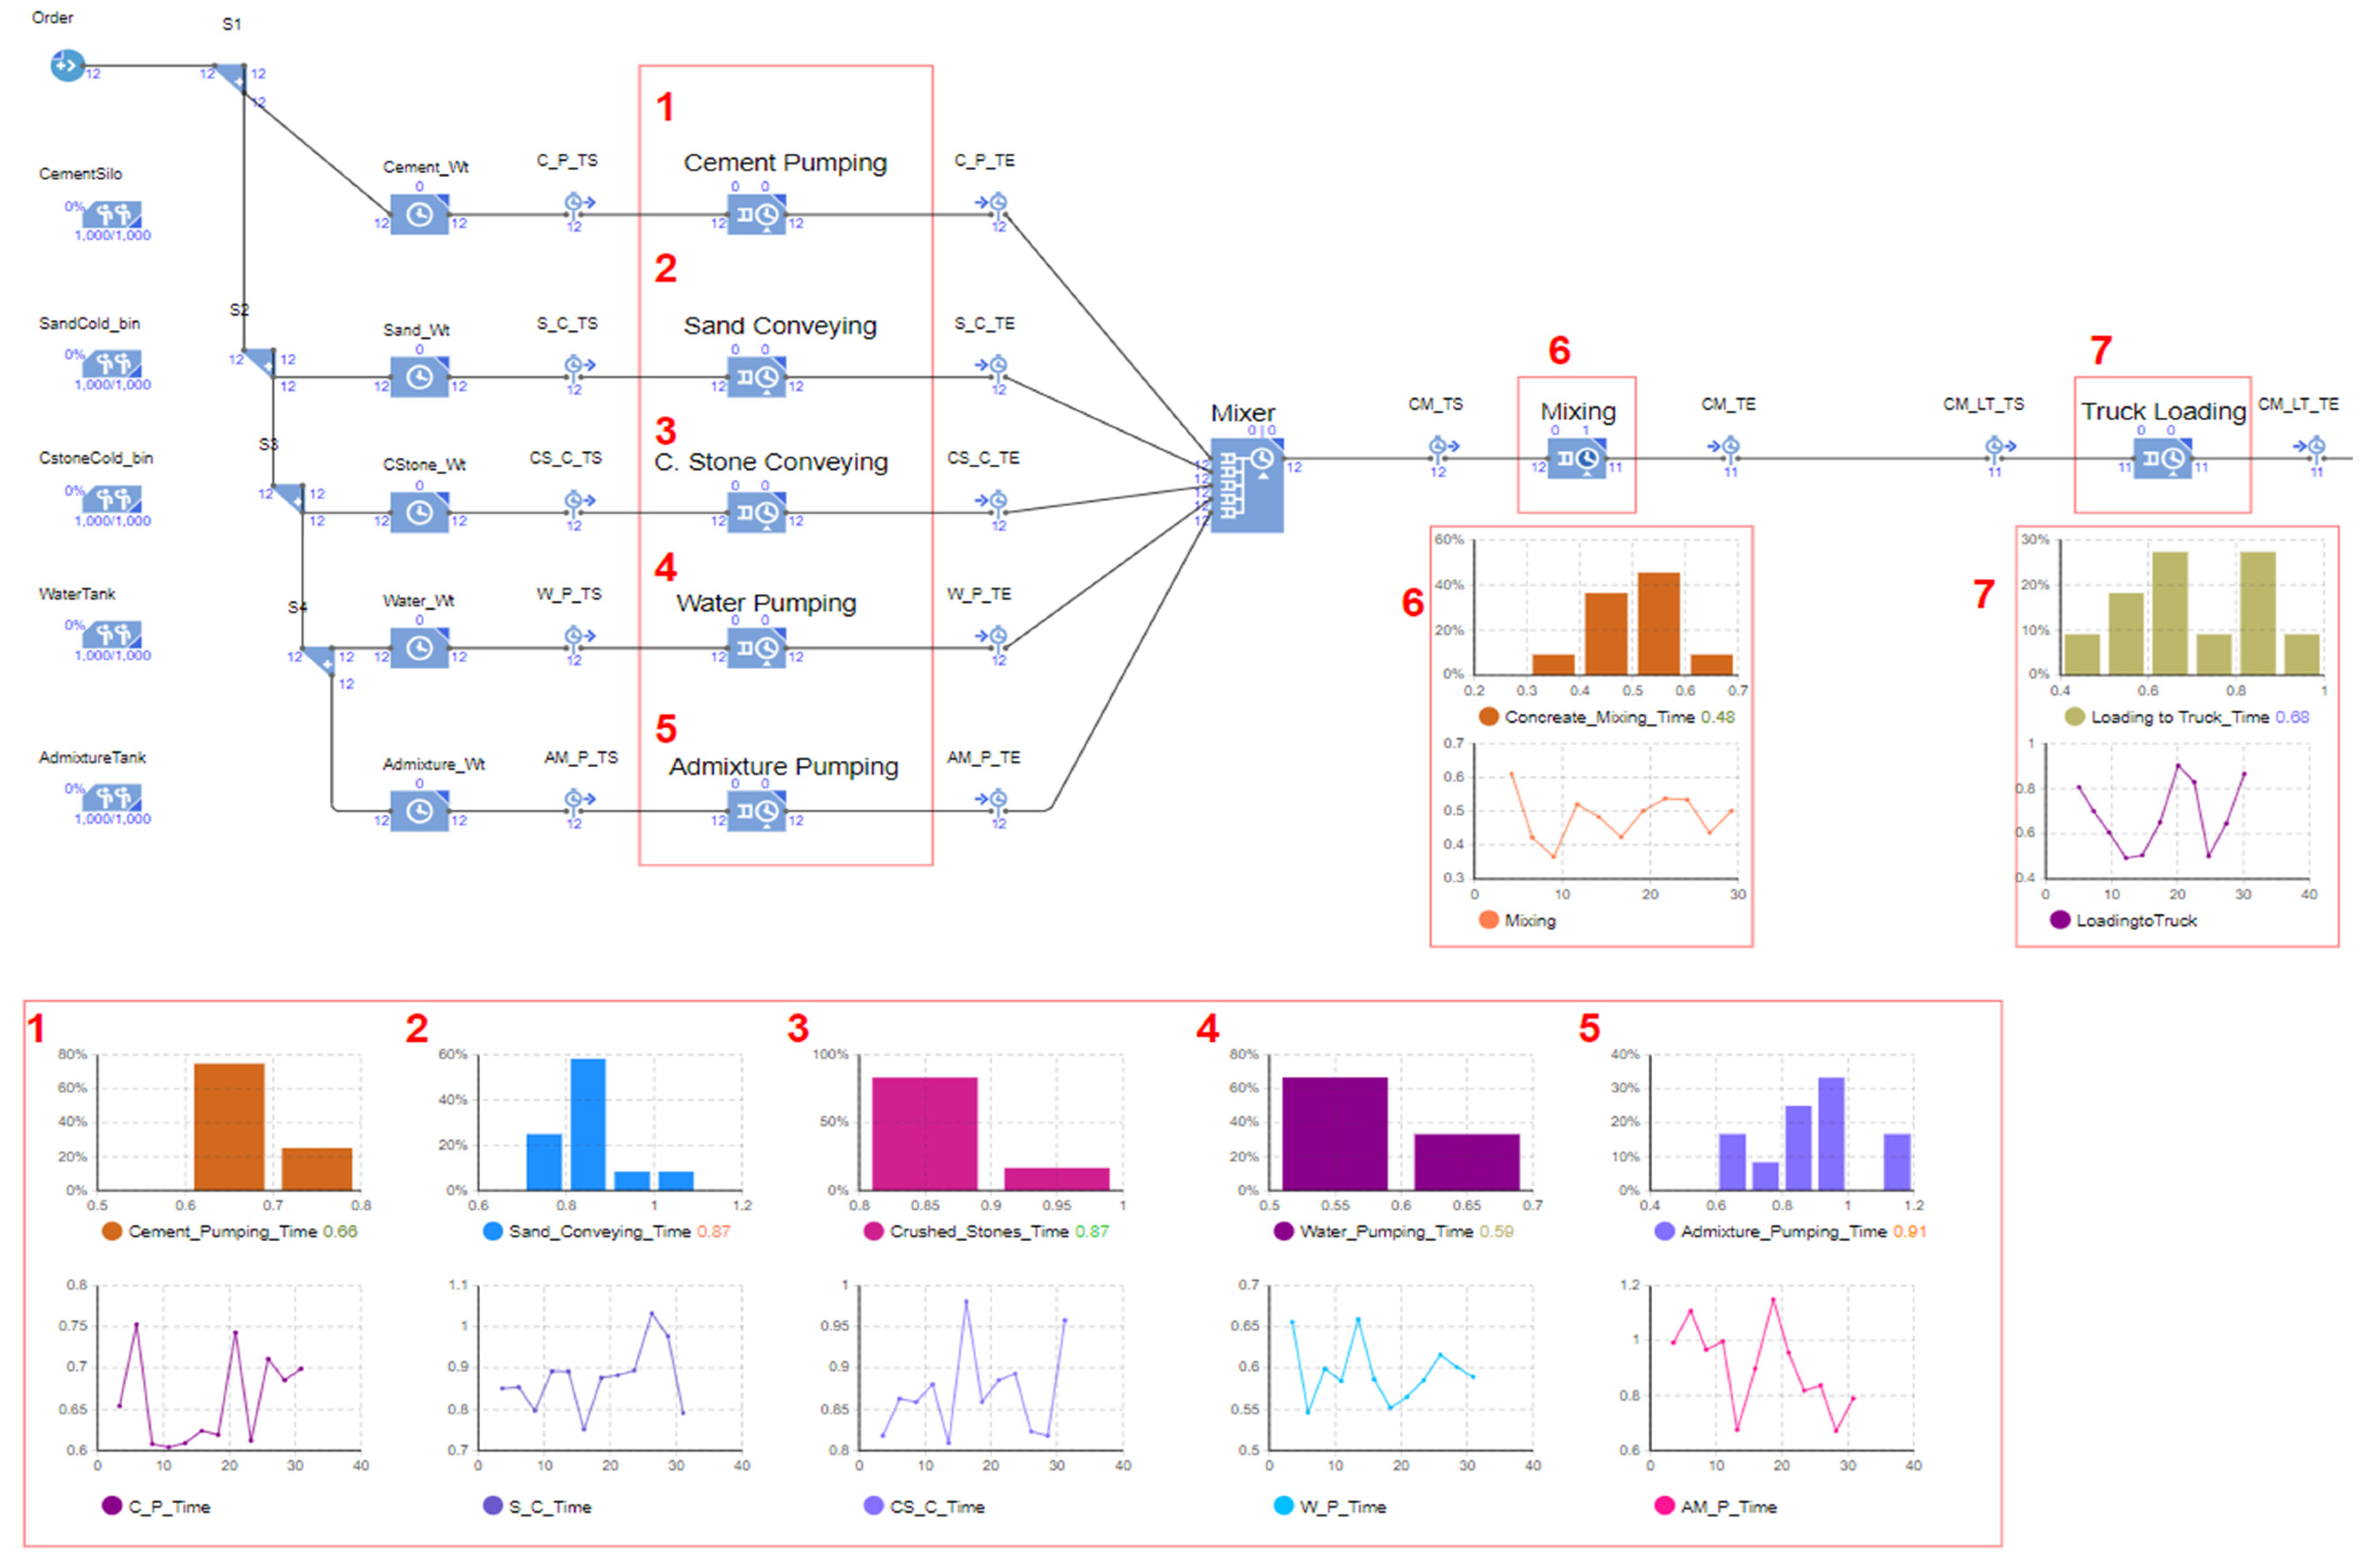
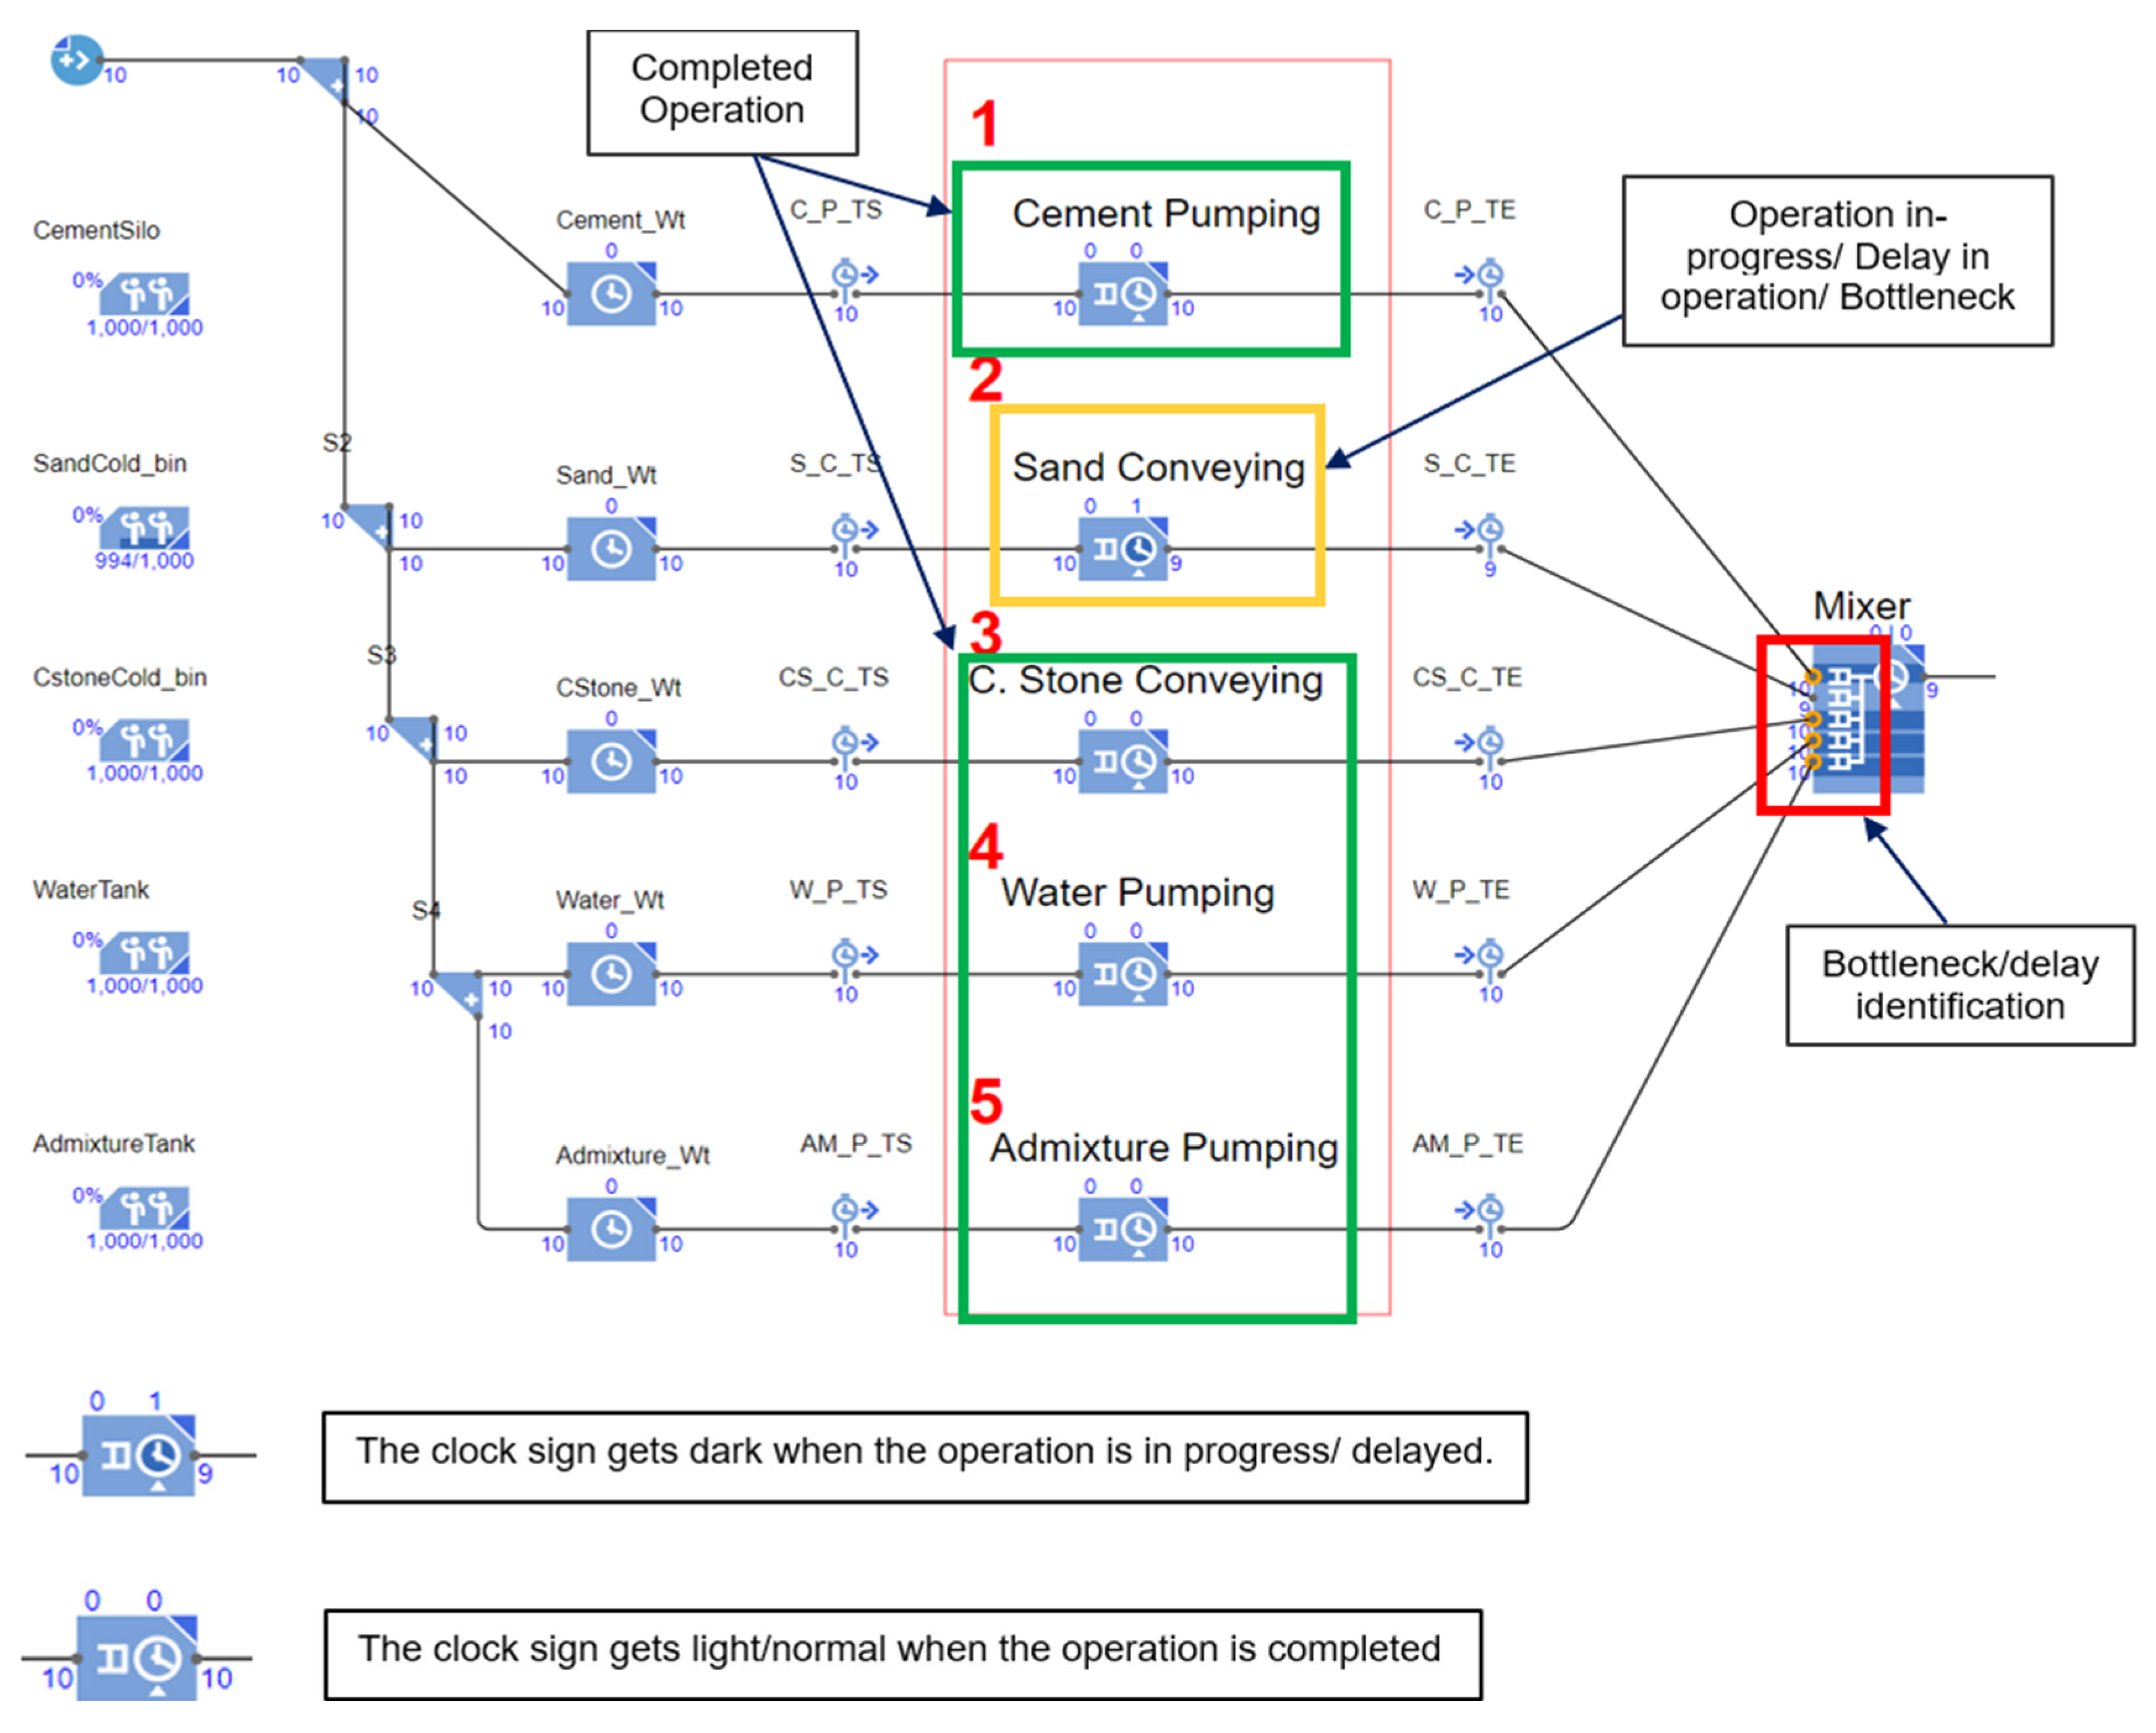
The digital twin operational model was developed in Anylogic, as shown in
Figure 15, by adding the operational layout and analytical capabilities to indicate the progress of the production process, average production cycle times, production delays and bottlenecks of any sub-production operations in real-time, which makes it easy to identify risks and mitigate them.
As shown in
Figure 16, the RMC digital twin operational model depicts production bottlenecks as orange dots, as seen in the concrete mixing operation. This delay indicates a potential bottleneck in the sand conveying operation. The reason for this bottleneck is that the sand conveying operation is still ongoing/ delayed. Likewise, the production delay and its associated bottleneck notification allow production engineers to pay special attention to and rectify any issues with production bottlenecks in particular sub-production operations.
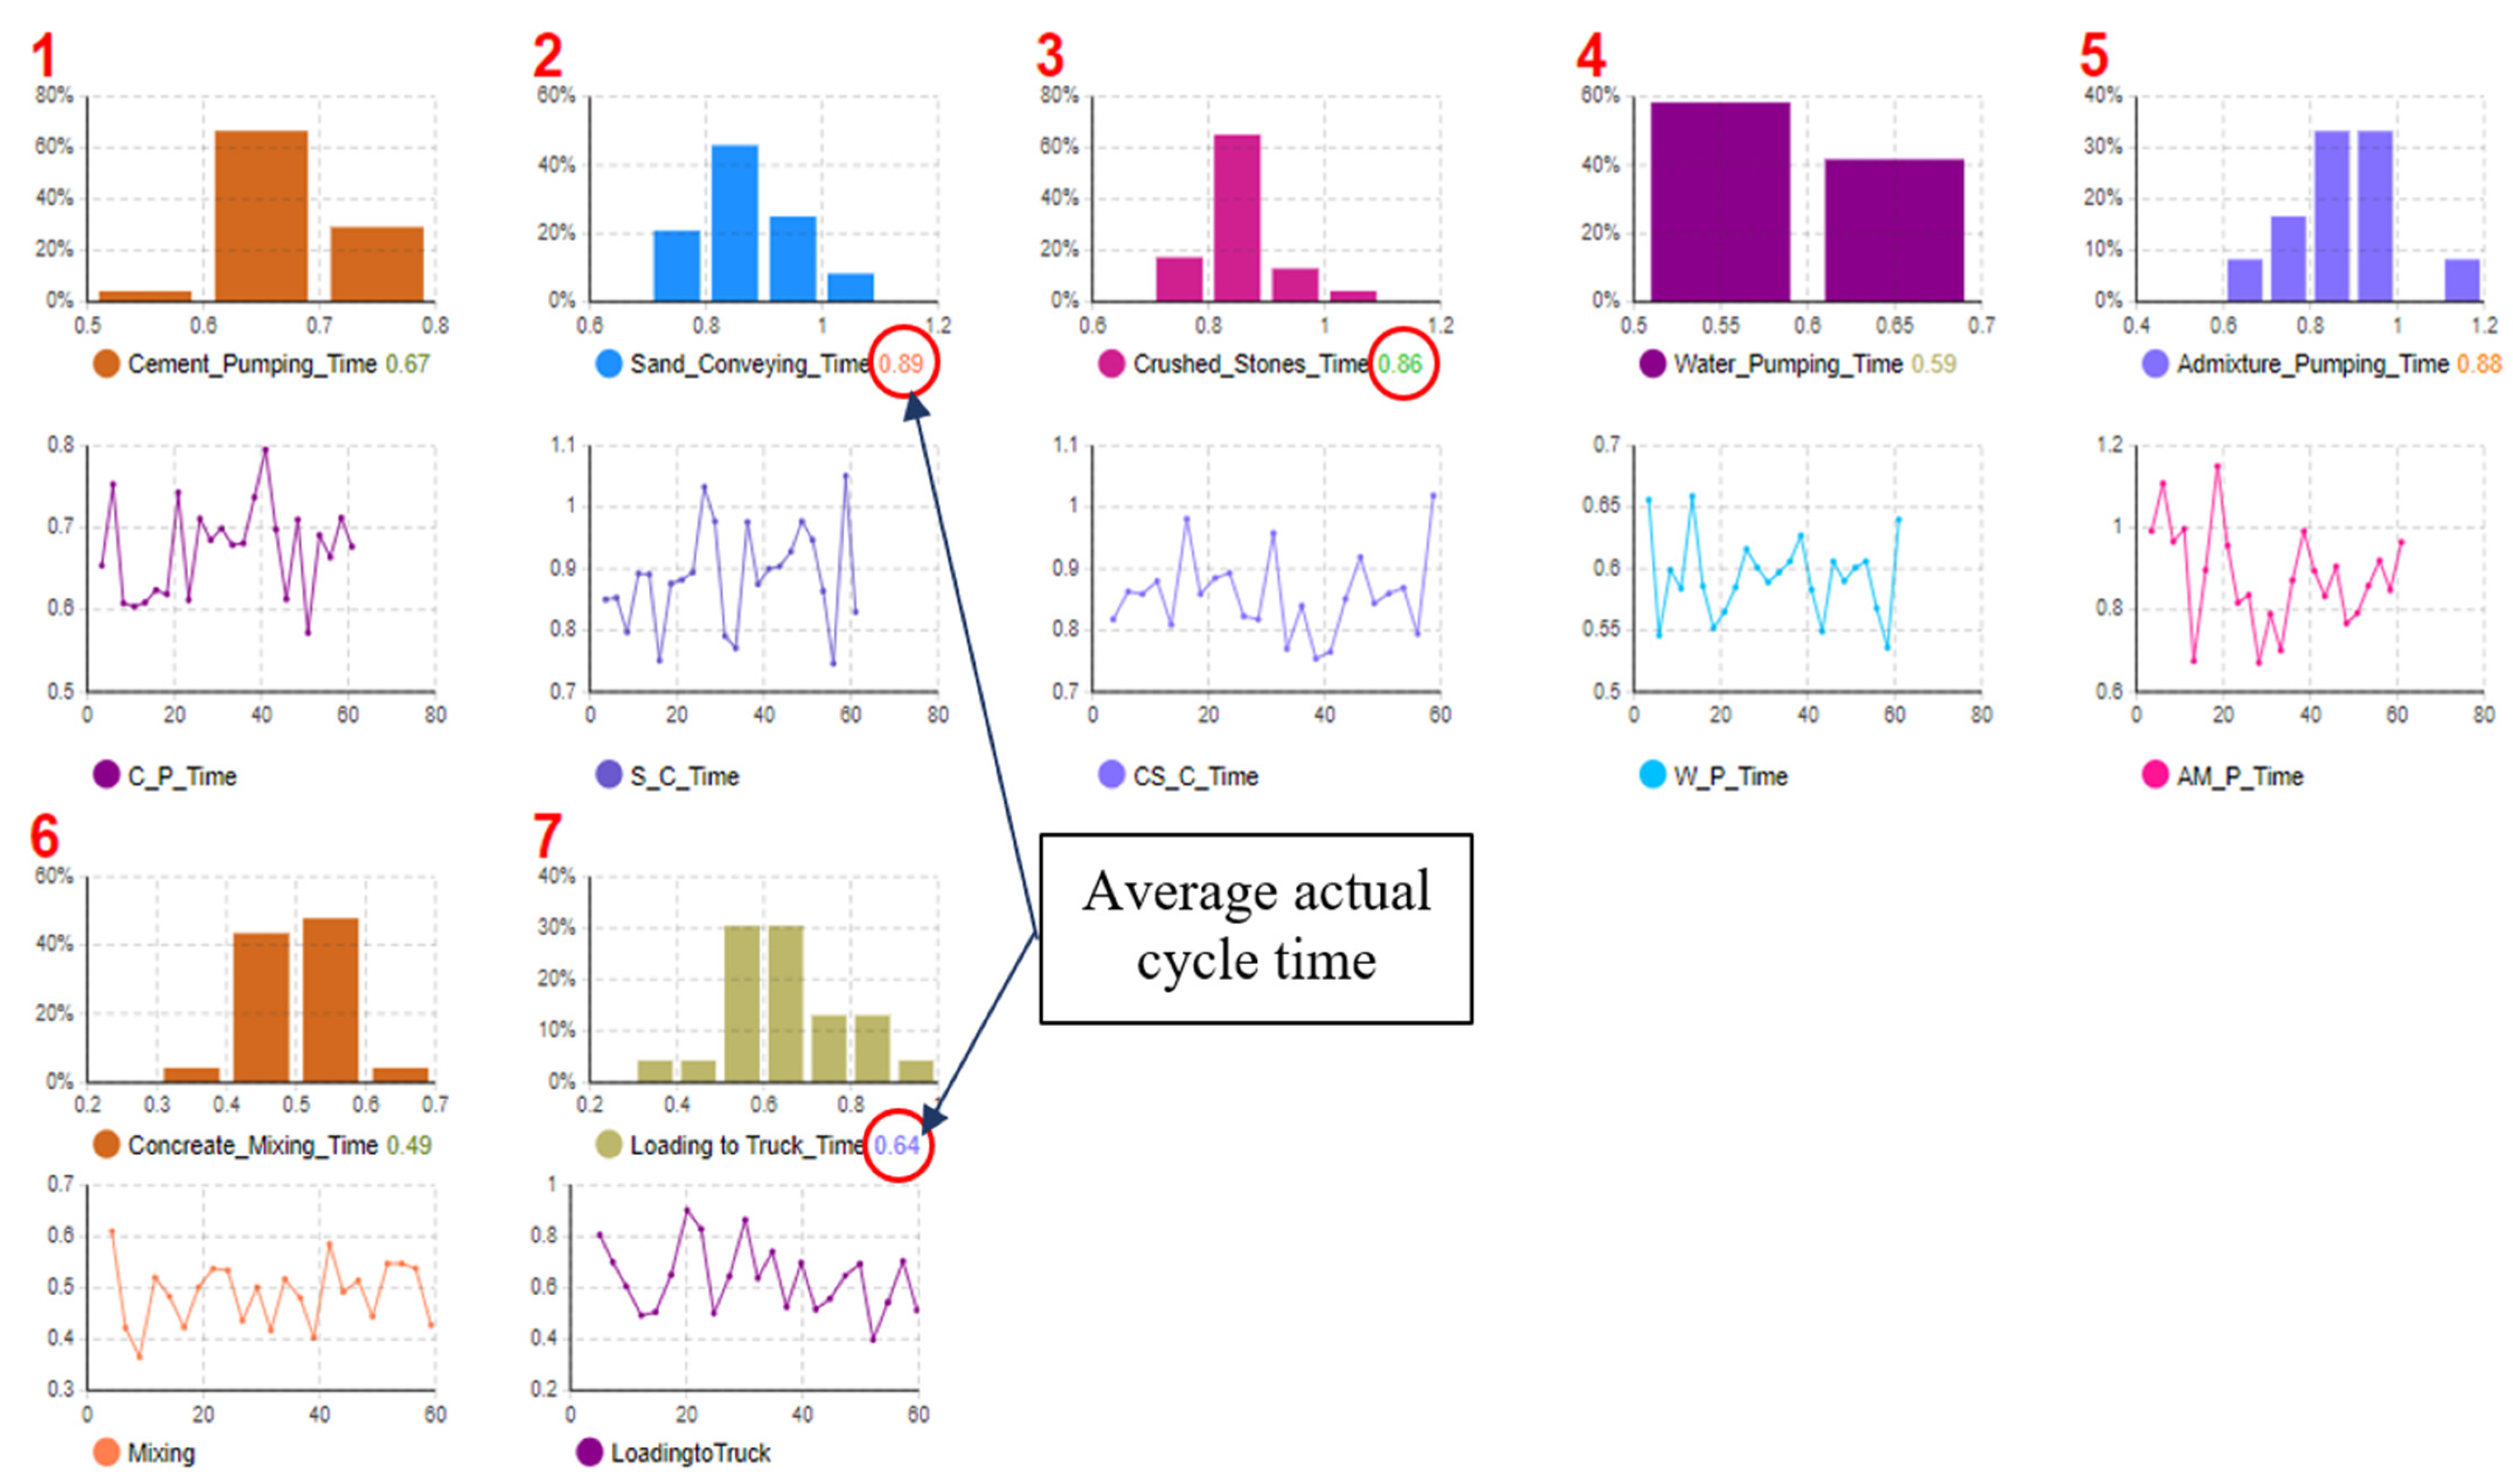
Moreover, all sub-production operations are analyzed through individual histograms to keep track of the average cycle time of each process with its distribution. This analysis helps to identify whether the actual average cycle times of the production process deviates from the given standard process cycle time.
Table 7 shows how each sub-production operation’s standard cycle time differs from the operational data obtained from simulation.
If the actual average cycle time is higher than the standard cycle time for a particular sub-production operation, then it means that the sub-production operation or its machines are inefficient, and it can cause future breakdowns. These issues need to be rectified before breakdowns occur.
In addition, if the actual average cycle time is lower than the standard cycle time for a particular sub-production operation, it means that that production operation or its machines are not processing at the right level to make the RMC product a successful one, which indicates potential calibration issues or mechanical issues.
As shown in
Figure 17, the below histogram analysis of the digital twin operational model shows how the production time of each sub-production operation has been distributed over the period. With the ability to analyze them in real-time, production engineers can have a rough idea of the predictive maintenance needed to reduce future production failures.
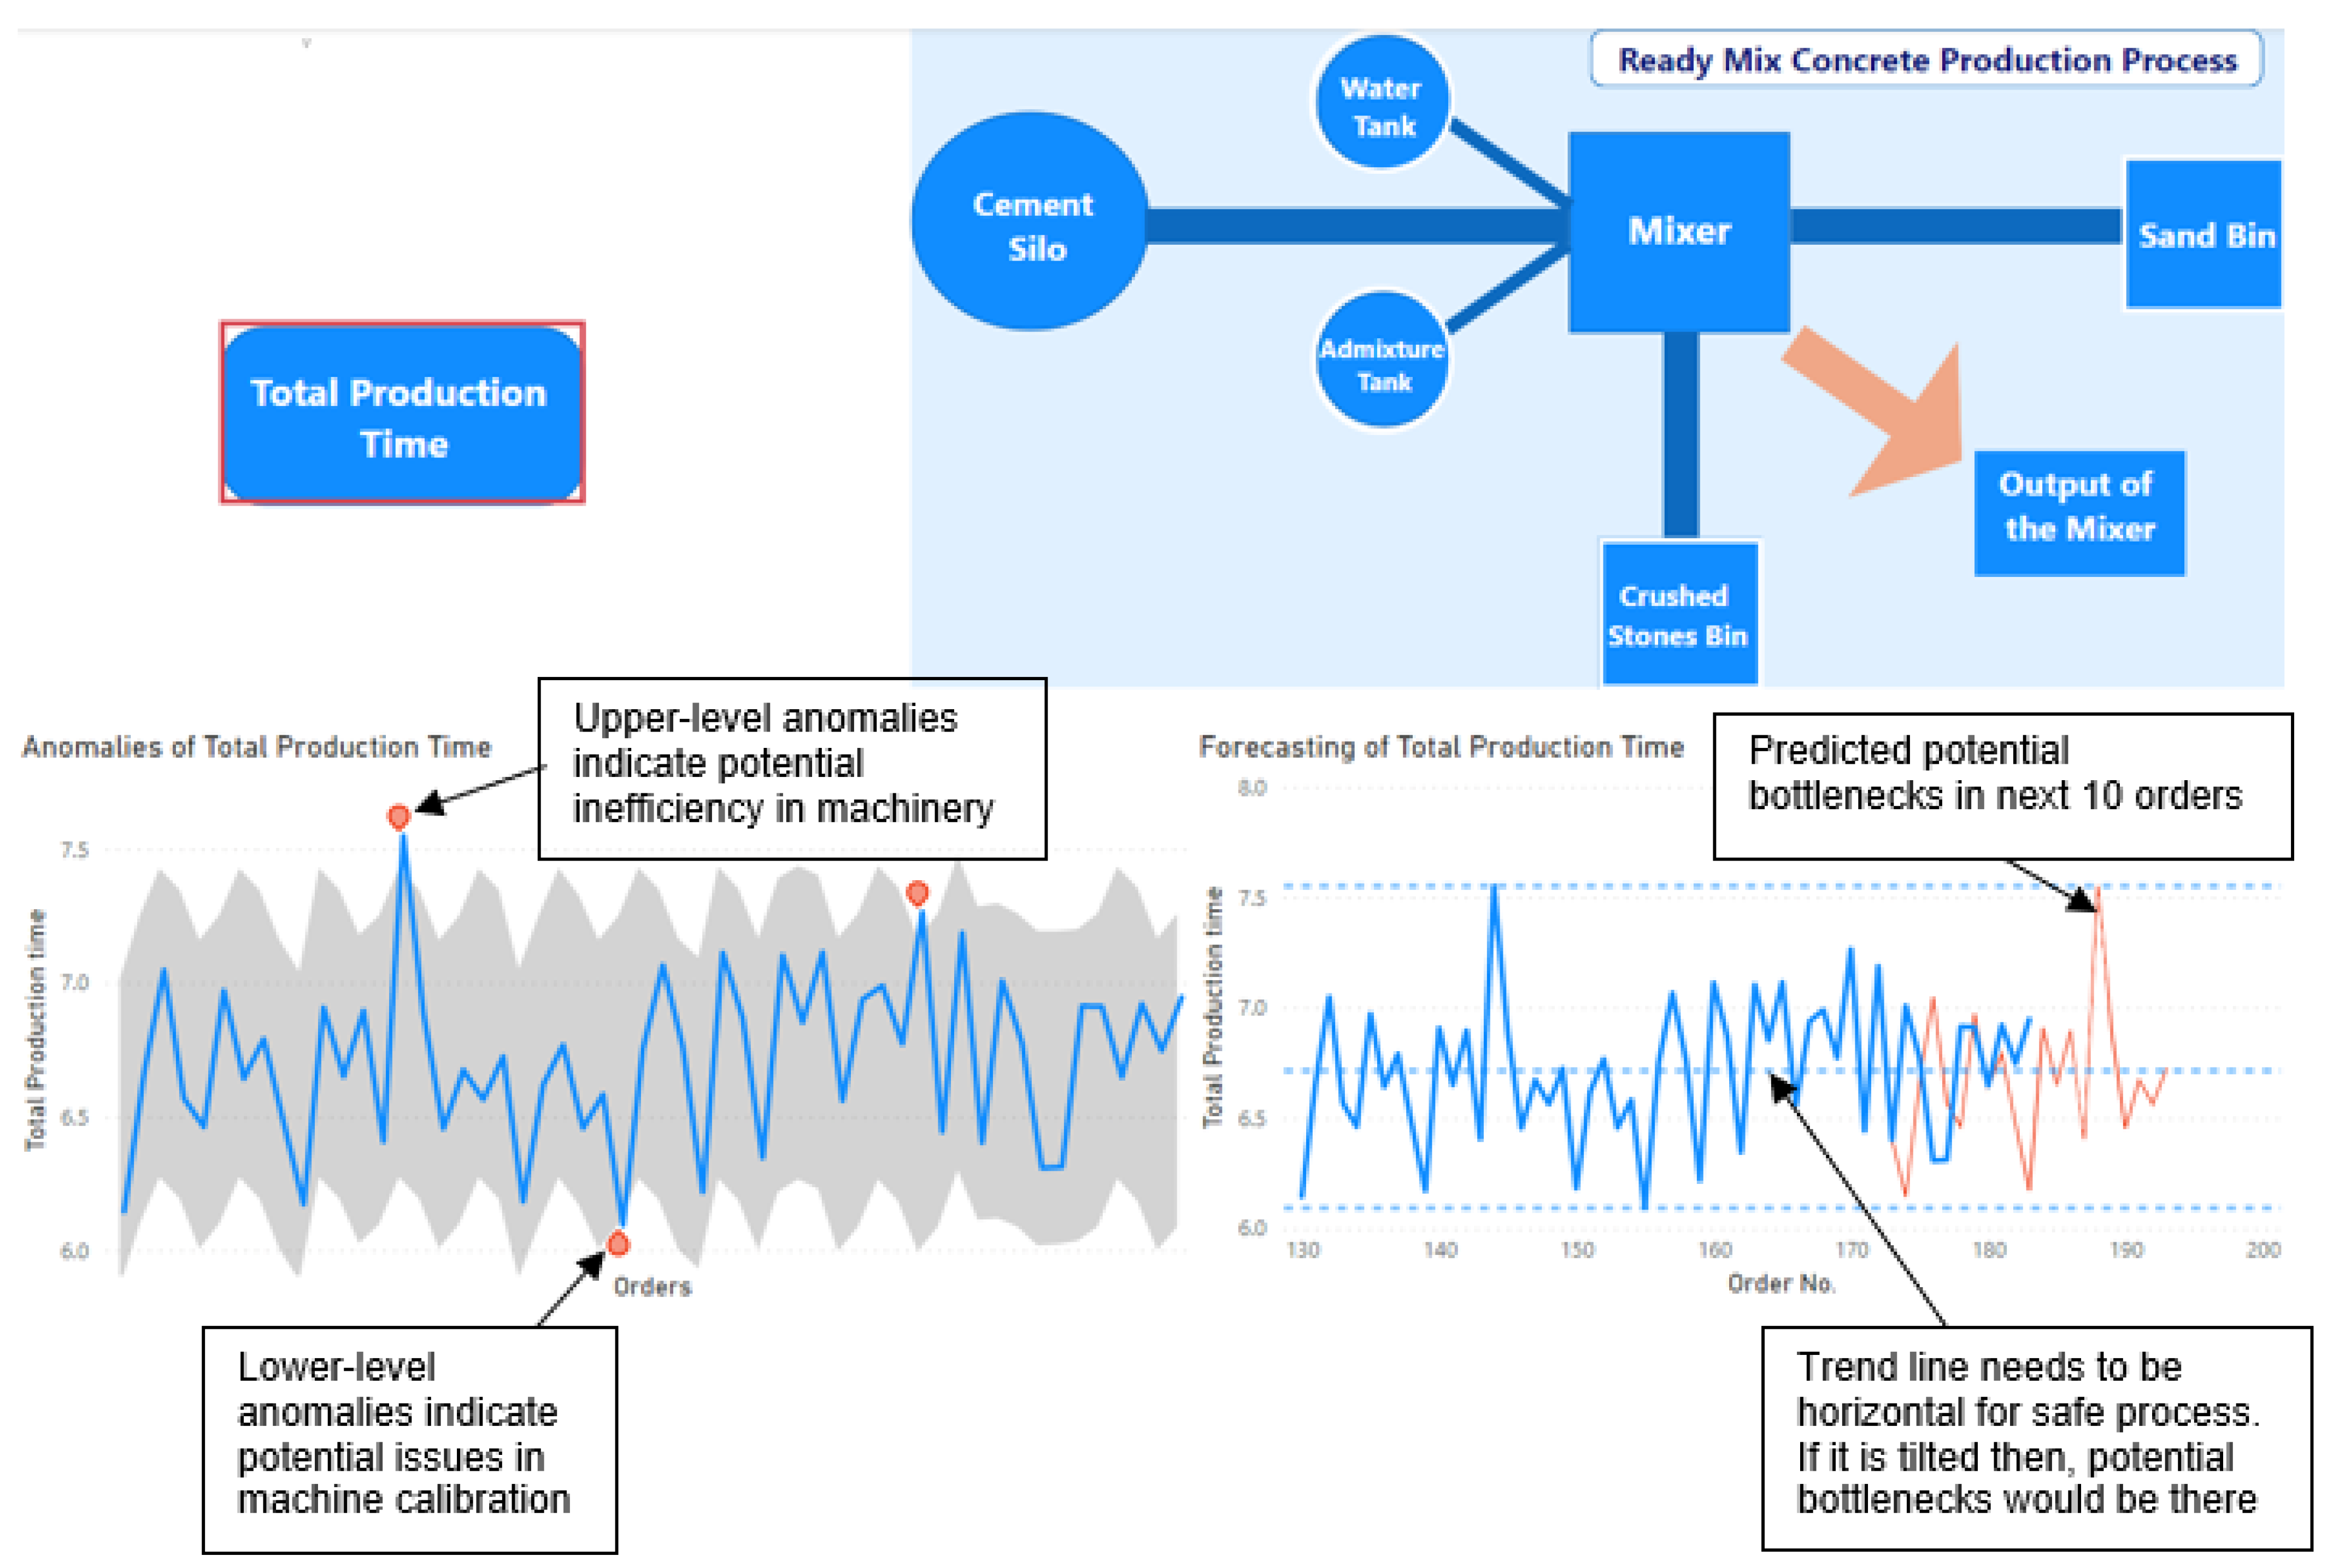
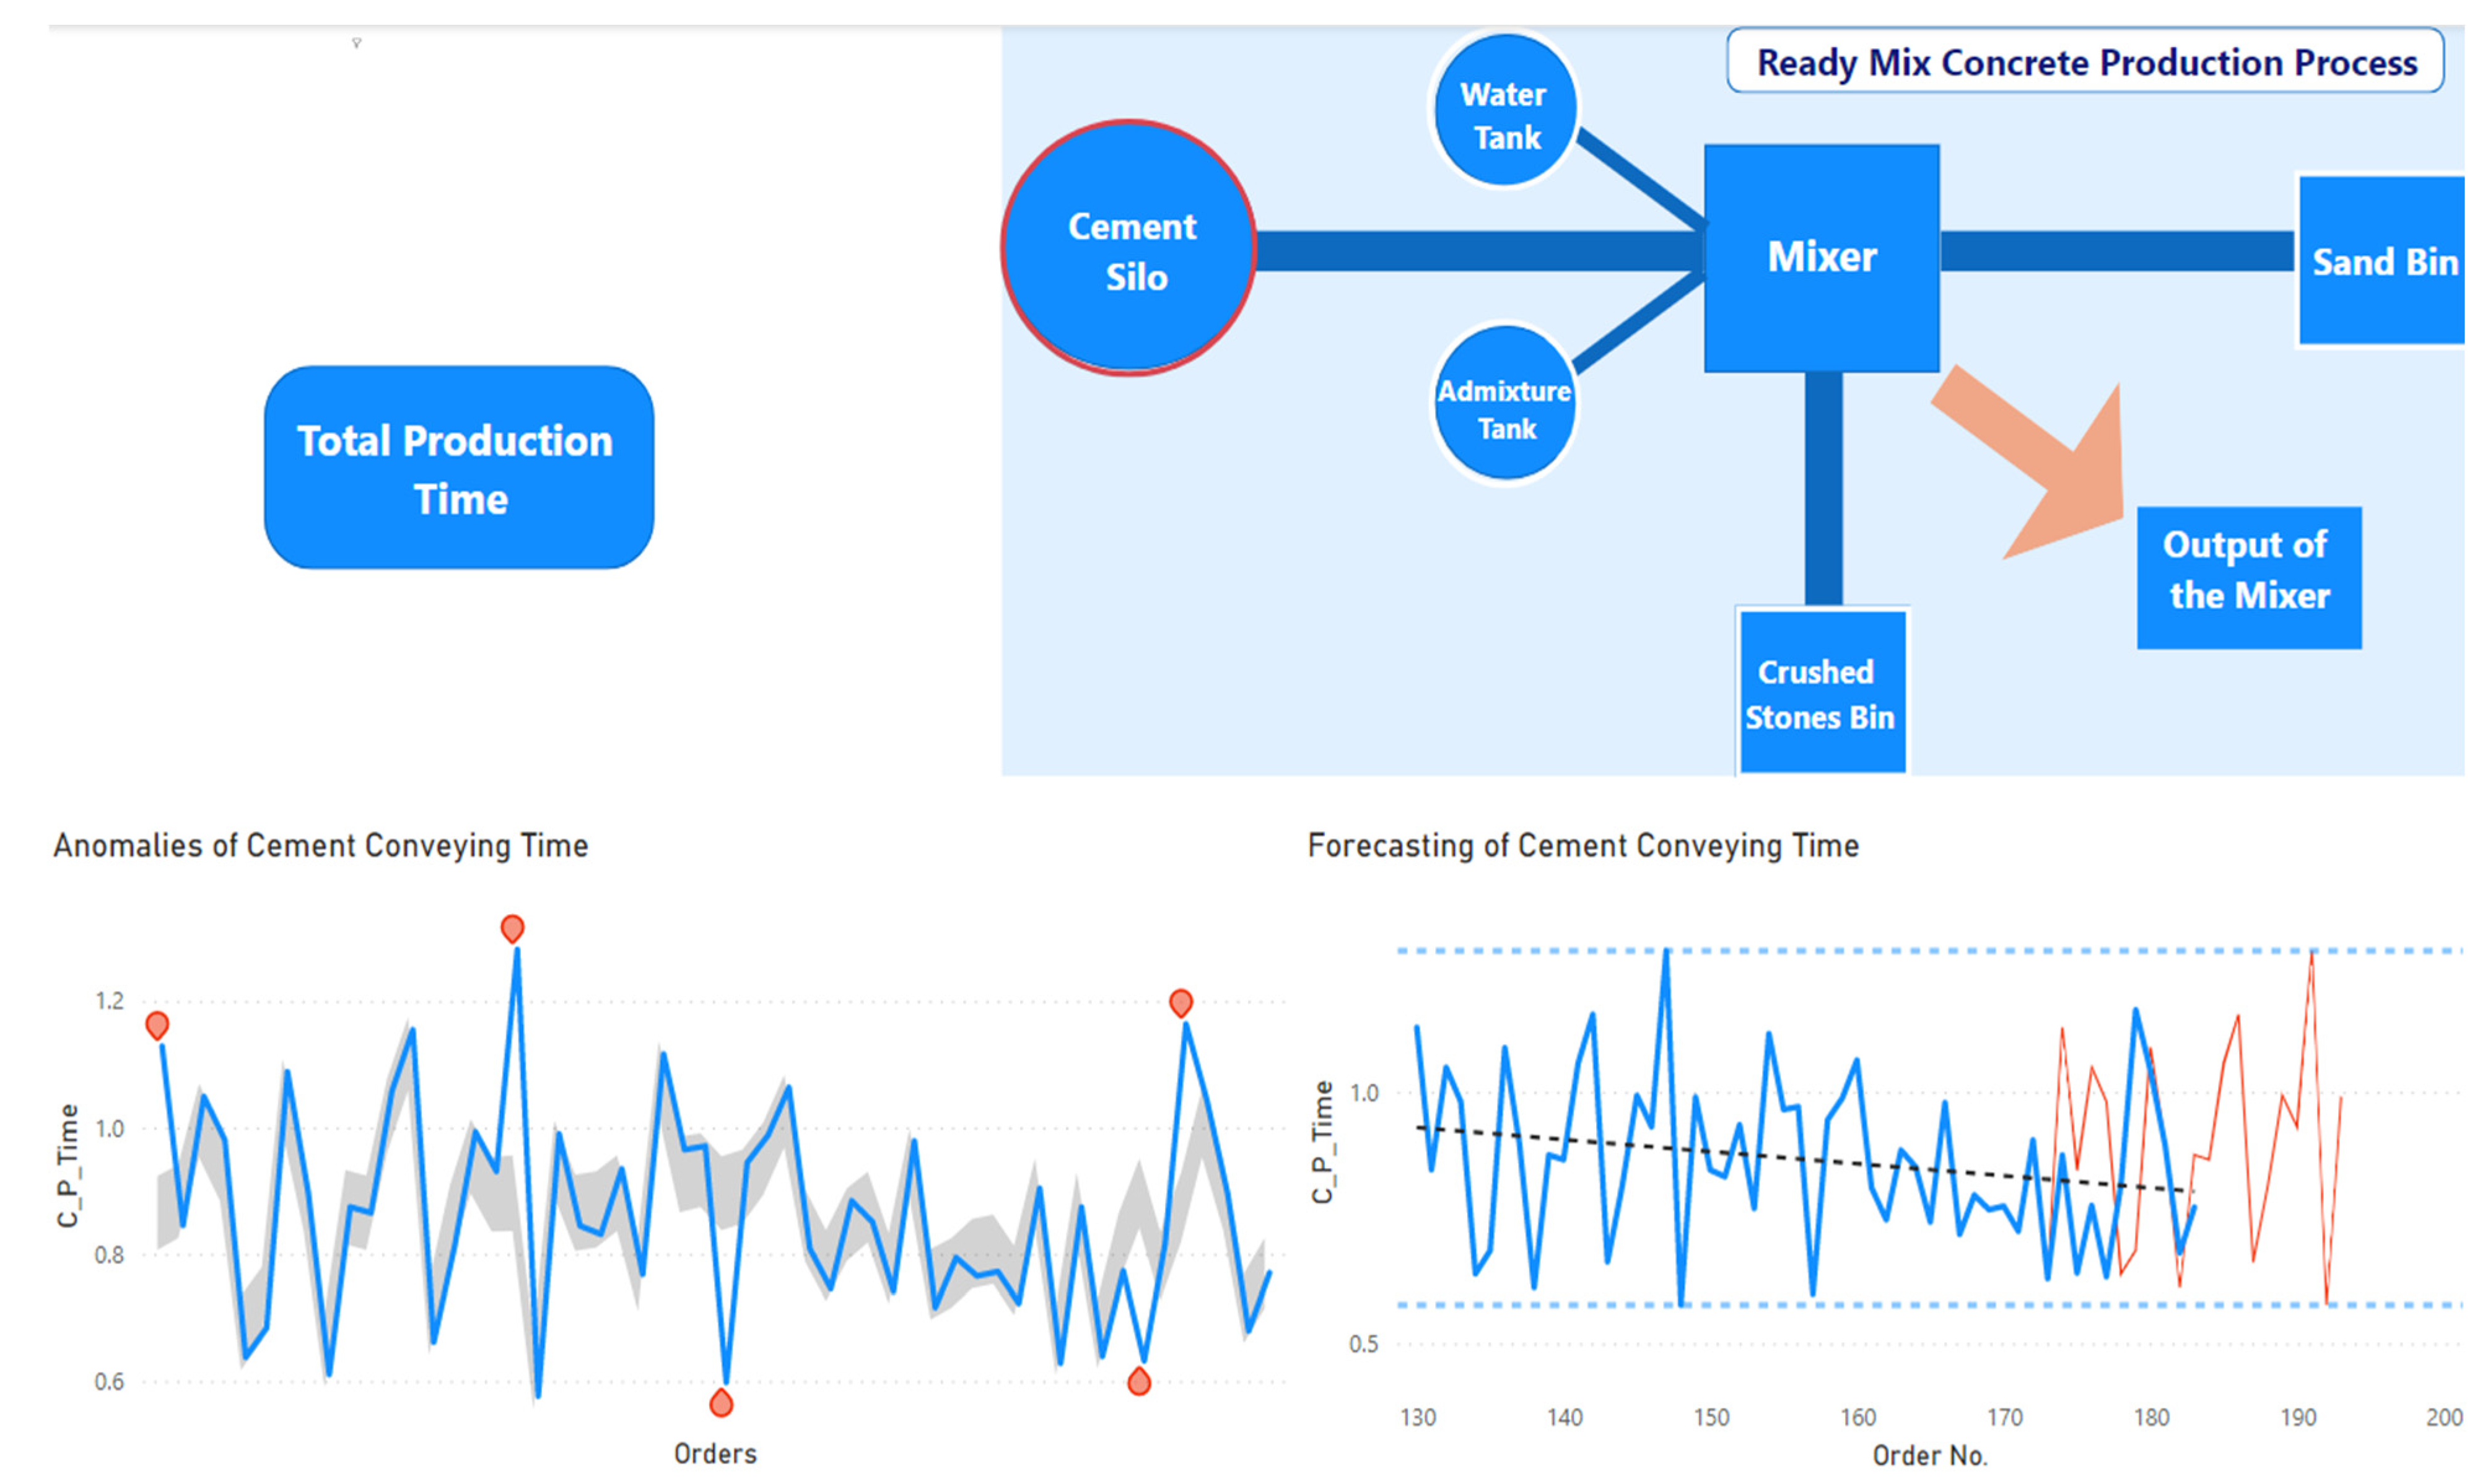
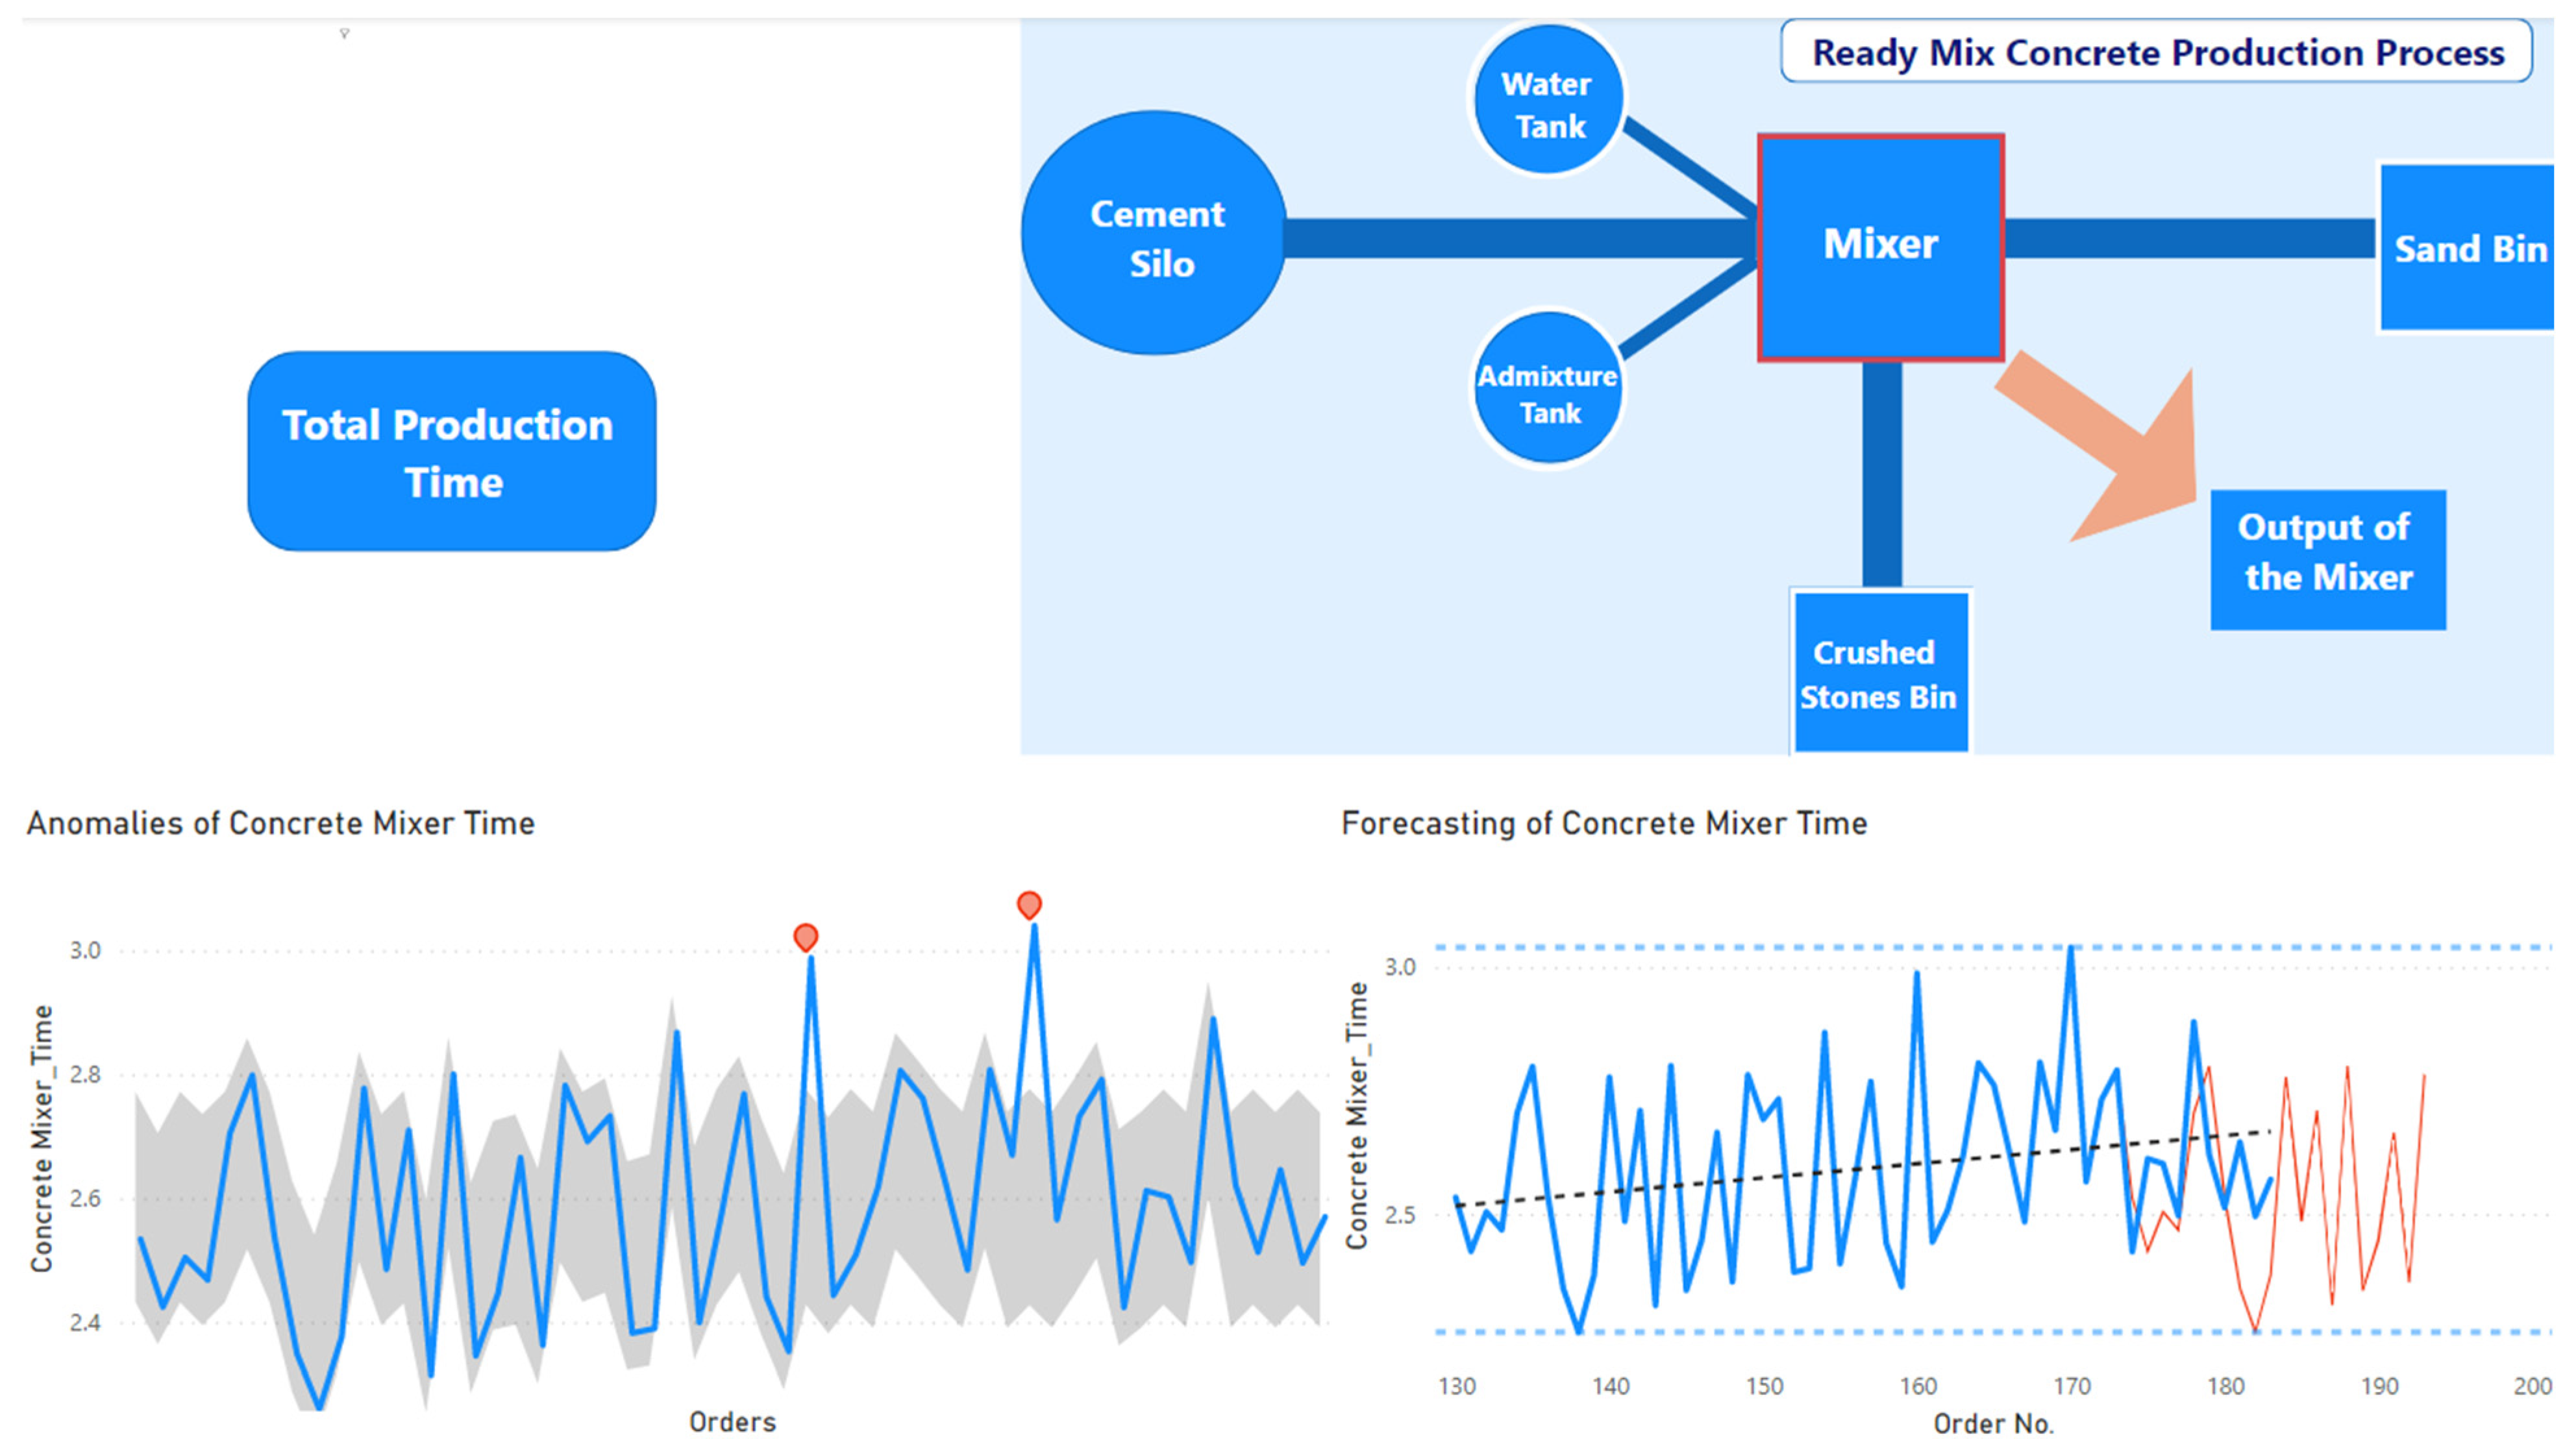
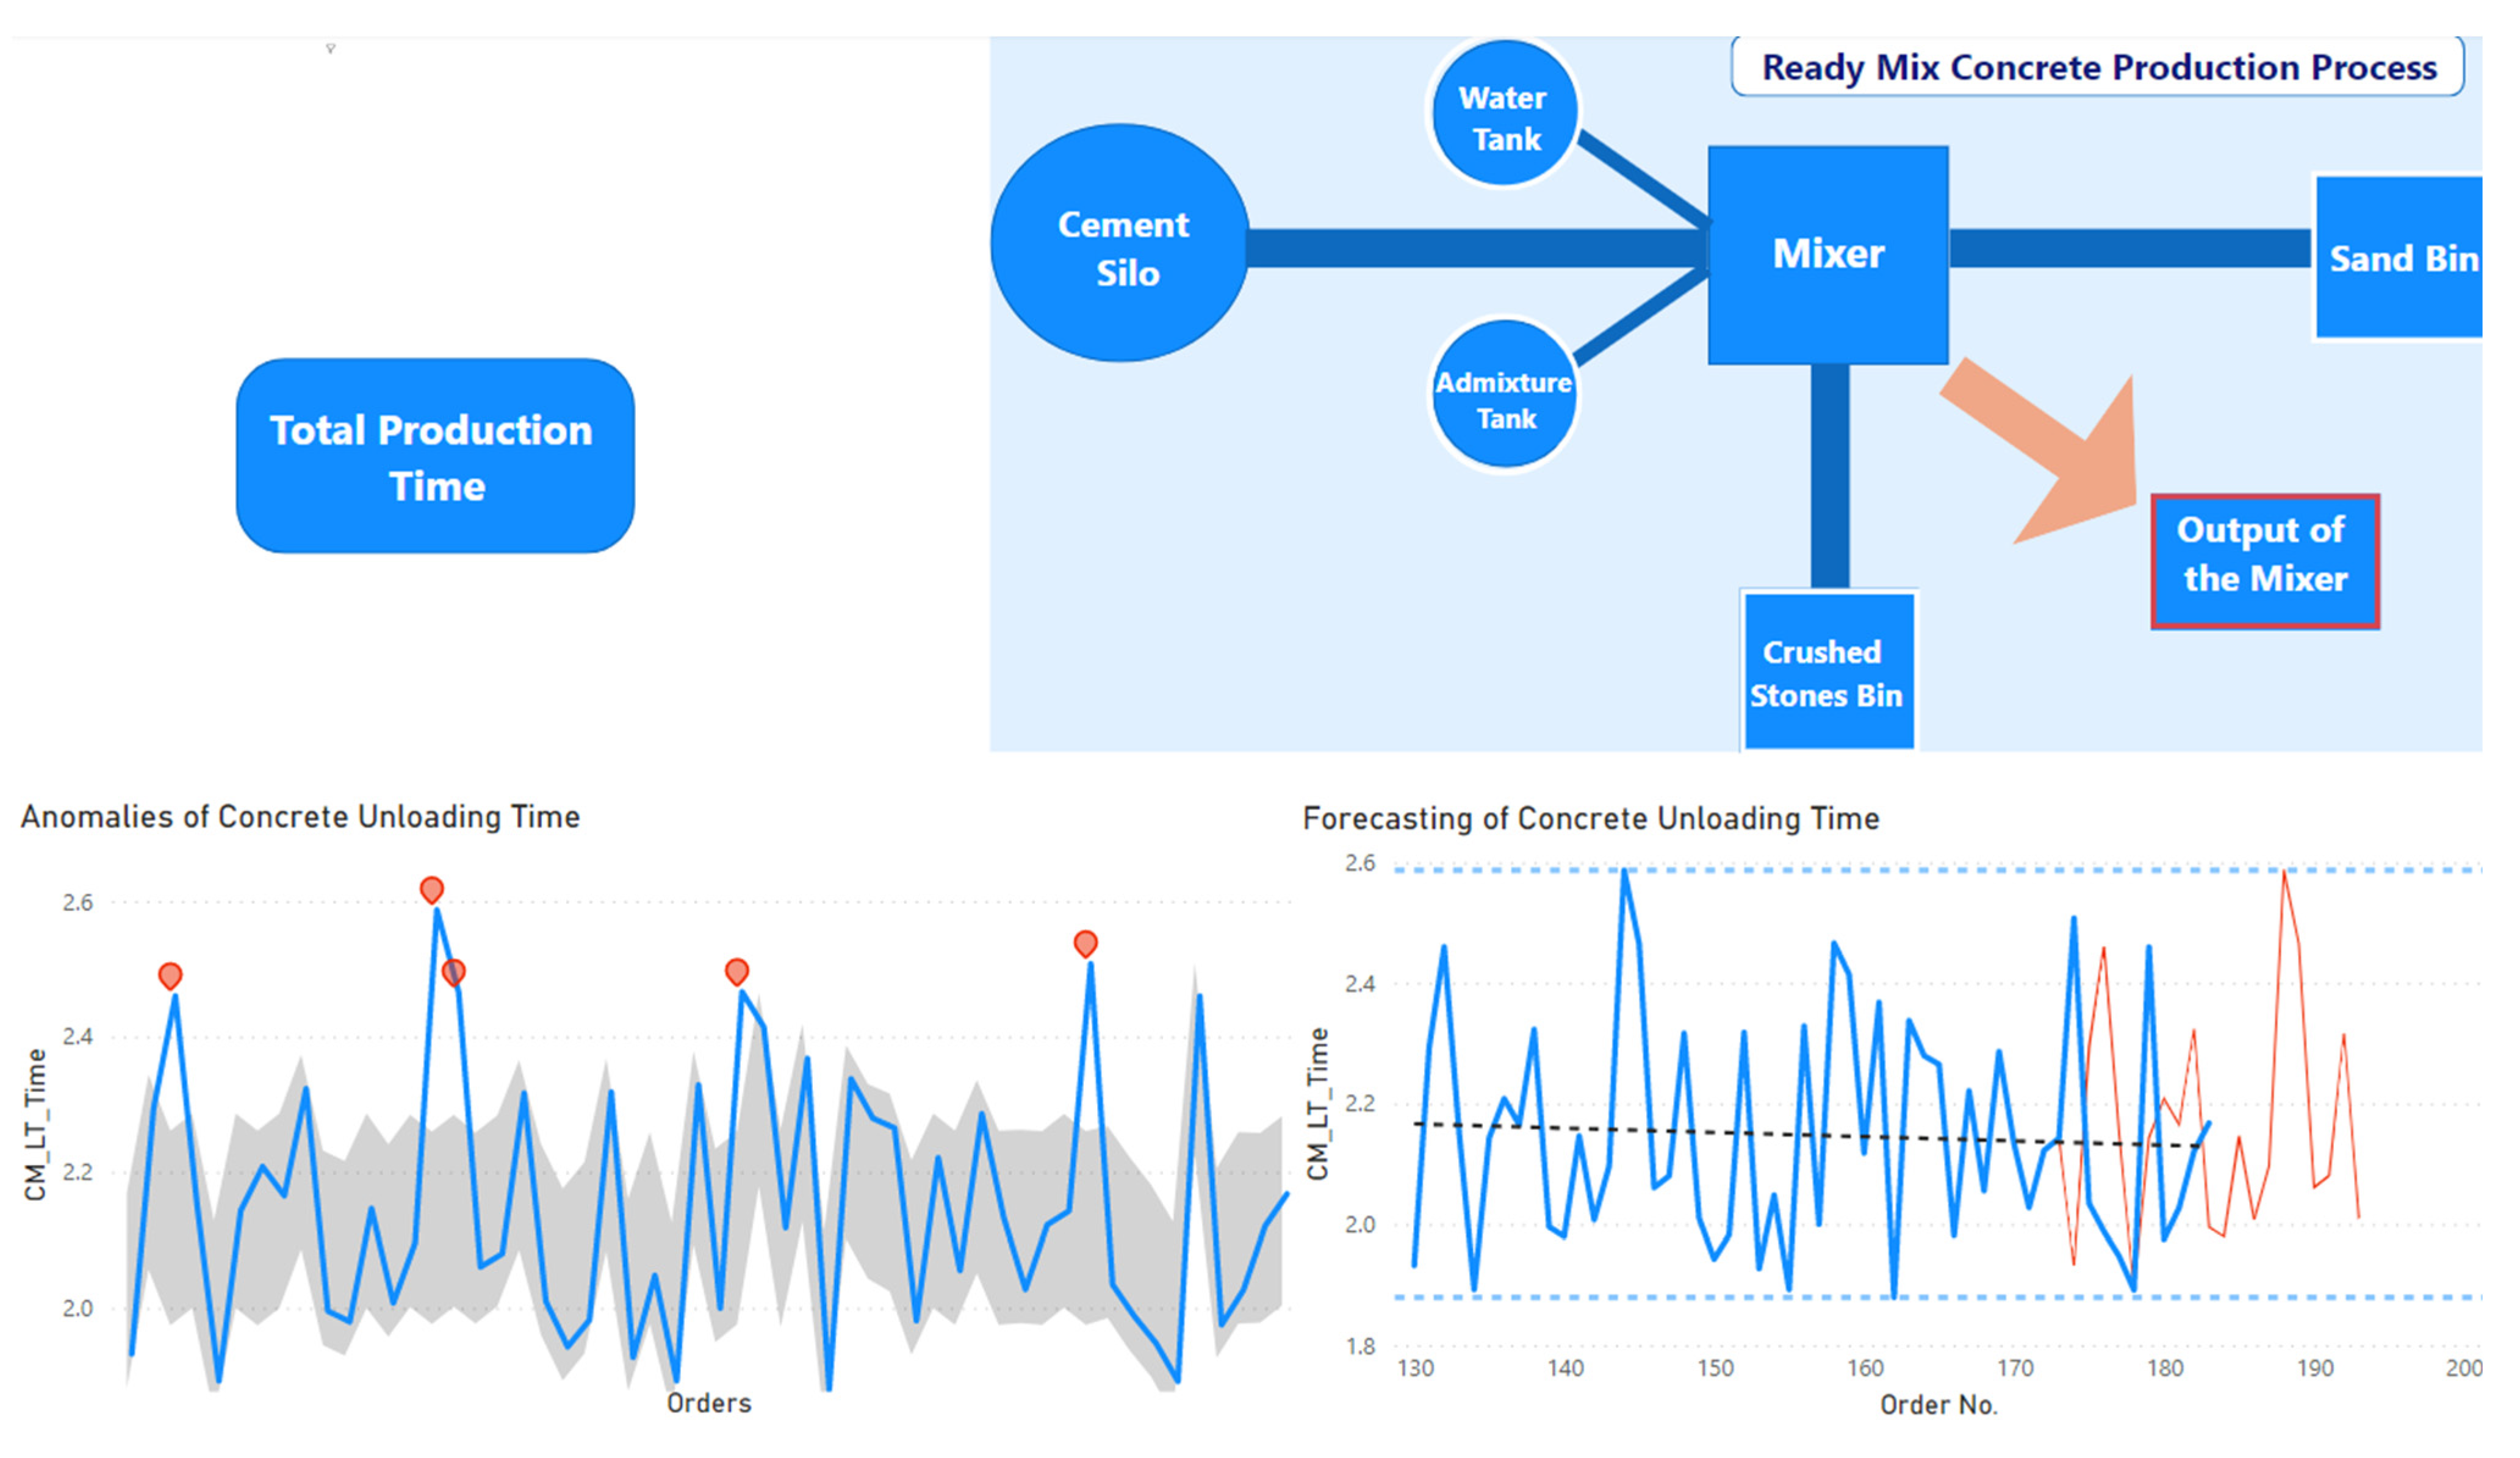
4.7. Advance Digital Twin Powered with Business Intelligence Analytical Dashboards
As shown in
Figure 18, the advanced analytical dashboard is the 2nd phase of the digital twin, which gives advanced insights into the process by identifying anomalous behavior affecting production process time as well as forecasting production process time for predictive maintenance decision-making. This dashboard consists of an operational layout, and each sub-production operation can be deeply analyzed by selecting each option, such as the cement silo, water tank, admixtures tank, mixer, sand bin, output of the mixer and total production time (
Appendix A.3).
The first graph shows the anomalies in total production time for selected sub-production operations. The red dots interpret the anomalies on both the top and bottom of the graph, which indicate possible issues that need to be rectified to have a non-disruptive ready-mix concrete production process. Anomalies at the top represent the production times that took significantly more time than the usual standard production time range/sensitivity level shown in the silver-colored range. Possible insights include inefficiency of the machinery due to lack of maintenance, which can possibly cause future machine breakdowns. Anomalies at the bottom represent the production times that took significantly less time than the usual standard production time range/sensitivity level. Possible insights are that one or more production operations/machines have not been operated with the standard calibration, or that there is a mechanical issue in the machinery.
The second graph forecasts the total production time based on previous production cycles. Based on previous orders, this model predicts the next 10 order cycles. The trend line indicates whether the forecast will go upwards or downwards, whereas the straight horizontal line gives a safe indication that the production process is normal for the current and upcoming production cycles. However, if the trend line slopes upward, then it indicates that that specific sub-production’s operation/total production is inefficient, which can be a potential machine breakdown/production delay. Moreover, if the trend line slopes downward, it indicates that the production machinery has not operated according to the standard cycle time, which can be due to calibration or mechanical issues with the machinery.
Moreover, the process forecasting graph provides insight into whether the predicted process time for the next 10 production cycles exceeds the maximum or the minimum production cycle time thresholds that occurred in the past, which were shown to be associated with significant production delays, failures or maintenance activities.
As shown in
Table 8, the accuracy of the forecasting model was evaluated by using the data of
Appendix A.4. As shown in
Table 3, a MAPE value below 20% is a good forecasting model, and the value of RMSE being close to zero also indicates a perfect model. Therefore, the Exponential Smoothening (ES) forecasting model used in Microsoft power BI is a good model for forecasting the RMC production process.
The total production time of the entire process gives the first indication for potential bottlenecks in overall production. Nevertheless, it is needed to identify at what sub-production operation that the bottleneck has occurred. To identify the bottleneck precisely, it is a must to access each sub-production operation and identify its abnormal situation.
Two validation rounds were conducted with the additional improvements given in the first validation session, and all of the experts gave favorable comments in the second validation round by proving the feasibility of the proposed product. Factors such as product feature evaluation, likability of the product and overall product functionality were evaluated for design for the production process, the working model of the product, the design of the product and measuring how the product will perform [
51].
4.8. Business Value Interpretation of Proposed Product for RMC Industry
4.8.1. Risk Scenarios to Which the Proposed Solution Can Be Applied Effectively
R1—When it comes to the concrete piling scenario, if the sites order higher quantities than the normal production quantity per production cycle of the RMC plant, then it needs to be delivered right away without any production delays, exceeding the standard interarrival rate of order deliveries. If the interarrival is exceeded, then the concrete that was sent will harden on the site premises, and the client will not be able to put all of the piling concrete underground on the site as needed. This may impact the entire quality of the client’s site.
R2—When using the pump truck, it needs to supply concrete continuously and not be idle for more than the standard interarrival time of concrete deliveries. If the pump truck does not get the concrete continuously, then the concrete inside the pump/tube hardens and eventually becomes useless (although some trucks keep 0.5 CBM of buffer stock inside the bucket of the pump truck to extend the time it takes to harden concrete inside the pump).
R3—If there is a delay in RMC production, then from the client’s end, they have to keep the rented machinery and the contracted labor (hourly paid) waiting, which creates a significant unnecessary cost for the client and causes customer dissatisfaction from the RMC plant’s point of view.
R4—If sub-production operations and their machinery are not operated up to the expected time, then the concrete delivery can either be rejected at the plant or during site quality checks, which necessitates remaking the concrete and delivering it to them again. This delays the expected order delivery time for clients and causes customer dissatisfaction.
R5—Providing concrete on time is essential because most current RMC customers stay with the same RMC supplier for years because of their customer service level. Therefore, the risk of production disruption needs to be mitigated in every possible way.
4.8.2. Benefits of the Proposed System to Overcome the above Risk Scenarios
In this system, production efficiency can be strictly monitored and maintained in such a way that there are no future production delays. This increases the customer service level by reducing the client’s idle time cost, site operation failure cost and returns from the client due to quality issues and delays.
This increases the production efficiency by operating the production cycle per the given standard cycle time and rectifying the possible bottlenecks before major disruptions occur.
This incremental improvement to production efficiency increases the plant’s throughput level without changes in the mechanical infrastructure.
The maintenance team can operate as an on-demand service because it is possible to identify and predict the bottlenecks of the production system and rectify them only when needed. Therefore, the maintenance team can be outsourced because there is less/no need for maintenance when there are no/fewer anomalies per day. In addition, annual repairs and monthly checkups are also not needed for the entire production system because requirements are triggered only when the bottleneck areas are identified.
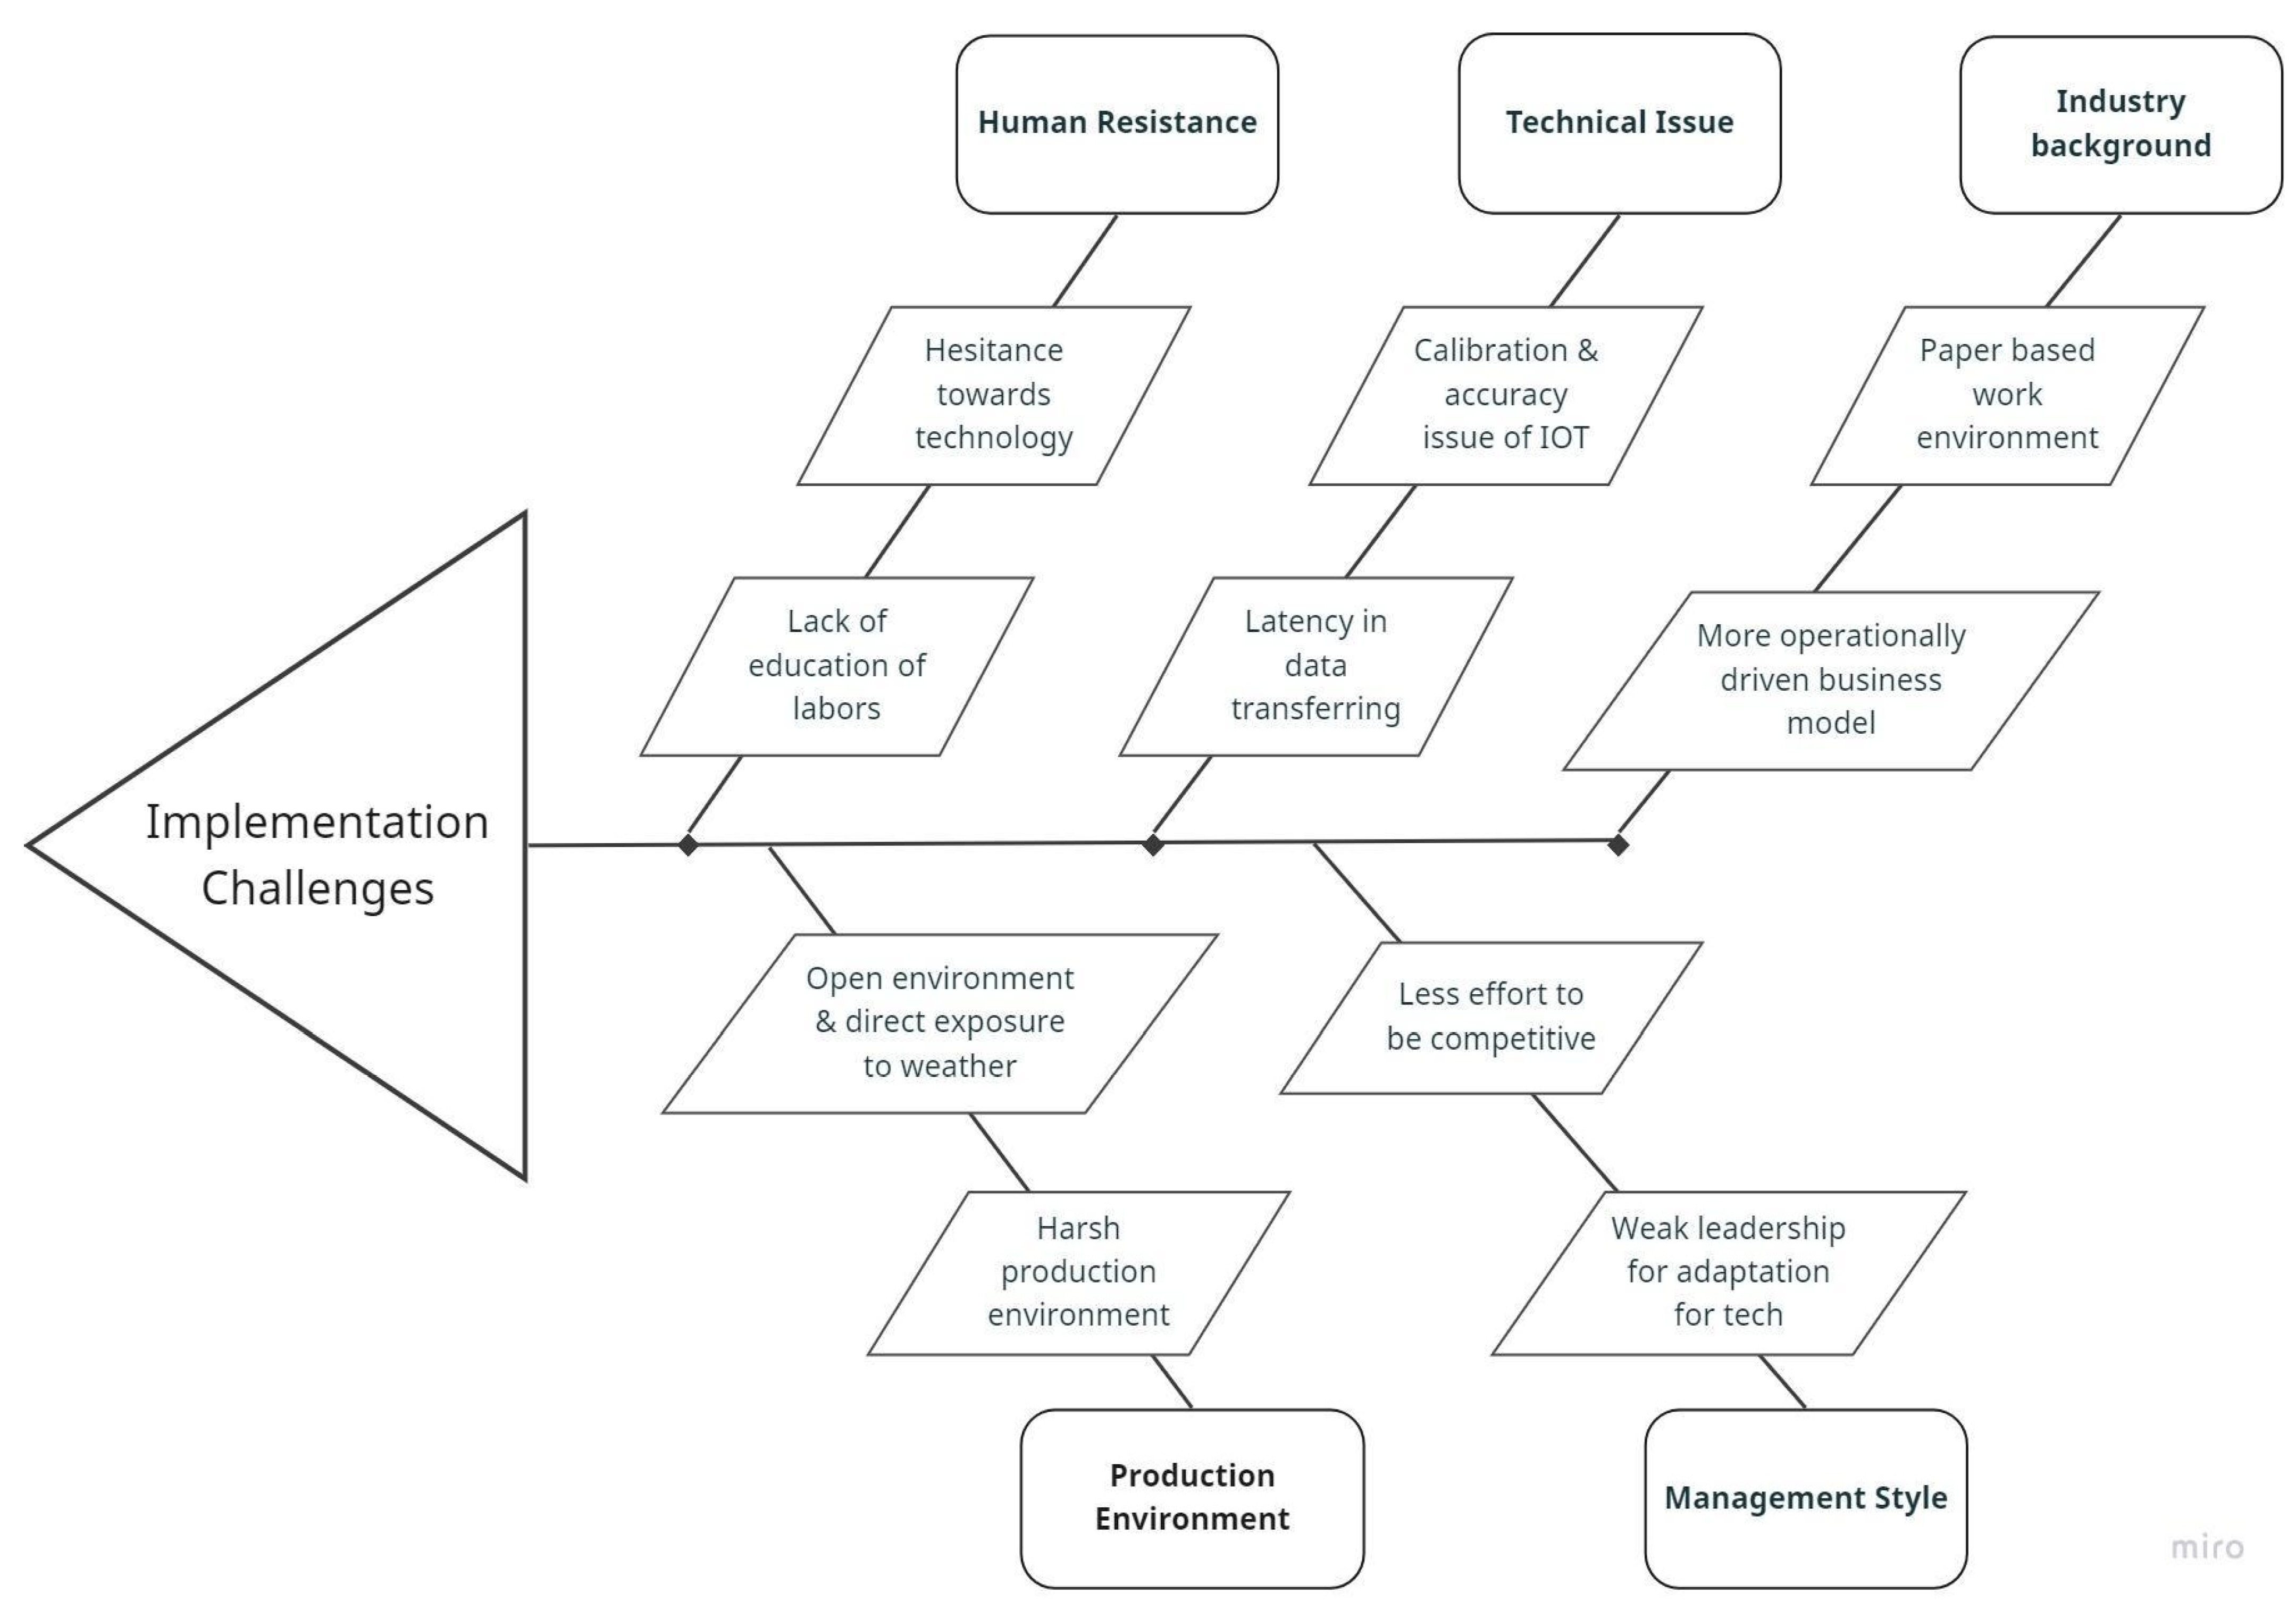
4.9. Challenges in Implementation
As shown in
Figure 19, the fish bone diagram captures the implementation challenges in terms of human resistance, management style, production environment, industry background, and technical issues.
4.9.1. Human Resistance
Uneducated laborers are used mostly in the construction industry, such as in ready-mix concrete plants, etc. Therefore, it is hard to make sustained significant changes to the initial process because they are not from an educated background and cannot absorb the value of the change. As per the experts from ready-mix concrete plants, even though the ground level laborers are trained intensively with incentives to perform a new task, they still do not perform as expected in the practical world. The main root causes of this is lack of education and the workers’ phobia for technology. Therefore, these issues may impact implementing a digital twin production risk management system in the RMC business.
4.9.2. Management Style
Most ready-mix concrete companies are only focusing on keep the business running as it is without any significant improvements. Due to this inherent issue, management is also reluctant to take the initiative and drive that change to the bottom level of the company hierarchy. Except for the large players among RMC businesses, most of the other RMC companies are not trying to be competitive. It makes the talent of those companies move to other competitive companies for career advancement.
4.9.3. Production Environment
Because it is needed to get real-time production operational data from the RMC plant using an IoT system, it is a must to have a well-protected and properly planned design to protect the system from the external influences of a harsh production line such as that of RMC, which is because the production system is open entirely to the atmosphere and the external environment.
4.9.4. Industry Background
Most RMC business are still operated in a traditional manner, meaning they only collect limited data, such as delivery order details and customer order data, using paper-based methods. In addition, due to the traditional approach and low career growth of the RMC business, material engineers shift to other construction companies. Moreover, compared to other construction business models, RMC is a more operationally driven industry.
4.9.5. Technical Issues
There is a risk that the proposed IoT system faces accuracy issues due to calibration issues, etc. This becomes critical when thundering occurs and impacts sensor output. In such cases, the calibration of sensors must be kept as per the standard. In addition, due to the signal issues, there might be a delay in the real-time data that are taken from the production process when connecting to the database to make the digital twin system run.
5. Conclusions
Ready-mix concrete production is a highly disruptive process that faces significant losses in terms of time and costs for both plants and clients. A solid real-time risk management solution is a must to identify machinery inefficiencies and breakdowns beforehand and rectify them before any production disruption happens. This study proposes the first ever customized digital twin application for the ready-mix concrete industry that effectively predicts process bottlenecks, detects process anomalies and forecasts process disruptions along with additional process performance monitoring capabilities. The value it brings to the RMC industry is immense by reducing the idle time of both the plant and the client, reworking cost and client operation disruptions, optimizing maintenance resources and improving asset health and performance while also increasing customer service levels, the bottom line of the RMC plant and overall productivity.
Our research covers the entire digital twin implementation process by providing the digital twin development procedure, the benefits and implications of the proposed solution and its challenges in implementation in the ready-mix concrete industry.
Our study’s limitations are that our proposed DT solution was validated using simulated data and feedback from experts. No real-time operational field data was extracted from actual plant operations. In addition, the proposed solution was developed to be operable only for one concrete type even though an actual plant can have many concrete types in terms of different compositions. Moreover, this works as a value-add for already automated plants. The IoT system in this solution was developed for a general RMC plant layout, as shown in
Appendix A.2, and it can be slightly different for other layouts. We only considered production disruptions due to failures in machinery, but production can be impacted by other interconnected processes within production, such as logistics delays and raw material shortages. As future research directions, we suggest incorporating sourcing and distribution operations into the base digital twin product we proposed in our study. Further, other predictive maintenance parameters such as vibration can be used to investigate the machines’ operations more deeply.

 ,
, 


 Inefficiency of operation/potential future machine breakdowns.
  Issue of machines with wrong calibration/potential future machine breakdowns.