Article

Development of a Multi-Asset Risk Assessment Algorithm in the Context of Home Energy Management

by
Davide Ottonello
1,
Alessandro Fermi
1,
Daniele Ravizza
1,
Marco Barbagelata
1,
Stylianos Karatzas
2,*,
Athanasios Chassiakos
2 and
Antonis Papamanolis
2,*
1
STAM Srl. Digital Solutions Business Area, 16121 Genova, Italy
2
Project, Infrastructure and City Management Laboratory, Department of Civil Engineering, University of Patras, 26504 Patras, Greece
*
Authors to whom correspondence should be addressed.
Buildings 2023, 13(2), 428; https://doi.org/10.3390/buildings13020428
Submission received: 13 December 2022 / Revised: 19 January 2023 / Accepted: 27 January 2023 / Published: 3 February 2023
(This article belongs to the Special Issue Advanced Materials and Systems for Energy Efficient Buildings)

Abstract

:
Risk management has become an important concern in the light of current developments in the home energy management sector as well as within the broader considerations regarding the building sector’s energy production and consumption paradigm. The current multi-parameter energy ecosystem structure raises a number of new challenges that require a reliable and robust risk management framework to assist in building management decision making. This paper presents a multi asset risk assessment algorithm, which is part of a risk management application developed for residential buildings within the framework of energy communities and digital energy markets. It describes the logic, principles, and operation of the algorithm, as well as the functionalities related to risk analysis and result visualization. This underpins the necessary means to monitor elements of a home energy system as well as tools for risk prevention and mitigation. The proposed application provides accurate, detailed, and easy to use information to assist decision makers and stakeholders in the context of smart home energy management systems.

1. Introduction

1.1. Background

The European building sector constitutes one of the primary energy consumers and, therefore, reducing its environmental footprint is a major goal in the context of the broader paradigm for the necessary shift as a response to the ongoing climate crisis. In this direction, several research works have been conducted over the past 20 years related to the optimization of energy consumption in the building sector. This includes the improvement of management practices as well as the development and implementation of new strategies and approaches. The integration of smart home energy management systems (SHEMS) for the efficient management of energy consumption at the residential level is a promising research direction [1]. These systems are an integral part of smart grids, as an emerging paradigm of energy production and consumption aimed at making buildings active nodes within the energy network.
The Congressional Research Service report on the 2007 Energy Independence and Security Act defines a smart grid (SG) as a distribution system that allows the bidirectional flow of information to and from the consumer’s meter [2]. As such, the SG allows for increased power grid efficiency, reliability, and flexibility while reducing the need for new grid infrastructure. The continuous rise in power demand and consumption as well as the growing sustainability and environmental concerns have led to a widespread application of the SG paradigm across electricity networks and a wide expansion of SG and related technologies research [3,4]. The contemporary smart electricity grid is conceptualized as a system of systems (SoS) that requires modelling and understanding of the multiple parts that constitute it as well as their interrelations [5]. Furthermore, the presence of smart devices and electronics on the grid poses an additional challenge for network operations since it leads to significant differentiation in power flow patterns and an increased need for enhanced supply quality and continuity. Given that the successful implementation of the SG paradigm is directly related to meeting the ever-increasing reliability challenge [6], this renders the efficient handling of risk in SG networks an essential component to their smooth operation.
Focusing on SHEMS, current research further indicates the lack of quality attributes such as security, privacy, and scalability, which points towards a research gap in the functionalities necessary for their smooth operation [1]. Furthermore, it has been established that renewable energy sources (RES) constitute an important factor of this paradigm shift, and the unpredictability of RES has been identified as a key challenge [7]. The broader social, technical, policy and economic considerations related to RES play a crucial role in the successful implementation of SG /SHEMS paradigms [8,9]. The present paper aims to consider these uncertainties and employ risk management as a tool for addressing certain aspects of the aforementioned issues and challenges. In this context, stakeholders of SG networks, including tenants, building and facility managers, energy providers, and distribution system operators, can benefit from the implementation of comprehensive risk management frameworks [10] and tools for monitoring the potential threats related to SG infrastructure, calculating the risk factor associated with each threat, and estimating their impact on the operation of the infrastructure in quantitative and monetary terms. Further, this framework can support and inform decision making regarding the activities associated with the operation of the SG (e.g., electricity production and consumption) and provide feedback to future network development planning. Furthermore, a robust and intuitive risk monitoring system can advance the necessary trust and acceptance among stakeholders, which is an essential component for the successful adoption of the SG paradigm [11].
The risk management framework presented in this paper is a quantitative risk management application dedicated to residential buildings and developed based on the aforementioned considerations. It has been part of the of the EU research project TwinERGY and its pilot applications to deal with a set of threats and risks and support decision making of the SG ecosystem from tenants and building managers to energy providers and distribution system operators (DSOs).

1.2. Asset Management & Risk Analysis

In the context of energy grid management, a number of parameters need to be considered that often lead to conflicting objectives which require optimum balancing. Further, changes in the electricity production, distribution, and consumption sectors (such as the SG paradigm) have introduced efficiency requirements as an additional consideration for grid stakeholders. These developments have led to the adoption of asset management frameworks as guiding principles for electricity network operations. Risk management, as described in the previous section, can be positioned within asset management decision support methodologies as the “systematic and coordinated activities and practices through which an organization optimally manages its assets and their associated performance, risk and expenditure over their lifecycle” [12]. These activities usually focus on the aspect of reliability and associated threats and risks, but other risk considerations (economic, safety, environmental etc.) have also been studied [13] and constitute important factors in a holistic asset management framework [12].
These holistic asset management frameworks encompass the breadth of related aspects such as generation, transmission and distribution networks, metrics, system modeling and analysis [14]. As mentioned earlier, relevant frameworks have inevitably increased in complexity to address the inherent challenges of emerging smart energy grid solutions, smart homes, and related home energy management systems [15]. With the emergence of these microgrid architectures in energy production and distribution networks, their resilience and risk management has become the object of extensive research [16]. The perceived risks and challenges extend across a wide spectrum, ranging from equipment failure to security issues [17,18,19]. The related literature categorizes the risks of smart grid applications and products in three broad categories: cybersecurity threats, physical threats, functional and economic threats [20].
The aggregation of the various factors and parameters outlined above accentuates the importance of risk as an integral part of energy grid asset management frameworks. Related research approaches and methodologies cover a broad spectrum that is rapidly expanding and evolving They range from risk categorization according to intrinsic characteristics [12] and classification of grid components as a method to model potential risk [14], to models for risk analysis, each focusing on specific aspects within the broader category of comprehensive risk assessment and system safety [21].

1.3. Risk Management

Τhe need for a robust and comprehensive risk management framework and application to deal with the variety of threats in the context of a home energy management system has been outlined in the literature and above. The aim of such framework is to address a wide variety of issues ranging from the vulnerabilities of interconnected systems (necessary to the IoT operation), to external attack and unauthorized access, which is among the leading concerns of users [19], to monitoring the devices’ malfunctions and communication issues, which have been found to be high-impact potential risks [20]. Therefore, it is important to develop suitable risk management systems for SHEMS applications to identify risks and provide the user with relevant information and decision support. The risk management application needs to provide both the necessary means to monitor all components of the smart home as well as tools for risk prevention and mitigation. These tools need to provide accurate, detailed, and easy to use information and directions to reduce the uncertainty and perceived risk. These characteristics are essential for the successful deployment of a smart home energy management system.
The present paper describes the proposed risk management application, including the tool components and the functionalities devoted to the risk analysis and result visualization. A detailed analysis of the tool’s logics and algorithms and the employed methodology is presented step-by-step along with the main formulas needed to substantiate such a presentation. A technical description of the application, the commands available and the information that can be visualized are presented through a set of case studies. The results that the user can obtain are described and the purposes and context of their use outlined. Additionally, the user experience (UX) for the field implementation, conclusions and future research directions are discussed.

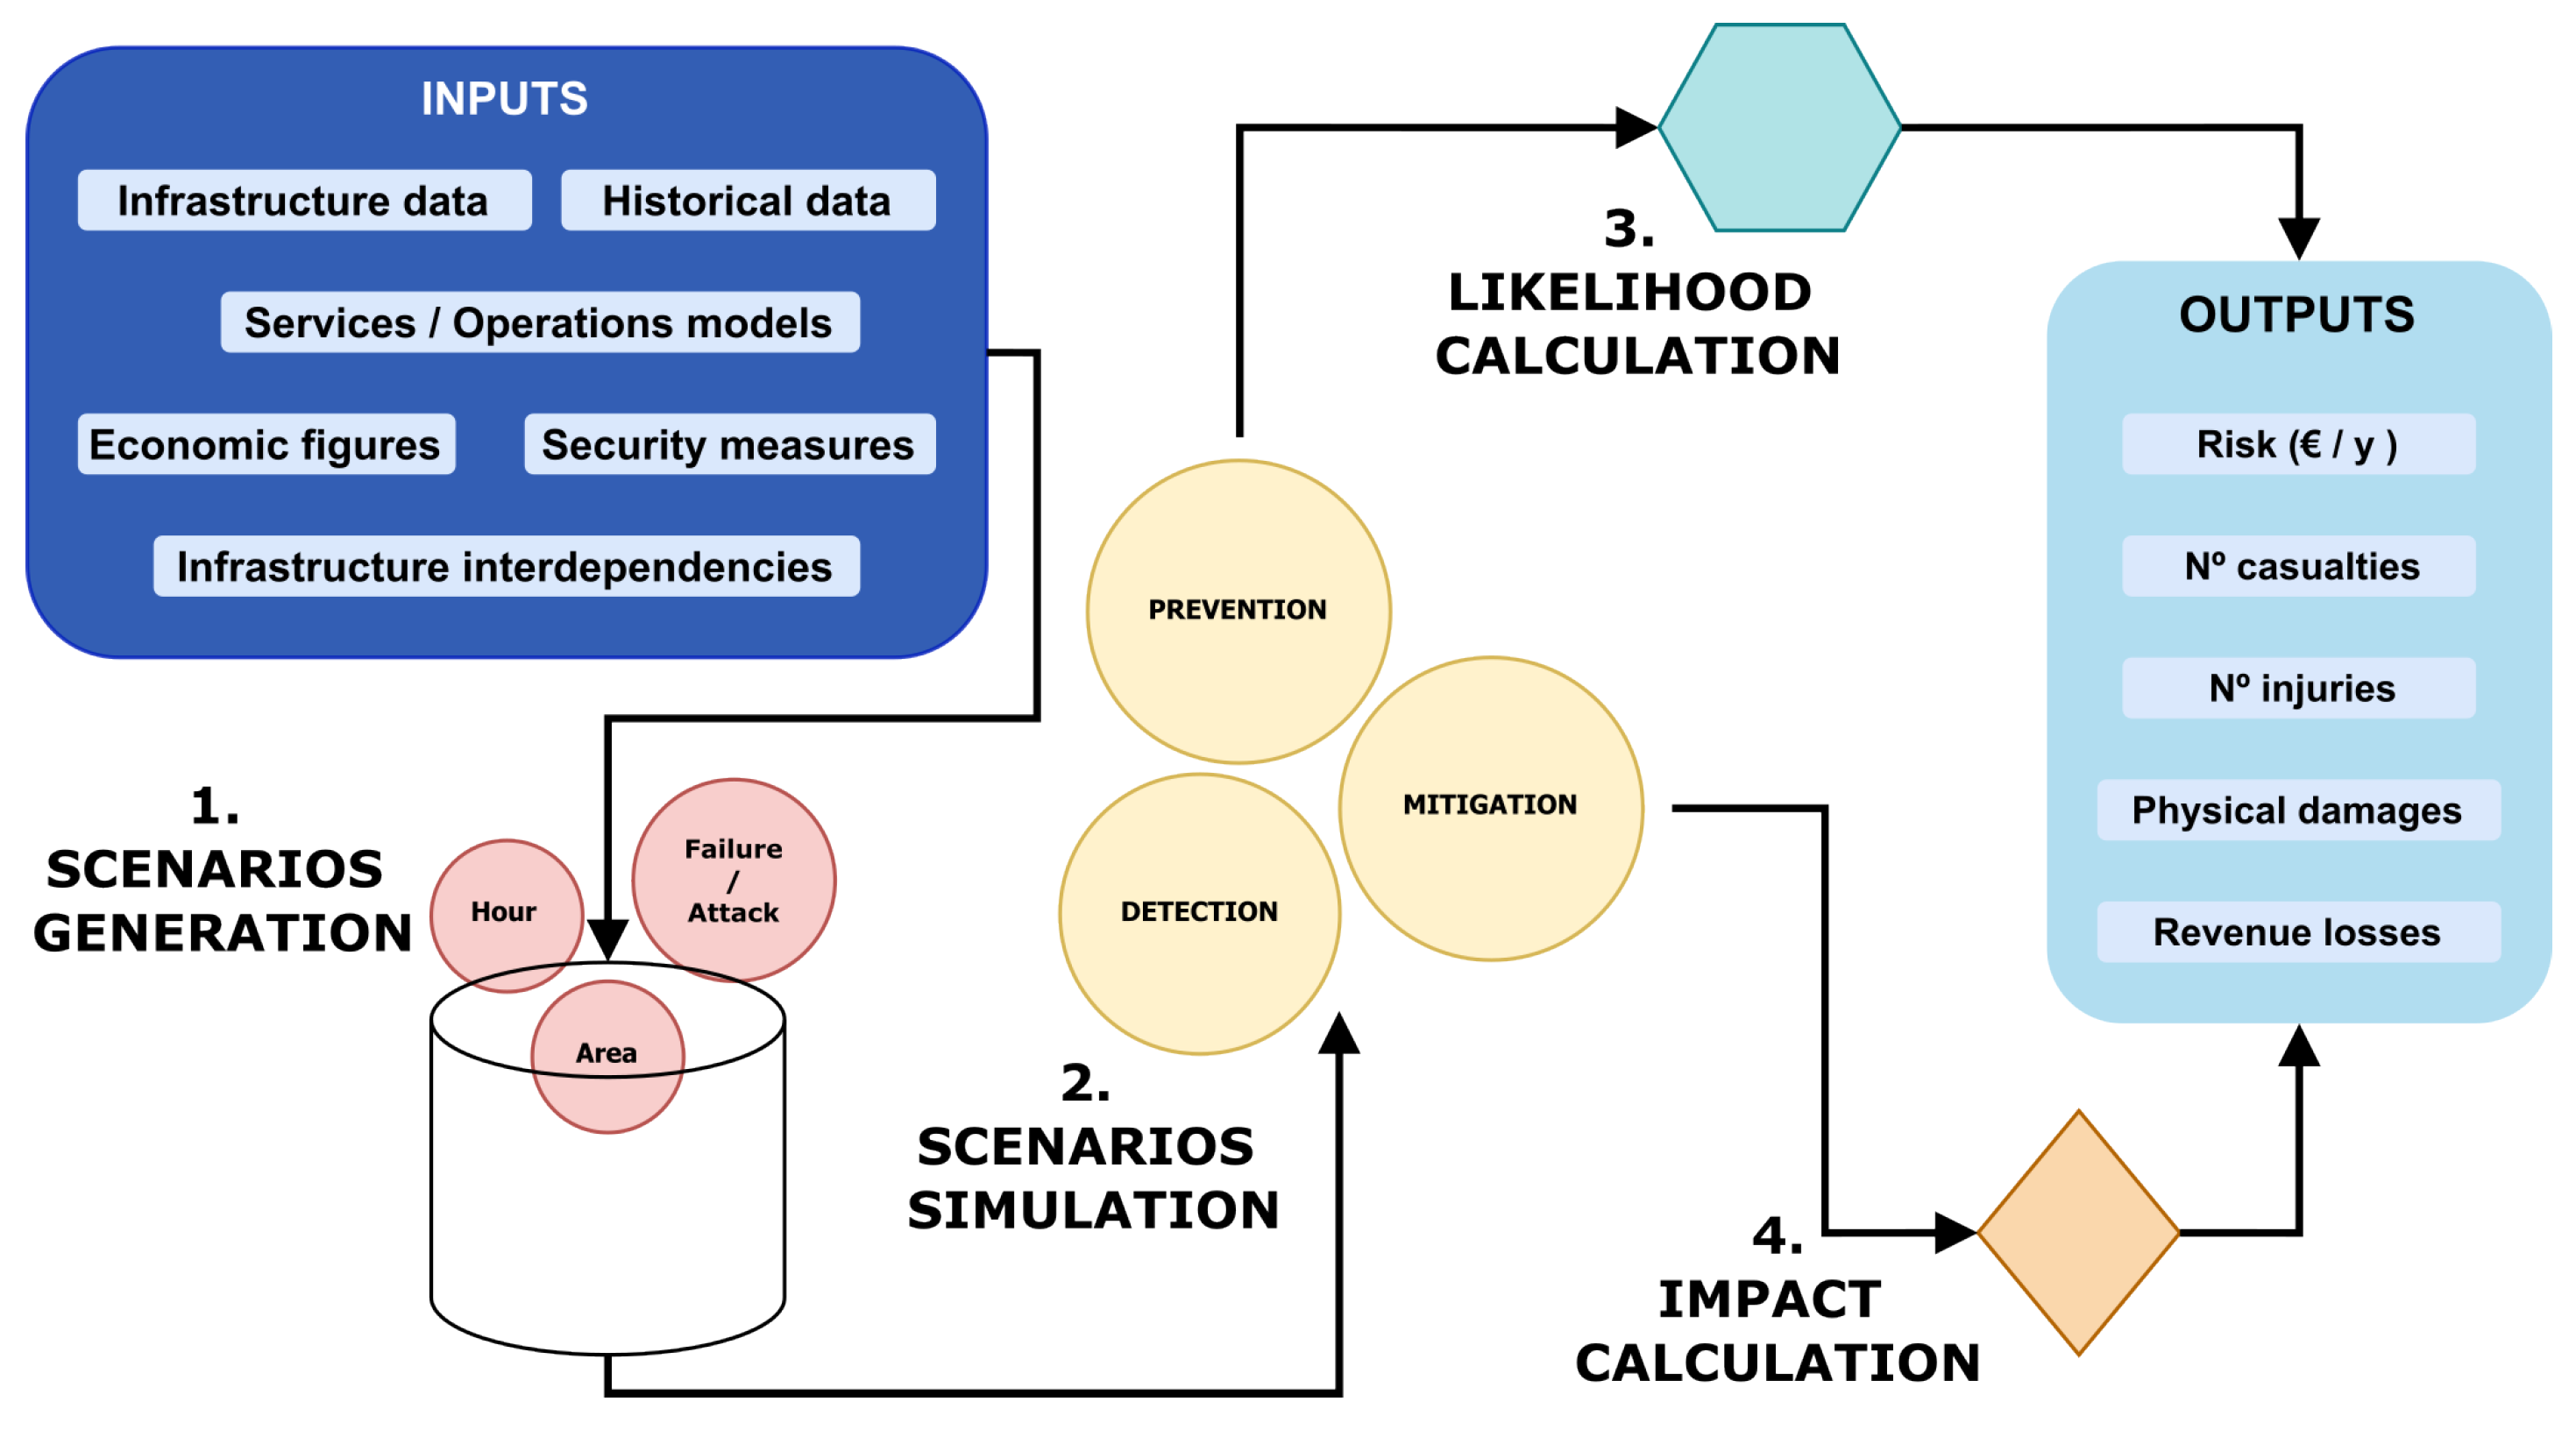
2. Materials and Methods

The algorithm for the risk management application is divided into four steps (Figure 1):
  • Scenario Generation: Depending on the parameters inserted by the user, the risk scenario is generated;
  • Scenario Simulation: The scenario generated in the previous step is simulated considering the potential countermeasures and the cascading effect (i.e., the threat propagation and generation of the related impacts) and results in the possible outcomes;
  • Likelihood Calculation: Following the outcome derivation, the corresponding likelihood is computed, starting from the probabilities of the triggering events;
  • Impact calculation: The effect of each outcome is calculated in monetary terms, taking into account any related physical damage, out of service condition or revenue loss. In addition, potential injuries may be considered.
Figure 1. Risk Management Algorithm Structure.
Buildings 13 00428 g001
The definition of the topology structure, the cascade effect model adopted, as well as of the necessary parameters and data that feeds the four algorithm steps are presented below.

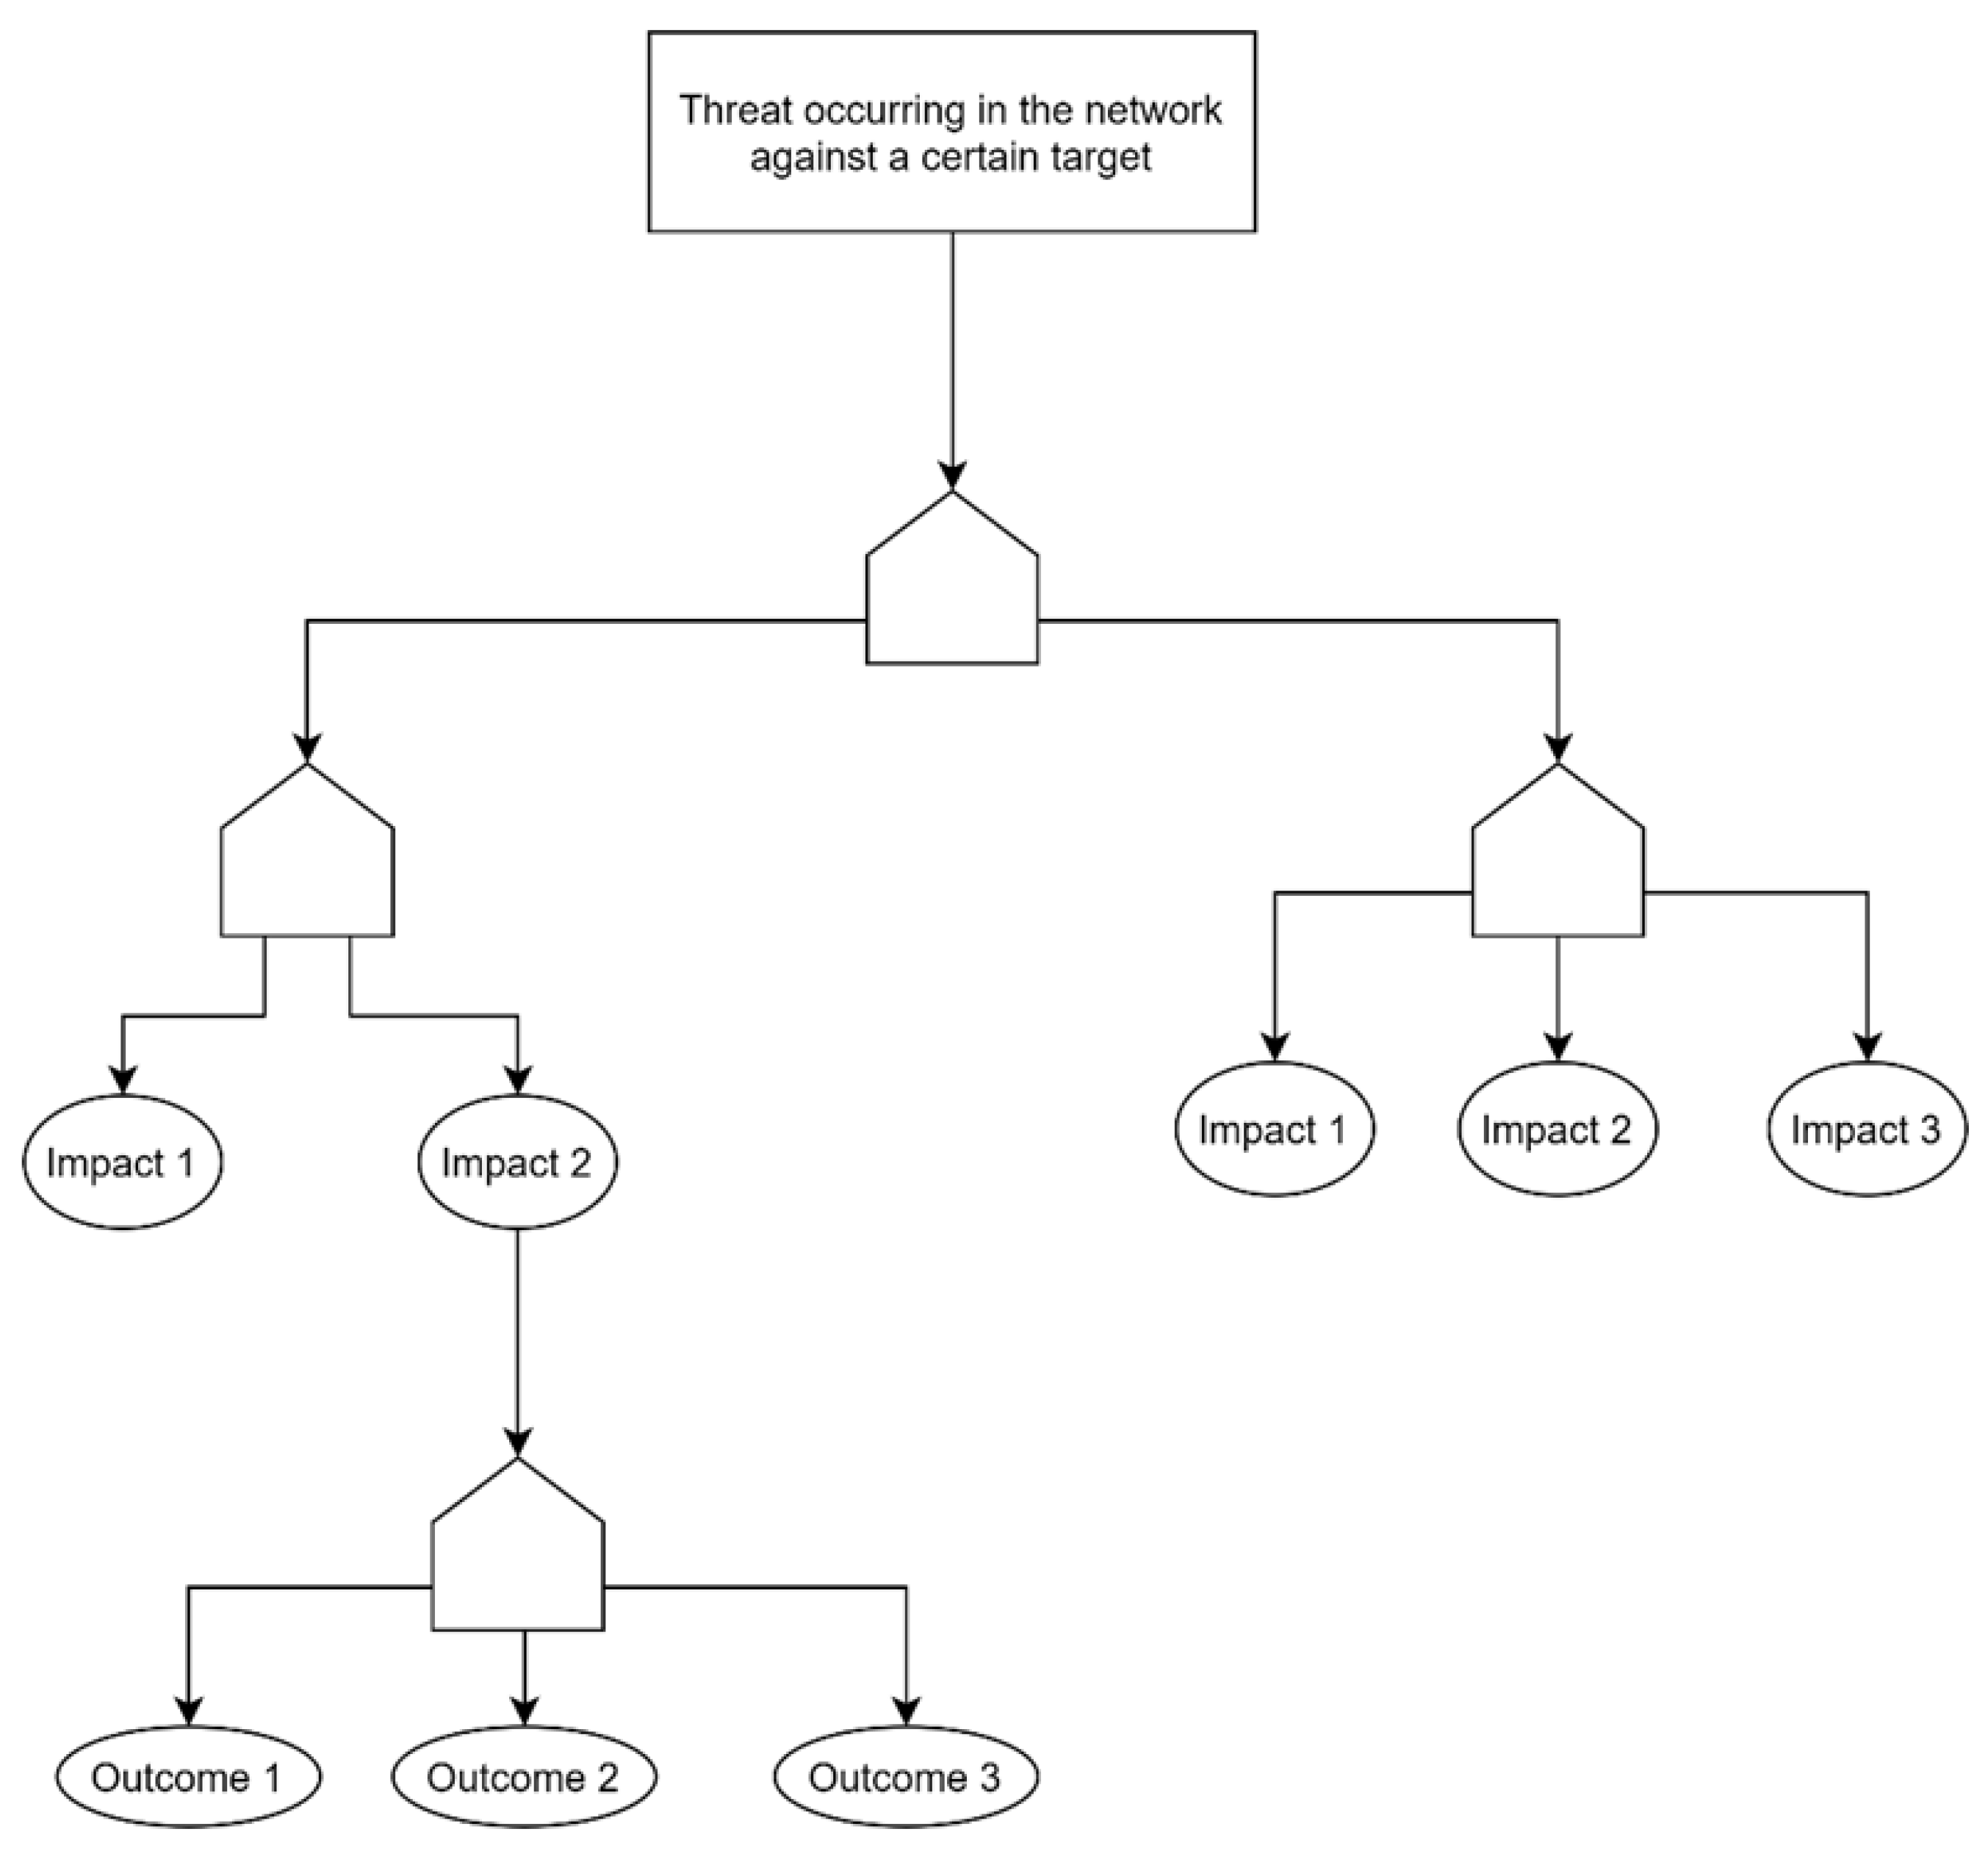
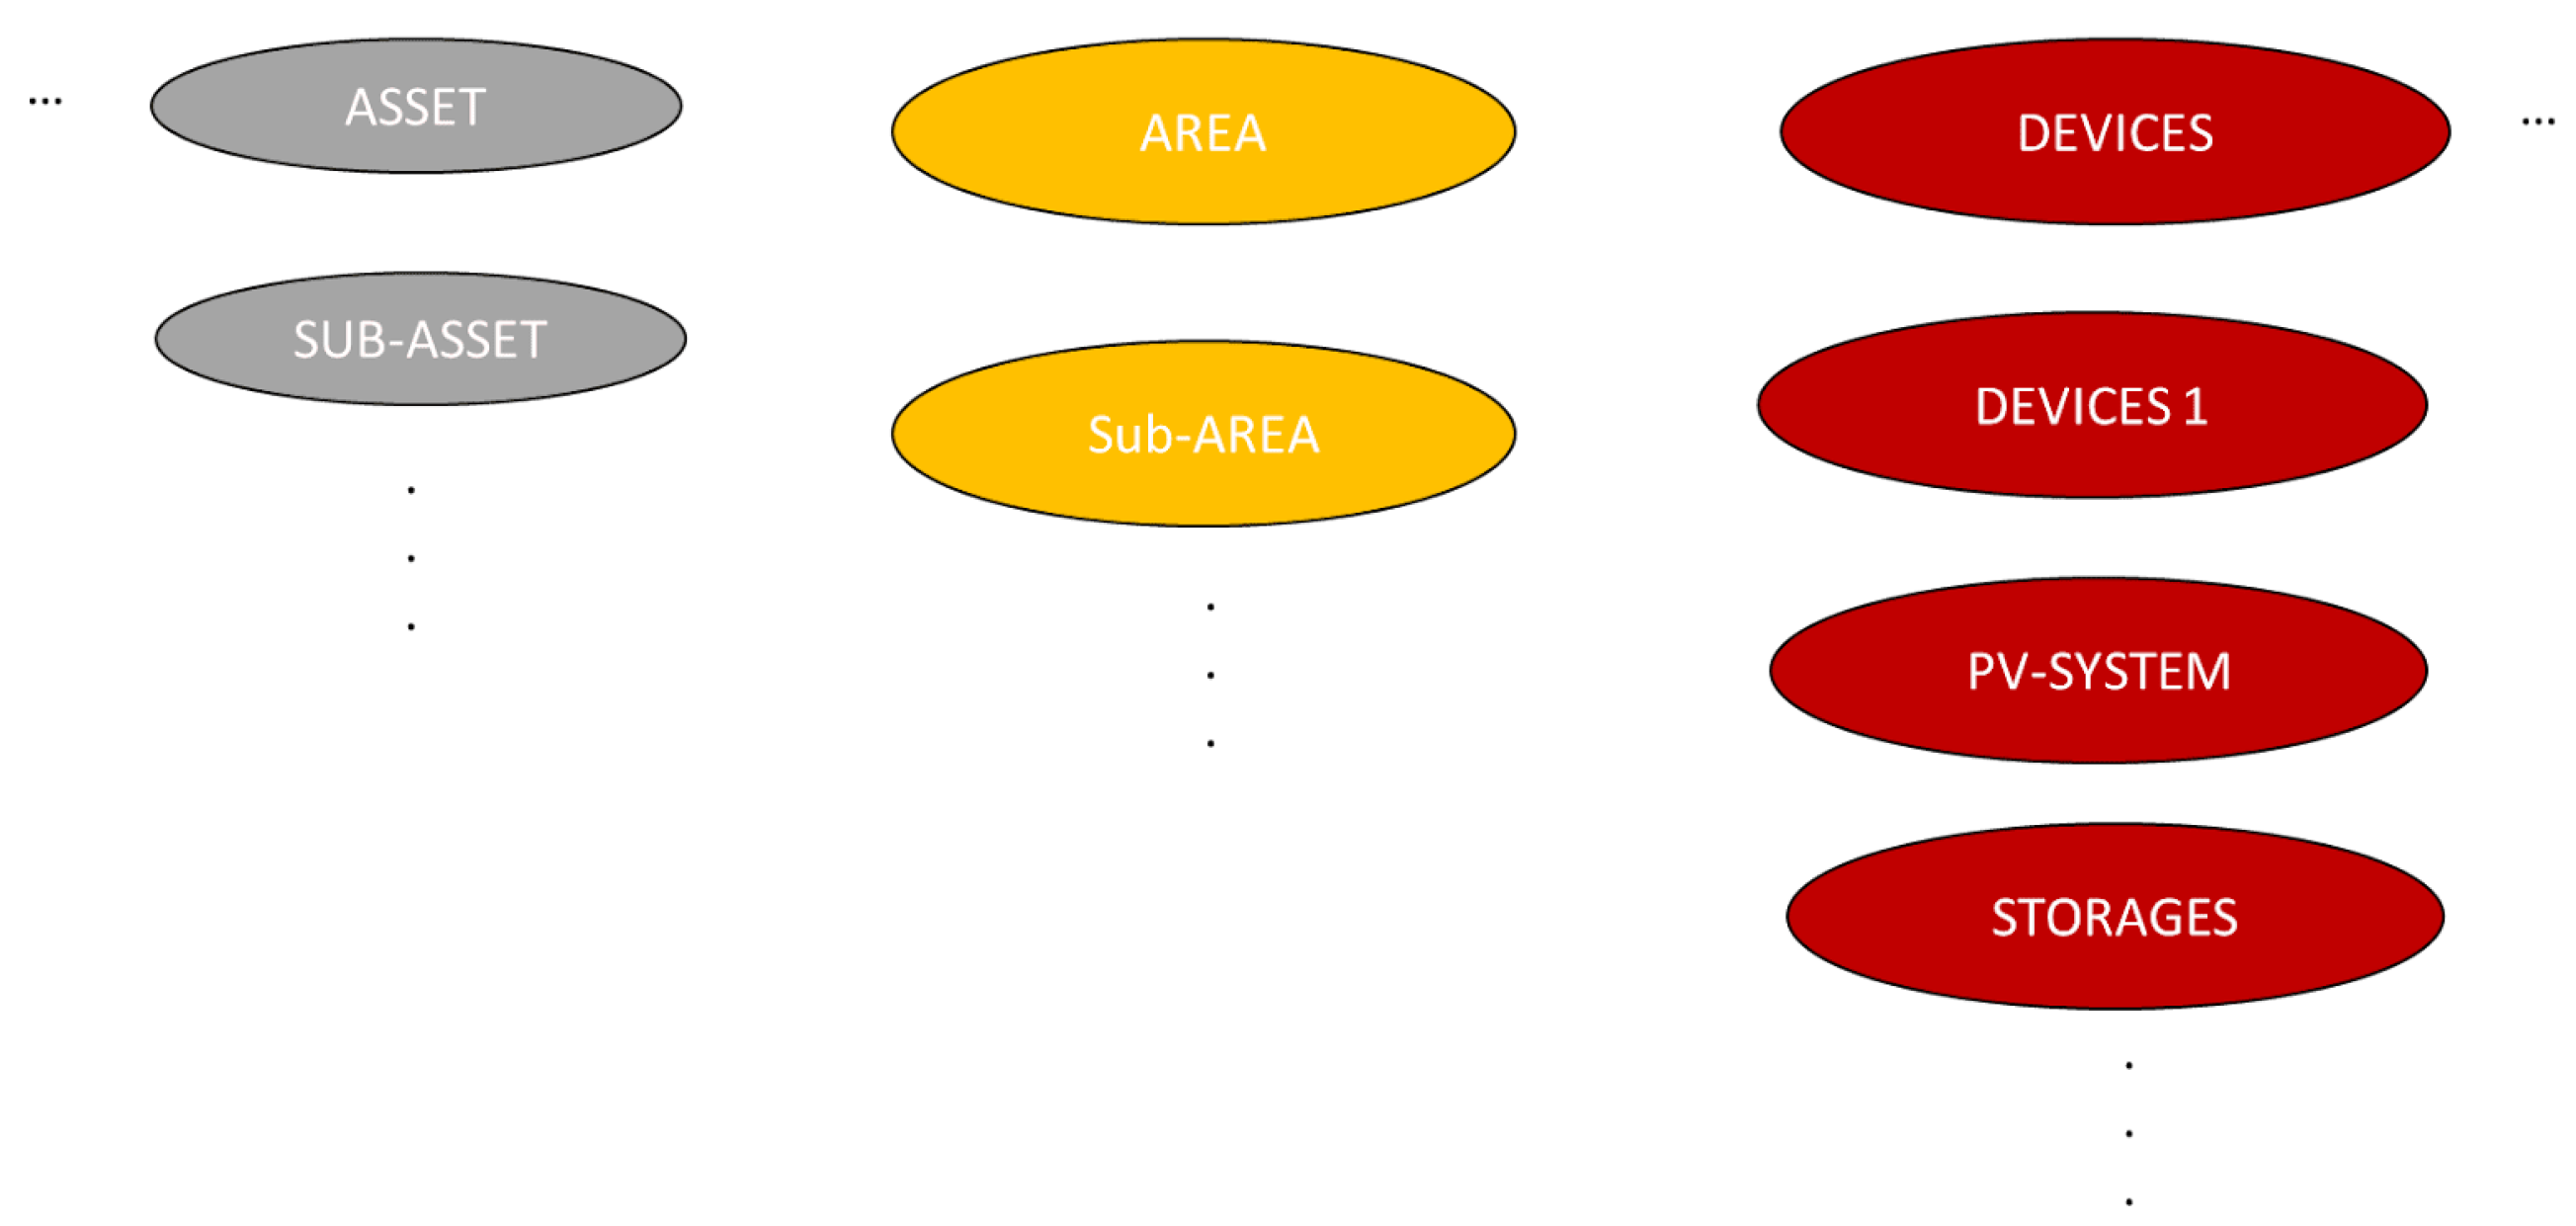
2.1. Topology Structure
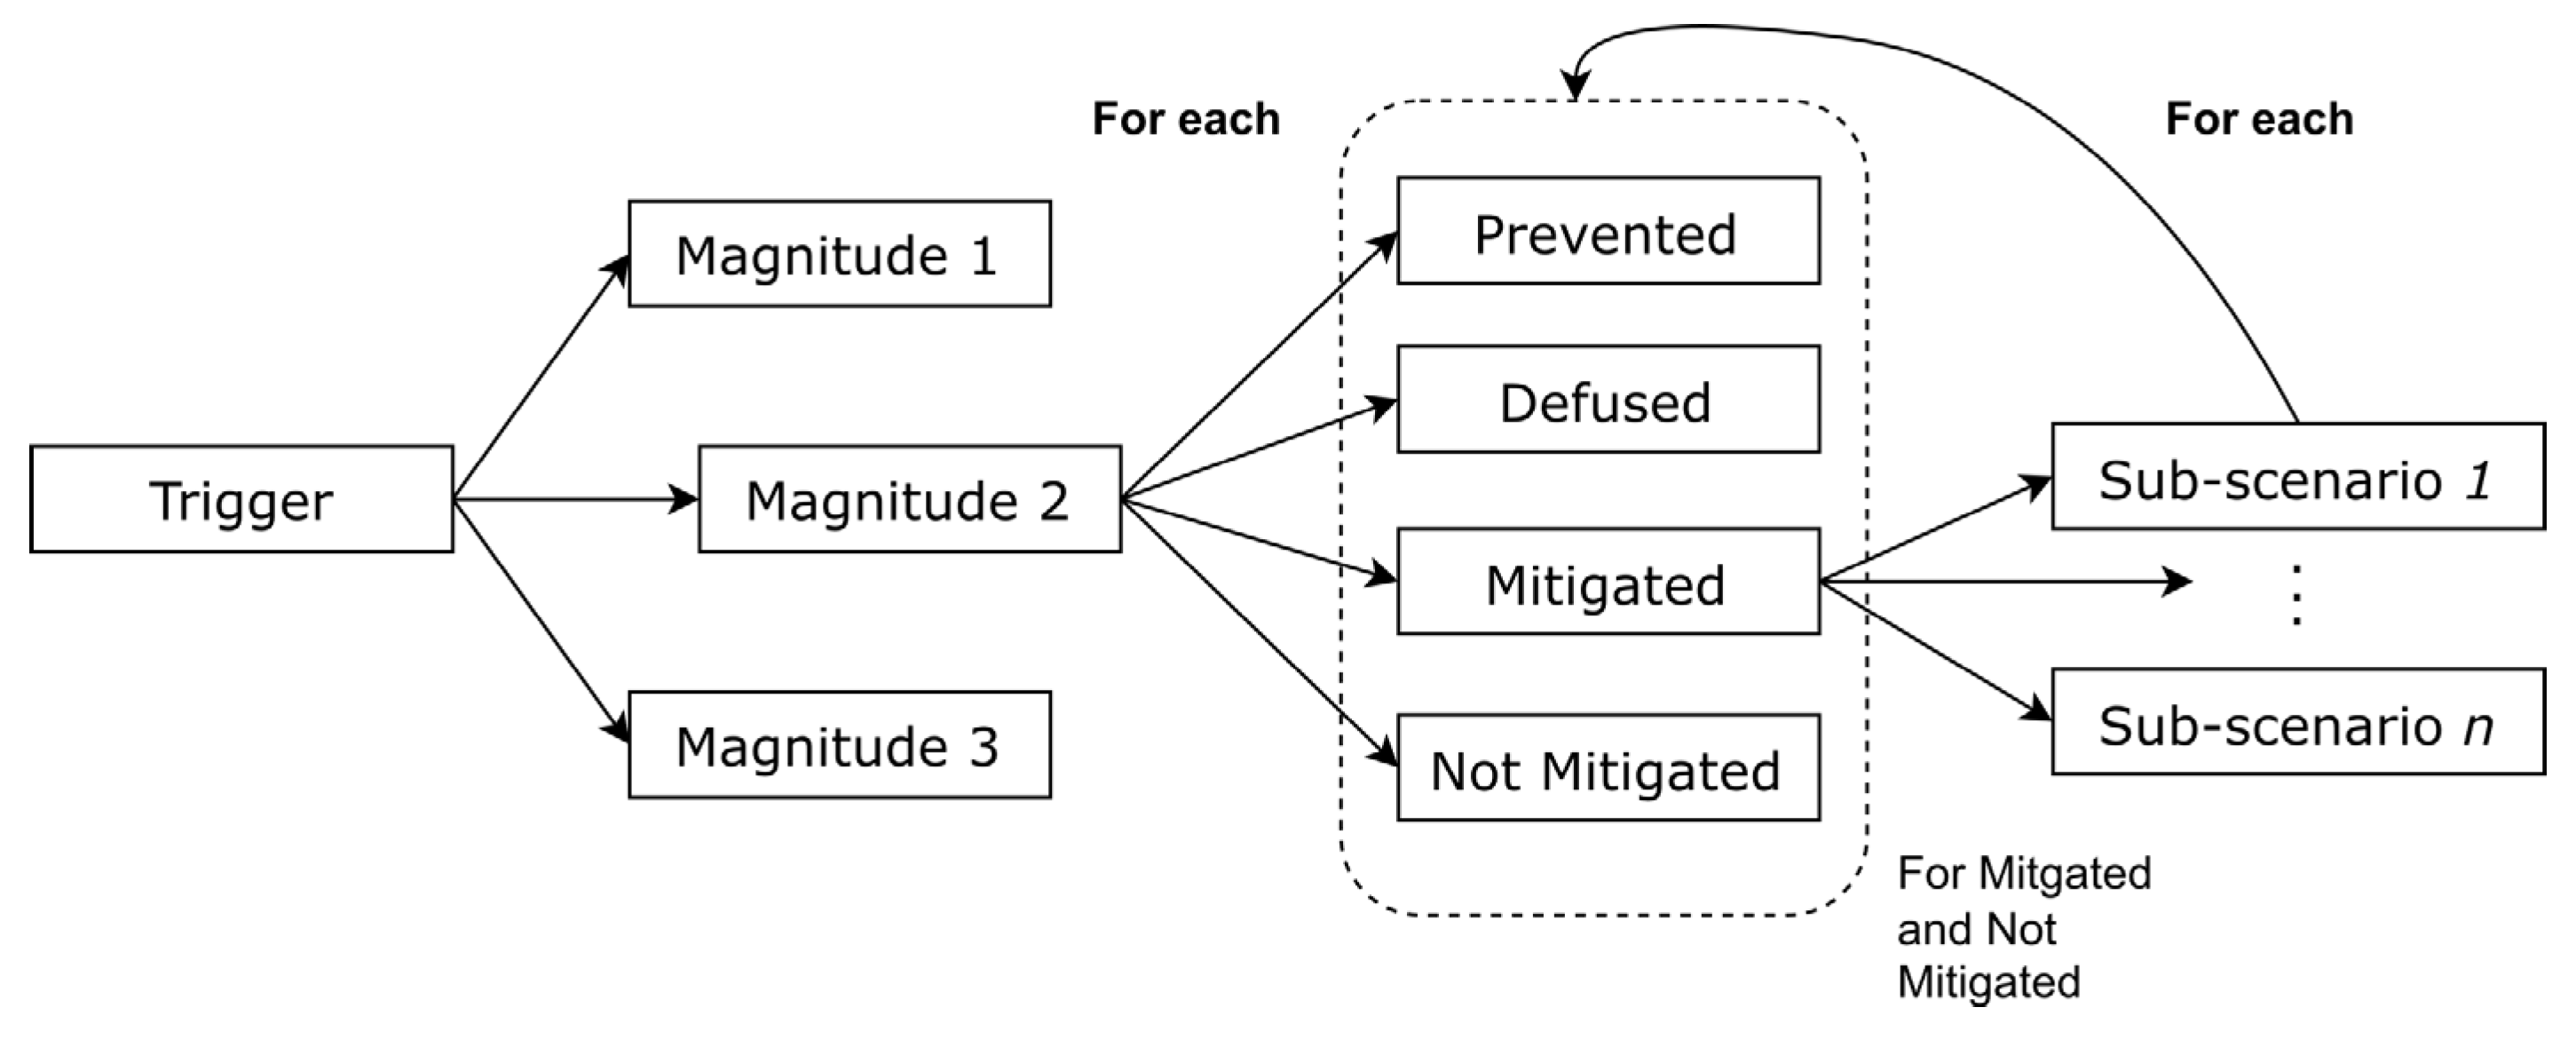
The algorithm development has been structured in a tree form [22]. This type of structure was chosen to allow tracking of the contribution of every event to the overall risk status in a simple and intuitive manner. The tree model structure used in the algorithm adopts a top-down approach, similar to fault tree analysis, which is a standard technique in risk assessment and accident analysis (Figure 2). The risk-triggering event is a threat against a certain target that is present in the network which generates a series of diverse impacts. The propagation of such impacts throughout the overall network is strongly dependent on the topology of the structure since impacts are generated and propagated depending on the connections between elements of the network. The generated impacts are mitigated by countermeasures embedded in the network, which have the capability to reduce or eliminate the effects of those impacts. This process leads to the generation of different outcomes, based on the efficiency of the aforementioned countermeasures, and the resulting propagation of the impact through the system. A main advance of this model, compared to the standard fault tree model, is the ability to represent the risk analysis of a building as a multi-dimensional graph. More specifically, the tree approach is used to represent a scenario occurring as a result of a threat while, within the network, it is possible to include several scenarios and several trees.

2.2. Cascade Effect

The algorithm used in the risk management application is based on a tree model structure to facilitate the propagation of impacts in the modeled network. This is fundamental for the cascade effect, where an impact acting on a node will also act on all the node’s children whose type is sensitive to such impact. Another important aspect is that threats are envisioned to be propagated from the parent node to the child ones but not vice versa, respecting the hierarchy of the infrastructure model presented below. The rationale of this rule is to avoid incurring infinite loops. However, since disruption of an asset also affects the services provided, the analysis takes into account that damage to a small asset (e.g., an electrical panel) can cause degradation to the performance of the whole building.
The tree model plays a fundamental role in the computation of risk in the algorithm (Figure 3). The process begins with the generation of the first impact in the examined scenario. The computation is performed for each possible impact magnitude and, depending on several parameters, such as the presence and effectiveness of countermeasures, several outcomes are generated. Specifically, the impact on a specific element of the network can be:
  • Prevented;
  • Defused;
  • Mitigated;
  • Not Mitigated.
Figure 3. Risk Management Algorithm—Outcomes and cascade effect (sub-scenarios are run for each connected asset).
Buildings 13 00428 g003
As a result, diverse outcomes arise. Depending on the outcomes generated for the parent node, the current impact is propagated downwards to the child nodes, giving rise to the cascade effect.

2.3. Inputs

In order to properly operate, the algorithm for risk computation requires several input parameters, the most important of which are listed below:
  • List of examined areas ( a i ) in the building A i = a 1 , a 2 , , a i ;
  • List of all possible threats T H i = t h 1 , t h 2 , , t h k ;
  • The economic value of each area, denoted by E V A i A i ;
  • The three levels of magnitude M z = m 1   m 2   m 3 , which represents the intensity of a threat;
  • The probability of a certain threat with a certain magnitude.
    P T H k , M z = P T H 1 , M 1 , P T H 2 , M 2 , , P T H k , M z   ;

2.4. Scenario Generation and Likelihood Calculation

The starting step of the algorithm is the generation of a feasible scenario [23]. A scenario in this case is characterized by three elements: threat, target and time of occurrence (Equation (1)).
S c e n a r i o T h r e a t , T a r g e t , T i m e   o f   o c c u r e n c e
Threat and target are fundamental in the identification of a scenario in order to understand the corresponding impacts and their propagation in the network elements. The time of occurrence is required to define those parameters that are time dependent. The scenario is then divided into sub-scenarios (Equation (2)), which depend on the magnitude type and the outcome type.
S u b s c e n a r i o T h r e a t , M a g n i t u d e , T a r g e t , T i m e   o f   o c c u r e n c e
The magnitude value is strongly related to the threats and to the users’ perception of them. In this tool, three magnitude levels are considered: low, medium, and high. This means that, for each scenario, tree subsections are arranged based on the likelihood of the same threat considered with varying intensity levels. The equation utilized to compute the probability of a specific scenario ( S i j k z ) depends mainly on the probability of the threat with the corresponding magnitude (P) and the “importance” (IM) of the target in the structure topology, i.e., a score describing the significance of the area affected by the threat:
P S i j k z = f P T H k , M z , I M A i , T j
Based on the probability of a scenario, the likelihood of occurrence is computed by the algorithm for each possible outcome. This value considers also the experience gained by the actual pilot implementation of the project and from historical record data.

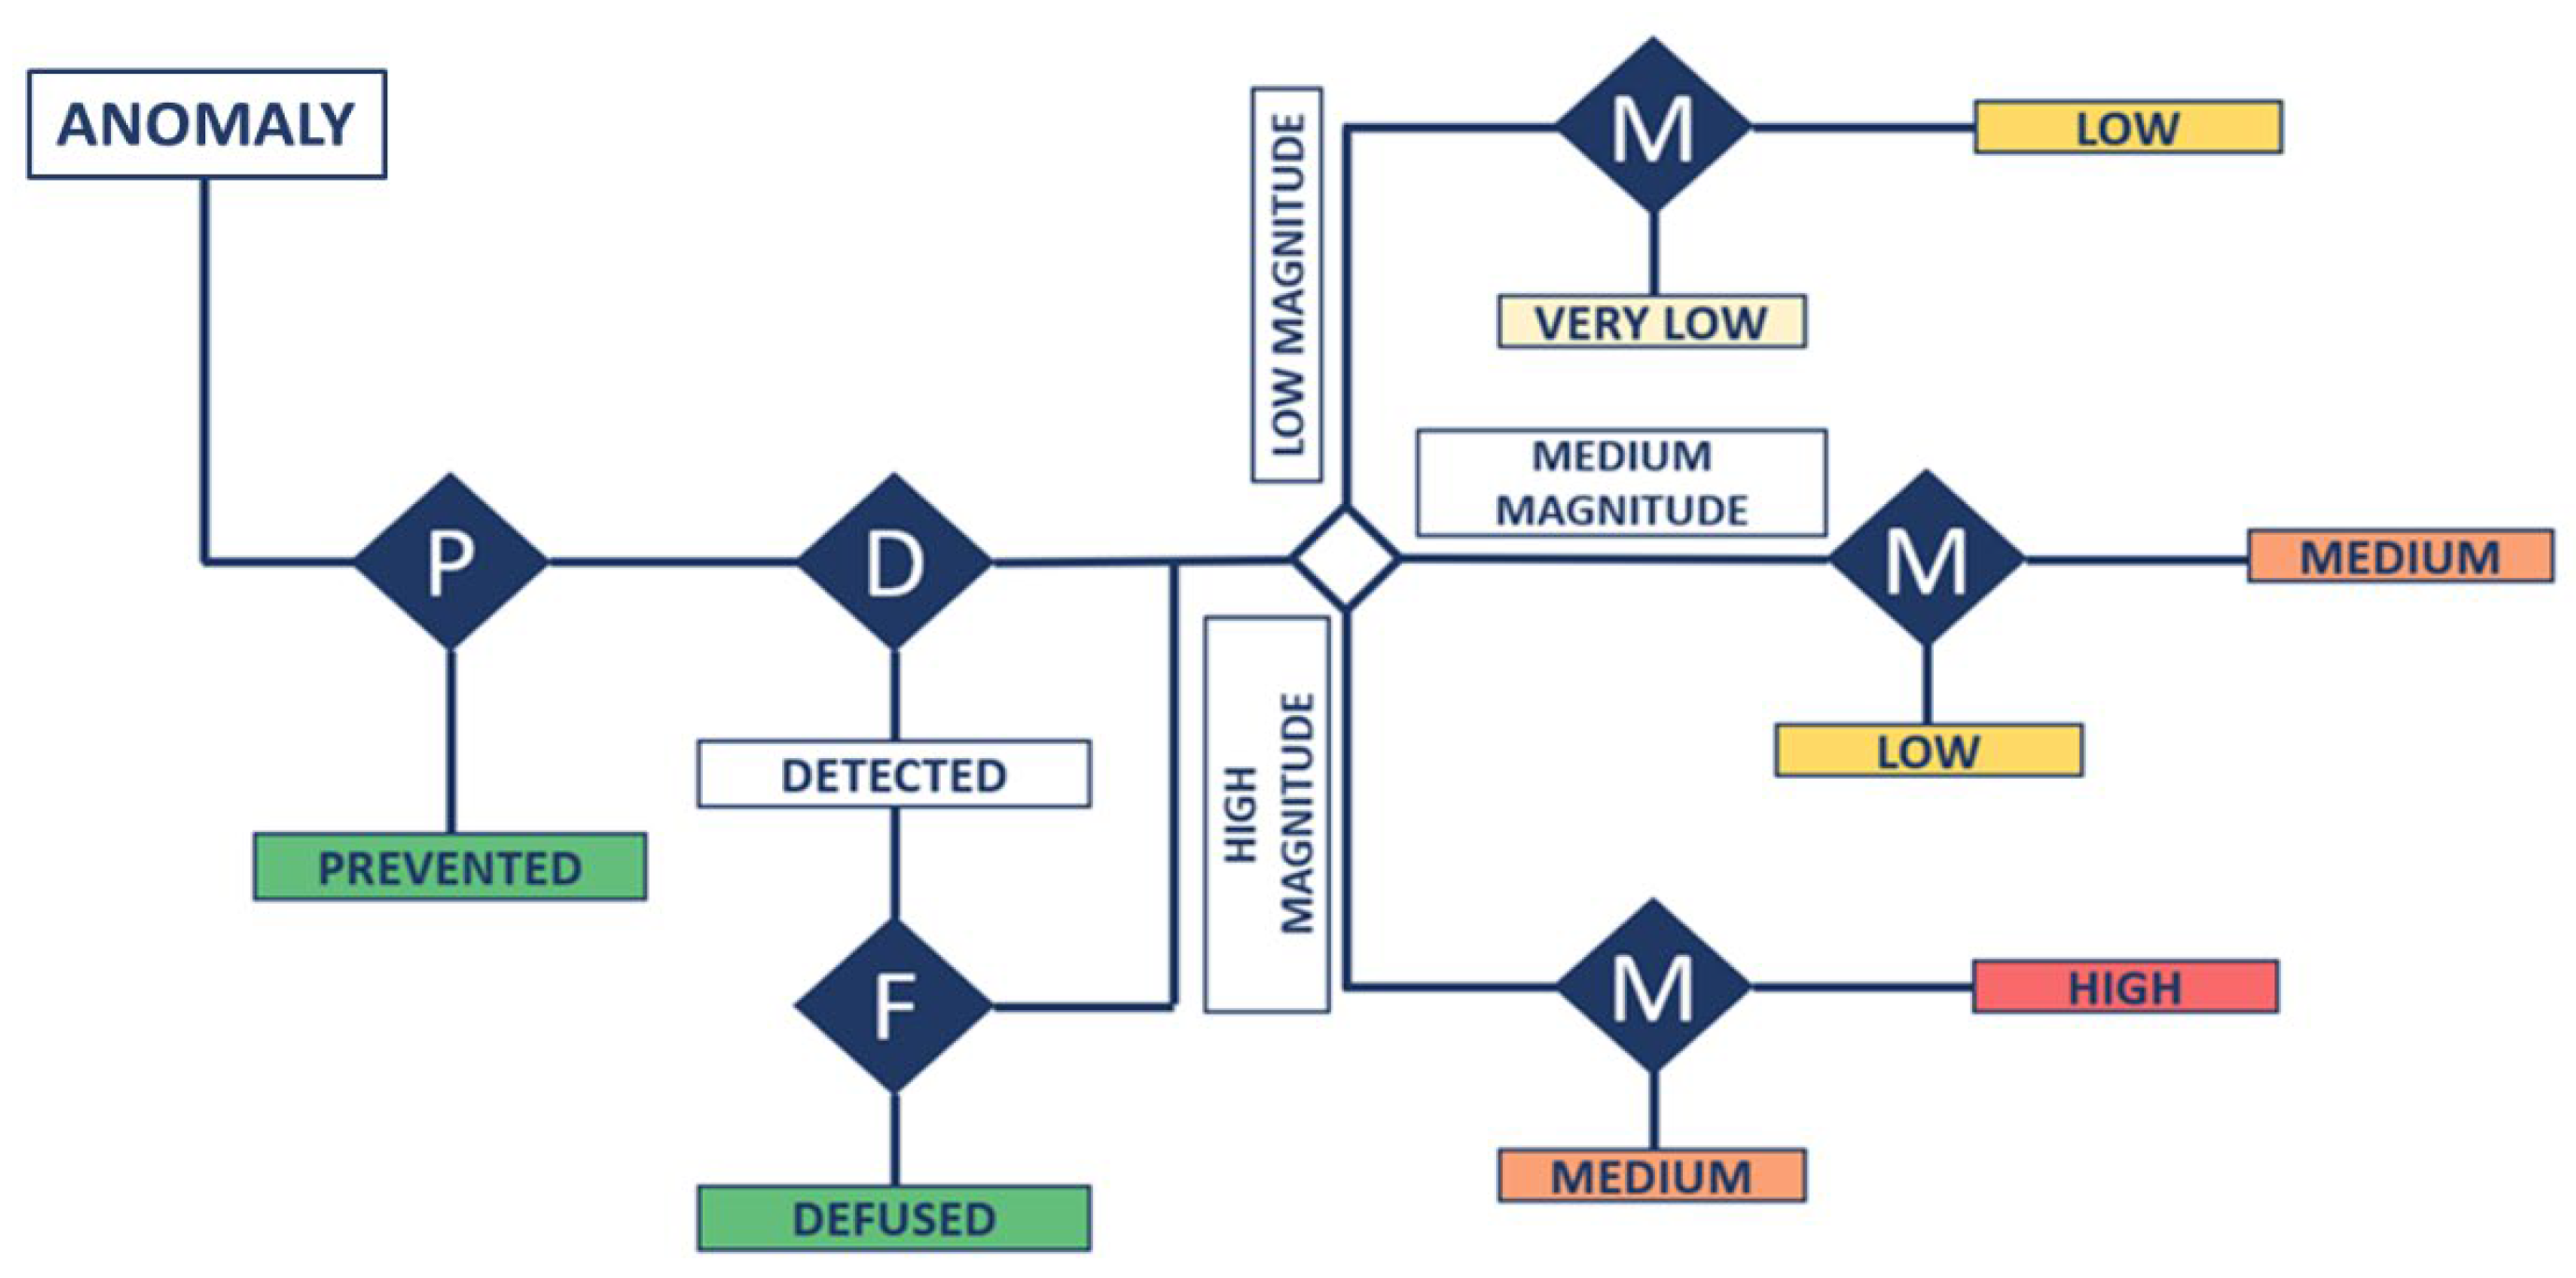
2.5. Scenario Simulation

Once an impact hits an element of the infrastructure, it is possible that the other elements linked to the targeted one in the model structure will also be affected and could even generate a consequent impact (Equation (4)):
I m p a c t S u b s c e n a r i o , S e c o n d a r y T a r g e t
This process is not instantaneous and needs to take into account the effect of potential countermeasures against the given impact. Since countermeasures may be directly applied to the element of the network, they can even block the propagation of the impact and reduce potential damage. The application of countermeasures can generate four distinct outcomes described below (Figure 4).
In order to estimate the outcomes, each countermeasure is defined by several parameters that express the efficiency of the countermeasure and the reduction of the likelihood and potential damages. These parameters are scored in terms of prevention, detection, defusion, and mitigation.
  • Prevented: within this outcome, the impact is prevented, and the propagation stops. In this case, no risk analysis is carried out, since the impact has no longer an effect on the target.
  • Defused: an impact is defused when the countermeasures are effective in not letting it generate any damage. The defusion efficiency score of a countermeasure can be modelled as an effect that stops the propagation of the threat and sets the risk of the outcome to zero.
  • Mitigated: in this situation, the impact happens but its effects are mitigated by the countermeasures applied. The mitigation efficiency score of a countermeasure can be modelled by a coefficient E M t o t s e c A i that reduces the probability of the occurrence of an outcome. The outcome probability in this case depends on the level of magnitude of the threat/impact.
    The probability of an outcome with low magnitude is:
    P S S 3 S i j k 1 = P S i j k 1 × E M t o t s e c A i
    The probability of an outcome with medium magnitude is:
    P S S 5 S i j k 2 = P S i j k 2 × E M t o t s e c A i
    The probability of an outcome with high magnitude is:
    P S S 7 S i j k 3 = P S i j k 3 × E M t o t s e c A i
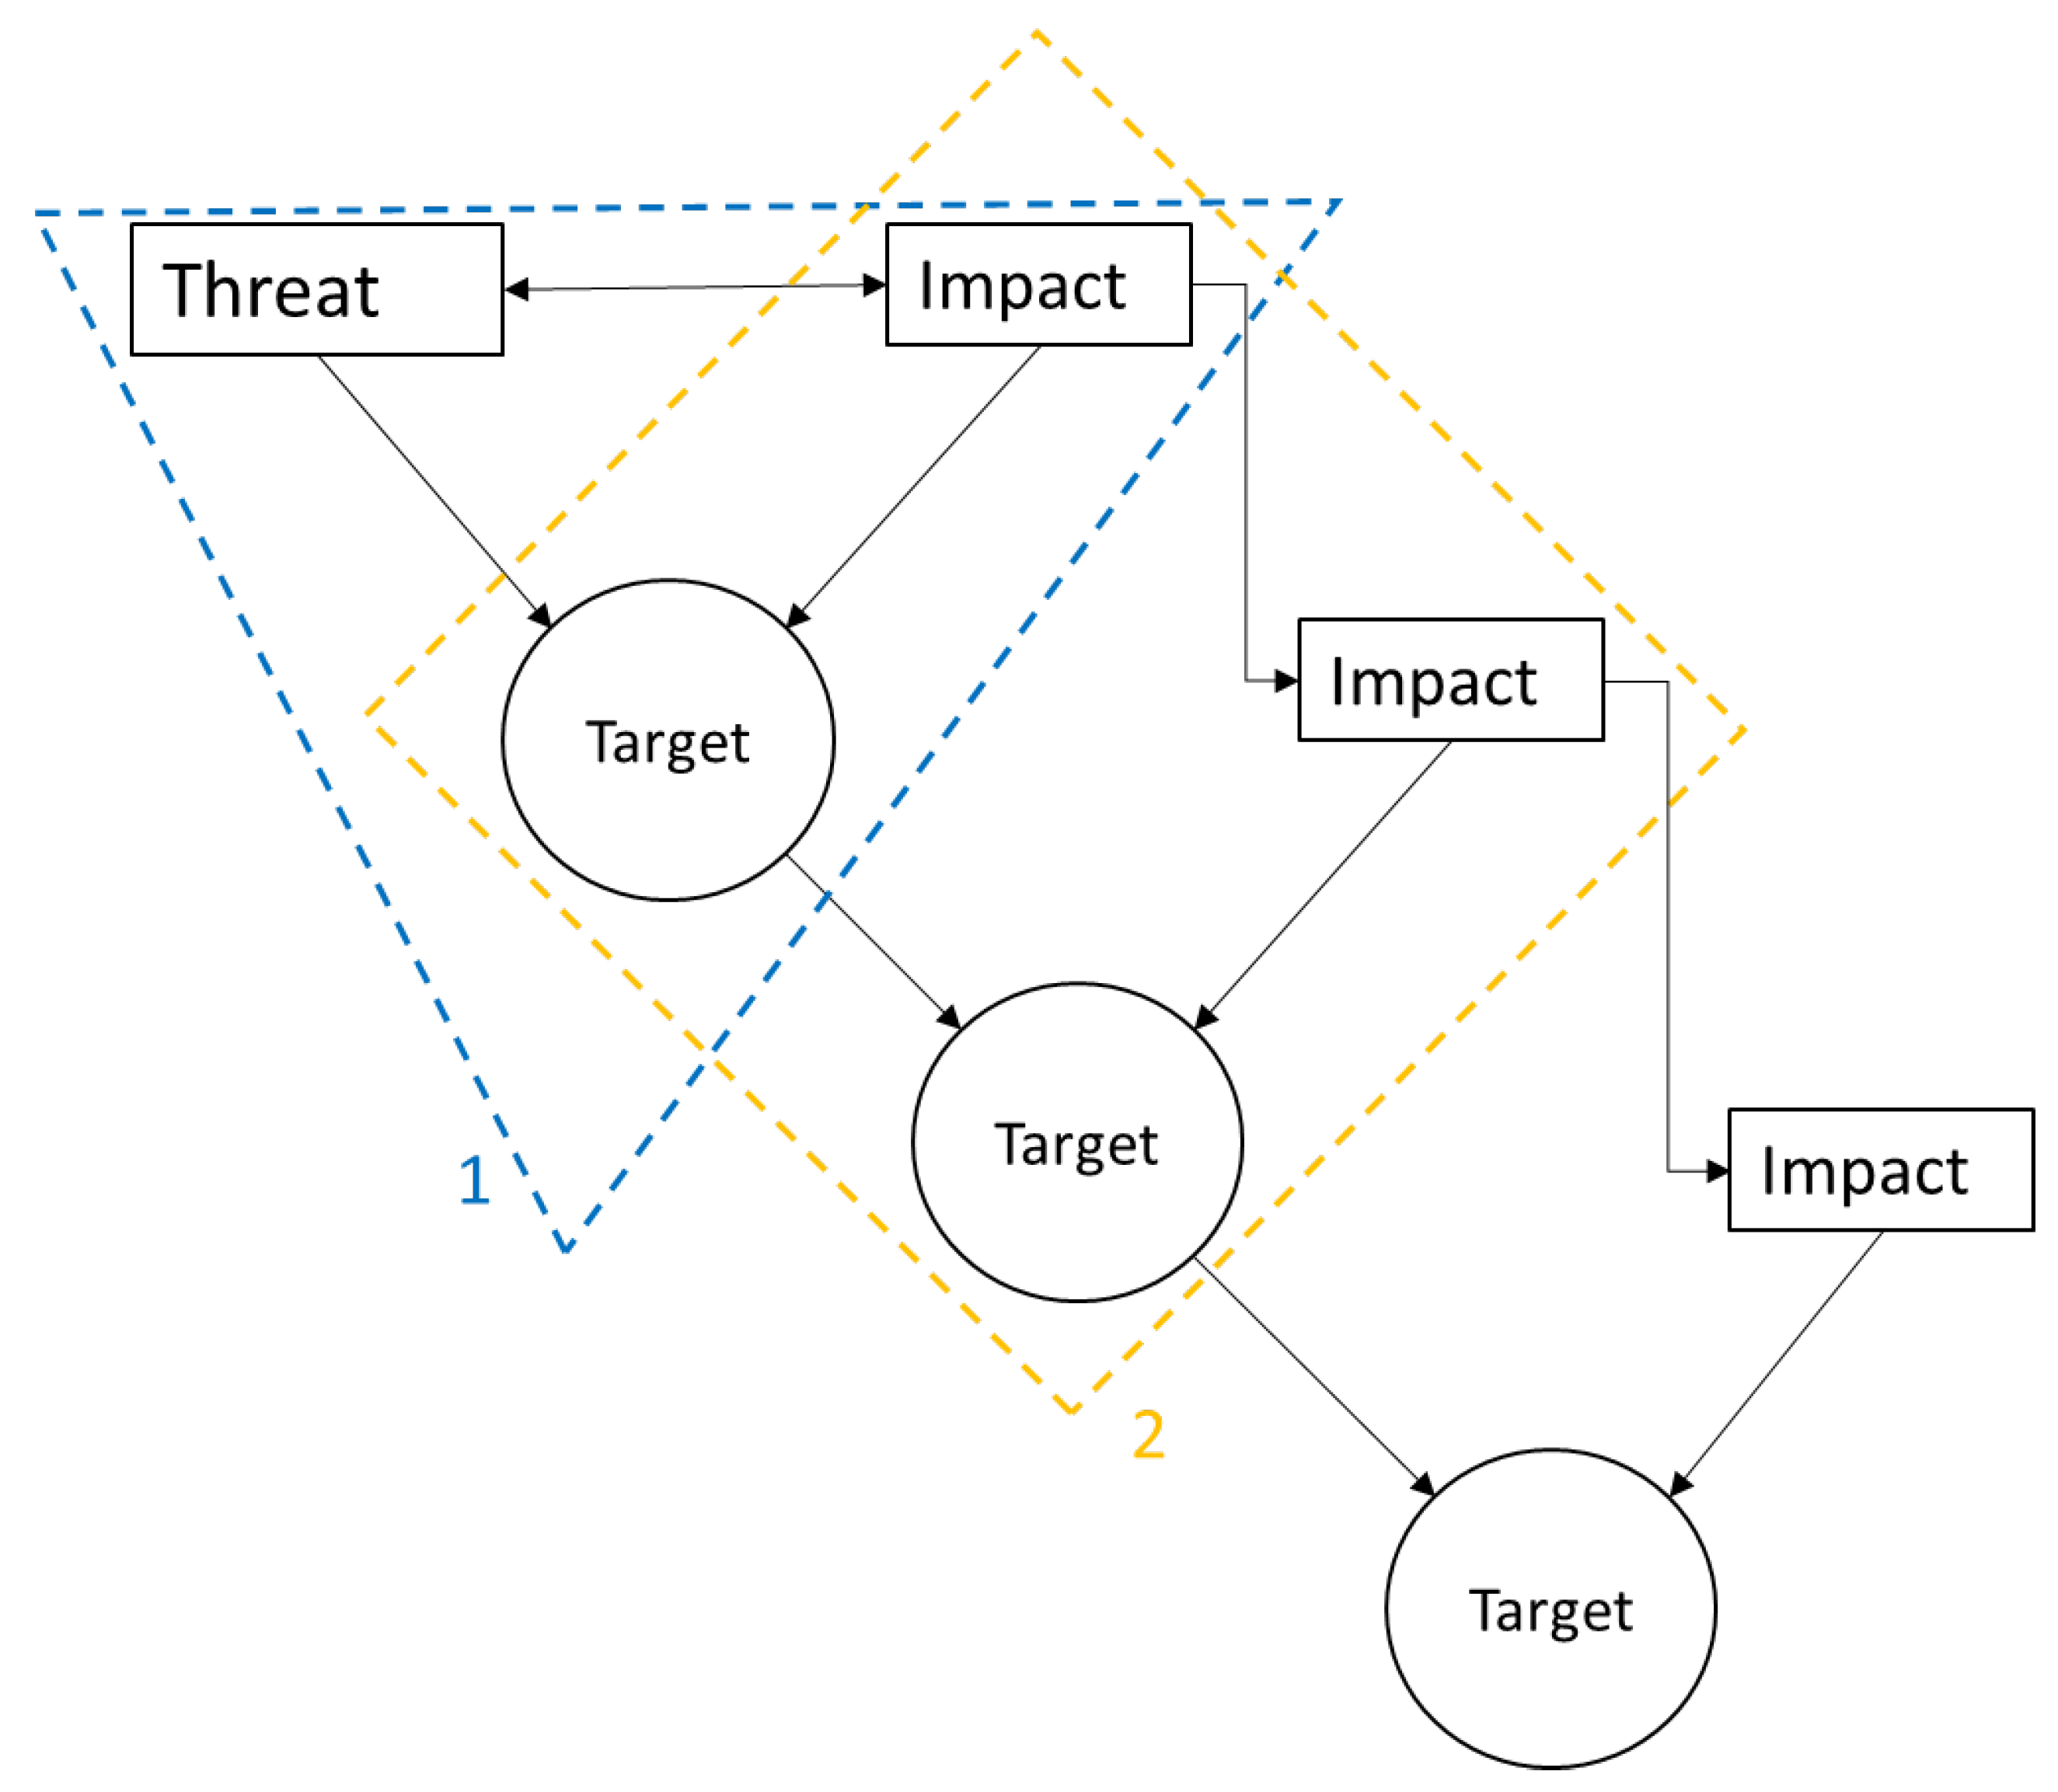
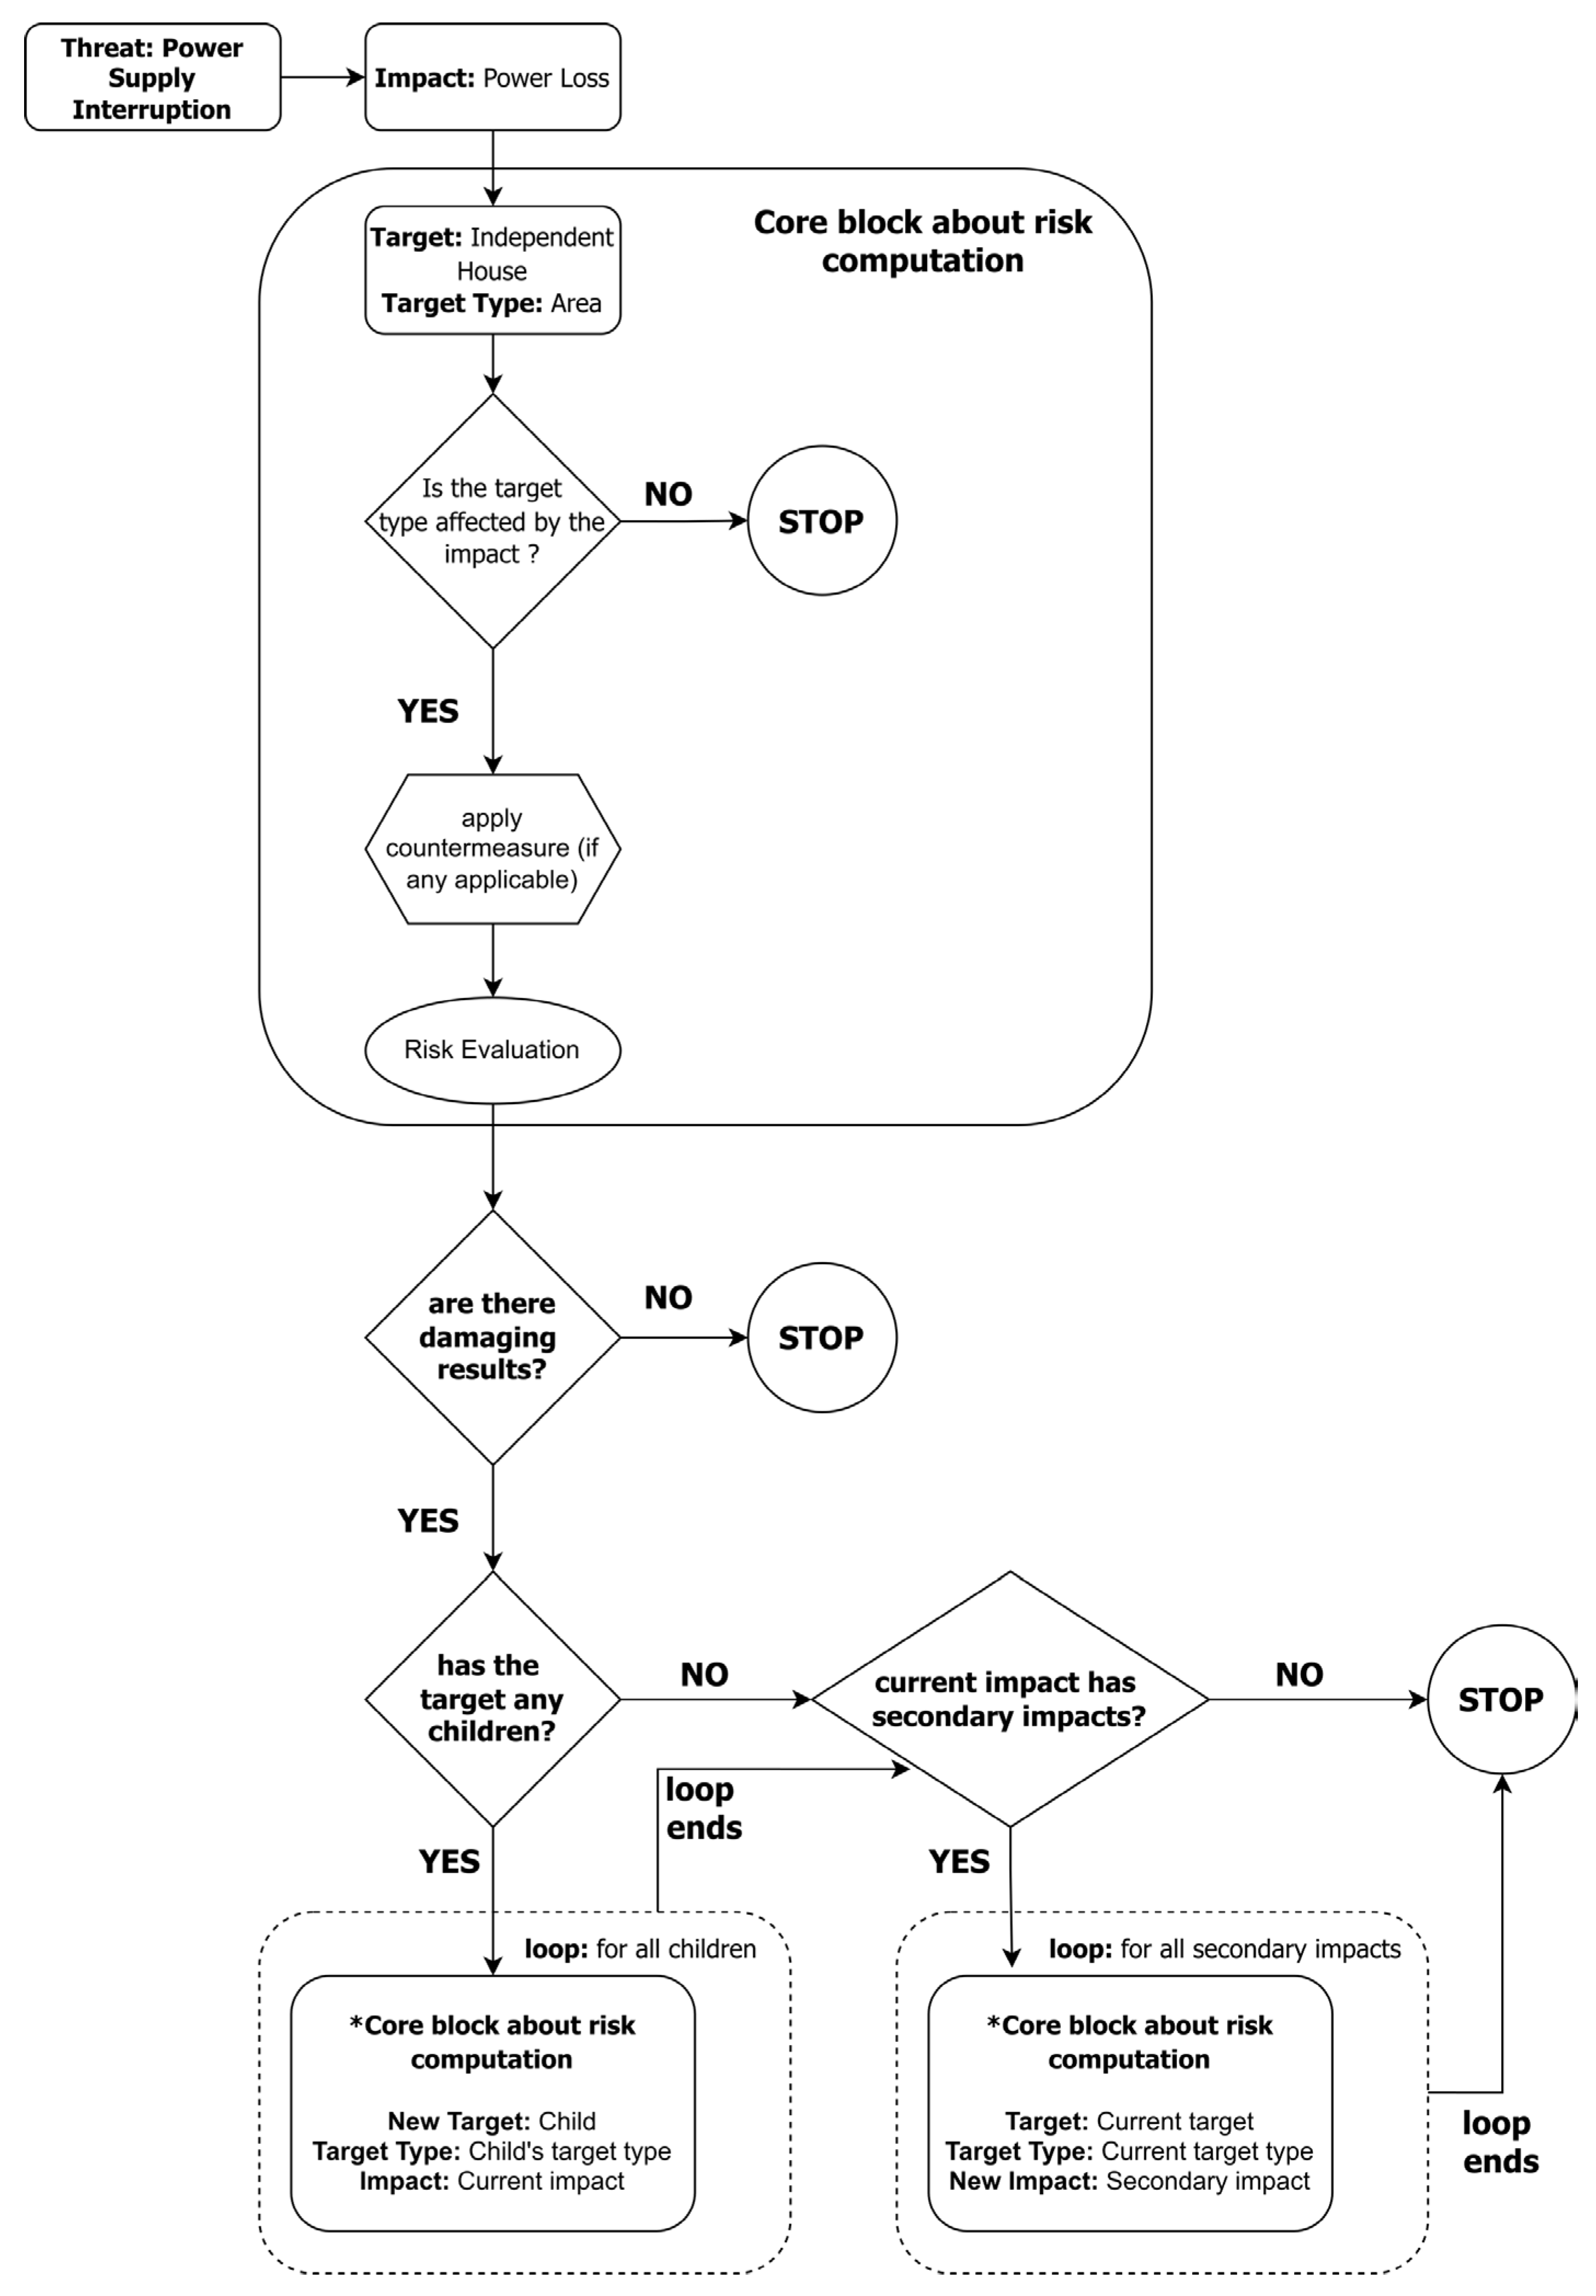
  • Not Mitigated: when an impact is not mitigated it means that the countermeasures applied have no effect or that there are no countermeasures applied to the targeted element. In this case, the efficiency score is not computed and the probability of this outcome equals that of the scenario itself. Since one of the main features is the cascade effect, the outcomes that are mitigated or not mitigated can propagate to the connected elements of the model infrastructure generating new impacts. In order to propagate the impact and generate consequent impacts, a specific mapping is required for the risk algorithm (Figure 5).
Figure 5. Mapping of the Impact Propagation.
Buildings 13 00428 g005
The mapping can be divided into two parts. In the first section (blue triangle area in Figure 5) the threat is mapped to a target, and both are mapped to an impact. This is due to the fact that only certain targets can be targeted by certain threats and, depending on the target and the threat, a specific impact is generated. The second section of the mapping (orange square area in Figure 5) links the original generated impact to the subsequent one and the new target to the initial one. Depending on the starting target and impact, new elements of the network can become new targets and they can even generate new and different impacts.
The flow chart in Figure 6 indicatively illustrates the steps that the risk algorithm performs within the use case of the threat “power supply interruption” occurring on the asset “independent house”. In particular:
  • For a threat onto a target, the algorithm checks if the corresponding impact affects the target type.
  • If yes, countermeasures (if available) are applied and the risk on the target is evaluated.
  • The algorithm checks if the target holds any children.
  • If yes, it verifies if the child’s target type is affected by the impact.
  • If yes, countermeasures (if available) are applied and the risk on the child target is evaluated.
  • Steps 4 and 5 are performed for all the target’s children.
  • Steps 1 to 6 imply that the graph structure of the asset is explored following a depth first search logic.
  • When any child is reached, the algorithm verifies if the current impact has any secondary impact that may affect the target type of the current child.
  • If yes, countermeasures (if available) for all secondary impacts are applied and the risk to the current child is evaluated.
Figure 6. Flow chart of the algorithm logic based on the Power loss threat.
Buildings 13 00428 g006

2.6. Countermeasures Application

Countermeasures that can prevent or mitigate the impact can generally be applied to any target [21]. A countermeasure can affect a given impact in the following ways:
  • Preventing the impact: The prevention rate of the countermeasure is the probability that the countermeasure prevents the impact.
  • Detecting the impact: The detection rate is the probability to detect the impact.
  • Defusing the impact: The defusion rate represents the probability to defuse the impact.
  • Mitigating the impact: The mitigation rate represents the probability to mitigate the impact.
The countermeasures influence the threat probability as a reduction coefficient. The corresponding assessment is based on:
  • The effect rates of the countermeasure in regard to its four properties, i.e., prevention rate, detection rate, defusion rate, and mitigation rate—both individually and as correlated effect rate.
  • Economic reference value for the asset operations: Single value, e.g., EUR 10,000 for the target (independent house) and its operations.
  • The percentage of damage in the asset resulting of each impact.
For a target with some potential countermeasures applied and a threat occurring on this target, the risk algorithm checks if any of the countermeasures installed is effective against the threat impact. If so, it computes the “effect rate” of the countermeasure on that impact with respect to all four countermeasure properties. Finally, it re-evaluates the risk of the current threat onto the target by taking into account the countermeasure efficiency of each property.

2.7. Cost Calculation

The cost computation is conducted simultaneously with the likelihood estimation. For every generated outcome, the tool calculates the:
  • Percentage of physical damage of the target;
  • Average hours of service interruption;
  • Expected economic losses due to physical damage;
  • Expected economic losses due to interruption of service.
Further, the cost estimation strongly depends on the type of threat, target, impact, and magnitude. The cost calculation provides an estimation of total economic losses, as shown in Equation (8):
E L t o t = E L p h y s i c a l D a m a g e + E L I S t o t ,
where E L p h y s i c a l D a m a g e denotes the economic losses due to physical damages and E L I S t o t the economic losses due to the interruption of service.

2.7.1. Physical Damage Computation

The physical damages are estimated as a percentage and represent the extent that the integrity and functionality of an element has been affected. In order to calculate the economic losses, the physical damage function needs to be computed, which strongly depends on the type of anomaly and the level of its magnitude. There are two types of physical damage functions, based on the type of outcome, mitigated (Equation (9)) and not mitigated (Equation (10)).
P D m i t i g a t e d T H k , M z
P D n o t M i t i g a t e d T H k , M z
Finally, the equation used to estimate the economic losses related to physical damage is:
E L p h y s i c a l D a m a g e s = P D T H k , M k × E V A i A i
where E V A i A i represents the economic value of the target and possibly of the assets contained in it, with P D T H k , M k being either P D m i t i g a t e d T H k , M z or P D n o t M i t i g a t e d T H k , M z .

2.7.2. Service Interruption Estimation

Another important aspect of the economic losses is the estimation of the out-of-service time. In the context of this estimation, the value of the building element under consideration as well as the maintenance cost for functionality restoration are essential components. These parameters have been considered since the time required to repair an asset is proportional to its cost and the choice whether to replace or fix an asset is strongly related to the corresponding costs.

2.7.3. Risk Computation

Following the previous steps, the overall risk score is computed, which is calculated for each possible scenario outcome. The formula used to estimate the risk score is:
R i s k = L i k e l i h o o d × E x p e c t e d   d a m a g e s
Accordingly, the equation in the risk modules becomes:
R i s k L e v e l i = P S S i ×   E L t o t
The risk score is expressed in monetary terms (EUR/year), since the likelihood is expressed in the number of expected events per year and the expected damages in euros. The risk score of a scenario considers the threat set as the trigger of the scenario (e.g., over-consumption) as well as all the consequent impacts caused by the initial threats.

3. Case Study

In this section, the algorithm application in a typical building configuration is described. The functionalities of the algorithm are implemented in the backend of the risk tool. The backend can be logically subdivided into two parts, one responsible for the risk computation and the other for the management of all specific elements related to the residential buildings. The risk backend is responsible for modeling and keeping track of the relation between threats and the possible mitigation measures. This part of the backend models the countermeasures, threats, targets, and services as well as other fundamental elements for risk computation [24,25]. The lists of threats, along with their frequency, magnitude (severity) and countermeasures installed have been collected based on relevant literature and from feedback coming from the TwinERGY project partners. The building backend is responsible for managing all specific aspects of the residential environment, i.e., all elements of the infrastructure, such as sections, areas and assets.

3.1. Topology Structure and Configuration

Figure 7 illustrates the main entities (asset, area and devices) of the assets’ tree model structure inside the risk algorithm. The correlation among the entities creates the structure hierarchy. Further, the presented structure is highly scalable. In the context of the TwinERGY project, and as proof of concept, an ad-hoc model has been developed that describes the graph structure of a single asset of the type “independent house”. Figure 8 summarizes the topology of the building assets. The following references are utilized.
  • Parent—Higher level entities
  • Child—Entity related to parent entity.
Figure 7. Topological Entities of Independent House.
Buildings 13 00428 g007
Figure 8. Topology of Independent House.
Buildings 13 00428 g008
In this context, the parent–child relation signifies that a parent node can influence the child node. Thus, the structure of the independent house is as follows:
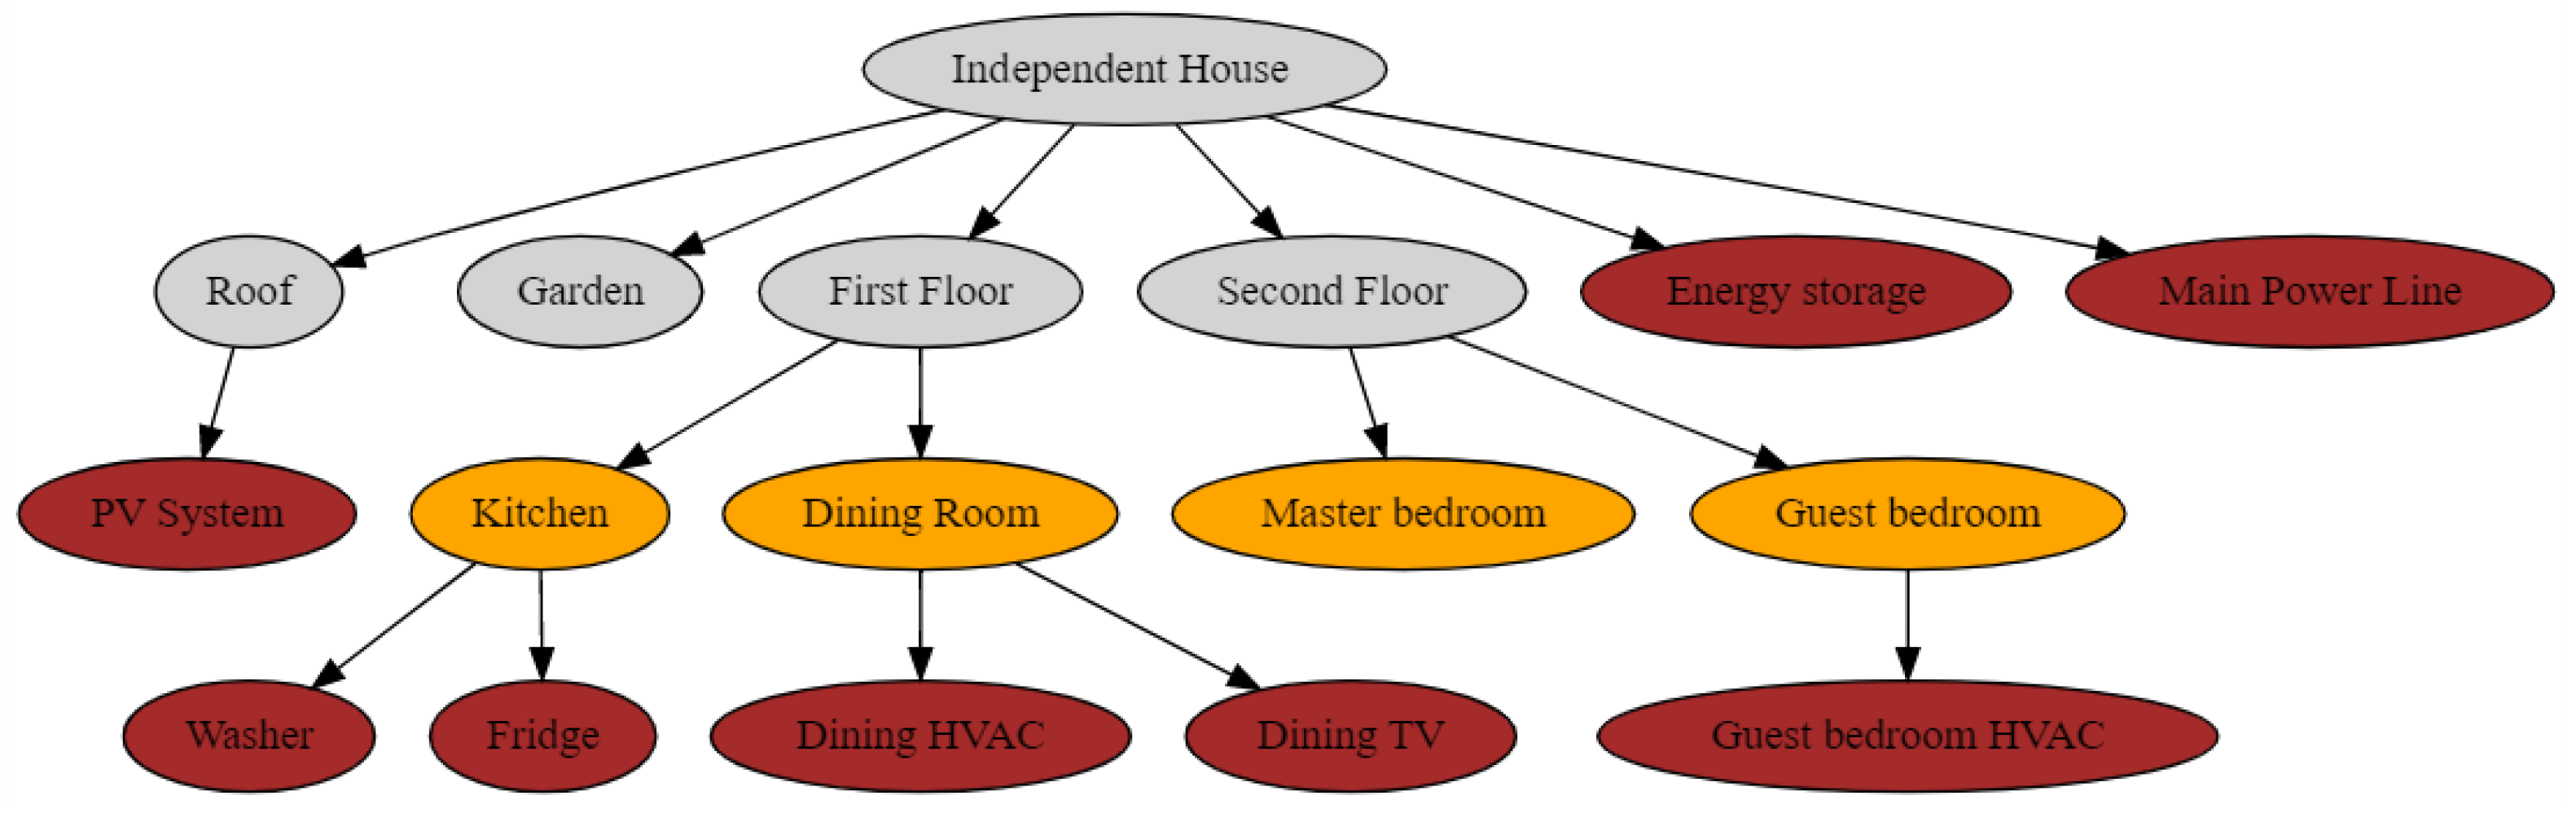
  • The root node is an asset named “independent house” which has six children:
    Roof, whose target type is “Area”.
    Garden, whose target type is “Area”.
    First Floor, whose target type is “Area”.
    Second Floor, whose target type is “Area”.
    Energy Storage, whose target type is “ Photovoltaic System “.
    Main Power Line, whose target type is “Device”.
  • The first floor has, in turn, two children:
    Kitchen, whose target type is “Sub-Area”.
    Dining Room, whose target type is “Sub-Area”.
  • The second floor has also two children:
    Master bedroom, whose target type is “Sub-Area”.
    Guest bedroom, whose target type is “Sub-Area”.
  • The roof has one child:
    PV System, whose target type is “Photovoltaic System”.
  • The kitchen has two children which represent two appliances:
    Washer, whose target type is “Electronic Device”.
    Fridge, whose target type is “Electronic Device”.
  • The dining room has also two children:
    Dining HVAC, whose target type is “Electronic Device”.
    Dining TV, whose target type is “ Electronic Device”.
  • Finally, the guest bedroom has a single child:
    Guest Bedroom HVAC, whose target type is “Electronic Device”.
The target type defines the threat impacts that a target can undergo. For example, a target of type “electronic device” may suffer from a permanent failure or temporary malfunction. Both are called impacts of the specific threat that may occur on the target, e.g., the threat “device obsolescence”. Threats and their impacts are discussed in the following sections of the experimental results along with their interpretation and the experimental conclusions that can be drawn.

3.2. Threats and Impacts

In order to correctly configure the risk application, two basic concepts need to be further explained.
  • Threat: An action or event that may cause danger, damage or any other unexpected behavior. Any threat has at least one impact.
  • Impact: The effects and consequences of a threat on a given target type.
For example:
  • For the target type “electronic device”, the threat “device obsolescence” may give rise to the impact “temporary malfunction”.
  • For the target type “photovoltaic system”, the threat “PV system malfunction may produce the impact “low production”.
In the context of the TwinERGY project, threats and impacts have been determined based on feedback collected from the risk template shared by the partners. Table 1 presents the data collected through the project pilot implementation and the threat probability obtained. The probability has been computed based on the frequency of the number of occurrences of each threat per year.

3.3. Risk Computation

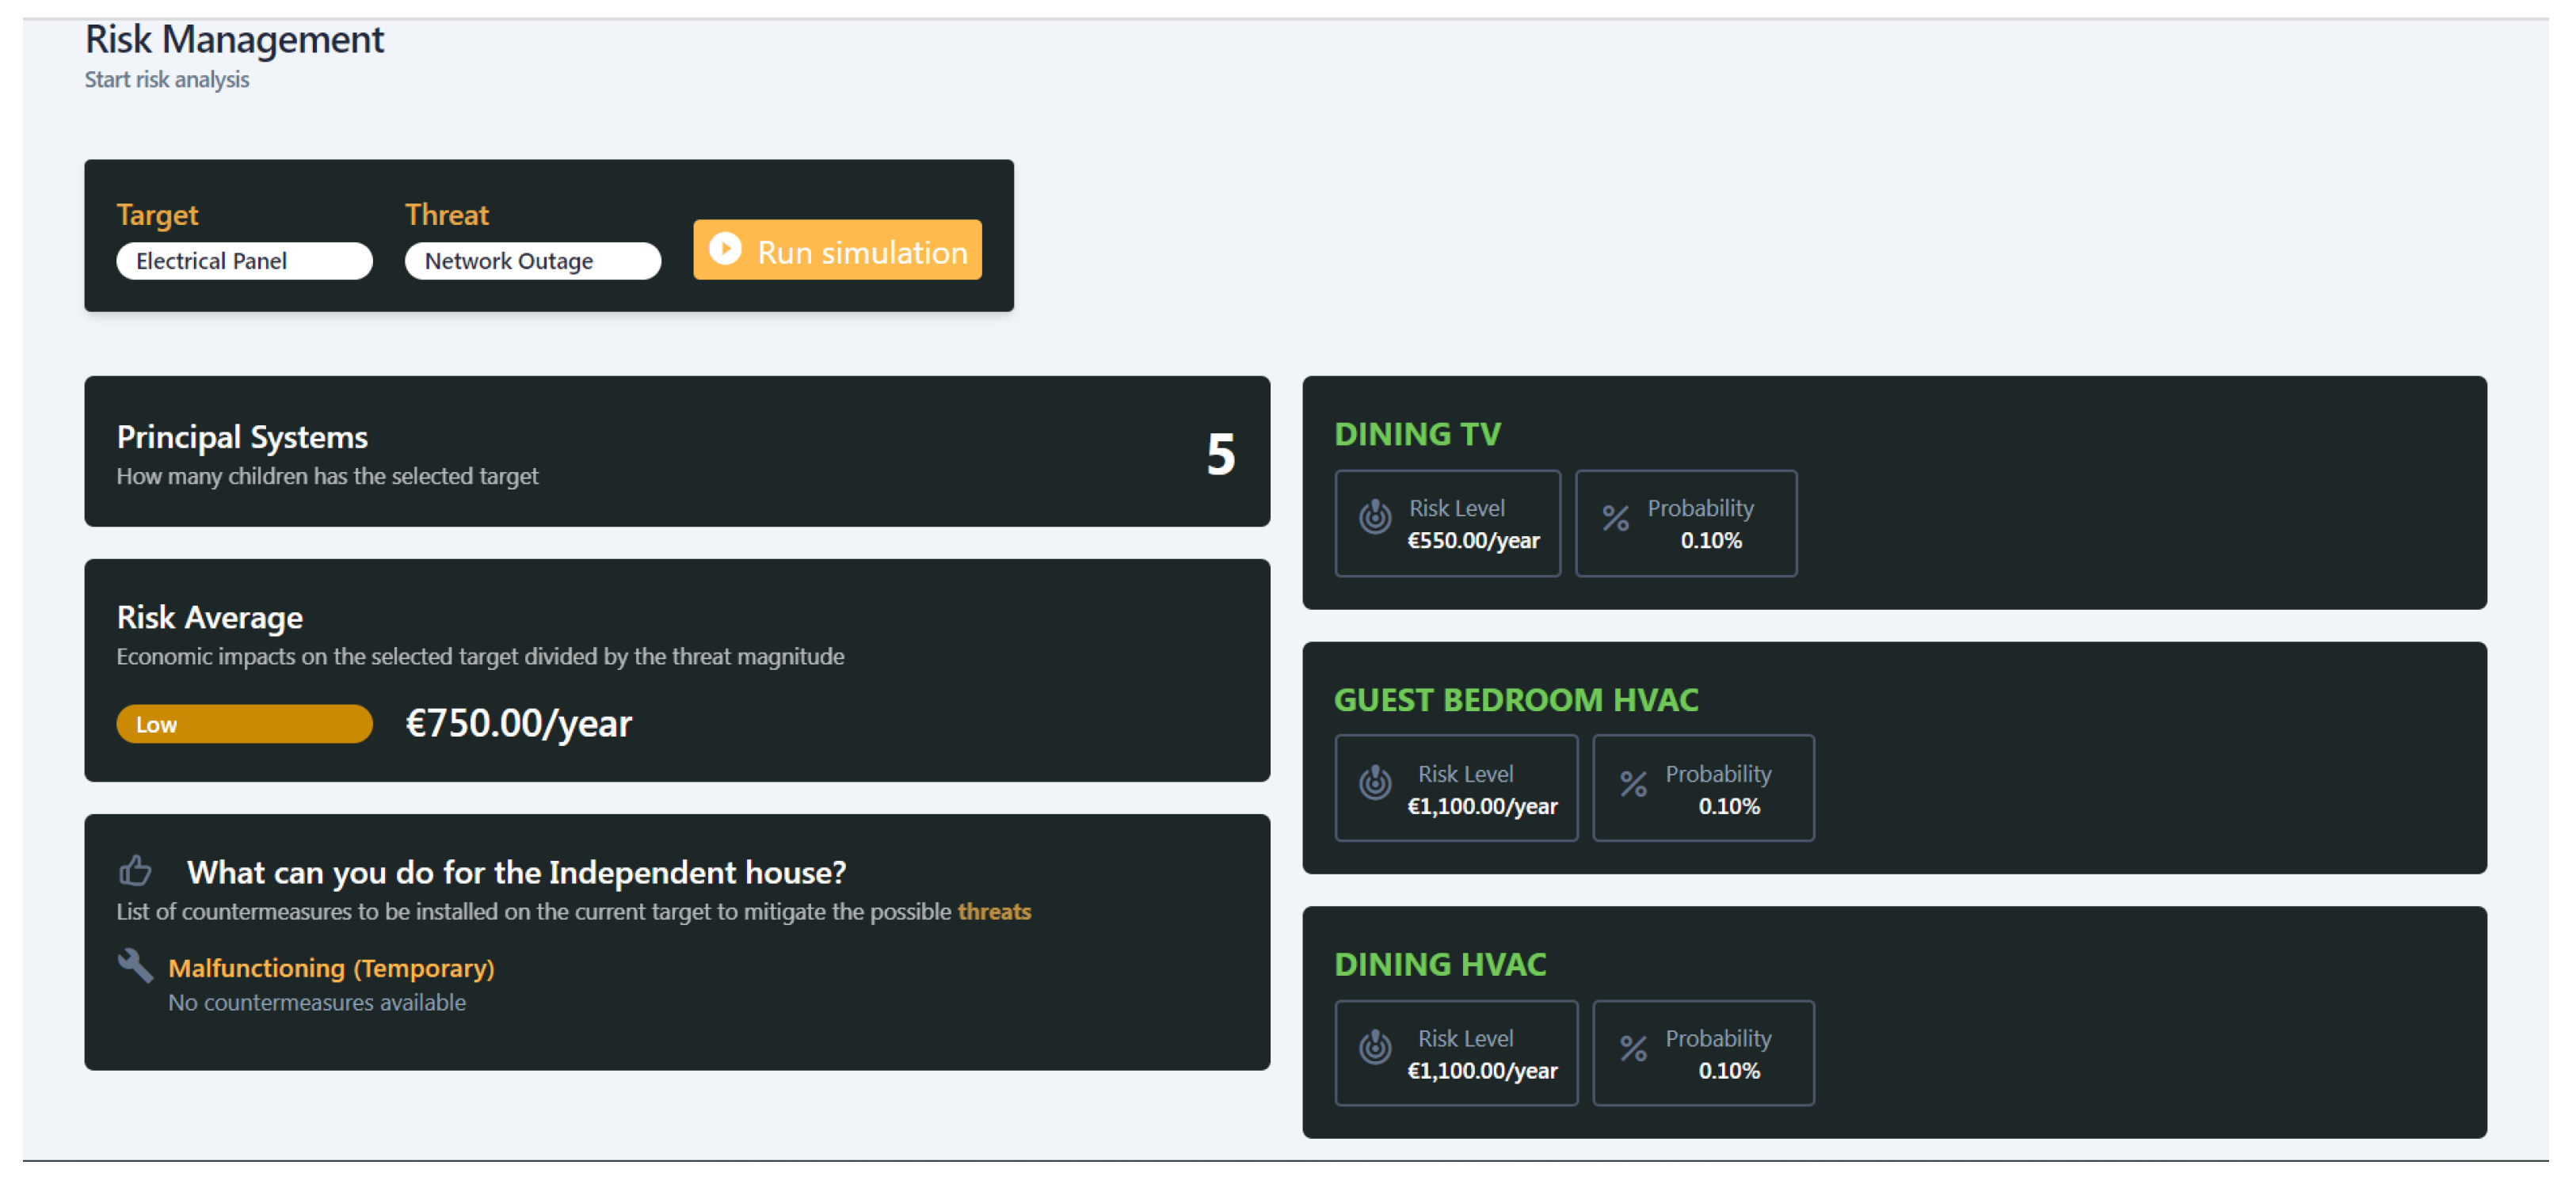
3.3.1. User Interface

The risk application is integrated as a microservice in the graphical user interface of the TwinERGY Platform, which is part of the same project. From there, the users can select a specific threat, using a list of preconfigured ones, and the target intended as the system involved in the building. After inserting this information, the risk analysis is performed. The results of the analysis are provided through a dashboard, as shown in Figure 9, and presented in an aggregated way in order to be easily understandable by the user. The values that are reported in this page are:
On the left:
  • The number of cascade appliances involved in the threat;
  • The risk value (or cost)in EUR/year;
  • The countermeasure installed against the threat;
On the right:
  • The detailed card of the devices involved;
  • The probability (likelihood) value corresponding to the diverse threats;
  • The device scenario presented with its corresponding impacts in euros;
  • An indication of the most common action to avoid the specific threat;
Figure 9. Scenario selection Risk GUI.
Buildings 13 00428 g009

3.3.2. Results

To assess the approach to risk computation, the following three use cases are considered, based on the “independent house” model described before.
  • Use Case 1: Threat “PV system fault” on the target type “photovoltaic system”. The impact of this threat on the target type is “low production”. The input of the relevant information in the corresponding fields of the application returns as results:
    The risk average is low.
    There is only one target of type “photovoltaic system” in the “independent building” model. Furthermore, the impact “low production” may have secondary impacts related to it, namely “power supply interruption” and “discomfort”. These secondary impacts are taken into account in the risk computation.
  • Use Case 2: Threat “device obsolescence” on the target “dining room HVAC”; this target has type “electronic device”. The input of the relevant information in the corresponding fields of the application returns as results:
    The risk average is low.
    The impact of this threat on the target type “electronic device” is “temporary malfunction”. The impact “temporary malfunction” may have a “discomfort” impact as a secondary impact.
  • Use Case 3: Threat “power loss” on the root target “independent house”; whereas the threat “power supply interruption” has impact “power loss”. The input of the relevant information in the corresponding fields of the application returns as results:
    The target has six principal systems as children;
    A breakdown of risk level/probability/related threats per child;
    The risk average is low;
    A list of potential countermeasures that can be deployed.
Since the root target has several children, the impact “power loss” propagates to any other area in the model, like kitchen, dining room and the bedrooms. Moreover, the impact “power loss” has a secondary “temporary malfunction” impact on any target type “area electronic device” that affects all appliances in the model, e.g., dining HVAC, fridge, washer, etc.
In all three Use Cases, economic impacts can be estimated in EUR/year. However, in order to compute reliable quantitative estimates, more precise parameters regarding countermeasure efficiency, threats-related coefficients, and building graph structure weights should be assessed by a domain expert and used in the algorithm. The information gained from the presented risk management application is envisaged to be utilized as a decision support tool that will facilitate maintenance planning and repair scheduling while minimizing costs and maximizing efficiency in the context of a decision support framework similar to those deployed in electric power distribution systems [26,27].

4. Conclusions

The present paper describes the functional aspects of the risk management application developed in the context of the TwinERGY project. The logics of the algorithm underlying the risk analysis engine is presented in order to make the risk assessment process transparent to all stakeholders involved. Furthermore, the interface and commands of the web application are explained in order to provide an overview of how the end users (i.e., the tenants or the building manager) can utilize the tool and what types of results can be obtained.
In conclusion, the emerging paradigms in energy production and consumption highlight the need for comprehensive risk assessment and management frameworks to assist stakeholders’ decision-making processes. These frameworks require robust and reliable applications that provide accurate, detailed, and accessible information. The scope, structure and flexibility of the underlying risk assessment algorithms are key factors in such applications. In this context, the present paper presented the results of research of a risk management application, highlighting the logic and functionalities that underpin the multi asset risk assessment algorithm implemented. This application constitutes an essential element of holistic approaches (such the TwinERGY project) to new energy production and consumption paradigms.
Future research directions include the system enhancement in updating data in a dynamic way by multiple actors such as users, maintenance technicians, and monitoring systems. Other research avenues lead to the exploration of synergies between the proposed methods and the ongoing development of AI models for predicting renewable energy generation [28] and of big data analytics [7] in the context of smart grids. Moreover, the possibilities and potential benefits of integrating the proposed methods in the context of home energy management frameworks, such as virtual power plants can be further explored.

Author Contributions

Conceptualization, D.O., A.F., D.R., M.B., S.K. and A.C.; methodology, D.O., A.F. and S.K.; software, D.O., A.F., D.R. and M.B.; validation, D.O., A.F., S.K. and A.P.; formal analysis, D.O., A.F., D.R. and M.B.; writing—original draft preparation, D.O, S.K. and A.C.; writing—review and editing, D.O., S.K., A.C. and A.P.; visualization, D.O., A.F., D.R. and M.B.; supervision, S.K.; funding acquisition, A.C. All authors have read and agreed to the published version of the manuscript.

Funding

This research was funded by the European Union’s Horizon 2020 Research and Innovation Program, under the project entitled “Intelligent Interconnection of Prosumers in PEC with Twins of Things for Digital Energy Markets-TwinERGY”, grant number 957736, H2020-LC-SC3-2020-EC-ES-SCCRIA.

Data Availability Statement

Not applicable.

Conflicts of Interest

The authors declare no conflict of interest.

References

  1. Aliero, M.S.; Qureshi, K.N.; Pasha, M.F.; Jeon, G. Smart Home Energy Management Systems in Internet of Things Networks for Green Cities Demands and Services. Environ. Technol. Innov. 2021, 22, 101443. [Google Scholar] [CrossRef]
  2. Sissine, F. Energy Independence and Security Act of 2007: A Summary of Major Provisions; Congressional Research Service: Washington, DC, USA, 2007. [Google Scholar]
  3. Tuballa, M.L.; Abundo, M.L. A Review of the Development of Smart Grid Technologies. Renew. Sustain. Energy Rev. 2016, 59, 710–725. [Google Scholar] [CrossRef]
  4. Judge, M.A.; Khan, A.; Manzoor, A.; Khattak, H.A. Overview of Smart Grid Implementation: Frameworks, Impact, Performance and Challenges. J. Energy Storage 2022, 49, 104056. [Google Scholar] [CrossRef]
  5. Karatzas, S.; Chondrogianni, D.; Stephanedes, Y. A Process-Centric Approach for System-of-Systems Integration in Smart Cities; Regional Studies Association: East Sussex, UK, 2018. [Google Scholar]
  6. Karatzas, S.; Chassiakos, A. System-Theoretic Process Analysis (STPA) for Hazard Analysis in Complex Systems: The Case of “Demand-Side Management in a Smart Grid”. Systems 2020, 8, 33. [Google Scholar] [CrossRef]
  7. Ponnusamy, V.K.; Kasinathan, P.; Madurai Elavarasan, R.; Ramanathan, V.; Anandan, R.K.; Subramaniam, U.; Ghosh, A.; Hossain, E. A Comprehensive Review on Sustainable Aspects of Big Data Analytics for the Smart Grid. Sustainability 2021, 13, 13322. [Google Scholar] [CrossRef]
  8. Padmanathan, K.; Govindarajan, U.; Ramachandaramurthy, V.K.; Rajagopalan, A.; Pachaivannan, N.; Sowmmiya, U.; Padmanaban, S.; Holm-Nielsen, J.B.; Xavier, S.; Periasamy, S.K. A Sociocultural Study on Solar Photovoltaic Energy System in India: Stratification and Policy Implication. J. Clean. Prod. 2019, 216, 461–481. [Google Scholar] [CrossRef]
  9. Vinoth Kumar, P.; Gunapriya, B.; Sivaranjani, S.; Gomathi, P.S.; Rajesh, T.; Sujitha, S.; Deebanchakkarawarthi, G. Smart Home Technologies Toward SMART (Specific, Measurable, Achievable, Realistic, and Timely) Outlook. In Mobile Computing and Sustainable Informatics; Shakya, S., Ntalianis, K., Kamel, K.A., Eds.; Springer Nature: Singapore, 2022; pp. 711–727. [Google Scholar]
  10. Spiliotis, E.; Legaki, N.Z.; Assimakopoulos, V.; Doukas, H.; El Moursi, M.S. Tracking the Performance of Photovoltaic Systems: A Tool for Minimising the Risk of Malfunctions and Deterioration. IET Renew. Power Gener. 2018, 12, 815–822. [Google Scholar] [CrossRef]
  11. Park, C.; Kim, Y.; Jeong, M. Influencing Factors on Risk Perception of IoT-Based Home Energy Management Services. Telemat. Inform. 2018, 35, 2355–2365. [Google Scholar] [CrossRef]
  12. Sand, K.; Wangensteen, I.; Nordgard, D. Risk Assessment Methods Applied to Electricity Distribution System Asset Management; Guedes Soares, C., Briš, R., Martorell, S., Eds.; CRC Press: Boca Raton, FL, USA, 2009. [Google Scholar]
  13. Nordgård, D.; Kjell, N.; Gjerde, O.; Maria, D.; Catrinu, J.; Lassila, J.; Partanen, J.; Bonnoit, S.; Aupied, J. A Risk Based Approach to Distribution System Asset Management and a Survey of Perceived Risk Exposure among Distribution Companies. In Proceedings of the 19th International Conference on Electricity Distribution, Vienna, Austria, 21–24 May 2007. [Google Scholar]
  14. Brown, R. Electric Power Distribution Reliability, 2nd ed.; Marcel Dekker, Inc.: New York, NY, USA, 2017; p. 484. ISBN 978-1-315-22233-2. [Google Scholar]
  15. Zhu, J.; Lin, Y.; Lei, W.; Liu, Y.; Tao, M. Optimal Household Appliances Scheduling of Multiple Smart Homes Using an Improved Cooperative Algorithm. Energy 2019, 171, 944–955. [Google Scholar] [CrossRef]
  16. Mansour-lakouraj, M.; Shahabi, M. Comprehensive Analysis of Risk-Based Energy Management for Dependent Micro-Grid under Normal and Emergency Operations. Energy 2019, 171, 928–943. [Google Scholar] [CrossRef]
  17. Benefits and Risks of Smart Home Technologies. Available online: https://www.sciencedirect.com/science/article/pii/S030142151630711X?via%3Dihub (accessed on 13 December 2022).
  18. El-Azab, R. Smart Homes: Potentials and Challenges. Clean Energy 2021, 5, 302–315. [Google Scholar] [CrossRef]
  19. Asplund, M.; Nadjm-Tehrani, S. Attitudes and Perceptions of IoT Security in Critical Societal Services. IEEE Access 2016, 4, 2130–2138. [Google Scholar] [CrossRef]
  20. Park, C.-K.; Kim, H.-J.; Kim, Y.-S. A Study of Factors Enhancing Smart Grid Consumer Engagement. Energy Policy 2014, 72, 211–218. [Google Scholar] [CrossRef]
  21. Hollnagel, E.; Woods, D.; Leveson, N. Resilience Engineering: Concepts and Precepts; Ashgate: Aldershot, UK, 2006. [Google Scholar]
  22. Robinson, I.; Webber, J.; Eifrem, E. Graph Databases, 2nd ed.; O’Reilly Media, Inc.: Sebastopol, CA, USA, 2015; Available online: https://www.oreilly.com/library/view/graph-databases-2nd/9781491930885 (accessed on 13 December 2022).
  23. Rausand, M. Risk Assessment: Theory, Methods, and Applications; John Wiley & Sons, Inc.: Hoboken, NJ, USA, 2011. [Google Scholar] [CrossRef]
  24. Simsion, G.C. Data Modeling Essentials: Analysis, Design, and Innovation; International Thomson Computer Press: Stamford, CT, USA, 1994; ISBN 978-1-85032-877-3. [Google Scholar]
  25. Merson, P.F. Data Model as an Architectural View; Carnegie Mellon University: Pittsburgh, PA, USA, 2009. [Google Scholar]
  26. Barriquello, C.; Garcia, V.; Schmitz, M.; Bernardon, D.; Fonini, J. A Decision Support System for Planning and Operation of Maintenance and Customer Services in Electric Power Distribution Systems; IntechOpen: London, UK, 2017; ISBN 978-953-51-3705-4. [Google Scholar]
  27. Shendryk, S.; Shendryk, V.; Parfenenko, Y.; Drozdenko, O.; Tymchuk, S. Decision Support System for Efficient Energy Management of Hybrid Power Grid. In Proceedings of the 2021 IEEE 12th International Conference on Electronics and Information Technologies (ELIT), Lviv, Ukraine, 5–7 May 2021; pp. 119–124. [Google Scholar]
  28. Khan, N.; Ullah, F.U.M.; Haq, I.U.; Khan, S.U.; Lee, M.Y.; Baik, S.W. AB-Net: A Novel Deep Learning Assisted Framework for Renewable Energy Generation Forecasting. Mathematics 2021, 9, 2456. [Google Scholar] [CrossRef]
Figure 2. Algorithm’s topology structure—tree model.
Buildings 13 00428 g002
Figure 4. Possible Outcomes of Countermeasure Application.
Buildings 13 00428 g004
Table 1. Impact/Threat Table based on TwinERGY Partners’ Feedback.
ImpactsSeverity (1 to 10)ThreatsProbability
Power Supply Interruption3Power loss0.049315068
Overconsumption5Energy demand overload, malfunction, heater involved, old device, no maintenance0.136986301
Overvoltage5Energy demand overload, malfunction, heater involved, old device, no maintenance0.041095890
Undervoltage3Malfunction0.035616438
Overcurrent3Malfunction0.001369863
Overpower3Malfunction0.001369863
Unplanned Maintenance8Malfunction due to improper use of appliances0.071232877
Ordinary Maintenance3Servicing, cleaning, malfunction, filters substitution0.032876712
Time Synchronization Error6NTP connection failure0.002739726
Device Failure10Hardware/firmware failure0.000547945
Application Error9Loss of internet connection0.016438356
Bad Performance8Heater, fluid lacking, weather conditions, sediment buildup from weather residue0.093150685
Discomfort9-0.139726027
Fault10Malfunction/Old device0.024657534
Battery Damage6Electrical/Mechanical/Chemical malfunctioning can damage the battery health0.002739726
Repair5Diverse incidents can cause the need for repairs0.001369863
Vandalism/Theft10Acts of vandalism can damage or destroy infrastructure0.001369863
Cyber Attack10High interconnectivity is a gap that can lead to increase in cyber vulnerabilities (malicious attacks, system outages, bugs etc.)0.001369863
Server Failure6The server in control of charging points can face problems such as intermittent lack of internet connection0.002739726
Low Production6Uncleaned panels0.093150685
Disclaimer/Publisher’s Note: The statements, opinions and data contained in all publications are solely those of the individual author(s) and contributor(s) and not of MDPI and/or the editor(s). MDPI and/or the editor(s) disclaim responsibility for any injury to people or property resulting from any ideas, methods, instructions or products referred to in the content.

