Article

Quantitative Risk Evaluation by Building Type Based on Probability and Cost of Accidents

1
Hyundai Engineering and Construction, 75, Yulgok-ro, Jongno-gu, Seoul 03058, Republic of Korea
2
Department of Safety Engineering, Seoul National University of Science and Technology, 232, Gongneung-ro, Nowon-gu, Seoul 01811, Republic of Korea
3
Department of Architecture, Honam University, Gwangju 62399, Republic of Korea
*
Author to whom correspondence should be addressed.
Buildings 2023, 13(2), 327; https://doi.org/10.3390/buildings13020327
Submission received: 16 December 2022 / Revised: 9 January 2023 / Accepted: 17 January 2023 / Published: 21 January 2023
(This article belongs to the Special Issue Proactive and Advanced Research on Construction Safety Management)

Abstract

:
The construction industry has the highest frequency of injuries and fatal accidents compared to other industries. Therefore, an accurate evaluation of the level of risk is necessary to effectively manage accidents in the construction industry. Although risk assessments are used in the construction industry to identify and reduce risk, they are carried out qualitatively by the subjective opinion of safety managers. Therefore, this study proposed a quantitative risk assessment based on the risk levels of 17 building facilities. Moreover, this study classified the building facilities into groups of similar risk levels. This study involved five steps. The results of the study indicated that in terms of both accident probability and financial losses, the facility type with the highest risk ranking was “Residential buildings” (5.92). The risk assessment method proposed in this study can contribute toward reducing accidents by identifying the exact risk level for each facility type. Moreover, clients and contractors can utilize this study and its findings as a basis for different safety management approaches depending on the risk group level.

1. Introduction

The construction industry has been characterized by the highest probability of accidental deaths compared to other industries. According to the “2020 Industrial Accident Statistics” published by the Ministry of Employment and Labor (MOEL), the largest number of occupational accidents (26,888 casualties) occurred in the construction industry of South Korea [1]. In particular, the largest number of fatal occupational accidents (414) occurred in the construction industry, representing approximately 50.4% of all fatal occupational accidents. As the construction industry involves more injuries and fatal accidents than other industries, efforts to reduce accidents are required for the safety of workers [2,3,4,5].
Therefore, it is necessary first to accurately evaluate the risk levels in the construction industry [3,6], and where the types and risk levels of accidents differ depending on the facility type. For example, the construction of “residential buildings” involves both structural frames and finishes; therefore, many “fall” accidents caused by working at heights may occur during the construction of “residential buildings” [7]. However, during the construction of “storage and treatment facilities for hazardous substances,” most accidents are “hit by objects” accidents caused by the unloading and lifting of heavy objects [8]. As the frequency and intensity of accidents differ depending on the facility type, it is necessary to reduce the occurrence of accidents by suggesting an appropriate risk level evaluation method that considers the facility type.
Traditionally, risk assessments, which are used to predict risks and establish reduction measures, are conducted to evaluate risks in the construction industry. According to the Occupational Safety and Health Act, a risk assessment must be conducted before starting dangerous construction work [9]. In addition, Design for Safety, which is a safety management process carried out at the design phase, is also based on a risk assessment [10]. Existing risk assessments combine the frequency and intensity of accidents using a 3-point or 5-point scale [9].
However, risk assessments are subjectively evaluated as “top, middle, and low” or “large, medium, and small” at the discretion of the safety manager, and without any objective standards or grounds. As a result, risk assessments based on subjective judgments can result in different outcomes depending on the party that conducted the risk assessment. In addition, exact risk levels cannot be identified because the assessment is based on subjective experience [2]. Therefore, a quantitative and objective risk assessment technique is required to ensure that proper safety management can be performed by accurately identifying the risk levels in the construction industry.
According to previous studies, the probability of an accident can be considered in terms of its frequency. Sawicki and Szóstak (2020) used data on occupational accidents occurring on scaffolding and assess the state of threat of working on scaffolding [11]. Nowobilski and Hola (2023) used data on 200 accidents that occurred in the Polish construction industry and presented a methodology for predicting the probability of falls from building scaffolding [12]. Dong et al. (2013) used data on fatal accidents and the number of workers and determined the fatalities per 100,000 workers to identify the frequency of fatal accidents caused by falls in the U.S. construction industry [6]. Similarly, Li et al. (2019) used data on fatal accidents and the number of workers by city and determined the fatalities per 100,000 workers to identify the frequency of deaths in the construction industry in China by city [13].
In South Korea, the probability of fatal accidents has been evaluated using the “fatalities per 10,000 workers” metric, calculated using the number of construction workers and the number of accidental deaths. However, it is difficult to use this metric as a basis for risk assessment due to the following problems. First, the fatalities per 10,000 workers are only evaluated for the entire construction industry [6]. However, the construction industry has different accident characteristics and risk levels depending on the type of facility [14,15], thus making it necessary to evaluate the probability of fatal accidents for different facility types as well as for the entire construction industry. Second, the number of construction workers is estimated using the ratio of construction cost to labor cost [16,17]. However, the estimated number of construction workers may differ from the actual number of workers, making it impossible to accurately evaluate the fatalities per 10,000 workers [18]. Third, the number of construction workers is estimated by assuming that the number of working days per year for construction workers is 264 [6,18]. However, in the case of non-regular workers, the number of working days may vary [19]. Thus, the fatalities per 10,000 workers cannot be accurately evaluated for non-regular workers.
Son (2021) calculated an accident probability based on the actual number of workers, compared it with that based on the construction cost, and found no significant difference between the two. Therefore, the frequency aspect of risk assessment can be based on the construction cost for a more accurate accident probability than that using the current fatalities per 10,000 workers [20].
According to previous studies, accident costs can be considered in terms of the intensity of accidents. Baradan and Usmen (2006) considered the income loss of workers to identify the intensity of accidents [21]. Waehrer et al. (2007) considered the direct medical cost, indirect losses in wage and household productivity [22]. Yilmaz et al. (2015) analyzed the compensations, medical expenses, and penalties caused by accidents to identify accident intensities [23]. According to Kim (2018) and Lee et al. (2021), the cost to workers, employers, and the government in the event of an accident can be considered in terms of the intensity of the accident [24,25].
This study aimed to evaluate quantitative risk levels for different construction facility types by considering the probability and financial cost of accidents.

2. Literature Review

In this study, a quantitative risk assessment was conducted for different construction facility types by considering accident probability and financial cost. We analyzed the limitations and implications of relevant previous studies and presented their main differences. The analysis included previous studies related to (i) calculating the probability of construction accidents; (ii) calculating the cost of construction accidents; and (iii) construction risk assessments. Table 1 summarizes the relevant previous studies.
We reviewed various previous studies investigating accident probabilities in the construction industry [6,7,13,18,25,26,27,28,29]. These studies evaluated the accident probability using the number of workers and accident frequency; however, the number of workers used was not calculated through complete enumeration but estimated through sampling [6,7,13,18,26]. When the accident probability is calculated using an estimated number of workers, the probability cannot be accurately evaluated [18]. Compared to the number of workers in the construction industry, for which complete enumeration is difficult, the construction cost invested in the construction industry has been more accurately surveyed [30]. Therefore, to evaluate more accurate risk levels for the construction industry, an accident probability based on construction cost rather than that based on the number of workers should be used.
We reviewed various previous studies calculating the costs incurred due to construction accidents [22,23,24,31,32,33,34,35]. These studies quantified various cost items resulting from construction accidents, such as direct, indirect, compensation, and penalty costs. However, the cost of accidents to workers, employers, and the government consists of multiple cost items rather than a single item. Therefore, to calculate the cost in terms of the intensity of construction accidents, it is necessary to consider all potential costs, including income loss, compensation costs, business loss, and administrative costs [5,24].
Finally, we reviewed the previous studies on quantitative and qualitative calculation of risk in construction [15,21,36,37,38,39,40]. In these studies, the risks in the construction industry were calculated using various methods such as surveys and data analysis. The risks were also evaluated considering the frequency and intensity of accidents [21,39,40]. However, accurate risk assessment could not be performed because the accident probability was based on the number of workers or only considered some cost items.
The level of risk in construction can be evaluated using a combination of frequency and intensity [3]. However, previous studies could not accurately evaluate risk levels because they failed to consider frequency and intensity simultaneously. In addition, even if the evaluation of risk levels did consider frequency and intensity, accurate data evaluation could not be performed. Therefore, it is necessary to determine accurate risk levels for the construction industry by considering both frequency and intensity. This study aimed to propose a quantitative risk assessment technique based on a construction cost-based accident probability and the cost of accidents to workers, employers, and the government. In addition, the risk levels by construction facility type were calculated using the proposed technique, with building facilities with similar risk levels classified into groups that can be used for safety management decision-making.

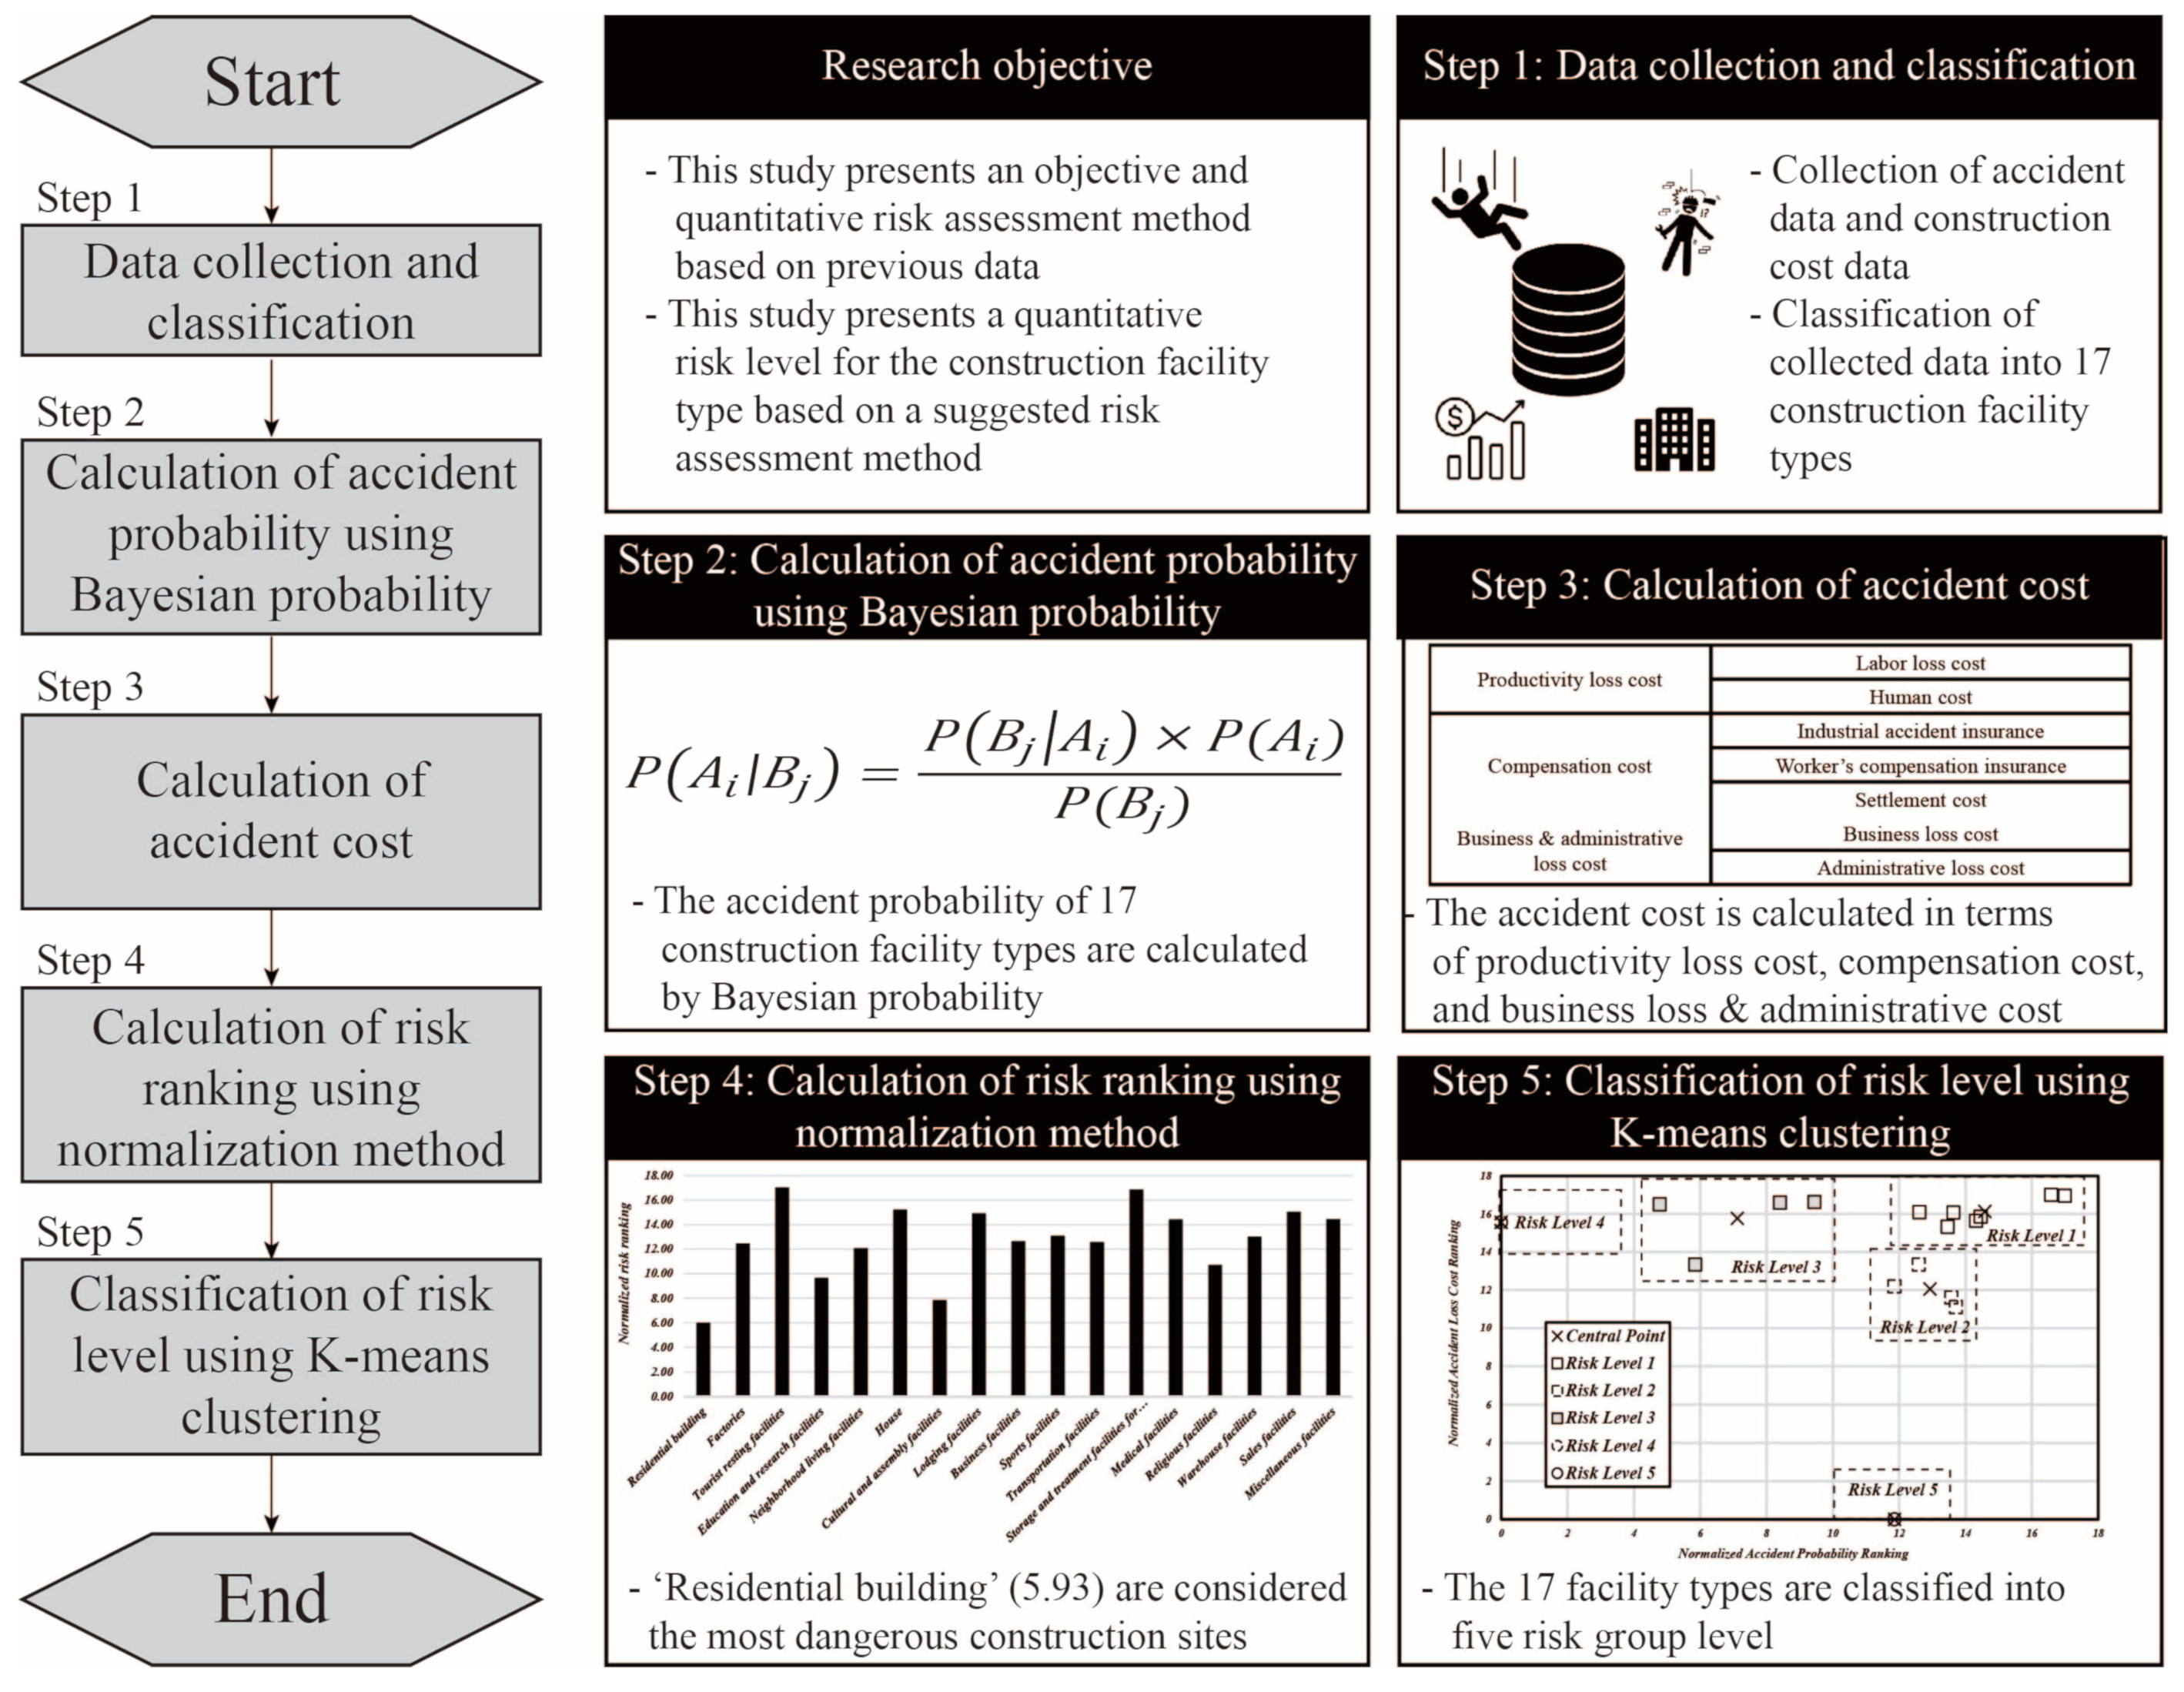
3. Materials and Methods

As shown in Figure 1, this study was conducted in the following order: (1) data collection and classification; (2) calculation of accident probability using Bayesian probability; (3) calculation of accident cost; (4) calculation of risk ranking using normalization method; and (5) classification of risk level using k-means clustering.

3.1. Data Collection and Classification

3.1.1. Data Collection

It was first necessary to collect the related data to calculate the quantitative accident probability and accident cost for each construction facility [2]. In this study, data on fatal and injury-causing construction accidents, as well as annual construction costs by facility, were collected to calculate the quantitative accident probability and cost for each facility type.
The Ministry of Land, Infrastructure, and Transport (MOLIT) provides accident data online using a Construction Safety Management Integrated Information (CSI) database system [41].
In this study, data on 5083 construction accidents from April 2018 to May 2021 were obtained from the CSI database (See Table S1).
To base the accident probability on construction cost rather than on the number of construction workers, it was necessary to collect data on the total construction cost for each facility type. Statistics Korea provides data on the contract amount, amount realized, original contract amount, and subcontract amount for different construction facilities. Because Statistics Korea only provides the construction cost for the corresponding year, data on the total construction cost were collected to determine the construction cost for the corresponding year regardless of the completion of construction or receipt of payment. Data on the total construction cost from 2017 to 2019, provided by Statistics Korea, were used to calculate the construction cost-based accident probability [30] (See Table S2).
In previous research, Jeong et al. (2021) analyzed data on 5732 fatal accidents [42]. Also, Konda et al. (2016) analyzed data on 2210 fatal accidents in the U.S [16]. Accordingly, the 5083 construction accidents used in this study were considered to be sufficient to calculate the quantitative accident probability.

3.1.2. Data Classification

To calculate the accident probability and cost for each construction facility using the abovementioned data, the construction facilities were classified as follows. We referred to the 29 construction facility types presented by the Enforcement Decree of the Building Act [Annex 1] Building Types by Use (related to Article 3–5) [41]. To match the accident data collected from the CSI database with the construction cost data collected from Statistics Korea, 17 facility types were selected, from “residential buildings” to “miscellaneous facilities”, as shown in Table 2.
Finally, the collected accident data and construction cost data were reclassified for the 17 facility types. Table 2 shows the reclassified data.

3.2. Calculation of Accident Probability Using Bayesian Probability

The existing frequency-based probability can be accurately calculated using sufficient past data. However, there was not enough data to calculate an accurate probability for unexpected events during construction, such as the occurrence of accidents [39]. Bayesian probability, a method for estimating the probability of an event that has not occurred using various probabilities related to the event [39,43,44,45], can be used to address this problem of frequency-based probability.
In this study, we attempted to calculate the accident probability for each facility type based on information on past accidents at each facility type and the amount realized for each facility type. To calculate the accident probability, the codes describing accident occurrence, no accident, and facility type were first determined (See Table S3).
Bayesian probability was calculated using Equations (1)–(5) below.
P B j = P A i B j P B j
P A i = P B j A i P A i
P A i B j = P B j × P B j
P B j A i = P A i × P A i
P B j = P A i × P A i P B j ,
where P A i = prior probability for variable A; P B j = prior probability for variable B, P A i = likelihood; P B j = posterior probability
In other words, prior probability P A i indicates the probability that an accident or no accidents will occur. In this study, prior probability P A i was calculated using the collected accident data. In this instance, prior probability P A i was calculated by dividing the number of accidents that have occurred at the corresponding facility by the number of accidents that have occurred at all facilities. Prior probability P B j indicates the probability that construction will occur at facility B j among all constructions. In this study, prior probability P B j was calculated using the construction cost data collected for each facility type. In this instance, prior probability P B j was calculated by dividing the construction cost of the corresponding facility by the construction cost of all facilities. In addition, likelihood P A i is the probability that the facility at which an accident or no accidents occurred was facility B j . In this study, the likelihood P A i was calculated using the accident and construction cost data collected for each facility type. Finally, the posterior probability, which is the probability that an accident or no accidents will occur at facility B j , was calculated using the prior probability and likelihood.

3.3. Calculation of Accident Costs

In this study, costs were considered when calculating the accident intensity of affected parties, such as workers, employers, and the government, following an accident in the construction industry [5,24]. To calculate the cost of an accident causing a fatality or injury in the construction industry, the items were first derived by referring to previous studies.

Determining Accident Costs

In this study, accident cost was calculated by referring to previous studies [5,24,31,32,33].
The cost of productivity loss related to the income and tax of workers [5,24,31], the compensation costs related to the pay-outs for accident victims [5,24,31], and the business and administrative costs related to lost business [5,24] were considered in calculating accident cost. The details of the cost items are presented in the Supplementary Materials (Table S4).
The costs of fatal and injury-causing accidents, presented in Table 3, are based on previous studies on cost items, as presented in Table S4 [5]. Finally, the annual accident cost by facility type using accident data for each facility type and cost per accident can be calculated using Equation (6).
A c c i d e n t   c o s t   b y   f a c i l i t y   t y p e = A c c i d e n t   c o s t   p e r   f a t a l   a c c i d e n t × N u m b e r   o f   f a t a l   a c c i d e n t s + A c c i d e n t   c o s t   p e r   i n j u r y   c a u s i n g   a c c i d e n t × N u m b e r   o f   i n j u r y   c a u s i n g   a c c i d e n t s

3.4. Calculation of Risk Ranking Using Normalization Method

In this study, the accident probability and cost for each construction facility type were calculated to solve the problem with risk assessments performed qualitatively and subjectively. In addition, it is necessary to integrate the two variables of accident probability and cost to calculate the risk level for each facility type.
A normalization method was used to integrate the accident probability and cost. This method normalizes and ranks the variables through simple calculations [2]. In addition, unlike other integration techniques, this method can perform normalization by considering the number of variables [2,46]. As shown in Equations (7)–(9), the normalized accident probability risk ranking (NPR), normalized accident cost risk ranking (NLR), and average normalized risk ranking (ANR) can be calculated using the normalization method.
N o r m a l i z e d   a c c i d e n t   p r o b a b i l i t y   r i s k   r a n k i n g   N P R = A c c i d e n t   p r o b a b i l i t y m a x A c c i d e n t   p r o b a b i l i t y i A c c i d e n t   p r o b a b i l i t y m a x A c c i d e n t   p r o b a b i l i t y m i n × 17
N o r m a l i z e d   a c c i d e n t   c o s t   r i s k   r a n k i n g   N L R = A c c i d e n t   c o s t m a x A c c i d e n t   c o s t i A c c i d e n t   c o s t m a x A c c i d e n t   c o s t m i n × 17
where the risk ranking = the accident probability and cost value for each of the 17 facility types; the normalized risk ranking = the normalized ranking value for each of the 17 facility types
A v e r a g e   n o r m a l i z e d   r i s k   r a n k i n g   A N R = R i s k   r a n k i n g i a c c i d e n t   p r o b a b i l i t y + R i s k   r a n k i n g i a c c i d e n t   l o s t   c o s t 2
The risk ranking for each construction facility type can be calculated using Equations (7) and (8). The normalized ranking value ranges from 0 to 17. As it approaches zero, the facility type has a higher risk level considering both the accident probability and cost [2].

3.5. Classification of Risk Level Using K-Means Clustering

The risk level for each construction facility type was calculated considering both the accident probability and cost, as shown above. If facility types with similar risk levels were classified from the viewpoint of contractors undertaking various construction projects, accidents could effectively be reduced by using different safety management approaches for each risk group level. Therefore, this study attempted to group facility types by similar risk levels based on risk levels calculated for each facility type.
In this study, facility types with similar risk levels were classified using k-means clustering [2]. K-means clustering randomly selects k centroids and allocates the data to the nearest centroids. The data can then be classified into k groups by repeating the process of readjusting the centers of the data allocated to the k centroids until no more readjustment is required [47]. In this study, the number of groups, k, was set to five using the elbow method and k-means clustering was performed [48].

4. Results

4.1. Results of the Accident Probability Analysis

In this study, the accident probability for each construction facility type was calculated through Bayesian probability. The accident probabilities for the 17 facility types were calculated using Equations (1)–(5), as shown in Table 4. Figure 2 compares frequency of accidents and accident probability for each facility type.
It was found that “Cultural and assembly facilities” (37.21 × 10⁻³ accidents/million dollars) have the highest accident probability followed by “religious facilities” (26.99 × 10⁻³ accidents/million dollars) and “education and research facilities” (24.70 × 10⁻³ accidents/million dollars).
However, “Tourist resting facilities” (0.67 × 10⁻³ accidents/million dollars) showed the lowest accident probability followed by “storage and treatment facilities for hazardous substances” (1.56 × 10⁻³ accidents/million dollars) and “houses” (6.17 × 10⁻³ accidents/million dollars).
According to the accident data provided by the CSI database, “residential buildings” exhibited the largest average number of accidents (654.85), followed by “business facilities” (194.86) and “factories” (181.20).
As seen in Figure 2, “residential buildings” were found to be the most dangerous facility type in terms of the frequency of accidents but ranked seventh among the 17 facility types in accident probability. However, “Cultural and assembly facilities,” which were found to be the most dangerous facility type in terms of accident probability, ranked sixth among the 17 facility types in terms of accident frequency.

4.2. Results of the Accident Lost Cost for 17 Facility Types

In this study, the accident cost was calculated for the 17 facility types using cost per accident and Equation (6), as shown in Table 5, to calculate the risk level for each facility type.
It was found that “residential buildings” (127.29 × 10⁻¹ million dollars) have the highest accident cost followed by “factories” (44.57 × 10⁻¹ million dollars) and “business facilities” (40.84 × 10⁻¹ million dollars). However, “storage and treatment facilities for hazardous substances” (0.57 × 10⁻¹ million dollars) showed the lowest cost, followed by “tourist resting facilities” (0.90 × 10⁻¹ million dollars) and “sports facilities” (3.34 × 10⁻¹ million dollars).

4.3. Results of the Risk Ranking Considering Accident Probability and Cost

The accident probability and cost were calculated for all facility types to evaluate their quantitative risk levels. According to Table 4, the most dangerous facility type in terms of accident probability was “cultural and assembly facilities” (37.21 × 10⁻³ accidents/million dollars). According to Table 5, the facility type with the highest accident intensity in terms of lost cost was “residential buildings” (127.29 × 10⁻¹ million dollars). As the accident probability and cost differ for each facility type, it is necessary to present an integrated risk ranking that considers both.
Accident probability and cost were normalized using the normalization method to calculate the risk level by considering both the accident probability and accident cost. The accident probability and accident cost of the 17 facility types were normalized from 0.00 to 17.00 using Equations (7) and (8), and the average normalized risk ranking used to integrate each ranking was calculated using Equation (9). Table 6 shows the ANR of the 17 facility types.
When the ANR was calculated by considering both the accident probability and loss cost, “residential buildings” (5.92) exhibited the highest ANR followed by “cultural and assembly facilities” (7.78) and “education and research facilities” (9.58).
In the case of “residential buildings,” the NLR was found to be high, but the risk level ranked seventh among the 17 facility types from an NPR perspective. “Residential buildings” was found to be the most dangerous facility type, ranking first in the ANR that considers both the accident probability and accident cost. In addition, “cultural and assembly facilities,” which had the highest risk level in terms of the NPR, also ranked second for ANR.
For all facilities, the accident cost can be low even if the accident probability is high, or the accident probability can be low even if the cost is high. Therefore, when it comes to the risk level, it is necessary to evaluate the risk ranking comprehensively by considering both the accident probability and cost.

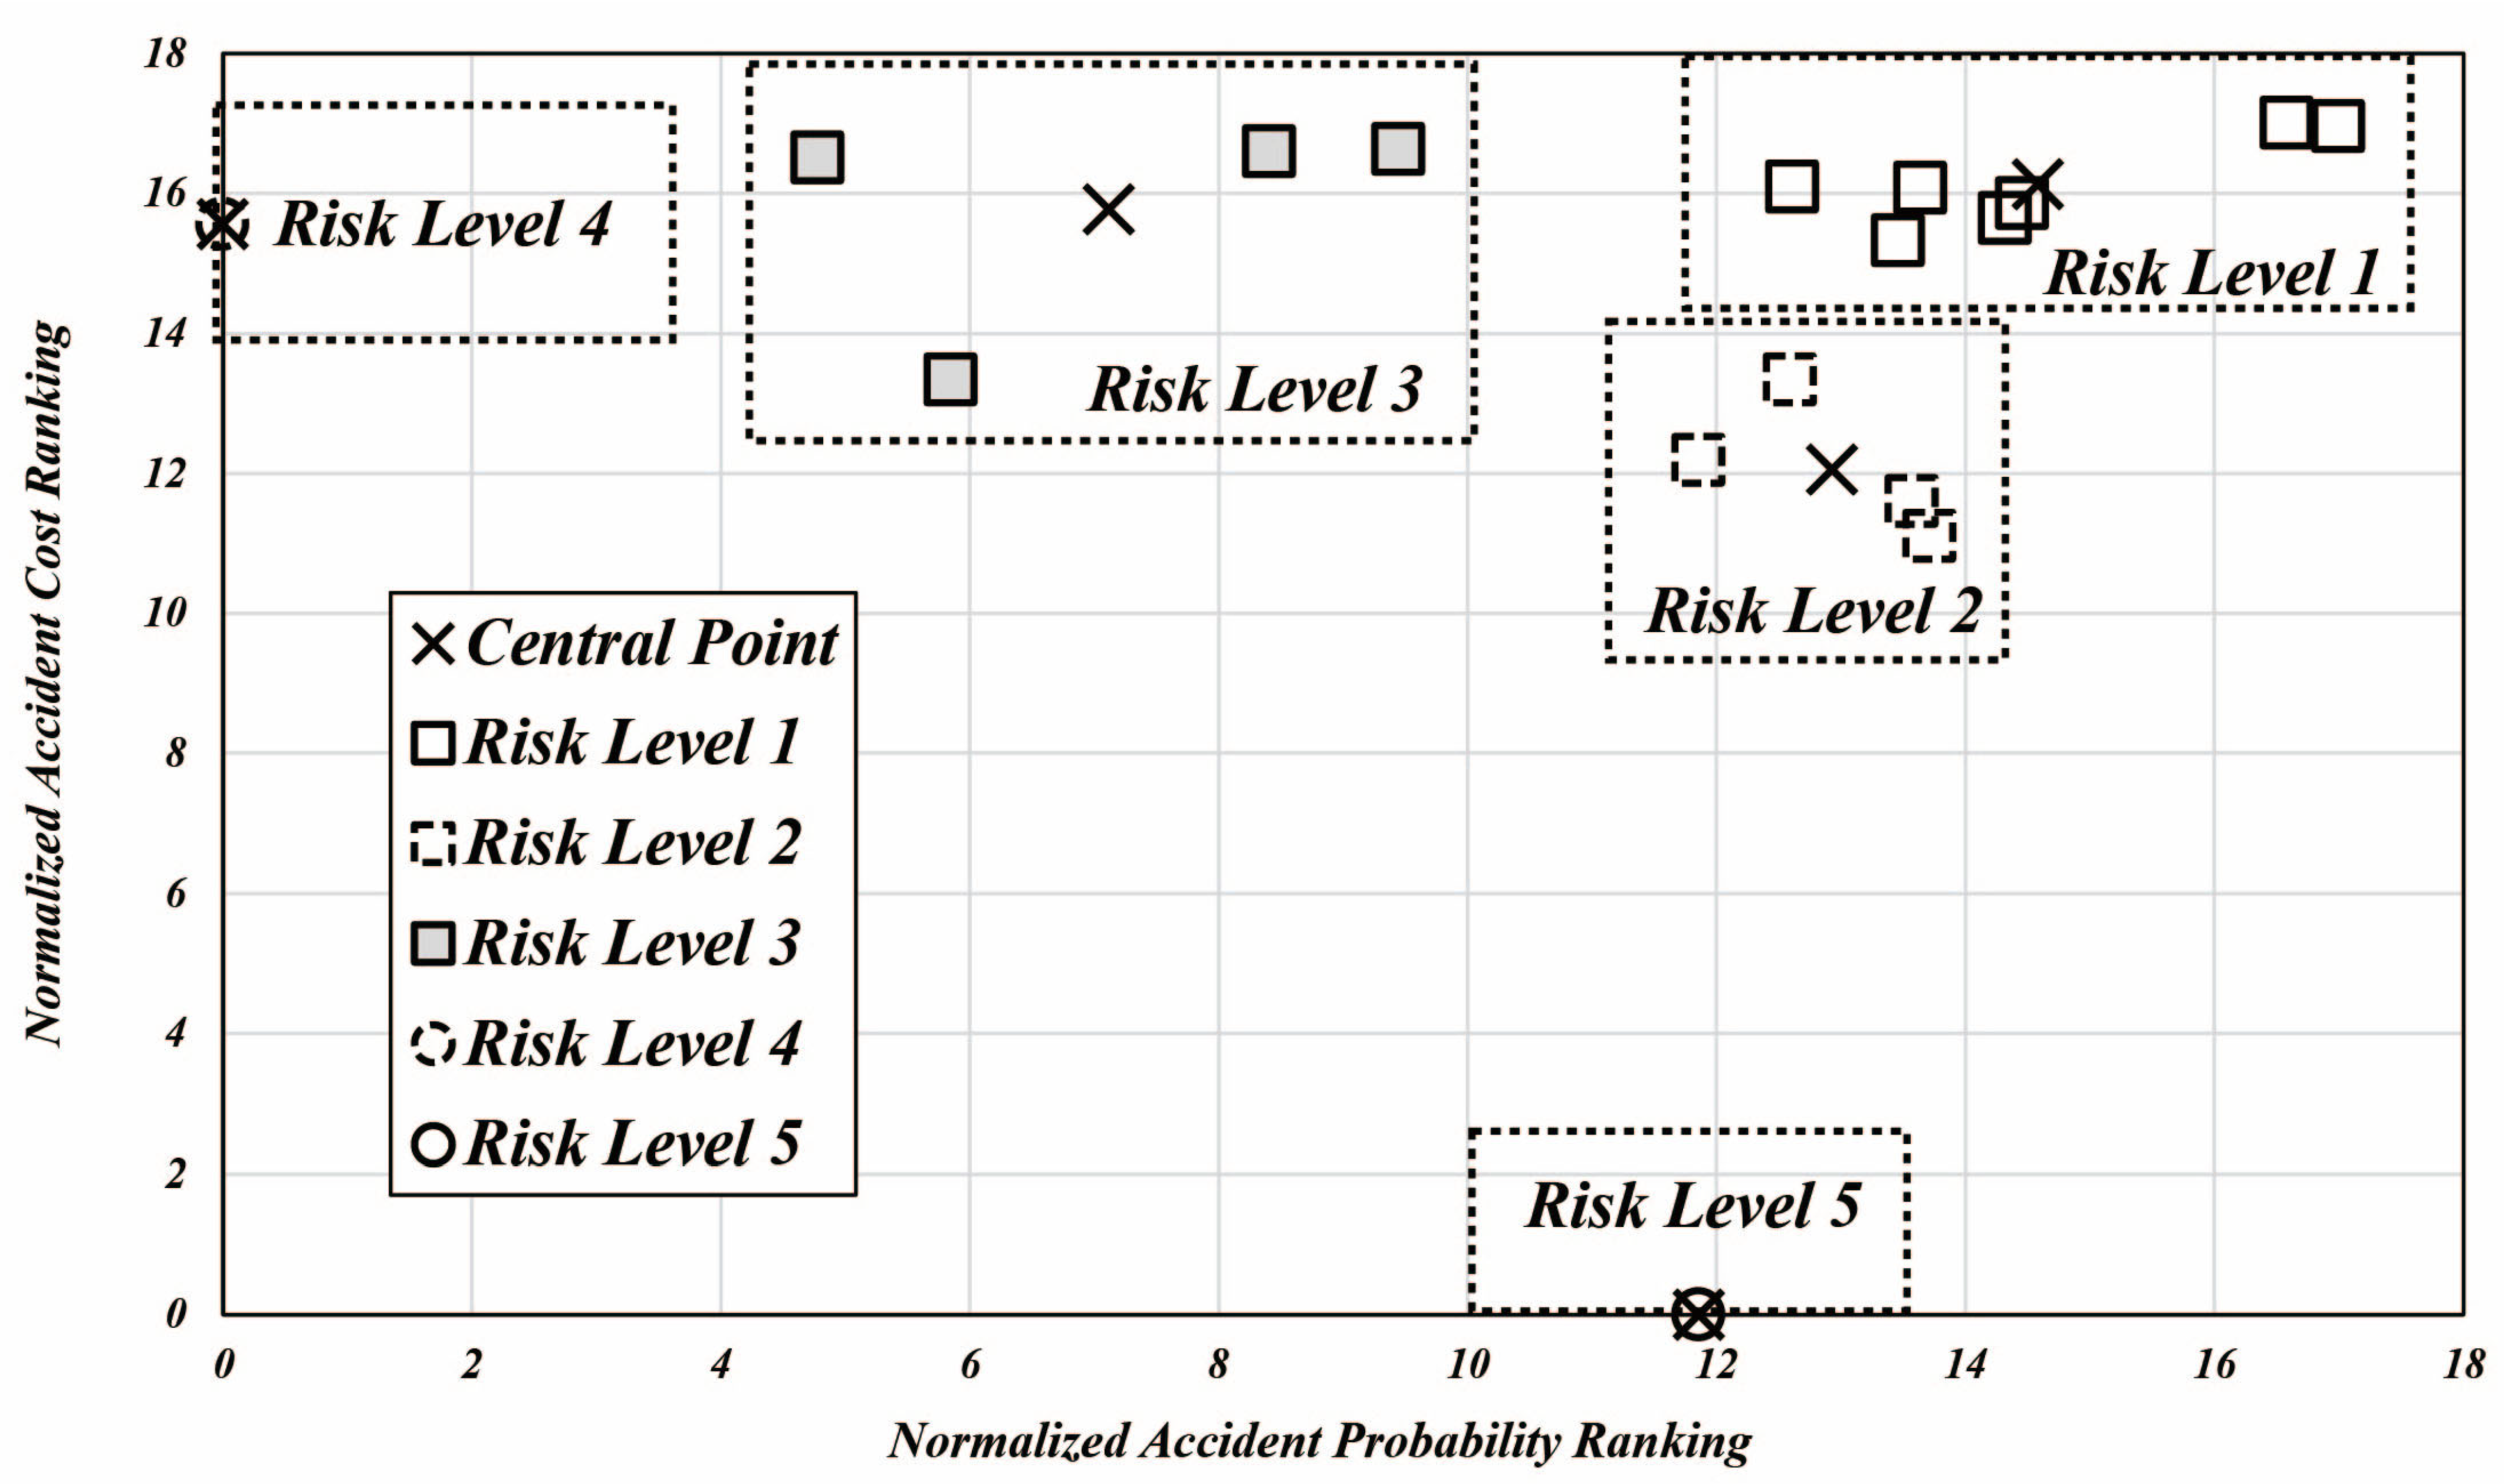
4.4. Rseults of Risk Level Clustering Considering Accident Probability and Cost

Risk groups were determined based on the risk rankings to enable decision-makers in the construction industry to easily establish safety management plans for different facility types. As shown in Table 7 and Figure 3, the 17 facility types were classified into five risk group levels in this study using k-means clustering.
  • Risk group level 1 is characterized by low accident probability and cost and includes seven facility types;
  • Risk group level 2 is characterized by low accident probability and medium-level accident cost and includes four facility types;
  • Risk group level 3 is characterized by low accident cost and medium-level accident probability and includes four facility types;
  • Risk group level 4 is characterized by medium-level accident cost and the highest accident probability and includes “cultural and assembly facilities”;
  • Risk group level 5 is characterized by medium-level accident probability and the highest accident cost and includes “residential buildings”.
Decision-makers can use the results of this study to allocate appropriate funds for safety measures depending on the risk group level. In addition, as the facilities in risk group level 5 would incur large costs in the event of an accident, despite having a relatively low accident probability, safety management of such facilities can focus on reducing accident costs. In contrast, as facilities in risk group level 4 are characterized by a large number of accidents, the safety management of these facilities can focus on reducing the occurrence of accidents.
The ANR and risk level groups shown in Table 7 indicate that risk group level 5 has the highest risk ranking followed by risk group level 4. In contrast, risk group level 1 was found to have the lowest risk ranking. The risk rankings of risk group levels 2 and 3 are similar, making it impossible to determine which group requires a higher degree of safety management through ANR alone. However, using the proposed safety management approach for each risk group level, the safety management of risk group levels 2 and 3 can focus on reducing accident cost and accident occurrence, respectively.

5. Discussion

In this study, we performed a risk assessment by considering the accident probability and accident cost for 17 construction facility types. The risk assessment results obtained using the normalization method showed that “residential buildings” is the facility type with the highest ANR (5.92).
According to MOLIT, “residential buildings” account for approximately 40% of all construction projects started in 2021 [41]. Moreover, among the 17 facility types, “residential buildings” have the highest annual construction cost [30]. In addition, according to Hatipkarasulu (2010), “residential buildings” have the largest number of accidents [14]. As “residential buildings” facilities are constructed in the largest quantities, naturally, they involve the largest number of accidents and the highest risk level.
According to Leu and Chang (2013), accidents described as “falls” most frequently occur during “residential buildings” construction due to repeated work at height for each floor, such as structural framework, ceiling finishing work, and operating machinery at height [39]. The research by Dong et al. (2014) reported that half of all accidents in “residential buildings” construction are “fall” accidents [7]. As “falls” are highly likely to cause death compared to other accident types, “residential buildings” have the highest risk level in terms of accident intensity [39]; therefore, safety management needs to be performed first for “residential buildings.”
Using the accident probability, accident cost, risk level for each facility type, and the proposed risk group levels can help clients and contractors in the decision-making on safety management in the construction or pre-construction phases. For example, clients can invest in larger safety budgets for projects with facilities in groups with higher risk levels. Contractors can reduce accidents and losses by accurately identifying and managing accident probability and accident costs of a construction project.
To describe how the results of this study can be used, Table 8 presents the construction projects undertaken by construction contractor “L” in 2017. According to Table 8, in 2017 contractor “L” undertook projects belonging to all risk group levels, except for risk group level 4. Based on the results of this study, contractor “L” can choose to invest in a larger safety budget for facilities with the highest risk level, i.e., those in risk group level 5. They can also perform safety management focusing on reducing accident costs for “education and research facilities”, which belong to risk group level 2. In contrast, for the “tourist resting facilities” of risk group level 3, safety management can focus on reducing the occurrence of accidents.

6. Conclusions

To reduce risks in the construction industry, which involves more accidents compared to other industries, it is necessary to first identify risk levels accurately. However, construction risk assessments adhering to the Occupational Safety and Health Act are subjective and qualitative, making it impossible to identify the risk level accurately. Therefore, this study presented quantitative risk levels by facility type by considering the accident probability and accident cost. In addition, facility types with similar risk levels were classified into groups to help those in the construction industry make decisions for safety management.
This study involved the following five steps: (1) data collection and classification; (2) calculation of accident probability using Bayesian probability; (3) calculation of accident cost; (4) calculation of risk ranking using normalization method; and (5) classification of risk level using k-means clustering.
The contributions of this study are as follows. First, a quantitative risk assessment method based on past data was proposed as an alternative to qualitative risk assessments. Second, the risk levels for each facility type and the risk group levels presented in this study can be utilized by clients or contractors in project safety management.
The limitations of this study are as follows: first, the risk level of each facility type in this study includes both death and injury. Therefore, the difference between the risk level for death and injury has not been considered for the facility types. Second, in this study, the accident cost for each facility type was calculated by multiplying the number of accidents for each facility type by the cost per accident. Therefore, the difference in accident cost between facilities was not reflected. Third, the cost of injury-causing accidents, which differs depending on the required days of care, was not applied. Fourth, although the risk levels for different facility types are presented in this study, they do not include the risk levels for the construction type and work type.
Future research will be conducted in the following three directions: first, based on the risk levels by facility type presented in this study, a standard for the allocation of safety management expenses by facility type should be established. Second, in addition to the accident risk level, the risk level for each fatal and injury-causing accident must also be calculated. In the case of injury-causing accidents, different accident costs will be applied depending on the required days of care. Third, the risk level for each construction type and work type must be calculated alongside the risk level for each facility type.

Supplementary Materials

The following supporting information can be downloaded at: https://www.mdpi.com/article/10.3390/buildings13020327/s1, Table S1: Example of collected accident data; Table S2: Annual construction cost of South Korea; Table S3: Code name for accident occurrence, no accident, and fatality type; Table S4: Accident cost items in the construction industry.

Author Contributions

J.S.: Methodology, Formal analysis, Resources, Visualization, Writing—Original draft. J.J. (Jaewook Jeong): Conceptualization, Supervision, Project administration, Writing—Review and editing. J.J. (Jaemin Jeong): Methodology, Resources, Visualization, Writing—Original draft. J.L.: Methodology, Resources, Writing—Review and editing. All authors have read and agreed to the published version of the manuscript.

Funding

Following are results of a study on the “Leaders in INdustry-university Cooperation 3.0” Project, supported by the Ministry of Education and National Research Foundation of Korea.

Data Availability Statement

The data generated and analyzed during this research are available from the corresponding author upon reasonable request.

Conflicts of Interest

The author declare no conflict of interest.

References

  1. Ministry of Employment and Labor (MOEL). A Report on Industrial Accidents in 2020; MOEL: Sejong, Republic of Korea, 2021. [Google Scholar]
  2. Jeong, J.; Jeong, J. Quantitative Risk Evaluation of Fatal Incidents in Construction Based on Frequency and Probability Analysis. J. Manag. Eng. 2022, 38, 04021089. [Google Scholar] [CrossRef]
  3. Jeong, J.; Jeong, J. Comparative Analysis of Degree of Risk between the Frequency Aspect and Probability Aspect Using Integrated Uncertainty Method Considering Work Type and Accident Type in Construction Industry. Appl. Sci. 2022, 12, 1131. [Google Scholar] [CrossRef]
  4. Lee, J.; Jeong, J.; Soh, J.; Jeong, J. Quantitative Analysis of the Accident Prevention Costs in Korean Construction Projects. Buildings 2022, 12, 1536. [Google Scholar] [CrossRef]
  5. Lee, J.; Jeong, J.; Soh, J.; Jeong, J. Quantification Analysis of Safety Investment Cost and Fatal Accident Cost in Construction. J. Archit. Inst. Korea 2021, 37, 211–218. [Google Scholar]
  6. Dong, X.S.; Choi, S.D.; Borchardt, J.G.; Wang, X.; Largay, J.A. Fatal falls from roofs among US construction workers. J. Saf. Res. 2013, 44, 17–24. [Google Scholar] [CrossRef] [PubMed]
  7. Dong, X.S.; Wang, X.; Largay, J.A.; Platner, J.W.; Stafford, E.; Cain, C.T.; Choi, S.D. Fatal falls in the US residential construction industry. Am. J. Ind. Med. 2014, 57, 992–1000. [Google Scholar] [CrossRef] [PubMed]
  8. Beavers, J.E.; Moore, J.R.; Schriver, W.R. Steel erection fatalities in the construction industry. J. Constr. Eng. Manag. 2009, 135, 227–234. [Google Scholar] [CrossRef]
  9. MOEL (Ministry of Employment and Labor). Occupational Safety and Health Act. 2022. Available online: https://www.moleg.go.kr/ (accessed on 20 June 2022).
  10. MLIT (Ministry of Land, Infrastructure and Transport). Construction Technology Promotion Act. 2022. Available online: https://www.molit.go.kr/ (accessed on 20 June 2022).
  11. Sawicki, M.; Szóstak, M. Quantitative assessment of the risk status of work on construction scaffolds. Int. J. Environ. Res. Public Health 2020, 17, 5773. [Google Scholar] [CrossRef]
  12. Nowobilski, T.; Hoła, B. Methodology based on causes of accidents for forcasting the effects of falls from scaffoldings using the construction industry in Poland as an example. Saf. Sci. 2023, 157, 105945. [Google Scholar] [CrossRef]
  13. Li, F.; Zeng, J.; Huang, J.; Zhang, J.; Chen, Y.; Yan, H.; Yip, P.S. Work-related and non-work-related accident fatal falls in Shanghai and Wuhan, China. Saf. Sci. 2019, 117, 43–48. [Google Scholar] [CrossRef]
  14. Hatipkarasulu, Y. Project level analysis of special trade contractor fatalities using accident investigation reports. J. Saf. Res. 2010, 41, 451–457. [Google Scholar] [CrossRef] [PubMed]
  15. Go, S.S.; Song, H.; Lee, J.Y. A study on the hazard of work types for building construction. J. Archit. Inst. Korea Struct. Constr. 2004, 20, 136–143. [Google Scholar]
  16. Jeon, S.H.; Koo, K.J. Trend analysis of labor input ratios by work types in apartment housing constructions. Korean J. Constr. Eng. Manag. 2015, 16, 97–104. [Google Scholar] [CrossRef] [Green Version]
  17. Kim, E.J.; Ahn, H.S. A study on the development of a formula to calculate regular employees as a basis for appointing safety managers. J. Reg. Assoc. Archit. Inst. Korea 2015, 17, 233–240. [Google Scholar]
  18. Konda, S.; Tiesman, H.M.; Reichard, A.A. Fatal traumatic brain injuries in the construction industry, 2003–2010. Am. J. Ind. Med. 2016, 59, 212–220. [Google Scholar] [CrossRef] [PubMed]
  19. Seo, H.C.; Lee, Y.S.; Kim, J.J.; Jee, N.Y. Analyzing safety behaviors of temporary construction workers using structural equation modeling. Saf. Sci. 2015, 77, 160–168. [Google Scholar] [CrossRef]
  20. Son, S. Evaluation of Probability of Accident Based on the Number of Workers and Construction Cost by Work Types and Effect of Safety Patrol Team Operation in Residential Construction Projects. Master’s Thesis, Seoul National University of Science and Technology, Seoul, Republic of Korea, 2021. [Google Scholar]
  21. Baradan, S.; Usmen, M.A. Comparative injury and fatality risk analysis of building trades. J. Constr. Eng. Manag. 2006, 132, 533–539. [Google Scholar] [CrossRef]
  22. Waehrer, G.M.; Dong, X.S.; Miller, T.; Haile, E.; Men, Y. Costs of occupational injuries in construction in the United States. Accid. Anal. Prev. 2007, 39, 1258–1266. [Google Scholar] [CrossRef] [Green Version]
  23. Yilmaz, F.; Çelebi, U.B. The importance of safety in construction sector: Costs of occupational accidents in construction sites. Bus. Econ. Res. J. 2015, 6, 25. [Google Scholar]
  24. Kim, K.W. Costs of injuries and ill health in the workplace in South Korea. Int. J. Occup. Saf. Ergon. 2018, 26, 772–779. [Google Scholar] [CrossRef]
  25. Lee, J.; Jeong, J.; Soh, J.; Jeong, J. Development of framework for estimating fatality-related losses in the Korean construction industry. Int. J. Environ. Res. Public Health 2021, 18, 8787. [Google Scholar] [CrossRef] [PubMed]
  26. Lin, Y.H.; Chen, C.Y.; Wang, T.W. Fatal occupational falls in the Taiwan construction industry. J. Chin. Lnst. Eng. 2011, 28, 586–596. [Google Scholar] [CrossRef]
  27. Grant, A.; Hinze, J. Construction worker fatalities related to trusses: An analysis of the OSHA fatality and catastrophic incident database. Saf. Sci. 2014, 65, 54–62. [Google Scholar] [CrossRef]
  28. Choe, S.; Yun, S.; Leite, F. Analysis of the effectiveness of the OSHA steel erection standard in the construction industry. Saf. Sci. 2016, 89, 190–200. [Google Scholar] [CrossRef]
  29. Chan, A.P.C.; Yang, Y.; Darko, A. Construction accidents in a large-scale public infrastructure project: Severity and prevention. J. Constr. Eng. Manag. 2018, 144, 05018010. [Google Scholar] [CrossRef]
  30. Statistics Korea. Available online: https://kostat.go.kr/portal/korea/index.action (accessed on 3 May 2022).
  31. Health and Safety Executive (HSE). Costs to Britain of Workplace Fatalities and Self-Reported Injuries and Ill Health, 2013/2014. 2015. Available online: https://www.hse.gov.uk/ (accessed on 17 July 2022).
  32. International Labour Organization (ILO). Estimating the Economic Costs of Occupational Injuries and Illnesses in Developing Countries Essential Information for Decision-Makers. 2012. Available online: https://www.ilo.org/ (accessed on 19 June 2022).
  33. Safe Work Australia (SWA). The Cost of Work-Related Injury and Illness for Australian Employers, Workers and the Community 2012-13. 2020. Available online: https://www.safeworkaustralia.gov.au/ (accessed on 2 July 2022).
  34. European Agency for Safety and Health at Work. Estimating the cost of accidents and ill-health at work: A review of methodologies. 2014. Available online: https://osha.europa.eu/en/publications/estimating-cost-accidents-and-ill-health-work-review-methodologies/ (accessed on 20 January 2022).
  35. Yang, U.S.; Park, J.H.; Lee, C.S. Accident risk analysis of construction workers by occupation. Archit. Inst. Korea 2009, 25, 149–156. [Google Scholar]
  36. Choi, S.H.; Kim, C.K. A study on the research & analysis of the health and safety managing’s understanding on the applied construction work site risk assessment-foucus on site manager & manager. J. Korean Soc. Saf. 2012, 27, 62–67. [Google Scholar]
  37. Dumrak, J.; Mostafa, S.; Kamardeen, I.; Rameezdeen, R. Factors associated with the severity of construction accidents: The case of South Australia. Constr. Econ. Build. 2013, 13, 32–49. [Google Scholar] [CrossRef] [Green Version]
  38. Jo, B.W.; Lee, Y.S.; Kim, J.H.; Khan, R.M.A. Trend analysis of construction industrial accidents in Korea from 2011 to 2015. Sustainability 2017, 9, 1297. [Google Scholar] [CrossRef] [Green Version]
  39. Leu, S.S.; Chang, C.M. Bayesian-network-based safety risk assessment for steel construction projects. Accid. Anal. Prev. 2013, 54, 122–133. [Google Scholar] [CrossRef]
  40. Yu, U.J.; Son, K.; Kim, T.; Kim, J.M. A risk quantifiaction study for accident causes on building construction site by applying probabilistic forecast concept. J. Korea Inst. Build. Constr. 2017, 17, 287–294. [Google Scholar] [CrossRef]
  41. Ministry of Land, Infrastructure and Transport (MOLIT). Available online: http://stat.molit.go.kr/ (accessed on 10 July 2021).
  42. Jeong, J.; Jeong, J. Novel approach of the integrated work & risk breakdown structure for identifying the hierarchy of fatal incident in construction industry. J. Build. Eng. 2021, 41, 102406. [Google Scholar]
  43. Al-Kasasbeh, M.; Mujalli, R.O.; Abudayyeh, O.; Liu, H.; Altalhoni, A. Bayesian network models for evaluating the impact of safety measures compliance on reducing accidents in the construction industry. Buildings 2022, 12, 1980. [Google Scholar] [CrossRef]
  44. Zhang, L.; Wu, X.; Skibniewski, M.J.; Zhong, J.; Lu, Y. Bayesian-network-based safety risk analysis in construction projects. Reliab. Eng. Syst. Saf. 2014, 131, 29–39. [Google Scholar] [CrossRef]
  45. Wang, J.; Guo, F.; Song, Y.; Liu, Y.; Hu, X.; Yuan, C. Safety risk assessment of prefabricated buildings hoisting construction: Based on IHFACS-ISAM-BN. Buildings 2022, 12, 811. [Google Scholar] [CrossRef]
  46. Dincer, I.; Acar, C. A review on clean energy solutions for better sustainability. Int. J. Energy Res. 2015, 39, 585–606. [Google Scholar] [CrossRef]
  47. Raviv, G.; Shapira, A.; Fishbain, B. AHP-based analysis of the risk potential of safety incidents: Case study of cranes in the construction industry. Saf. Sci. 2017, 91, 298–309. [Google Scholar] [CrossRef]
  48. Sepasgozar, S.M.; Davis, S.R.; Loosemore, M. Dissemination practices of construction sites’ technology vendors in technology exhibitions. J. Manag. Eng. 2018, 34, 04018038. [Google Scholar] [CrossRef]
Figure 1. Research process.
Buildings 13 00327 g001
Figure 2. Comparison between accident probability and frequency for 17 construction facility types.
Buildings 13 00327 g002
Figure 3. Clustering of risk level for 17 construction facility types.
Buildings 13 00327 g003
Table 1. Literature review on the analysis of construction accident probability, accident cost, and risk assessment.
ContentsAuthorsMain ContentsFindings
Accident
probability
Choe et al. 2016
[26]
-
Effectiveness of new OSHA steel-framework standards was examined using four safety measurements.
-
For structural steel frames, the fatal accident probability decreased by 22.2% and the injury accident probability by 53.7%.
Chan et al. 2018
[27]
-
Accident probability for Hong Kong bridge construction was calculated and compared with the overall accident probability for the construction industry.
-
Bridge construction exhibited a higher accident rate and higher average fatality than that of the overall construction industry.
-
Safety management reinforcement is required for large-scale social infrastructure construction.
Dong et al. 2013
[6]
-
Fall fatality accident data were analyzed for the construction types of the U.S. construction industry.
-
Accident probability due to “falls” is highest for roof construction.
Dong et al. 2014
[7]
-
Accident probability was compared between apartment construction and non-apartment construction in the U.S. construction industry.
-
Accident probability is higher in apartment construction than in non-apartment construction.
-
The accident type that occurs most frequently in apartment construction is “falling”.
Grant et al. 2014
[28]
-
211 accident data of OSHA were analyzed for accurate understanding of the risks of truss construction.
-
Improper fall prevention equipment, lack of bracing, and lack of workspace presented as the main causes of fall accidents.
Konda et al. 2016
[18]
-
Fatal accident data due to brain damage in the U.S. construction industry were analyzed.
-
Based on age, workers aged 65 and over have the highest probability for fatal accidents caused by brain damage.
-
Based on work type, steel-frame workers and roof workers have the highest probability for fatal accidents caused by brain damage.
Lin et al. 2011
[29]
-
Work-related standards to prevent falls were provided by analyzing fall-related statistical data.
-
Falls are mostly related to roof work.
-
30% of fatal accidents occur due to falls from scaffolding or stairs.
Li et al. 2019
[13]
-
Fatal accidents due to “falls” in Shanghai and Wuhan, China were analyzed.
-
The probability of “fall” accidents is higher in Wuhan than in Shanghai.
Accident
costs
Health and Safety Executive (HSE) 2015
[31]
-
Work-related accident cases in the UK were analyzed and a loss cost calculation method was developed.
-
When the proportions of injured and sick workers in UK workplaces were surveyed in 2017 and 2018, it was found that the lost cost incurred by diseases represented a larger proportion even though the number of injured workers was larger.
-
It was reported that this is because sick patients had more days off than injured workers.
International
Labour Office (ILO) 2018
[32]
-
Costs incurred as a result of occupational injuries and diseases was estimated and information was provided for decision makers in developing countries.
-
The need to invest in safety management of workplaces for improved work productivity and economic efficiency was presented.
-
It was reported that it is necessary for decision makers to identify the cost required to improve safety and health in workplaces and improve their awareness.
Kim 2018
[24]
-
Accident cost was investigated by size and industry, and accident losses for employers, workers, and the government were calculated.
-
As stakeholder losses in construction are presented, awareness of safety management can be raised.
-
Research on the production levels of construction sites and the insurance premiums caused by accidents are limited.
Safe Work
Australia (SWA) 2015
[32]
-
The estimated costs resulting from work-related injuries and diseases in Australia was calculated.
-
A framework for classifying accidents by severity and estimating direct/indirect loss costs by the number of occupational accidents was developed.
Waehrer et al. 2007
[22]
-
The cost of occupational accidents in the U.S. construction industry was calculated.
-
The average cost of construction accidents in 2002 was $27,000 per case, which is approximately twice as high as that of other industries.
Weerd et al. 2014
[34]
-
A method for determining the costs caused by work-related accidents and diseases was derived.
-
During the calculation of the costs resulting from accidents and diseases, underreporting or overreporting must be prevented through sensitivity analysis for uncertainty.
Yang et al. 2009
[35]
-
Tasks that require intensive management were derived by evaluating injury and fatal accident risk for each task in the construction industry.
-
The injury accident risk was highest for carpenters while the fatal accident risk was highest for painters, requiring intensive management.
-
Labor loss cost calculations and risk by task results can be used as the risk factor for fatality loss.
Yilmaz and Çelebi 2015
[23]
-
The cost of manpower losses due to accidents at construction sites in Turkey was investigated, and the financial losses of minor and fatal occupational injuries were compared.
-
The costs resulting from accidents include not only occupational costs but also various expenses, such as accident compensation, medical expenses, penalties, court costs, and education and insurance costs.
-
Minor injuries cause significant losses in workplaces as they are not sufficiently reviewed or recorded.
Risk
assessment
Baradan and Usmen 2006
[21]
-
Accident risk scores were evaluated by specialized construction tasks by considering the frequency and intensity of accidents.
-
Accident probability was considered with frequency, and the income losses of workers was considered with intensity.
-
Among the specialized construction industry tasks, steel-frame workers and roof workers were found to have the highest integrated risk scores.
Choi and Kim 2012
[37]
-
Safety and health awareness were investigated at workplaces that apply risk assessments.
-
A survey involving clients and participants of the wider construction industry and specialized construction industry that achieved KOSHA 18,001 certification.
-
Through risk assessment, risk factors were derived in advance and activities for improvement were increased.
Dumrak et al. 2013
[38]
-
Data on 24 764 accidents were analyzed to identify the factors affecting the risk of construction accidents.
-
Worker characteristics, work environment, and unit work determine the degree of exposure to circumstances that cause accidents by triggering accident mechanisms.
Go et al. 2004
[15]
-
Based on 11-years of accident cases obtained from the Korea Occupational Safety and Health Agency, each task of the construction industry was classified into elements and detailed work, and the frequency of accidents and the degree of risk were presented for each task.
-
Concrete construction had the highest risk index, followed by earth works, lifting work, dismantling work, stone/exterior wall construction, and steel-frame construction.
Jo et al. 2017
[38]
-
The likelihood of construction accidents in the Korean construction industry was analyzed.
-
Male workers exhibited higher accident probability than female workers.
-
For the age, workers aged 40 and over showed the highest accident probability.
-
For the number of workers, workplaces with five or fewer employees showed the highest accident probability.
Leu and Chang 2013
[39]
-
A steel-frame construction risk assessment model based on the fault tree technique and Bayesian probability was developed.
-
A risk assessment model applicable to accident factors in steel-frame construction was developed.
-
The practicality of the developed model was verified by applying it to actual cases of project accidents.
Yu et al. 2017
[40]
-
Based on accident data from construction sites, the frequency of accidents and the average amount of damage for each cause behind an accident risk factor were analyzed through the Monte Carlo technique.
-
For accident causes, construction defects showed the highest frequency of accidents followed by fire, typhoons, heavy rain, and worker carelessness.
-
For accident causes, theft exhibited the largest average amount of damage followed by heavy rain etc.
Table 2. Classification of collected data.
Facility TypeNumber of Annual Fatal AccidentsNumber of Annual Injury Causing AccidentsNumber of Annual AccidentsAnnual Construction Costs (Million Dollars)
Residential buildings27.98626.88654.8555,516
Factories14.31166.89181.2023,356
Tourist resting facilities0.332.933.254935
Education and research facilities5.20148.02153.226113
Neighborhood living facilities11.06144.11155.1713,148
Houses3.2530.2533.515452
Cultural and assembly facilities2.9350.7553.681403
Lodging facilities1.9533.1835.134439
Business facilities10.41184.45194.8624,154
Sports facilities0.9813.6614.64857
Transportation facilities0.9815.2916.27839
Storage and treatment facilities for hazardous substances0.004.234.232730
Medical facilities2.6024.7227.332690
Religious facilities0.6524.0724.72900
Warehouse facilities15.2930.9046.194533
Sales facilities3.5838.3941.976512
Miscellaneous facilities4.2348.8053.036387
Sum105.731587.521693.25163,965
Table 3. Cost per fatal and injury causing accident.
SeverityCost per Accident (Million Dollars)
Fatal15.56 × 10−1
Injury1.34 × 10−1
Table 4. Analysis of accident probability for 17 facility types using Bayesian probability.
Facility TypeNumber of Accidents (Annually)Accident Probability
(Accidents/Million Dollars)
(Annually)
Residential buildings654.8511.78 × 10−3
Factories181.207.78 × 10−3
Tourist resting facilities3.250.67 × 10−3
Education and research facilities153.2224.70 × 10−3
Neighborhood living facilities155.1711.78 × 10−3
Houses33.516.17 × 10−3
Cultural and assembly facilities53.6837.21 × 10−3
Lodging facilities35.137.93 × 10−3
Business facilities194.868.09 × 10−3
Sports facilities14.6416.97 × 10−3
Transportation facilities16.2719.21 × 10−3
Storage and treatment facilities for hazardous substances4.231.56 × 10−3
Medical facilities27.3310.16 × 10−3
Religious facilities24.7226.99 × 10−3
Warehouse facilities46.1910.19 × 10−3
Sales facilities41.976.47 × 10−3
Miscellaneous facilities53.038.32 × 10−3
Table 5. Analysis of accident costs for 17 construction facility types.
Facility TypeAccident Costs (Million Dollars)
Residential buildings127.29
Factories44.57
Tourist resting facilities0.90
Education and research facilities27.88
Neighborhood living facilities36.47
Houses9.10
Cultural and assembly facilities11.34
Lodging facilities7.47
Business facilities40.84
Sports facilities3.34
Transportation facilities3.56
Storage and treatment facilities for hazardous substances0.57
Medical facilities7.35
Religious facilities4.23
Warehouse facilities27.92
Sales facilities10.70
Miscellaneous facilities13.10
Table 6. Calculation of risk ranking for 17 construction facility types using normalized method.
Facility TypeNPRNLRANR
Residential buildings11.83 (7)0.00 (1)5.92 (1)
Factories13.69 (13)11.10 (2)12.39 (6)
Tourist resting facilities17.00 (17)16.96 (16)16.98 (17)
Education and research facilities5.82 (3)13.34 (6)9.58 (3)
Neighborhood living facilities11.83 (6)12.18 (4)12.01 (5)
Houses14.44 (15)15.85 (10)15.15 (15)
Cultural and assembly facilities0.00 (1)15.56 (8)7.78 (2)
Lodging facilities13.62 (12)16.07 (11)14.85 (13)
Business facilities13.55 (11)11.60 (3)12.57 (8)
Sports facilities9.42 (5)16.63 (15)13.02 (10)
Transportation facilities8.37 (4)16.60 (14)12.49 (7)
Storage and treatment facilities for hazardous substances16.58 (16)17.00 (17)16.79 (16)
Medical facilities12.58 (9)16.09 (12)14.34 (11)
Religious facilities4.75 (2)16.51 (13)10.63 (4)
Warehouse facilities12.57 (8)13.33 (5)12.95 (9)
Sales facilities14.30 (14)15.64 (9)14.97 (14)
Miscellaneous facilities13.44 (10)15.32 (7)14.38 (12)
Table 7. Clustering of risk level for 17 construction facility types.
Facility TypeANRRisk Level Group
Residential buildings5.92 (1)5
Cultural and assembly facilities12.39 (6)4
Education and research facilities16.98 (17)3
Religious facilities9.58 (3)3
Neighborhood living facilities12.01 (5)2
Factories15.15 (15)2
Transportation facilities7.78 (2)3
Business facilities14.85 (13)2
Warehouse facilities12.57 (8)2
Sports facilities13.02 (10)3
Medical facilities12.49 (7)1
Miscellaneous facilities16.79 (16)1
Lodging facilities14.34 (11)1
Sales facilities10.63 (4)1
Houses12.95 (9)1
Storage and treatment facilities for hazardous substances14.97 (14)1
Tourist resting facilities14.38 (12)1
Table 8. Construction project carried out by ‘L’ contractor in 2017.
Facility TypeThe Number of ProjectsRisk Level Group
Residential building85
Tourist resting facilities33
Business facilities22
Education and research facilities11
Warehouse facilities11
Disclaimer/Publisher’s Note: The statements, opinions and data contained in all publications are solely those of the individual author(s) and contributor(s) and not of MDPI and/or the editor(s). MDPI and/or the editor(s) disclaim responsibility for any injury to people or property resulting from any ideas, methods, instructions or products referred to in the content.

