1. Introduction
As global temperatures continue to rise, the ecological environment continues to deteriorate and resources become increasingly scarce, people gradually realize the importance of sustainable development and begin to vigorously promote energy conservation and environmental protection [
1,
2,
3,
4,
5,
6,
7,
8,
9,
10]. As the main product of construction steel, if the properties of steel reinforcement can be improved, it can also reduce the amount of steel used and save energy while improving structural safety reserves, which is of great significance in promoting the structural adjustment of the construction industry and promoting transformation and upgrading [
11]. International research on the application of high-strength steel reinforcement began in the 1970s, and after decades of development, developed countries have widely used 400 MPa grade steel reinforcement in the construction field; and 500 MPa grade high-strength steel reinforcement become the mainstream in some countries; and the use of 600 MPa grade steel reinforcement has occupied a considerable scale, and is actively promoting new 700 MPa high-strength steel reinforcement [
12].
As the transfer hub of the frame structure, the joints are subjected to bending moments and shear forces at the beam ends as well as column axial forces, shear forces and bending moments, and are subjected to complex forces, thus becoming the weakest link in the frame structure [
13].
In Japan, a five-year national research project was carried out in the late 1980s to investigate the use of high-strength reinforcement with yield strengths of 400–1200 MPa and high-strength concrete in engineering applications [
14]. For joints, based on theoretical analysis as well as experimental verification [
15,
16,
17,
18,
19], it was found that poor joint energy dissipation was caused by bond degradation of the beam reinforcement running through the joint, but that bond slip could be effectively addressed through rational joint design; tests showed that the shear capacity of three-dimensional joints was higher than that of two-dimensional joints.
Brooke et al. [
20] carried out four beam-column joint tests designed to assess the accuracy of the New Zealand code design conditions relating to bond strength at beam-column joints when applied to large diameter, high strength reinforcement. The results of the tests indicated that the New Zealand code requirements were too conservative and suggested that the conditions in the code to prevent bond failure at beam-column joints should be relaxed. In addition, it was shown that a large amount of vertical shear reinforcement was effective in improving bond properties in the joint region, but that horizontal shear reinforcement had little effect on bond properties.
Liu et al. [
21] carried out seismic tests on four full-scale assembled concrete beam-column joints (including two central joints and two side joints) configured with Hot-rolled Ribbed Bar (HRB) 500 high-strength reinforcement and found that the high-strength joints still had good deformation and energy dissipation capacities when the beam ends yielded first, but the use of large diameter and large spacing reinforcement forms did not significantly improve the seismic performance of the joints.
Alaee and Li [
15] designed five full-scale beam-column joints with 700 MPa grade high-strength reinforcement according to ACI 318-14 code [
22], and explored the effects of concrete and reinforcement strength and axial compression ratio on the seismic performance of the joints through proposed static tests. The results show that the use of higher grade reinforcement in the nodal beams results in a slight reduction in bond strength in the joint region; however, increasing the strong concrete strength and axial pressure ratio can improve the bond condition of the beam reinforcement in the core region, allowing ductile damage to occur in the specimens.
Zhang et al. [
23,
24] and Rong et al. [
25,
26] carried out a series of tests on concrete beam-column joints with high-strength reinforcement. The results showed that, compared with ordinary reinforced concrete joints, the configuration of high-strength reinforcement could increase the shear capacity of the joints, slow down the degradation rate of stiffness and improve the joint hysteresis characteristics, while reducing the axial compression ratio of the joints or increasing the joint stirrups could improve the plastic rotation capacity of the beam ends of high-strength reinforcement joints. It was also found that the use of high-strength reinforcement with high-strength concrete not only improves the bearing capacity of the specimens, but also improves the failure modes.
To further promote the use of high-strength reinforcement in concrete structures, a new type of high-strength reinforcement, Cold-rolled Ribbed Bar (CRB) 735, is innovatively used in concrete planar frame joints in this paper. Seven specimens were designed and fabricated according to existing specifications,
GB50010-2010 Code for Design of Concrete Structures [
27], including six new high-strength reinforcement joints and one HRB400 ordinary joint. The seismic performance of the joints was analyzed in detail by means of cyclic load tests.
4. Test Results
4.1. Test Phenomena
4.1.1. Cruciform Joints
(1) Specimen ZJ-1
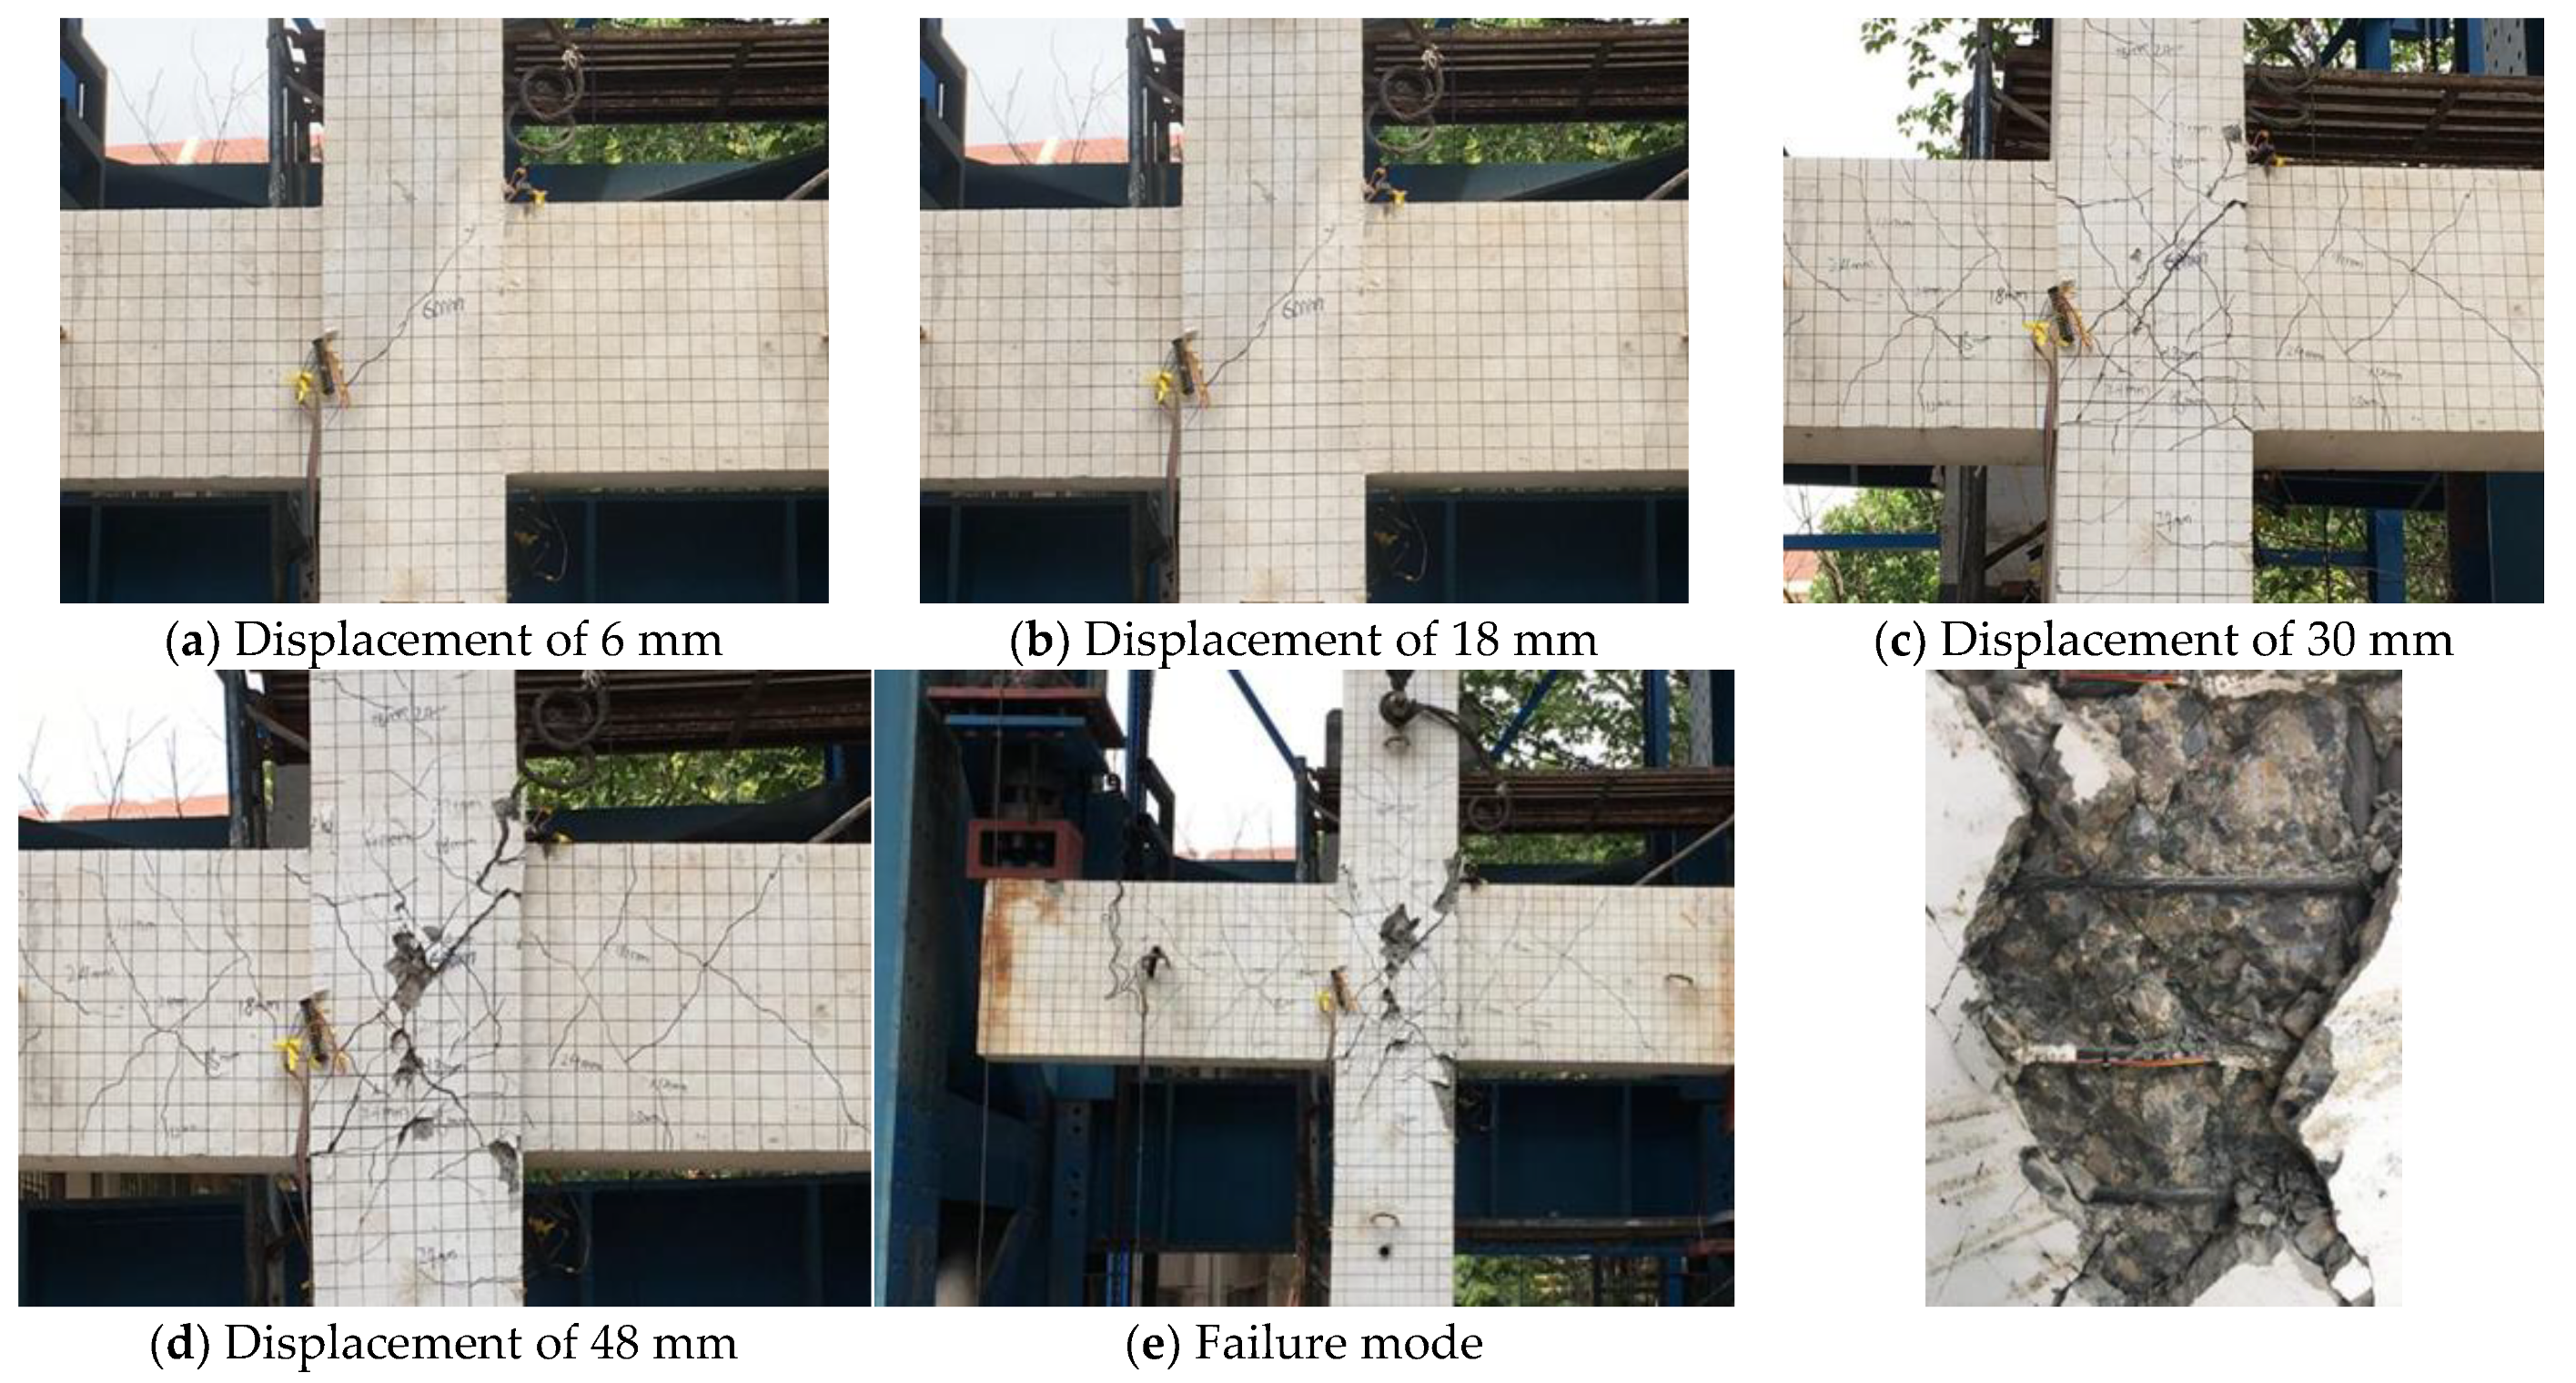
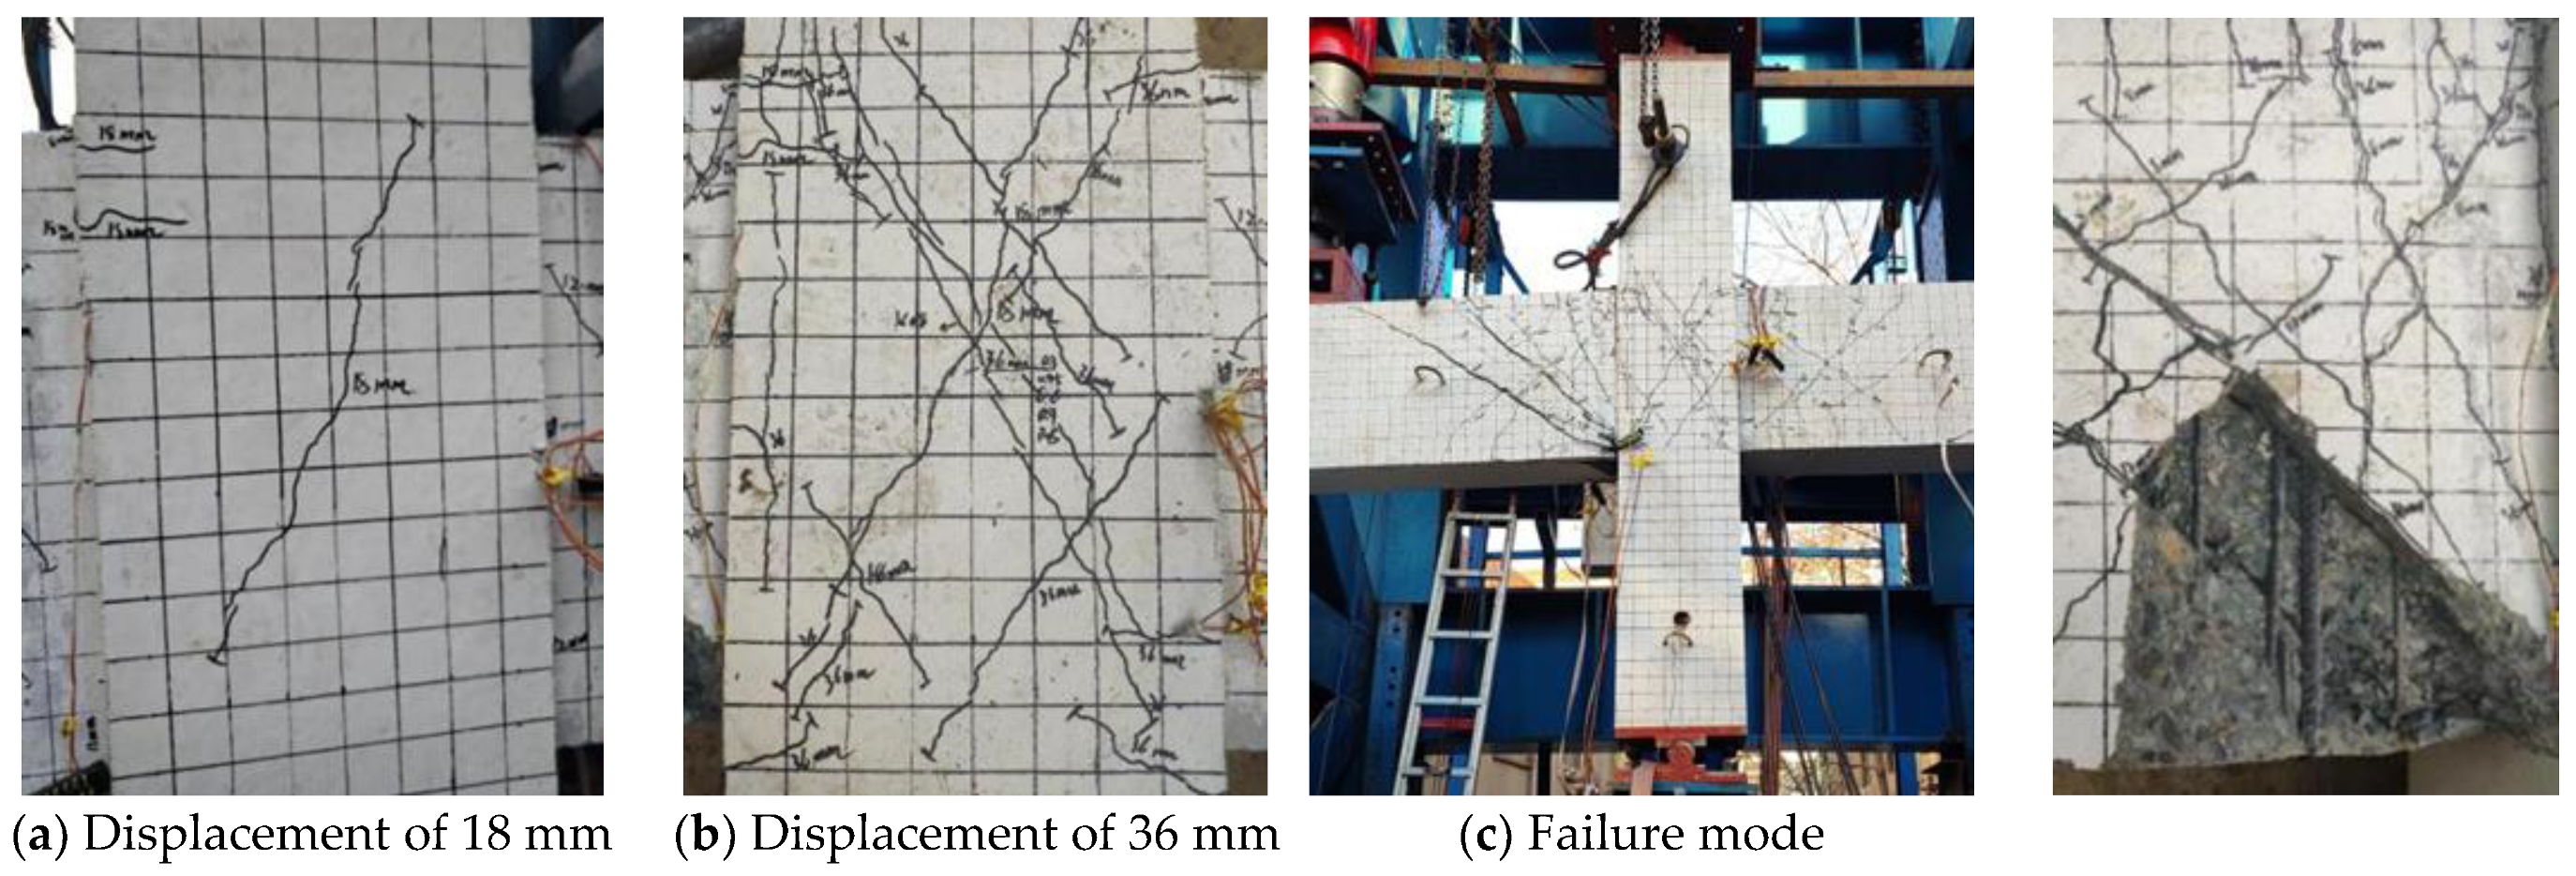
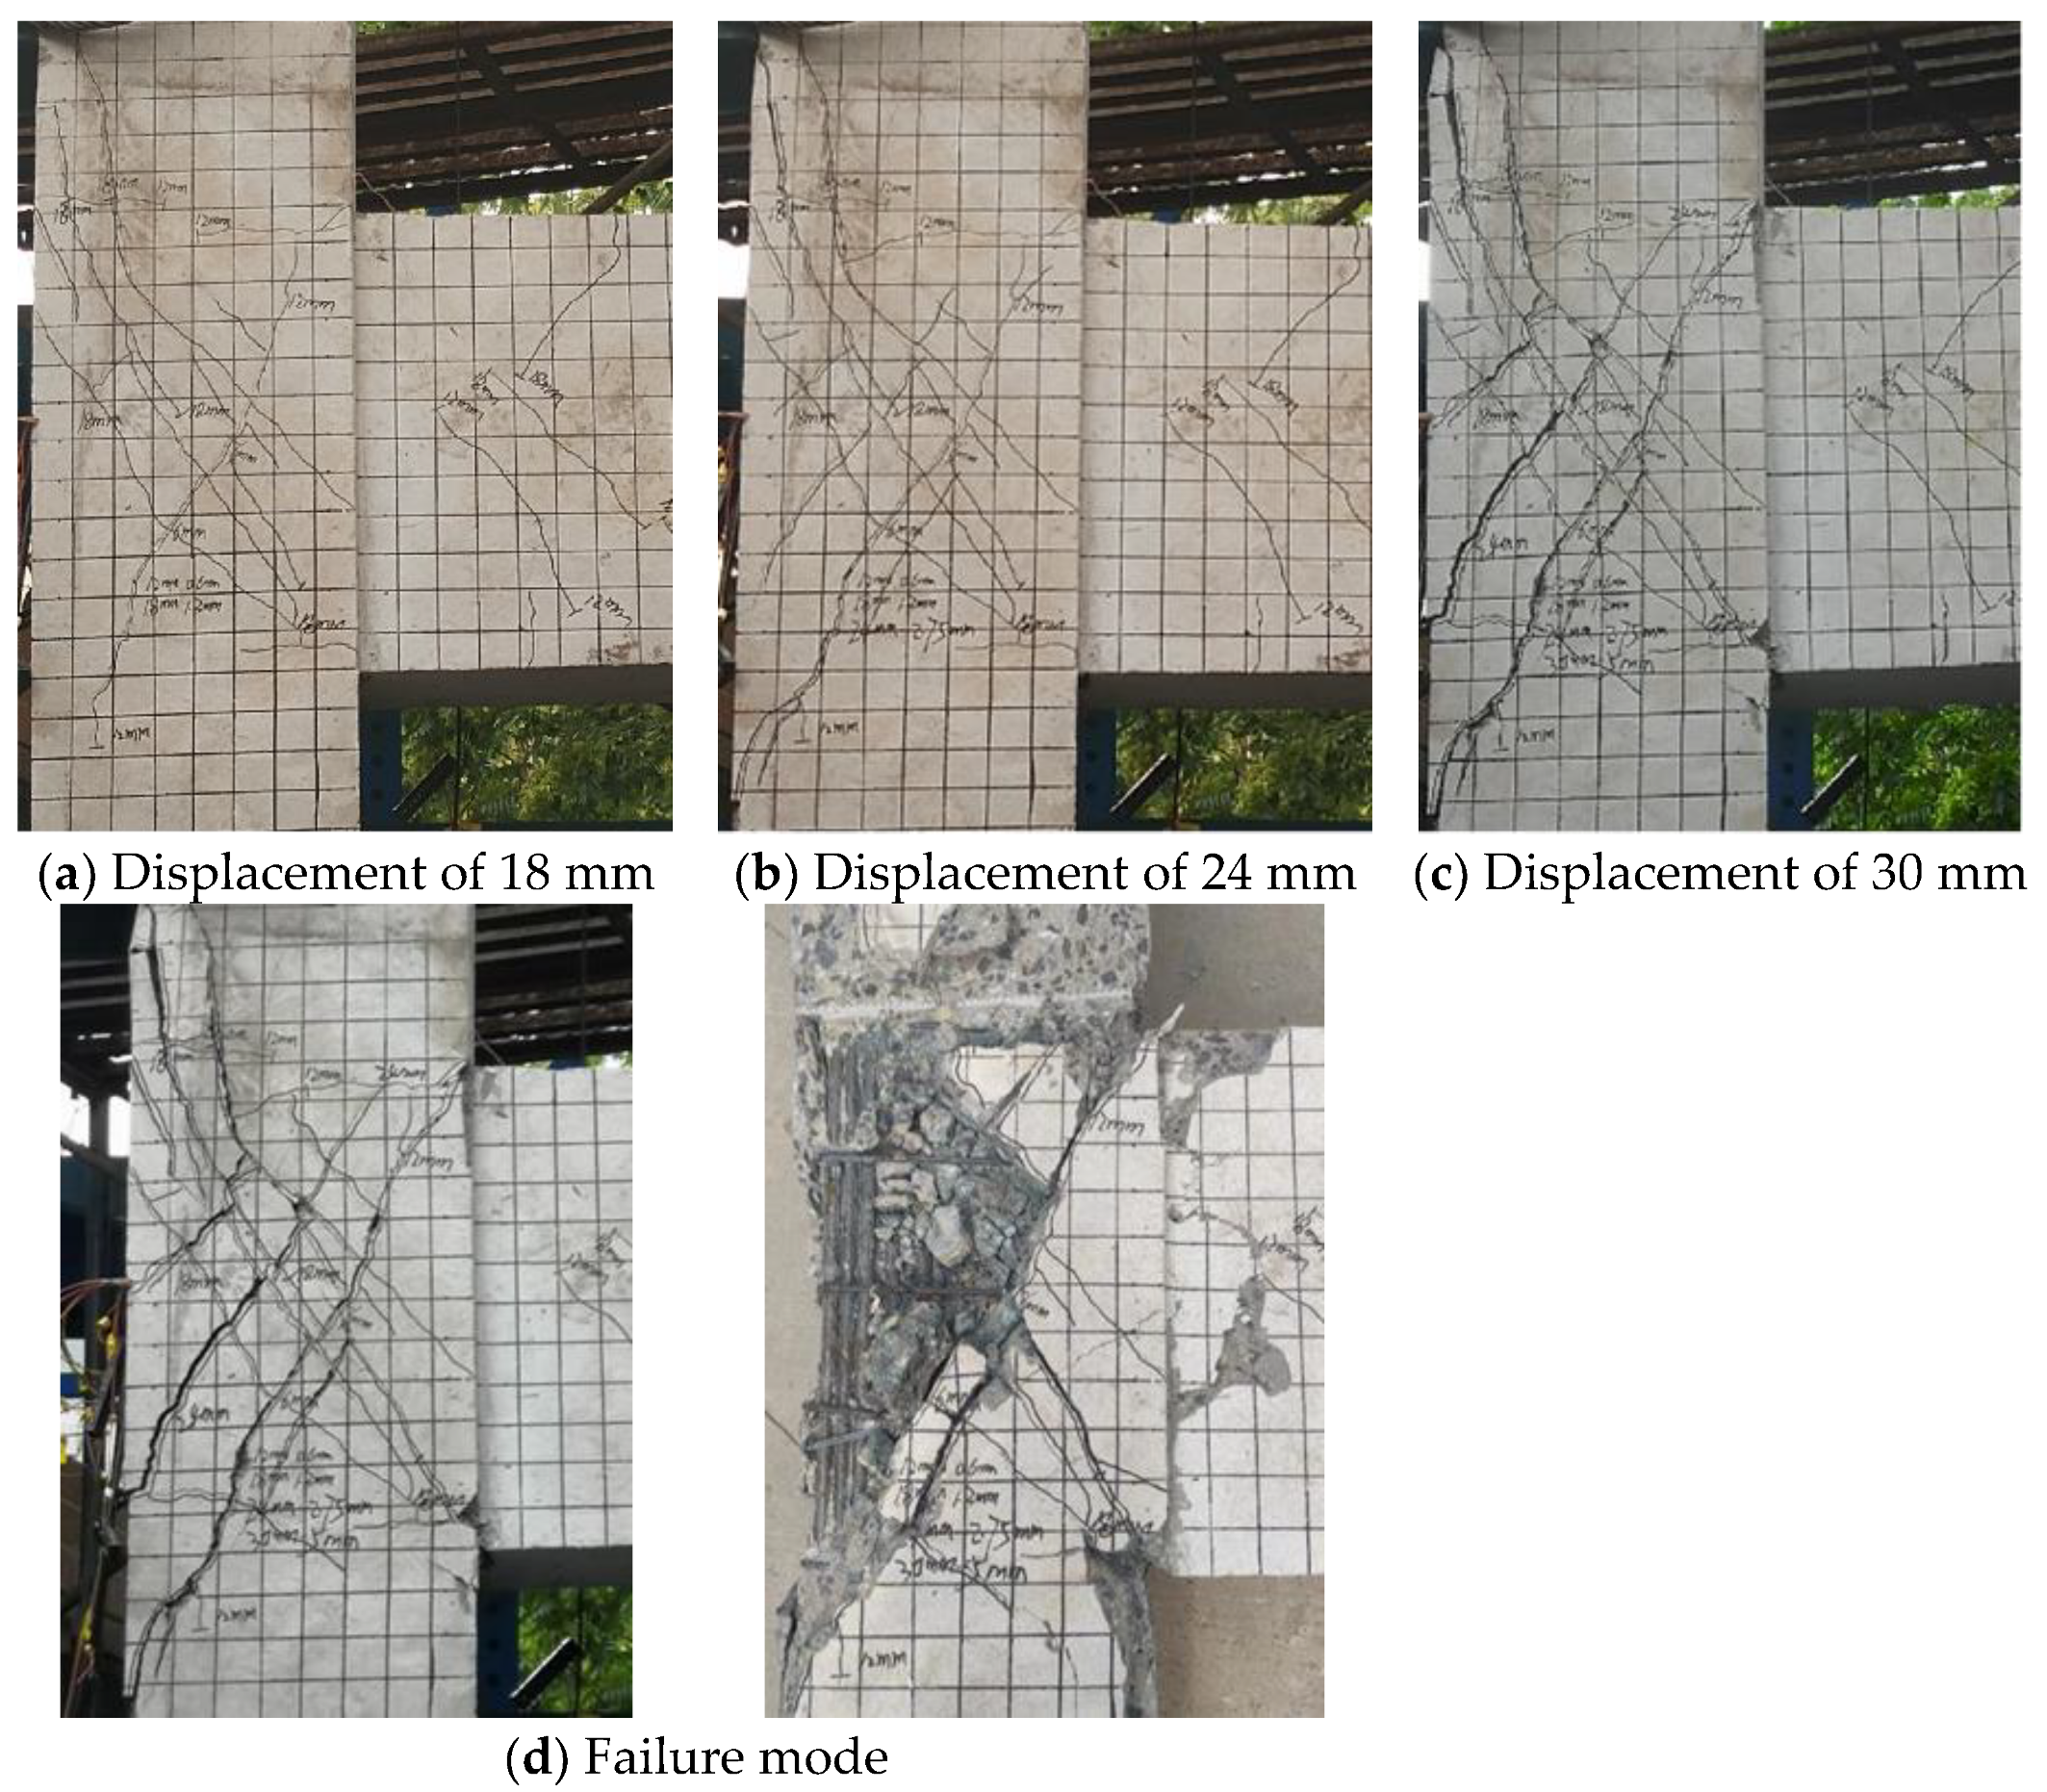
For specimen ZJ-1, when the beam end displacement was 6 mm, the first minor diagonal crack appeared, oriented parallel to the diagonal of the joint core, but not yet penetrating the joint. When loaded to 12 mm, the original diagonal crack penetrates the joint and several new parallel diagonal cracks are added to the core. At this point bending and shear cracks appear at the left beam end. When the displacement at the beam end reaches 18 mm, several new diagonal cracks cross the joint core and reach a maximum width of 0.15 mm. When the displacement is loaded to 24 mm, the maximum width of the diagonal cracks reaches 0.35 mm and the concrete protection layer starts to fall off. When the load is cycled at 30 mm, no new cracks appear in the core area and the existing cracks expand to form two main cracks with a maximum width of 0.60 mm. When the beam end is cycled to 36 mm, the joint reaches its maximum shear capacity with a positive ultimate load of 334.4 kN and a negative load of 336.4 kN, at which point the cracks reach a width of 0.90 mm. The concrete in the core area gradually broke. When the load reached 48 mm, the concrete protection layer in the core area was spalling off and the stirrups were exposed. When the displacement was loaded to 54 mm, the concrete in the core area was sheared and the stirrup was deformed and the joint load dropped to 270 kN. The crack development and failure of the specimen is shown in
Figure 11.
(2) Specimen ZJ-2
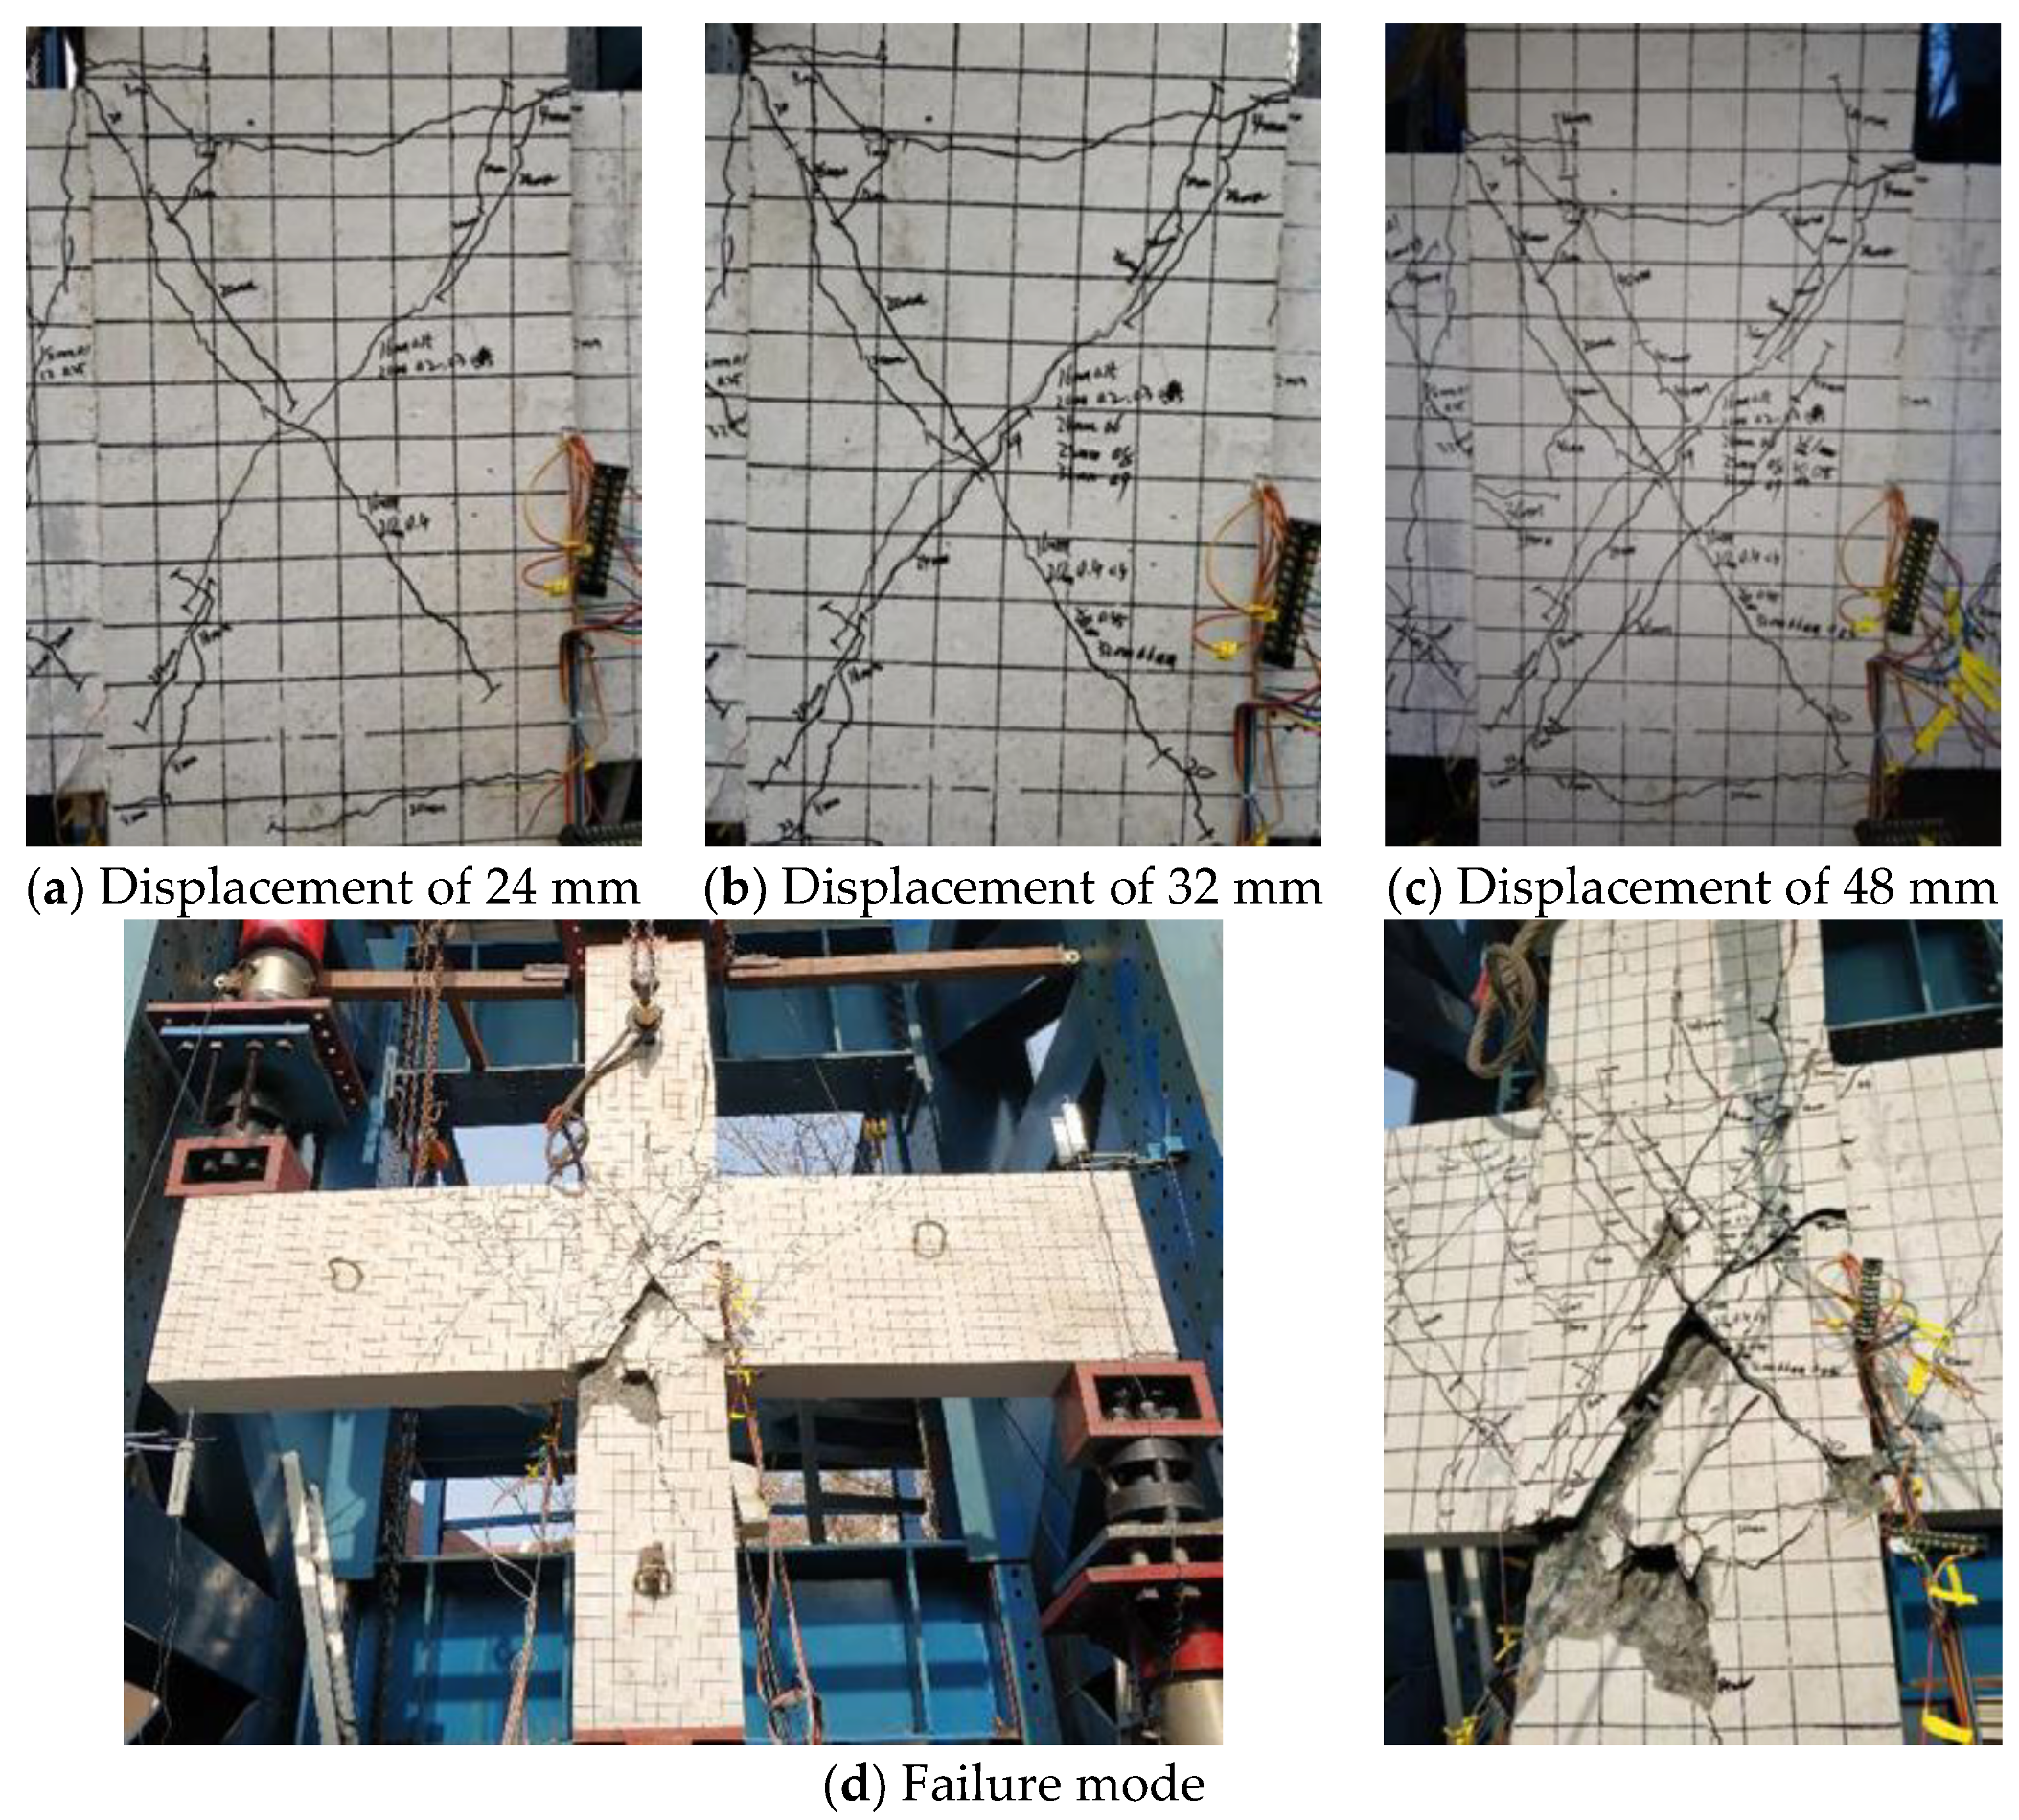
For specimen ZJ-2, the first diagonal crack appeared in the core when the beam end displacement was applied to 8 mm. At this point a bending crack appears in the left beam, extending to one-third of the beam height. As the beam end displacements cycled at 16 mm and 32 mm, cross cracks continued to appear in the core zone and the original diagonal cracks continued to develop. When the load reaches 40 mm, the existing diagonal cracks in the core area extend and converge, and the main diagonal crack begins to form, with a width of 1.30 mm. At this point the load reaches its peak, with a positive ultimate load of 317.9 kN and a negative of 319.3 kN. When the displacement is cyclically loaded at 56 mm, the protective layer of concrete in the core area spalls off significantly. At this point the maximum width of the main diagonal crack reached 2.75 mm, the peak load dropped to 209 kN and shear failure occurred at the joint. The crack development and failure mode of the specimen is shown in
Figure 12.
(3) Specimen ZJ-2A
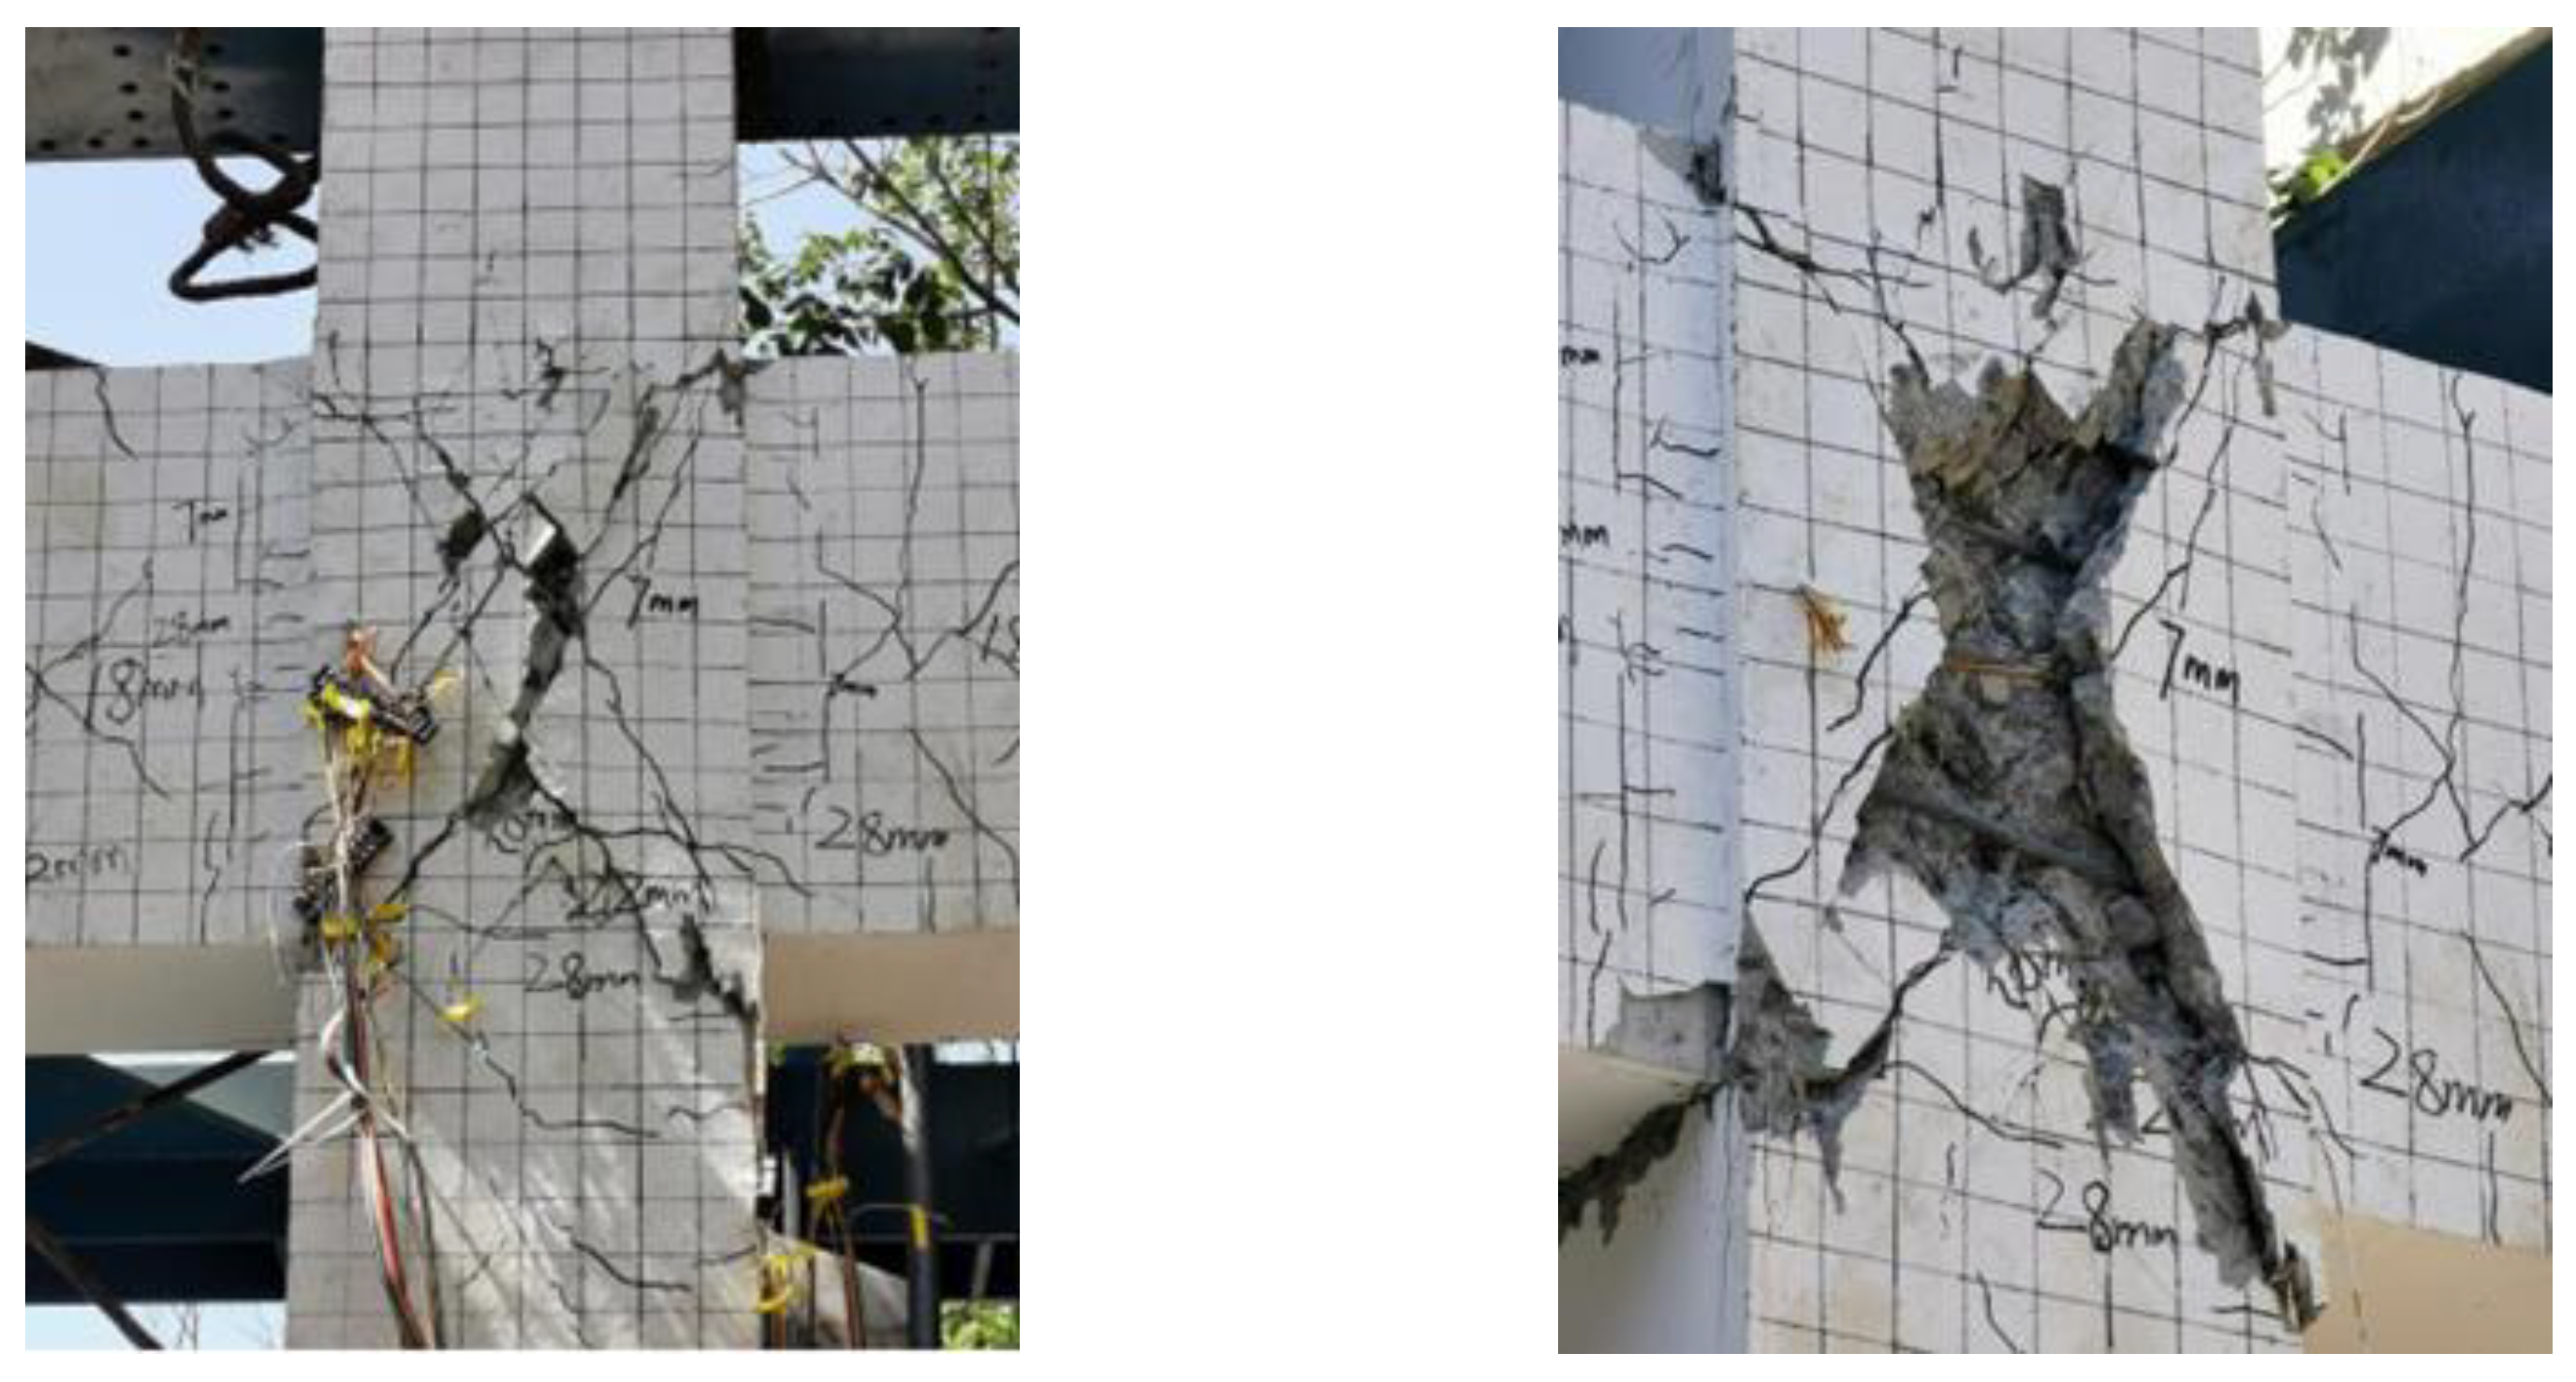
For specimen ZJ-2A, until the displacement reaches 8 mm, bending shear cracks start to appear in both beams and are mainly concentrated in the upper of the left beam, with the loading proceeding the beam cracks rapidly extend down to two-thirds of the beam height. When the load reaches 12 mm, a number of bending shear diagonal cracks are added to the lower of the right beam and gradually extend to three quarters of the beam height. The first diagonal crack appeared in the joint core when the load reached 18 mm at the beam ends. When the 36 mm load was applied to the second cycle, two main diagonal cracks suddenly formed on the left beam and penetrated the beam height, with a maximum crack width of 5.5 mm and a rapid drop in load. The crack development and failure of the specimen is shown in
Figure 13.
(4) Specimen ZJ-3
For specimen ZJ-3, the first diagonal crack appeared in the joint core when the displacement was loaded to 6 mm. When the displacement reaches 18 mm, cross cracks are formed in the core, with the widest cracks of 0.9 mm, and when the displacement reaches 24 mm, several new minor cross cracks are added to the core. At this stage, the bending and shear cracks in the beams are developing rapidly, with cracks extending to one-half of the beam height. When the displacement reaches 36 mm, the main cracks expand and the concrete protection layer on both sides of the crack starts to spall. When the displacement reaches 42 mm, the joint-bearing capacity reaches its maximum, with a positive ultimate load of 343.0 kN and a negative load of 355.6 kN. When the loading continues until the displacement at the beam ends reaches 54 mm, the concrete in the core is sheared, the protective layer is spalled off and the stirrups are exposed and deformed. The crack development and failure mode of the specimen are shown in
Figure 14.
(5) Specimen ZJ-4
For specimen ZJ-4, when the beam end was loaded at a displacement of 4 mm, three diagonal cracks appeared in the core parallel to the diagonal. When the beam ends were loaded to 16 mm, three new diagonal cracks were added in the other diagonal direction and crossed the original cracks to form a network with a maximum width of 1.75 mm. At this point cross bending shear diagonal cracks were formed on both beams. When loaded to 36 mm, the load reached a peak of 327.1 kN in the positive direction and 319.2 kN in the negative, and the load dropped significantly when the protective layer spalling was severe and the stirrups were exposed during the 56 mm cycles. The crack development and failure mode of the specimen is shown in
Figure 15.
4.1.2. Side Joints
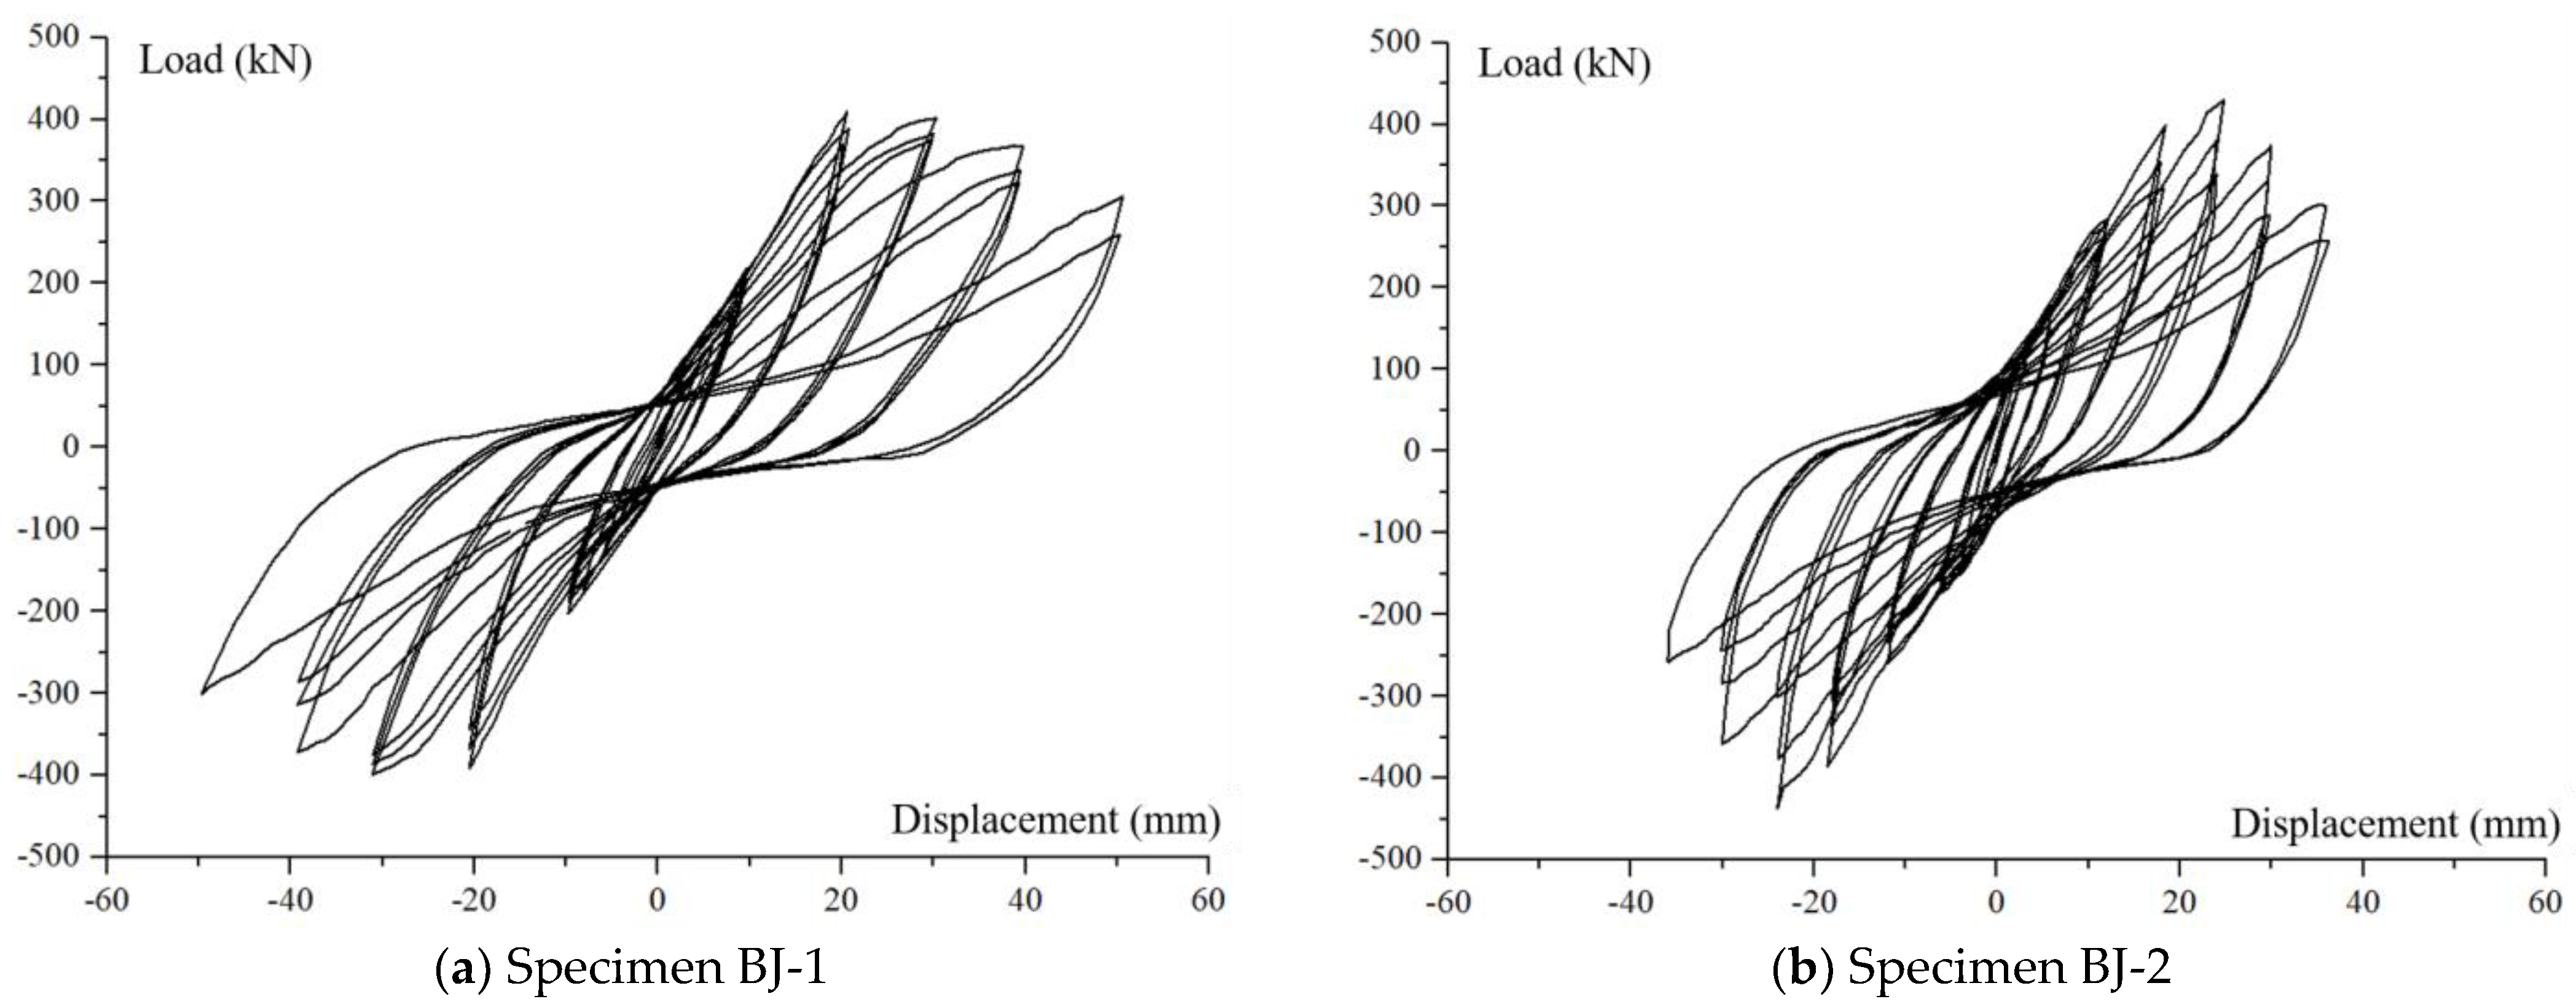
(1) Specimen BJ-1
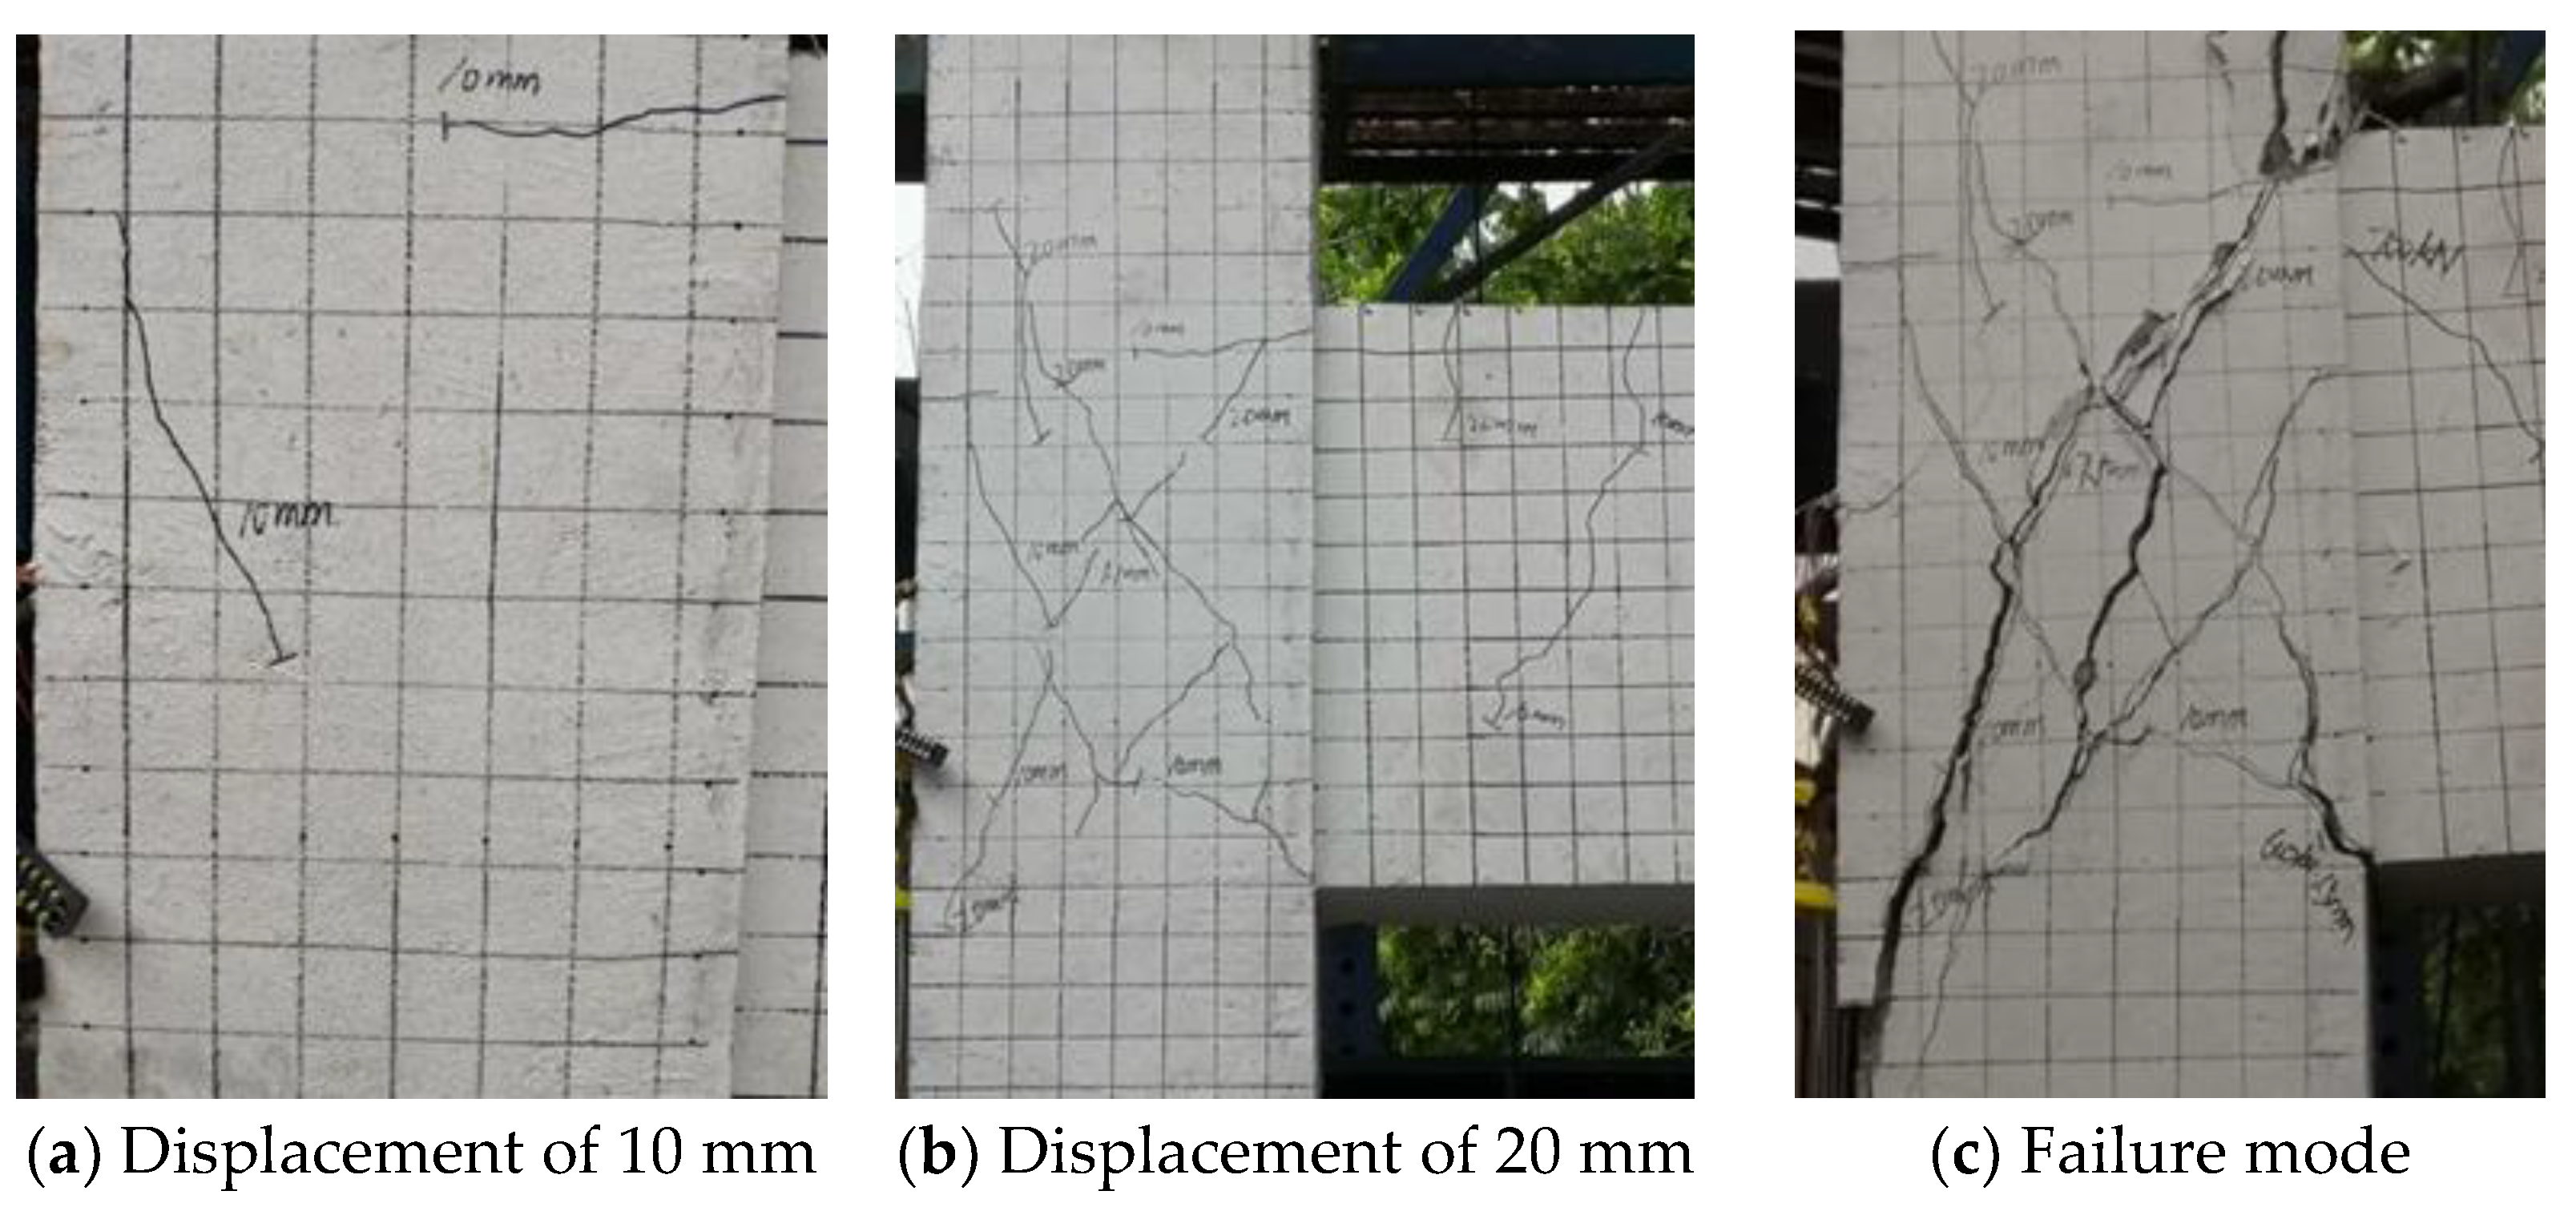
For specimen BJ-1, when the displacement was loaded to 10 mm, two cross diagonal cracks appeared in the joint core. When the displacement reached 20 mm, the original diagonal cracks in the core rapidly crossed the diagonal while several new diagonal cracks were added, with the widest reaching 1.10 mm. When the beam end was loaded at 40 mm, the peak load started to drop, but the damage to the concrete protection layer in the core was not yet serious, at which time the main diagonal cracks expanded to 1.50 mm wide. When the beam end was cyclically loaded at 50 mm, the peak load dropped to about 300 kN and shear failure to the core occurred. The crack development and failure mode of the specimen is shown in
Figure 16.
(2) Specimen BJ-2
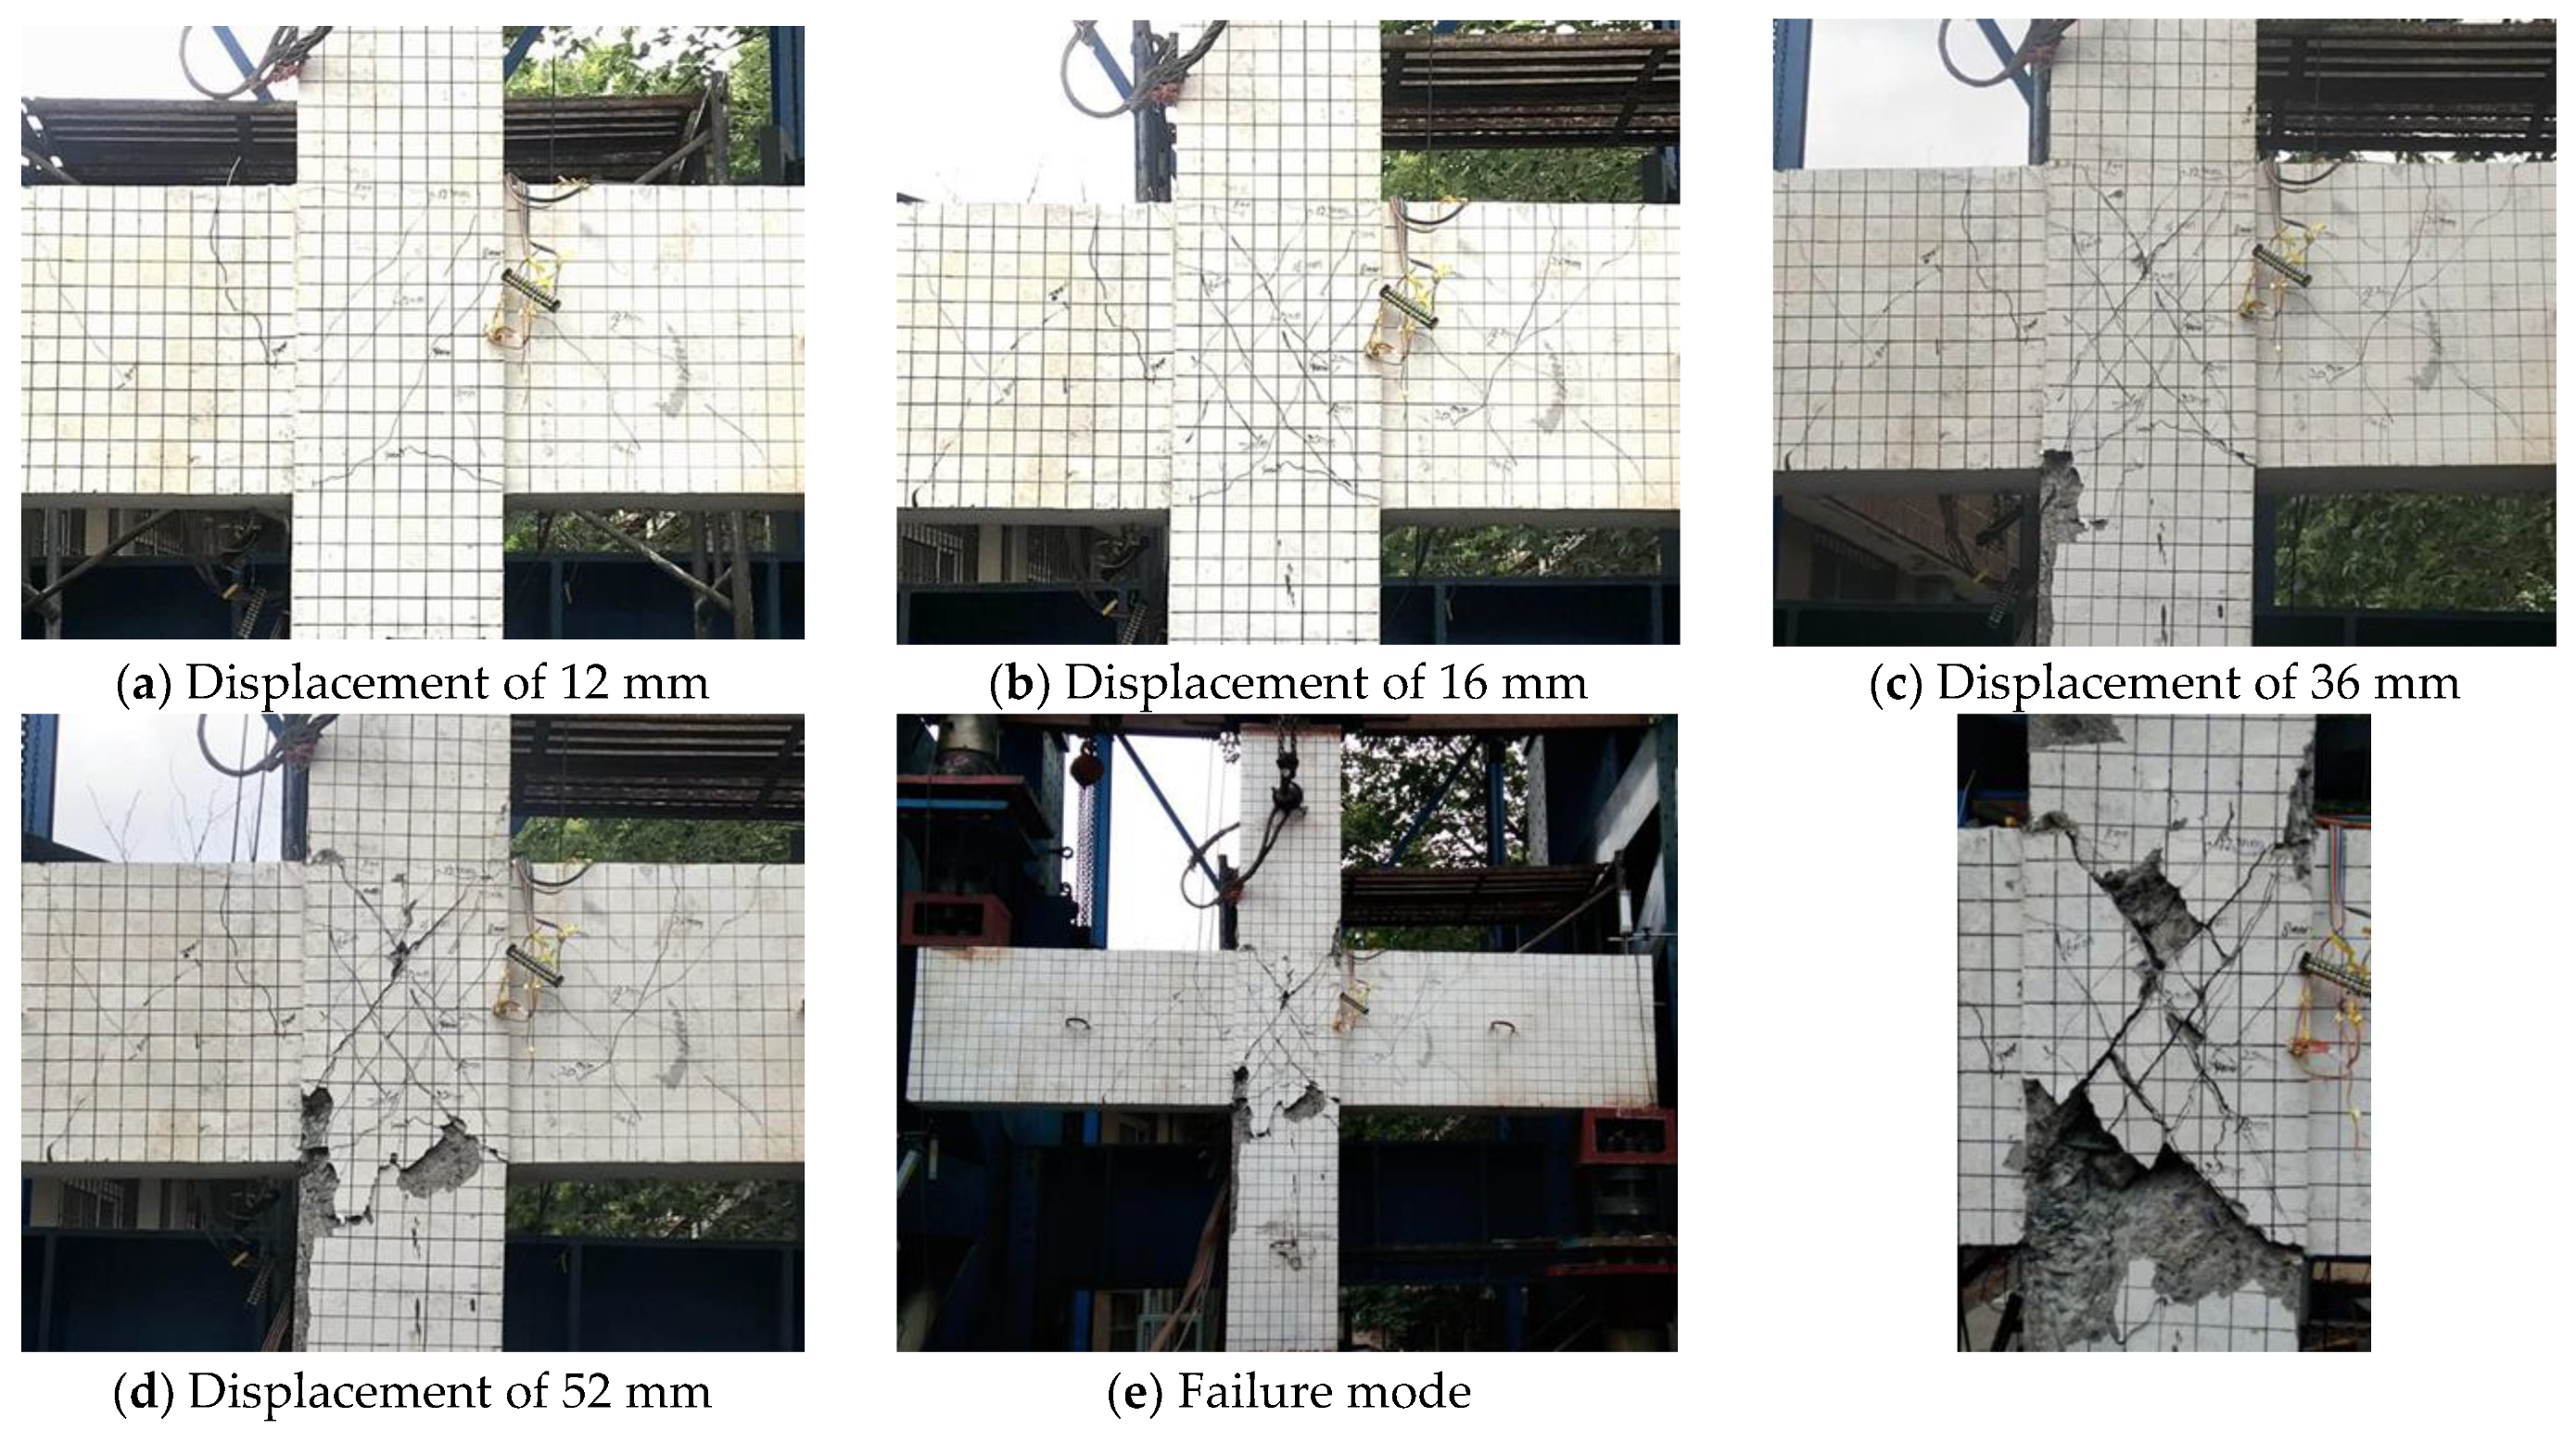
For specimen BJ-2, the first diagonal crack appeared in the joint core when the displacement reaches 6 mm. When the loading reaches the second cycle of 12 mm, several new shear diagonal cracks are added in the core along the other diagonal direction. When the displacement reaches 24 mm, the joint shear capacity reaches its maximum, with a positive ultimate load of 429.3 kN and a negative of 437.3 kN. As the loading progressed, main cracks developed rapidly extending to one-half the column height, forming a crack up to 8 mm wide on the surface of the protective layer. As the beam end continued to be loaded to 30 mm, the original cracks became wider and four symmetrical main cracks were formed on the upper and lower sides of the core, with the widest crack reaching 5.0 mm. When the beam end was cyclically loaded at 36 mm, the concrete in the core broke down severely and the protective layer spalled off rapidly, resulting in shear damage to the joint. The crack development and failure mode of the specimen is shown in
Figure 17.
4.2. Analysis of Failure Modes
(1) For all the specimens with CRB735, the failure modes are consistent with the design principle, which is joint shear failure. For specimen ZJ-2A with ordinary reinforcement, the failure mode is shear damage at the beam end. This indicates that when designing HRB400 ordinary reinforced concrete joints according to
GB50010-2010 Code for Design of Concrete Structures [
27], the shear capacity of the core will have a higher safety reserve, resulting in the actual shear capacity of the joint core in this paper being higher than the shear capacity of the beam ends, and therefore the shear failure occurs at the beam end before the core.
(2) Comparing the two groups of specimens with the same axial compression ratio and different volumetric stirrup ratios in the core area, it was found that the specimens with smaller volumetric stirrup ratio had fewer cracks during loading and the cracks would widen rapidly as the displacement increased. For the specimens with a larger stirrup ratio, the width of the cross cracks in the core was small but the number of cracks increased significantly. When loaded to the joint failure stage, excessive cracks split the concrete into smaller blocks, resulting in large areas of concrete protection falling off.
(3) Comparing three groups of specimens with the same volumetric stirrup ratios in the core area and different axial compression ratios, it was found that the larger the axial compression ratio, the wider the diagonal cracks tended to be for the same displacement. The authors suggest that this phenomenon is due to the fact that increasing the axial compression ratio increases the load on the “diagonal compression bar mechanism” in the core, and the concrete is always under high pressure stress, resulting in more severe failure and therefore wider cracks.
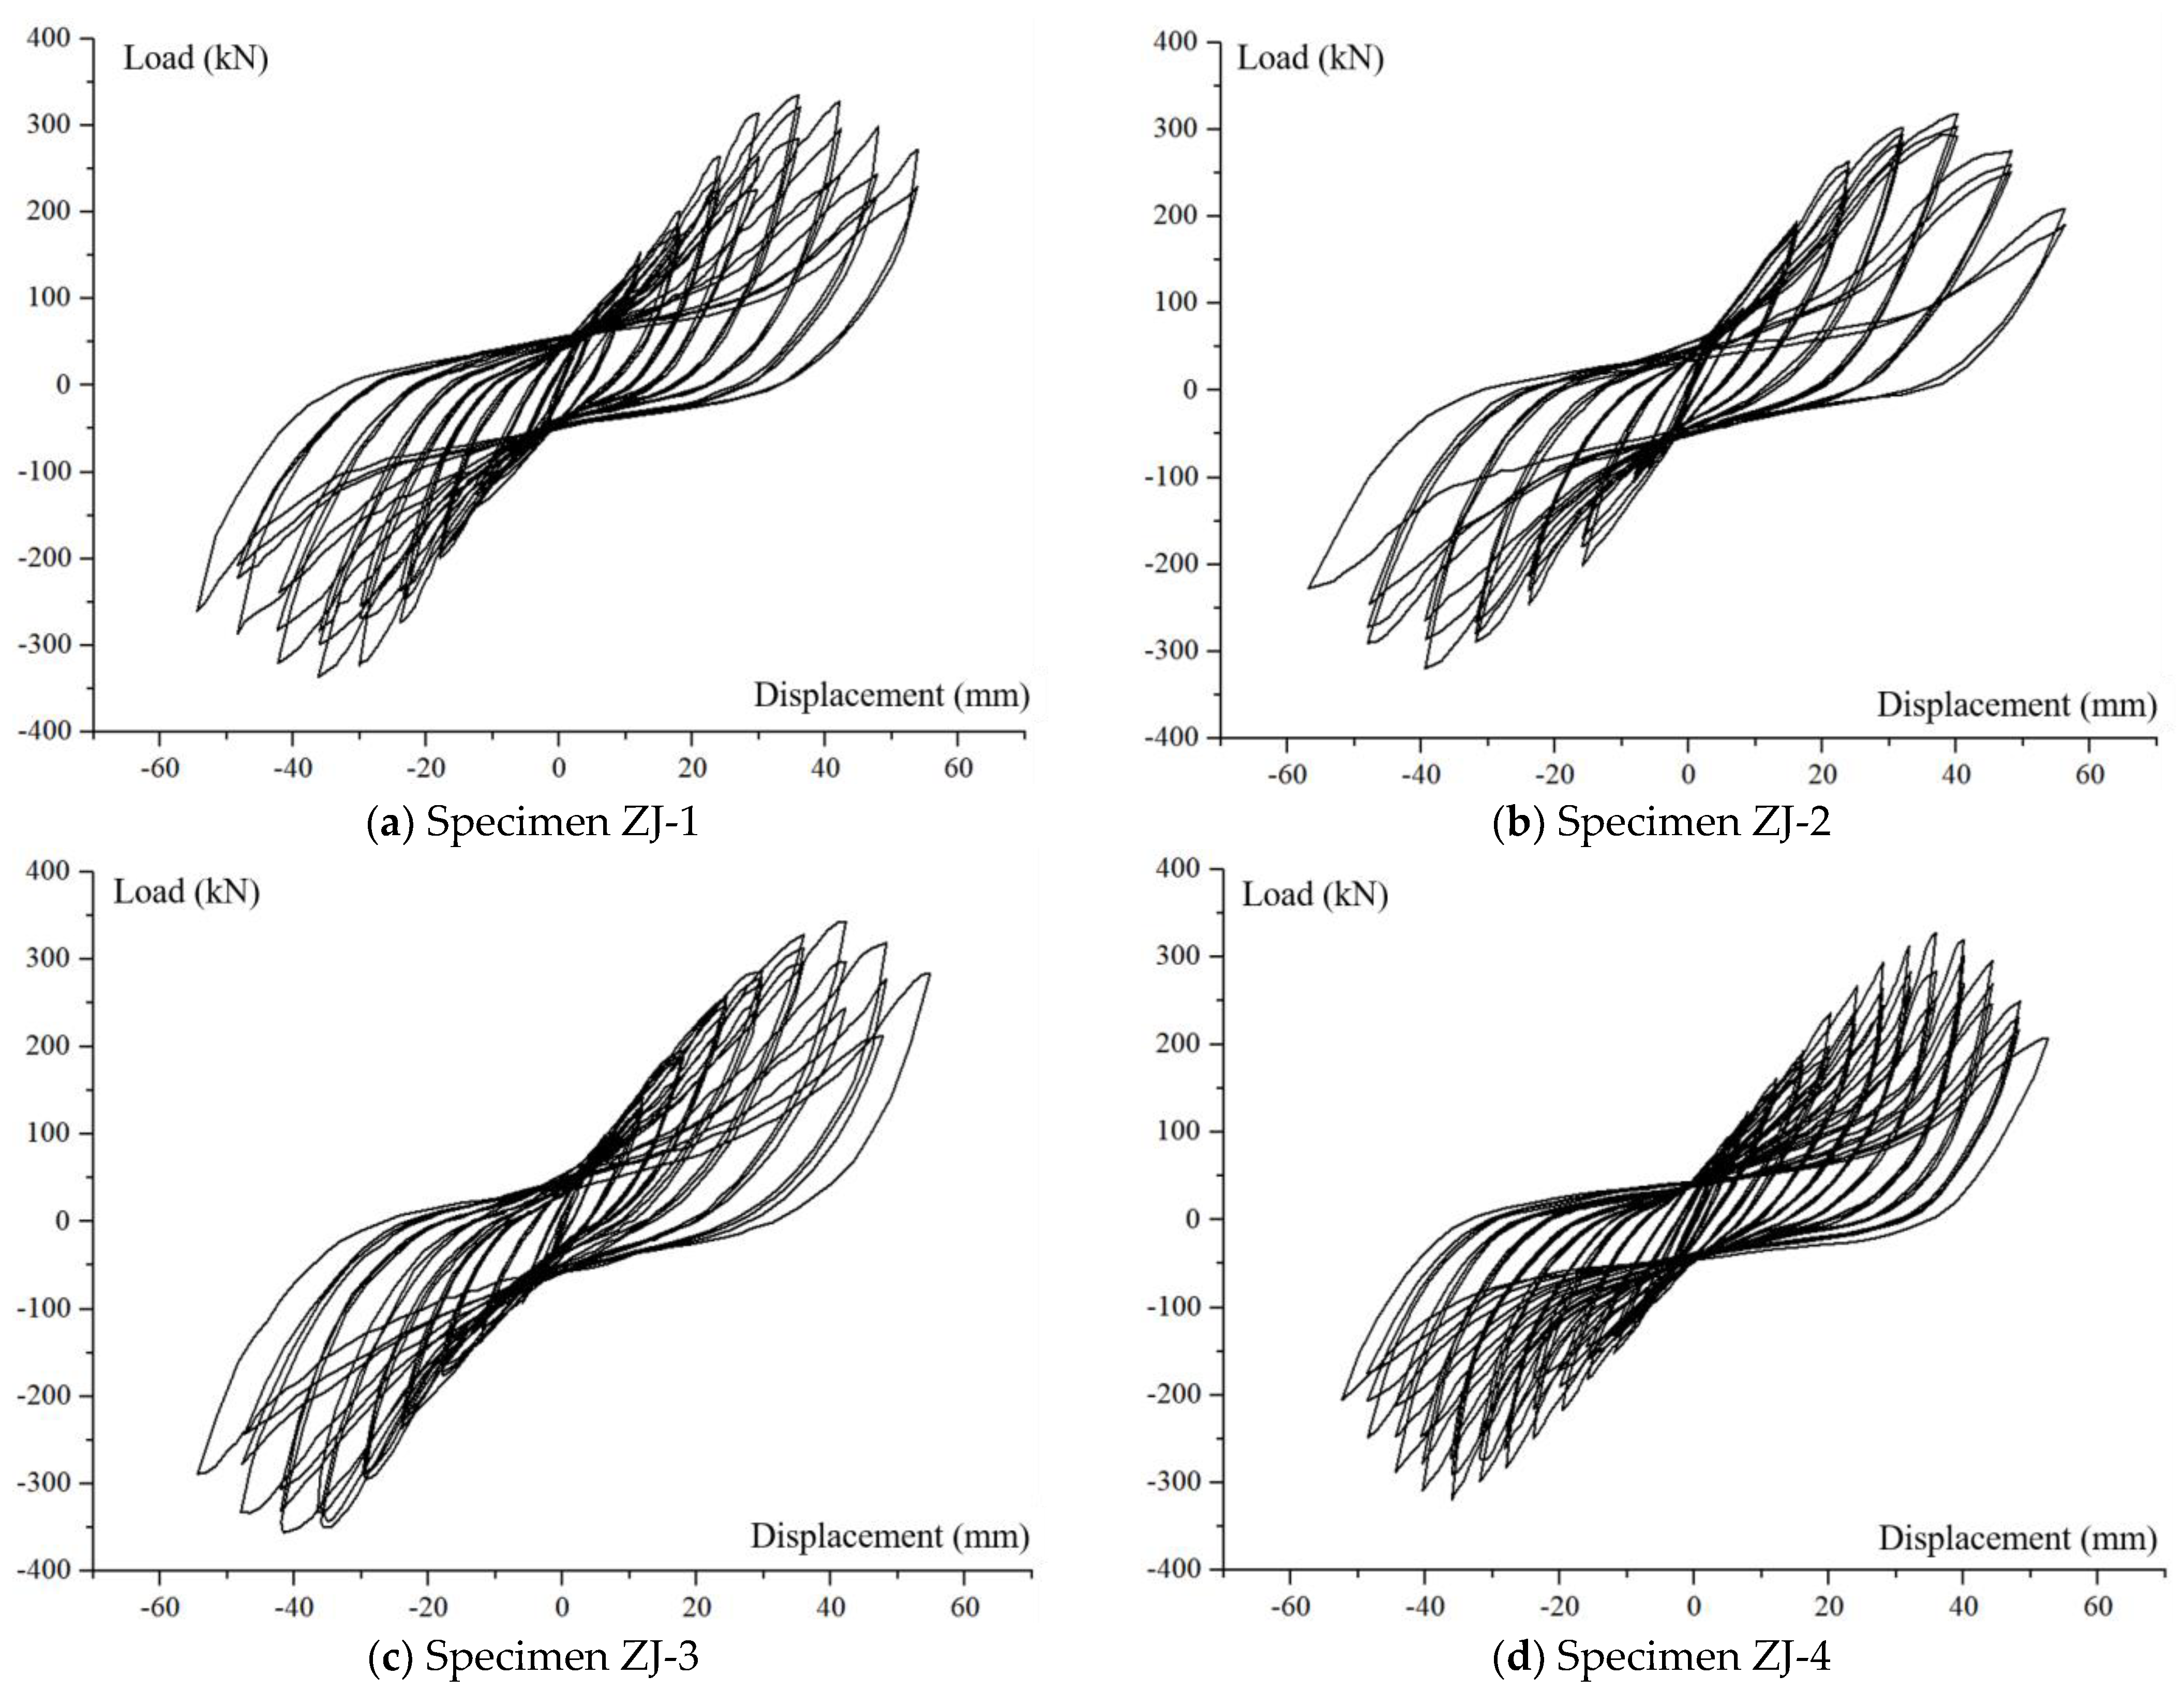
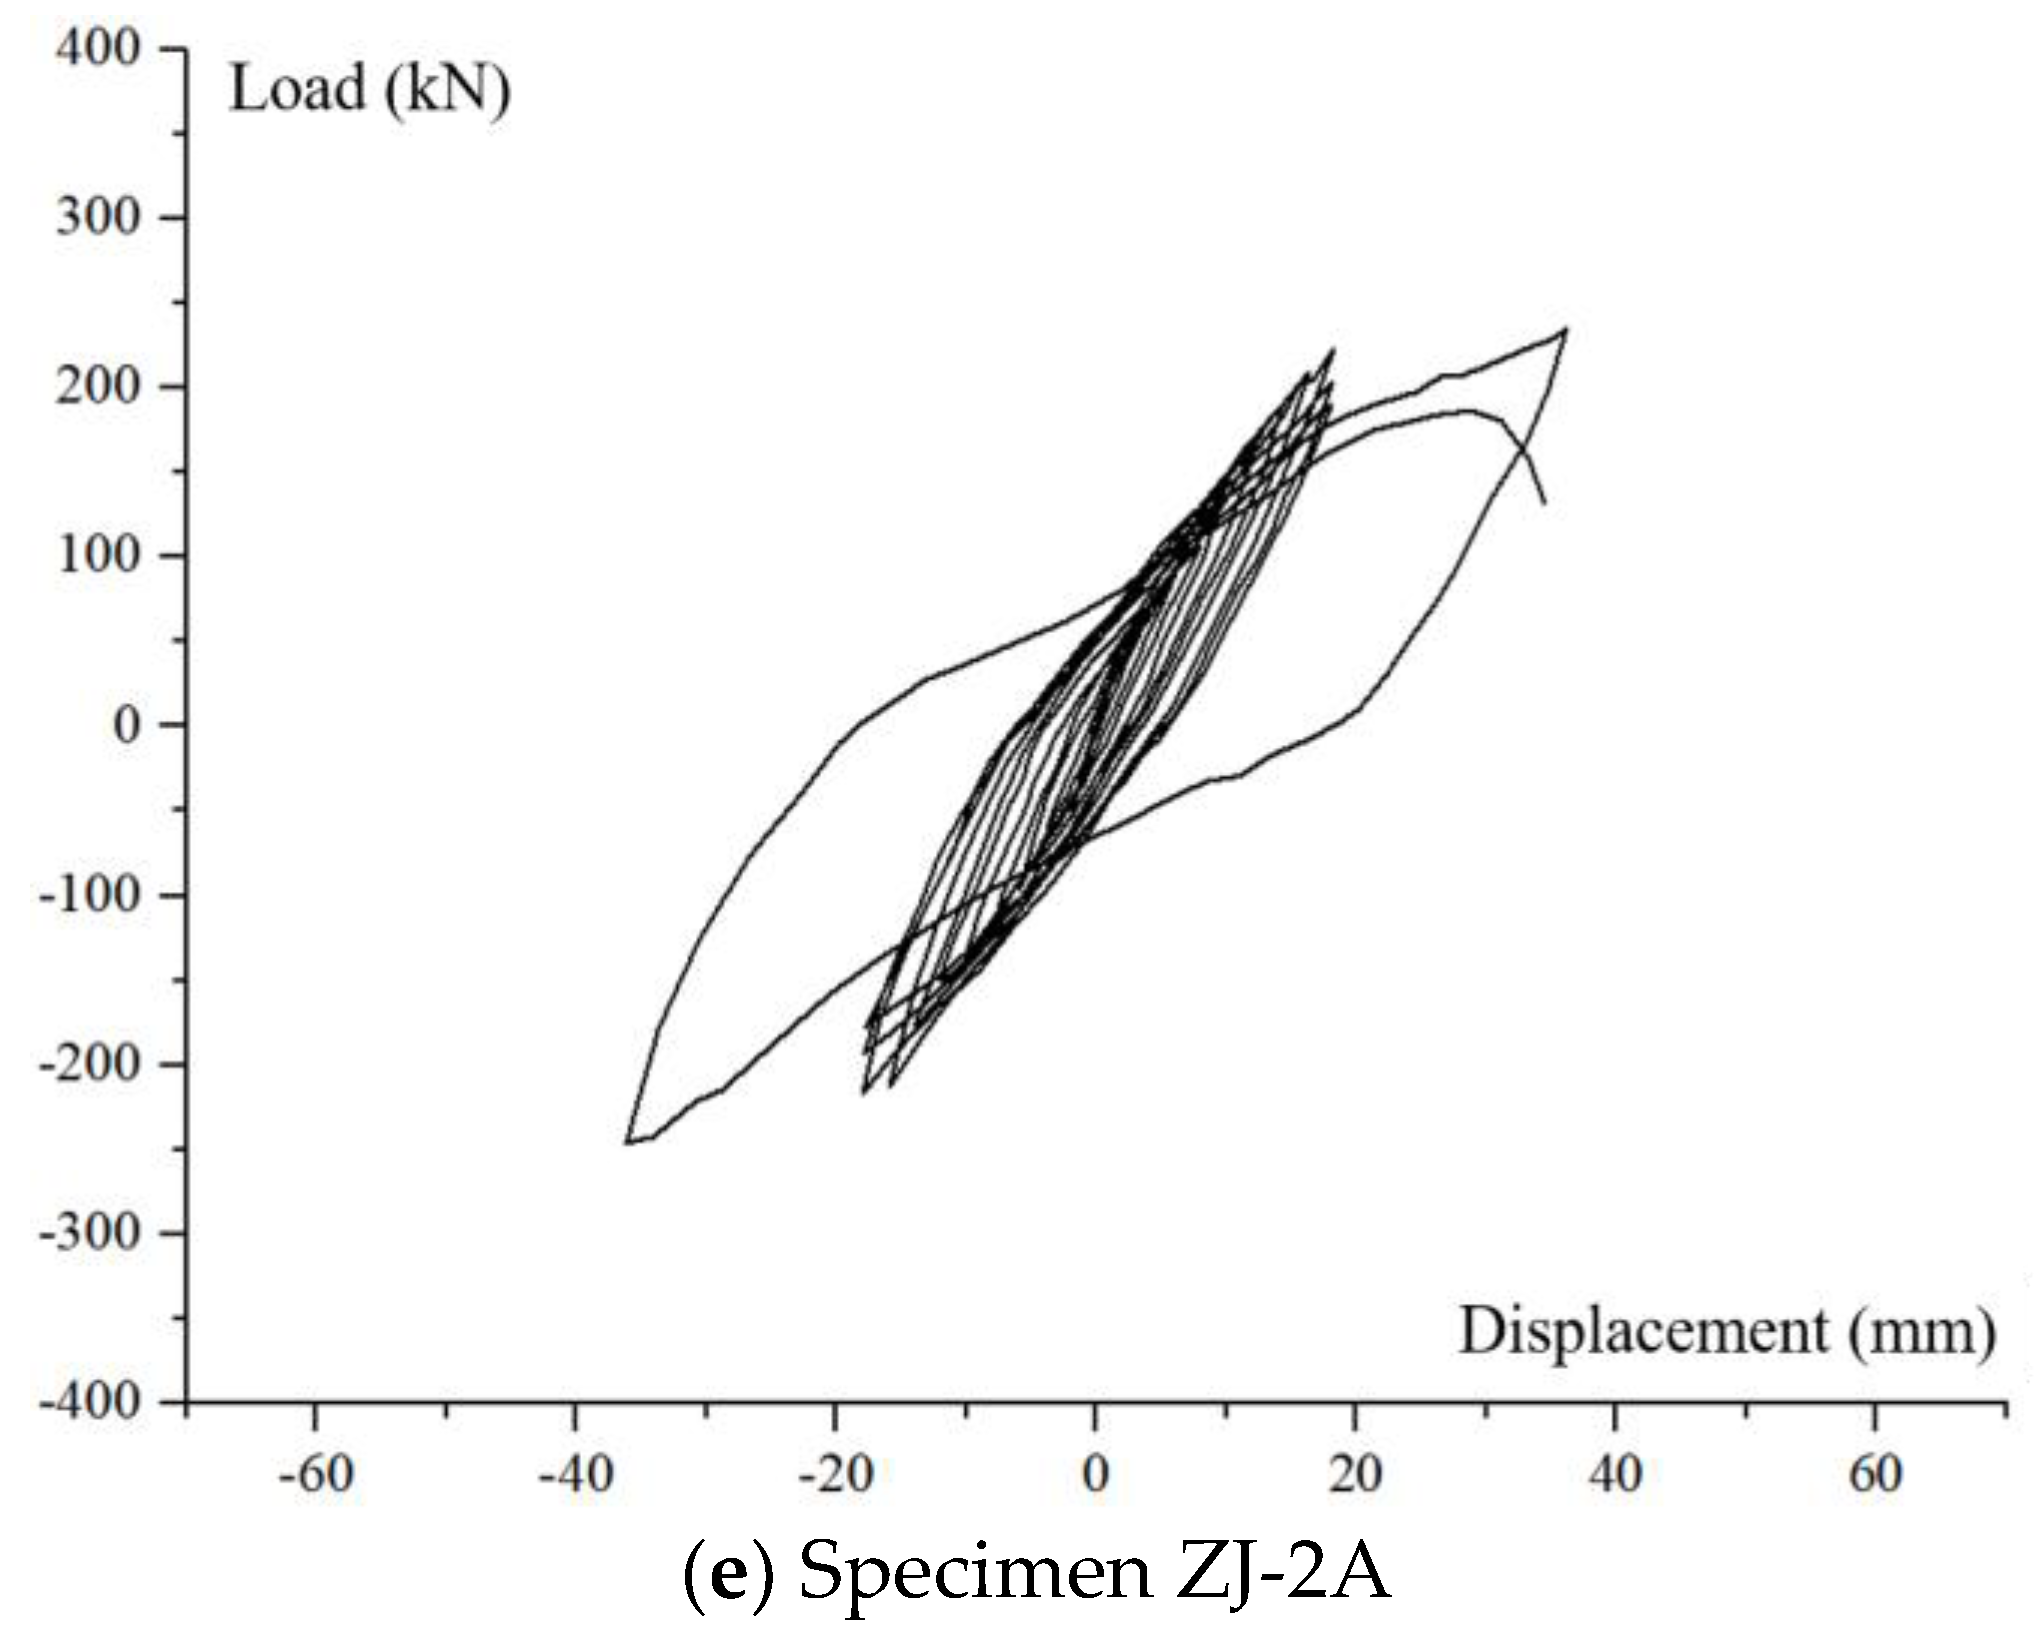
4.3. Hysteretic Curves
The hysteretic curves for the specimens are shown in
Figure 18 and
Figure 19, based on the beam end displacement and beam end load data collected in real time during the test. Observing and analysing the hysteretic curves at the seven joints, we can draw the following conclusions:
Overall, the change process of the joint hysteretic curves with CRB735 is basically the same. At the beginning of the loading period, the joint is not cracked, the specimen is basically in the elastic stage, and the curve is approximately a straight line. As the load increases, plastic deformation of the specimen occurs and the hysteretic curve shows that the displacement is no longer zero when the load is zeroed. At this point the curve is in the shape of a good energy dissipation “shuttle shape”, the shape is full. As the load continues until the core cracks, the area surrounded by the hysteretic loop becomes larger, forming a “bow shape”. When the ultimate load is reached, the hysteretic loop becomes more obviously pinched and becomes ‘anti-S shape’. At the failure stage, the load-displacement curve of some specimens has basically formed a ‘Z-shape’. This is because the concrete cracks in the core are too wide at this time, and the cracks cannot be completely closed when reverse loading, which leads to the concrete not being able to transfer the compressive stress effectively, and eventually leads to a significant reduction in the joint stiffness. For joint ZJ-2A with HRB400, the hysteretic curve is relatively full due to the shear failure at the beam end.
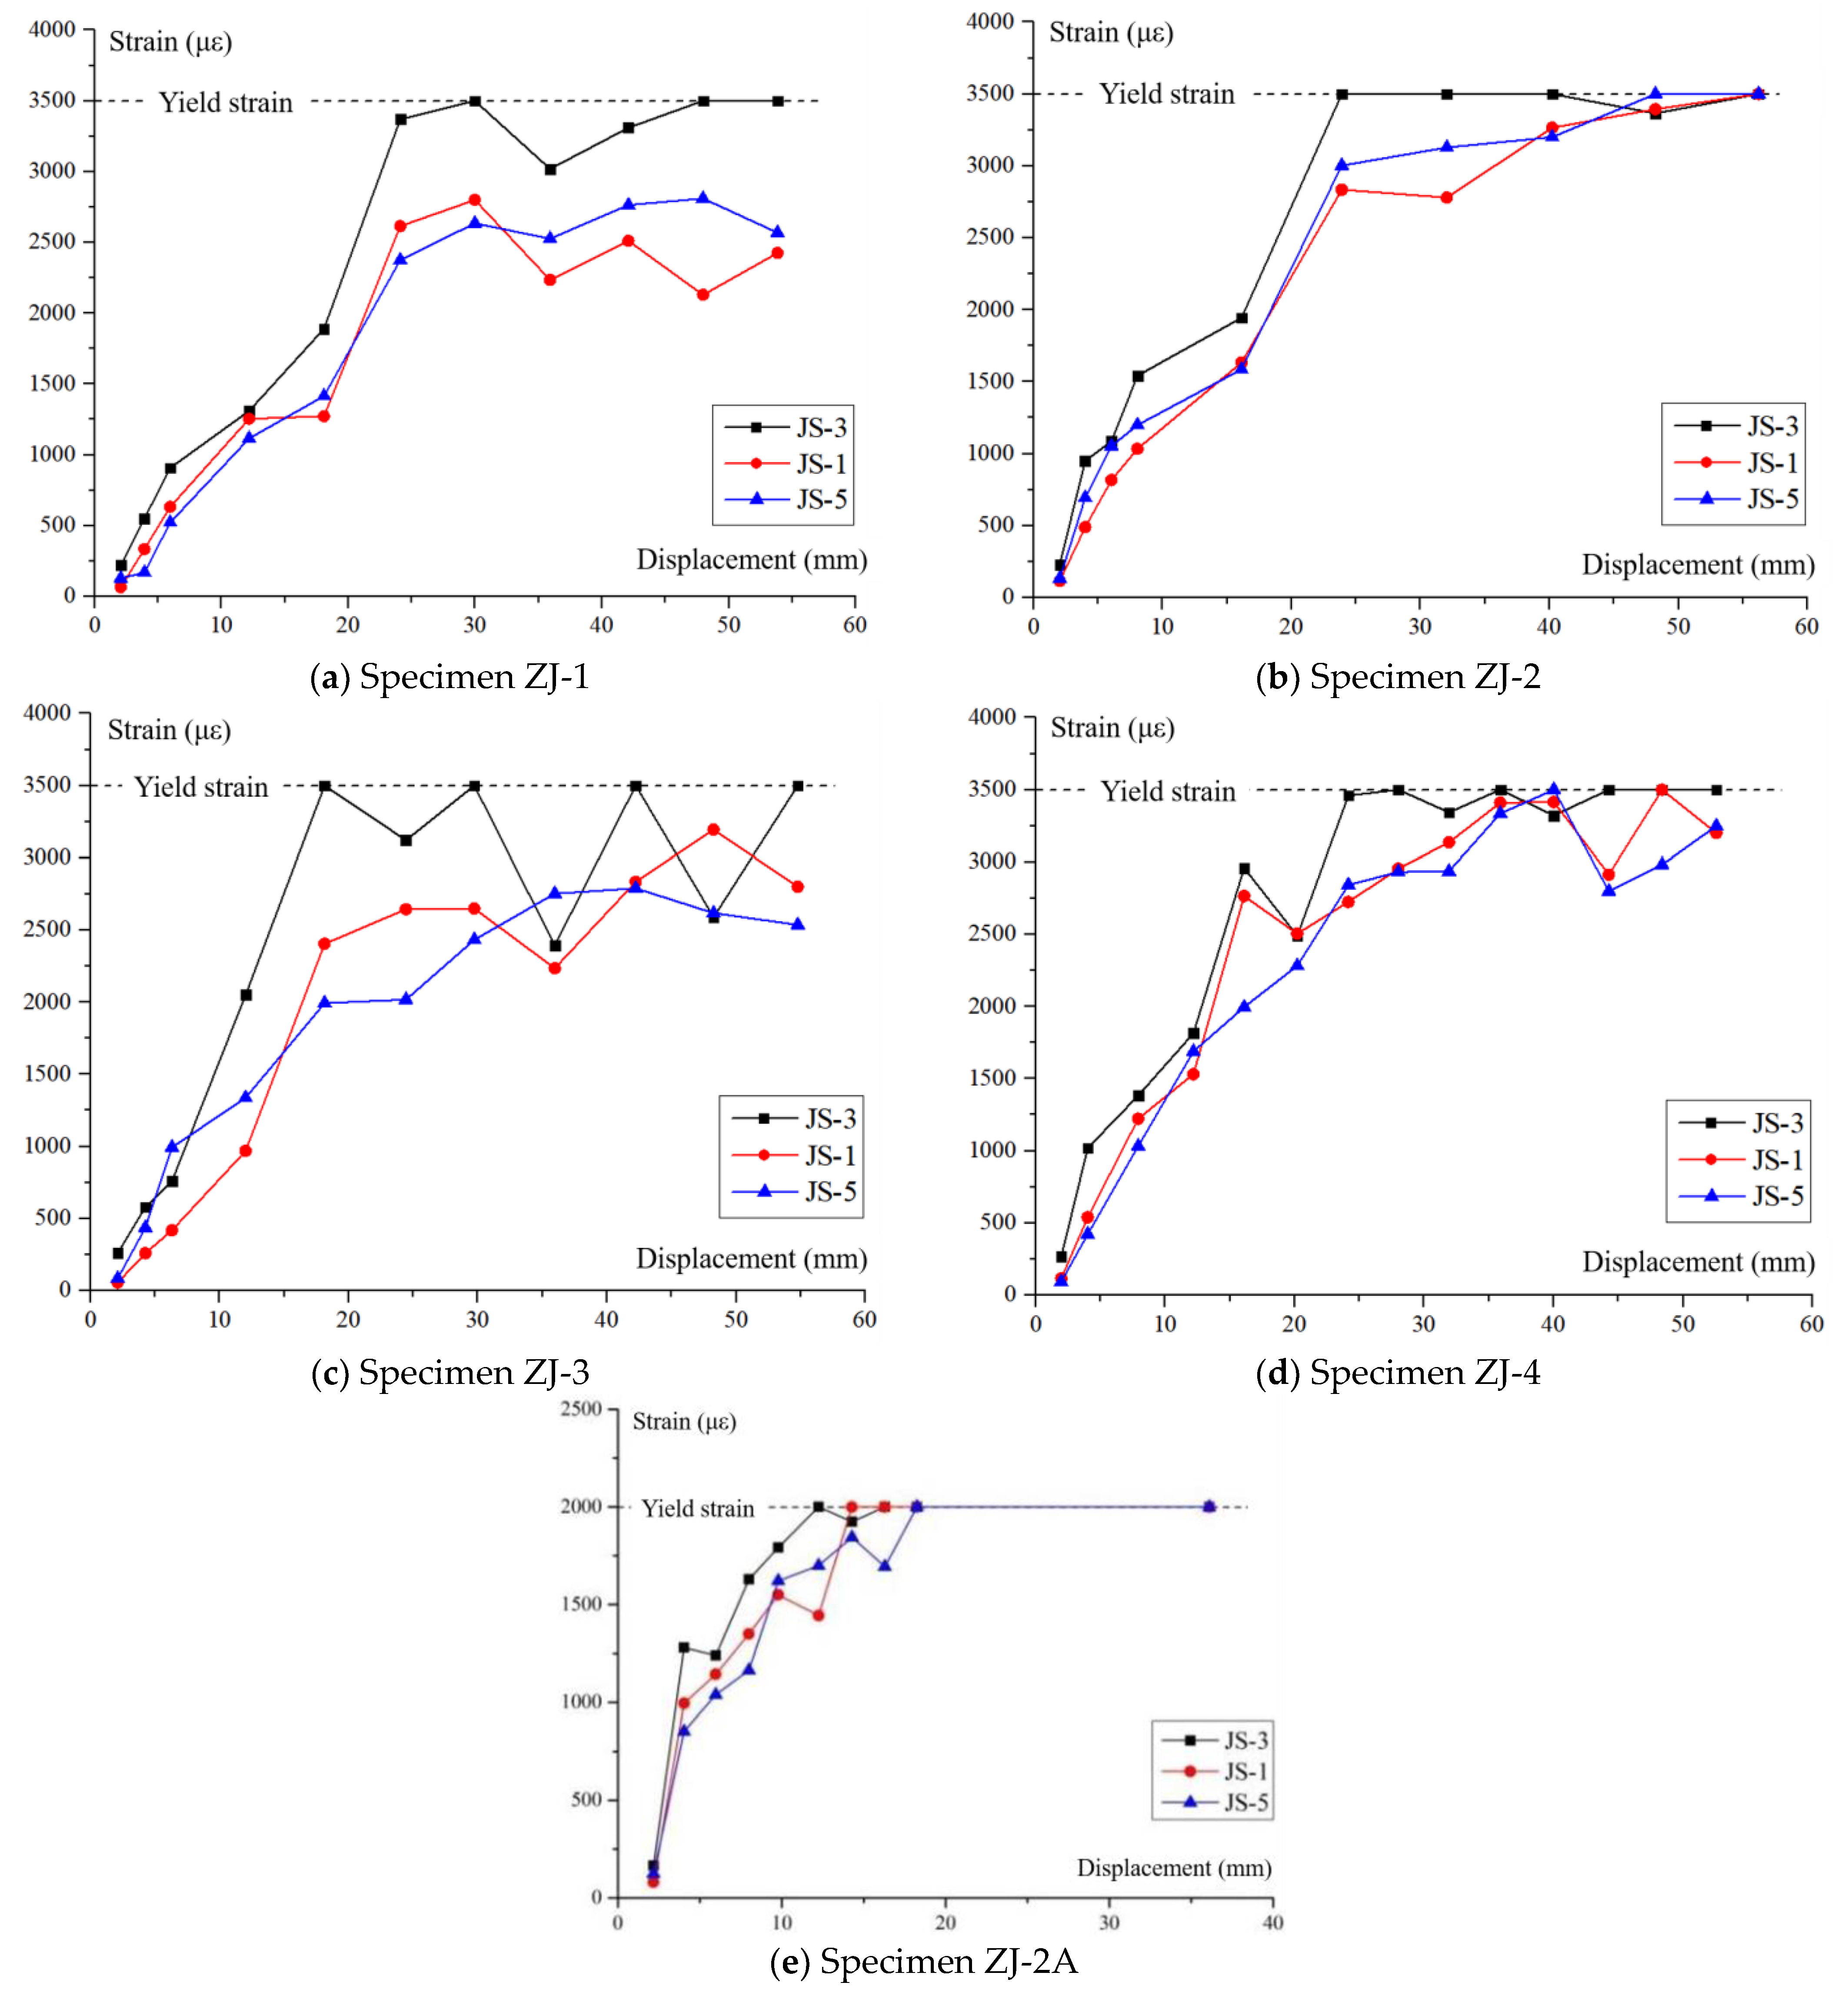
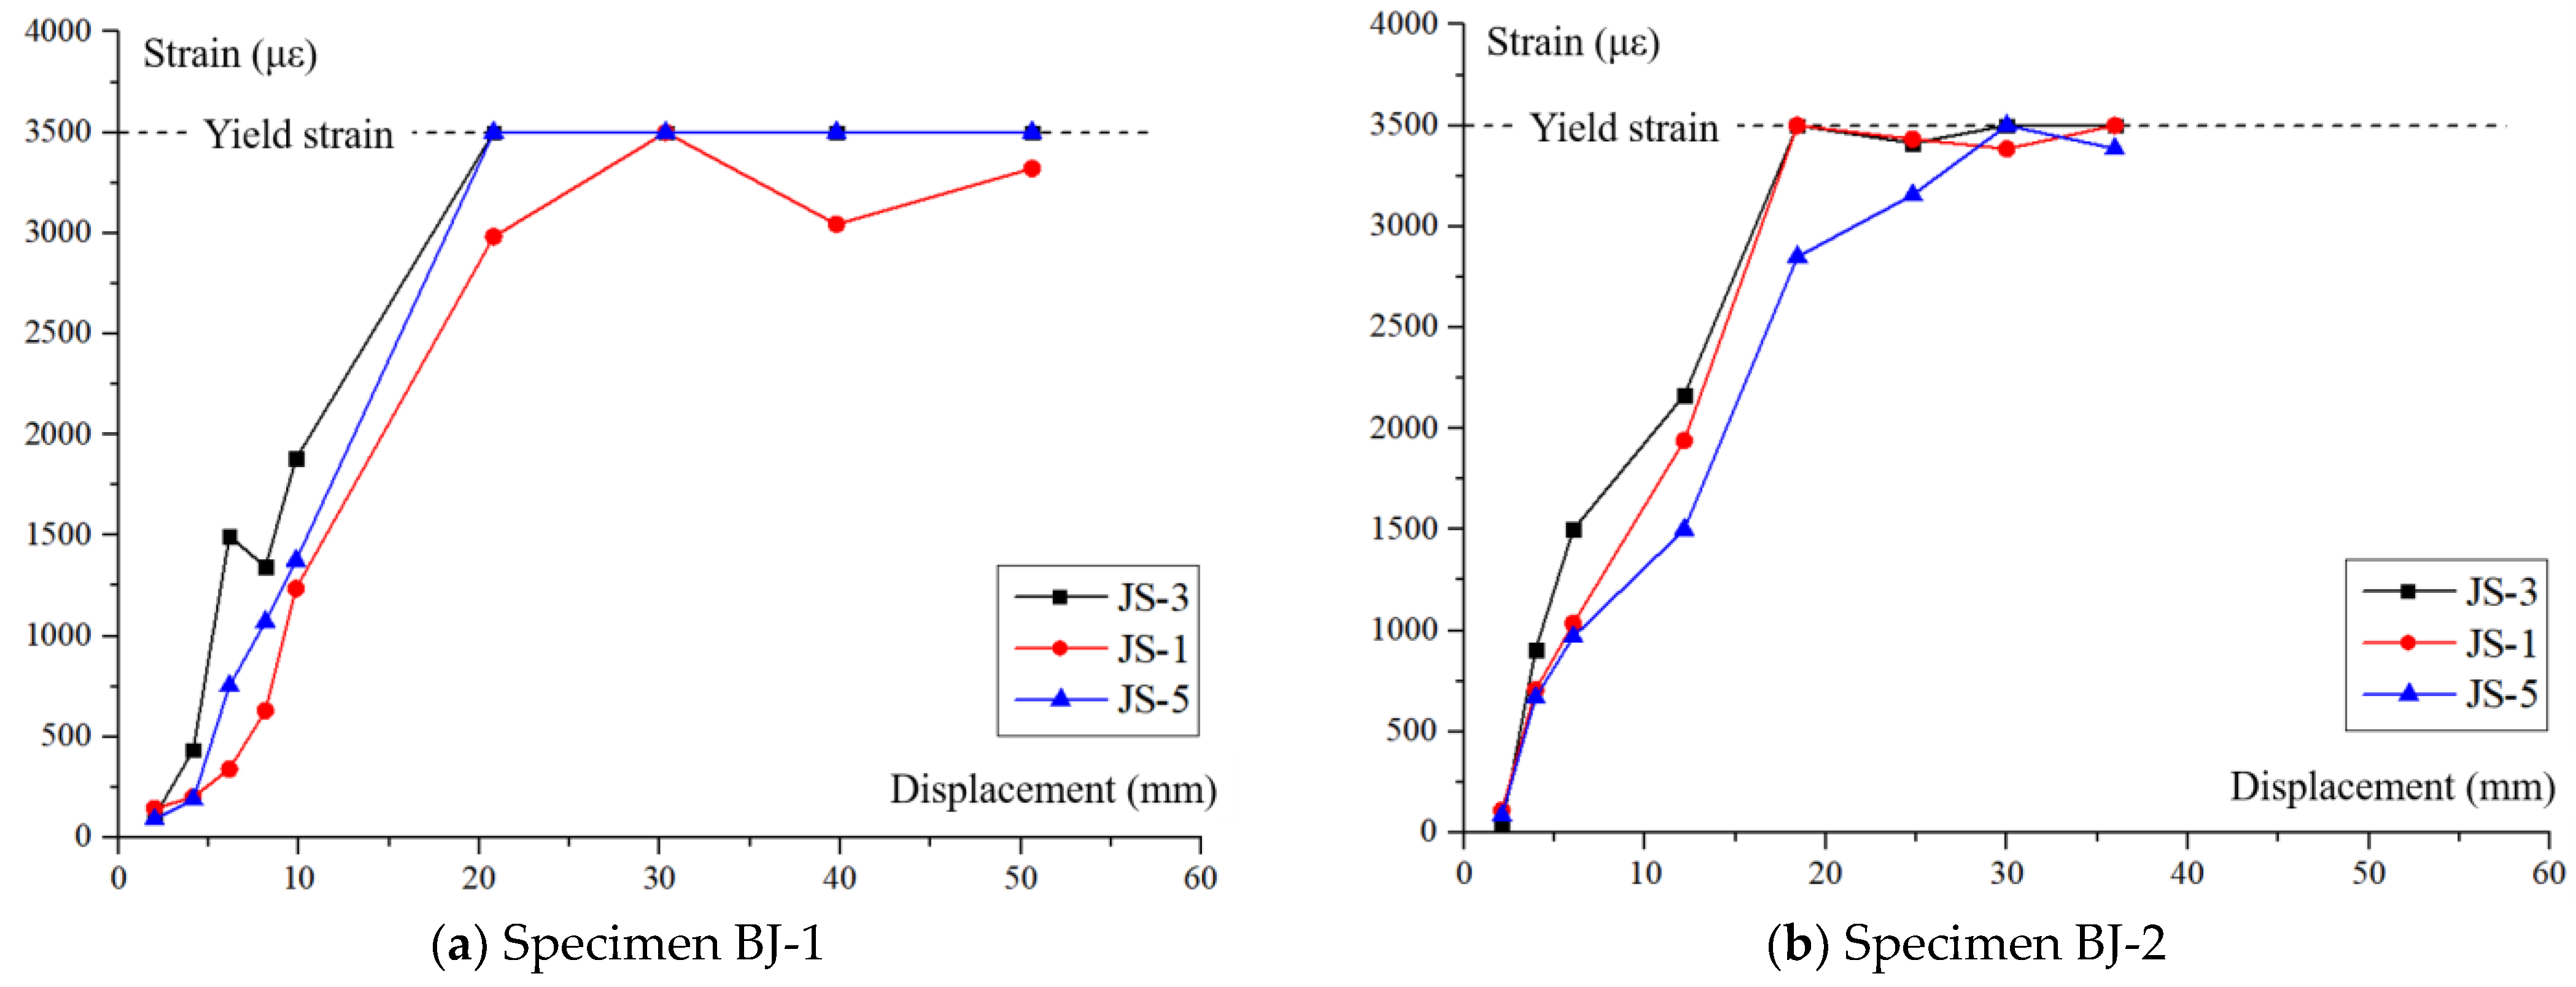
4.4. Analysis of Stirrup Strain in the Core Area
To study the strain law of stirrups in the joint core zone, the maximum stirrup strain-displacement curves of stirrups 1#, 3# and5 # in the core at all displacement levels were plotted for discussion. In order to ensure the accuracy of the measured data, the yield strain was taken when the stirrup strain exceeded the yield state. An amount of 3500 με was taken as yield strain for CRB735 and 2000 με for HRB400, which could still qualitatively reflect the stirrup strain in the core. The strain-displacement curves were plotted as shown in
Figure 20 and
Figure 21.
Stirrup strain is generally small in each specimen prior to cracking. The strains increased more rapidly when loaded until the core cracked. As the loading continued, the 3# strain gauge was the first to reach yield at its location. The strain in the middle 3# stirrup is always greater than the stirrups on either side of it. Due to the symmetrical position, the strains of the 1# and 5# strain gauges did not differ much from each other under the same loading displacement and yielding was only achieved in some of the joints. In the case of specimen ZJ-2A, the stirrups yielded before the core cracked, indicating that the concrete had expanded significantly.
Comparing the two groups of specimens with the same axial compression ratio and different volumetric stirrup ratios, it was found that under the same loading displacement, the strains in the stirrup with more stirrups in the core were smaller, especially in the later stages of loading, for specimens ZJ-2 and ZJ-4 with fewer stirrups, the strains in 1# and 5# had grown to near yield. The strains on both sides of the stirrups of specimens ZJ-1 and ZJ-3 were low and grew slowly.
Comparing the three groups of specimens with the same volumetric stirrup ratio and different axial compression ratios, it was found that when the displacement and stirrup position were the same, the joint with a larger axial compression ratio should have a larger strain compared to the joint with a smaller axial compression ratio, and the middle stirrup 3# would reach yield earlier. The reason for this is that increasing the axial compression ratio will increase the internal force of the diagonal compression bar mechanism in the core area, making the lateral expansion of the diagonal compression bar concrete greater and therefore the stirrup stress is higher.
In summary, increasing the core stirrups can effectively reduce the internal forces on the stirrups, allowing the core stirrups to retain sufficient tensile potential in the later stages of loading. However, if the stirrup position is too close to the edge, it will not be able to effectively restrain the expansion of the concrete in the core. In addition, studies have shown that increasing the axial compression ratio will increase the stirrup stress in the core.
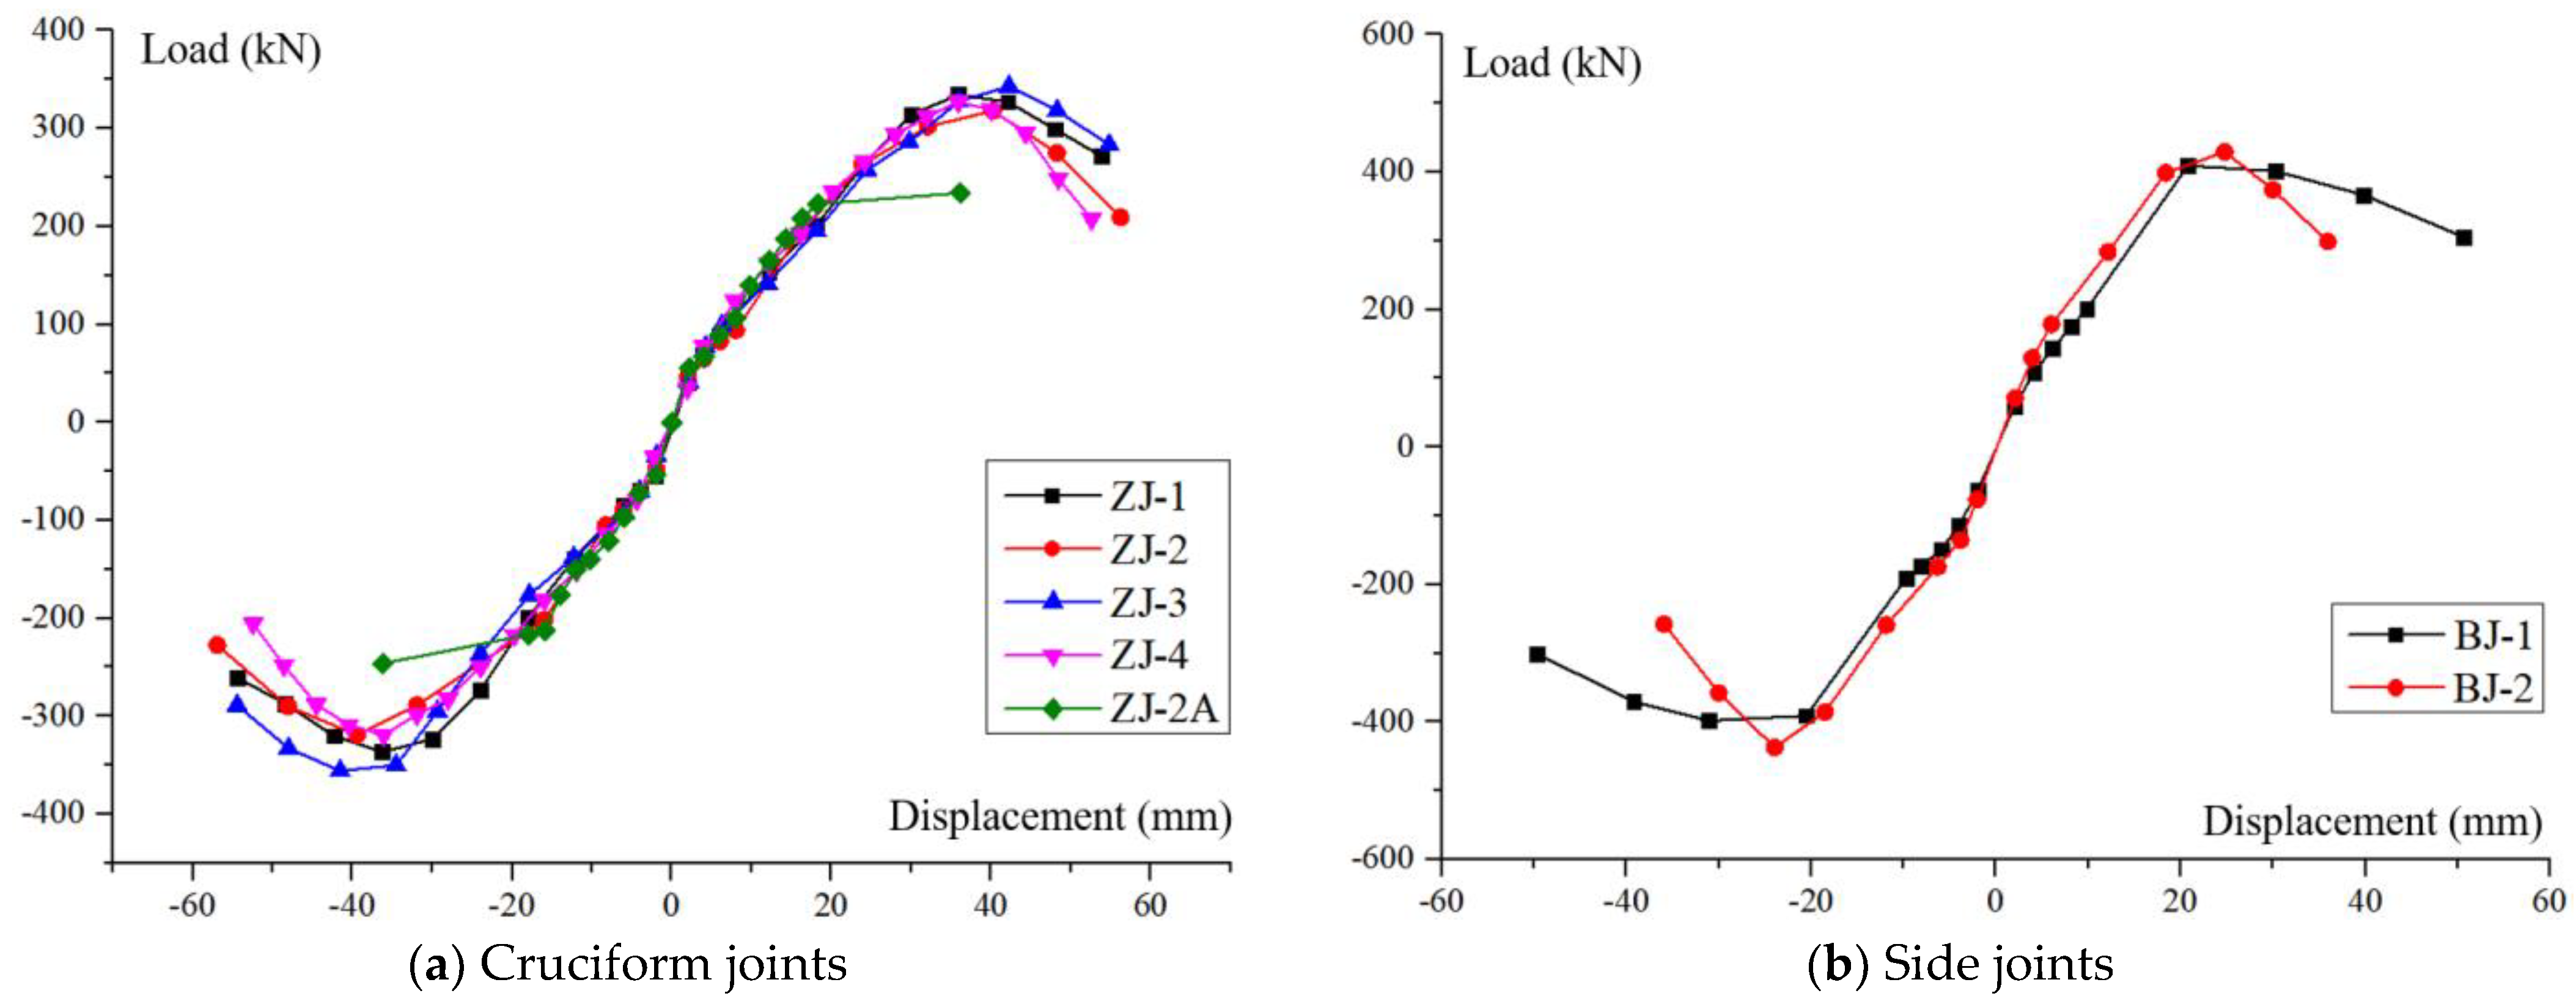
4.5. Envelope Curves
The envelope curves of each joint are plotted according to the hysteretic curves as shown in
Figure 22. Overall, the envelope curves of all joints with CRB735 are similar in shape and can be basically divided into four stages: elastic rise, plastic development, ultimate state and final failure, where the ultimate state is relatively short. It is easy to observe that the envelope curves overlap well in the early stages of loading, and the trends are basically the same. As loading continues, the curves begin to deviate gradually. By the time the failure stage is reached, there is a large difference in the rate of load drop for each specimen. The envelope curve of the control joint ZJ-2A basically overlaps with the joint ZJ-2 with HRB400 before cracking, and there is no obvious plastic development stage, and the ultimate bearing capacity is lower when shear failure occurs at the beam end eventually.
4.6. Bearing Capacity and Ductility
The bearing capacity and ductility of the specimens are determined by analysing data from the four key stages of cracking, yielding, ultimate and failure. The yielding referred to here is the yielding of the whole joint, marked by a sudden change in joint stiffness, and the yielding point is determined using the equal energy method in this paper. The ductility factor is the ratio of the loaded displacement to the yield displacement at the beam end at the time of joint failure and the data are calculated in
Table 5.
4.6.1. Bearing Capacity
(1) Cracking stage
The cracking displacements of the different joints were found to be uneven but the cracking loads were not very different, except for specimen ZJ-2A. The reason for this is that before the core cracked, the stirrups only took up a few shear forces, while the concrete was responsible for resisting most of the shear forces, and when the main tensile stress in the concrete diagonal section reached the tensile strength, the joint then cracked. In this test, the concrete strength and cross-sectional dimensions of the beams and columns were equal in each control group, so the difference in the cracking loads of the specimens was relatively small. In addition, it was found that the joints with higher axial compression ratio in this paper tended to crack earlier in the core area. The reason for this is that when the axial compression ratio exceeds a certain range, continuing to increase the axial compression will result in the “diagonal compression bar mechanism” in the core being subjected to too high and the concrete will crack sooner after reaching the tensile strength.
(2) Yielding stage
Comparison easily shows that the yield loads and corresponding displacements of all joints configured with CRB735 are significantly greater than those of the control specimen ZJ-2A. This is due to the higher yield strength of CRB735, which requires greater deformation of the reinforcement for the same modulus of elasticity before it will yield, and the corresponding load displacement at the beam end is greater.
(3) Ultimate stage
The ultimate bearing capacity of specimens ZJ-1 and ZJ-3 with higher volumetric stirrup ratio in the core is higher than that of specimens ZJ-2 and ZJ-4 with lower one, with an increase of 5.3% and 10.1%, respectively. While the ultimate bearing capacity of specimens ZJ-3, ZJ-4 and BJ-2 with higher volumetric stirrup ratio have an increase of 4.1%, 1.4% and 5.6%, respectively, compared to ZJ-1, ZJ-2 and BJ-1 when the volumetric stirrup ratios are the same. The increase in load is not significant, as the ultimate bearing capacity of ZJ-3, ZJ-4 and BJ-2 are 4.1%, 1.4% and 5.6%, respectively. Therefore, in terms of increasing the shear capacity of the joint, it is more effective to increase the volumetric stirrup ratio than to increase the axial compression ratio. When specimen ZJ-2A was fielded, there were only a few cracks in the core. The maximum load applied to the beam ends is 246.1 kN.
(4) Failure stage
Comparing the effect of different parameters on the failure displacement of beam-column joints, it was found that increasing the volumetric stirrup ratio increased the failure displacement, while the effect of axial compression ratio is not significant.
4.6.2. Ductility
Overall, the ductility coefficient of the test joints in this paper are generally very small, due to the fact that both joint core shear and beam ends shear failure are brittle failure. When these two modes occur, the deformation capacity of the specimens from yield to failure is very poor and does not meet the seismic requirements of the existing code. When the specimens with CRB735 reaches yield, the concrete in the core has been basically sheared diagonally and continues to be loaded, the stiffness of the specimens decreases rapidly and the joints is soon failed.
Although the yield displacement of the control specimen ZJ-2A is small, when the loading continues, shear failure occurs suddenly at the beam end, and the displacement does not increase much during this process, so its ductility coefficient is still small. It can also be found that increasing the axial compression ratio will reduce the ductility of the joints, regardless of whether it is a cruciform side joints.
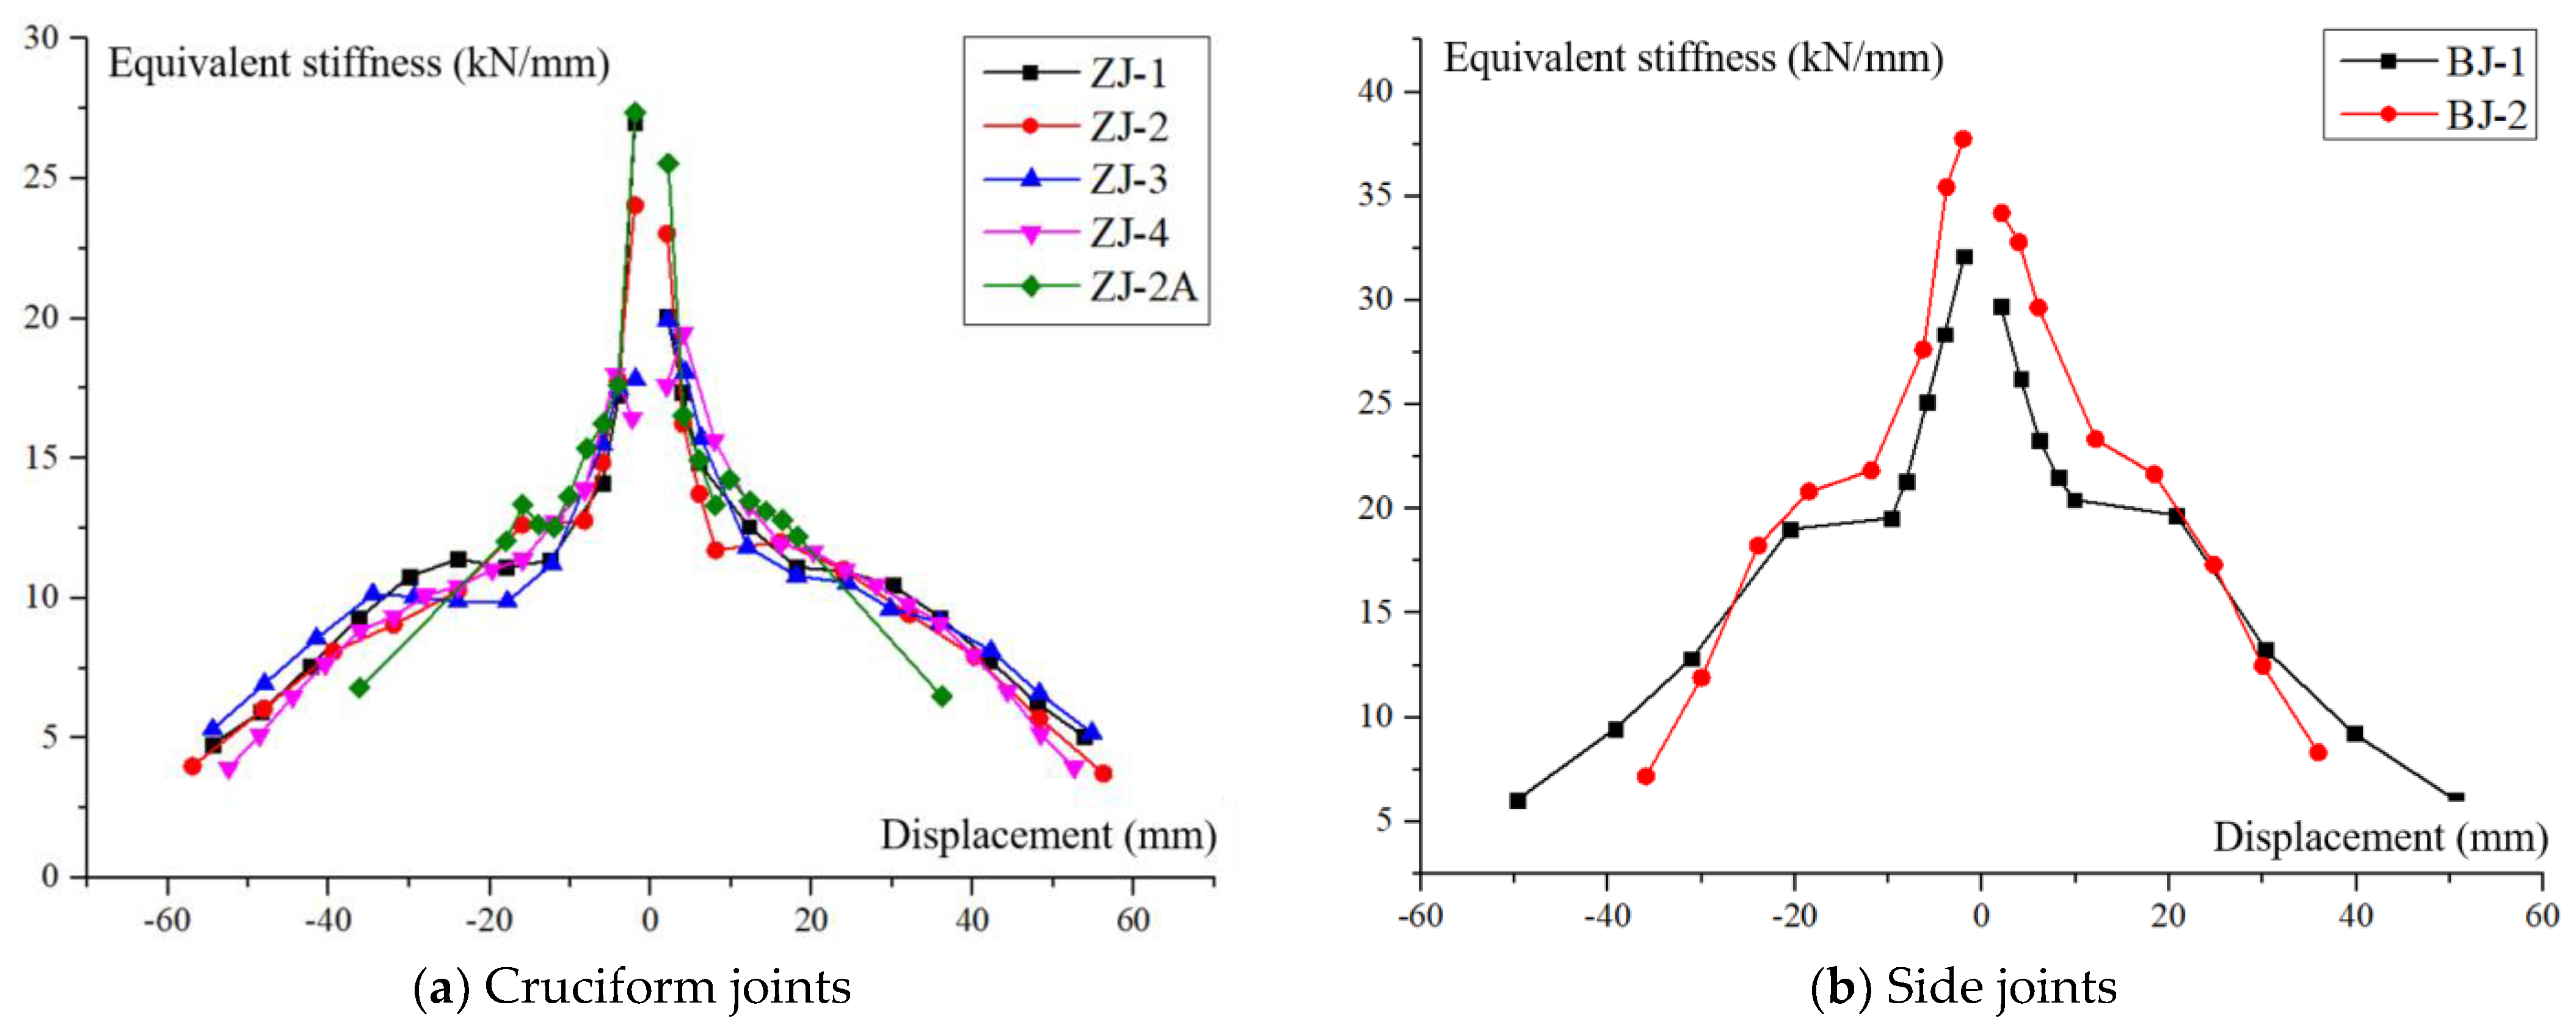
4.7. Stiffness Degradation
Stiffness degradation is the phenomenon of continuous reduction in stiffness due to the accumulation of damage to the joint, the opening and closing of concrete cracks and the development of material plasticity under cyclic loading. The stiffness of the specimens in this paper is represented by the secant stiffness, calculated as follows:
where,
Ki is the equivalent stiffness of the joint;
Fi is the peak load of
i-th cycle; and
Δi is the displacement corresponding to the peak load of
i-th cycle. The stiffness degradation curves for each specimen are plotted as shown in
Figure 23.
Overall, the stiffness degradation of the specimens was generally rapid at the beginning of loading, with a more uniform decay throughout and no sudden changes in stiffness. There were significant differences in the stiffness degradation of the beam-column joints when configured with different types of reinforcement. For the specimens configured with CRB735, the stiffness degradation process can be broadly divided into three stages: (1) Before cracking, the increase in loading displacement is large relative to the load change, and all specimens have rapid stiffness degradation, which is caused by the rapid development of cracks within the concrete. (2) After cracking to the yielding stage, this process loads the beam ends with an increase in cracking displacement, i.e., the displacement variation is greater compared to the first stage. Although cracks are generated in the concrete at this stage, the overall failure to the specimens is less severe and the load is steadily increasing. The reason for this analysis is that the concrete in the core is gradually expanding under compression at this stage, the passive restraint force provided by CRB735 is increasing, and the stirrup effectively delays the development of cracks, resulting in no significant degradation of the joint stiffness. (3) After the specimen reaches yield, most of the stirrup in the core has already yielded and the restraining effect on the concrete gradually degrades. Continuing to load, the cross cracks further widen, resulting in an accelerated rate of stiffness reduction in the joints.
For joint ZJ-2A, which is configured with HRB400, the stiffness degrades quickly during the initial loading. With the increasing applied displacement, the internal cracks develop and extend, and the stiffness of the joint further decreases. However, the overall stiffness of the joint is slightly greater than that of the joints equipped with CRB735 because there are no obvious cracks in the core at this time. When the core cracked, the curve decreased rapidly. This is due to the fact that when shear failure occurs at the beam end, the main crack is wider and rapidly penetrating the beam height, resulting in a dramatic reduction in stiffness of the whole joint.
In summary, the configuration of CRB735 can significantly slow down the rate of stiffness degradation of beam-column joints during the core cracking to joint yielding stage. When the joints configured with CRB735 reached yield, the specimens were close to the ultimate state and the stiffness degradation was fast when the loading continued. The tests in this paper demonstrate that increasing the volumetric stirrup ratio in the joint core can improve the specimen’s ability to resist deformation after yielding.
4.8. Energy Dissipation Capacity
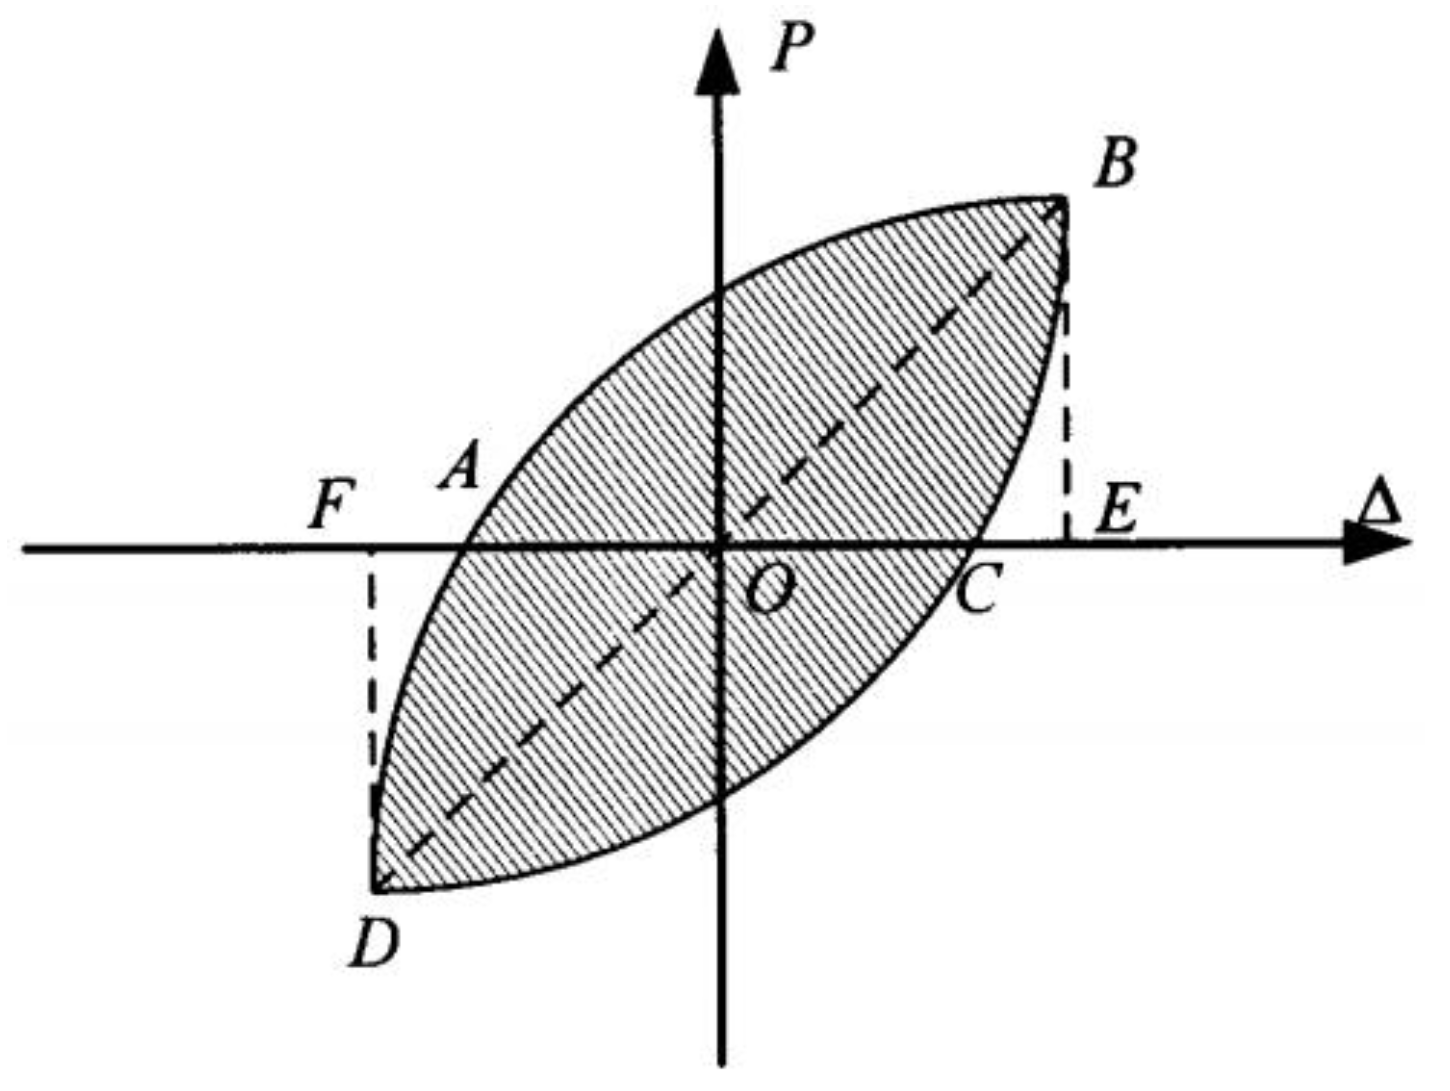
To fully understand the seismic performance of a specimen, it is not enough to analyse it by strength and stiffness alone, but also by its ability to dissipate energy under cyclic load. If a specimen is able to dissipate a significant amount of the seismic input, it can effectively reduce the seismic response of the structure and protect it from damage. The area enclosed by the hysteretic curve of the specimen is the dissipated energy. In this paper, the equivalent viscous damping coefficient,
heq, is used to represent the fullness of the hysteretic curve and thus assess the energy dissipation performance of the specimen during loading. A sketch of the calculation of the equivalent viscous damping coefficient (
Figure 24) and the equation (Equation (7)) are as follows:
where,
S(ABC+CAD) is the area enclosed by the hysteretic curve;
S(△OBE+△ODF) is the sum of the areas enclosed by triangles OBE and OFD.
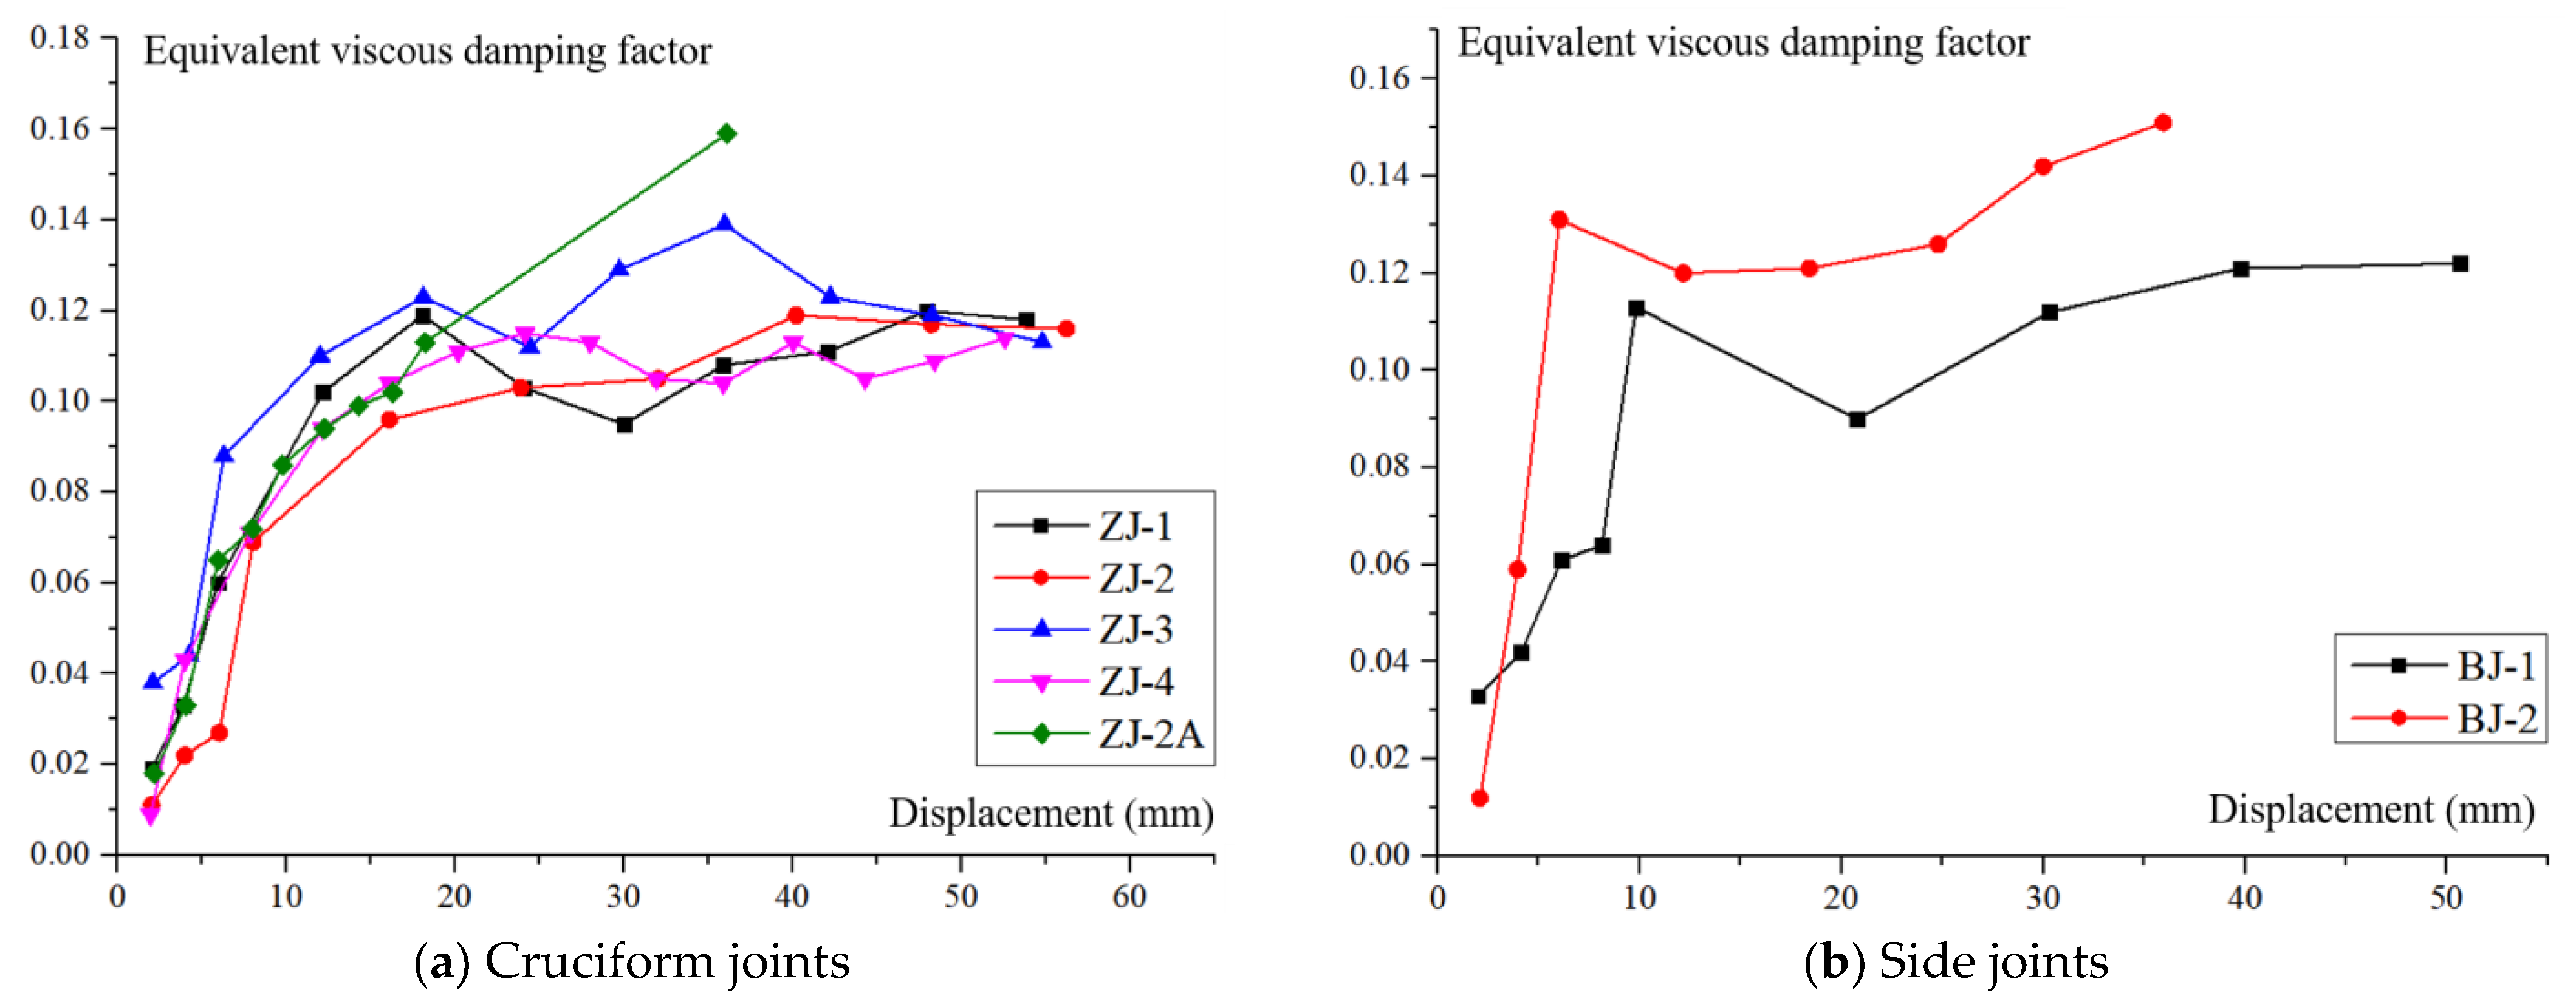
Based on
Figure 24 and Equation (7), the equivalent viscous damping coefficient-displacement curves of all specimens are plotted in
Figure 25.
It is observed that the energy dissipation capacity of all joints is generally poor, indicating that both shear failures are unable to dissipate seismic energy effectively and are detrimental to the seismic resistance of the structure. The different stages of the curves are analysed as follows:
(1) The initial loading of the joints to the core cracking stage is generally small in energy dissipation capacity, but grows rapidly, with the fastest growth rate at the moment of core cracking.
(2) After cracking, the specimen will continue to dissipate energy through the extension and widening of existing cracks and friction from aggregate shear misalignment, so the equivalent viscous damping coefficient continues to increase.
(3) After the specimen yields, the crack develops further, and although the energy dissipation capacity increases, the curve does not increase much because the longitudinal reinforcement of the beam and column never yields, and the plastic hinges of the beam and column with high energy dissipation capacity are not formed.
(4) During the failure stage, the energy dissipation capacity of the specimen is stable and tends to decrease. This is due to the fact that the longitudinal reinforcement of the beams and columns running through the joints has undergone adhesive degradation, but the extent is still shallow, so the energy dissipation capacity does not decrease significantly.
Comparing specimens with different parameters, it was found that joints with higher axial compression generally had a higher energy dissipation capacity. In contrast, the variation of the volumetric stirrup ratio has an insignificant effect. In summary, the energy dissipation capacity of the specimens is generally weak as the core shear or beam end shear failure occurs before the beam-column plastic hinge occurs in the assemblies.
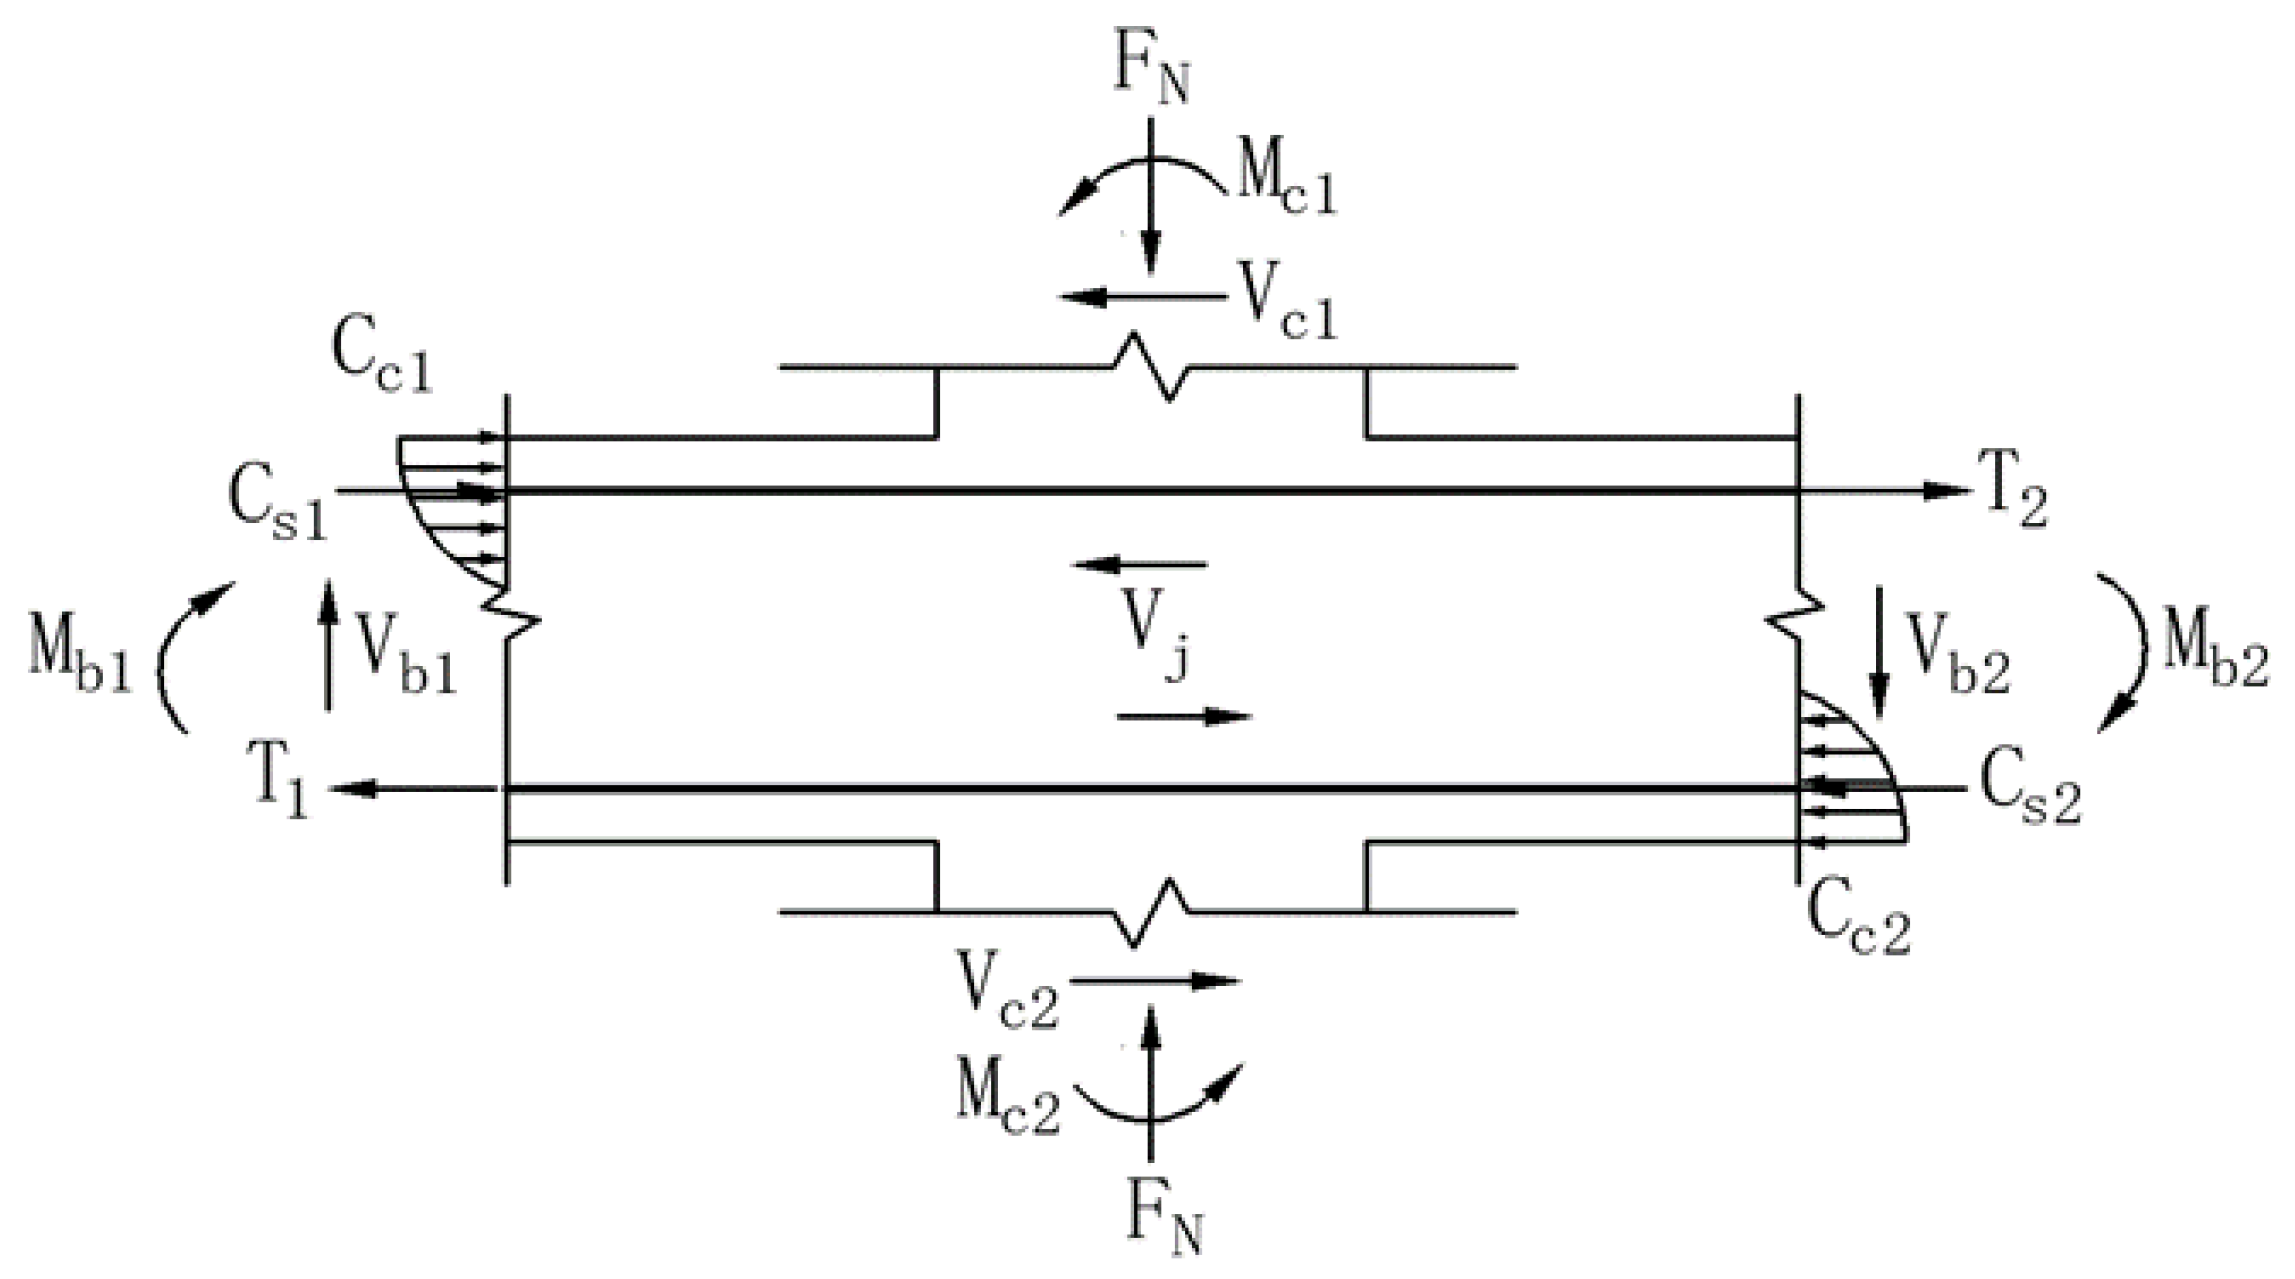
5. Analysis of Joint Shear Capacity
All the specimens in this paper are designed as “strong members, weak connection”, and the joints configured with CRB735 in the tests have reached the expected failure mode, so the final damage of the whole assembly is controlled by the shear capacity of the core. When the joints reach the ultimate shear capacity, the force sketch of the core is shown in
Figure 26.
Taking the upper half as the isolator, establish the equilibrium equation:
where,
Cc1 is the combined compression on the concrete in the compression zone at the left beam end;
Cs1 is the combined compression on the compressive longitudinal bars at the same side of the beam end;
T2 is the combined tension on the tension longitudinal bars at the right beam end;
Vc1 is the shear force on the column.
Assuming zero axial force in the horizontal direction at the beam ends, the horizontal direction at the left beam end has the equations:
where,
d1 is the distance from the centre of the tensile longitudinal bars at the left beam end to the point where the compression on the concrete in the compression zone is combined with the longitudinal bars.
Bringing Equation (10) into Equation (9):
Similarly, for the right beam end there is the equation:
In either state, the damage to the left and right beam ends is theoretically perfectly symmetrical, i.e.,
d1 =
d2 =
d. During the loading process, the cracks continue to extend into the compression zone after the concrete in the tension zone at the beam end cracks, and the neutral axis of the beam cross-section continues to move upwards, so that
d also changes with the location of the concrete combination point in the compression zone. However, it is certain that the position of the concrete consolidation point in the compression zone before the joint is damaged will gradually approach the form centre of the compressed reinforcement section. Therefore, to simplify the calculation,
d is taken to be:
In the test, the top and bottom of the column are hinged supports with no bending moment, which will be used as the anti-bending point. The height, cross-section, and material of the upper and lower columns are identical, so the stiffnesses of the top and bottom are equal. Assuming that the joint core is rigid and no shear deformation occurs, it is easy to obtain from structural mechanics that the bending moment coming from the beam ends will be equally distributed between the upper and lower columns, so the upper and lower columns are equal in shear, and the equilibrium equation of the joint gives the following:
where
hc is the column height.
Bringing Equations (11)–(14) into Equation (8):
For the specimens configured with CRB735 in this paper, the beam and column end has not yet reached yield when the combination fails due to shear in the core. Therefore, the shear force of the combination calculated according to Equation (15) is the direct shear capacity of the joint core.
GB50010-2010 Code for Design of Concrete Structures [
27] recommends the following equation for calculating the shear capacity of frame beam-column joints without considering earthquake combinations:
where
N is the design value of the axial force at the column bottom considering the combined shear design value of the seismic action; when
N is the compression force, the smaller value of the axial compression design value is taken, and when
N is greater than 0.5
fcbchc, 0.5
fcbchc is taken; when
N is the tensile force, 0 is taken;
Asvj is the full cross-sectional area of each limb of the stirrup in the direction of the same cross-sectional check within the valid check width of the core;
hb0 is the effective height of the cross-section of the frame beam; the average value is taken when the height of the beam on both sides is not equal.
The shear force at the beam ends measured in the tests is brought into Equation (15) to obtain the measured shear capacity,
Vj, of the joint and then compared with the calculated value,
V’j, of Equation (16). The results of the comparison between
Vj and
V’j are shown in
Table 6.
As can be seen from the results in
Table 6, the measured values
Vj of the joints configured with CRB735 are all greater than the calculated ones
V’j provided by the existing code [
27]. Among them, the cruciform joints have a more adequate safety reserve, while the side joints are small. This is due to the fact that a larger number of longitudinal bars are configured in the design to ensure that the beam in the side joints do not bending failure, compared to the cruciform joints, and all these longitudinal bars are anchored in the core of the side joints, resulting in a reduced range of diagonal compression bar mechanisms. In summary, when shear failure occurs in the core controlled by the material properties of the joints, the shear capacity calculation Equation (16) in
GB50010-2010 Code for Design of Concrete Structures [
27] can be used directly to calculate the ultimate shear capacity of beam-column joints configured with CRB735.
6. Conclusions
To study the seismic performance of high-strength reinforced concrete frame joints, cyclic loading tests were carried out on six concrete beam-column joints configured with the new CRB735 high-strength steel reinforcement and one joint with HRB400 ordinary steel reinforcement to obtain the effects of the axial compression ratio and the stirrup ratio in the joint core on the seismic performance of the joints. The results show the following:
(1) Increasing the axial compression ratio can improve the energy dissipation characteristics of the joints configured with CRB735, but cannot effectively improve the ultimate shear capacity of the joints. Larger axial compression ratio will cause earlier cracks in the joint core area and reduce the ductility by 6.1~27.9%.
(2) Increasing the stirrup ratio in the joint core will increase the shear capacity of the joint by 5.3~8.1% while also increasing the damage displacement by 2.8~14.9%. When the joints are equipped with CRB735 stirrups, the rate of stiffness degradation from core cracking to the yielding stage of the specimens will be effectively delayed.
(3) Compared with the joint configured with HRB400, the ultimate loading process of the joints with CRB735 is shorter, the yield load and yield displacement are higher, and the specimens are close to the ultimate state when they reach yield.
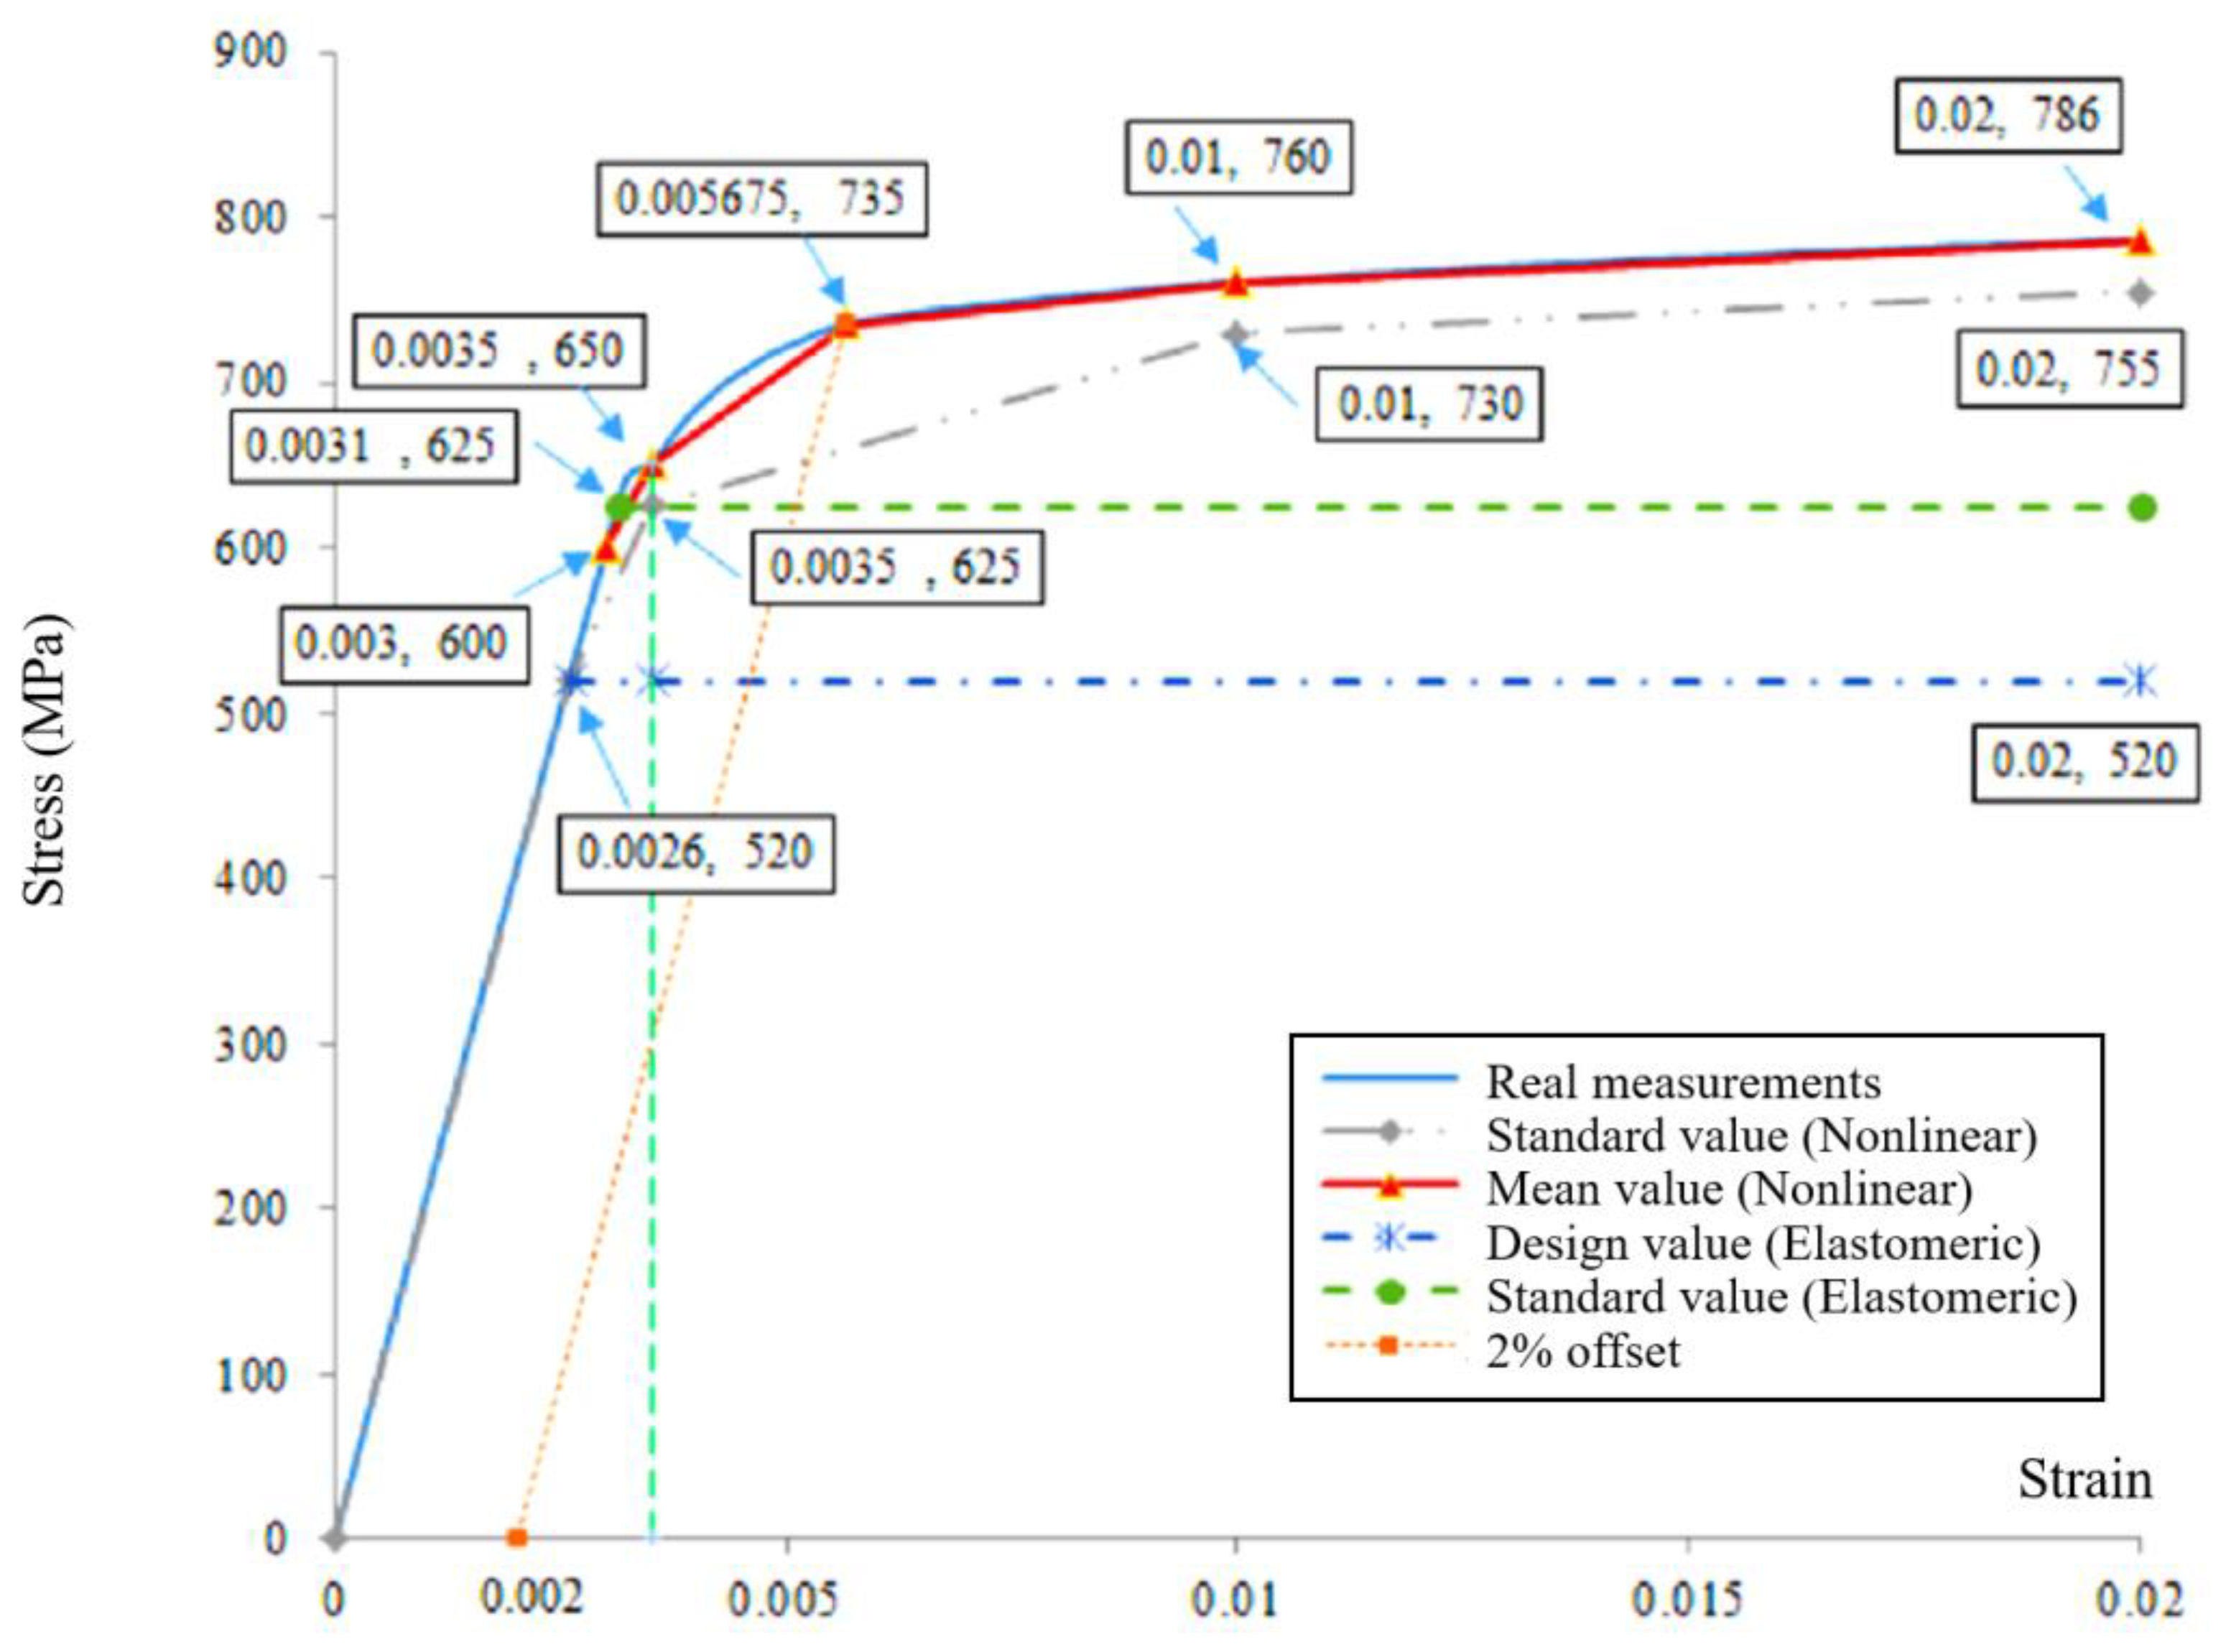
(4) The shear capacity of concrete beam-column joints configured with CRB735 can be calculated using the relevant shear capacity equation in GB50010-2010 Code for Design of Concrete Structures, and has a certain safety reserve. In the equation, the yield strength of CRB735 steel reinforcement is recommended to be 735 MPa.
(5) This study demonstrates that concrete beam-column joints configured with CRB735 can be designed based on GB50010-2010 Code for Design of Concrete Structures under core shear failure, but it remains to be investigated whether the same applies to the beam end failure. Interestingly, this study has identified attractive high strength and high ductility characteristics of CRB735, which will provide additional application scenarios for CRB735, such as prestressing bars in bridges, anchor systems in foundation works and underground works.


