

Seismic Hazard Curve as Dynamic Parameters in Earthquake Building Design for Sabah, Malaysia

Abstract
:1. Introduction
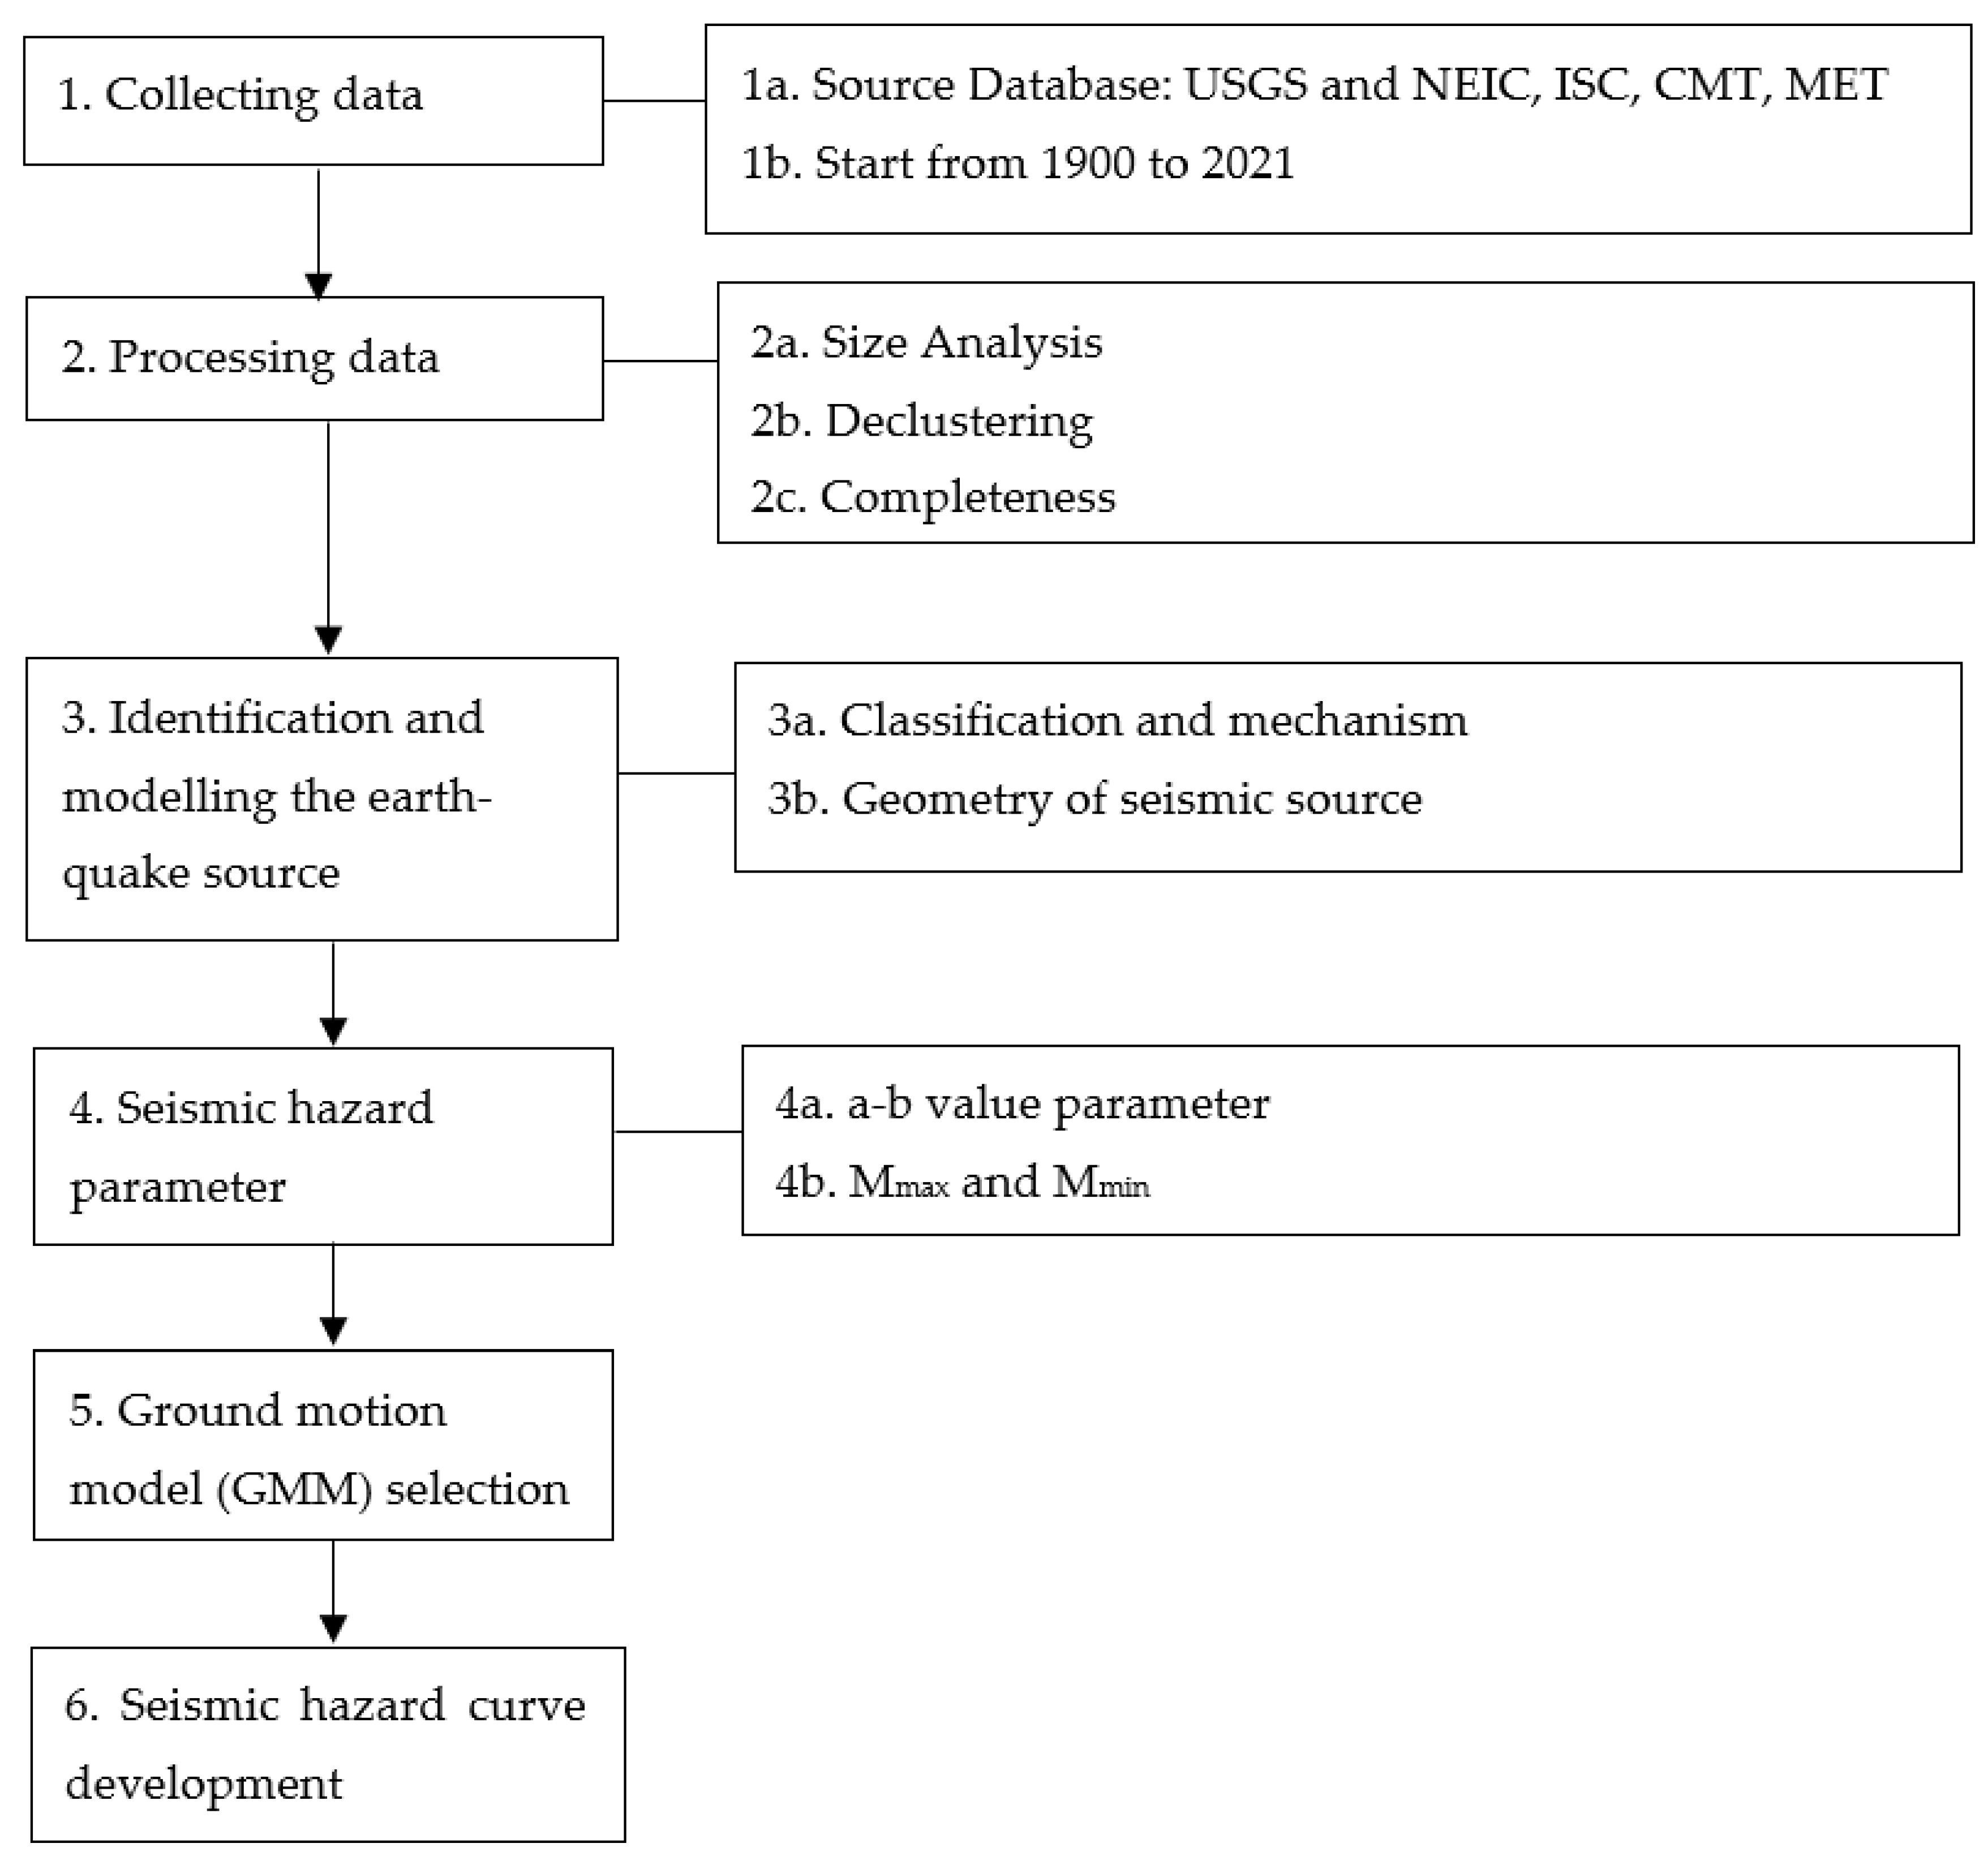
2. Methods
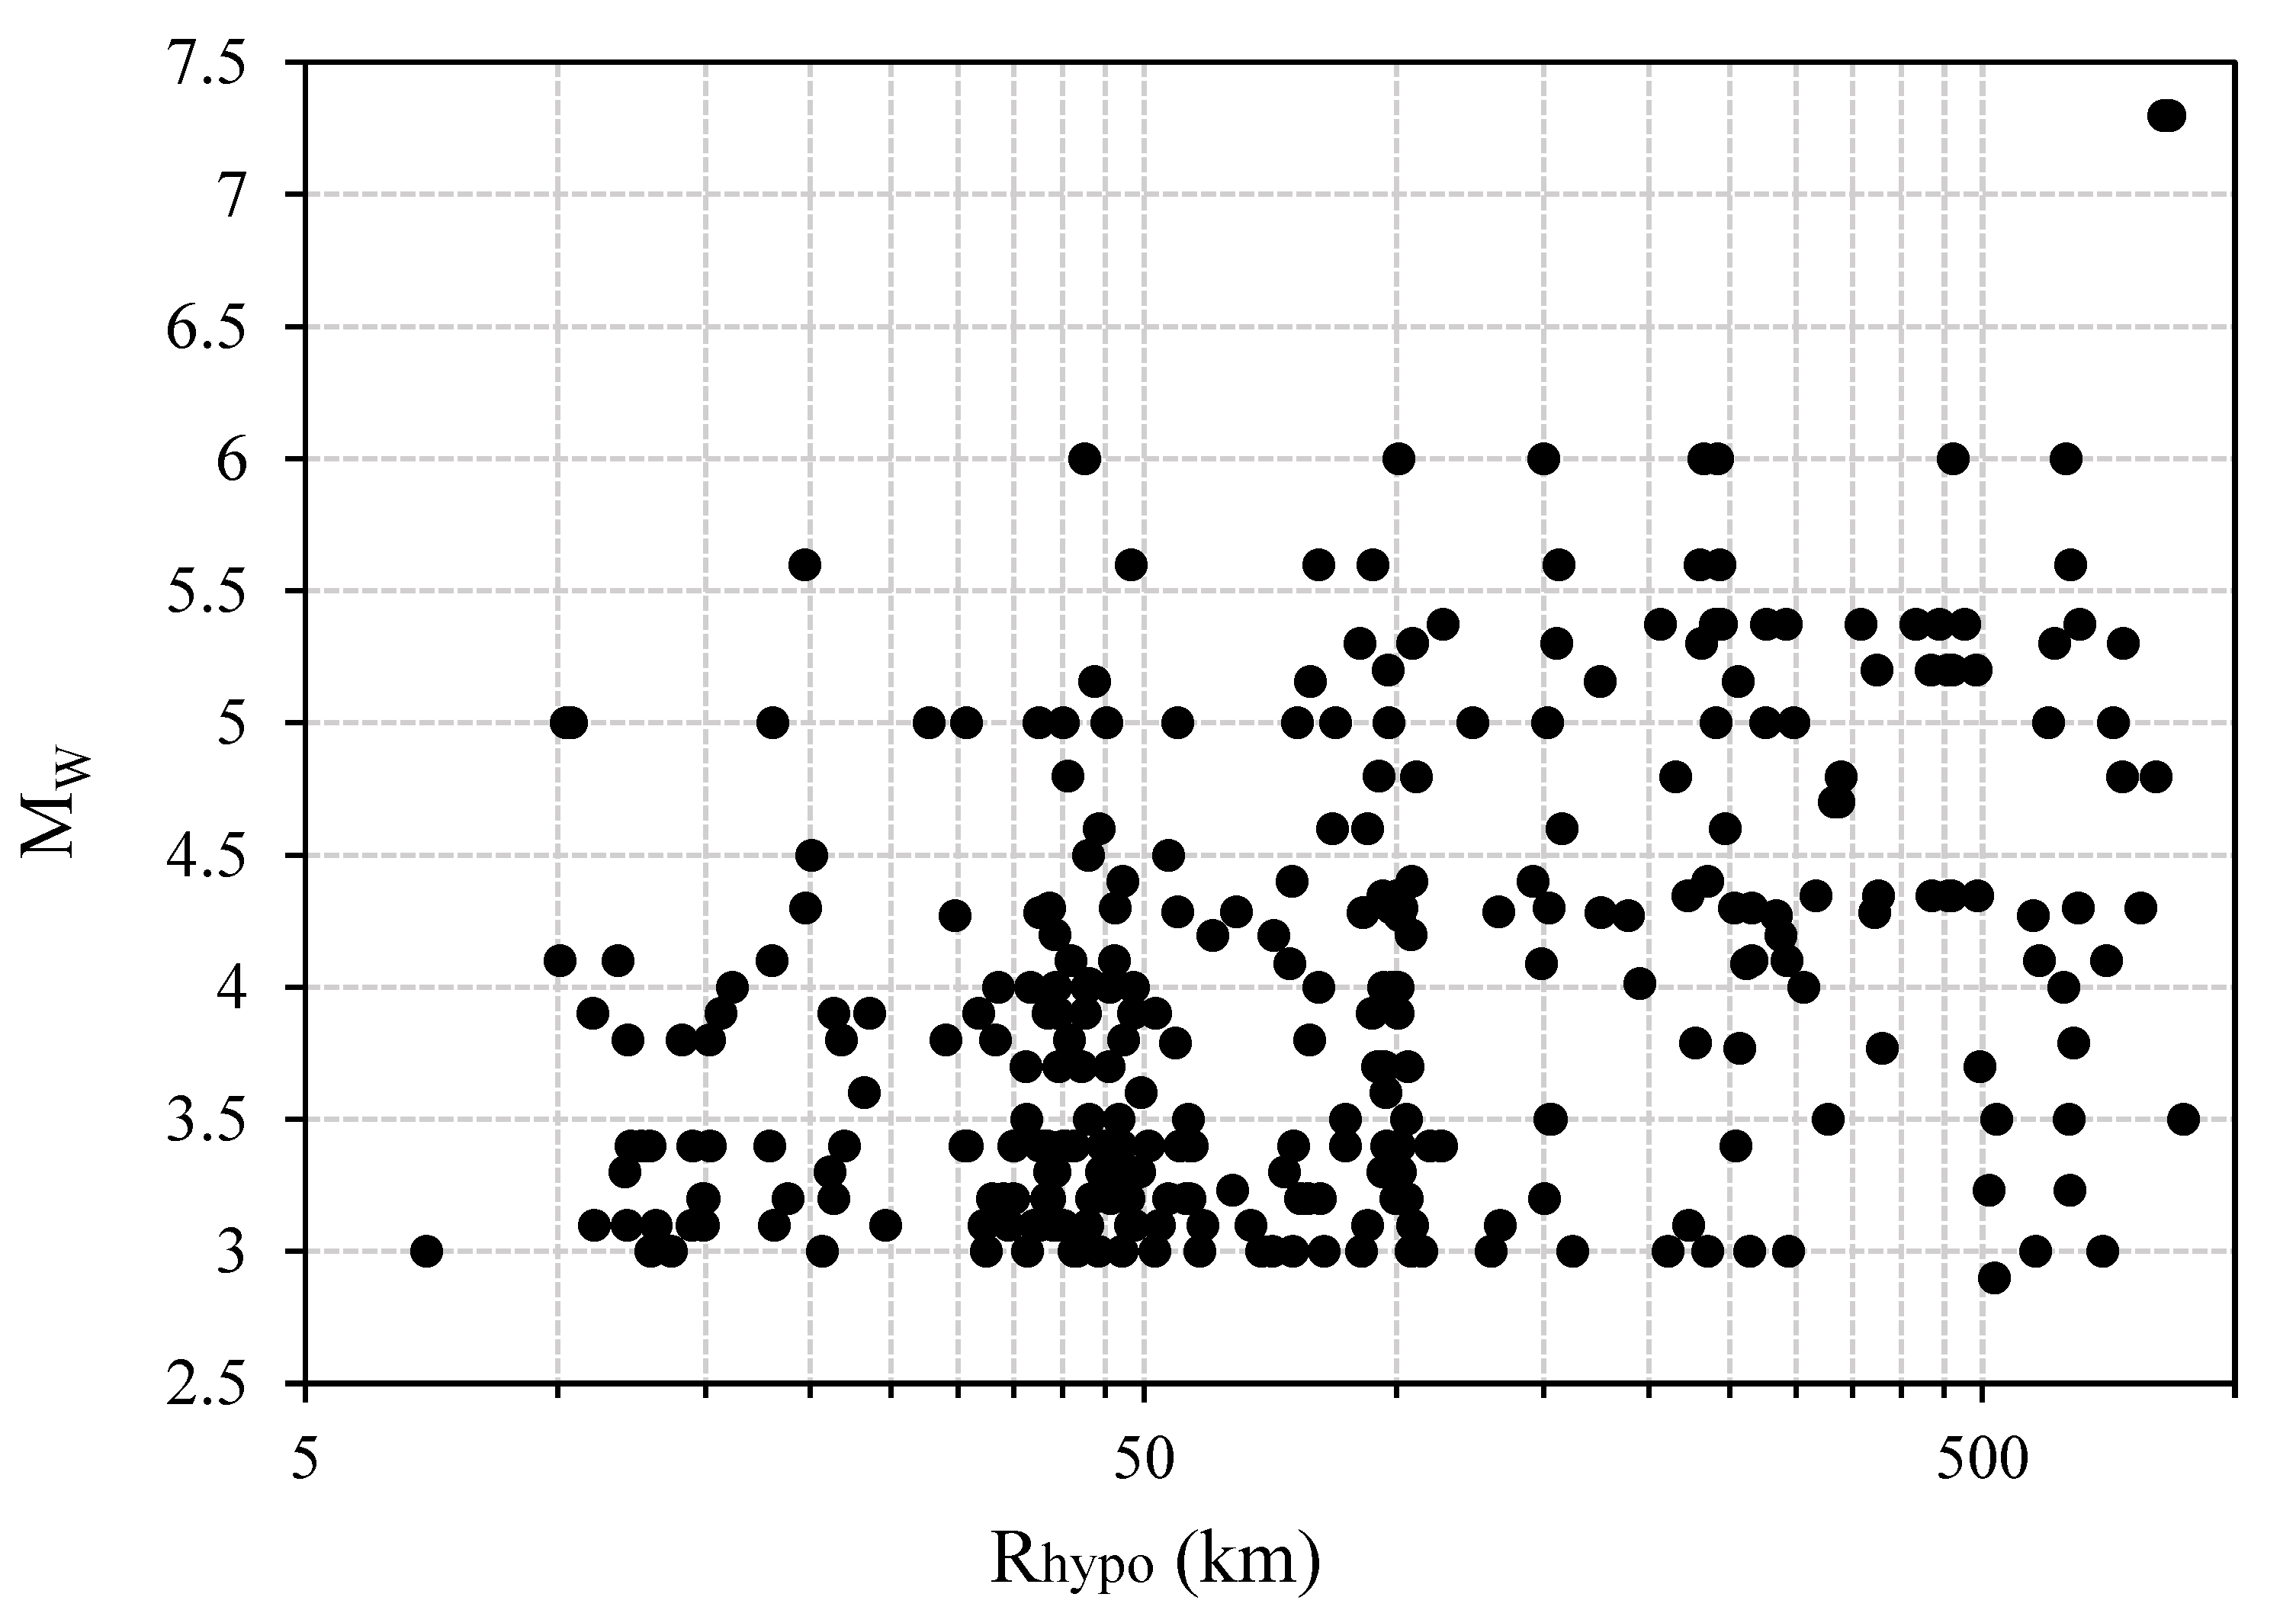
2.1. Data Collection and Processing Earthquake Catalog
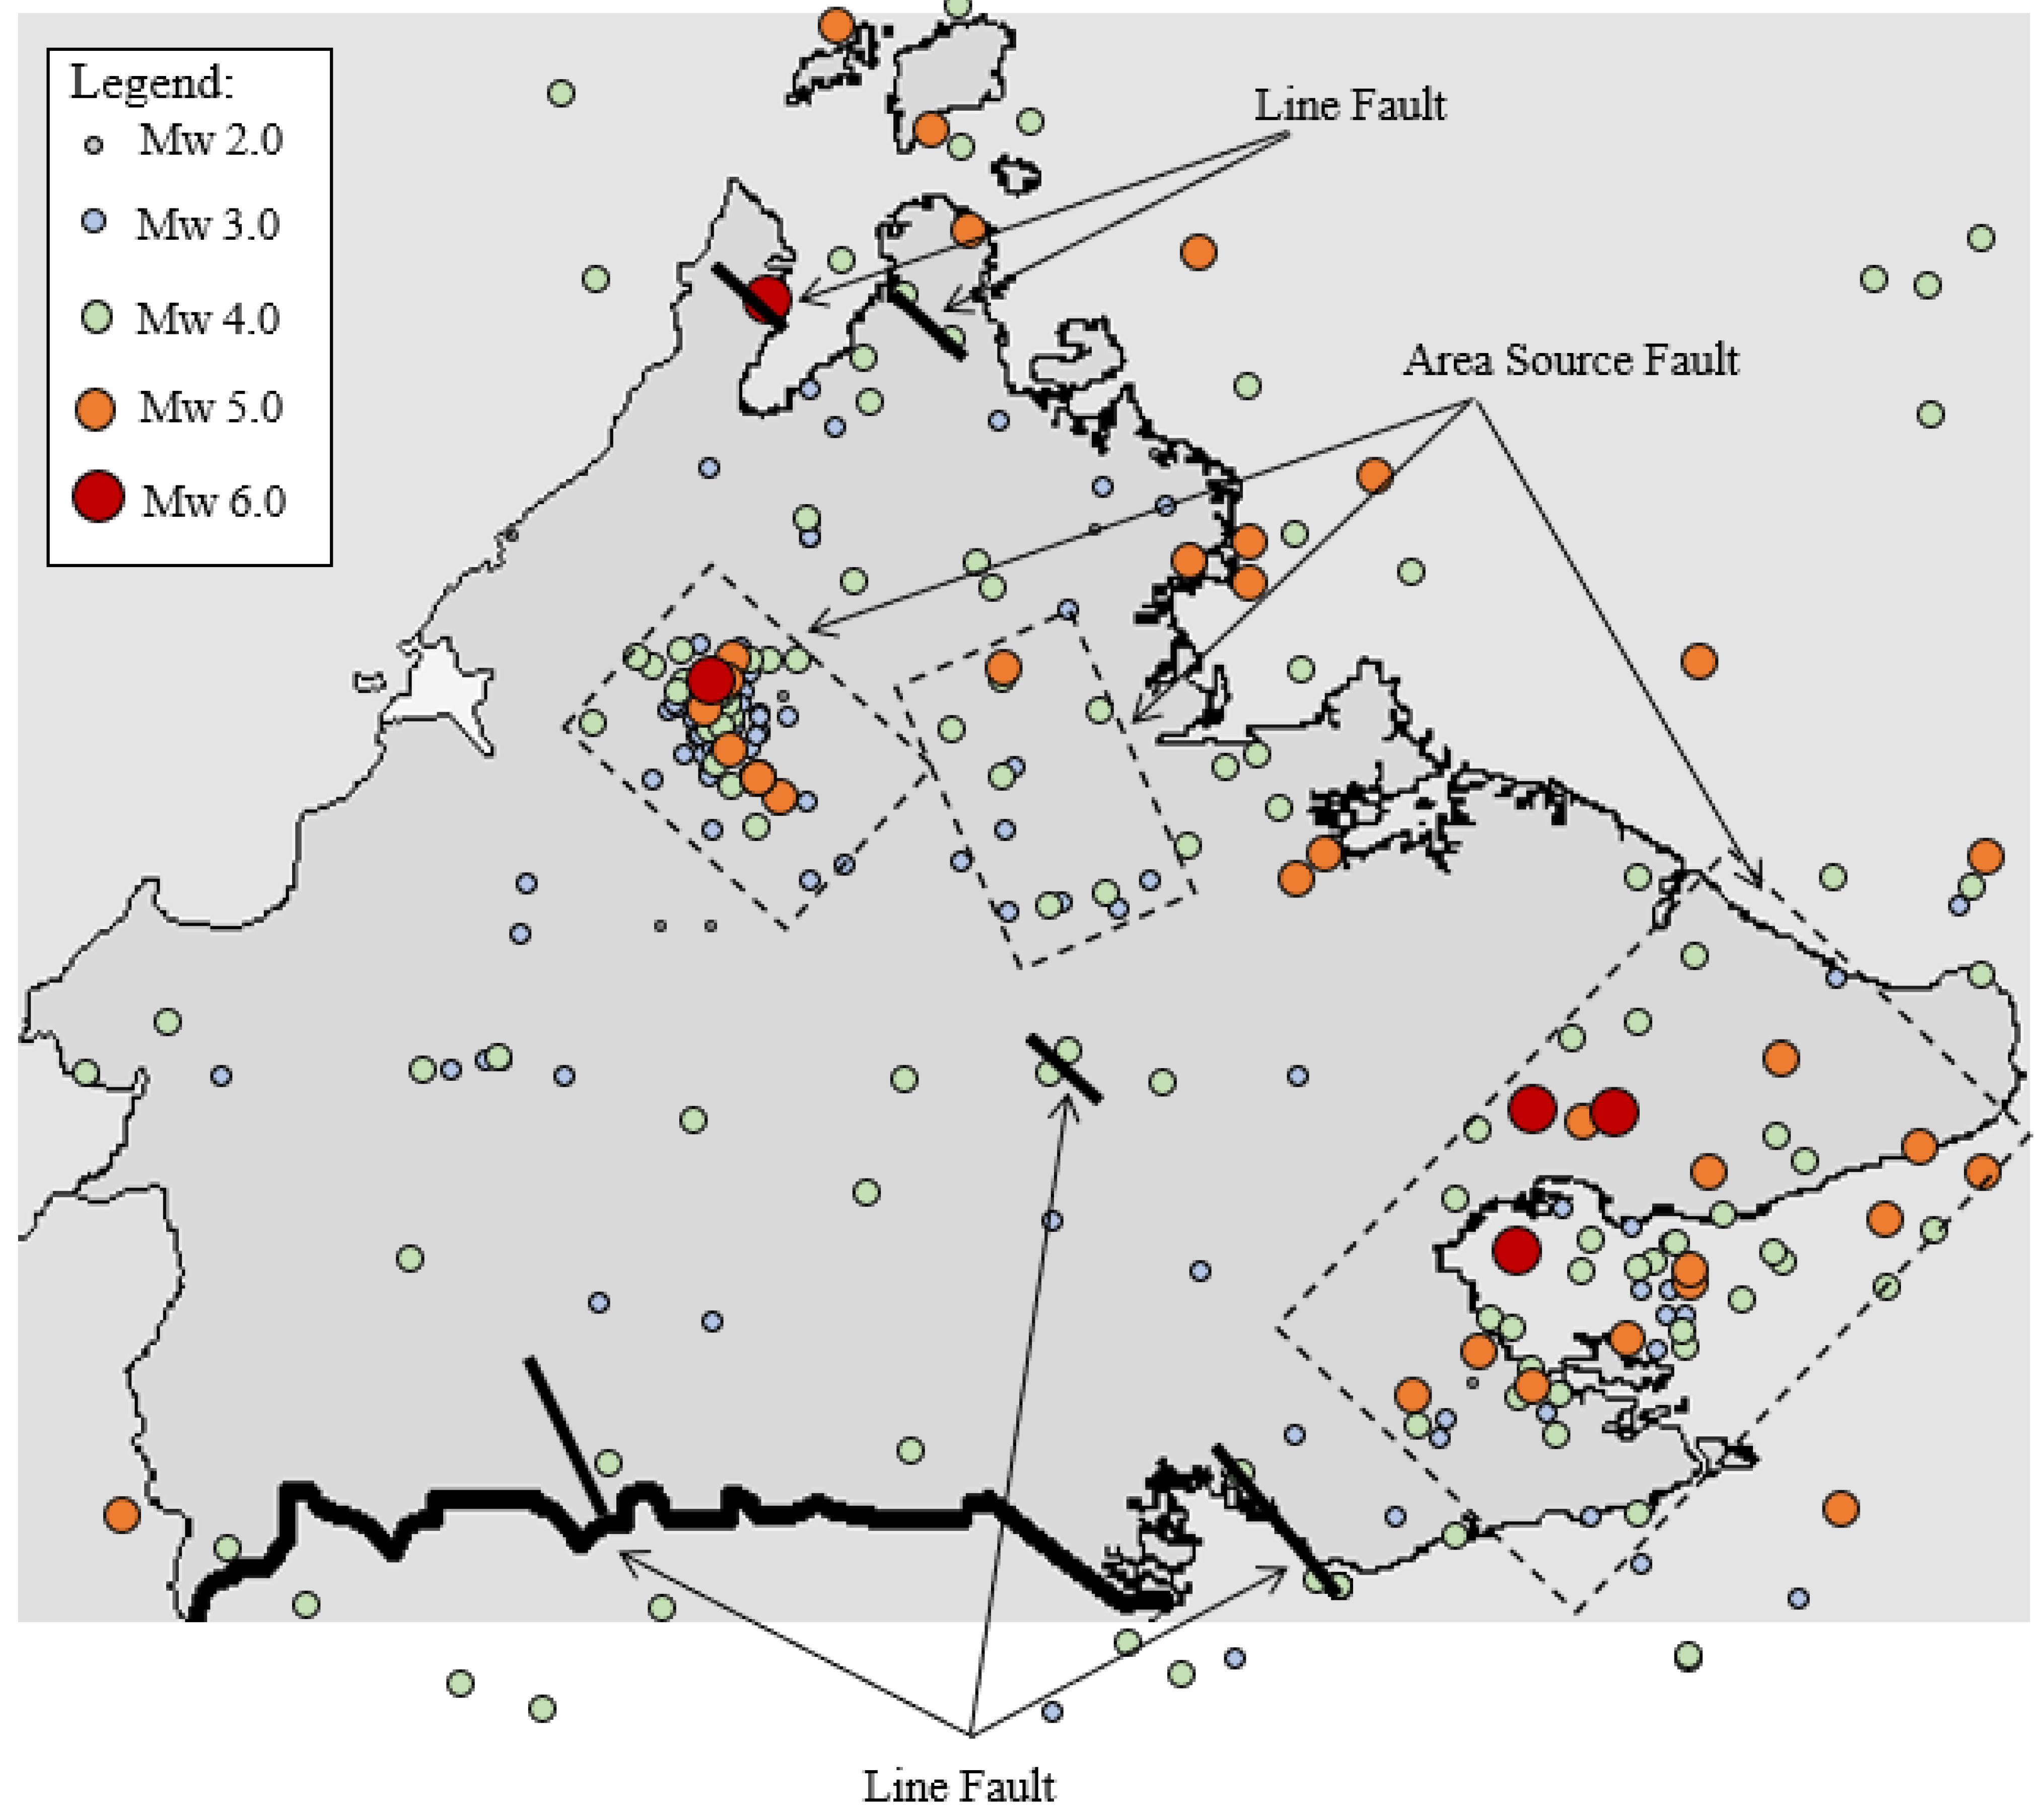
2.2. Identification and Modelling the Earthquake Source
2.3. Ground Motion Model Description
2.4. Seismic Hazard Parameter
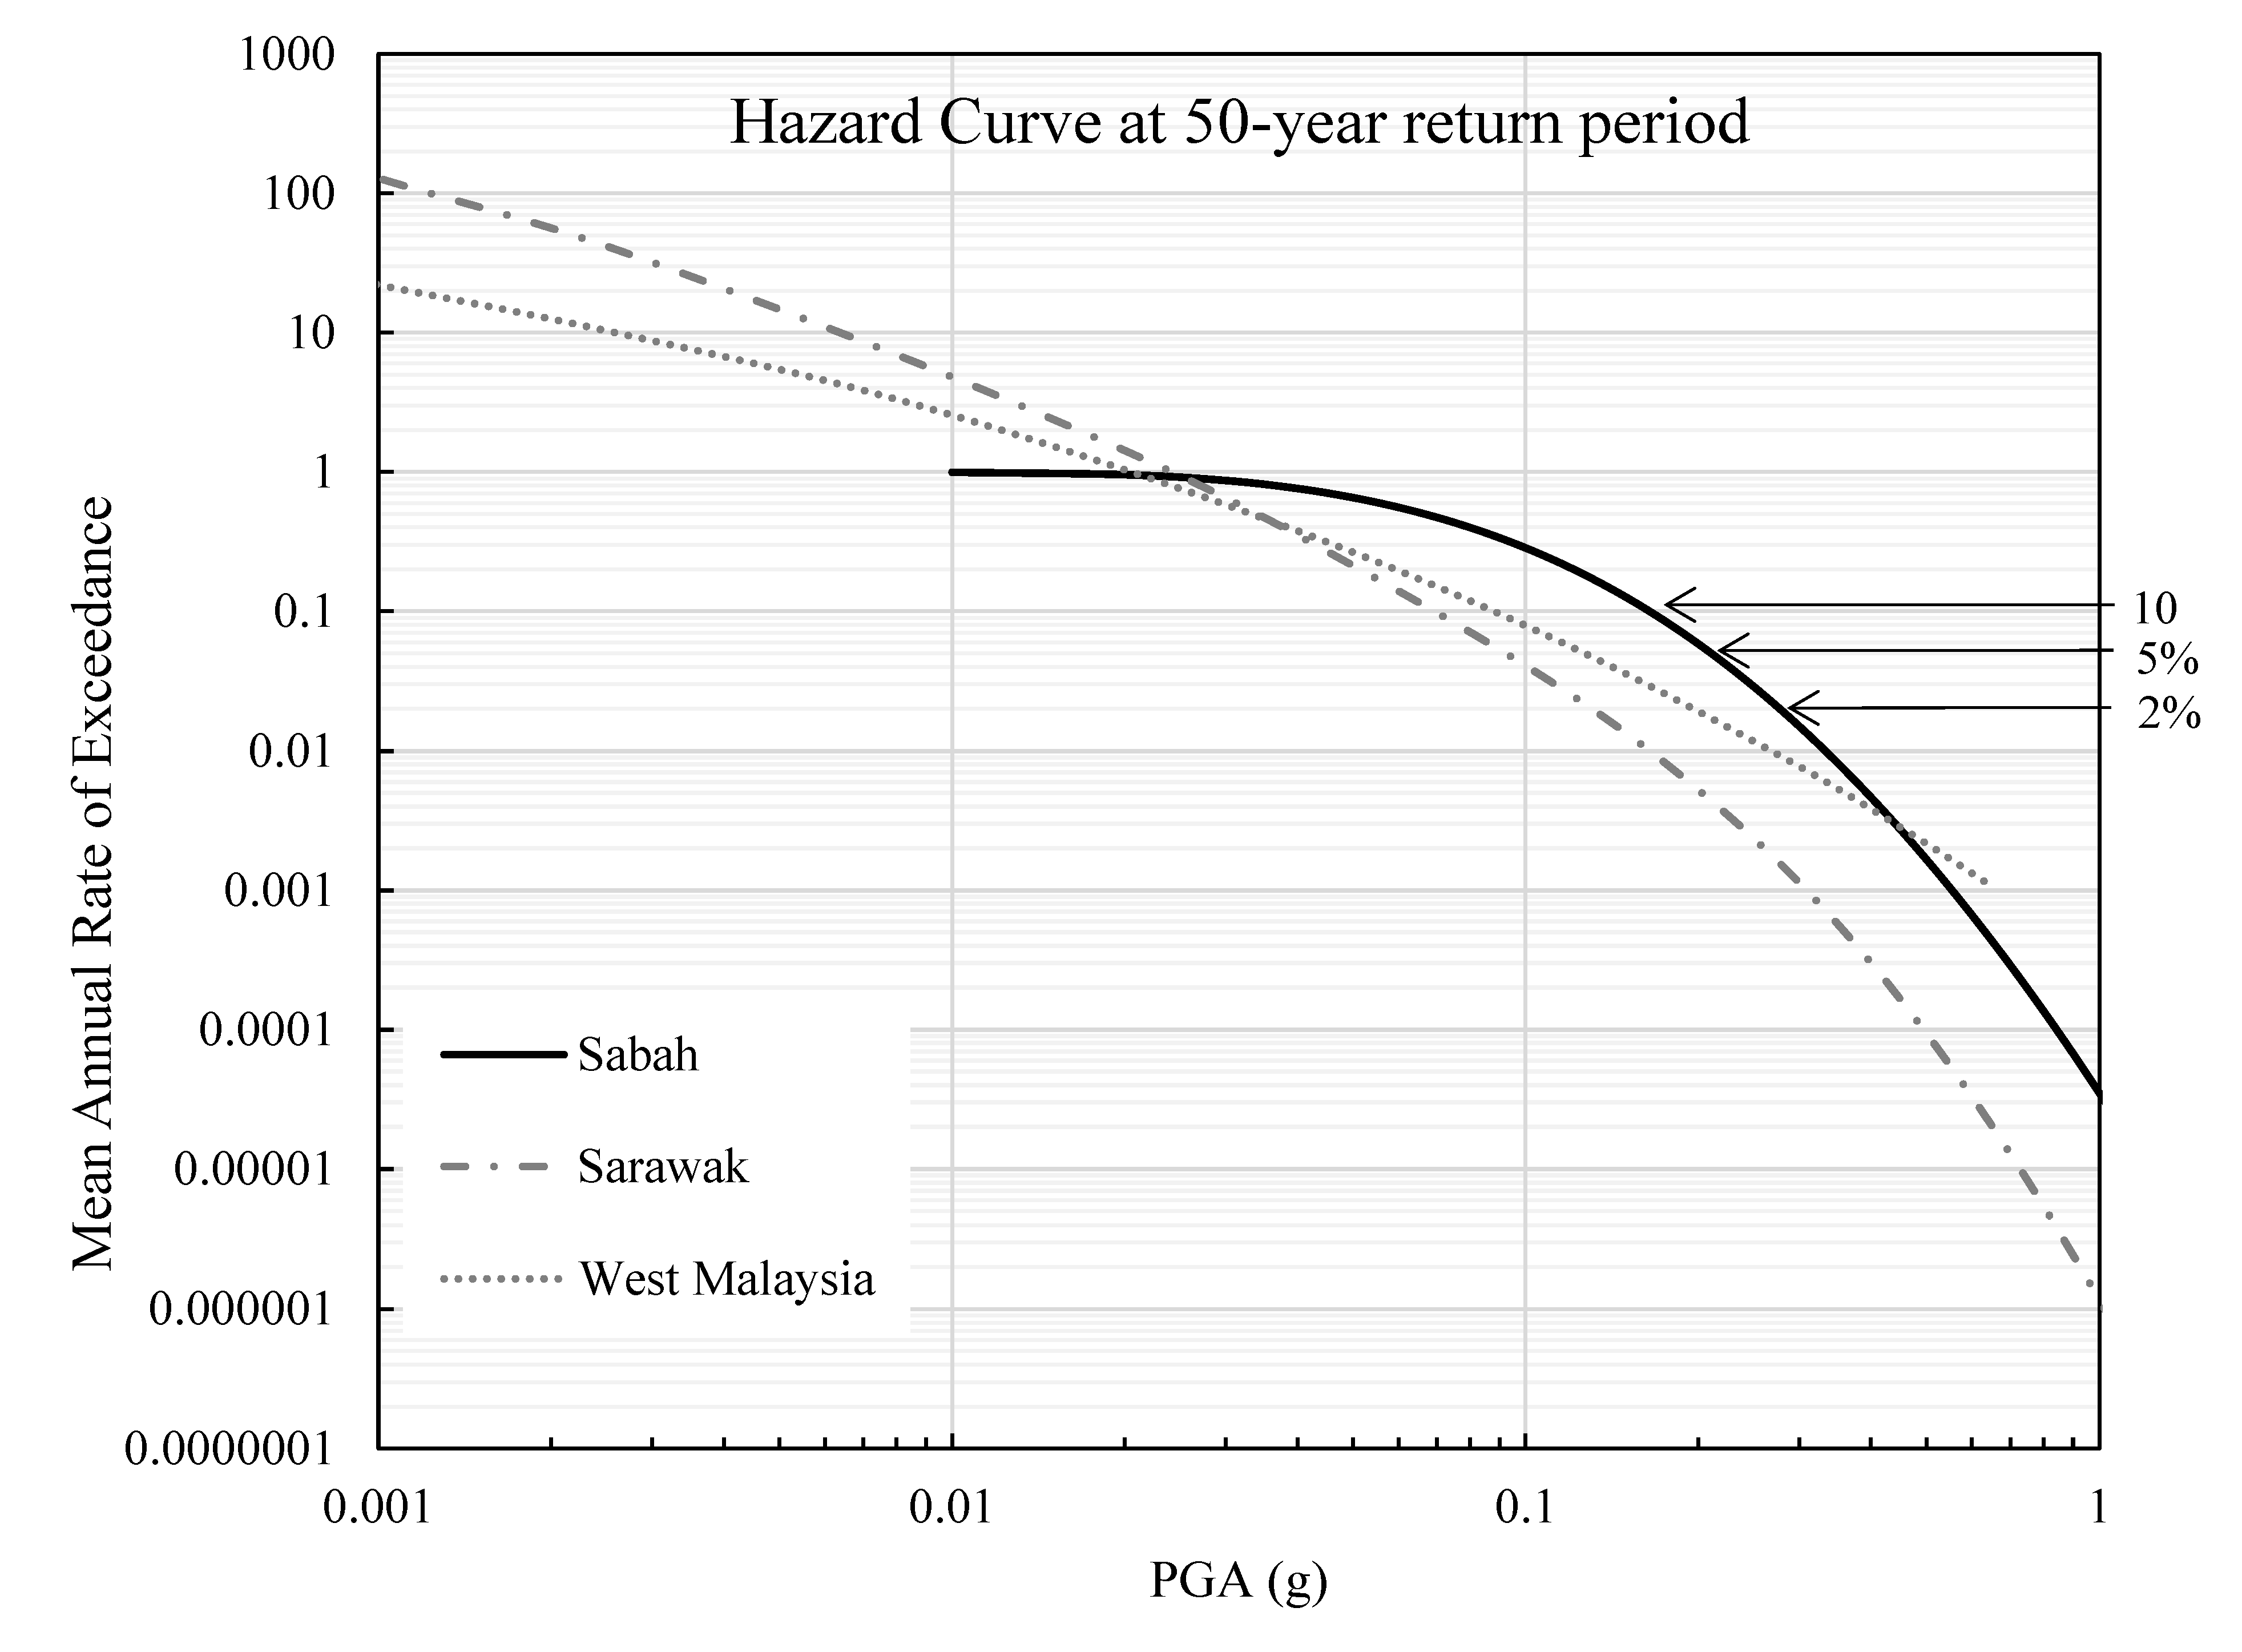
2.5. Seismic Hazard Curve Calculation
3. Results
4. Conclusions
Author Contributions
Funding
Data Availability Statement
Conflicts of Interest
References
- Alberto, P.; Igor, L.; Roberto, N. Seismic vulnerability assessment of an infilled reinforced concrete frame structure designed for gravity load. J. Earthq. Eng. 2017, 21, 267–289. [Google Scholar]
- Perrone, D.; Calvi, P.M.; Nascimbene, R.; Fischer, E.C.; Magliulo, G. Seismic performance of non-structural elements during the 2016 Central Italy earthquake. Bull. Earthq. Eng. 2019, 17, 5655–5677. [Google Scholar] [CrossRef]
- Hutchings, S.J.; Mooney, W.D. The seismicity of Indonesia and tectonic implications. Geochem. Geophys. Geosystems 2021, 22, 1–42. [Google Scholar] [CrossRef]
- Muhd Yusrizal, Z.A.; Moosom, V.S.; Ismadi, P.N.N.; Farish, M.M.L.B.M.M.; Sulaiman, S.S.B. Is Malaysia Located in The Pacific Ring of Fire? A Legal Perspective. In Law, Environment and Society, 1st ed.; Kamaruddin, H., Tan, S., Thambusamy, R.X., Eds.; Future Academy, Universiti Kebangsaan Malaysia (UKM): Bangi, Malaysia, 2019; pp. 181–189. [Google Scholar]
- Borah, N.; Kumar, A.; Dhanotiya, R. Seismic source zonation for NE India on the basis of past EQs and spatial distribution of seismicity parameters. J. Seismol. 2021, 25, 1483–1506. [Google Scholar] [CrossRef]
- Sawires, R.; Peláez, J.A.; Hamdache, M. Probabilistic Seismic Hazard Assessment for United Arab Emirates, Qatar and Bahrain. Seismic source zonation for NE India on the basis of past EQs and spatial distribution of seismicity parameters. Appl. Sci. 2020, 10, 7901. [Google Scholar] [CrossRef]
- MSEN1998-1:2015; Malaysia National Annex to Eurocode 8: Design of Structures for Earthquake Resistance—Part 1: General Rules, Seismic Actions and Rules for Buildings. 1st ed. Department of Standards Malaysia: Kuala Lumpur, Malaysia, 2017; pp. 1–39.
- Drouet, S.; Ameri, G.; Le Dortz, K.; Secanell, R.; Senfaute, G. A probabilistic seismic hazard map for the metropolitan France. Bull. Earthq. Eng. 2020, 18, 1865–1898. [Google Scholar] [CrossRef]
- Eurocode 8; Design of Structures for Earthquake Resistance—Part 1: General Rules, Seismic Actions and Rules for Buildings. 1st ed. European Committee for Standardization, The European Union: Brussels, Belgium, 2004; pp. 1–231.
- Sharon, M.; Sagy, A.; Kurzon, I.; Marco, S.; Rosensaft, M. Assessment of seismic sources and capable faults through hierarchic tectonic criteria: Implications for seismic hazard in the Levant. Nat. Hazards Earth Syst. Sci. 2020, 05, 125–148. [Google Scholar] [CrossRef] [Green Version]
- Wannier, M. History of geological mapping in Sabah (late 19th Century-1951). Bull. Geol. Soc. Malays. 2017, 64, 37–49. [Google Scholar] [CrossRef] [Green Version]
- Mohd Zainudin, M.S.F.; Zubir, N.; Yan, A.S.W.; Amnan, I.; Among, H.L.; Javino, F. Geological Map of Sabah, 1st ed.; Minerals and Geoscience Malaysia: Kota Kinabalu, Malaysia, 2015; p. 1.
- Agarwal, J.; Blockley, D. Structural integrity: Hazard, vulnerability and risk. Int. J. Mater. Struct. Integr. 2007, 1, 117–127. [Google Scholar] [CrossRef]
- Looi, D.T.W.; Lam, N.; Tsang, H.H. Developing Earthquake-Resistant Structural Design Standard for Malaysia Based on Eurocode 8: Challenges and Recommendations. Standards 2021, 1, 134–153. [Google Scholar] [CrossRef]
- Chong, J.H.; Alih, S.C.; Vafaei, M.; Wong, W.K. Seismic Performance of Low Ductile RC Frame Designed in Accordance with Malaysia National Annex to Eurocode 8. IOP Conf. Ser. Earth Environ. Sci. 2021, 682, 012011. [Google Scholar] [CrossRef]
- Looi, D.T.W.; Tsang, H.H.; Hee, M.C. Seismic Hazard Modelling for Malaysia and Singapore. In Proceedings of the 2017 World Congress on Advances in Structural Engineering and Mechanics (ASEM17), Ilsan, Seoul, Republic of Korea, 28 August–1 September 2017. [Google Scholar]
- Pagani, M.; Garcia-Pelaez, J.; Gee, R.; Johnson, K.; Poggi, V.; Silva, V.; Simionato, M.; Styron, R.; Vigano, D.; Danciu 10, L. The 2018 version of the Global Earthquake Model: Hazard component. Earthq. Spectra 2020, 36, 226–251. [Google Scholar] [CrossRef]
- Yang, Y.; Shi, B.; Sun, L. Seismic hazard estimation based on the distributed seismicity in northern China. Earthq. Sci. 2008, 21, 202–212. [Google Scholar] [CrossRef] [Green Version]
- Dutfoy, A. Estimation of the Gutenberg–Richter earthquake recurrence parameters for unequal observation periods and imprecise magnitudes. Pure Appl. Geophys. 2020, 177, 4597–4606. [Google Scholar] [CrossRef]
- Al Atik, L.; Abrahamson, N. An improved method for nonstationary spectral matching. Earthq. Spectra 2010, 26, 601–617. [Google Scholar] [CrossRef] [Green Version]
- Marmureanu, G.; Cioflan, C.O.; Marmureanu, A.; Ionescu, C.; Manea, E.F. Bridging the Gap Between Nonlinear Seismology as Reality and Earthquake Engineering. In Perspectives on European Earthquake Engineering and Seismology, 1st ed.; Ansal, A., Ed.; Geotechnical, Geological and Earthquake Engineering: Istanbul, Turkey, 2015; Volume 2, pp. 409–428. [Google Scholar]
- Solarino, F.; Giresini, L. Fragility curves and seismic demand hazard analysis of rocking walls restrained with elasto-plastic ties. Earthq. Eng. Struct. Dyn. 2021, 50, 3602–3622. [Google Scholar] [CrossRef]
- Vargas-Alzate, Y.F.; Hurtado, J.E.; Pujades, L.G. New insights into the relationship between seismic intensity measures and nonlinear structural response. Bull. Earthq. Eng. 2022, 20, 2329–2365. [Google Scholar] [CrossRef]
- Jorge, L.A.; José, A.R.; Rossana, V. Unification of different approaches to probabilistic seismic hazard analysis. Bull. Seismol. Soc. Am. 2020, 110, 2816–2827. [Google Scholar]
- Beauval, C.; Bard, P.Y. History of probabilistic seismic hazard assessment studies and seismic zonations in mainland France. Géoscience 2021, 353, 413–440. [Google Scholar] [CrossRef]
- Lamessa, G.; Mammo, T.; Raghuvanshi, T.K. Homogenized earthquake catalog and b-value mapping for Ethiopia and its adjoining regions. Geoenviron. Disasters 2019, 6, 1–24. [Google Scholar] [CrossRef] [Green Version]
- Ghasemi, H.; Cummins, P.; Weatherill, G.; McKee, C.; Hazelwood, M.; Allen, T. Seismotectonic model and probabilistic seismic hazard assessment for Papua New Guinea. Bull. Earthq. Eng. 2020, 18, 6571–6605. [Google Scholar] [CrossRef]
- Sianko, I.; Ozdemir, Z.; Khoshkholghi, S.; Garcia, R.; Hajirasouliha, I.; Yazgan, U.; Pilakoutas, K. A practical probabilistic earthquake hazard analysis tool: Case study Marmara region. Bull. Earthq. Eng. 2020, 18, 2523–2555. [Google Scholar] [CrossRef]
- Ranjit, D.; Claudio, M. A unified moment magnitude earthquake catalog for Northeast India. Geomat. Nat. Hazards Risk 2021, 12, 167–180. [Google Scholar]
- Leptokaropoulos, K.M.; Gkarlaouni, C.G. A magnitude independent space-time earthquake clustering algorithm. Bull. Geol. Soc. Greece 2016, 50, 1359–1368. [Google Scholar] [CrossRef] [Green Version]
- Zaliapin, I.; Ben-Zion, Y. Earthquake declustering using the nearest-neighbor approach in space-time-magnitude domain. J. Geophys. Res. 2020, 125, 1–33. [Google Scholar] [CrossRef]
- Cesca, S.S. A tool for density-based seismicity clustering and visualization. J. Seismol. 2020, 24, 443–457. [Google Scholar] [CrossRef]
- Pagani, M.; Monelli, D.; Weatherill, G.; Danciu, L.; Crowley, H.; Silva, V.; Henshaw, P.; Butler, R.; Nastasi, M.; Panzeri, L.; et al. OpenQuake engine: An open hazard (and risk) software for the Global Earthquake Model. Seismol. Res. Lett. 2014, 85, 692–702. [Google Scholar] [CrossRef] [Green Version]
- Anbazhagan, P.; Bajaj, K.; Matharu, K.; Moustafa, S.S.R.; Al-Arifi, N.S.N. Probabilistic seismic hazard analysis using the logic tree approach—Patna district (India). Nat. Hazards Earth Syst. Sci. 2019, 19, 2097–2115. [Google Scholar] [CrossRef] [Green Version]
- Weatherill, G.; Cotton, F. A ground motion logic tree for seismic hazard analysis in the stable cratonic region of Europe: Regionalisation, model selection and development of a scaled backbone approach. Bull. Earthq. Eng. 2020, 18, 6119–6148. [Google Scholar] [CrossRef]
- Abrahamson, N.; Silva, W. Summary of the Abrahamson & Silva NGA ground-motion relations. Earthq. Spectra 2008, 24, 67–97. [Google Scholar]
- Zhao, J.X.; Zhang, J.; Asano, A.; Ohno, Y.; Oouchi, T.; Takahashi, T.; Ogawa, H.; Irikura, K.; Thio, H.K.; Somerville, P.G.; et al. Attenuation relations of strong ground motion in Japan using site classification based on predominant period. Bull. Seismol. Soc. Am. 2006, 96, 898–913. [Google Scholar] [CrossRef]
- Fukushima, Y.; Tanaka, T. The revision of A New Attenuation Relation for Peak Horizontal Acceleration of Strong Earthquake Ground Motion in Japan. Abstr. Seismol. Soc. Jpn. 1992, 1, B18. [Google Scholar]
- Van, T.C.; Lau, T.L.; Mok, C.F. Selection of ground motion attenuation model for Peninsular Malaysia due to far-field Sumatra earthquakes. Nat. Hazards 2015, 80, 1865–1889. [Google Scholar] [CrossRef]
- Cummins, P.R. Geohazards in Indonesia: Earth science for disaster risk reduction-introduction. Geol. Soc. 2017, 441, 1–7. [Google Scholar] [CrossRef]
- Taroni, M.; Selva, J.; Zhuang, J. Estimation of the tapered Gutenberg-Richter distribution parameters for catalogs with variable completeness: An application to the Atlantic ridge seismicity. Appl. Sci. 2021, 11, 12166. [Google Scholar] [CrossRef]
- Baker, J.W.; Bradley, B.A.; Stafford, P.J. Seismic Hazard and Risk Analysis, 1st ed.; Cambridge University Press: Cambridge, UK, 2021; pp. 1–600. [Google Scholar]
- Ahmadi, R.; Ahmad, A.; Abdullahi, A.F.; Najar, I.A.; Muhamad Suhaili, M.H.A. A Framework on Site-Specific Probabilistic Seismic Hazard Assessment of Tabung Haji Hotel and Convention Centre in Kuching, Sarawak, Malaysia. Available online: https://www.researchgate.net/publication/336207830_A_framework_on_site-specific_probabilistic_seismic_hazard_assessment_of_Tabung_Haji_hotel_and_Convention_centre_in_Kuching_Sarawak_Malaysia (accessed on 1 November 2022).
- Loi, D.; Raghunandan, M.; Swamy, V. Revisiting seismic hazard assessment for Peninsular Malaysia using deterministic and probabilistic approaches. Nat. Hazards Earth Syst. Sci. 2018, 18, 2387–2408. [Google Scholar] [CrossRef] [Green Version]
- Khoiry, M.A.; Hamzah, N.; Osman, S.; Mutalib, A.; Hamid, R. Physical damages effect on residential houses caused by the earthquake at Ranau, Sabah Malaysia. Int. J. Eng. Technol. 2018, 10, 414–418. [Google Scholar] [CrossRef] [Green Version]
- Roslee, R.; Termizi, A.K.; Indan, E.; Tongkul, F. Earthquake vulnerability assessment (EVAs): Analysis of environmental vulnerability and social vulnerability in Ranau area, Sabah, Malaysia. Geol. Behav. 2018, 2, 24–28. [Google Scholar]
- Ganasan, R.; Tan, C.G.; Ibrahim, Z.; Mohamed Nazri, F.; Wong, H. A Case Study on Structural Failure of Reinforced Concrete Beam-Column Joint After the First Significant Earthquake Impact in Malaysia. Int. J. Integr. Eng. 2020, 12, 288–302. [Google Scholar] [CrossRef]
- Razak, J.; Rambat, S.; Che Ros, F.; Shi, Z.; Mazlan, S. Seismic vulnerability assessment in Ranau, Sabah, using two different models. Int. J. Geo-Inf. 2021, 10, 1–25. [Google Scholar]


| Reference | PGA at 10% PE (g) | ||
|---|---|---|---|
| Sabah | Sarawak | West Malaysia | |
| Looi et al. [16] | 0.15 | 0.11 | 0.11 |
| MSEN1998-1:2015 [7] | 0.16 | 0.15 | 0.13 |
| Pagani et al. [17] | 0.13 | 0.13 | 0.08 |
| GMM Model | Description | Range of Magnitude | Distance Definition |
|---|---|---|---|
| Abrahamson and Silva [36] | Using the PEER NGA database, empirical ground motion models for the rotation-independent average horizontal component from shallow crustal earthquakes are created. The active shallow crust tectonic zone is supported. | 5.0–8.5 | Required distance measures at 0–200 km. |
| Zhao et al. [37] | Regression of historical data, primarily from Japan’s subduction and crustal earthquakes, with data from earthquakes in the Western United States and the 1978 Tabas earthquake in Iran thrown in for good measure. | 5.1–7.3 | If a fault model is provided, the hypocentral distance (Rhyp), 0–300 km, is the shortest distance to the rupture plane (Rrup). |
| Fukushima and Tanaka [38] | Designed for active shallow crustal earthquakes. | 4.6–8.2 | Closest distance to the fault, 1–300 km. |
| Segment | Locality | Frequency–Magnitude Relationship | Mmax | |
|---|---|---|---|---|
| β | λ | |||
| Area | Lahad Datu | 0.921 | 0.201 | 6.5 |
| Ranau | 0.152 | |||
| Labuk | 0.824 | 0.043 | 5.5 | |
| Line | Kudat | 0.921 | 0.152 | 6.0 |
| Pitas | 0.824 | 0.043 | 5.0 | |
| Perancangan | ||||
| Pensiangan | ||||
| Tawau | ||||
| Kunak | 1.051 | 0.175 | 6.0 | |
| Background | BS1 | 0.824 | 0.043 | 4.0 |
| BS2 | 1.051 | 0.175 | 5.5 | |
| BS3 | 6.0 | |||
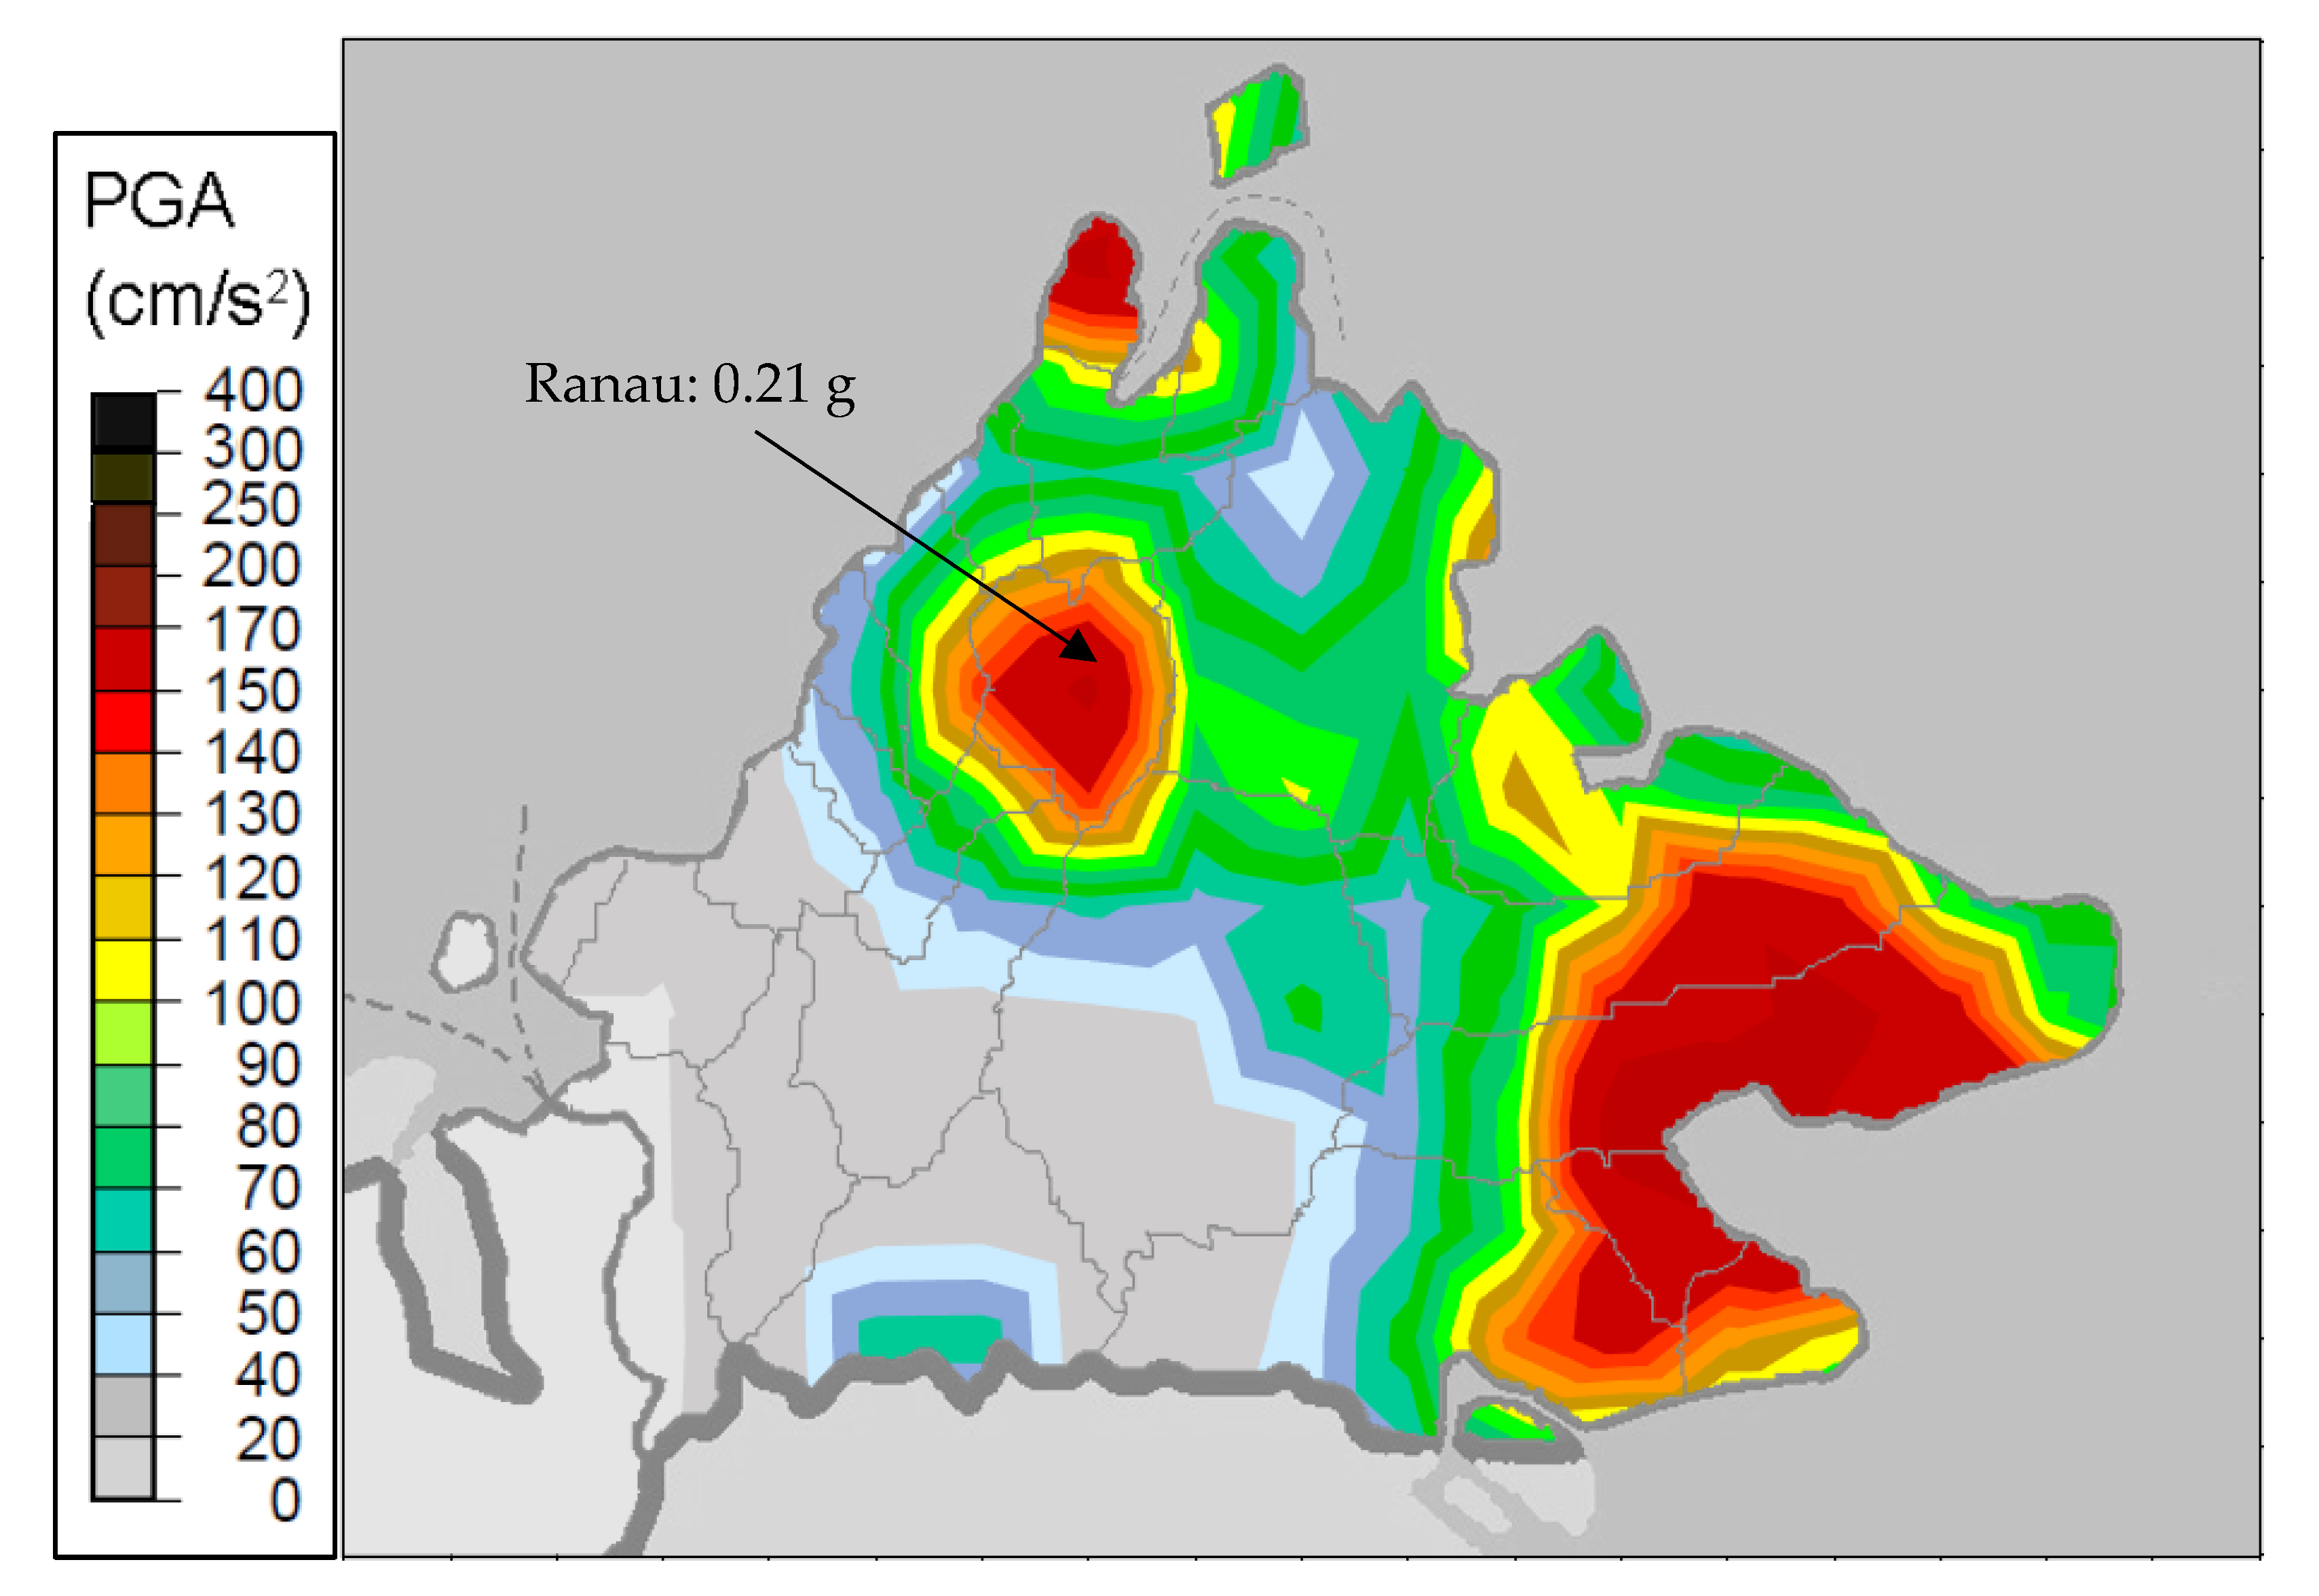
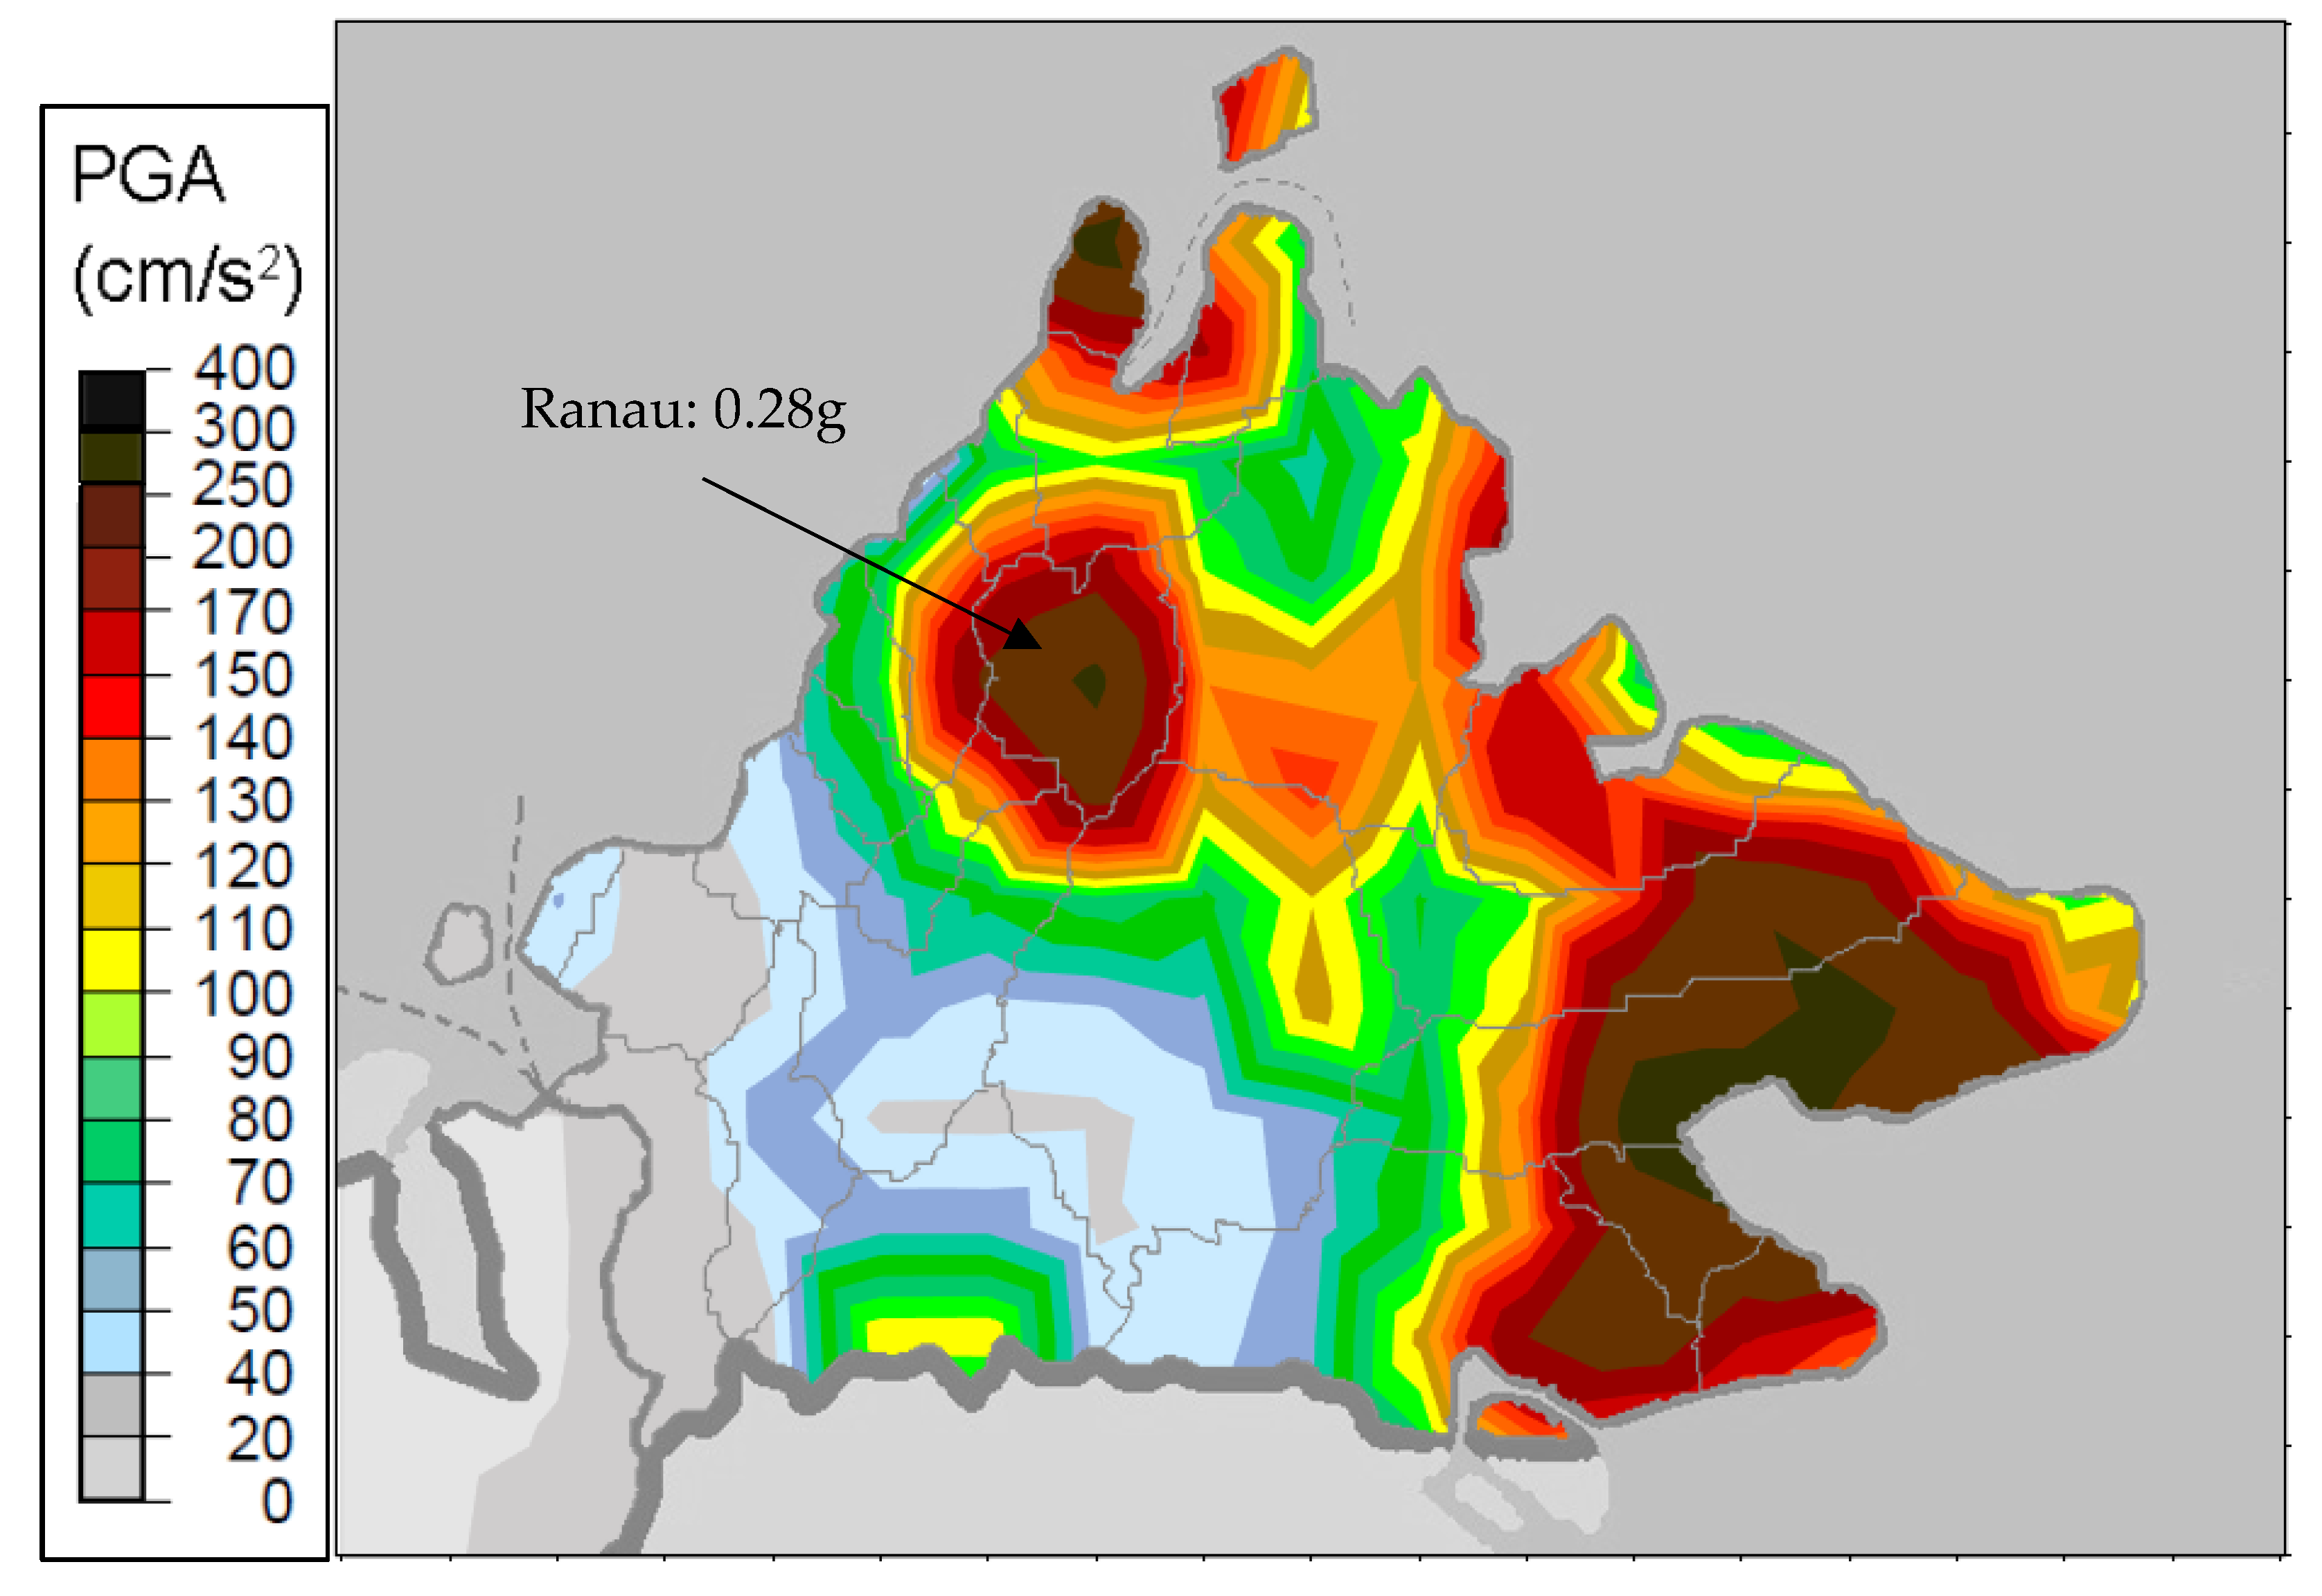
| Region | 10% | 5% | 2% |
|---|---|---|---|
| Sabah | 0.16 g | 0.21 g | 0.28 g |
| Sarawak | 0.07 g | 0.09 g | 0.13 g |
| West Malaysia | 0.09 g | 0.13 g | 0.20 g |
Disclaimer/Publisher’s Note: The statements, opinions and data contained in all publications are solely those of the individual author(s) and contributor(s) and not of MDPI and/or the editor(s). MDPI and/or the editor(s) disclaim responsibility for any injury to people or property resulting from any ideas, methods, instructions or products referred to in the content. |
© 2023 by the authors. Licensee MDPI, Basel, Switzerland. This article is an open access article distributed under the terms and conditions of the Creative Commons Attribution (CC BY) license (https://creativecommons.org/licenses/by/4.0/).
Share and Cite
Harith, N.S.H.; Tongkul, F.; Adnan, A. Seismic Hazard Curve as Dynamic Parameters in Earthquake Building Design for Sabah, Malaysia. Buildings 2023, 13, 318. https://doi.org/10.3390/buildings13020318
Harith NSH, Tongkul F, Adnan A. Seismic Hazard Curve as Dynamic Parameters in Earthquake Building Design for Sabah, Malaysia. Buildings. 2023; 13(2):318. https://doi.org/10.3390/buildings13020318
Chicago/Turabian StyleHarith, Noor Sheena Herayani, Felix Tongkul, and Azlan Adnan. 2023. "Seismic Hazard Curve as Dynamic Parameters in Earthquake Building Design for Sabah, Malaysia" Buildings 13, no. 2: 318. https://doi.org/10.3390/buildings13020318