Article

Assessment of Energy, Environmental and Economic Costs of Buildings’ Thermal Insulation–Influence of Type of Use and Climate

by
António M. Raimundo
1,*,
Afonso M. Sousa
1 and
A. Virgílio M. Oliveira
2
1
Department of Mechanical Engineering, University of Coimbra, Pólo II, Rua Luís Reis Santos, 3030-788 Coimbra, Portugal
2
Polytechnic Institute of Coimbra, ISEC, Department of Mechanical Engineering, Rua Pedro Nunes, Quinta da Nora, 3030-199 Coimbra, Portugal
*
Author to whom correspondence should be addressed.
Buildings 2023, 13(2), 279; https://doi.org/10.3390/buildings13020279
Submission received: 15 December 2022 / Revised: 13 January 2023 / Accepted: 14 January 2023 / Published: 18 January 2023

Abstract

:
Among the aspects with major impacts on the energy and environmental performance of a building, the thermal insulation of the opaque elements of its envelope stands out. This work assesses the influence of the application of thermal insulation to the opaque elements of the building’s envelope on the thermal comfort conditions indoors; moreover, the influence of the thermal insulation on the energy, environmental, and economic costs over the building’s complete life cycle is evaluated. For this purpose, the three most commonly used thermal insulating materials (expanded polystyrene—EPS, extruded polystyrene—XPS, and mineral wool—MW), thicknesses between 0 (without insulation) and 40 cm, five climates (hot, warm, moderate, cold, and very cold), and six types of use (apartment, housing, clinic, school, bank branch, and supermarket) were considered. EPS reveals itself to be the most promising thermal insulation material, both in economic and environmental terms, so it was selected for this study. The EPS’ optimal thickness depends on the building’s type of use, the climate, and the perspective from which the assessment is carried out (energy, environmental, or economic). The results show that the economically optimal thicknesses of thermal insulation are significantly lower than the corresponding ones in environmental terms. Furthermore, the application of thermal insulation to the opaque building’s envelope is more beneficial in energy and environmental terms than from an economic perspective.

1. Introduction

Good indoor environmental quality is essential to achieving well-being and ensuring work efficiency. Among the aspects relevant to indoor environmental quality, thermal comfort is usually pointed out as being more important than visual and acoustic comfort and indoor air quality [1]. To assure a low environmental impact, thermal comfort must be ensured with low primary energy consumption. The preference of building holders is that thermal comfort conditions should be achieved at a low economic cost [2].

1.1. Overview

According to the Intergovernmental Panel on Climate Change (IPCC) report on climate change mitigation from 2022 [3], total greenhouse gas (GHG) emissions have increased between 1970 and 2019, with a larger absolute increase after year 2000. Despite a growing number of climate change mitigation policies, annual GHG emissions grew on average by 2.2% per year from 2000 to 2019, compared with 1.3% per year from 1970 to 2000. Slightly different values for the GHG emissions are reported on the Emissions Gap Report 2022 of the United Nations Environment Programme [4], where an average annual growth rate of 2.6% per year from 2000 to 2009 and 1.1% per year from 2010 to 2019 is reported. According to both reports, a high was reached in 2019, followed by a decrease in 2020 (associated with the COVID-19 confinement); it is also suggested that total global GHG emissions in 2021 will be similar to, or even surpass, 2019 levels. According to the IPCC report [3], the building sector was responsible for 32% of the final energy consumption and 19% of the global equivalent CO2 emissions.
The actual European Union (EU) “energy performance of buildings directive” (EPBD) [5] demands that new buildings be “near-zero-energy buildings” (nZEB). To progress towards more sustainable buildings, a new EPBD directive is being developed [6], in which it is required that new buildings be “zero-emission buildings” of greenhouse gases (GHG), defined as “buildings with a very high energy performance in line with the energy efficiency first principle, and where the very low amount of energy still required is fully covered by energy from renewable sources at the building or district or community level where technically feasible”.

1.2. State of the Art

This section provides a summary of some previous research about the energy, environmental, and economic costs of thermal comfort, presents the methodologies of analysis, details the studies more related to the present one, and highlights the aspects that require a further assessment.
The environmental impacts of a building are essentially divided into three parts: those caused by the construction, those due to the building’s operation, and those resulting from the building’s demolition at the end of its useful life. Between them, the impacts caused by a building’s end-of-life are negligible or have a small share [7,8,9,10], so studies related to this area normally consider only the environmental impacts due to the construction and operation phases.
The energy consumption of a building during its use is directly related to the quality of its constructive solutions (passive and active) and the efficiency of its heating, ventilation, and air conditioning (HVAC) system. Among its passive constructive solutions, the opaque elements of the envelope stand out, whose thermal transmission coefficient and thermal mass strongly influence the thermal and energy behavior of the building; these properties depend on the materials included, namely the thermal insulator (material, thickness, and location in the constructive element) [11]. Furthermore, opaque building elements generally represent the largest share of the construction expenditures [11].
The economic costs of a building are always supported by whoever is responsible for its use, be it the owner or the tenant [11,12]. To carry out an economic assessment of a building, it is necessary to know the corresponding expenses during its complete life cycle [13,14], whose value depends on the financial framework of its holder [11,12,15]. This assessment can be performed using the concept of “equivalent annual cost” [€/(m2 year)] [2,11,15], which is an improvement of the concept of “equivalent global cost” (€/m2) [13,14].
The environmental impacts caused by the construction phase arise from the energy used for the extraction, manufacture, transport, and application of buildings’ constituent elements [16], which is recognized as embodied energy. This energy is one of the most commonly used indicators to represent the sustainability of materials and equipment. Therefore, a lower embodied energy indicates a lower environmental impact.
The methodologies used to identify the best thermal insulation material, its better position in the building opaque envelope, and its optimal thickness are normally based on a life cycle energy analysis (LCEA), a life cycle impact analysis (LCIA), and a life cycle cost analysis (LCCA), depending on whether the focus is on minimizing the energy consumption, the environmental impacts, or the economic costs, respectively [7,8,9,10,11,17,18,19,20,21]. As the relationship between the economic cost of buildings’ thermal insulation and its energy efficiency and environmental impacts is not linear, there may be large differences between the solutions identified as the best, depending on the assessment methodology used [11,12,17,18,19,20,21].
Anastaselos et al. [17] proposed a methodology to classify the economic, the energy, and the environmental qualities of thermal insulation solutions, which assigns a performance category to each perspective. According to its proponents, this “simplistic” approach allows an easy comparison of thermal insulation solutions. They tested a fixed thickness of 6 cm of expanded polystyrene (EPS), extruded polystyrene (XPS), and mineral wool (MW) insulating materials. The selection of the best solution requires a ranking of priorities between economic cost, energy performance, and environmental impact.
Bastos et al. [9] carried out an analysis of the energy consumed and of the greenhouse gas (GHG) emissions of three types of buildings located in Lisbon (Portugal). Considering 75 years of buildings’ lifetime, they modeled their life cycle focusing on the construction, restoration, and maintenance phases. They noticed that the use phase is the one with the highest primary energy demands (69–83%) and the greatest emissions of GHG. They also observe that, per square meter, larger buildings present lower energy demands, which is reflected in lower GHG emissions.
Using energy and economic assessments, Raimundo et al. [11] focused their study on identifying the most advantageous thermal insulation solutions for opaque elements for buildings located in the Portuguese temperate climate. For this purpose, they considered buildings of five types of use (apartment, detached house, clinic, school, and supermarket) and three types of thermal insulation materials (EPS—expanded polystyrene, XPS—extruded polystyrene, and MW—mineral wool) applied in three alternative positions (on the inner surface, in the middle of the air gap, and on the outer surface). They identified EPS as the most economically advantageous thermal insulation material. They also found that, in economic terms, it is more advantageous to apply thermal insulation in the intermediate position (in the air gap); the ETICS solution is more advantageous from the energy perspective; and the optimal thickness of thermal insulation depends on which perspective the analysis is performed. Even so, they concluded that, according to both perspectives, buildings located in regions with more intense climates require substantially greater thermal insulation thicknesses than those located in milder climates, and that residential buildings are the ones that need the highest thickness values. They identified the detached house as the building with the highest optimal thermal insulation thickness and the school (a service building with intermittent use only during the daytime) with the lowest.
Dylewski and Adamczyk [18] addressed the economic and environmental benefits of using thermal insulation on the external walls of buildings located in the various Polish climate regions. Variants in terms of different thermal insulation materials, thermal insulation systems, climatic zones, and heat sources were taken into consideration. They concluded that the environmental impact of a building strongly decreases with the decrease in energy demands for HVAC equipment operation, with the use of thermal insulation being a highly effective way to reduce these needs. They stated that the ideal insulation thickness, from both perspectives, increases with the number of heating degree-days.
Totland et al. [22] state that, in the case of buildings with insufficient thermal insulation thickness, 90% of their environmental impacts occur during the use phase; the increase in thermal insulation thickness leads to a decrease in this impact during the use phase and to its growth during the construction phase.
There is a great variability of climates, which can be identified using a wide range of classification types [23,24]. However, a simplistic categorization system is normally used on energy and environmental assessments, where the climates are classified as: hot, warm, moderate, cold, and very cold. As each type of climate leads to a different level of indoor-outdoor thermal exchanges, the climate of the building site is undoubtedly of vital importance for the identification of the optimum thermal insulation solution [11,23,24,25,26].
In terms of type of use, there are published studies focused on the optimal insulation of various types of buildings [9,17,25,27]. However, these studies considered only the buildings located in a specific place and did not involve a range of buildings sufficiently representative of the various types of use. Therefore, a comparative analysis in which various typologies of use are included is helpful and must be undertaken at sites representative of the various possibilities of climatic conditions.

1.3. Objectives and Scope
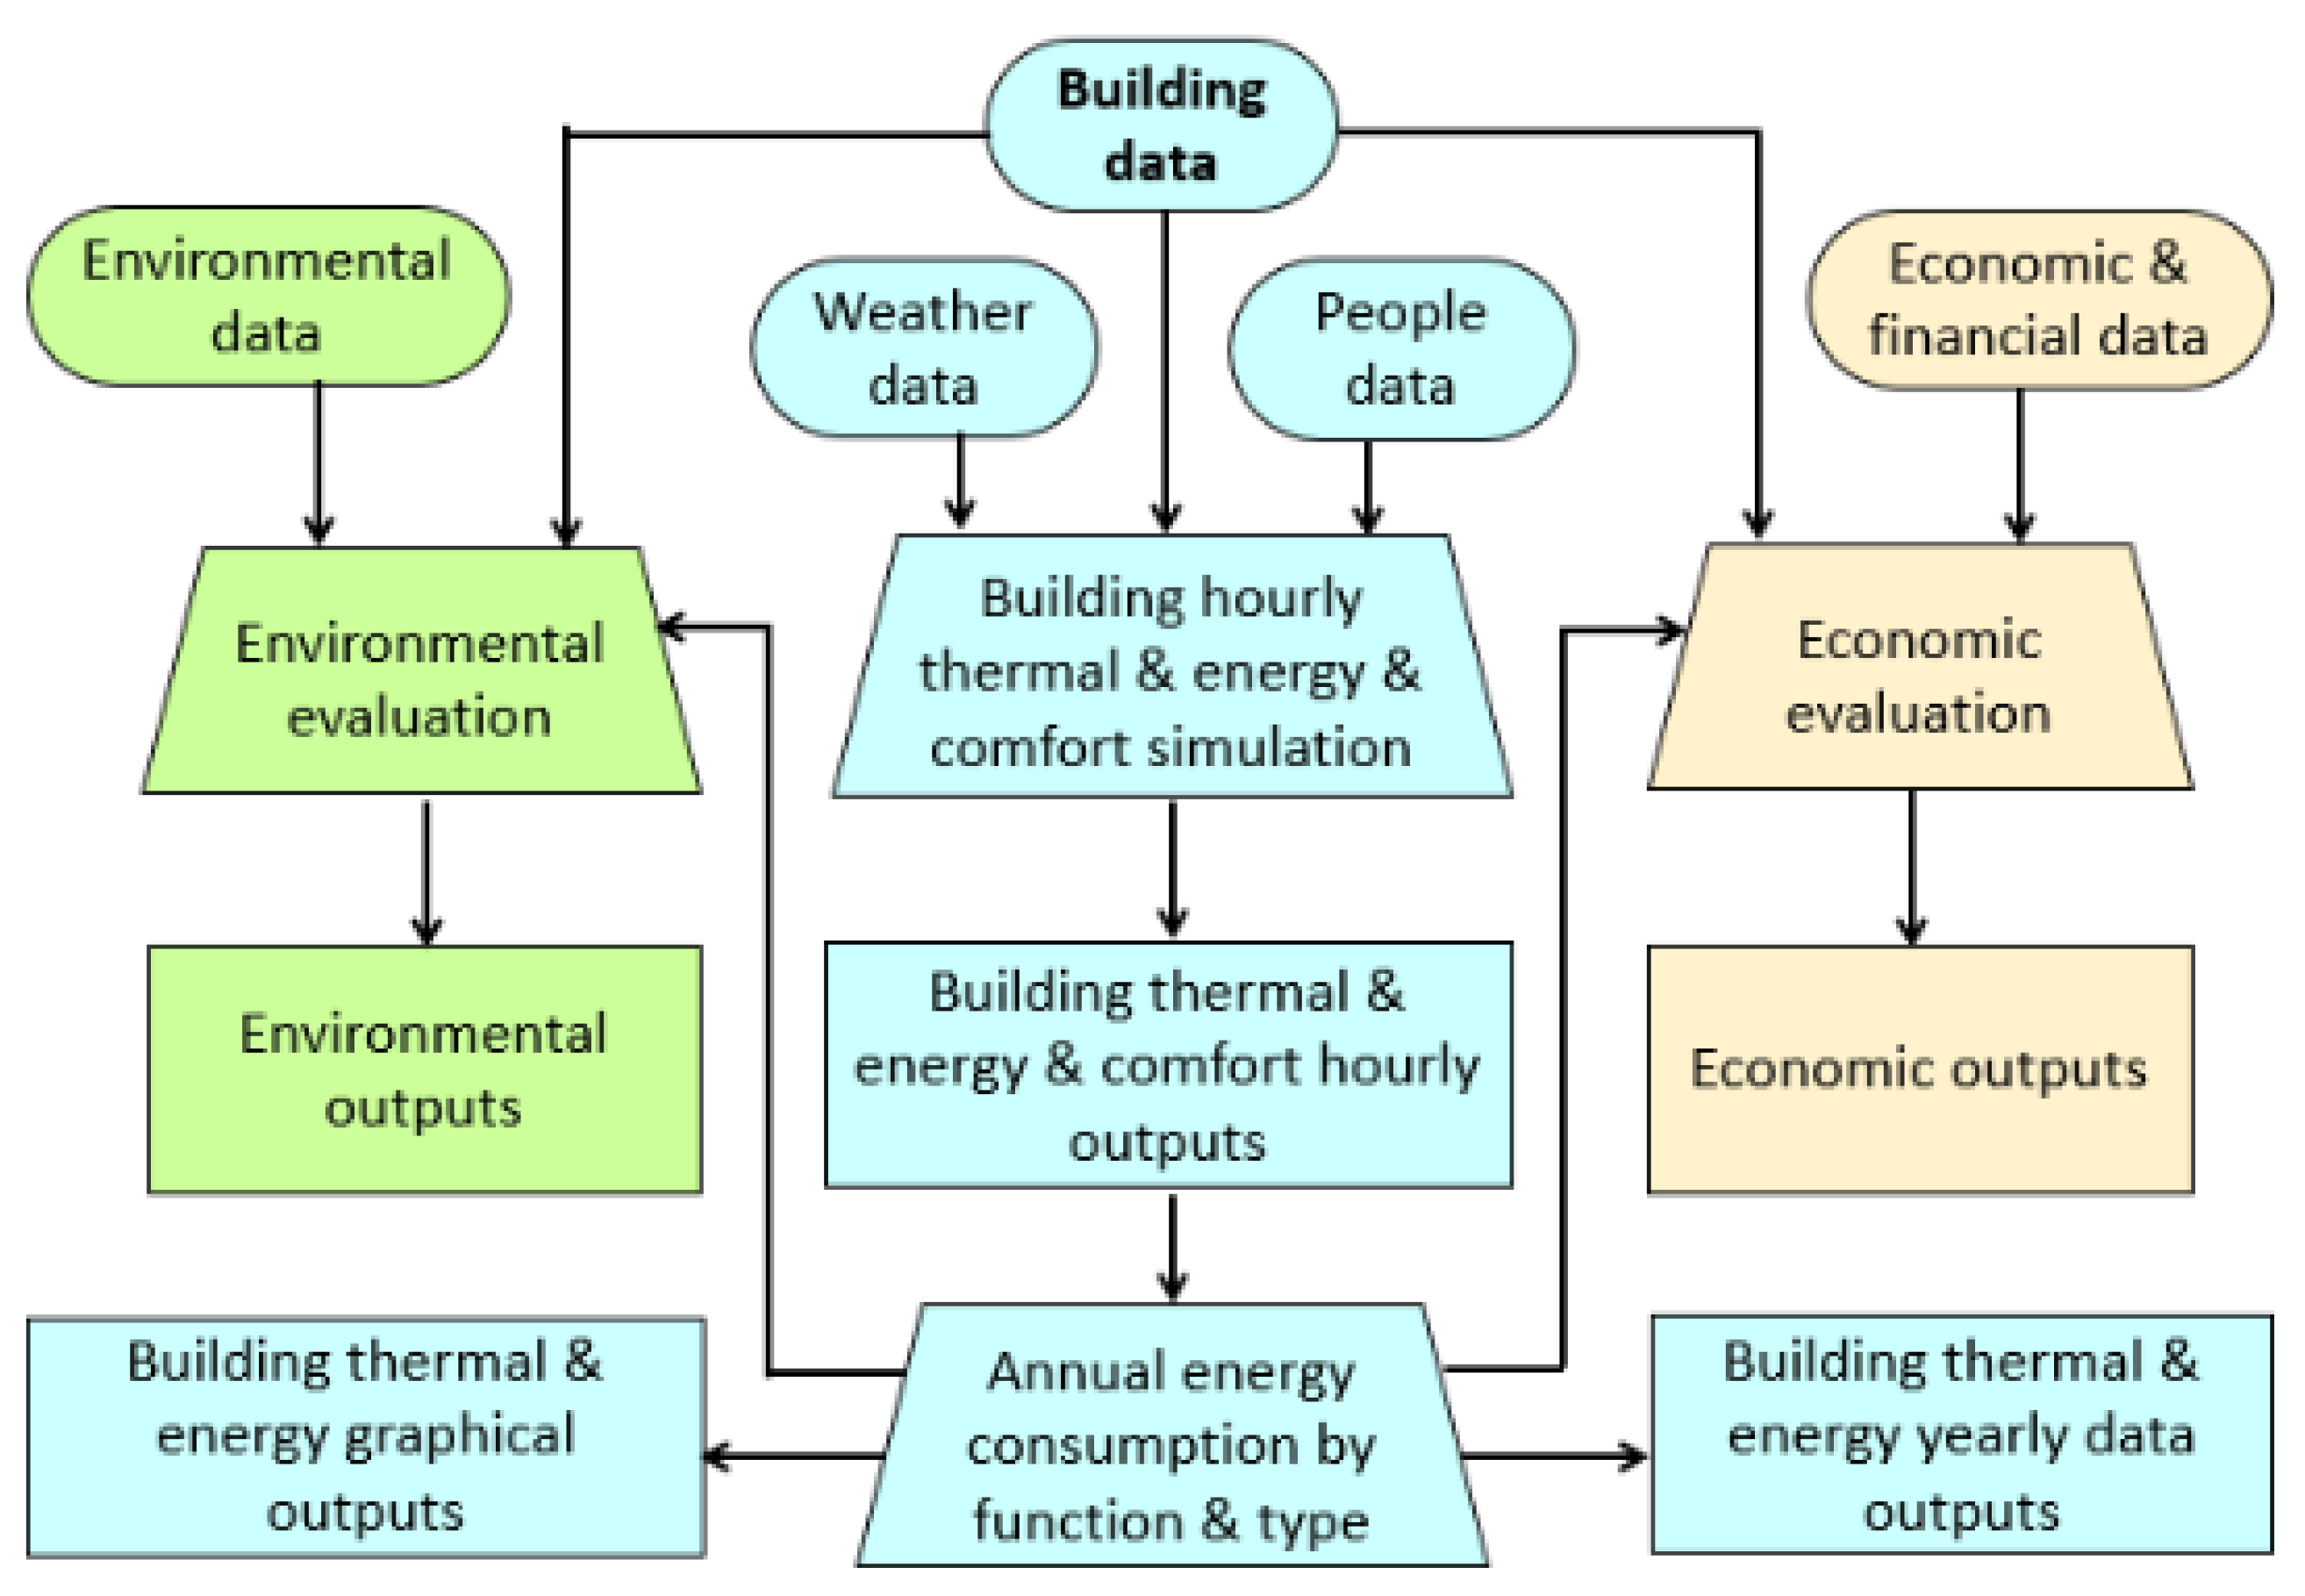
The present work aims to analyze the influence of thermal insulation on the economic, energy, and environmental parameters of buildings located in different climate types, namely the identification of the most suitable insulating material and its optimal thickness according to the economic, energy, and environmental perspectives. These assessments were performed using life cycle energy analysis (LCEA), life cycle impact analysis (LCIA), and life cycle cost analysis (LCCA) methodologies.
A unified comparison between various types of buildings, chosen to be a good representation of the building stock and supposedly located in the different climate alternatives, from very cold to hot, was used to perform an original assessment. In this analysis, several parameters frequently missing in the literature are considered, namely the building holder’s financial framework and tax burden, both of which have a large impact on the economic cost associated with the use of a building. Additionally, the economic and environmental costs of applying the thermal insulation system and of other necessary materials are also taken into account. The usefulness of the results of this research is that they can be used to select the recommended thermal insulation thickness to apply in a given building located in a specific climate. Clearly, the value of the optimal thickness depends on the perspective considered.
The choice of locations considered to represent the various climate types was based on the number of heating degree days (HDD) and cooling degree days (CDD). Five cities with distinct climatic conditions were selected, which, taken together, are thought to be a good representation of a wide range of climate types: hot, warm, moderate, cold, and very cold.
The building stock is represented by buildings of six types of use: an apartment located in the middle of a multifamily building and a detached house (residential buildings), a clinic (a service building with permanent occupancy), a school and a bank branch (service buildings with intermittent use), and a supermarket (a commercial building with intermittent utilization).
It was assumed that all buildings are built using the same type of passive construction solutions (opaque and glazed), and the opaque elements of the buildings’ envelope are equipped with a traditional External Thermal Insulation Composite System (ETICS) [2,11,24,25,28,29,30,31,32]. The three most common thermal insulation materials used in building construction are expanded polystyrene (EPS), extruded polystyrene (XPS), and mineral wool (MW) [20,21,30,33,34]. Thus, these are the insulating materials considered.

2. Methodology

SEnergEd software [2,11,15,35], a validated in-home tool developed for research purposes, was used to perform the life cycle energy analysis (LCEA), the life cycle impact analysis (LCIA), and the life cycle cost analysis (LCCA) of the buildings. It is a user-friendly software integrating algorithms for the dynamic simulation of the thermal and energy behavior of buildings (residential, commercial, and service), including thermal comfort evaluation, environmental impact analysis, and economic assessment of the building life cycle (Figure 1).

2.1. Energy Demands and Consumption

SEnergEd software predicts the thermal behavior and energy needs of buildings using a reformulated version of the dynamic hourly model 5R1C (5 thermal resistances and one thermal capacitance) described in ISO 13,790 [36]. Other energy demands are also obtained by a dynamic hourly calculation [35]. Using the energy performance of equipment and systems (HVAC, DHW, lighting, appliances, etc.), the energy demands are converted into consumption. More details on the energy model are described elsewhere [2,11,15,35].
The energy component of this software was validated by comparison of its predictions with the real monthly energy consumption (during 2014, full year) of a high school [35] (Figure 2). This school was divided into 7 different thermal zones and has a global net floor area of 11,246 m2, a gross floor area of 14,148 m2, and a weighted average ceiling height of 3.84 m. Classrooms, rooms for teachers, offices, and secretaries occupy a net floor area of 7669 m2, common spaces make up 3171 m2, and showers and toilets make up 406 m2. Each thermal zone includes acclimatized and non-acclimatized spaces (archives, storage rooms, warehouses, and technical spaces). There are no constructive elements that promote significant shading of the glazing. As this building is considered in this study, the occupancy and operating profiles are described ahead. As revealed by Figure 2, a reliable predictive capacity of SEnergEd software was observed, with a difference of 2.9% for the annual energy consumption and a maximum difference of 8.4% for the monthly consumption. These differences were justified by the difficulty in accurately establishing the utilization profile of each thermal zone, by the climatic data measured by a meteorological station located about 4 km away from the building, and by the impossibility of considering all the exact details of the building, such as constructive aspects, equipment performance, and occupation profiles.

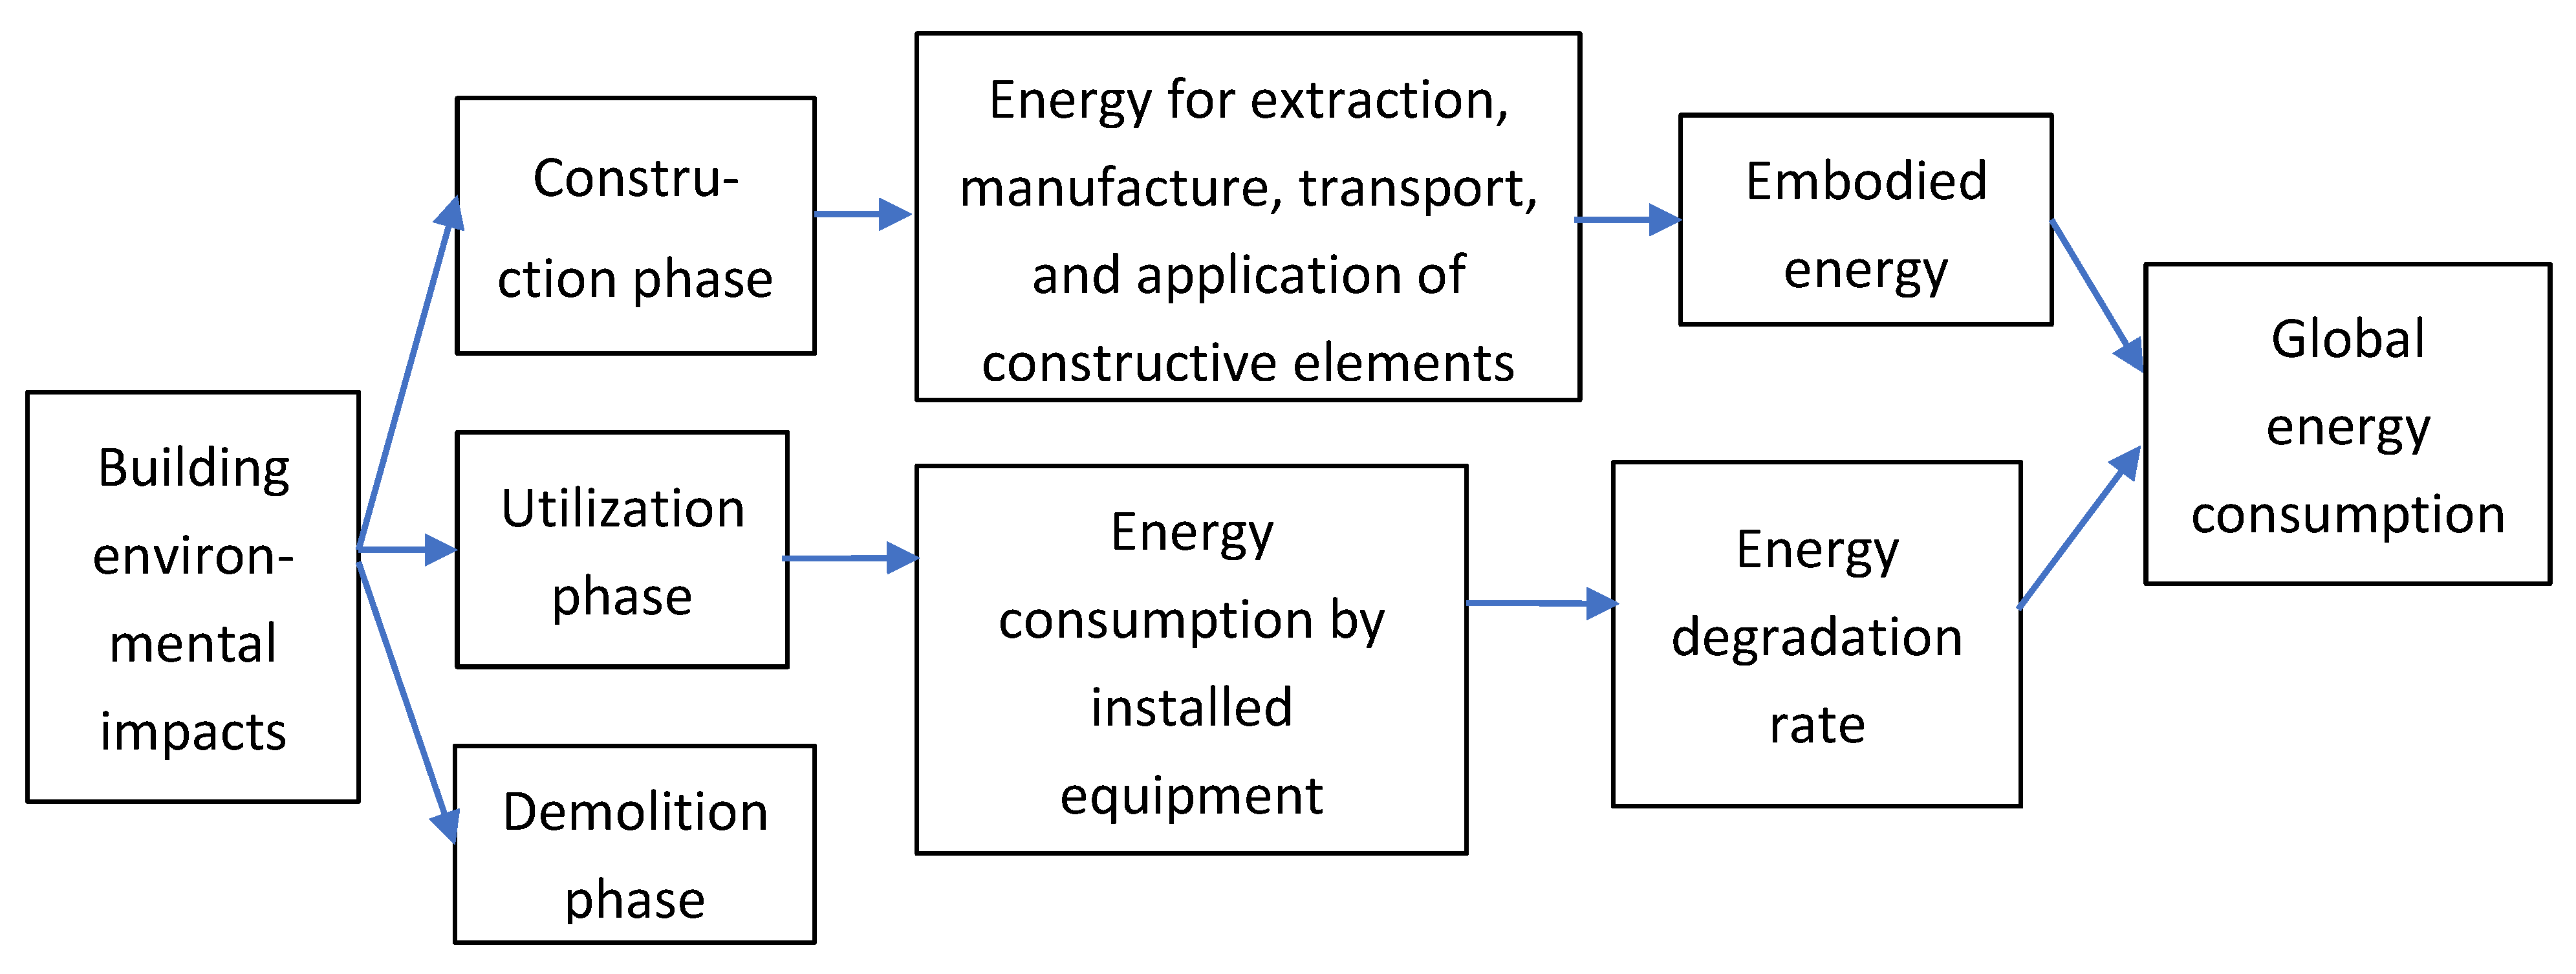
2.2. Energy and Environmental Relations

The energy resources found in nature are known as primary energy and can be renewable (hydro, solar, wind, plant biomass, etc.) or non-renewable (coal, oil, natural gas, etc.). Final (or secondary) energy is energy in a state that allows its use in powering equipment, which may correspond to primary energy (as is the case with natural gas, among others) or result from refining (gasoline, diesel, etc.) or transformation (electricity, liquefied petroleum gas, thermal, etc.) processes. Useful (or tertiary) energy is energy capable of serving people directly (heat introduced or removed from a space to keep it comfortable, heat contained in domestic hot water, energy in the form of light, etc.), being produced by equipment powered with final energy.
The overall energy consumption of a building is equal to the sum of its energy consumption associated with its construction (represented by the energy absorbed in construction solutions), occupation (HVAC equipment, lighting, etc.), and demolition phases. However, energy consumption during the demolition phase is much lower than in the other two, and, as such, it can be neglected [7,8,9,10]. Thus, in the determination of buildings’ overall energy consumption during their full life cycle, the end-of-life phase was not considered (Figure 3).
SEnergEd software predicts, for the first year of the use phase, the energy demands and the final energy consumption, disaggregated for: heating, cooling, ventilation, and pumping; non-HVAC equipment; indoor lighting; outdoor lighting; domestic hot water; specific equipment; kitchens; laundry; parking lots; warehouses; and complementary spaces. The final energies consumed can be of various types, so they are standardized by their conversion to a reference base in terms of primary energy. Annual primary energy consumption during the remaining years of the building’s lifetime is determined assuming a rate of increase, which is representative of the loss of energy performance of the building’s passive and active systems.
In this work, the kWhOE (kilowatt-hour oil equivalent) is assumed as a reference for primary energy, and it is considered for the conversion factors of final energy to primary reference energy (FFP [kWhOE/kWh]). The values of 2.5 for electricity, 1.0 for natural gas (a non-renewable fuel), and 0 for energy from renewable sources were used [37]. To carry out an environmental impact assessment, it is necessary to link primary energy consumption with equivalent CO2 emissions. For this, conversion factors of primary energy to emissions of equivalent kilograms of CO2 (FPC [kgCO2 eq/kWhOE]) were used, assuming the values of 0.144 for electricity, 0.202 for natural gas, and 0 for energy from renewable sources [37].

2.3. Equivalent Annual Cost of Thermal Insulation

The equivalent annual cost (EAC) of a building includes the costs of acquisition, installation/construction, maintenance, replacement, occupation, and end-of-life [2,11,35]. The cost of energy must consider the tariffs to be paid for each type of final energy.
The global cost of a building, as defined in EN 15,459 [13] and in European Regulation [14], can be represented by the net present value (NPV), which corresponds to the “overall economic loss” of the building when discounted to the instant when its use starts and can be expressed by [11]
N P V = R V ( 1 + r ) n k = 0 n I k C F k ( 1 + r ) k
where k is the index representing each one of the n years of the period under analysis, r is the real interest rate (discount rate), RV is the residual value of the building at the end of the period under analysis, and Ik is the required amount of investment in year k [11]. The cash flow (CFk) represents the net economic flow related to the building in each year, k.
C F k = R k + S T k C k
where Rk, STk, and Ck represent the annual value of revenues, tax relief, and costs, respectively [11]. Annual revenues (Rk) may arise from selling energy or from renting. The existence of any income directly generated by the buildings was not considered in this study (Rk = 0). The annual tax relief (STk) is the reduction of the payable tax amount the building holder can benefit from by including the costs related to the building as expenses of his economic activity. This tax relief depends on the building holder’s tax framework, which is null if the holder is an individual. In contrast, a significant monetary amount of tax relief can be present if the building holder is a company. The costs, given by
C k = C T k + C R k + C M k + C W k + C E k + C O k
include taxes due to building ownership (CTk), equipment replacement (CRk), building and systems maintenance (CMk), water consumption, sewage treatment, waste collection (CWk), energy consumption (CEk), and other costs (COk), such as, for example, condominium costs (in the case of the apartment) [11]. As they have no influence on the cost of thermal comfort, the expenses CTk, CWk, and COk are not relevant for the purposes of the present analysis.
The equivalent annual cost (EAC) of the building’s use during its useful life is obtained from the building’s net present value using the following equation [11]
E A C = N P V A c l   ·   r   ( 1 + r ) n ( 1 + r ) n 1
where Acl represents the floor area of the building’s acclimatized spaces.
However, the focus of this study is not the EAC of the building but only the equivalent annual economic cost of the thermal insulation (ECTI); therefore,
E C T I = E A C b E A C 0
where EACb is the EAC of the building under assessment equipped with a HVAC system operating when necessary to maintain thermal comfort conditions, and EAC0 represents the EAC of that building on the condition that its opaque elements do not include thermal insulation and the HVAC system only assures the renovation of indoor air (thus, no heating or cooling of indoor air).
To obtain the required amount of investment, it is necessary to know in advance the economic cost of implementation of each thermal insulation solution (ECS, €/m2), which depends on the thermal insulating material, the thickness applied, the type of solution (ETICS in this case), the type of construction element (exterior wall, floor, roof, etc.), and the country in question. Thus, it is reasonable to consider that ECS is basically composed of three parts: (i) the cost of the thermal insulating material; (ii) the cost of the extra material required to apply the solution; and (iii) the cost of labor. Accordingly, for each type of constructive element, the three parcels are: (i) the cost of the thermal insulating material, which depends on the unit cost of EPS (Ctim, €/m2 per cm of thickness) and the thickness applied (thick, cm), not depending on the country; (ii) the cost of the extra material (Cextra, €/m2), which varies with the type of building element and is the same in all countries; and (iii) the cost of labor (CL, €/m2), which depends on the type of building element and varies from country to country in proportion to the respective minimum wage (MW). To carry out this study, the values obtained by Raimundo et al. [11] for Ctim, Cextra, and CL, which are valid for Portugal, were assumed. Thus, the ECS value of each opaque constructive element was obtained using the expression
E C S = C t i m · t h i c k + C e x t r a + C L P T · M W C / M W P T      
where Ctim = 0.75 €/m2 per centimeter of EPS thickness, CLPT is the labor cost in Portugal of applying the thermal insulation solution, MWC is the annual minimum wage in the country in question, and MWPT is the annual minimum wage in Portugal, which, in the first semester of 2022, were 9870 €/year in Portugal, 13,510 €/year in Spain, 7858 €/year in Poland, and 24,840 €/year in Iceland [38].

3. Research Objects and Conditions

3.1. Climate Conditions

Even when only considering areas with a significant human population density, terrestrial climatic conditions are very diverse. Among the different methodologies used to classify the various types of climates, the one based on the number of heating degree-days (HHD [°C.day/year]) and the number of cooling degree-days (CDD [°C.day/year]) is the one that allows a more direct relationship between outdoor weather conditions and energy demands for heating and cooling, respectively [18,19,24,25,26,34]. Then, to perform this study, the selection process of the representative locations was based on the HDD and CDD values, defined in relation to base values of 20 °C and 24 °C, respectively. The selected five cities with distinct climate conditions are shown in Table 1, where also their Köppen–Geiger climate classification is indicated [23,24].

3.2. Buildings’ Layout and Occupancy

Six buildings with different acclimatized areas, occupancy, internal thermal gains, and types of use were considered: (i) an apartment at the midlevel of a multi-story building (residential with permanent use); (ii) a detached house (residential with permanent use); (iii) a private clinic with hospitalization (services with permanent use); (iv) a private high school (services with intermittent use); (v) a bank branch (services with intermittent use); and (vi) a medium-sized supermarket (commerce with intermittent use). Table 2 shows a summary of the main characteristics of these buildings. The net and gross areas do not include non-acclimatized spaces. Additional information about the layout and the characteristics of these buildings can be found in Raimundo et al. [2,11,15].
In general terms, occupancy and operating profiles are characterized by:
-
In all buildings, the occupancy and the operating profiles vary according to the time of the day, the day of the week, and the week of the year;
-
When the building is closed, the HVAC system is off, and the lighting systems are either off or operate at very low power;
-
Residential buildings are assumed to be unoccupied during the first fifteen days of August and permanently occupied during the remaining days of the year, by four people on Saturdays and Sundays, and between 6 p.m. and 8 a.m. on weekdays (Mondays to Fridays), and by one person the rest of the time;
-
The clinic runs continuously during all days of the year, but with higher occupation intensity between 8 a.m. and 8 p.m. on weekdays and on Saturdays;
-
The high school is only occupied between 8 a.m. and 6 p.m. on weekdays, is closed on Saturdays and Sundays, and its operation follows a common school calendar, so it works at 100% during school periods, at 50% during the 1st examination phase (15–30 June), at 25% during the 2nd examination phase (1–15 July), at 25% during the admission phase (16–31 July), and is closed during school holidays (the first 15 days of April, 1 to 31 August, and the last 15 days of December);
-
The bank branch operates every weekday of the year, is occupied between 8 a.m. and 6 p.m., and is closed on Saturdays and Sundays;
-
The supermarket operates every day of the year and is occupied between 8 a.m. and 10 p.m., but with more intense activity on Saturdays and Sundays.

3.3. Air-Conditioning Systems

In temperate climates, electric air-source heat pumps have reasonably good energy performances in heating mode, and so systems based on air-source chillers/heat pumps are the recurrent option [2,11,15,39]. Alternatively, in cold climates, air-source heat pumps have very low performance in heating mode, so in these climates, heating systems are usually based on a boiler (using gas or another type of fuel) [18,33,34]. Therefore, two different HVAC systems are considered: (A) for buildings located in hot, warm, and moderate climates; and (B) for buildings located in cold and very cold climates.
HVAC systems type A are assisted by a single chiller/heat pump device, and HVAC systems type B are supported by a natural-gas boiler and a chiller machine. The chillers and heat pumps considered are based on a compression-expansion cycle and are of European Class A+ [40], as this class is the one that better represents the equipment currently being installed and it leads to a lower economic cost to obtain thermal comfort conditions [2]. The chiller has a seasonal energy efficiency ratio SEER = 5.85 in cooling mode [40], the heat pump has a seasonal coefficient of performance SCOP = 4.30 in heating mode [40], and the natural-gas boiler has a seasonal thermal efficiency STE = 0.95 [18,33,34].
The results of the present study were obtained assuming that HVAC systems only work when the corresponding space is expected to be occupied. During these periods, the indoor air temperature is maintained between setpoints Tmin = 21 °C and Tmax = 24 °C. As stated by Raimundo and Oliveira [2], this range of setpoints is the one that most probably guarantees category II of thermal comfort, as endorsed by the European Standard EN 16798-1:2019 [41] for new buildings and renovations. The air renewal is ensured by air handling units (AHU) and air extraction fans, both with an efficiency of 70% [37]. Heat recovery from the rejected air and free-cooling strategies were not considered.

3.4. Glazing Elements

The windows identified by Raimundo et al. [15] as the most economically advantageous glazing for buildings located in Portugal were selected. The windows are composed of an aluminum frame with a thermal barrier and double glass (colorless 6 mm + 11 mm of air layer + colorless 4 mm). Electric blinds composed of horizontal plastic strips were considered external protection. This glazing system has a thermal transmission coefficient (U) and a solar factor (g) of Uw = 3.05 W/(m2 K) and g┴w = 0.79, respectively, and when the external protection is active, Uwp = 1.56 W/(m2 K) and g┴wp = 0.05.

3.5. Economic and Environmental Costs of Thermal Insulation

The thermal insulation materials most commonly used in building construction are expanded polystyrene (EPS), extruded polystyrene (XPS), and mineral wool (MW) [11,16,17,20,21,30,33]. The option for these materials is a result of their economic advantages, which is the first criterion used by the constructors and the owners of buildings. Thus, our focus will be on these three thermal insulation materials.
By consulting six Portuguese suppliers, Raimundo et al. [11] obtained an average price (VAT not included) of 0.75, 2.61, and 1.15 €/m2 per centimeter of thickness for sheets of EPS, XPS, and MW, respectively. The embodied energy was obtained from Anastaselos et al. [17], where values of 80.76 for EPS, 87.10 for XPS, and 24.61 MJ/kg for MW are suggested, which correspond to 11.31, 27.87, and 16.00 MJ/m2 per each centimeter of thickness of EPS, XPS, and MW, respectively.
The economic and environmental costs associated with a building depend substantially on the material used to insulate the opaque elements. Thus, an important issue is the identification of the most advantageous thermal insulating material from economic and environmental perspectives. For this, the environmental and economic costs of thermal insulating materials were obtained for the functional unit R = 1 m2 K/W, which are shown in Table 3. Considering the values obtained, it can be observed that the most promising thermal insulation material is EPS (expanded polystyrene). Therefore, EPS was the thermal insulation material selected for this study.
Several other works had identified EPS (expanded polystyrene) as among the most advantageous thermal insulation materials for application to building elements [11,16,17,20,21,30,33]. In addition, it can be used in almost all opaque building elements (façades, roofs, floors, etc.) [11,42] and has a durability of at least 50 years [16,33,39]. Alternatively, there are other thermal insulation materials with better environmental performance [43,44], namely natural pumice, cellulose flocks, and kenaf fibers [43]. However, there is not a regular market for this kind of thermal insulator, so their prices make it economically unviable.

3.6. Opaque Elements of Buildings’ Envelope

Each type of opaque construction element relies on a base structure, which is the same for all buildings and for all climates. Table 4 describes the base structure of the opaque elements in contact with the exterior and the corresponding values of thickness, useful thermal mass (Mt), and thermal transmission coefficient (U).
The basic structure is complemented with the application of EPS thermal insulation on the outer face through an ETICS-type solution, identified by Raimundo et al. [11] as the most efficient in terms of energy demands. Another advantage is that it can be applied both in new buildings and in refurbishments. Thermal insulation thicknesses between 0 cm (without insulation) and 40 cm were tested.
Bearing in mind that the objective of this work is not the analysis of the environmental impact of buildings but the application of thermal insulation to their opaque elements, it is reasonable to consider the embodied energy in buildings null when their opaque elements are not thermally insulated. The embodied energy in the thermal insulation solution (EES, kWh/m2) mainly depends on the thermal insulating material, its thickness, the type of solution, and the type of construction element.
Tables with the useful thermal mass (Mt) and the thermal transmission coefficient (U) of each type of construction element and with the economic cost of each thermal insulation solution (ECS), obtained using Equation (6), and the embodied energy (EES) of the respective thermal insulation solution were built. Table 5 shows the values obtained for the external walls.

3.7. Economic Assessment

The tax burden is high in almost all countries, so any economic assessment must consider them. Each country has its own tax system. Usually, the differences are associated with the applicable rates and not with the types of taxes. The tax system considered is based on EU practice, where the more relevant fees for this study are: (i) the value-added tax (VAT), which is a consumption tax; and (ii) the annual tax relief, i.e., the reduction of the amount paid in each year, related to the professional activity of the holder due to the annual expenses attributable to the building. The value of these taxes is strongly influenced by the taxable person’s fiscal framework, which can be: (i) a natural person (individual or family), which, as the final consumer, is unable to recover the VAT paid; (ii) a legal person (company or organization), which is unable to recover the VAT paid; or (iii) a legal person capable of recovering the VAT paid.
It was assumed that the holders of the apartment and the detached house are natural persons, while the ones of the clinic and the school are corporations without the ability to recover the VAT paid; on the contrary, the bank branch and the supermarket are companies capable of recovering the VAT paid. Therefore, to all investments and all expenses (including energy costs) related to the apartment and the detached house, it is necessary to add the VAT; to all investments and expenses related to the clinic and the school, the VAT must be added; and both the investments and the expenses related to the supermarket and the bank branch do not include the VAT. Investments and disbursements on buildings are normally subject to the maximum VAT rate, which is currently 21% in Spain, 23% in Portugal and Poland, and 24% in Iceland.
In most countries, the annual tax paid due to the professional activity of individuals is determined by applying a rate to the total amount of revenues. Therefore, if the building holders are individuals, tax relief due to annual expenses or investments in the building does not exist, and in Equation (2), STk = 0. This happens in the case of residential buildings. The business activity is normally taxed in proportion to the total profit (revenues minus expenses). When the building is associated with the activity of its holder and their investments and expenditures decrease the holders’ profit, then the amount of activity fees to pay also decreases. Consequently, if the building holder is a corporation, there is tax relief due to the annual expenses and the investments within the building. In these cases, to obtain the corresponding value of STk to be used in Equation (2), a profit tax rate of 25% was considered, which is what is supposed to happen in the case of the four non-residential buildings.
For buildings constructed using passive solutions of the type considered, a lifespan of at least 50 years is often reported in the literature [11,16,33,39]. Thus, it is appropriate to assume n = 50 years in the economic analysis. Besides usual maintenance work, any major intervention in the passive elements was assumed to occur during the first 50 years of a building’s lifespan. The maintenance costs (CMk in Equation (3)) are related to the corresponding investment value, considering a rate of 1%/year for all passive elements [2,11].
A large portion of annual expenditure is related to energy consumption (CEk in Equation (3)). The tariffs of energy (electric and natural gas) were obtained from the European Union energy price statistics website [45,46], where the consumers are classified as household or non-household. The most recent data refer to the first semester of 2022, which was considered (Table 6).
In research papers involving buildings’ energy consumption [2,11,33,39,42], rates ranging from 0 to 10%/year are presumed for the increase of average prices, between 0 and 15%/year for the increase of energy tariffs, and between 0 and 10%/year for the financial discount rate. As they are considered to be highly probable, a global inflation rate of if g = 5%/year and a financial discount rate of r = 5%/year were assumed. The energy market is perhaps one of the most unstable, so it is not possible to recognize a value as the most likely for the energy price evolution rate. Thus, it was considered that the energy price inflation rate (if e) is equal to the global inflation rate, if e = if g = 5%/year. The economic assessment was carried out using a current price analysis.

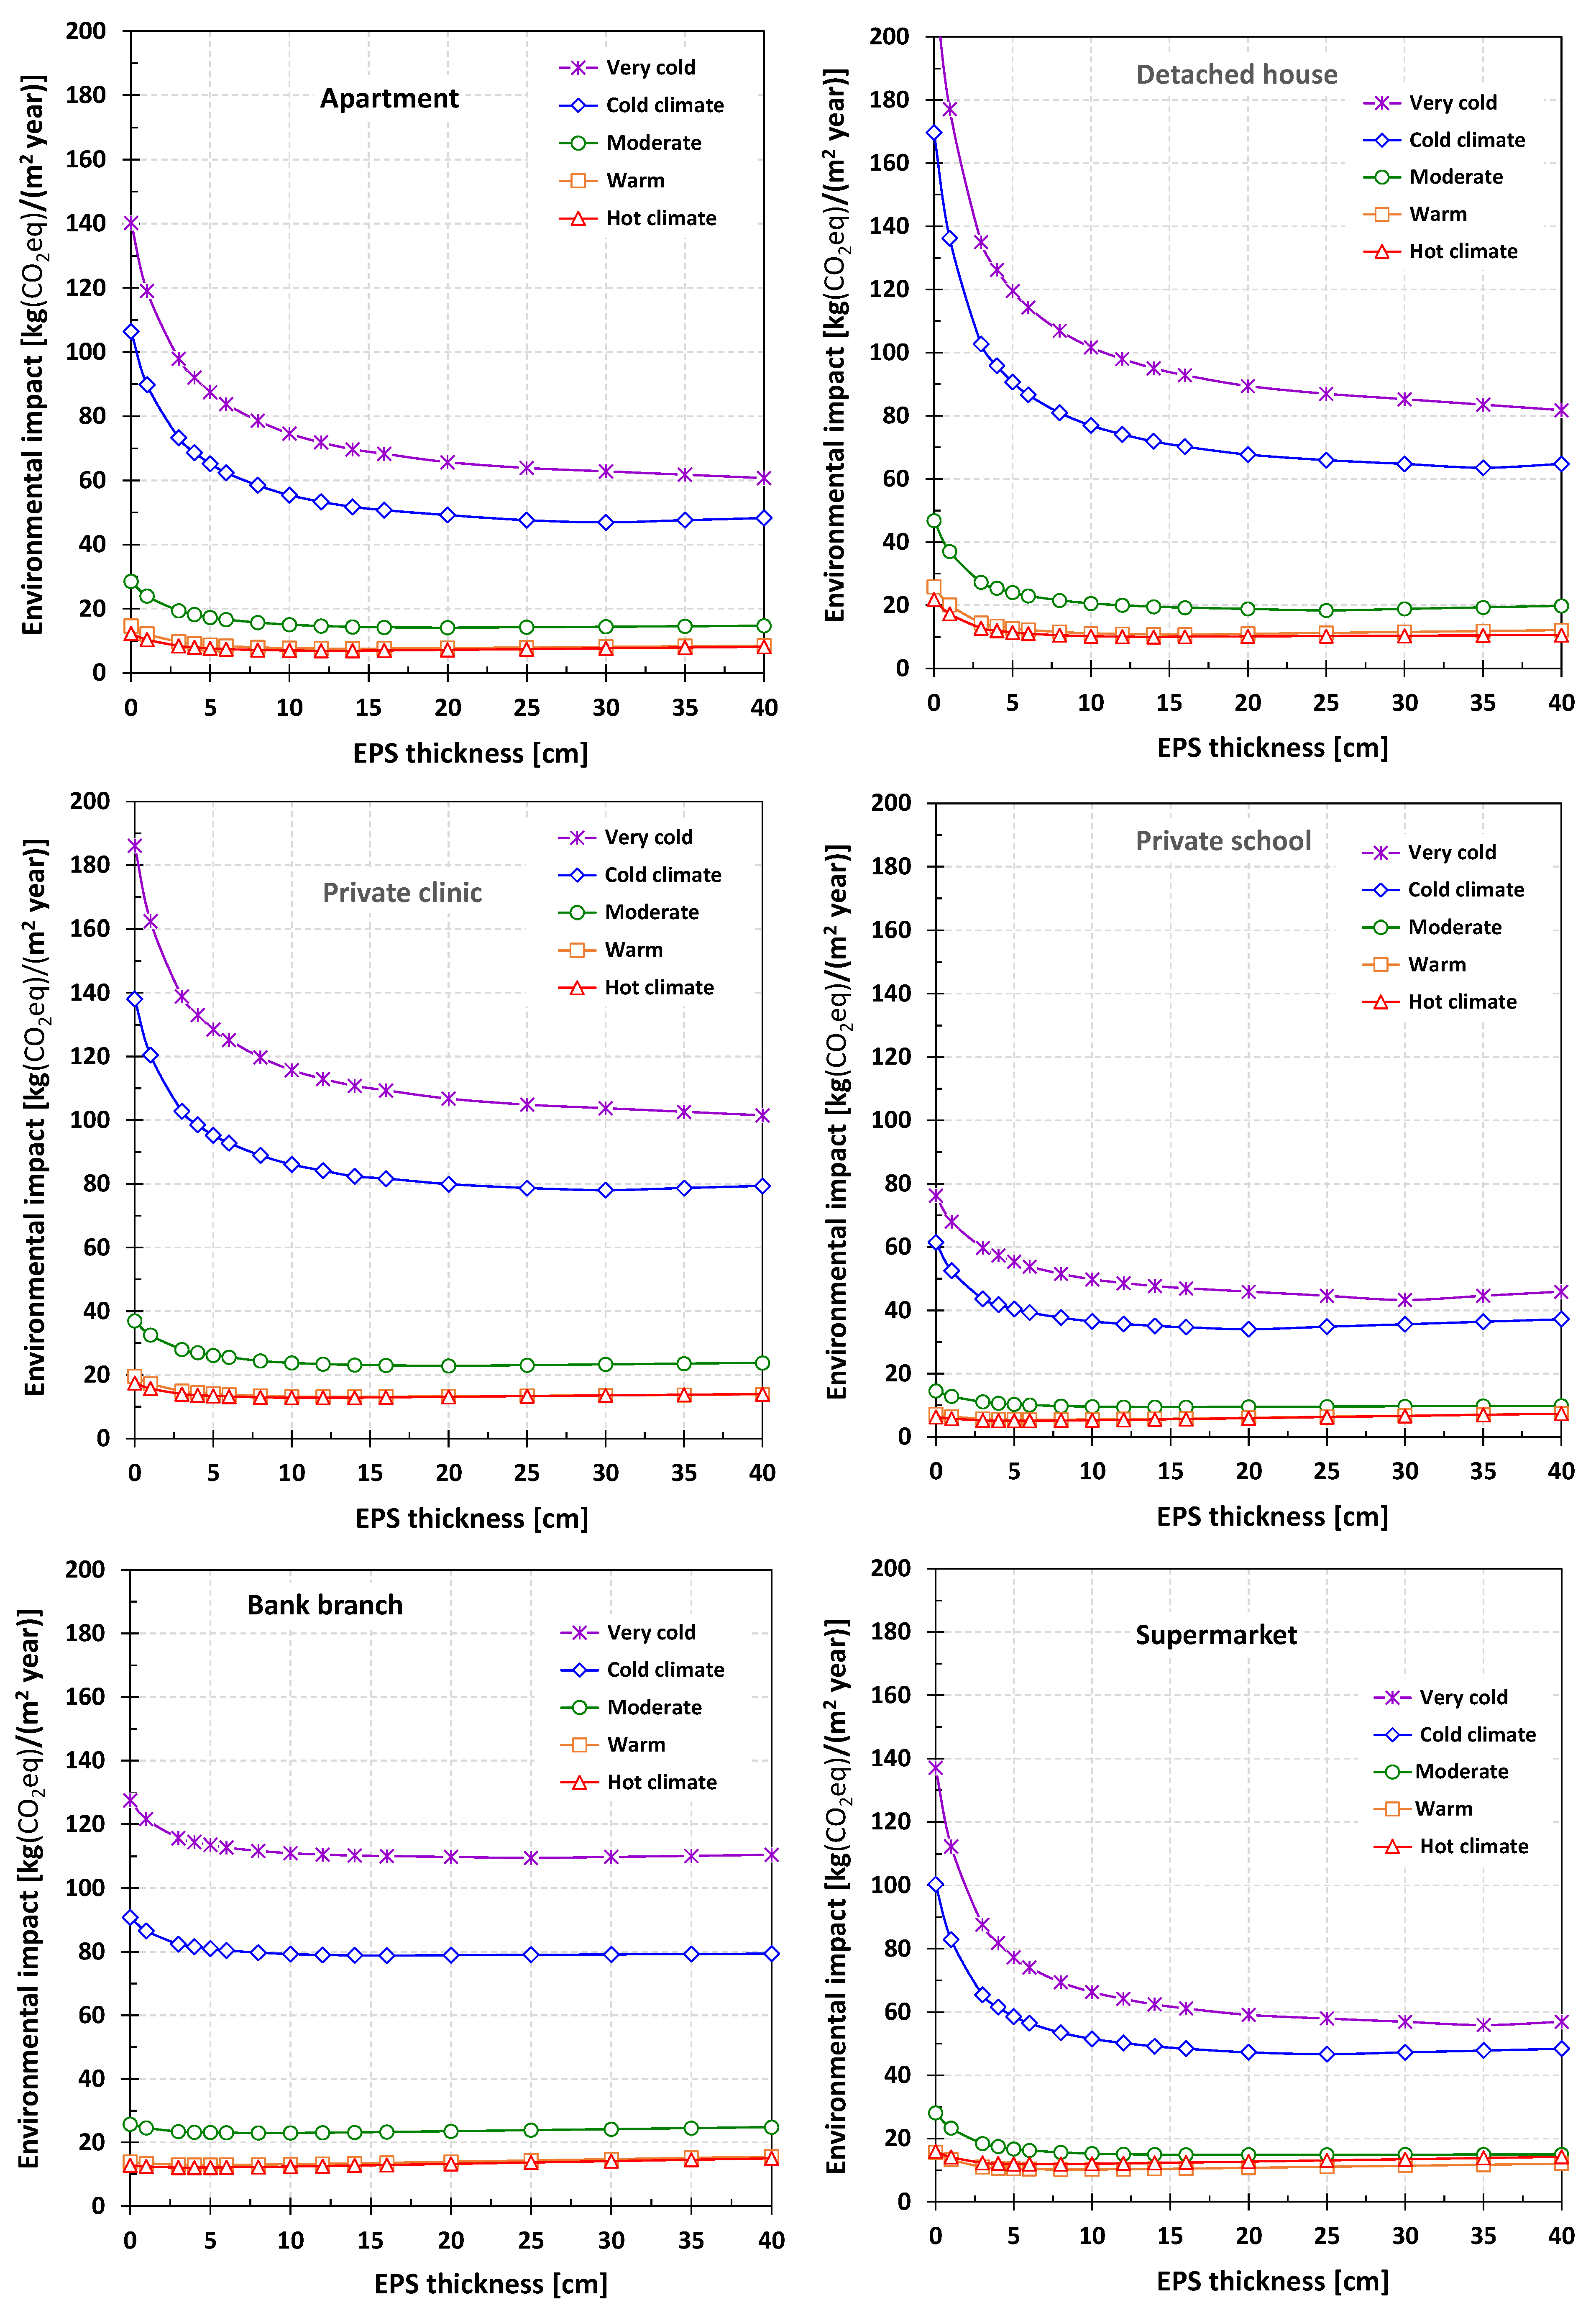
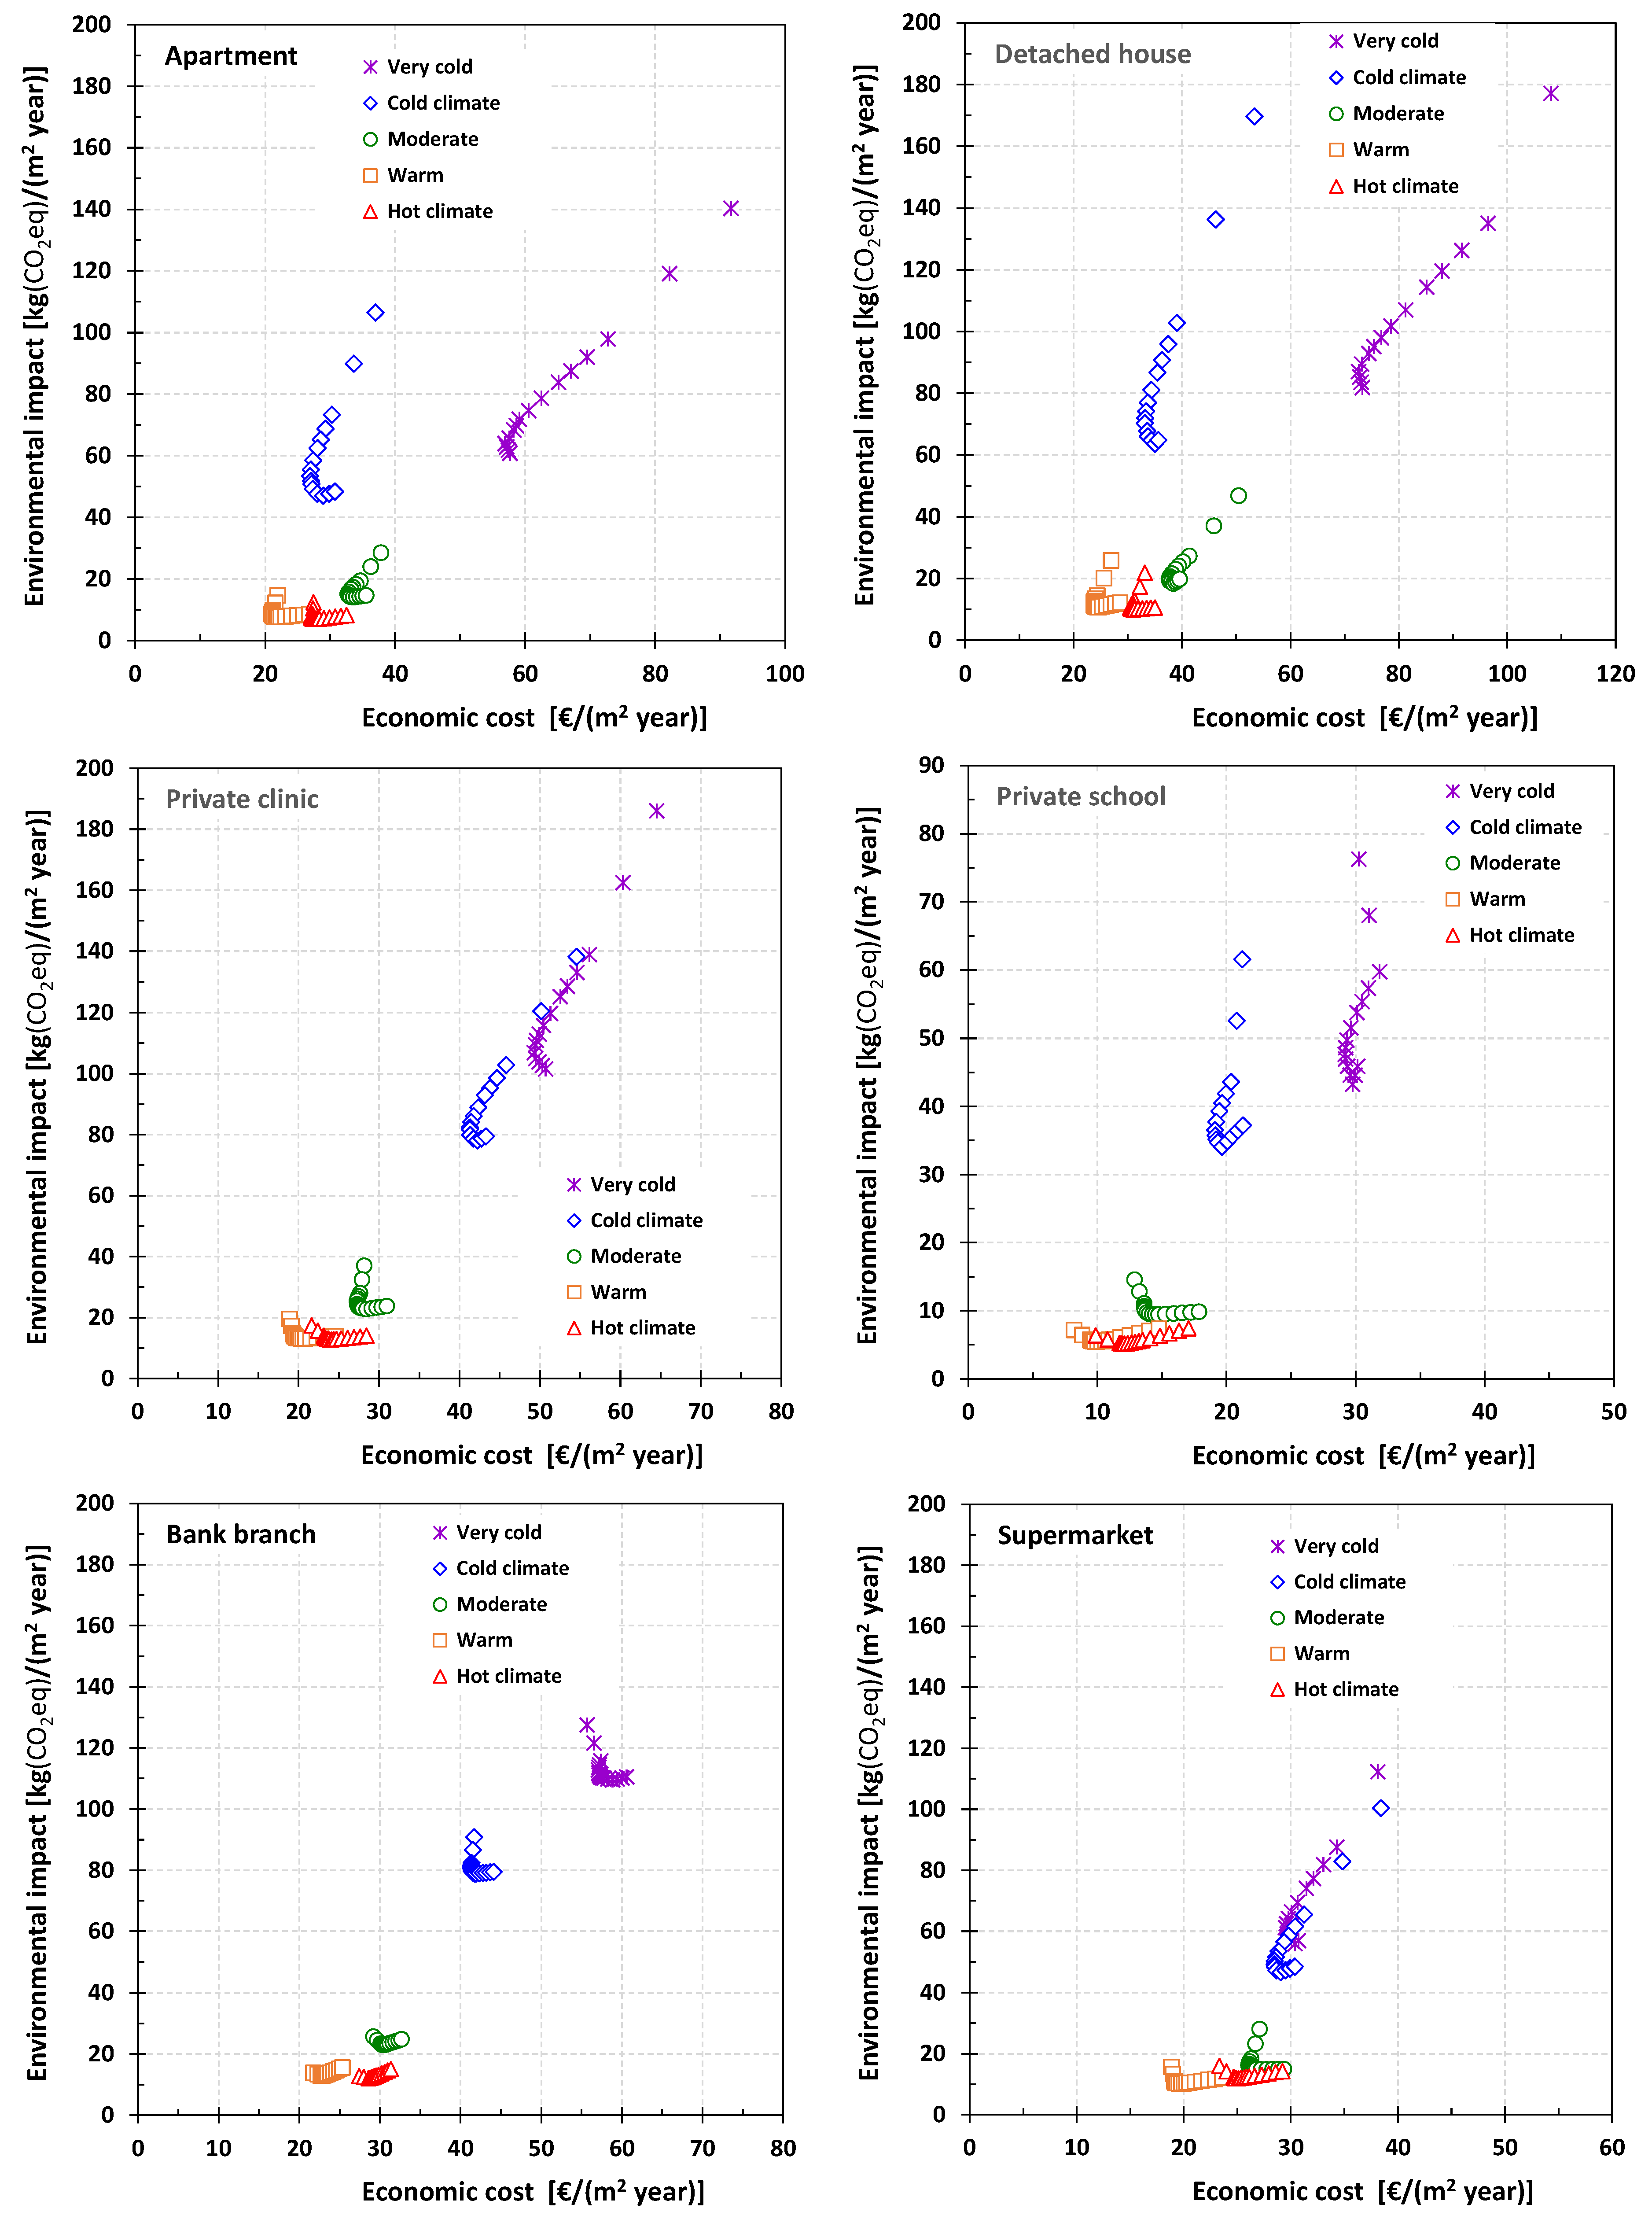
4. Results and Discussion

To facilitate comparisons between the different buildings, it was assumed that they were all built using the same type of passive construction solutions (opaque and glazed). The combination of opaque element materials with an External Thermal Insulation Composite System (ETICS) leads to buildings with high thermal inertia, which is known as an effective strategy to mitigate both overheating and cooling load peaks [2,11,24,25,28,29,30,31,32].
As stated elsewhere [28,31,32], the buildings’ energy performance is very sensitive to several deterioration factors, particularly the degradation with time of the HVAC and the thermal insulation systems. Thus, this loss of efficiency was considered assuming an increase of 1%/year in primary energy consumption for heating and cooling.
Energy, environmental, and economic perspectives are used to relate the thickness of the thermal insulation with the climate and the type of building. For this, five climate types (hot, warm, moderate, cold, and very cold) and six different buildings (an apartment, a detached house, a clinic, a school, a bank branch, and a supermarket) were considered. The results shown in the following sections are normalized per m2 of acclimatized spaces’ floor area. The net (Acl) and gross (Agf) floor areas are presented in Table 2.

4.1. Energy Cost of Thermal Comfort

The primary energy consumption for the heating and cooling functions is used to represent the energy cost of thermal comfort. This cost depends on the building type of use, on the climate characteristics, on the energy efficiency of the acclimatization systems, and on the thickness of thermal insulation.
As shown in Figure 4, the buildings with day and night uses (apartment, dwelling, and clinic) have a higher primary energy consumption for climatization than those with only daytime occupation (school and bank branch) or occupied during daytime and part of the night (supermarket). As it has a much more favorable aspect ratio (AR), the apartment’s energy requirements are lower than those of the dwelling. The school is the building with the lowest energy consumption for air conditioning per m2 of acclimatized floor area due to the fact that it is occupied only during the daytime and is closed, or is partially closed, during school holidays.
Figure 4 shows that the energy cost of thermal comfort is substantially higher in the case of the two cold climates (cold and very cold) than in the remaining three (hot, warm, and moderate). This is due to the high energy requirements for heating in cold climates and the fact that the heating system considered for these has a significantly lower efficiency than that assumed for the remaining three.
The increase in the applied thickness of EPS leads to a continuous decrease in the consumption of primary energy by the air-conditioning equipment, promoting a decrease in the thermal comfort energy cost. This decrease has an inverse exponential behavior, showing a declining rate of decrease as the EPS thickness increases, and, within the range of tested EPS thicknesses (0–40 cm), the minimum value occurs for the thickness of 40 cm, which leads to the projection that this consumption will continue to decline with the growth in the thickness of thermal insulation. Therefore, it was not possible to identify, in concrete, the optimal thickness of EPS from an energy perspective.
For the same building, the decrease in energy consumption for air conditioning with the increase in EPS thickness is much more significant in the cases of cold and very cold climates. Otherwise, the decrease in energy consumption with the increase in the applied EPS thickness is small in the case of buildings located in hot and warm climates. Furthermore, primary energy consumption is very similar in these two climates. Except for the supermarket, primary energy consumption in the warm climate is slightly higher than in the hot climate. Due to its high internal thermal loads, the supermarket has high energy needs for cooling, which leads to a slightly higher consumption of primary energy in a hot climate compared with a warm climate.

4.2. Environmental Cost of Thermal Comfort

The environmental impact of ensuring thermal comfort conditions inside buildings is assessed using the concept of the “annual environmental cost of thermal comfort,” which is represented here by equivalent CO2 emissions. These emissions include those associated with the building’s construction phase and those related to its operation throughout its useful life cycle, ignoring the emissions related to the end-of-life of the materials. Equivalent CO2 emissions associated with the construction phase include those caused by energy consumption for the extraction, manufacture, transport, and application of the thermal insulation solution. Since they are not related to the thickness of thermal insulation, the environmental impacts associated with other construction materials were ignored. CO2 equivalent emissions associated with the building use phase are due to energy consumption by HVAC equipment to meet heating and cooling demands.
Figure 5 shows the equivalent annual CO2 emissions of the six buildings considered, according to the type of climate and the thickness of thermal insulation. As expected, these emissions depend on the building’s type of use, the characteristics of the climate, and the EPS thickness.
The results presented in Figure 5 reveal that annual CO2 equivalent emissions depend mostly on the annual consumption of primary energy for heating and cooling, with a minor influence from the emissions associated with building construction. Thus, with few exceptions, the statements for the energy cost of thermal comfort are also valid for the environmental cost of thermal comfort. Namely, the environmental cost of thermal comfort is substantially higher in the case of the two cold climates (cold and very cold) than in the remaining three (hot, warm, and moderate). For the same typology of use, buildings located in hot and warm climates have very close environmental costs. The buildings with day and night uses (apartment, dwelling, and clinic) have higher environmental costs than those with only daytime occupation (school and bank branch) or occupied during daytime and part of the night (supermarket). Per m2 of acclimatized floor area, the school is the building with the lowest environmental cost of thermal comfort.
Figure 5 reveals that the increasing EPS thickness leads to a continuous decrease in CO2 equivalent emissions, but only up to a certain thickness, after which emissions increase. Therefore, from an environmental perspective, there is an EPS thickness for which the environmental impact is minimal.

4.3. Economic Cost of Thermal Comfort

The economic cost of thermal comfort is represented by the “equivalent annual economic cost of the thermal insulation” (ECTI), obtained considering the investment costs in the thermal insulation system, the expenses in its maintenance, and the costs due to the energy consumed to maintain thermal comfort conditions. Taxes were also considered and, if they exist, tax savings.
For a specific country and a particular HVAC system, the ECTI value depends on the type of building, the climate characteristics, and the thickness of the thermal insulation [2,11]. However, if the analysis involves different countries and distinct HVAC systems, the ECTI value also depends on the labor cost, the energy efficiency of heating and cooling devices, and the price of energy purchase. As can be seen in Section 3.3 and Table 5 and Table 6, these parameters can show very substantial differences between distinct countries. Therefore, the ECTI value is only valid for the HVAC system, the type of climate, and the country for which it is determined. Thus, the type of climate must appear to be associated with the country of the place considered to represent it.
Figure 6 shows the equivalent annual economic cost of the thermal insulation (ECTI) of the six buildings considered as a function of the climate type (and country) and of the thermal insulation thickness. The optimal thermal insulation thickness is the one for which the ECTI value is the lowest. Both the ECTI value and its evolution with the increase in EPS thickness are strongly related to the type of building. This relationship, however, is substantially more evident in the case of cold and very cold climates than in the others (hot, warm, and moderate). In general terms, for the same type of climate (and country), buildings with permanent occupancy (apartment, detached house, and clinic) have higher ECTI values than buildings with intermittent use (school, bank branch, and supermarket). The school is the building with the lowest ECTI values, followed by the supermarket.
The highest ECTI values always occur in very cold climates (Iceland). This is due to the high demand for thermal energy for heating, the low performance of the heating system, and the high value of labor costs in Iceland. The difference compared with other types of climates (countries) is very substantial in the case of the two residential buildings and very small in the case of the supermarket.
The consumption of primary energy for air conditioning is always higher in the cold climate (Poland) than in the moderate climate (Spain), but the ECTI value is higher in the case of the moderate climate (Spain) than in the cold climate (Poland) for the two residential buildings. This is a result of the substantially higher values of labor costs and energy prices in Spain than in Poland. These causes are not enough to lead to this “inversion of order” in the case of non-residential buildings, but even so, it leads to a greater approximation of values between ECTI and energy consumption.
The difference in primary energy consumption for air conditioning between hot and warm climates is very small, being slightly higher in warm climates (except in the case of the supermarket, where it is the opposite, due to the demands of thermal energy for cooling associated with this type of building). Even so, the difference in ECTI values between hot (Spain) and warm (Portugal) climates is not small, and the value of this economic cost is always higher in the case of a hot climate (Spain) than in a warm climate (Portugal). This results from substantially higher values in Spain than in Portugal for labor costs and energy purchase prices.
Previous outcomes lead to the conclusion that the optimal value of the thermal insulation thickness from an economic perspective is only valid for the HVAC system, the type of climate, and the country for which it is determined.

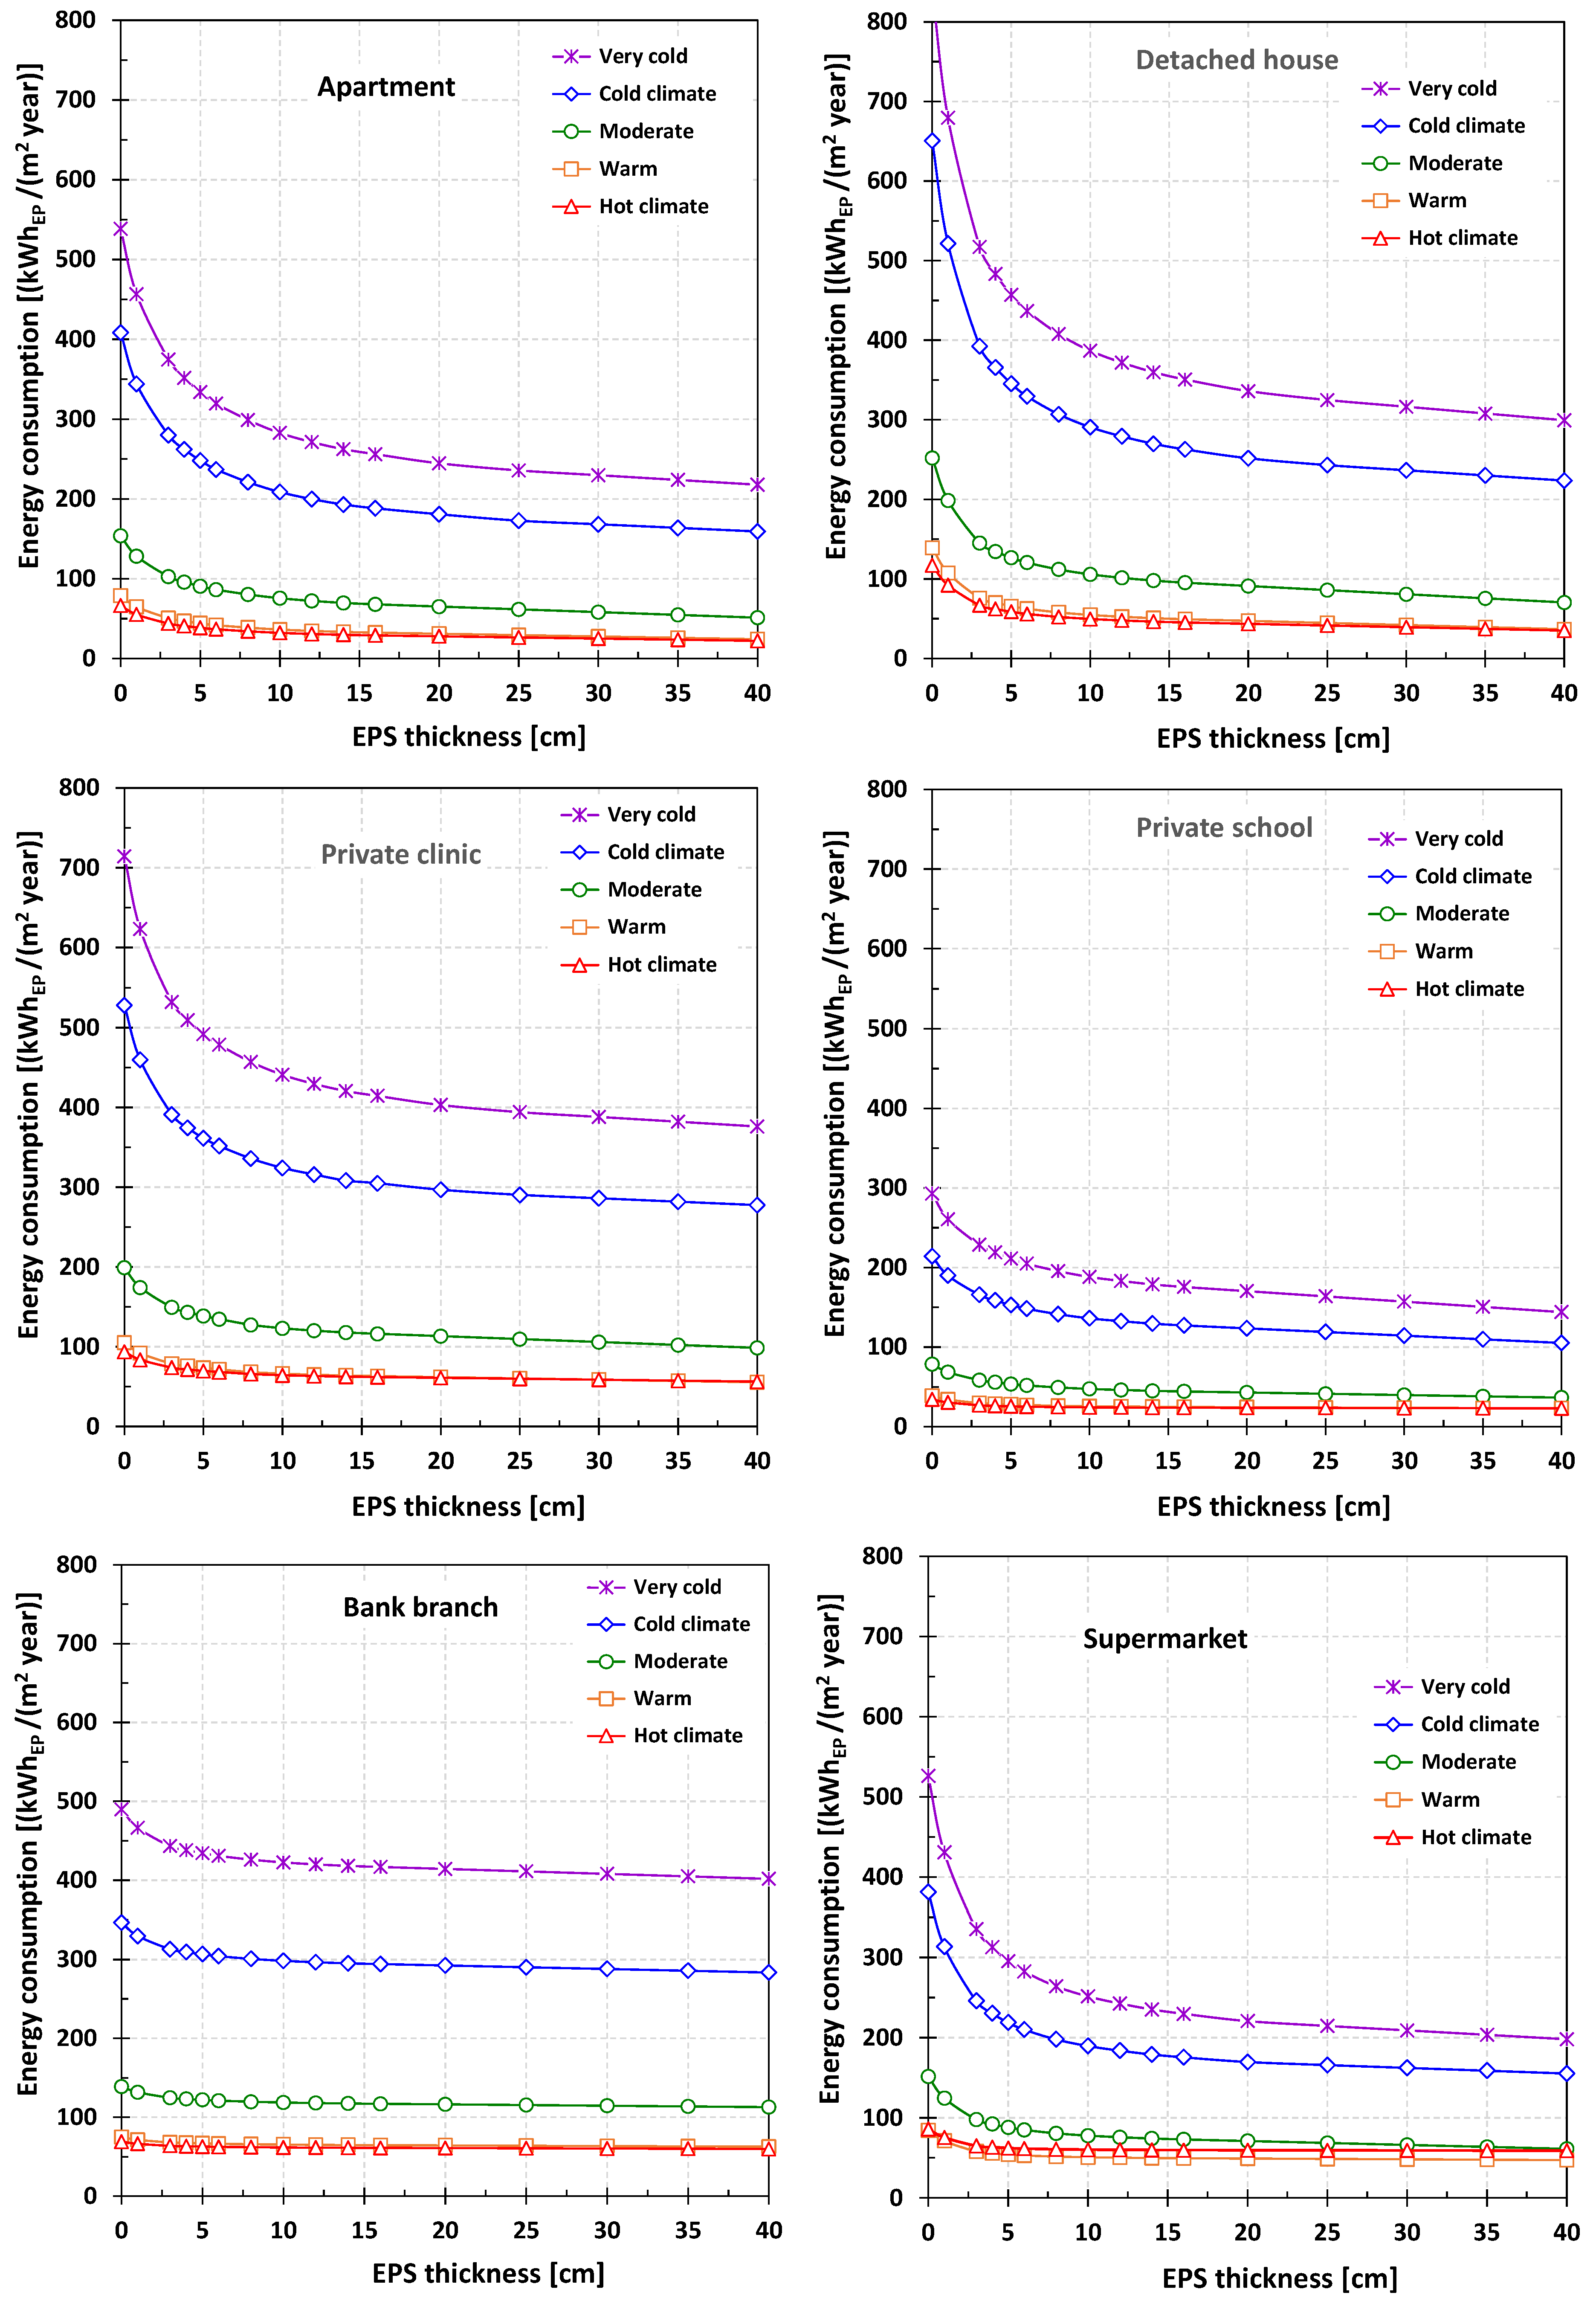
4.4. Optimal Thickness of Thermal Insulation

The optimal thermal insulation thickness of buildings’ envelopes depends on the perspective of analysis, which can be energetic, environmental, or economic [11,12,17,18,19,20,21]. In energy terms, it corresponds to the one that leads to the lowest primary energy consumption for climatization; from an environmental perspective, it is the one where the emission of CO2 equivalent reaches a minimum; and in economic terms, it is the one that leads to the lowest value of the economic cost of thermal comfort. The application of these criteria to the values represented in Figure 4, Figure 5 and Figure 6 allowed the elaboration of a summary table (Table 7), in which it is evident that each perspective leads to different values of the optimal EPS thickness.
The results shown in Table 7 reveal that, within the range of tested EPS thicknesses (0 to 40 cm), from an energy point of view, the optimal thermal insulation thickness is greater than 40 cm for all types of buildings and climates. This is a consequence of the fact that increasing thermal insulation thickness always leads to a decrease in energy consumption for heating and an increase in energy consumption for cooling, as shown by the results of this study (figures not shown) and what is reported in the bibliography [2,11,24,25,33]. Additionally, the rate of decrease in energy consumption for heating is greater than the rate of increase in consumption for cooling, which is reflected in a continuous decrease in energy consumption for air conditioning with the increase of thermal insulation thickness. Clearly, this statement is valid only for the situations analyzed here. In the authors’ opinion, a reversal of this trend can occur in buildings with high internal thermal loads and low thermal mass that are located in regions with hot or warm climates. The buildings in this study have a high thermal mass, so eventually, a thermal insulation thickness that leads to a minimum of energy consumption does not exist.
As Table 7 highlights, there is an EPS thickness that minimizes equivalent CO2 emissions, so it can be stated that there always exists an environmentally optimal thermal insulation thickness. This optimal thickness increases with the cooling of the climate in all types of buildings, always presenting the lowest value for a hot climate and the highest for a very cold climate. In the situation of very cold weather, it was not possible to identify the environmentally optimal EPS thickness for buildings with permanent occupancy (apartments, detached houses, and clinics). Even so, the evolution of emissions of CO2 equivalent clearly suggests that its value lies between 40 and 50 cm.
In global terms and for the same type of climate, the value of the environmentally optimal thickness of buildings with permanent occupancy is substantially higher than that of buildings with intermittent use (school, bank branch, and supermarket). According to the environmental perspective, the detached house requires the greatest EPS thickness, and the bank branch the smallest.
In very general terms and as expected, it can be outlined that the optimal EPS thickness according to the economic perspective increases with the cooling of the climate; thus, the lowest corresponds to a hot climate and the highest to a very cold climate. In terms of type of use, buildings can be ordered from the least economically optimal thickness to the greatest: bank branch (0 to 6 cm), school (0 to 14 cm), supermarket (0 to 16 cm), clinic (0 to 20 cm), apartment (5 to 25 cm), and detached house (8 to 25 cm). Among the situations analyzed in the present study, it is not economically advantageous to isolate the opaque elements of the four non-residential buildings when located in hot (Spain) and warm (Portugal) climates. In the case of the moderate climate (Spain), this also occurs in the cases of the school and the bank branch.
In addition to the energy demands for air conditioning, the energy efficiency of HVAC systems, the cost of acquiring EPS, the cost of labor, and the price of purchasing energy have also been considered in the economic analysis, which differs from country to country. As such, the economic optimal value of thermal insulation thickness is only valid for the type of climate and the country for which it was determined. Furthermore, it was assumed that, for the next 50 years, energy prices would increase at a rate of 5%/year. However, as demonstrated by Raimundo and Oliveira [2], the economic advantages of thermally insulating the opaque elements of buildings grow with the rate of inflation of energy prices.
Figure 7 shows the relation between the environmental impact and the economic cost of the six buildings considered for the five types of climates. As revealed by these graphs and by Table 7, the EPS thickness that leads to the lower environmental impacts does not correspond to the optimal economic cost. However, as shown in Figure 7, the optimal EPS thickness in environmental terms shows an economic cost relatively close to its optimal value. So, in the authors’ point of view, the best option for thermal insulation thickness lies between the optimal values of the economic and environmental costs.
In summary, for the cases considered in this study, the greater the thickness of EPS, the lower the energy consumption for air conditioning. From an environmental perspective, there is always an optimal EPS thickness below which emissions of CO2 equivalent decrease with increasing EPS thickness. For thicknesses above this ideal value, the energy embodied in constructive solutions is not offset by the reduction in energy consumption for air conditioning. The economically optimal thicknesses of EPS are significantly lower than the corresponding ones in environmental terms. From a strictly economic perspective, the additional investment in a thermal insulation system is only clearly offset by the reduction in energy expenditure for air conditioning when buildings are in a cold or very cold climate. However, the higher the price of purchasing energy, the greater the economic interest in increasing the thickness of thermal insulation [2], so it is highly likely that in the future it will be economically interesting to apply generous thicknesses of thermal insulation, even in moderate climates.

5. Conclusions

An assessment of the relationship between the cost of thermal comfort in residential and non-residential buildings and the type of building use, the type of climate, and the thermal insulation of opaque elements was carried out using energy, environmental, and economic analyses. Three buildings with permanent use (an apartment, a detached house, and a clinic) and three buildings with intermittent utilization (a school, a bank branch, and a supermarket) were selected, which were supposedly located in places with five different climates (hot, warm, moderate, cold, and very cold).
The concepts of “economic cost of thermal insulation efficiency” and “environmental cost of thermal insulation efficiency” were applied to the three thermal insulating materials most widely used (EPS—expanded polystyrene, XPS—extruded polystyrene, and MW—mineral wool). Both perspectives reveal the EPS as the most promising. Therefore, this was the thermal insulation material selected for this study.
Regardless of the climatic region and the type of the building, the predicted values show a continuous decrease in the consumption of primary energy for climatization with the increase in the EPS thickness applied to opaque elements of the building’s envelope. This decrease has an inverse exponential behavior, showing a lessening of the decreasing rate as the EPS thickness increases. The energy cost of thermal comfort is substantially higher in the case of the two cold climates than in the other three, and it is also in the cold climates that there is a more significant decrease in energy consumption for air conditioning with the increase in EPS thickness. The buildings with day and night uses have higher energy consumption for climate control than those with only daytime occupation or occupied during the day and part of the night.
The environmental cost of thermal comfort mainly depends on the annual primary energy consumption for heating and cooling, with emissions associated with building construction having a smaller influence. The buildings with permanent use have a higher environmental cost than those with intermittent occupation, and this cost is substantially higher for the two cold climates than for the remaining three. Clearly, it is more environmentally advantageous to thermally insulate opaque elements of buildings located in cold climates than in moderate, warm, or hot climates. Thus, there is a great sensitivity to this parameter in relation to climate and building types, with a substantially stronger relationship with the type of climate.
In general terms, the economic optimal EPS thickness increases with the cooling of the climate, with the lowest value for hot climates and the highest for very cold ones. Furthermore, it varies with the building’s type of use, with higher values for residential buildings than for commercial and service buildings. Economically, the investment in a thermal insulation system is only clearly offset by the reduction in energy expenditure for climatization when buildings are in cold or very cold climates and/or if they are of the residential type.
In short, it has been demonstrated that the application of thermal insulation in the opaque constructive solutions of the building envelope is a highly efficient way of reducing energy consumption and environmental impacts, and it is economically advantageous in the case of residential buildings and/or all buildings located in cold climates. The optimal economic thicknesses of EPS are significantly lower than the corresponding ones in environmental terms.
The optimal thermal insulation thicknesses of the opaque elements of six types of buildings, supposedly located in different types of climates, were obtained using a unified assessment. The results can be used to select the recommended thermal insulation thickness to apply in a given building located in a specific climate; this fact represents the main added value of this work. Clearly, the optimal thickness depends on the perspective considered.
It should be noted that the influence of installing electrical energy production systems from renewable sources was not considered, which is noteworthy in environmental terms and might become economically significant due to the probable energy price escalation. These limitations deserve to be addressed in future work. Finally, the results of this research provide useful insights for building professionals and policymakers.

Author Contributions

Conceptualization, A.M.R.; methodology, A.M.R.; software, A.M.R. and A.M.S.; validation, A.M.R.; investigation, A.M.S.; writing-first draft, A.M.S.; formal analysis, A.M.R. and A.V.M.O.; writing-second draft, review, and editing, A.M.R. and A.V.M.O. All authors have read and agreed to the published version of the manuscript.

Funding

This research received no external funding.

Institutional Review Board Statement

Not applicable.

Informed Consent Statement

Not applicable.

Data Availability Statement

Not applicable.

Conflicts of Interest

The authors declare no conflict of interest.

References

  1. Frontczak, M.; Wargocki, P. Literature survey on how different factors influence human comfort in indoor environments. Build. Environ. 2011, 46, 922–937. [Google Scholar] [CrossRef]
  2. Raimundo, A.M.; Oliveira, A.V.M. Analyzing thermal comfort and related costs in buildings under Portuguese temperate climate. Build. Environ. 2022, 219, 109238. [Google Scholar] [CrossRef]
  3. Intergovernmental Panel on Climate Change. Technical Summary. In Climate Change 2022: Mitigation of Climate Change. Contribution of Working Group III to the Sixth Assessment Report of the Intergovernmental Panel on Climate Change; Cambridge University Press: Cambridge, UK; New York, NY, USA, 2022; Available online: https://www.ipcc.ch/report/sixth-assessment-report-working-group-3/ (accessed on 2 September 2022). [CrossRef]
  4. United Nations Environment Programme. Emissions Gap Report 2022: The Closing Window—Climate Crisis Calls for Rapid Transformation of Societies; United Nations Environment Programme: Nairobi, Kenya, 2022; Available online: https://www.unep.org/resources/emissions-gap-report-2022 (accessed on 20 September 2022).
  5. European Union. Directive (EU) 2018/844 of the European Parliament and of the Council, of 30 May 2018, amending Directive 2010/31/EU on the energy performance of buildings and Directive 2012/27/EU on energy efficiency. Offic. J. Eur. Union 2018, 156, 75–91. Available online: https://eur-lex.europa.eu/legal-content/EN/TXT/?uri=uriserv%3AOJ.L_.2018.156.01.0075.01.ENG (accessed on 2 September 2022).
  6. 2021/0426 (COD); Proposal for a Directive of the European Parliament and of the Council on the Energy Performance of Buildings (Recast). European Union: Brussels, Belgium, 2021. Available online: https://eur-lex.europa.eu/procedure/EN/2021_426 (accessed on 2 September 2022).
  7. Scheuer, C.; Keoleian, G.A.; Reppe, P. Life cycle energy and environmental performance of a new university building: Modeling challenges and design implications. Energy Build. 2003, 35, 1049–1064. [Google Scholar] [CrossRef]
  8. Beccali, M.; Cellura, M.; Fontana, M.; Longo, S.; Mistretta, M. Energy retrofit of a single-family house: Life cycle net energy saving and environmental benefits. Renew. Sustain. Energy Rev. 2013, 27, 283–293. [Google Scholar] [CrossRef]
  9. Bastos, J.; Batterman, S.A.; Freire, F. Life-cycle energy and greenhouse gas analysis of three building types in a residential area in Lisbon. Energy Build. 2014, 69, 344–353. [Google Scholar] [CrossRef]
  10. Atmaca, A.; Atmaca, N. Life cycle energy (LCEA) and carbon dioxide emissions (LCCO2A) assessment of two residential buildings in Gaziantep, Turkey. Energy Build. 2015, 102, 417–431. [Google Scholar] [CrossRef]
  11. Raimundo, A.M.; Saraiva, N.B.; Oliveira, A.V.M. Thermal insulation cost optimality of opaque constructive solutions of buildings under Portuguese temperate climate. Build. Environ. 2020, 182, 107107. [Google Scholar] [CrossRef]
  12. Jafari, A.; Valentin, V. Selection of optimization objectives for decision-making in building energy retrofits. Build. Environ. 2018, 130, 94–103. [Google Scholar] [CrossRef]
  13. EN 15459:2007; Energy Performance of Buildings—Economic Evaluation Procedure for Energy Systems in Buildings. CEN (European Committee for Standardization): Brussels, Belgium, 2007.
  14. European Commission. Commission Delegated Regulation (EU) 244/2012 of 16 January 2012 supplementing Directive 2010/31/EU on the energy performance of buildings by establishing a methodology framework for calculating cost optimal levels of minimum energy performance. Offic. J. Eur. Union 2012, 81, 18–36. Available online: https://eur-lex.europa.eu/legal-content/EN/TXT/?uri=CELEX%3A32012R0244 (accessed on 2 September 2022).
  15. Raimundo, A.M.; Saraiva, N.B.; Dias, L.P.; Rebelo, A.C. Market-oriented cost-effectiveness and energy analysis of windows in Portugal. Energies 2021, 14, 3720. [Google Scholar] [CrossRef]
  16. Grazieschi, G.; Asdrubali, F.; Thomas, G. Embodied energy and carbon of building insulating materials: A critical rewiew. Clean. Environ. Syst. 2021, 2, 100032. [Google Scholar] [CrossRef]
  17. Anastaselos, D.; Giama, E.; Papadopoulos, A. An assessment tool for the energy, economic and environmental evaluation of thermal insulation solutions. Energy Build. 2009, 41, 1165–1171. [Google Scholar] [CrossRef]
  18. Dylewski, R.; Adamczyk, J. Optimum thickness of thermal insulation with both economic and ecological costs of heating and cooling. Energies 2021, 14, 3835. [Google Scholar] [CrossRef]
  19. Las-Heras-Casas, J.; López-Ochoa, L.M.; López-González, L.M.; Olasolo-Alonso, P. Energy renovation of residential buildings in hot and temperate Mediterranean zones using optimized thermal envelope insulation thicknesses: The case of Spain. Appl. Sci. 2021, 11, 370. [Google Scholar] [CrossRef]
  20. Wang, H.; Huang, Y.; Yang, L. Integrated economic and environmental assessment-based optimization design method of building roof thermal insulation. Buildings 2022, 12, 916. [Google Scholar] [CrossRef]
  21. Yang, Q.; Kong, L.; Tong, H.; Wang, X. Evaluation model of environmental impacts of insulation building envelopes. Sustainability 2020, 12, 2258. [Google Scholar] [CrossRef] [Green Version]
  22. Totland, M.; Kvande, T.; Bohne, R.A. The effect of insulation thickness on lifetime CO2 emissions. IOP Conf. Ser. Earth Environ. Sci. 2019, 323, 012033. [Google Scholar] [CrossRef]
  23. Congedo, P.M.; Baglivo, C.; Seyhan, A.K.; Marchetti, R. Worldwide dynamic predictive analysis of building performance under long-term climate change conditions. J. Build. Engin. 2021, 42, 103057. [Google Scholar] [CrossRef]
  24. Ounis, S.; Aste, N.; Butera, F.M.; Pero, C.D.; Leonforte, F.; Adhikari, R.S. Optimal balance between heating, cooling and environmental impacts: A method for appropriate assessment of building envelope’s U-value. Energies 2022, 15, 3570. [Google Scholar] [CrossRef]
  25. Bo, R.; Shao, Y.; Xu, Y.; Yu, Y.; Guo, H.; Chang, W.S. Research on the relationship between thermal insulation thickness and summer overheating risk: A case study in severe cold and cold regions of China. Buildings 2022, 12, 1032. [Google Scholar] [CrossRef]
  26. Chen, S.; Zhang, G.; Xia, X.; Setunge, S.; Shi, L. A review of internal and external influencing factors on energy efficiency design of buildings. Energy Build. 2020, 216, 109944. [Google Scholar] [CrossRef]
  27. Andreotti, M.; Bottino-Leone, D.; Calzolari, M.; Davoli, P.; Pereira, L.D.; Lucchi, E.; Troi, A. Applied research of the hygrothermal behaviour of an internally insulated historic wall without vapour barrier: In situ measurements and dynamic simulations. Energies 2020, 13, 3362. [Google Scholar] [CrossRef]
  28. Kvande, T.; Bakken, N.; Bergheim, E.; Thue, J.V. Durability of ETICS with rendering in Norway—Experimental and field investigations. Buildings 2018, 8, 93. [Google Scholar] [CrossRef] [Green Version]
  29. Brambilla, A.; Bonvin, J.; Flourentzou, F.; Jusselme, T. On the influence of thermal mass and natural ventilation on overheating risk in offices. Buildings 2018, 8, 47. [Google Scholar] [CrossRef] [Green Version]
  30. Michałowski, B.; Marcinek, M.; Tomaszewska, J.; Czernik, S.; Piasecki, M.; Geryło, R.; Michalak, J. Influence of rendering type on the environmental characteristics of expanded polystyrene-based external thermal insulation composite system. Buildings 2020, 10, 47. [Google Scholar] [CrossRef] [Green Version]
  31. D’Agostino, D.; Landolfi, R.; Nicolella, M.; Minichiello, F. Experimental study on the performance decay of thermal insulation and related influence on heating energy consumption in buildings. Sustainability 2022, 14, 2947. [Google Scholar] [CrossRef]
  32. Landolfi, R.; Nicolella, M. Durability assessment of ETICS: Comparative evaluation of different insulating materials. Sustainability 2022, 14, 980. [Google Scholar] [CrossRef]
  33. Dylewski, R.; Adamczyk, J. Economic and environmental benefits of thermal insulation of building external walls. Build. Environ. 2011, 46, 2615–2623. [Google Scholar] [CrossRef]
  34. Adamczyk, J.; Dylewski, R.; Sobierajewicz, P. Economic and ecological benefits of thermal insulation of external partitions depending on the temperature in residential premises. J. Clean. Product. 2023, 384, 135622. [Google Scholar] [CrossRef]
  35. Raimundo, A.M. SEnergEd—Software for Buildings’ Dynamic Energy Simulation and Calculation of Their Environmental and Economic Life-Cycle Costs, User Guide 2019; DEM, FCTUC, University of Coimbra: Coimbra, Portugal. (In Portuguese)
  36. ISO 13790:2008; Energy Performance of Buildings—Calculation of Energy Use for Space Heating and Cooling. International Organization for Standardization: Geneva, Switzerland, 2008. Available online: https://www.iso.org/obp/ui/#iso:std:iso:13790:ed-2:v1:en (accessed on 2 September 2022).
  37. General Directorate of Energy and Geology of Portugal. Technical Manual for the Assessment of the Energy Performance of Buildings. Approved by Dispatch nº 6476-H/2021 of July 1; General Directorate of Energy and Geology of Portugal: Lisbon, Portugal, 1 July 2021. Available online: https://www.sce.pt/legislacao/ (accessed on 2 September 2022). (In Portuguese)
  38. Eurostat. Monthly Minimum Wages—Bi-annual Data, First Semester of 2022. Available online: https://ec.europa.eu/eurostat/en/web/products-datasets/-/EARN_MW_CUR (accessed on 2 September 2022).
  39. Baglivo, C.; Congedo, P.M.; D’Agostino, D.; Zacá, I. Cost-optimal analysis and technical comparison between standard and high efficient mono-residential buildings in a warm climate. Energy 2015, 83, 560–575. [Google Scholar] [CrossRef]
  40. European Commission. Consolidated text of Commission Delegated Regulation (EU) 626/2011 of 4 May 2011 supplementing Directive 2010/30/EU with regard to energy labelling of air conditioners. Offic. J. Eur. Union 2011, L178, 1–78. Available online: https://eur-lex.europa.eu/legal-content/EN/TXT/?uri=CELEX%3A02011R0626-20200809 (accessed on 16 September 2022).
  41. EN 16798-1:2019; Energy Performance of Buildings—Part 1: Indoor Environmental Input Parameters for Design and Assessment of Energy Performance of Buildings Addressing Indoor Air Quality, Thermal Environment, Lighting and Acoustics, CEN. European Committee for Standardization: Brussels, Belgium, 2019.
  42. Guardigli, L.; Bragadin, M.A.; Fornace, F.D.; Mazzoli, C.; Prati, D. Energy retrofit alternatives and cost-optimal analysis for large public housing stocks. Energy Build. 2018, 166, 48–59. [Google Scholar] [CrossRef]
  43. Schiavoni, S.; D’Alessandro, F.; Bianchi, F.; Asdrubali, F. Insulation materials for the building sector: A review and comparative analysis. Renew. Sustain. Energy Rev. 2016, 62, 988–1011. [Google Scholar] [CrossRef]
  44. Braulio-Gonzalo, M.; Bovea, M.D. Environmental and cost performance of building’s envelope insulation materials to reduce energy demand: Thickness optimization. Energy Build. 2017, 150, 527–545. [Google Scholar] [CrossRef]
  45. Eurostat. Electricity Price Statistics, First Semester of 2022. Available online: http://ec.europa.eu/eurostat/statistics-explained/index.php/Electricity_price_statistics (accessed on 16 September 2022).
  46. Eurostat. Natural Gas Price Statistics, First Semester of 2022. Available online: http://ec.europa.eu/eurostat/statistics-explained/index.php/Natural_gas_price_statistics (accessed on 16 September 2022).
Figure 1. Global block diagram of the SEnergEd calculation methodology.
Buildings 13 00279 g001
Figure 2. Measured versus predicted energy consumption of the high school during 2014.
Buildings 13 00279 g002
Figure 3. Block diagram of the building’s global energy consumption calculation.
Buildings 13 00279 g003
Figure 4. Primary energy consumption for heating and cooling, to maintain thermal comfort.
Buildings 13 00279 g004
Figure 5. CO2 equivalent emissions to maintain thermal comfort conditions.
Buildings 13 00279 g005
Figure 6. Economic equivalent annual cost per unit area to maintain thermal comfort conditions.
Buildings 13 00279 g006
Figure 7. Relationship between the environmental impact and the economic cost.
Buildings 13 00279 g007
Table 1. Climatic data of the selected 5 cities with distinct climate conditions.
Climate TypeCity, CountryLatitude
[North]
HDD20
[°C.Day/Year]
CDD24
[°C.Day/Year]
Köppen-Geiger Class
HotAlmeria, Spain36.84°1069281BSk
WarmLisbon, Portugal38.73°1601174Csa
ModerateSalamanca, Spain40.96°3040120Csb
ColdWarsaw, Poland53.23°436726Cfb
Very ColdReykjavik, Iceland64.14°56700Cfc
Table 2. Summary of the characteristics of the 6 buildings considered: Np—maximum number of occupants; Nf—number of floors; Acl—acclimatized floor area; Agf—gross floor area; Ch—ceiling height; Vol—acclimatized volume; Aopc—opaque area of external envelope; Aglz—glazed area of external envelope; AR—aspect ratio = (Aopc + Aglz)/Vol; EA—envelope area ratio = (Aopc + Aglz)/Acl); GA—glazed area ratio = Aglz/Acl.
ApartmentDetached HousePrivate ClinicPrivate SchoolBank BranchSuper-Market
Np [--]44151110012194
Nf [--]132411
Acl [m2]109.4167.1926.711,246.0111.41035.3
Agf [m2]141.6212.61161.214,147.5134.71176.1
Ch [m]2.622.963.723.842.603.60
Vol [m3]286.6494.63447.343,184.6316.23727.1
Aopc [m2]58.6343.4743.422,703.8181.02830.6
Aglz [m2]21.349.7192.82975.337.296.6
AR [m−1]0.280.790.270.590.690.79
EA [--]0.732.351.012.281.962.83
GA [--]0.190.300.210.260.330.09
Table 3. Environmental and economic costs of the thermal insulation materials for a functional unit R = 1 m2 K/W.
MaterialEnvironmental Cost [MJ/m2]Economic Cost [€/m2]
EPS40.292.66
XPS86.098.05
MW53.983.82
Table 4. Base structure of the opaque elements of the external envelope.
ElementDescription (from Outside to Inside)Values
WallTraditional plaster with 2 cm, bored brick of 22 cm, not-ventilated air space with 1 cm, bored brick of 11 cm, traditional plaster with 2 cmThickness = 38 cm
Mt = 150 kg/m2
U = 0.88 W/(m2 K)
Pillar/BeamTraditional plaster with 2 cm, reinforced concrete (iron volume less than 1%) of inerts with 22 cm, not-ventilated air space of 1 cm, bored brick of 11 cm, traditional plaster with 2 cmThickness = 38 cm
Mt = 150 kg/m2
U = 1.36 W/(m2 K)
Floor above outsideTraditional plaster with 2 cm, lightened slab of 38 cm, light-sand concrete of 7.5 cm, screed (mortar) of 5.5 cm, oak wood with 2 cmThickness = 55 cm
Mt = 150 kg/m2
U = 1.17 W/(m2 K)
Ground floorWaterproofing layer, lightened slab of 38 cm, light-sand concrete of 7.5 cm, screed (mortar) of 5.5 cm, oak wood with 2 cmThickness = 54 cm
Mt = 150 kg/m2
U = 1.23 W/(m2 K)
Accessible roofMosaic tile with 1 cm, screed (mortar) of 5.5 cm, waterproofing of 3 mm, light-sand concrete of 7.5 cm, lightened slab of 38 cm, traditional plaster with 2 cmThickness = 55 cm
Mt = 150 kg/m2
U = 1.39 W/(m2 K)
Not accessible roofSandstone (inert) with 4 cm (or ceramic tile), waterproofing of 3 mm, screed (mortar) of 4 cm, lightened slab of 23 cm, traditional plaster with 2 cmThickness = 33 cm
Mt = 150 kg/m2
U = 2.40 W/(m2 K)
Table 5. Useful thermal mass (Mt) and thermal transmission coefficient (U) of the exterior walls and the respective economic cost (ECS) and embodied energy (EES) of the thermal insulation solution.
ThicknessMtUECS [€/m2]EES
[cm][kg/m2][W/(m2 K)]PortugalSpainPolandIceland[kWh/m2]
01500.880.000.000.000.000.00
31500.5420.3426.0517.1943.8012.56
41500.4821.0926.8017.9444.5515.70
51500.4321.8427.5518.6945.3018.84
61500.3922.5928.3019.4446.0521.98
81500.3324.0929.8020.9447.5528.26
101500.2825.5931.3022.4449.0534.55
121500.2527.0932.8023.9450.5540.83
141500.2228.5934.3025.4452.0547.11
161500.2030.0935.8026.9453.5553.39
201500.1733.0938.8029.9456.5565.95
251500.1436.8442.5533.6960.3081.66
301500.1240.5946.3037.4464.0597.36
351500.1144.3450.0541.1967.80113.06
401500.00948.0953.8044.9471.55128.77
Table 6. Electric energy and natural gas tariffs in the first semester of 2022 for household or non-household consumers [45,46] (VAT not included).
Type of ConsumerCountryElectric Energy [€/kWh]Natural Gas [€/kWh]
HouseholdSpain0.28220.3290
(ResidentialPoland0.13790.1511
buildings)Portugal0.18310.2067
Iceland0.12340.1478
Non-householdSpain0.18790.2111
(CommercePoland0.15550.1825
and ServicesPortugal0.12020.1415
buildings)Iceland0.07560.0843
Table 7. Optimal EPS thickness [cm] from energy, environmental, and economic perspectives.
Climate
BuildingPerspectiveHotWarmModerateColdVery Cold
ApartmentEnergetic>40>40>40>40>40
Environmental12142030>40
Economic55101225
DetachedEnergetic>40>40>40>40>40
houseEnvironmental14162535>40
Economic88141625
PrivateEnergetic>40>40>40>40>40
clinicEnvironmental12142030>40
Economic0061420
PrivateEnergetic>40>40>40>40>40
schoolEnvironmental58142030
Economic0001014
BankEnergetic>40>40>40>40>40
branchEnvironmental3581625
Economic00060
Super-Energetic>40>40>40>40>40
marketEnvironmental68162535
Economic0061416
Disclaimer/Publisher’s Note: The statements, opinions and data contained in all publications are solely those of the individual author(s) and contributor(s) and not of MDPI and/or the editor(s). MDPI and/or the editor(s) disclaim responsibility for any injury to people or property resulting from any ideas, methods, instructions or products referred to in the content.

