
Thermal Assessment of a Ventilated Double Skin Façade Component with a Set of Air Filtering Photocatalytic Slats in the Cavity
 , and
, and
Abstract
:1. Introduction
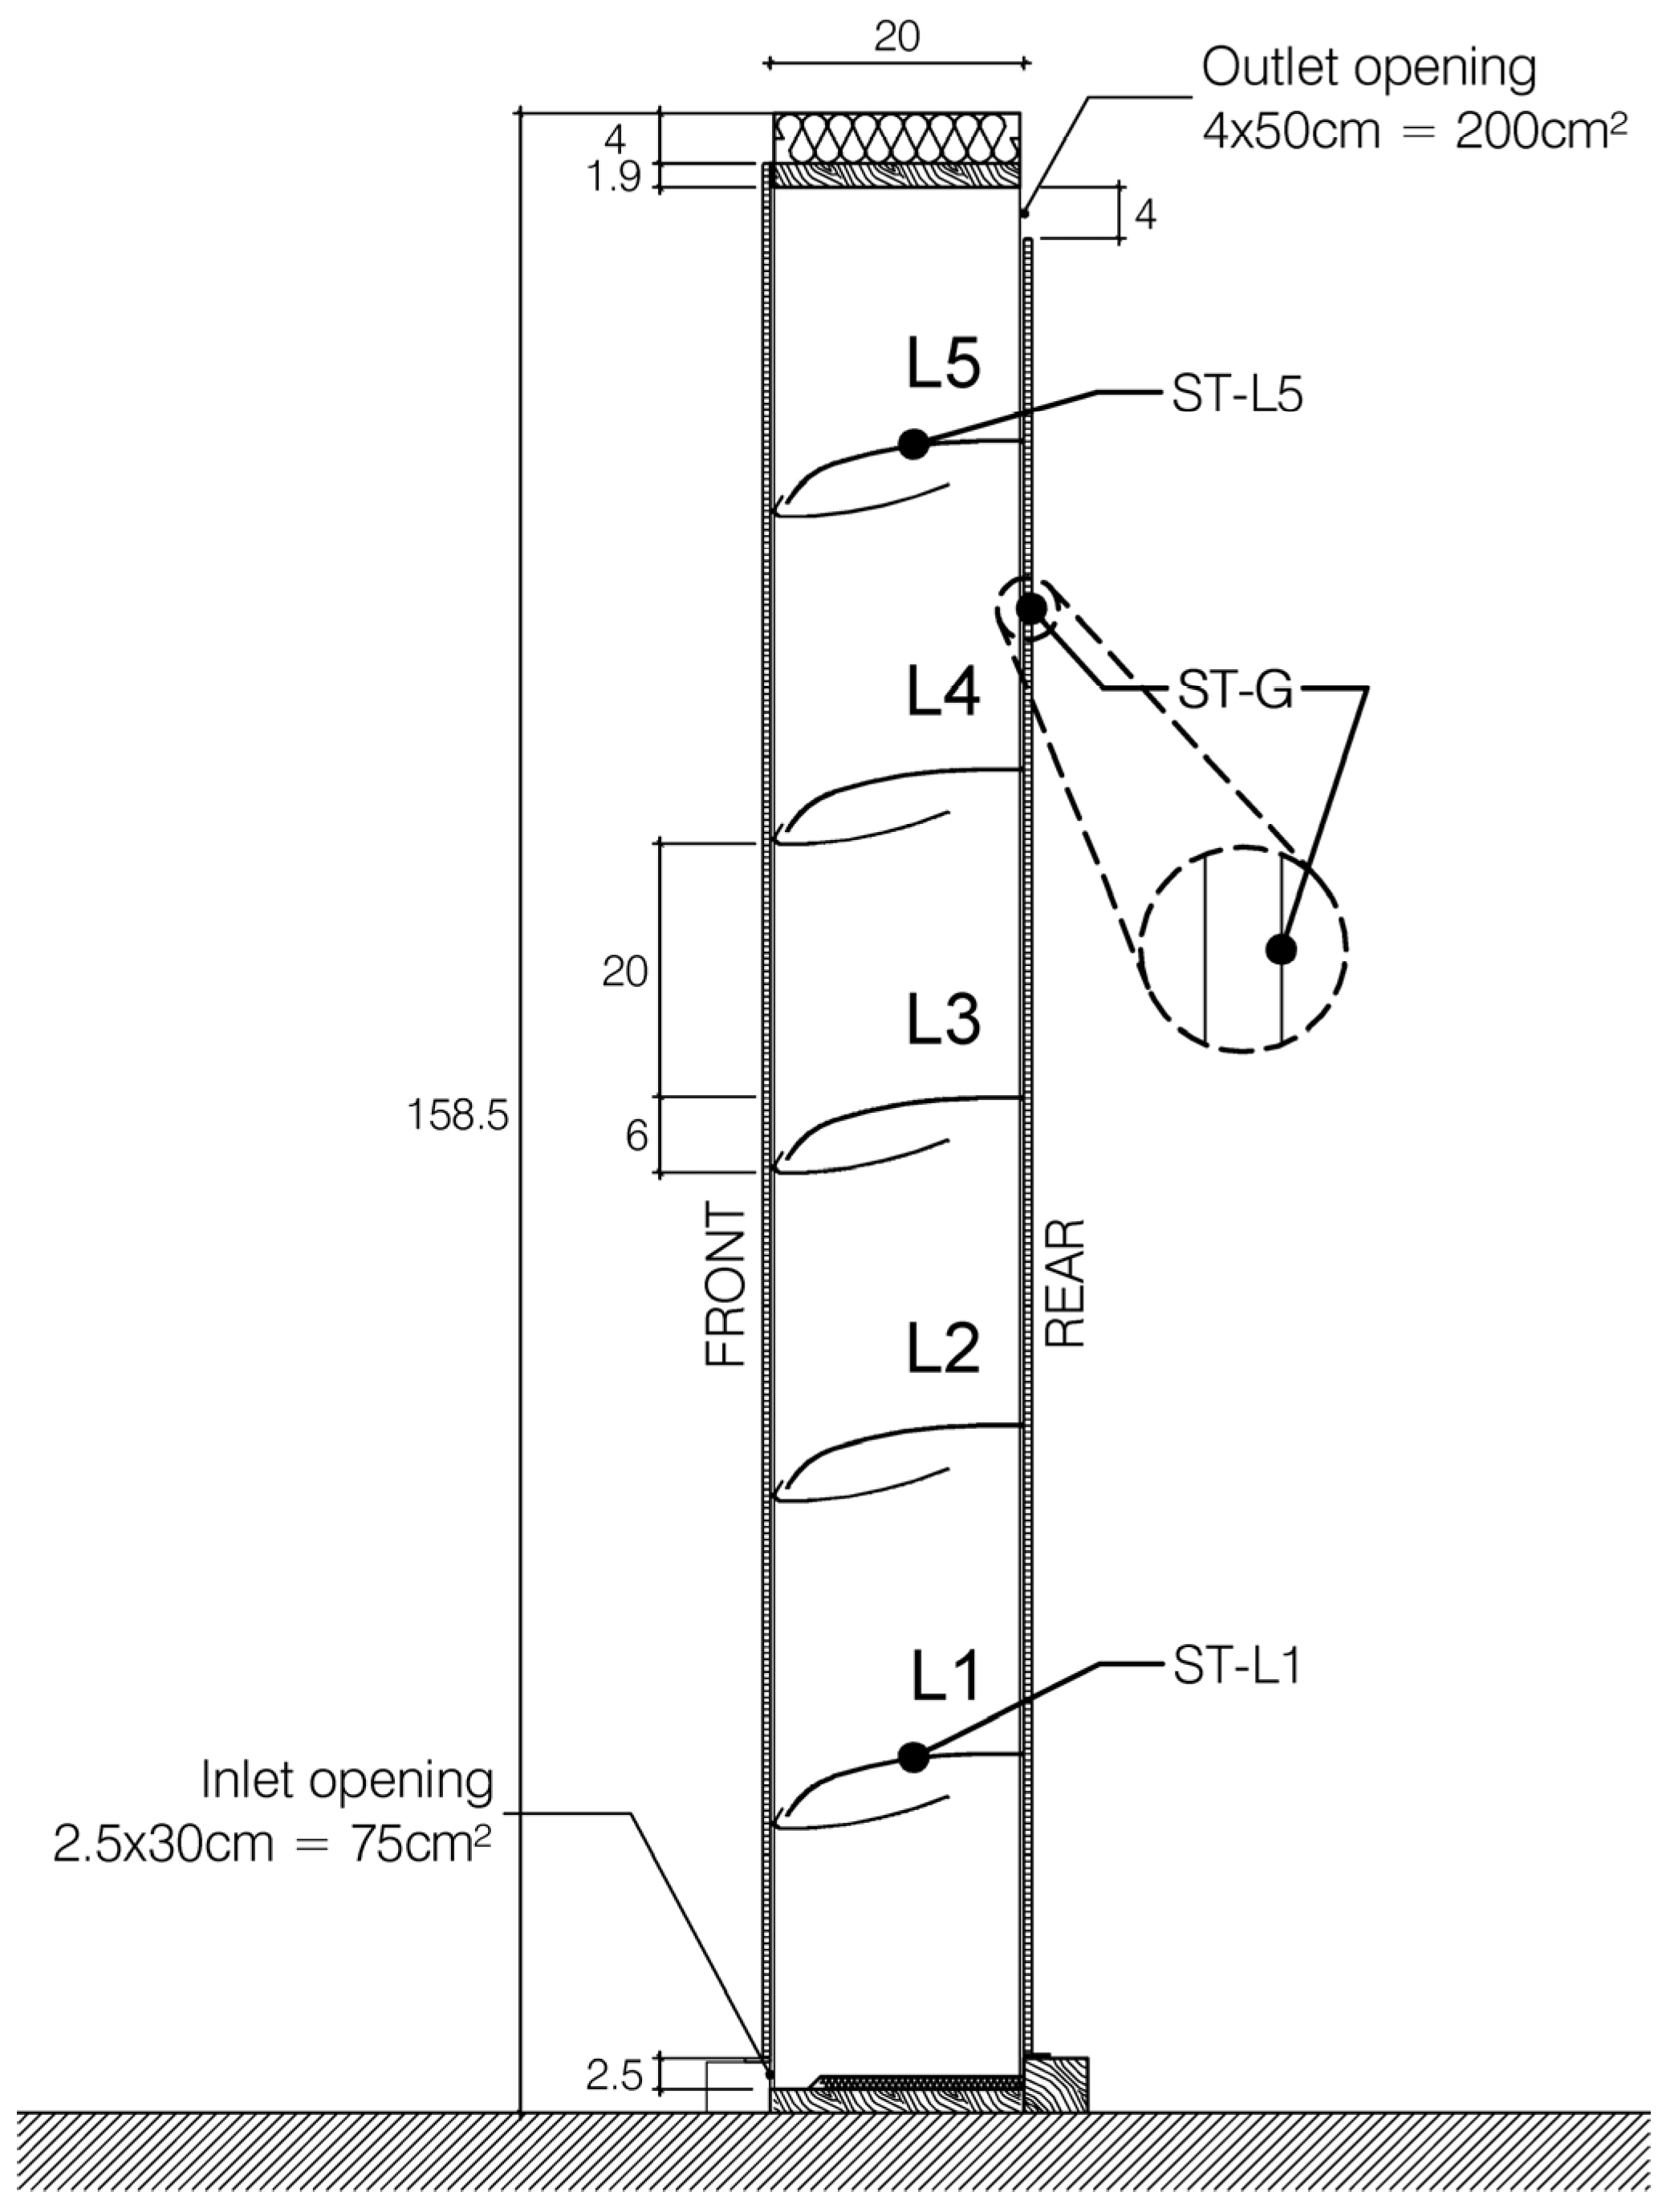
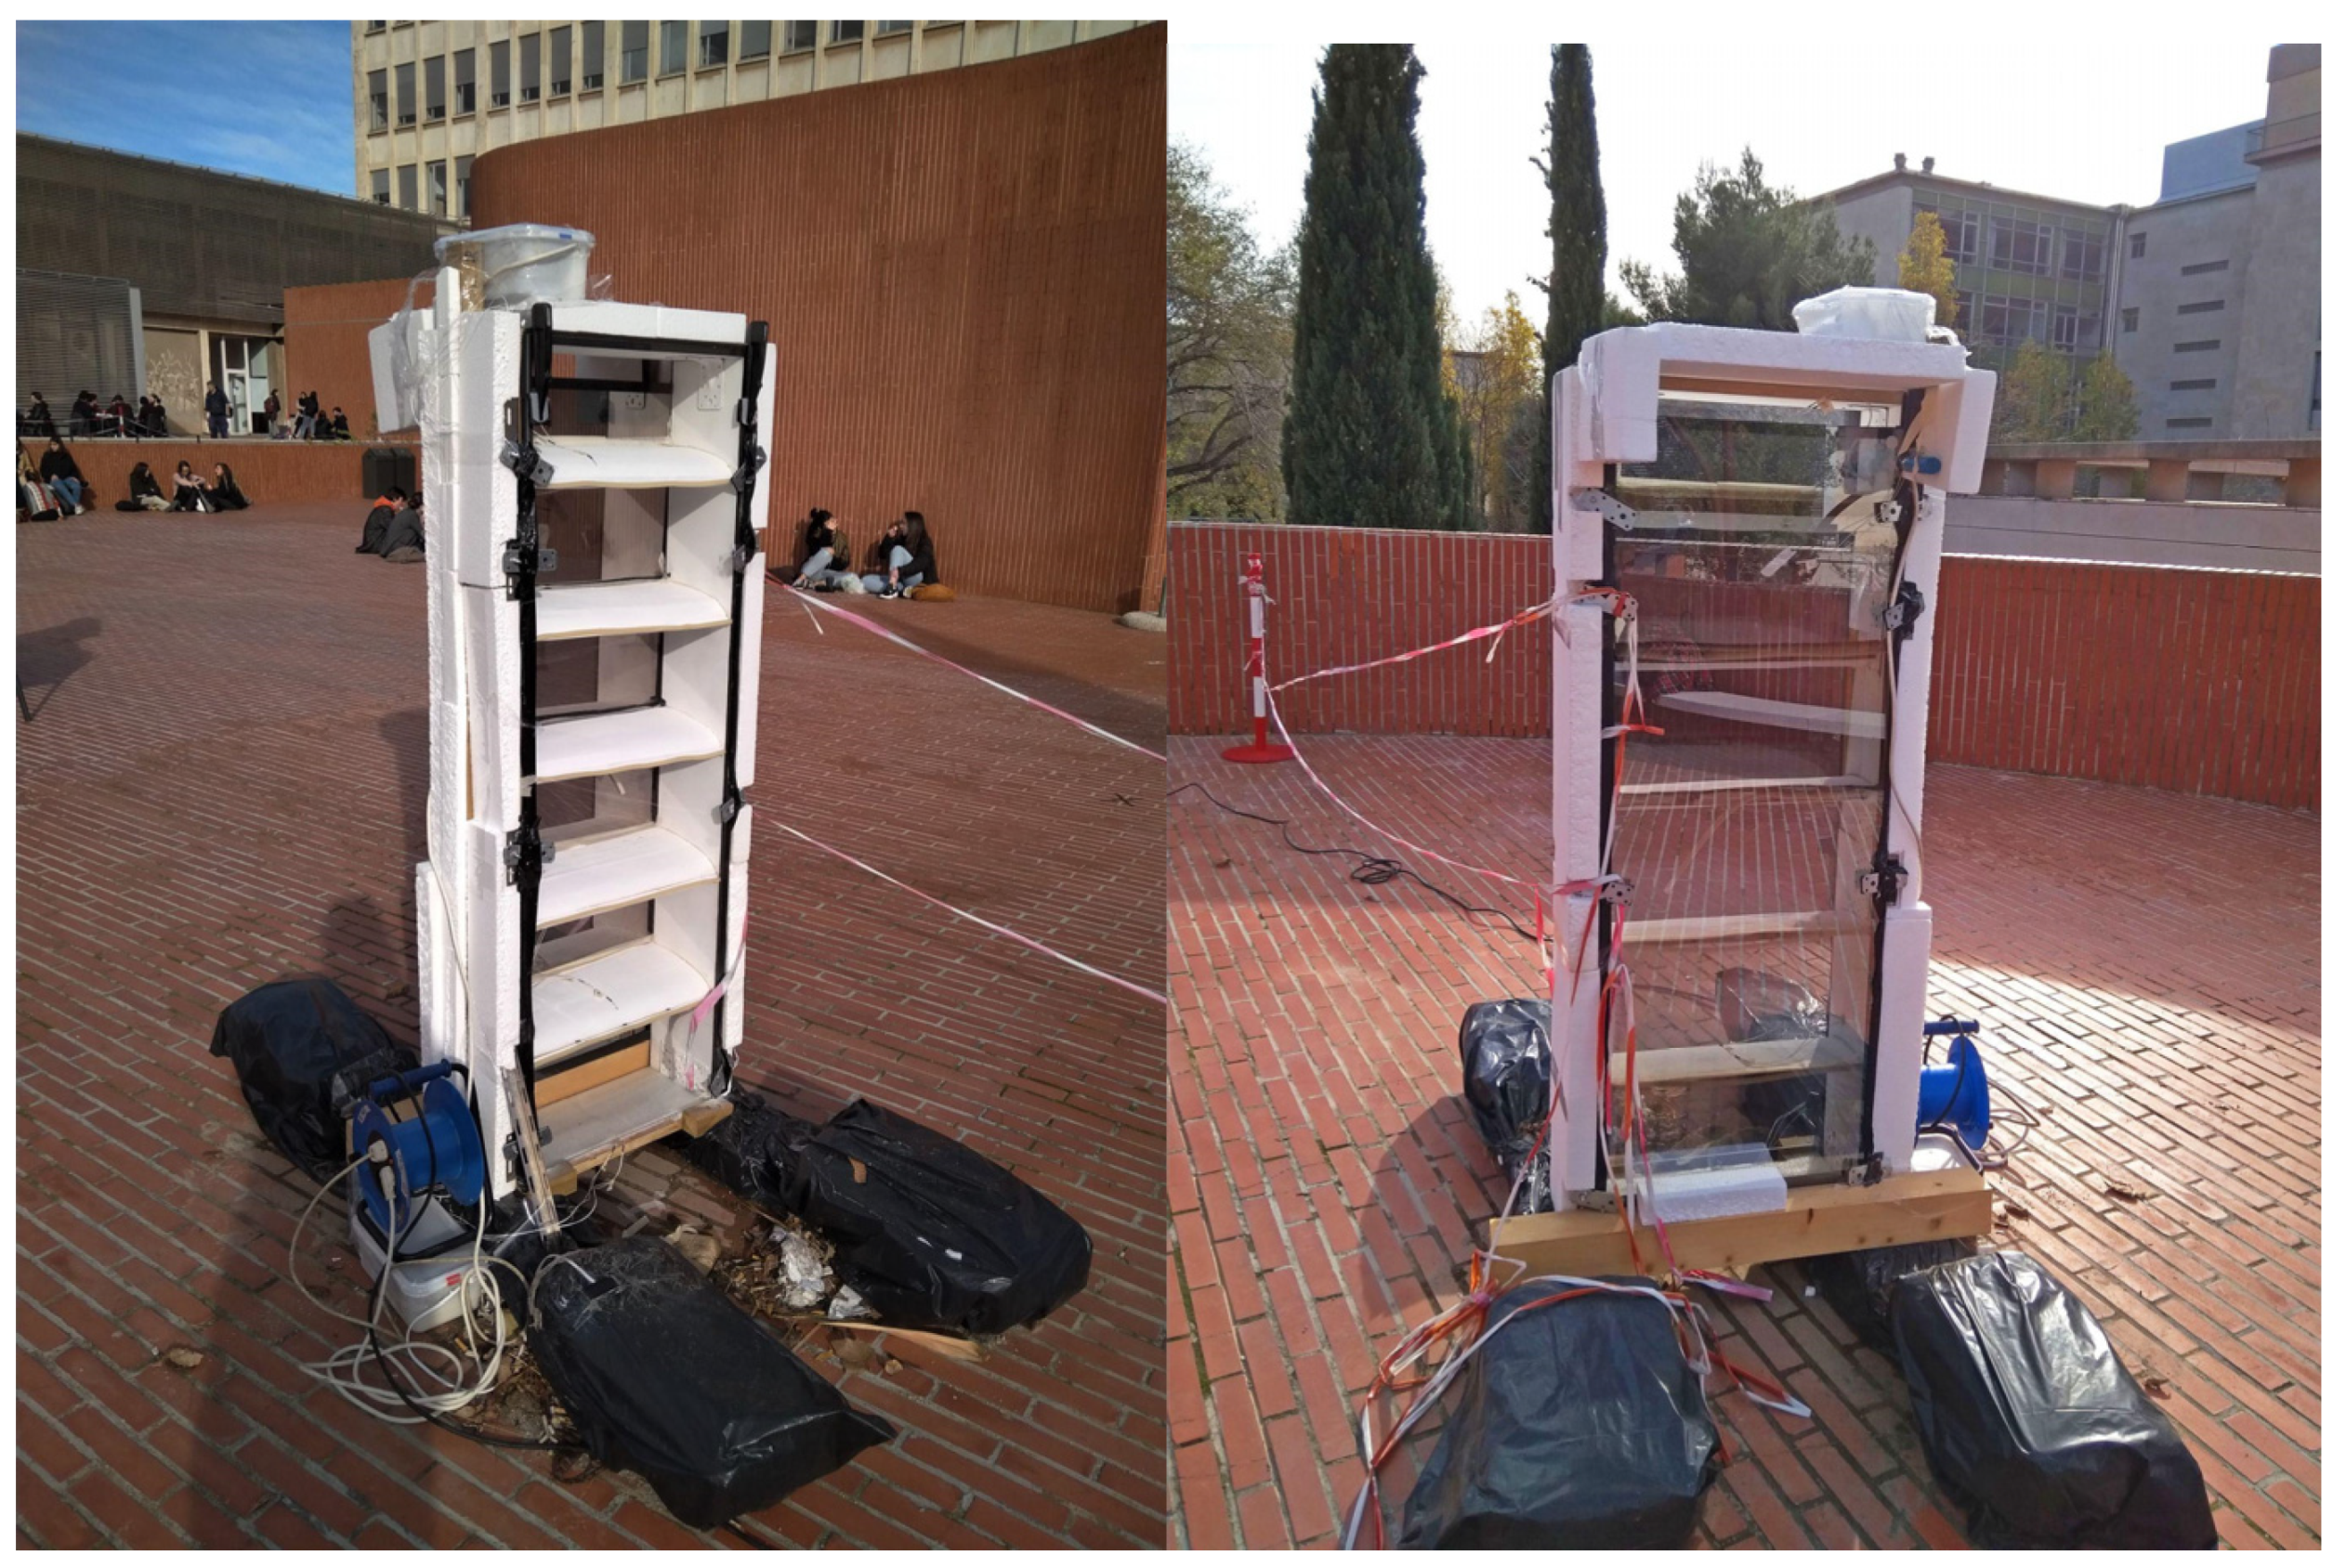
2. Model Thermal Performance Tests
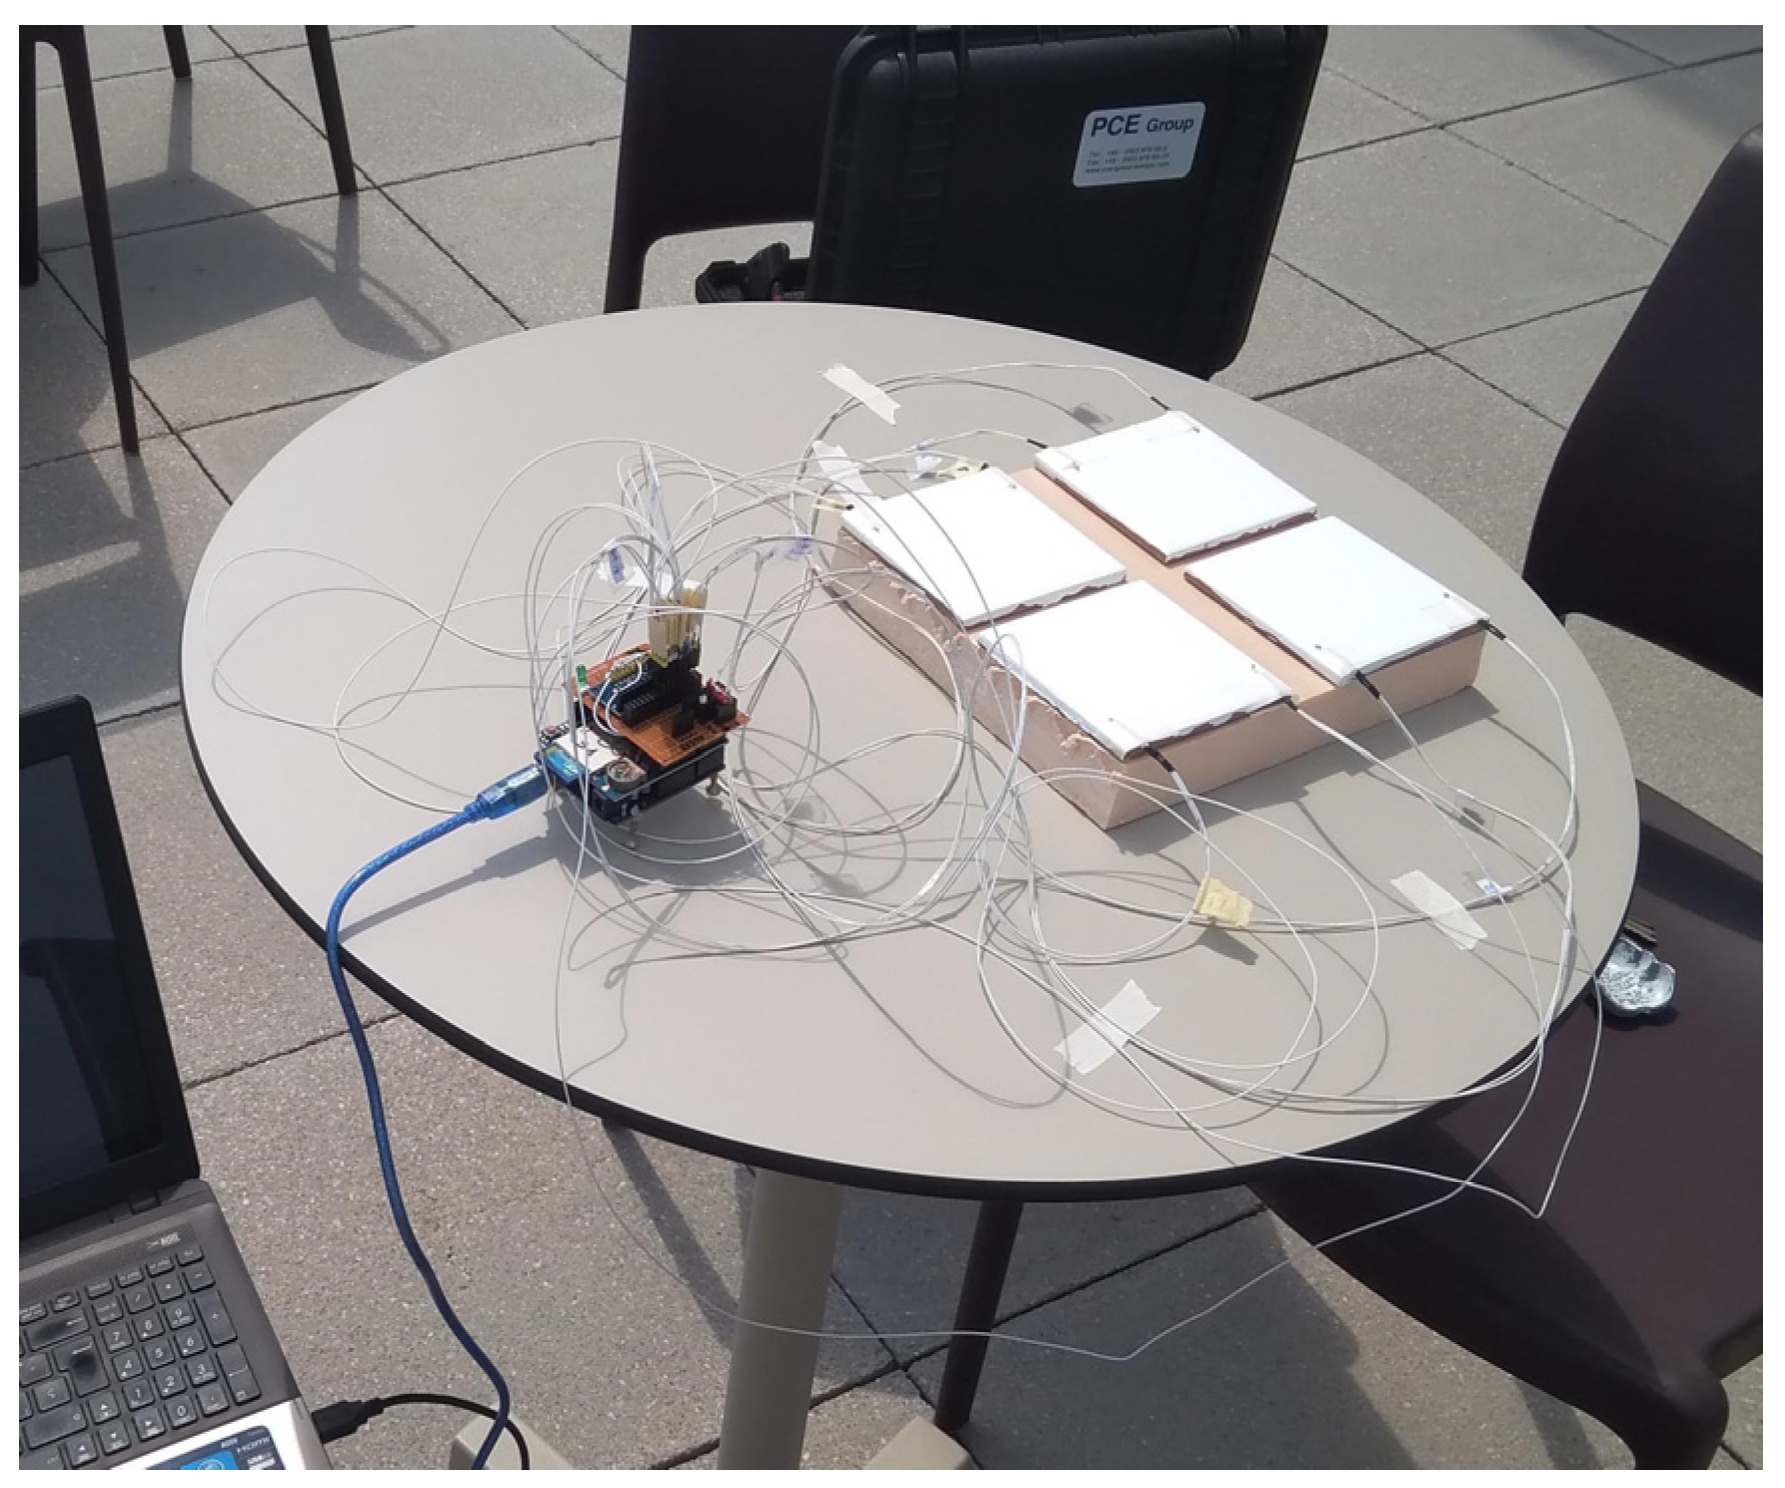
2.1. Methodology for Thermal Model
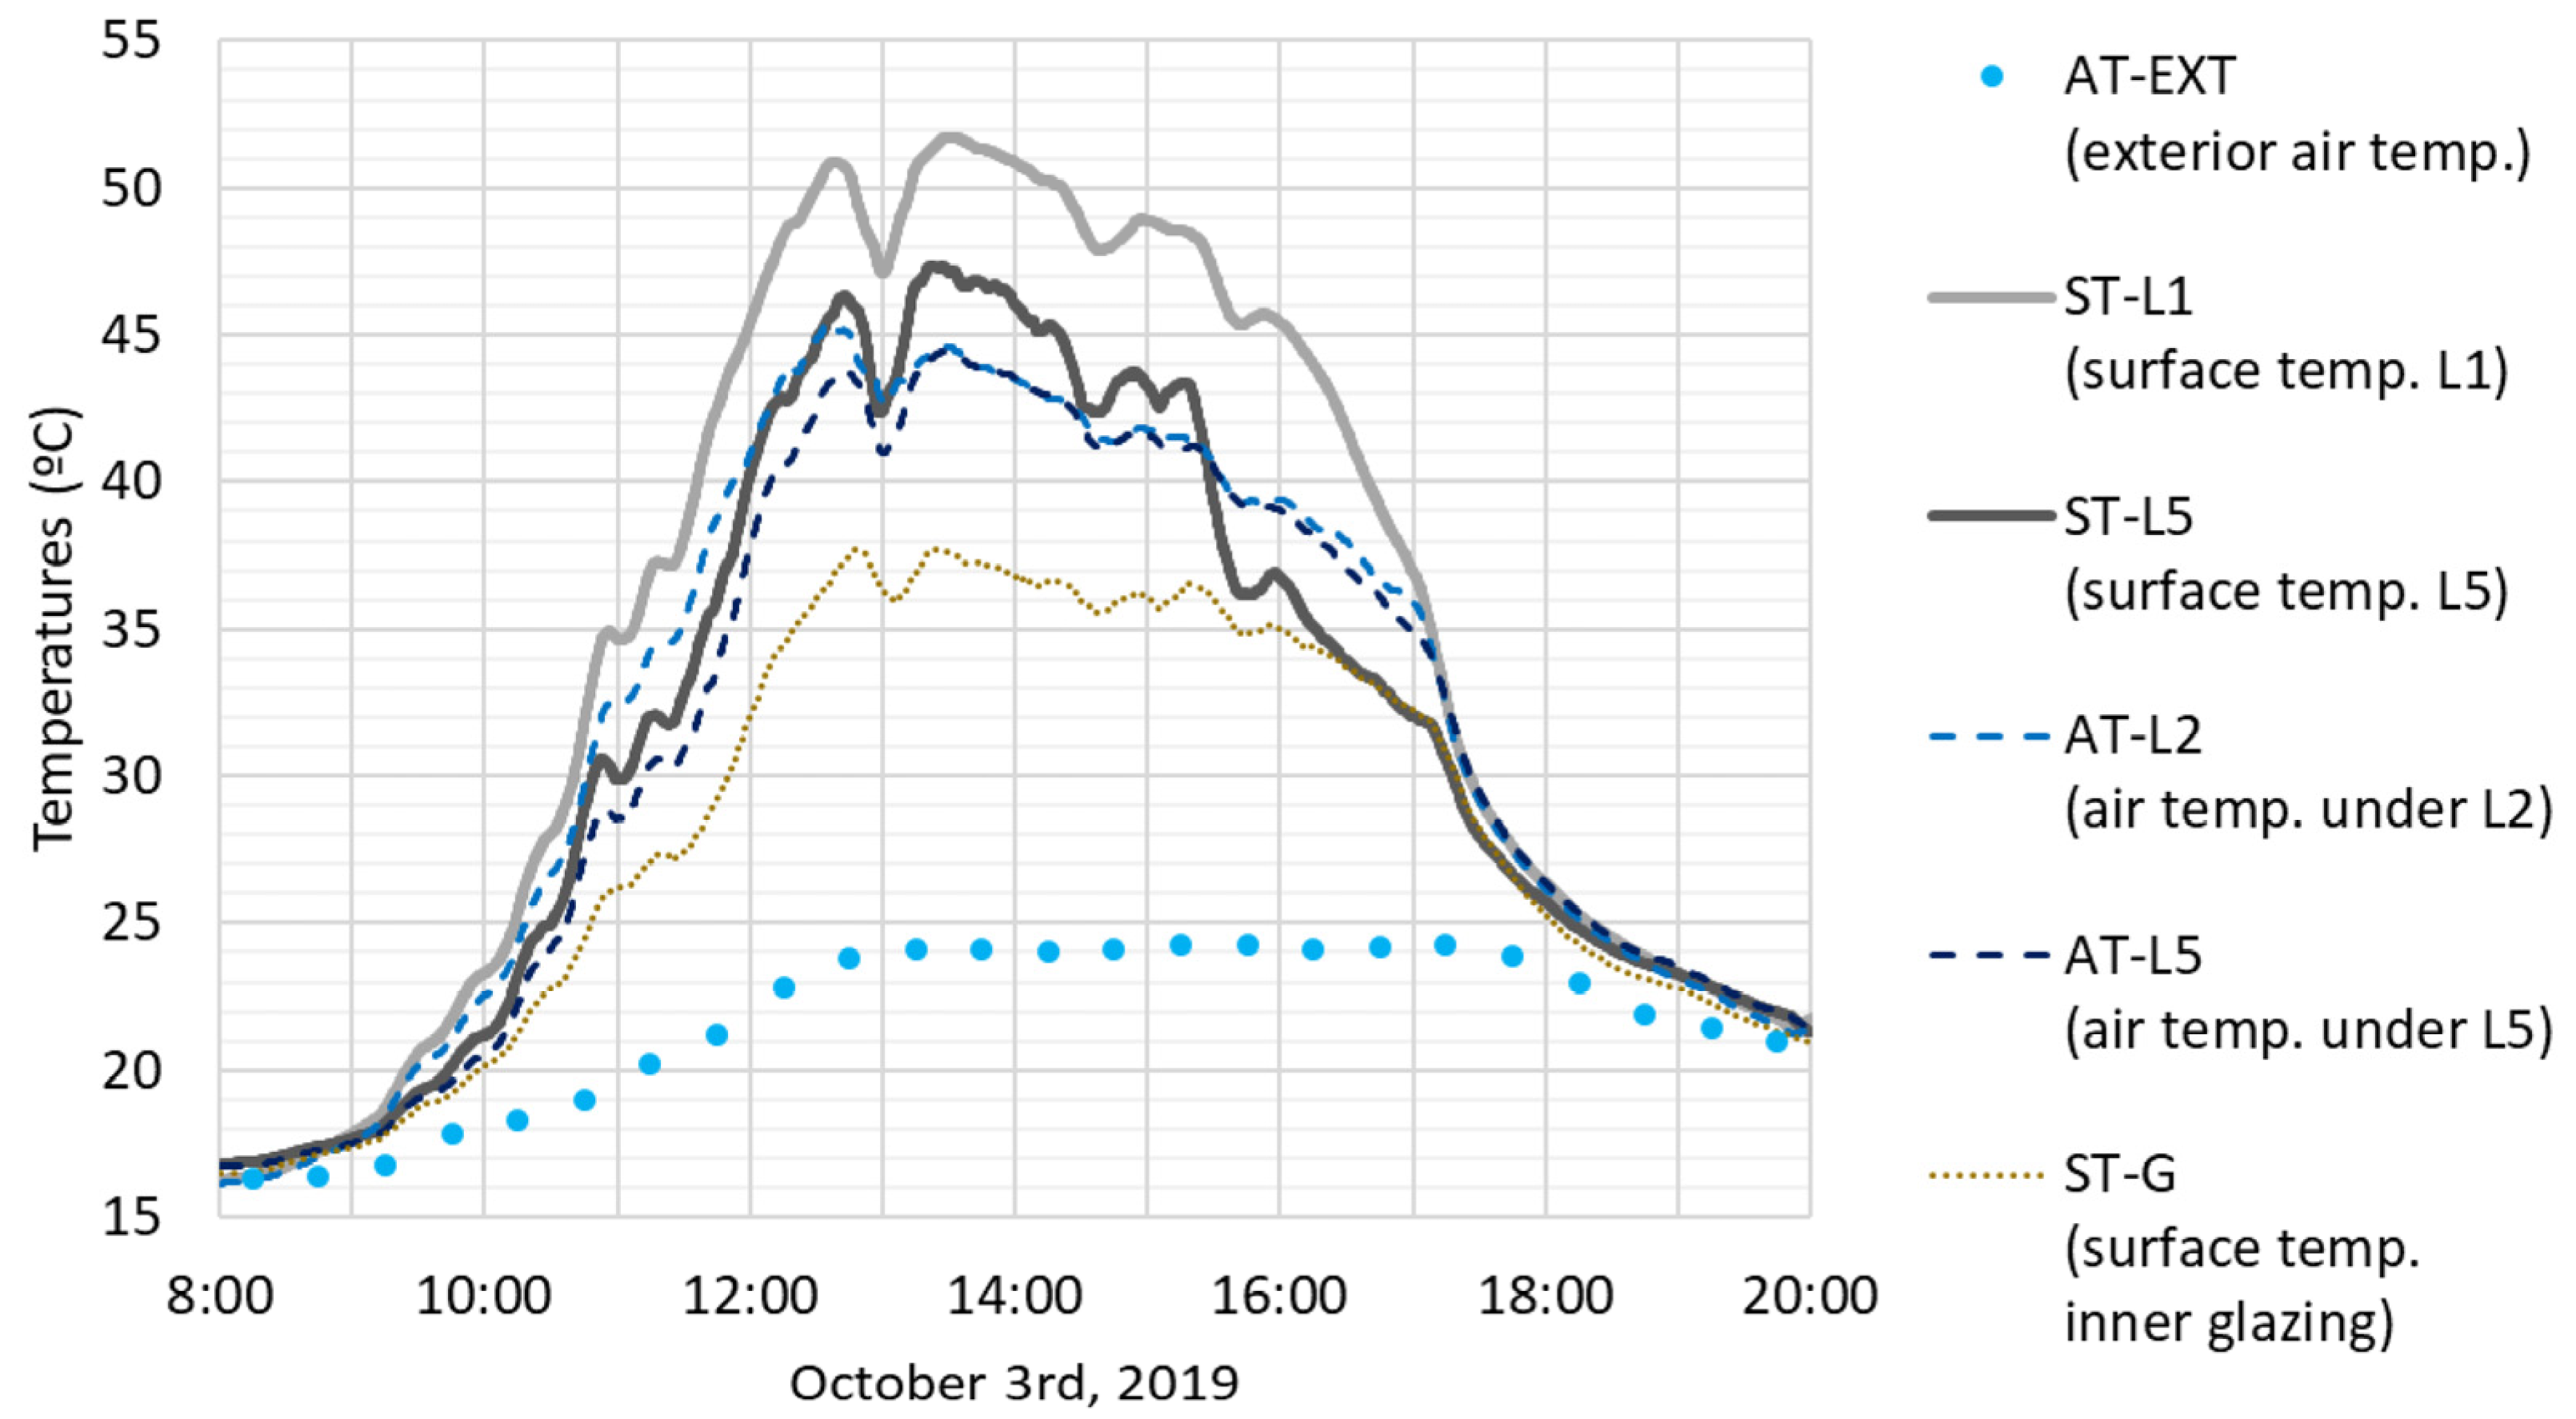
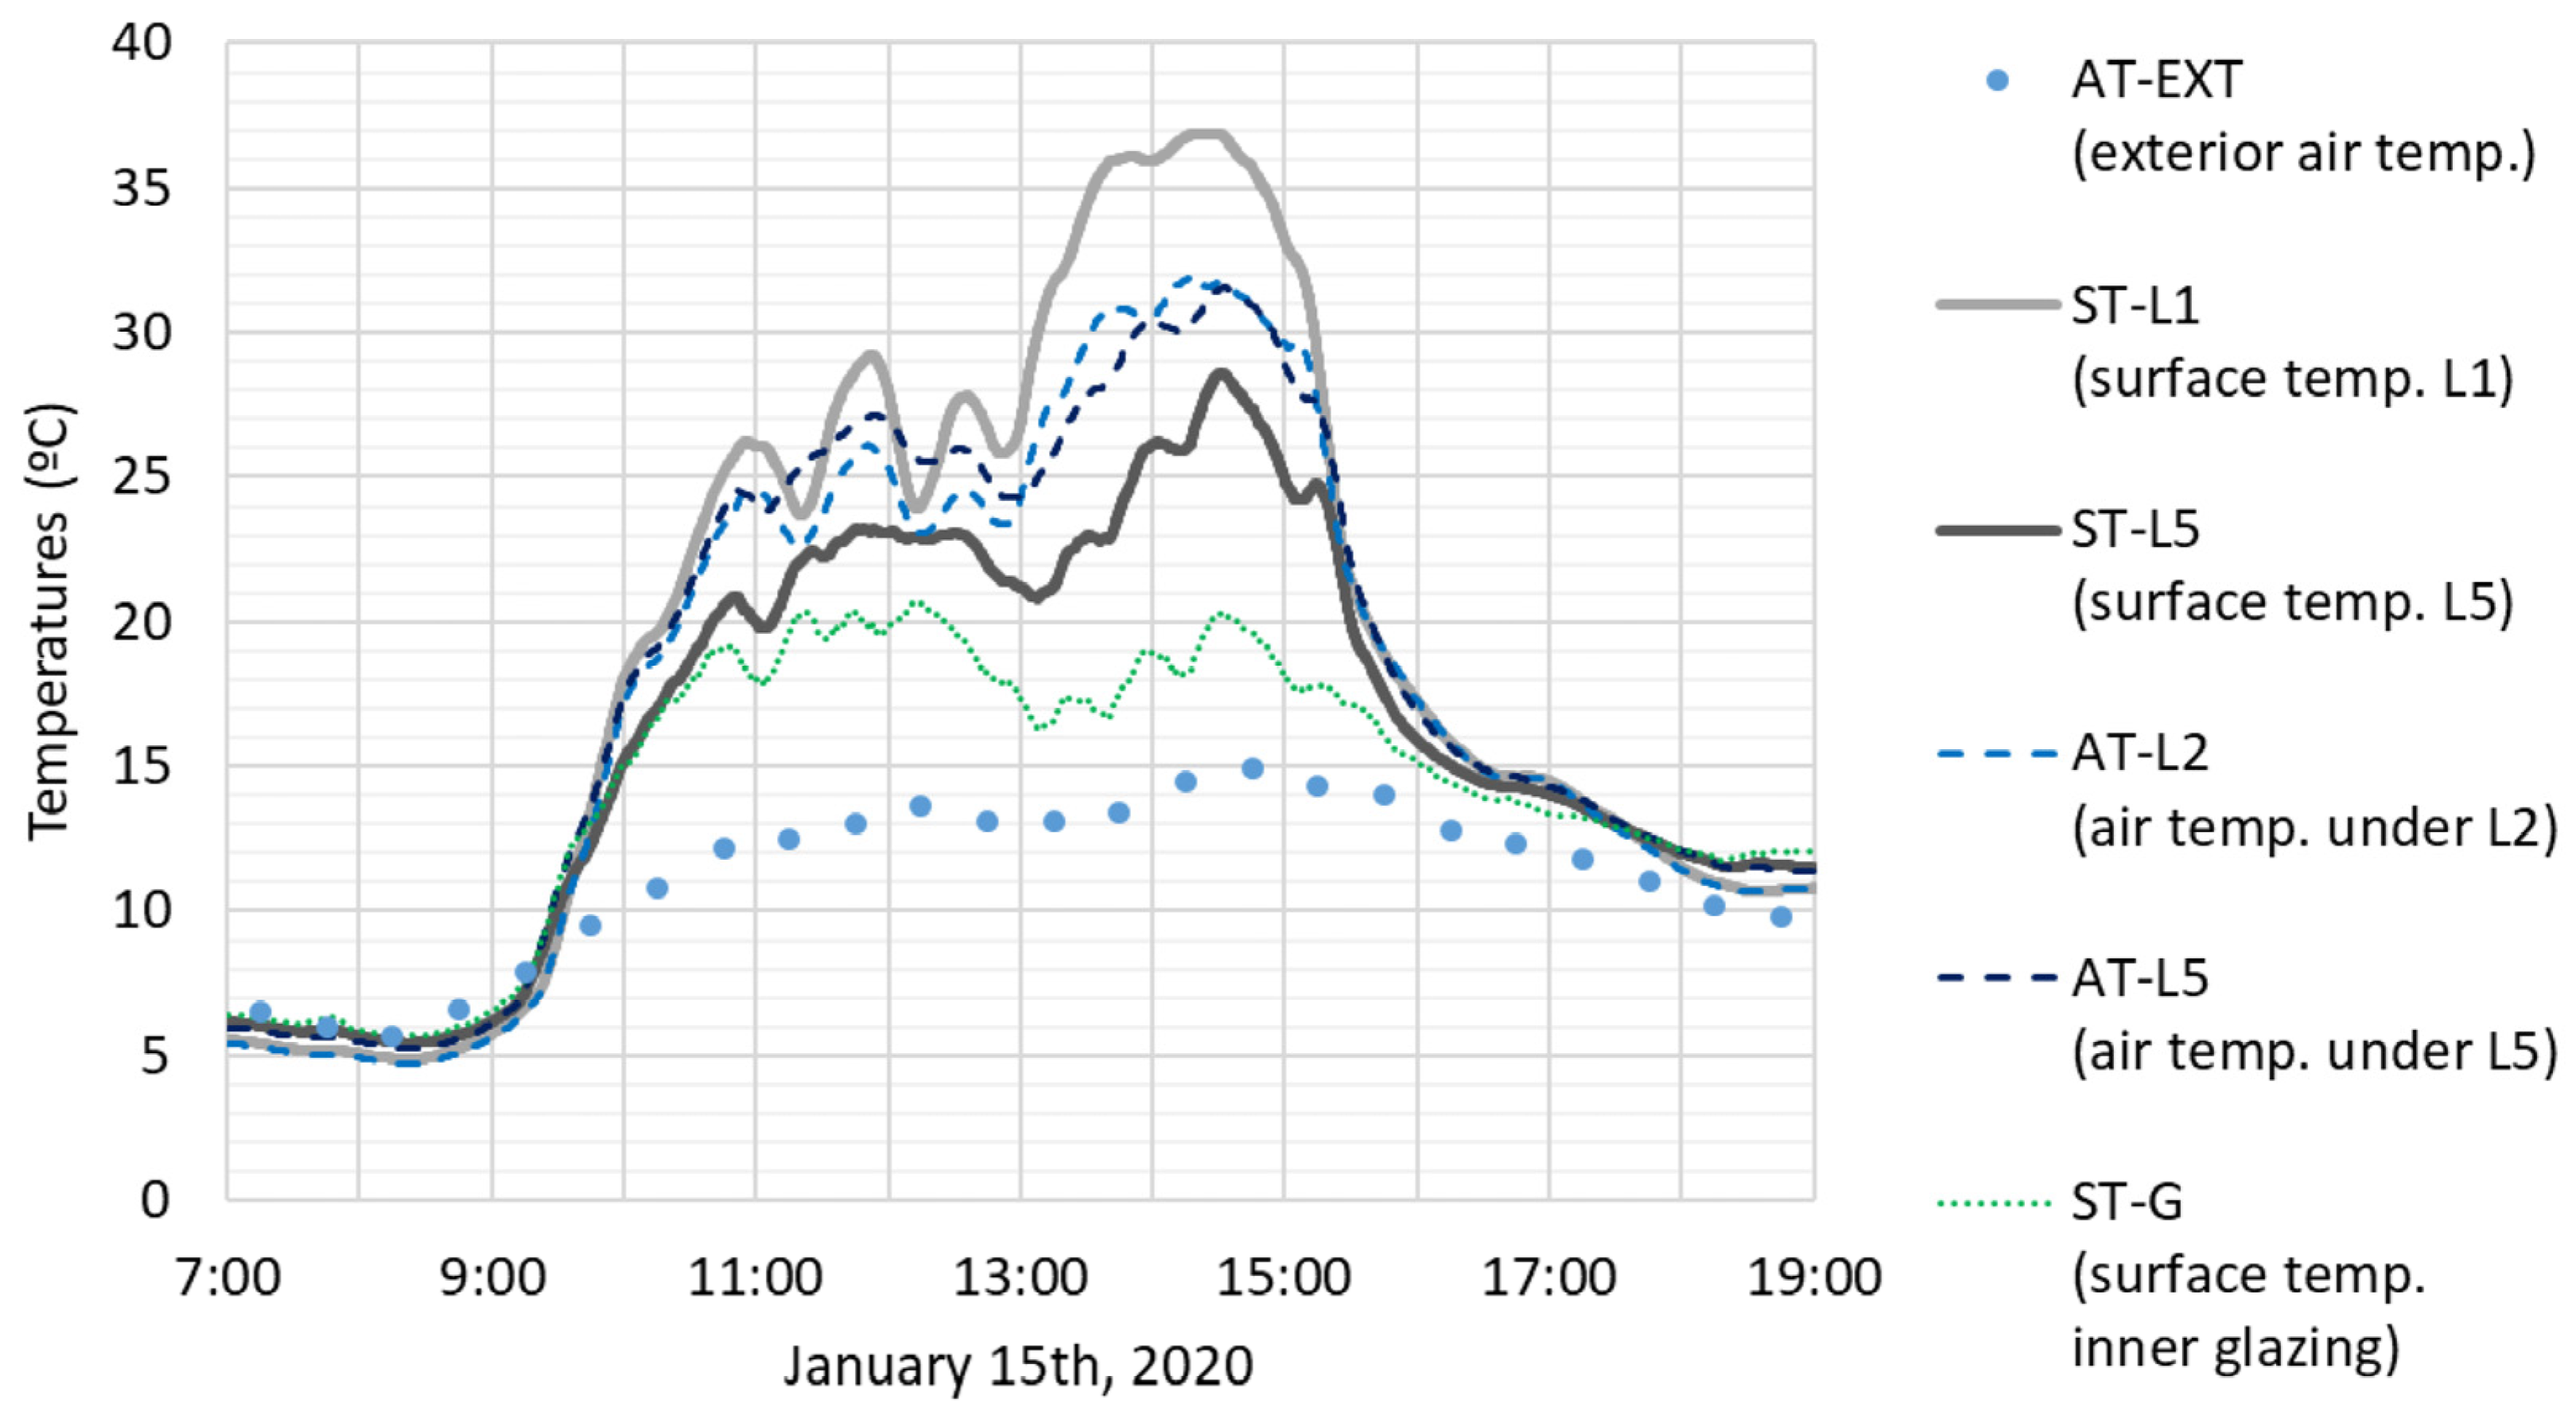
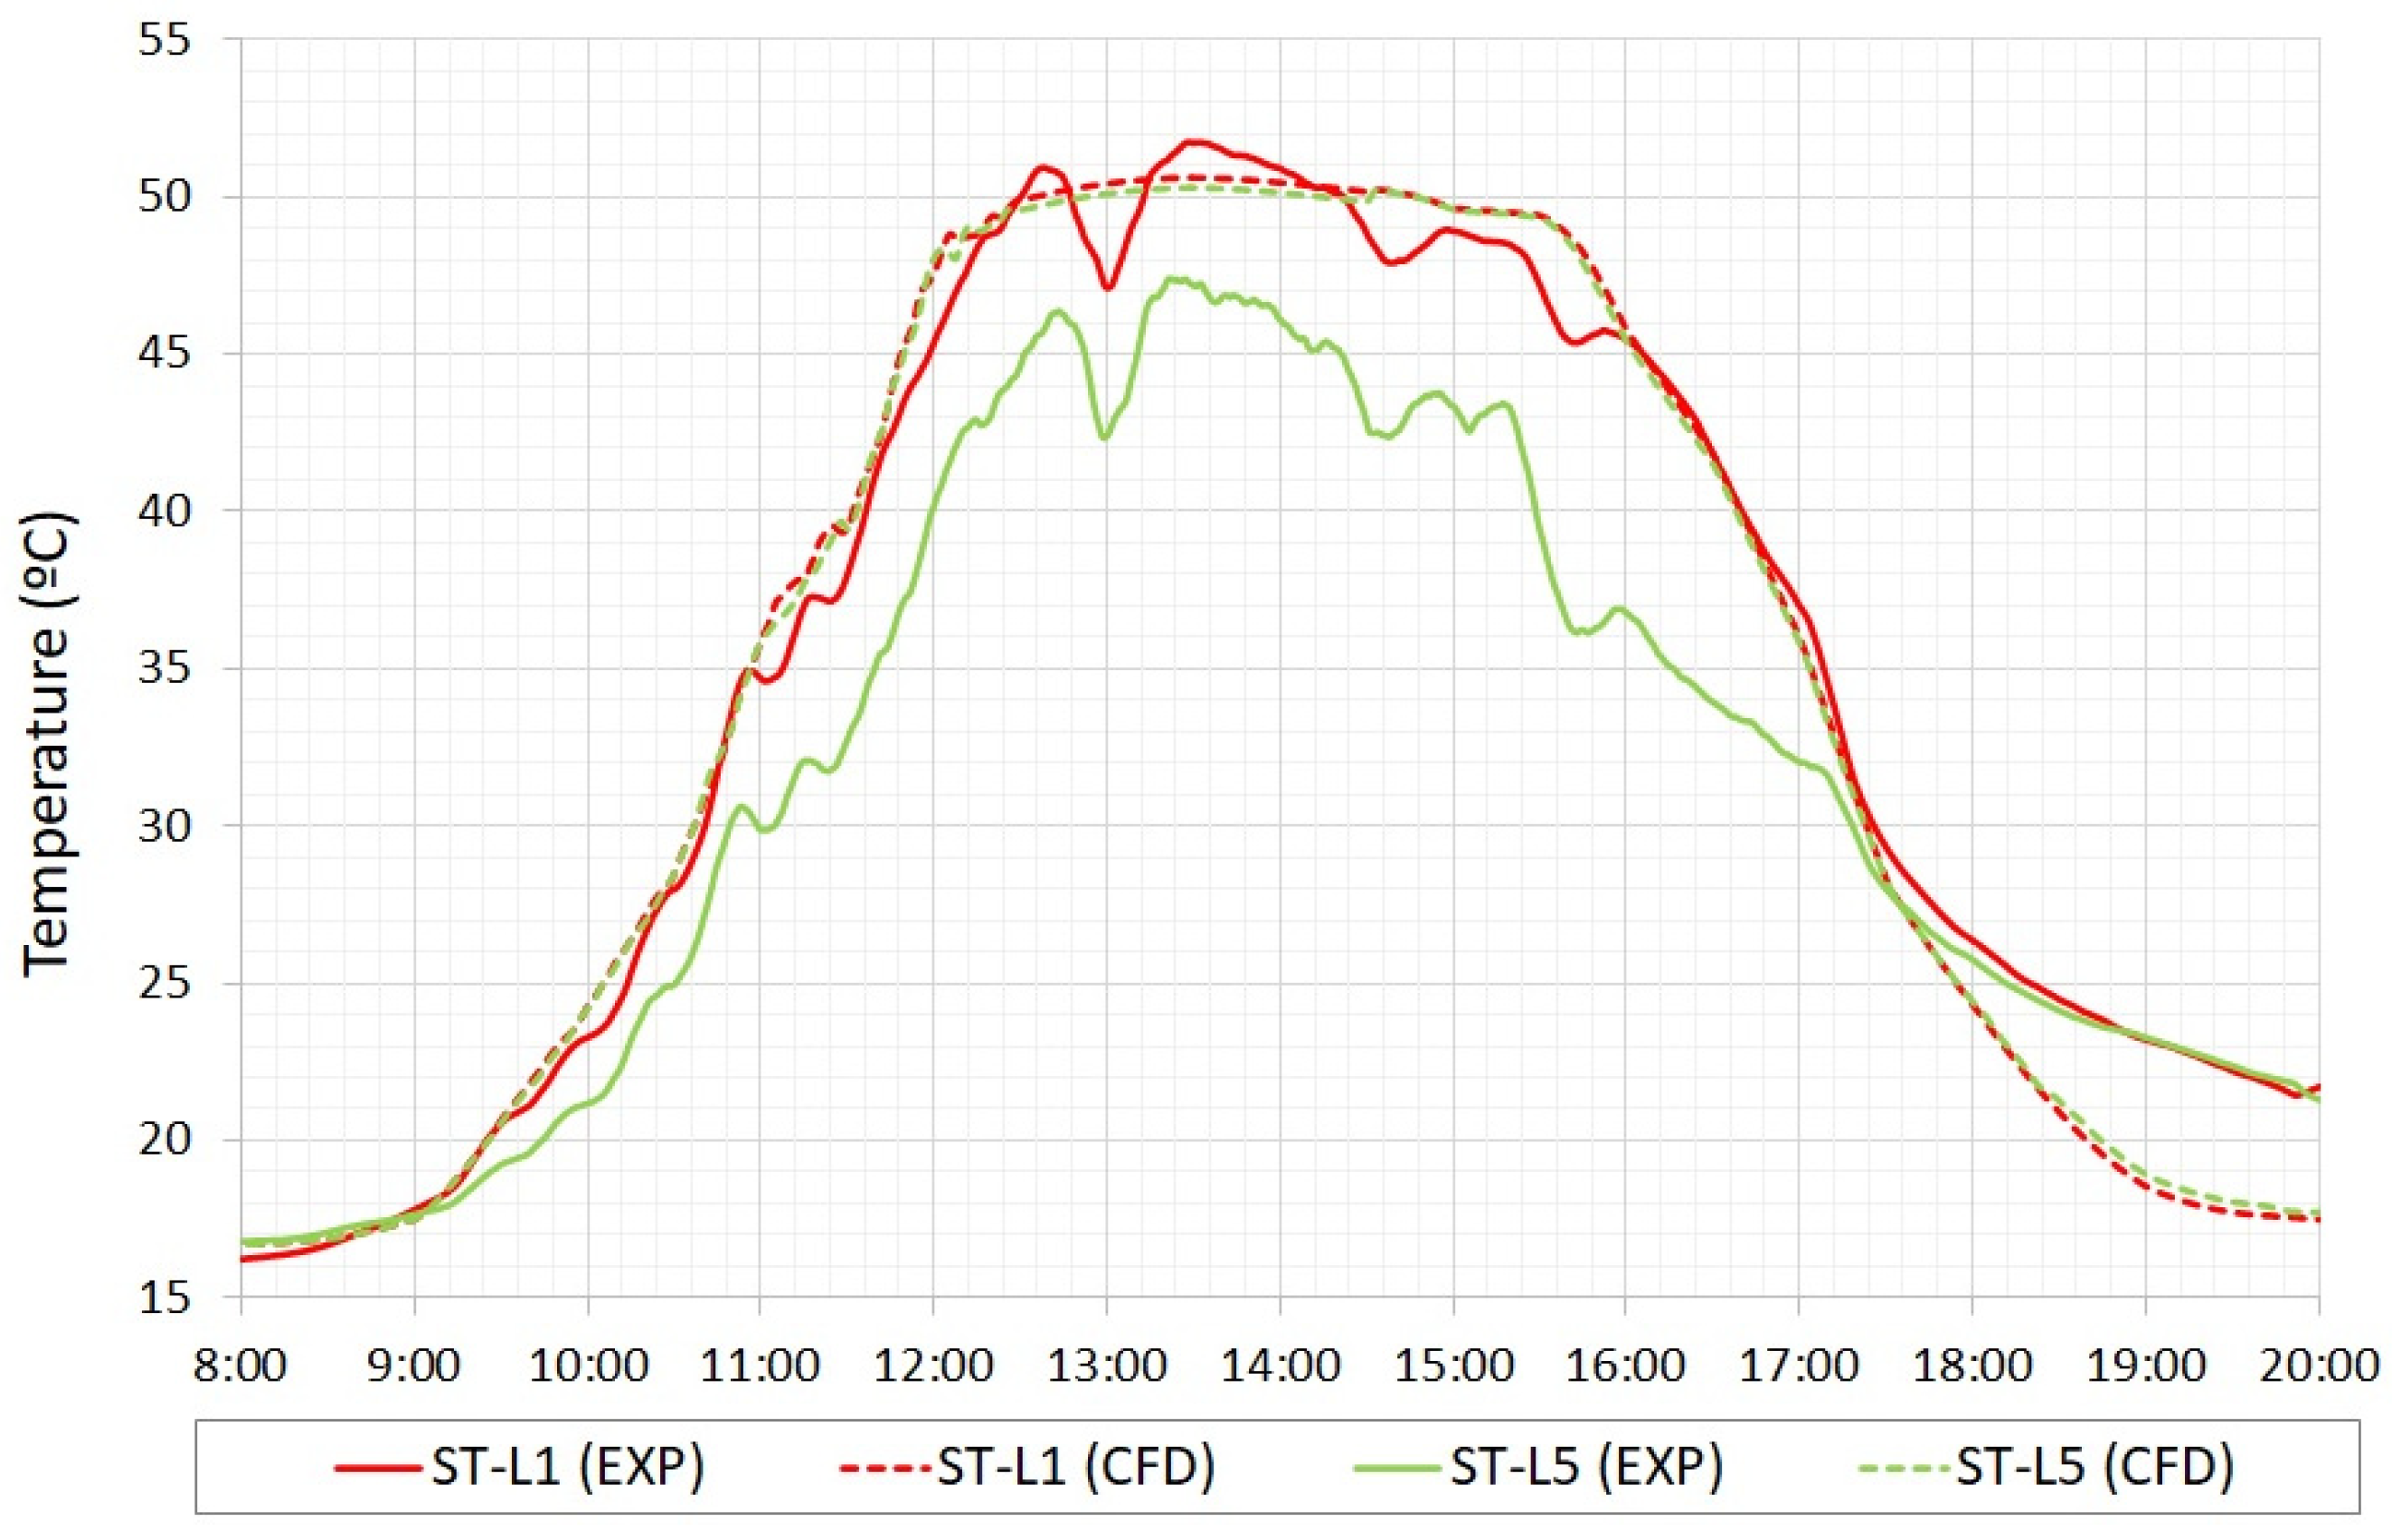
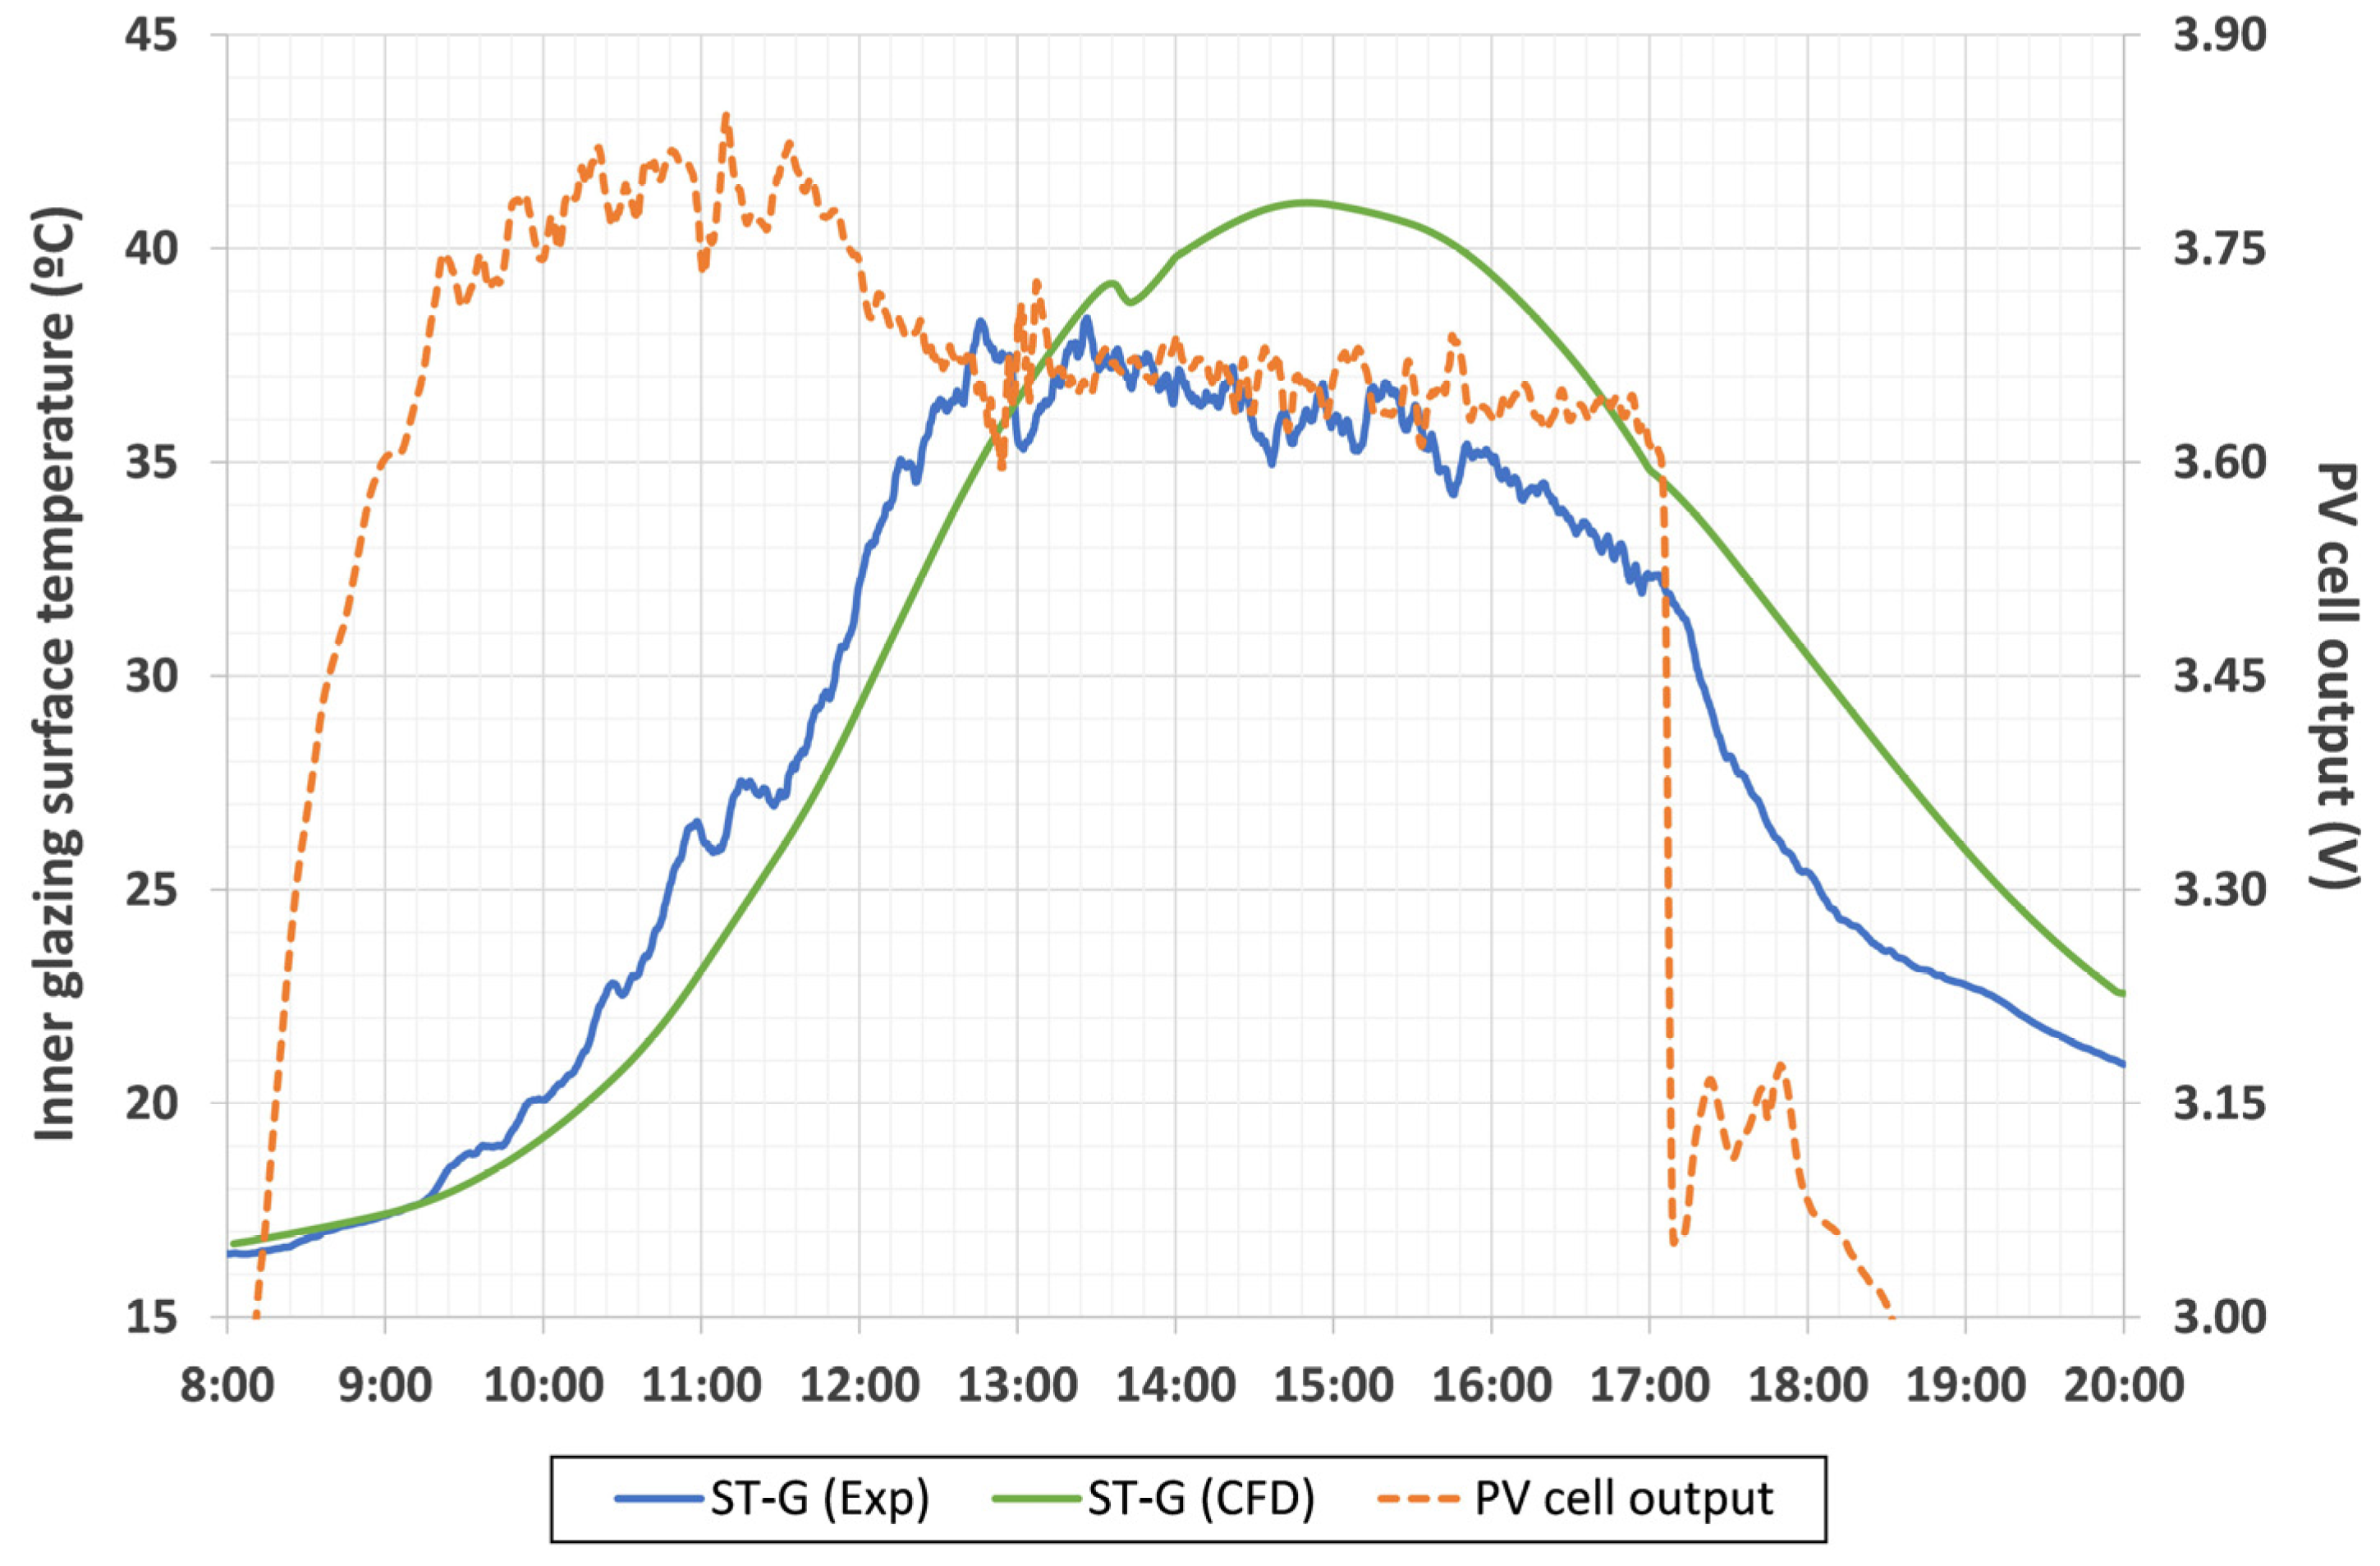
2.2. Results and Discussion of the Thermal Model
3. Photocatalytic Coating Emissivity Tests
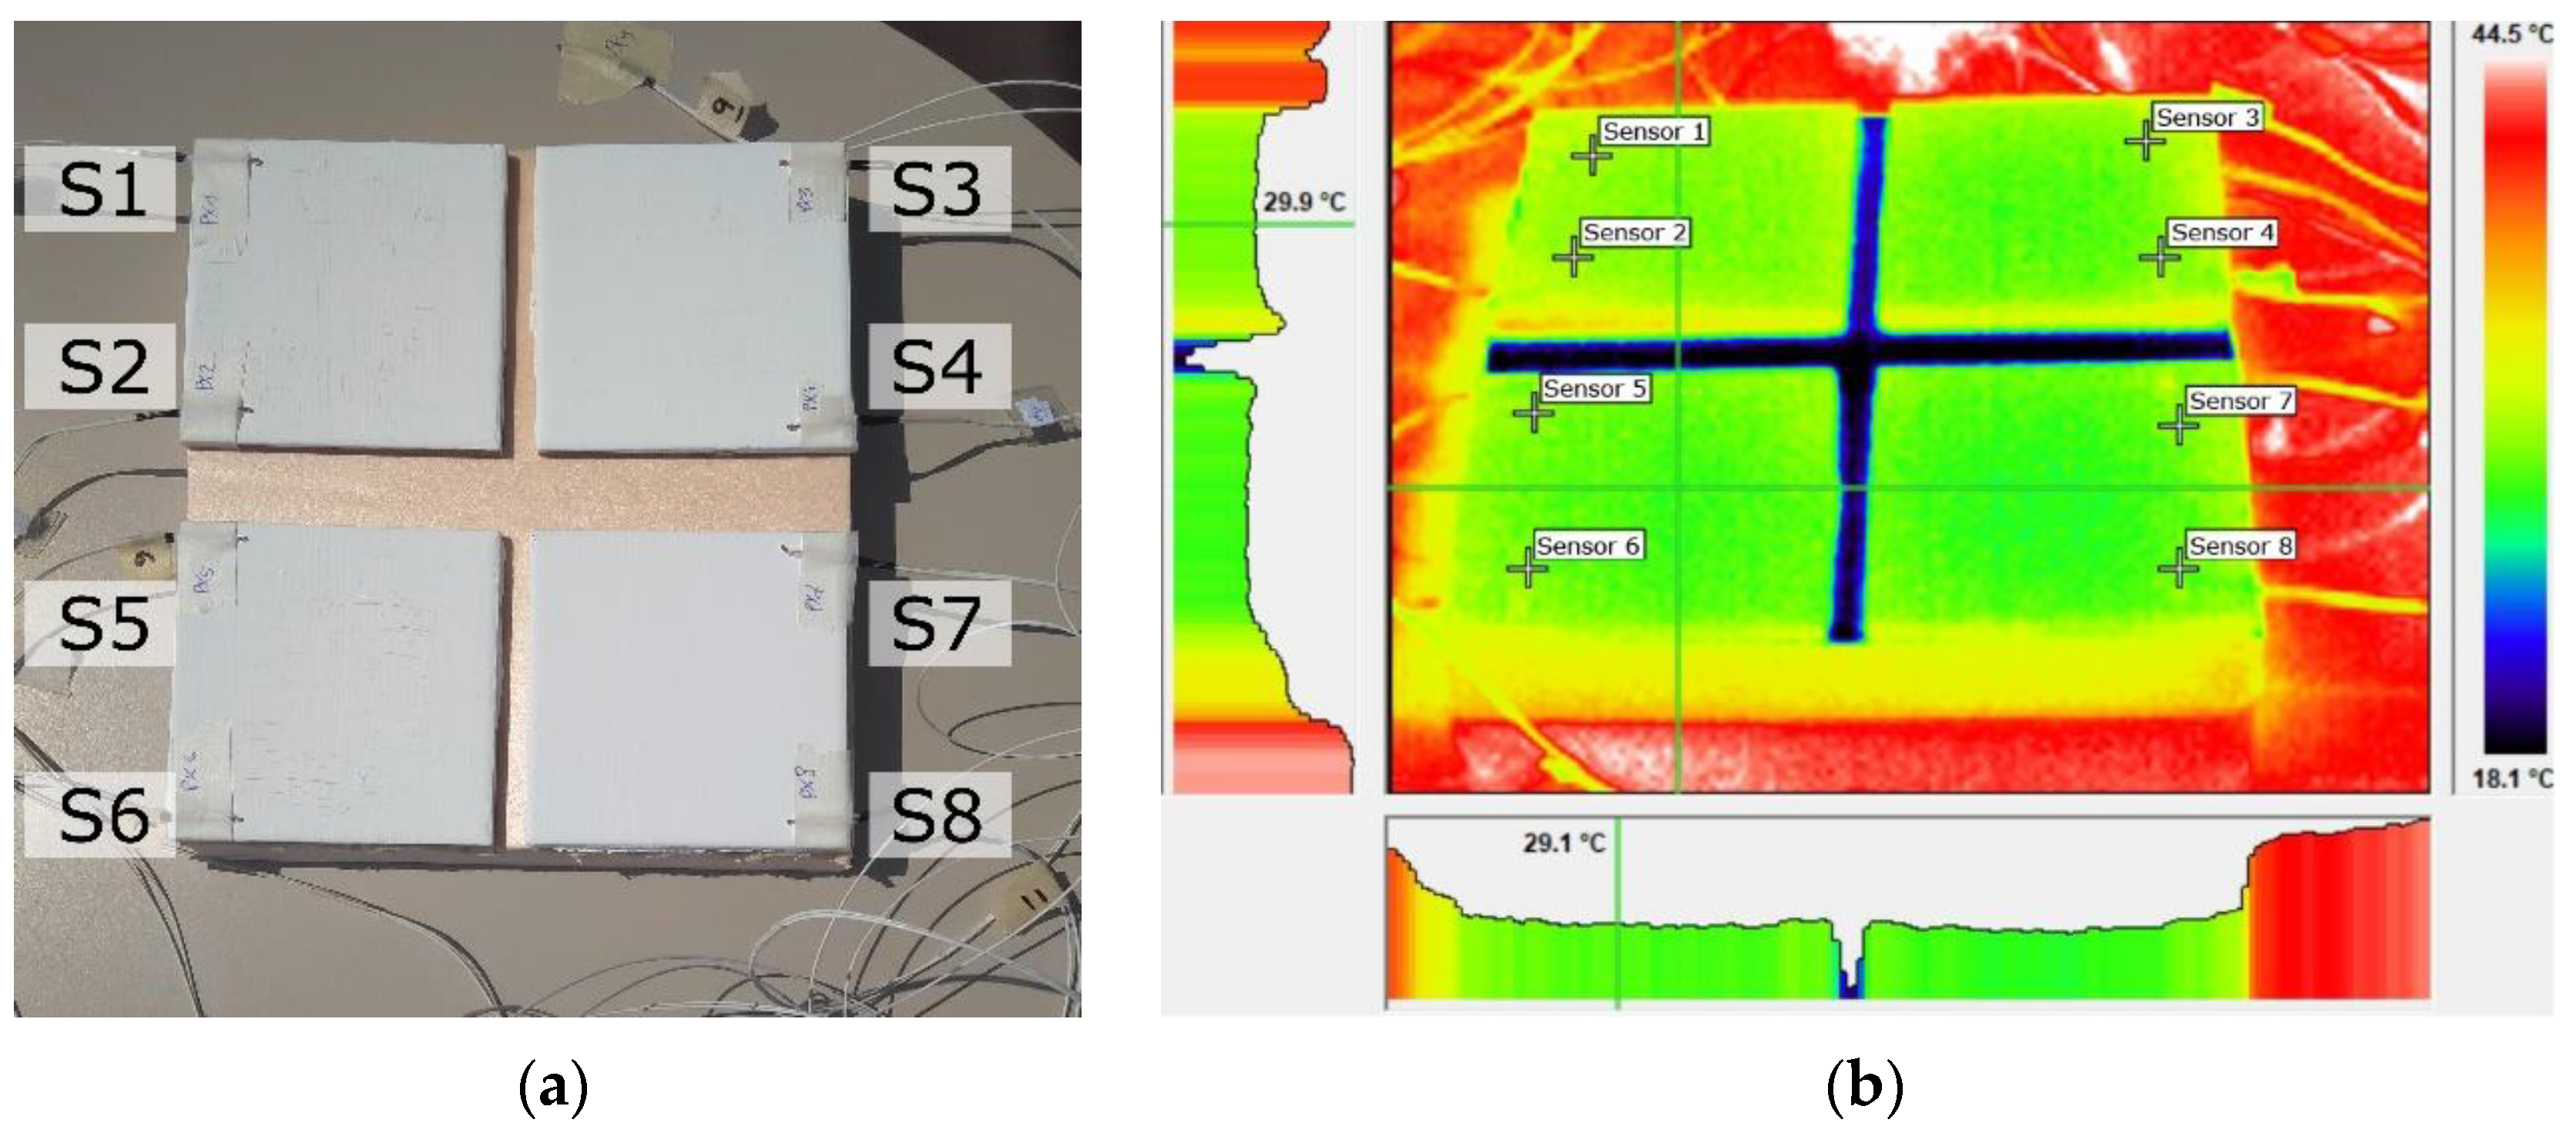
3.1. Methodology for Emissivity Tests
3.2. Results and Discussion for Emissivity Tests
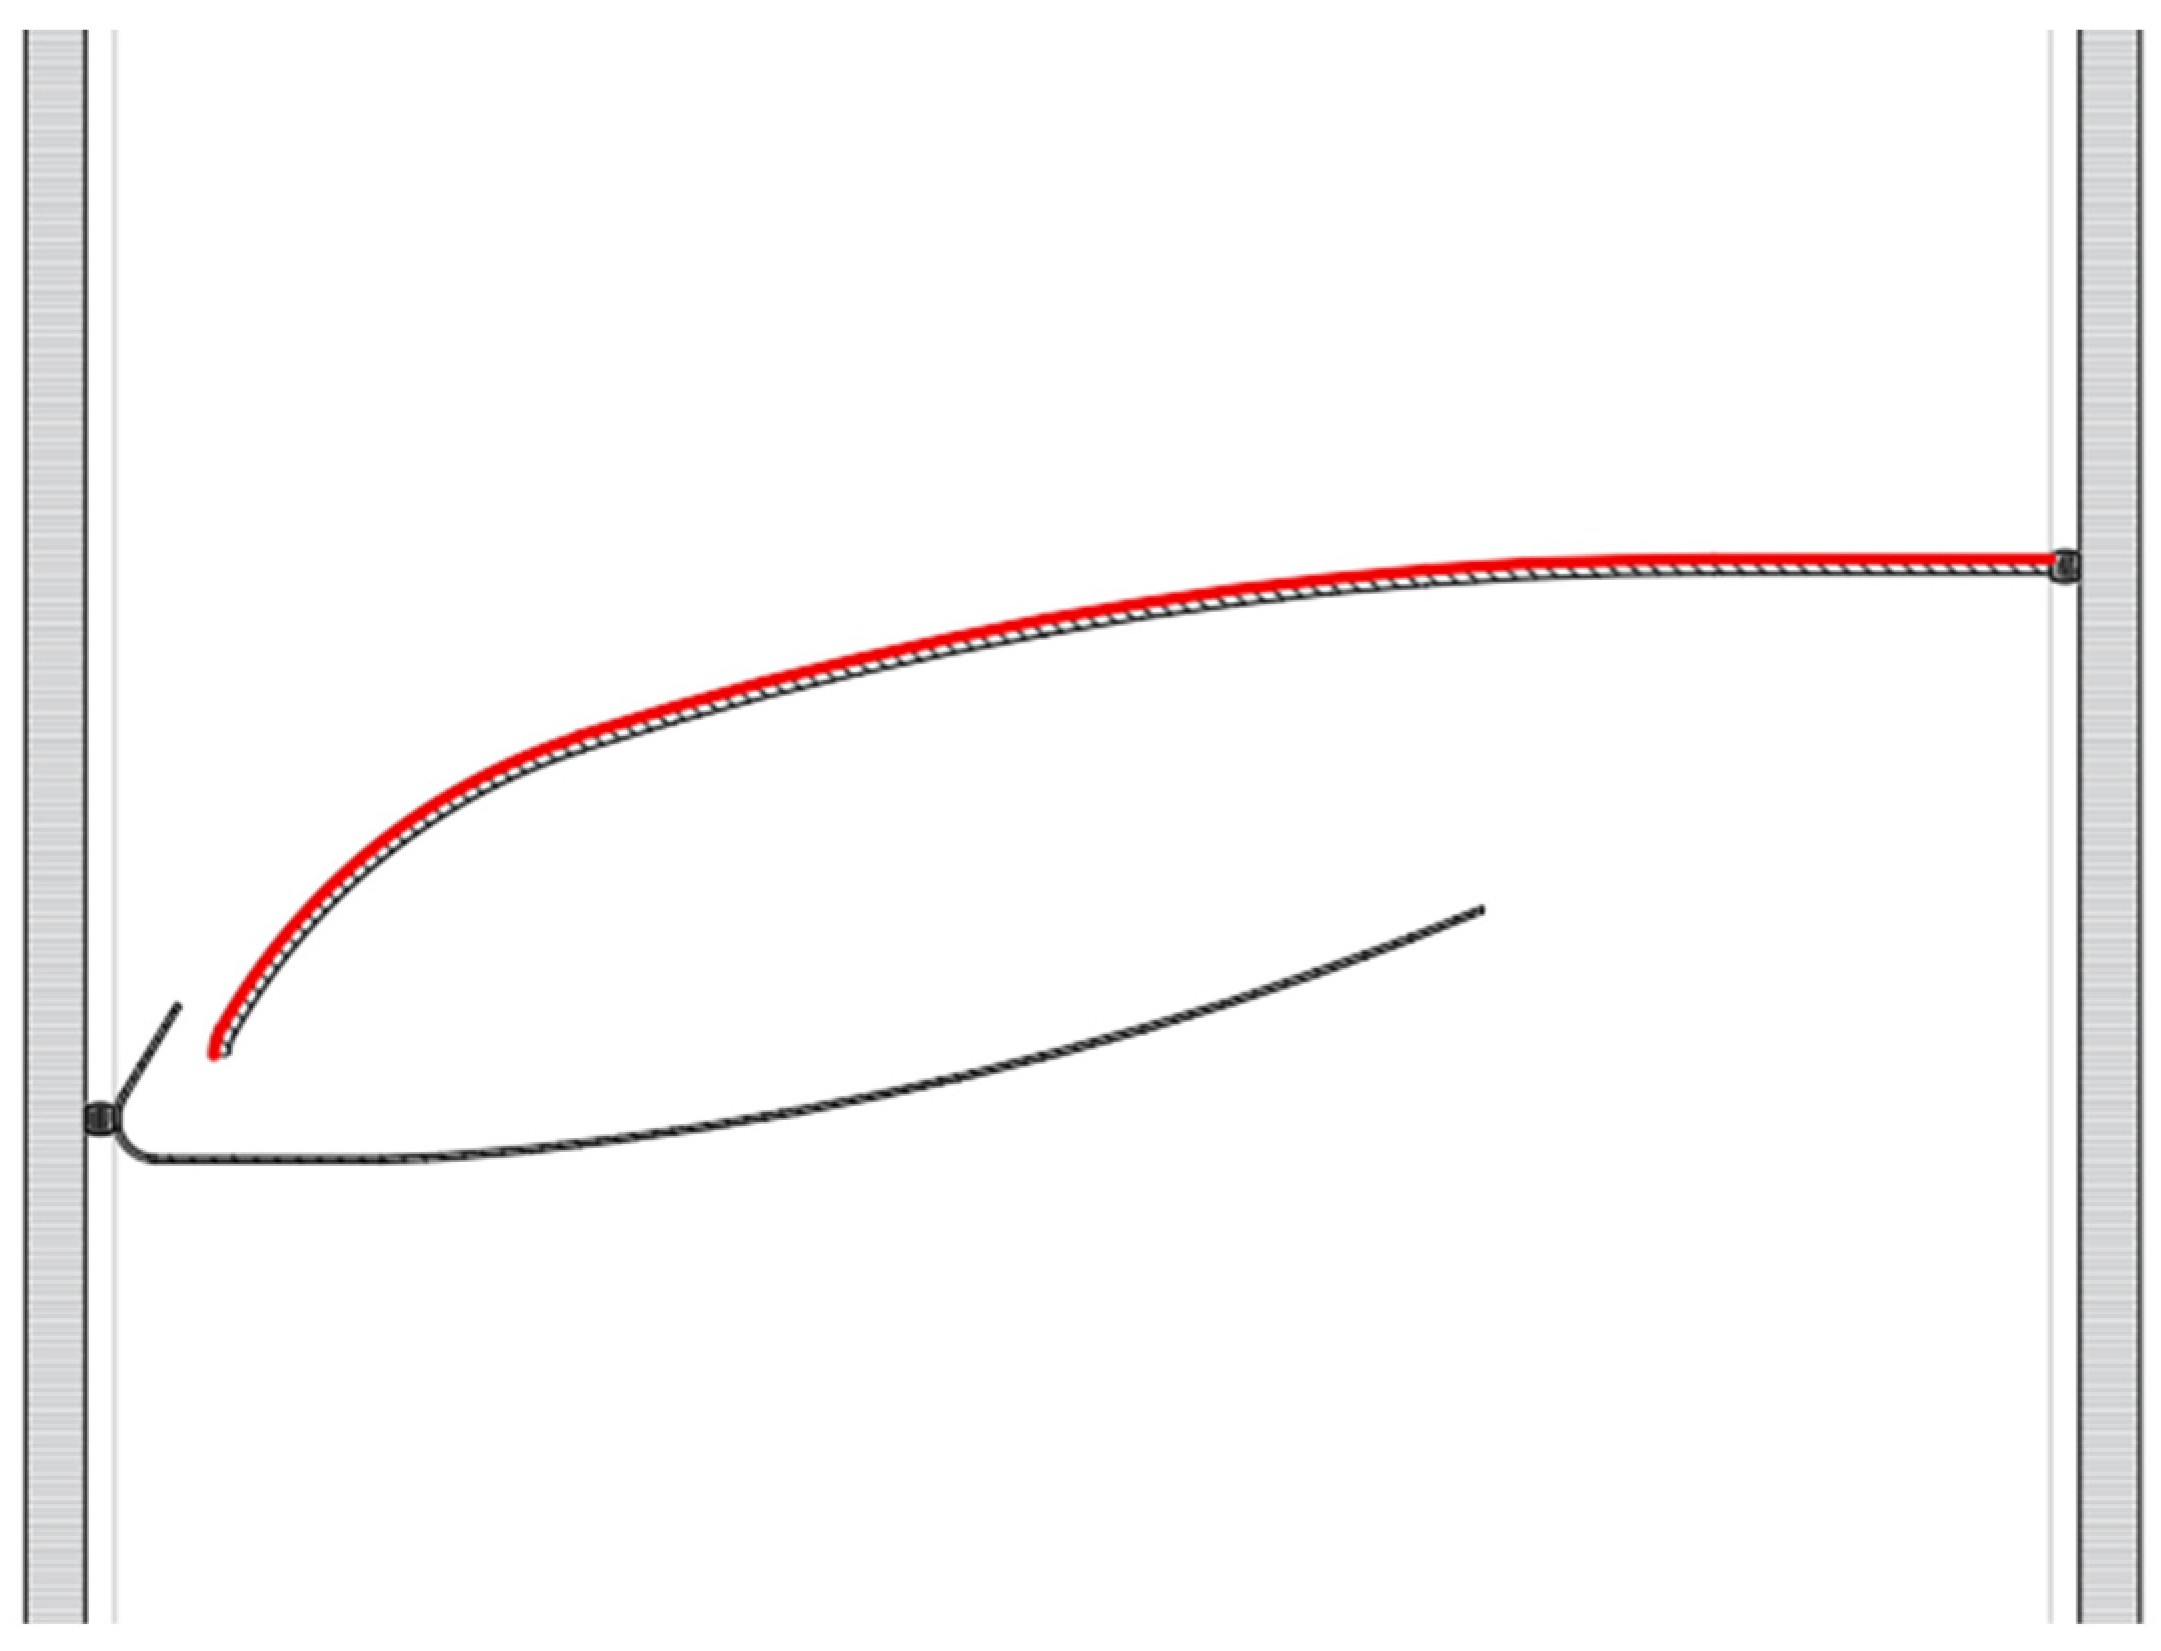
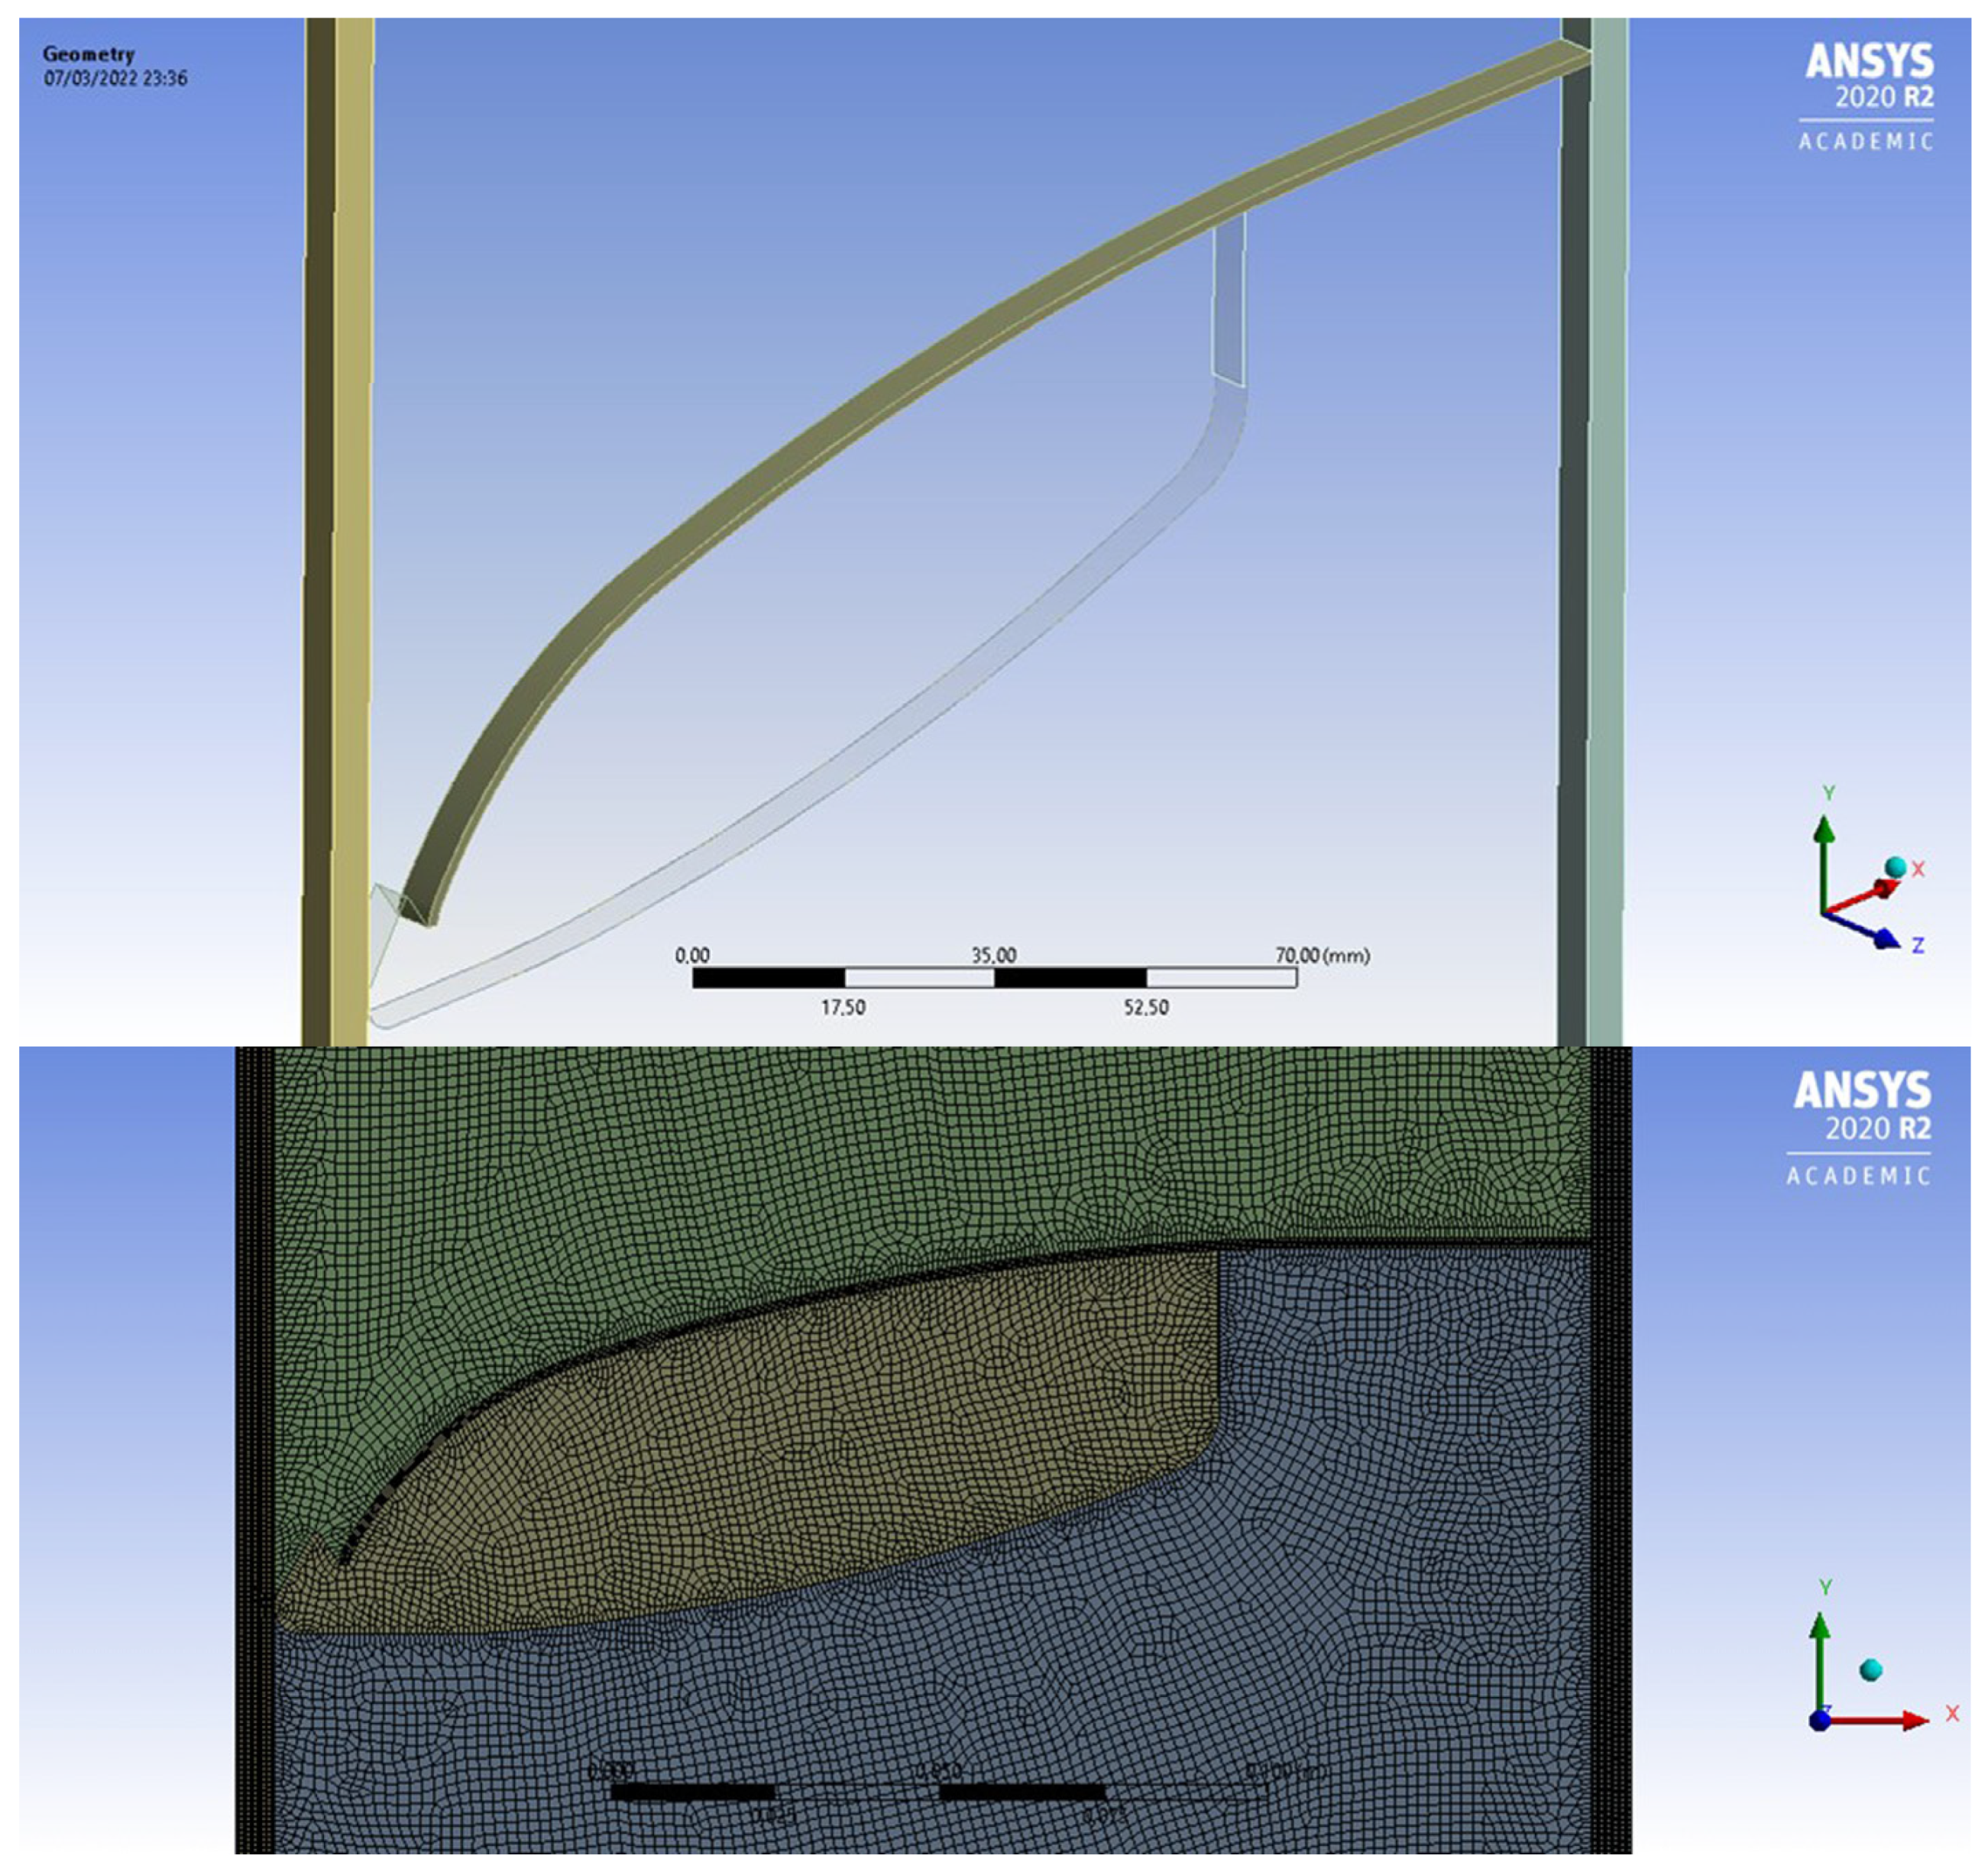
4. Façade System CFD Model
4.1. Mesh Independency
4.2. Model Validation
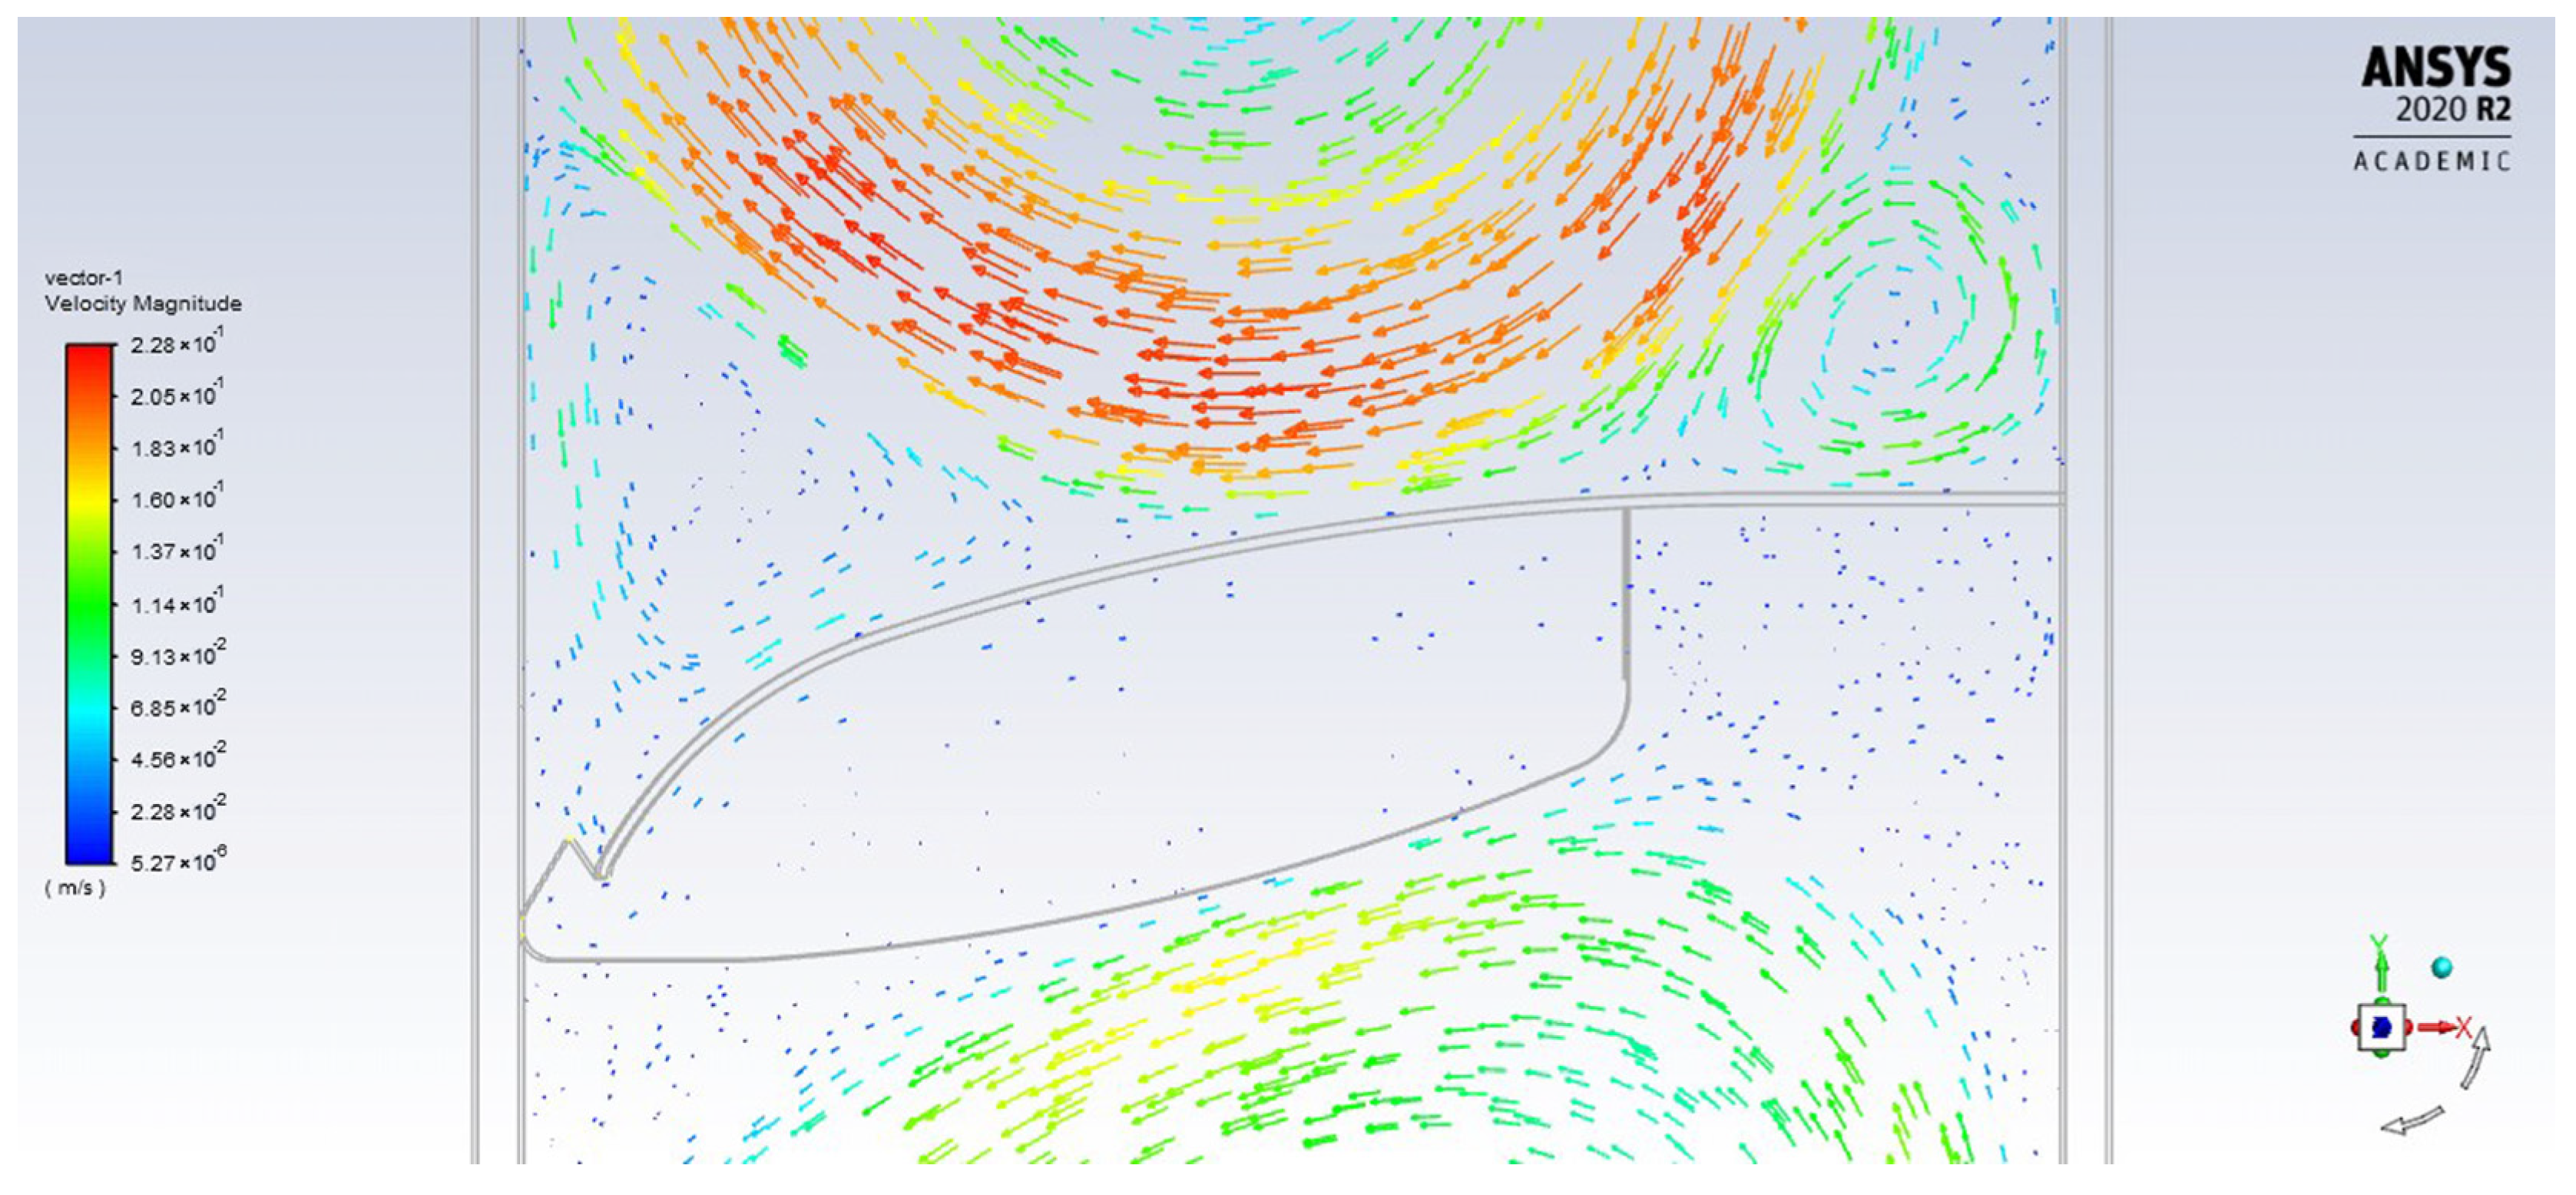
4.3. Model Evolution
5. Range of Application of the Façade System for Different Climatic Zones
5.1. Methodology for the Range of Application Study
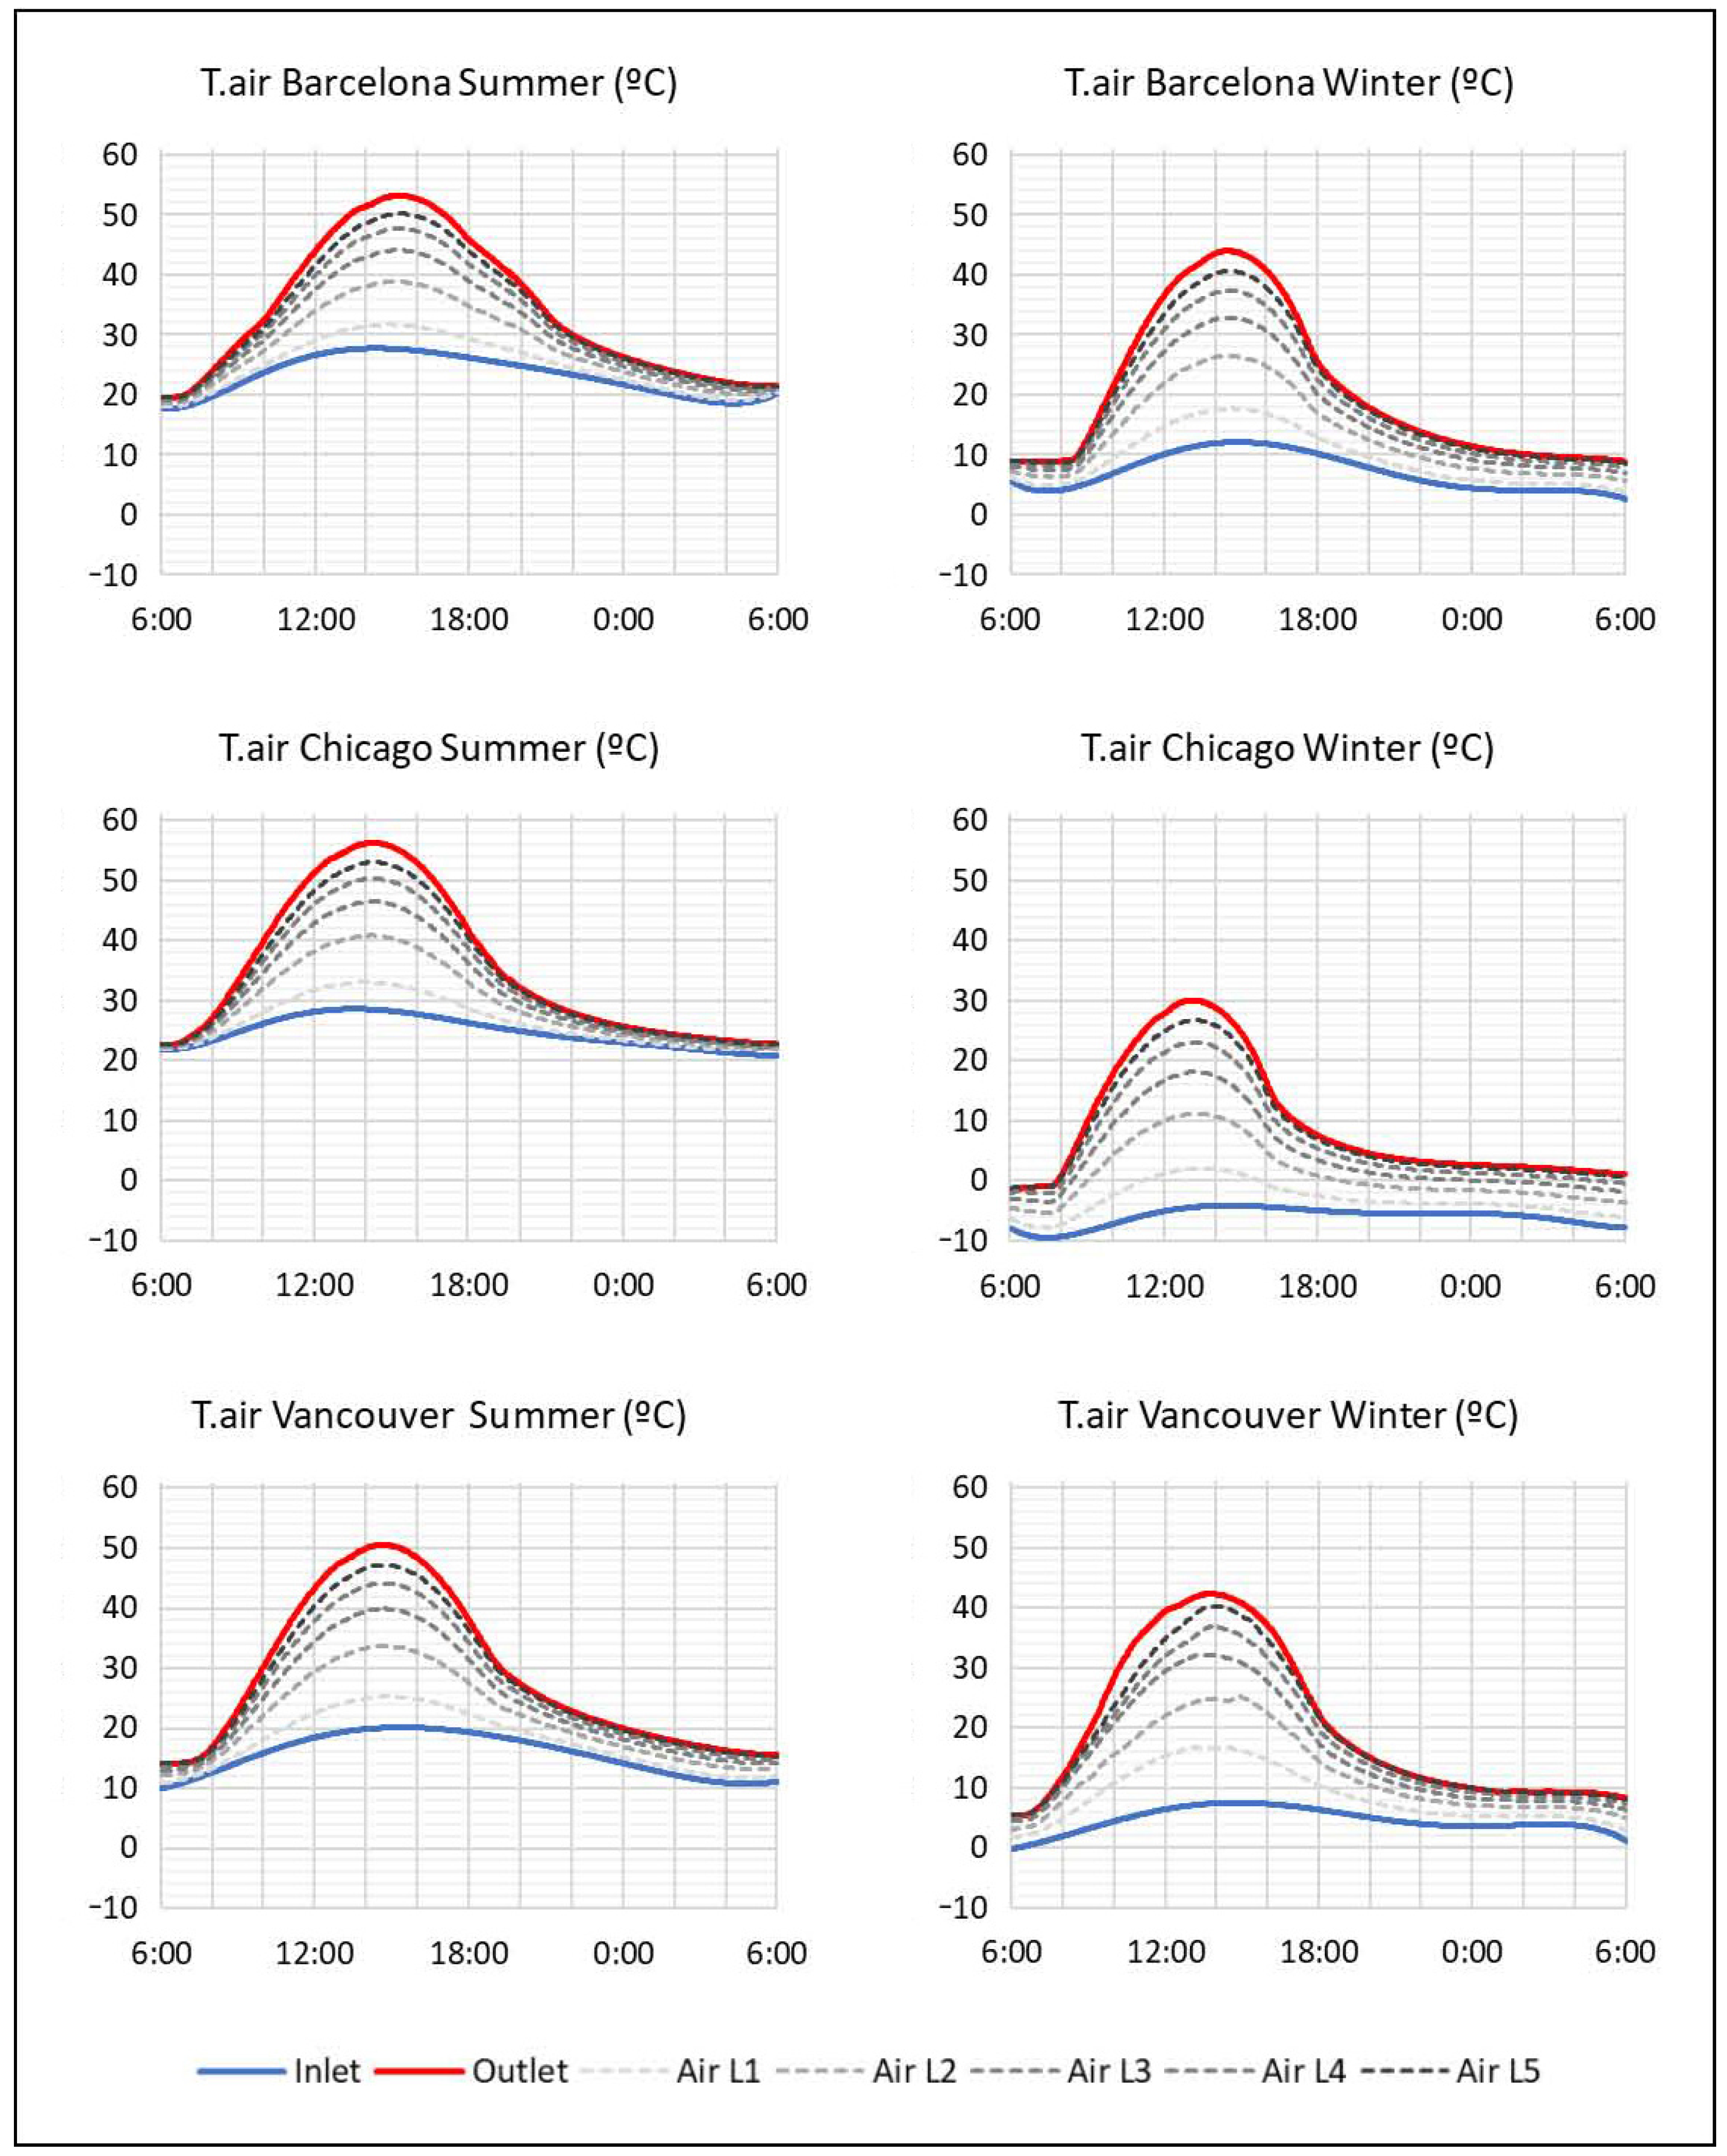
5.2. Results and Discussion for the Applicable Range Study
6. Conclusions
7. Patents
Author Contributions
Funding
Acknowledgments
Conflicts of Interest
Acronyms and Abbreviations
| AHU | Air Handling Unit (Air Treatment Unit) |
| CFD | Computational Fluid Dynamics |
| CTE | Código Técnico de la Edificación (Spanish building regulation) |
| DSF | Double Skin Façade |
| EPS | Expanded Polystyrene |
| GCI | Grid Convergence Index |
| IAQ | Indoor Air Quality |
| NTC sensor | Negative Temperature Coefficient sensor |
| UPC-EEBE | Universitat Politècnica de Catalunya—Escola d’Enginyeria Barcelona Est |
| UPC-ETSAB | Universitat Politècnica de Catalunya—Escola Tècnica Superior d’Arquitectura de Barcelona |
| UV | Ultraviolet |
| VDSF | Ventilated Double Skin Façades |
| VOCs | Volatile Organic Compounds |
| XPS | Extruded Polystyrene |
References
- Velux The Indoor Generation. The Effects of Modern Indoor Living on Health, Wellbeing and Productivity. YouGov Survey—Read More about How Life Indoor Effects Us. Available online: https://www.velux.com/indoorgeneration (accessed on 14 July 2021).
- Ortiz, M.; Itard, L.; Bluyssen, P.M. Indoor Environmental Quality Related Risk Factors with Energy-Efficient Retrofitting of Housing: A Literature Review. Energy Build. 2020, 221, 110102. [Google Scholar] [CrossRef]
- Office of the United Nations High Commissioner for Humar Rights the Right to Adequate Housing. Fact Sheet 21. 2009. Available online: https://www.ohchr.org/sites/default/files/Documents/Publications/FS21_rev_1_Housing_en.pdf (accessed on 9 January 2023).
- Khovalyg, D.; Kazanci, O.B.; Halvorsen, H.; Gundlach, I.; Bahnfleth, W.P.; Toftum, J.; Olesen, B.W. Critical Review of Standards for Indoor Thermal Environment and Air Quality. Energy Build. 2020, 213, 109819. [Google Scholar] [CrossRef]
- Wei, W.; Ramalho, O.; Mandin, C. Indoor Air Quality Requirements in Green Building Certifications. Build. Environ. 2015, 92, 10–19. [Google Scholar] [CrossRef]
- Grün, G.; Urlaub, S.; Foldbjerg, P. Part A: Towards an Identification of European Indoor Environments’ Impact on Health and Performance—Mould and Dampness; Fraunhofer IBP: Stuttgart, Germany, 2016. [Google Scholar]
- Brager, G.S.; Paliaga, G.; De Dear, R.; Olesen, B.; Wen, J.; Nicol, F.; Humphreys, M. Operable Windows, Personal Control, and Occupant Comfort. Ashrae Trans. 2004, 110, 17–35. [Google Scholar]
- De Dear, R.J.; Brager, G.S. Thermal Comfort in Naturally Ventilated Buildings: Revisions to ASHRAE Standard 55. Energy Build. 2002, 34, 549–561. [Google Scholar] [CrossRef] [Green Version]
- Luo, M.; Cao, B.; Ji, W.; Ouyang, Q.; Lin, B.; Zhu, Y. The Underlying Linkage between Personal Control and Thermal Comfort: Psychological or Physical Effects? Energy Build. 2016, 111, 56–63. [Google Scholar] [CrossRef]
- Luna-Navarro, A.; Loonen, R.; Juaristi, M.; Monge-Barrio, A.; Attia, S.; Overend, M. Occupant-Facade Interaction: A Review and Classification Scheme. Build. Environ. 2020, 177, 106880. [Google Scholar] [CrossRef] [Green Version]
- Neila González, F.J. Arquitectura Bioclimática En Un Entorno Sostenible; Munillaleria: Madrid, Spain, 2004; ISBN 9788489150645. [Google Scholar]
- Allard, F. Natural Ventilation in Buildings: A Design Handbook; James and James (Science Publishers) Ltd.: London, UK, 1998; ISBN 9781873936726. [Google Scholar]
- Năstase, G.; Doboși, I.S.; Brezeanu, A.I.; Taus, D.; Tăbăcaru, M.B.; Vuțoiu, B.G.; Rusu, D.; Bulmez, A.M.; Iordan, N.F. Experimental Heat Transfer, Sound Insulation and Interior Comfort Parameters Assessment on a Box Double-Skin Façade. Buildings 2022, 12, 730. [Google Scholar] [CrossRef]
- Poirazis, H. Double Skin Facades for Office Buildings—Literature Review Report; Lund Institute of Technology: Lund, Switzerland, 2004; ISBN 91-85147-02-8. [Google Scholar]
- Zelenay, K.; Perepelitza, M.; Lehrer, D. High-Performance Facades Design Strategies and Applications in North America and Northern Europe; Center for the Built Environment: Berkeley, CA, USA, 2011. [Google Scholar]
- Gratia, E.; De Herde, A. Is Day Natural Ventilation Still Possible in Office Buildings with a Double-Skin Façade? Build. Environ. 2004, 39, 399–409. [Google Scholar] [CrossRef]
- Gratia, E.; De Herde, A. Natural Cooling Strategies Efficiency in an Office Building with a Double-Skin Façade. Energy Build. 2004, 36, 1139–1152. [Google Scholar] [CrossRef]
- Manz, H.; Frank, T. Thermal Simulation of Buildings with Double-Skin Façades. Energy Build. 2005, 37, 1114–1121. [Google Scholar] [CrossRef]
- Karadag, I.; Cakmakli, A.B. Interface of the Natural Ventilation Systems with Building Management Systems. Period. Polytech. Archit. 2020, 51, 178–188. [Google Scholar] [CrossRef]
- Saroglou, T.; Theodosiou, T.; Givoni, B.; Meir, I.A. A Study of Different Envelope Scenarios towards Low Carbon High-Rise Buildings in the Mediterranean Climate—Can DSF Be Part of the Solution? Renew. Sustain. Energy Rev. 2019, 113, 109237. [Google Scholar] [CrossRef]
- Guardo, A.; Coussirat, M.; Egusquiza, E.; Alavedra, P.; Castilla, R. A CFD Approach to Evaluate the Influence of Construction and Operation Parameters on the Performance of Active Transparent Façades in Mediterranean Climates. Energy Build. 2009, 41, 534–542. [Google Scholar] [CrossRef]
- Torres, M.; Alavedra, P.; Guzmán, A.; Cuerva, E.; Planas, C. Double Skin Façades—Cavity and Exterior Openings Dimensions for Saving Energy on Mediterranean Climate. In Building Simulation; 2007; pp. 198–205. Available online: https://publications.ibpsa.org/conference/paper/?id=bs2007_407 (accessed on 22 December 2022).
- Parra, J.; Guardo, A.; Egusquiza, E.; Alavedra, P. Thermal Performance of Ventilated Double Skin Façades with Venetian Blinds. Energies 2015, 8, 4882–4898. [Google Scholar] [CrossRef]
- Velasco, A.; García, S.J.; Guardo, A.; Fontanals, A.; Egusquiza, M. Assessment of the Use of Venetian Blinds as Solar Thermal Collectors in Double Skin Facades in Mediterranean Climates. Energies 2017, 10, 1825. [Google Scholar] [CrossRef] [Green Version]
- Planas, C.; Cuerva, E.; Alavedra, P. Effects of the Type of Facade on the Energy Performance of Office Buildings Representative of the City of Barcelona. Ain Shams Eng. J. 2018, 9, 3325–3334. [Google Scholar] [CrossRef]
- World Health Organization (WHO); Climate & Clean Air Coalition (CCAC). BreathLife: The Equation Is Simple. 2015. Available online: https://www.who.int/publications/m/item/breathlife-equation-is-simple (accessed on 9 January 2023).
- Breathe Life 2030—Health and Climate Impacts. Available online: https://breathelife2030.org/the-issue/health-and-climate-impacts/?playlearn (accessed on 14 July 2021).
- Li, H.; Zhong, K.; Zhai, Z. A New Double-Skin Façade System Integrated with TiO2 Plates for Decomposing BTEX. Build. Environ. 2020, 180, 107037. [Google Scholar] [CrossRef]
- Flores Lazo, J.F. Integración En Fachada de Mecanismos de Depuración de Aire. Master’s Thesis, Universitat Politècnica de Catalunya, Barcelona, Brazil, 2018. [Google Scholar]
- Coronado, J.M.; Portela, R.; Hernández-Alonso, M.D.; García Rodríguez, S.; Fresno García, F.; Suárez Gil, S.; de la Peña O’Shea, V.A. Design of Advanced Photocatalytic Materials for Energy and Environmental Applications; Coronado, J.M., Fresno García, F., Hernández-Alonso, M.D., Portela, R., Eds.; Springer: Berlin/Heidelberg, Germany, 2013; ISBN 978-1-4471-5060-2. [Google Scholar]
- Lee, J.E.; Ok, Y.S.; Tsang, D.C.W.; Song, J.H.; Jung, S.C.; Park, Y.K. Recent Advances in Volatile Organic Compounds Abatement by Catalysis and Catalytic Hybrid Processes: A Critical Review. Sci. Total Environ. 2020, 719, 137405. [Google Scholar] [CrossRef]
- Maness, P.C.; Smolinski, S.; Blake, D.M.; Huang, Z.; Wolfrum, E.J.; Jacoby, W.A. Bactericidal Activity of Photocatalytic TiO2 Reaction: Toward an Understanding of Its Killing Mechanism. Appl. Environ. Microbiol. 1999, 65, 4094–4098. [Google Scholar] [CrossRef] [Green Version]
- Chen, D.; Li, F.; Ray, A.K. Effect of Mass Transfer and Catalyst Layer Thickness on Photocatalytic Reaction. AIChE J. 2000, 46, 1034–1045. [Google Scholar] [CrossRef]
- Knaack, U.; Klein, T.; Bilow, M.; Auer, T. Façades: Principles of Construction Second and Revised Edition; Birkhäuser: Berlin, Germany, 2014. [Google Scholar]
- Prieto, A.; Klein, T.; Knaack, U.; Auer, T. Main Perceived Barriers for the Development of Building Service Integrated Facades: Results from an Exploratory Expert Survey. J. Build. Eng. 2017, 13, 96–106. [Google Scholar] [CrossRef]
- Quesada, G.; Rousse, D.; Dutil, Y.; Badache, M.; Hallé, S. A Comprehensive Review of Solar Facades. Transparent and Translucent Solar Facades. Renew. Sustain. Energy Rev. 2012, 16, 2643–2651. [Google Scholar] [CrossRef]
- Sadineni, S.B.; Madala, S.; Boehm, R.F. Passive Building Energy Savings: A Review of Building Envelope Components. Renew. Sustain. Energy Rev. 2011, 15, 3617–3631. [Google Scholar] [CrossRef]
- Carlos, J.S.; Corvacho, H. Ventilated Double Window for the Preheating of the Ventilation Air Comparison of Its Performance in a Northern and a Southern European Climate. J. Renew. Energy 2013, 2013, 290865. [Google Scholar] [CrossRef] [Green Version]
- Carlos, J.S.; Corvacho, H.; Silva, P.D.; Castro-Gomes, J.P. Real Climate Experimental Study of Two Double Window Systems with Preheating of Ventilation Air. Energy Build. 2010, 42, 928–934. [Google Scholar] [CrossRef]
- Ariño Duglass Fabricante de Vidrio a Medida|Edificios y Ferrocarril—Ariño Duglass. Available online: https://www.duglass.com/ (accessed on 15 March 2022).
- Instituto Eduardo Torroja de Ciencias de la Construcción; CEPCO; AICIA. Catálogo de Elementos Constructivos Del CTE; Instituto Eduardo Torroja de Ciencias de la Construcción: Madrid, Spain, 2010. [Google Scholar]
- Proquicesa Photocatalytic Products—Proquicesa. Available online: https://www.proquicesa.com/en/product/photocatalytic-products/ (accessed on 15 March 2022).
- Henninger, J.H. Solar Absorptance and Thermal Emittance of Some Common Spacecraft Thermal-Control Coatings; NASA Technical Reports Server: Greenbelt, MD, USA, 1984; Volume 1121.
- Servei Meteorològic de Catalunya Dades de l’estació Automàtica Barcelona—Zona Universitària, Meteocat. Available online: https://www.meteo.cat/observacions/xema/dades?codi=X8 (accessed on 14 July 2021).
- Arduino Uno Rev3|Arduino Official Store. Available online: https://store.arduino.cc/arduino-uno-rev3 (accessed on 14 July 2021).
- Martín Monroy, M. Comportamiento de Cerramientos Soleados: Un Modelo de Simulacion Por Diferencias Finitas. Ph.D. Thesis, Universidad de Las Palmas de Gran Canaria, Las Palmas de Gran Canaria, Spain, 1995. [Google Scholar]
- Engineering ToolBox Absorbed Solar Radiation. Available online: https://www.engineeringtoolbox.com/solar-radiation-absorbed-materials-d_1568.html (accessed on 14 March 2022).
- Fernández-Mira, M.; Jimenez-Relinque, E.; Martínez, I.; Castellote, M. Evaluation of Changes in Surface Temperature of TiO2 Functionalized Pavements at Outdoor Conditions. Energy Build. 2021, 237, 110817. [Google Scholar] [CrossRef]
- Pan, L.; Xu, G.; Guo, T.; Zhang, B.; Xiang, S.; Fang, G.; Li, J. Study on Thermochromic-Emissivity Performance of Mn Doped TiO2 under Temperature Fluctuations. Infrared Phys. Technol. 2020, 105, 103192. [Google Scholar] [CrossRef]
- Xiang, S.; Xu, G.; Liu, C.; Bu, H.; Zhang, Y. Study on the Variable Color and Emissivity Properties of Co Doped TiO2 under Temperature Fluctuations. Opt. Mater. 2018, 85, 254–260. [Google Scholar] [CrossRef]
- Servei Meteorològic de Catalunya Dades de l’estació Automàtica Badalona—Museu, Meteocat. Available online: https://www.meteo.cat/observacions/xema/dades?codi=WU (accessed on 14 July 2021).
- Multi-Purpose Thermal Imager PCE-TC 3 User Manual. Available online: https://d3pcsg2wjq9izr.cloudfront.net/files/44930/download/302405/PCE-TC_3_medium_quality.pdf (accessed on 9 January 2023).
- Specifications for NTC Thermistor; TEM Electronic Components: Madrid, Spain, 2021; Available online: https://www.tme.eu/Document/f9d2f5e38227fc1c7d979e546ff51768/NTCM-100K-B3950.pdf (accessed on 9 January 2023).
- Tominaga, Y.; Stathopoulos, T. CFD Simulations Can Be Adequate for the Evaluation of Snow Effects on Structures. Build. Simul. 2020, 13, 729–737. [Google Scholar] [CrossRef]
- Mirzaei, P.A. CFD Modeling of Micro and Urban Climates: Problems to Be Solved in the New Decade. Sustain. Cities Soc. 2021, 69, 102839. [Google Scholar] [CrossRef]
- Thordal, M.S.; Bennetsen, J.C.; Capra, S.; Koss, H.H.H. Towards a Standard CFD Setup for Wind Load Assessment of High-Rise Buildings: Part 1—Benchmark of the CAARC Building. J. Wind Eng. Ind. Aerodyn. 2020, 205, 104283. [Google Scholar] [CrossRef]
- Thordal, M.S.; Bennetsen, J.C.; Capra, S.; Kragh, A.K.; Koss, H.H.H. Towards a Standard CFD Setup for Wind Load Assessment of High-Rise Buildings: Part 2—Blind Test of Chamfered and Rounded Corner High-Rise Buildings. J. Wind Eng. Ind. Aerodyn. 2020, 205, 104282. [Google Scholar] [CrossRef]
- De Gracia, A.; Castell, A.; Navarro, L.; Oró, E.; Cabeza, L.F. Numerical Modelling of Ventilated Facades: A Review. Renew. Sustain. Energy Rev. 2013, 22, 539–549. [Google Scholar] [CrossRef]
- Coussirat, M.; Guardo, A.; Jou, E.; Egusquiza, E.; Cuerva, E.; Alavedra, P. Performance and Influence of Numerical Sub-Models on the CFD Simulation of Free and Forced Convection in Double-Glazed Ventilated Façades. Energy Build. 2008, 40, 1781–1789. [Google Scholar] [CrossRef]
- Guardo, A.; Coussirat, M.; Valero, C.; Egusquiza, E.; Alavedra, P. CFD Assessment of the Performance of Lateral Ventilation in Double Glazed Façades in Mediterranean Climates. Energy Build. 2011, 43, 2539–2547. [Google Scholar] [CrossRef]
- Valentín, D.; Guardo, A.; Egusquiza, E.; Valero, C.; Alavedra, P. Use of Coandă Nozzles for Double Glazed Façades Forced Ventilation. Energy Build. 2013, 62, 605–614. [Google Scholar] [CrossRef]
- Roache, P.J. Perspective: A Method for Uniform Reporting of Grid Refinement Studies. J. Fluids Eng. 1994, 116, 405–413. [Google Scholar] [CrossRef]
- Reglamento de Instalaciones Térmicas En Los Edificios (RITE); Ministerio de la Presidencia: Madrid, Spain, 2007.
- ANSYS Ansys® Fluent 2020, Release 1, Help System, Theory Guide; ANSYS, Inc.: Pittsburgh, PA, USA, 2020.
- RESPILON Group, s.r.o. Respilon Technical Data Sheet, Anti-Smog Window Membrane RWM; RESPILON Group s.r.o: Brno, Czech Republic, 2018. [Google Scholar]
- Buchta, S.; Šmarda, M.; Holomek, M. Test Report 39-11216/1—Nanofilter Respilon Air; Hudcova: Brno, Czech Republic, 2017. [Google Scholar]
- Panitz, T.; Wasan, D.T. Flow Attachment to Solid Surfaces: The Coanda Effect. AIChE J. 1972, 18, 51–57. [Google Scholar] [CrossRef]
- Reba, I. Applications of the Coanda Effect. Sci. Am. 1966, 214, 84–92. [Google Scholar] [CrossRef]
- Kottek, M.; Grieser, J.; Beck, C.; Rudolf, B.; Rubel, F. World Map of the Köppen-Geiger Climate Classification Updated. Meteorol. Zeitschrift 2006, 15, 259–263. [Google Scholar]
- Crawley, D.; Lawrie, L. Climate.Onebuilding.Org. Available online: https://climate.onebuilding.org/ (accessed on 1 February 2022).
- American Society of Heating, Refrigerating and Air-Conditioning Engineers. 2001 ASHRAE Handbook: Fundamentals SI Edition; ASHRAE: Atlanta, GA, USA, 2001; ISBN 9781883413880. [Google Scholar]
- AmesWeb Thermal Expansion Coefficient of Aluminum. Available online: https://amesweb.info/Materials/Thermal_Expansion_Coefficient_of_Aluminum.aspx (accessed on 22 February 2022).
- Engineering ToolBox Metals—Temperature Expansion Coefficients. Available online: https://www.engineeringtoolbox.com/thermal-expansion-metals-d_859.html (accessed on 22 February 2022).
- Pardal March, C.; Paricio Ansuategui, I.; Aguilar Urquidez, P.; Lopez Besora, J.; Flores Lazo, J.; Roig Mayoral, O. Sistema de Depuración Fotocatalítica. Patent Number P202030141, 27 January 2022. [Google Scholar]
- Pardal March, C.; López Besora, J.; Alonso Montolio, C.; Cuerva Contreras, E.; Guardo Zabaleta, A.; Flores Lazo, J. Dispositivo Para Depuración de Aire Con Lamas Con Propiedades Fotocatalíticas (Modelo de Utilidad). Patent Number ES1248829, 17 September 2020. [Google Scholar]


| Front Glazing | Rear Glazing | Opaque Surfaces | |
|---|---|---|---|
| Extra-clear | Colourless | Softwood + EPS | |
| Thickness | 6 mm | 6 mm | 19 mm + 40 mm |
| Light transmission | 91% | 20% | - |
| Exterior light reflection | 8% | 32% | - |
| U value | 5.7 W/m2K | 5.2 W/m2K | 0.68 W/m2K |
| Solar factor | 27% | 27% | - |
| UV transmission | 69% | 11% | - |
| UV reflection | 8% | 32% | - |
| Date | Indirect Sunlight | Direct Sunlight | Indirect Sunlight |
|---|---|---|---|
| 3 October 2019 (UTC + 2 h) | 7:45–9:00 | 9:00–17:00 | 17:00–19:30 |
| 15 January 2020 (UTC + 1 h) | 8:15–9:30 | 9:30–15:15 | 15:15–17:45 |
| Device | Model | Accuracy | Measuring Range | Resolution |
|---|---|---|---|---|
| Thermistor | NTC 100K 3950 | ±1% ±0.25 °C | −50 °C to 260 °C (max. expected measuring range 0 °C to 75 °C) | 0.1 °C |
| Thermographic camera | PCE-TC 3 | ±2% ±2 °C | −10 to 250 °C | 0.15 °C |
| Sensors | Average and Standard Deviation | |||||||||
|---|---|---|---|---|---|---|---|---|---|---|
| S1 | S2 | S3 | S4 | S5 | S6 | S7 | S8 | |||
| Experiments | E01 | 29.90 | 30.36 | 30.05 | 29.94 | 30.35 | 30.48 | 30.64 | 30.37 | 30.26 ± 0.27 |
| E02 | 29.62 | 30.35 | 29.53 | 29.53 | 30.08 | 30.14 | 30.13 | 29.90 | 29.91 ± 0.32 | |
| E03 | 29.71 | 30.35 | 30.45 | 29.90 | 30.17 | 30.44 | 30.49 | 30.18 | 30.21 ± 0.28 | |
| E04 | 29.19 | 29.71 | 29.62 | 29.25 | 29.80 | 30.03 | 29.73 | 29.73 | 29.63 ± 0.28 | |
| E05 | 29.30 | 29.99 | 29.07 | 29.16 | 29.62 | 29.71 | 29.62 | 29.53 | 29.50 ± 0.31 | |
| E06 | 29.36 | 30.08 | 29.35 | 29.25 | 29.80 | 29.82 | 29.76 | 29.44 | 29.61 ± 0.30 | |
| E07 | 29.17 | 29.43 | 29.53 | 29.07 | 29.67 | 29.80 | 29.62 | 29.62 | 29.49 ± 0.25 | |
| E08 | 29.86 | 30.26 | 30.08 | 30.17 | 30.17 | 30.56 | 30.61 | 30.45 | 30.27 ± 0.26 | |
| E09 | 29.89 | 30.64 | 30.16 | 29.62 | 30.26 | 30.45 | 30.36 | 30.18 | 30.20 ± 0.32 | |
| E10 | 29.49 | 30.26 | 29.52 | 29.34 | 29.90 | 30.05 | 29.89 | 29.72 | 29.77 ± 0.31 | |
| Exp. | εTG | εavg | Deviation | Average Deviation | Sensor Precision | Maximal Deviation | Standard Deviation | Uncertainty |
|---|---|---|---|---|---|---|---|---|
| E01 | 0.43 | 0.59 | 0.16 | 0.10 | 0.01 | 0.18 | 0.13 | 0.13 |
| E02 | 0.49 | 0.10 | ||||||
| E03 | 0.60 | 0.01 | ||||||
| E04 | 0.50 | 0.09 | ||||||
| E05 | 0.62 | 0.03 | ||||||
| E06 | 0.43 | 0.16 | ||||||
| E07 | 0.79 | 0.20 | ||||||
| E08 | 0.70 | 0.11 | ||||||
| E09 | 0.74 | 0.15 | ||||||
| E10 | 0.57 | 0.02 |
| MESH SENSITIVITY ANALYSIS | |||||||||||||
|---|---|---|---|---|---|---|---|---|---|---|---|---|---|
| Solid mesh | size ratio | 1.4142 | |||||||||||
| Mesh | Element size (mm) | Average temperatures (K) | GRID REFINEMENT STUDY | ||||||||||
| Fluid | Solid | z-axis | Inner glass | Slat 1 | Slat 5 | Int. air | ε | |p| | GCI | Asymptotic range of convergence (R = 1) | |||
| 1 | 1.000 | 0.250 | 1.250 | 309.14 | 306.28 | 315.47 | 309.71 | 0.0001 | 2.00 | 0.0001 | 1.00 | ||
| 2 | 0.354 | 309.24 | 306.28 | 315.64 | 309.73 | 0.63 | |||||||
| 3 | 0.500 | 309.21 | 306.26 | 315.61 | 309.70 | 0.0001 | 2.00 | 0.0001 | 0.38 | ||||
| 4 | 0.707 | 308.88 | 304.61 | 315.06 | 309.61 | 0.0003 | 2.74 | 0.0002 | |||||
| 5 | 1.000 | 309.29 | 306.30 | 315.58 | 310.05 | 0.0014 | 4.74 | 0.0004 | |||||
| Fluid mesh | size ratio | 1.4142 | |||||||||||
| Mesh | Element size (mm) | Average temperatures (K) | GRID REFINEMENT STUDY | ||||||||||
| Fluid | Solid | z-axis | Inner glass | Slat 1 | Slat 5 | Int. air | ε | |p| | GCI | Asymptotic range of convergence (R = 1) | |||
| 1 | 0.500 | 0.354 | 1.250 | 308.54 | 306.30 | 314.76 | 309.46 | 0.0017 | 2.19 | 0.0039 | 1.00 | ||
| 2 | 0.707 | 308.88 | 304.64 | 314.49 | 309.97 | 2.20 | |||||||
| 3 | 1.000 | 309.24 | 306.28 | 315.64 | 309.73 | 0.0008 | 2.19 | 0.0018 | 0.01 | ||||
| 4 | 1.414 | 308.96 | 304.54 | 315.32 | 309.43 | 0.0010 | 0.62 | 0.0050 | |||||
| 5 | 2.000 | 308.66 | 305.81 | 314.36 | 309.34 | 0.0003 | 3.59 | 0.0001 | |||||
| z-axis mesh | size ratio | 2.0000 | |||||||||||
| Mesh | Element size (mm) | Average temperatures (K) | GRID REFINEMENT STUDY | ||||||||||
| Fluid | Solid | z-axis | Inner glass | Slat 1 | Slat 5 | Int. air | ε | |p| | GCI | Asymptotic range of convergence (R = 1) | |||
| 1 | 0.707 | 0.354 | 0.313 | 308.60 | 304.73 | 313.93 | 309.52 | 0.0001 | 2.32 | 0.0001 | 1.00 | ||
| 2 | 0.625 | 308.61 | 304.74 | 313.96 | 309.53 | 0.04 | |||||||
| 3 | 1.250 | 308.62 | 304.74 | 313.96 | 309.53 | 0.0000 | 2.32 | 0.0000 | 24.63 | ||||
| 4 | 2.500 | 308.59 | 304.74 | 313.93 | 309.50 | 0.0001 | 9.05 | 0.0000 | |||||
| 5 | 5.000 | 308.60 | 304.73 | 313.93 | 309.51 | 0.0000 | 6.46 | 0.0000 | |||||
| Evolution | Ventilation Flow Rate | Gauge Pressure | Head Loss | Aerodynamic Noise | Coanda Effect? | |
|---|---|---|---|---|---|---|
| 1 |  | 13.1 | −158 | 13.15 | 24.9 | Yes |
| 2 |  | 14.6 | −99 | 8.24 | 14.8 | No |
| 3 |  | 14.3 | −149 | 12.40 | 20.5 | No |
| 4 |  | 12.7 | −198 | 16.43 | 25.9 | Yes |
| 5 |  | 14.9 | −162 | 13.45 | 10.5 | No |
| 6 |  | 17.4 | −120 | 9.98 | 10.8 | Yes |
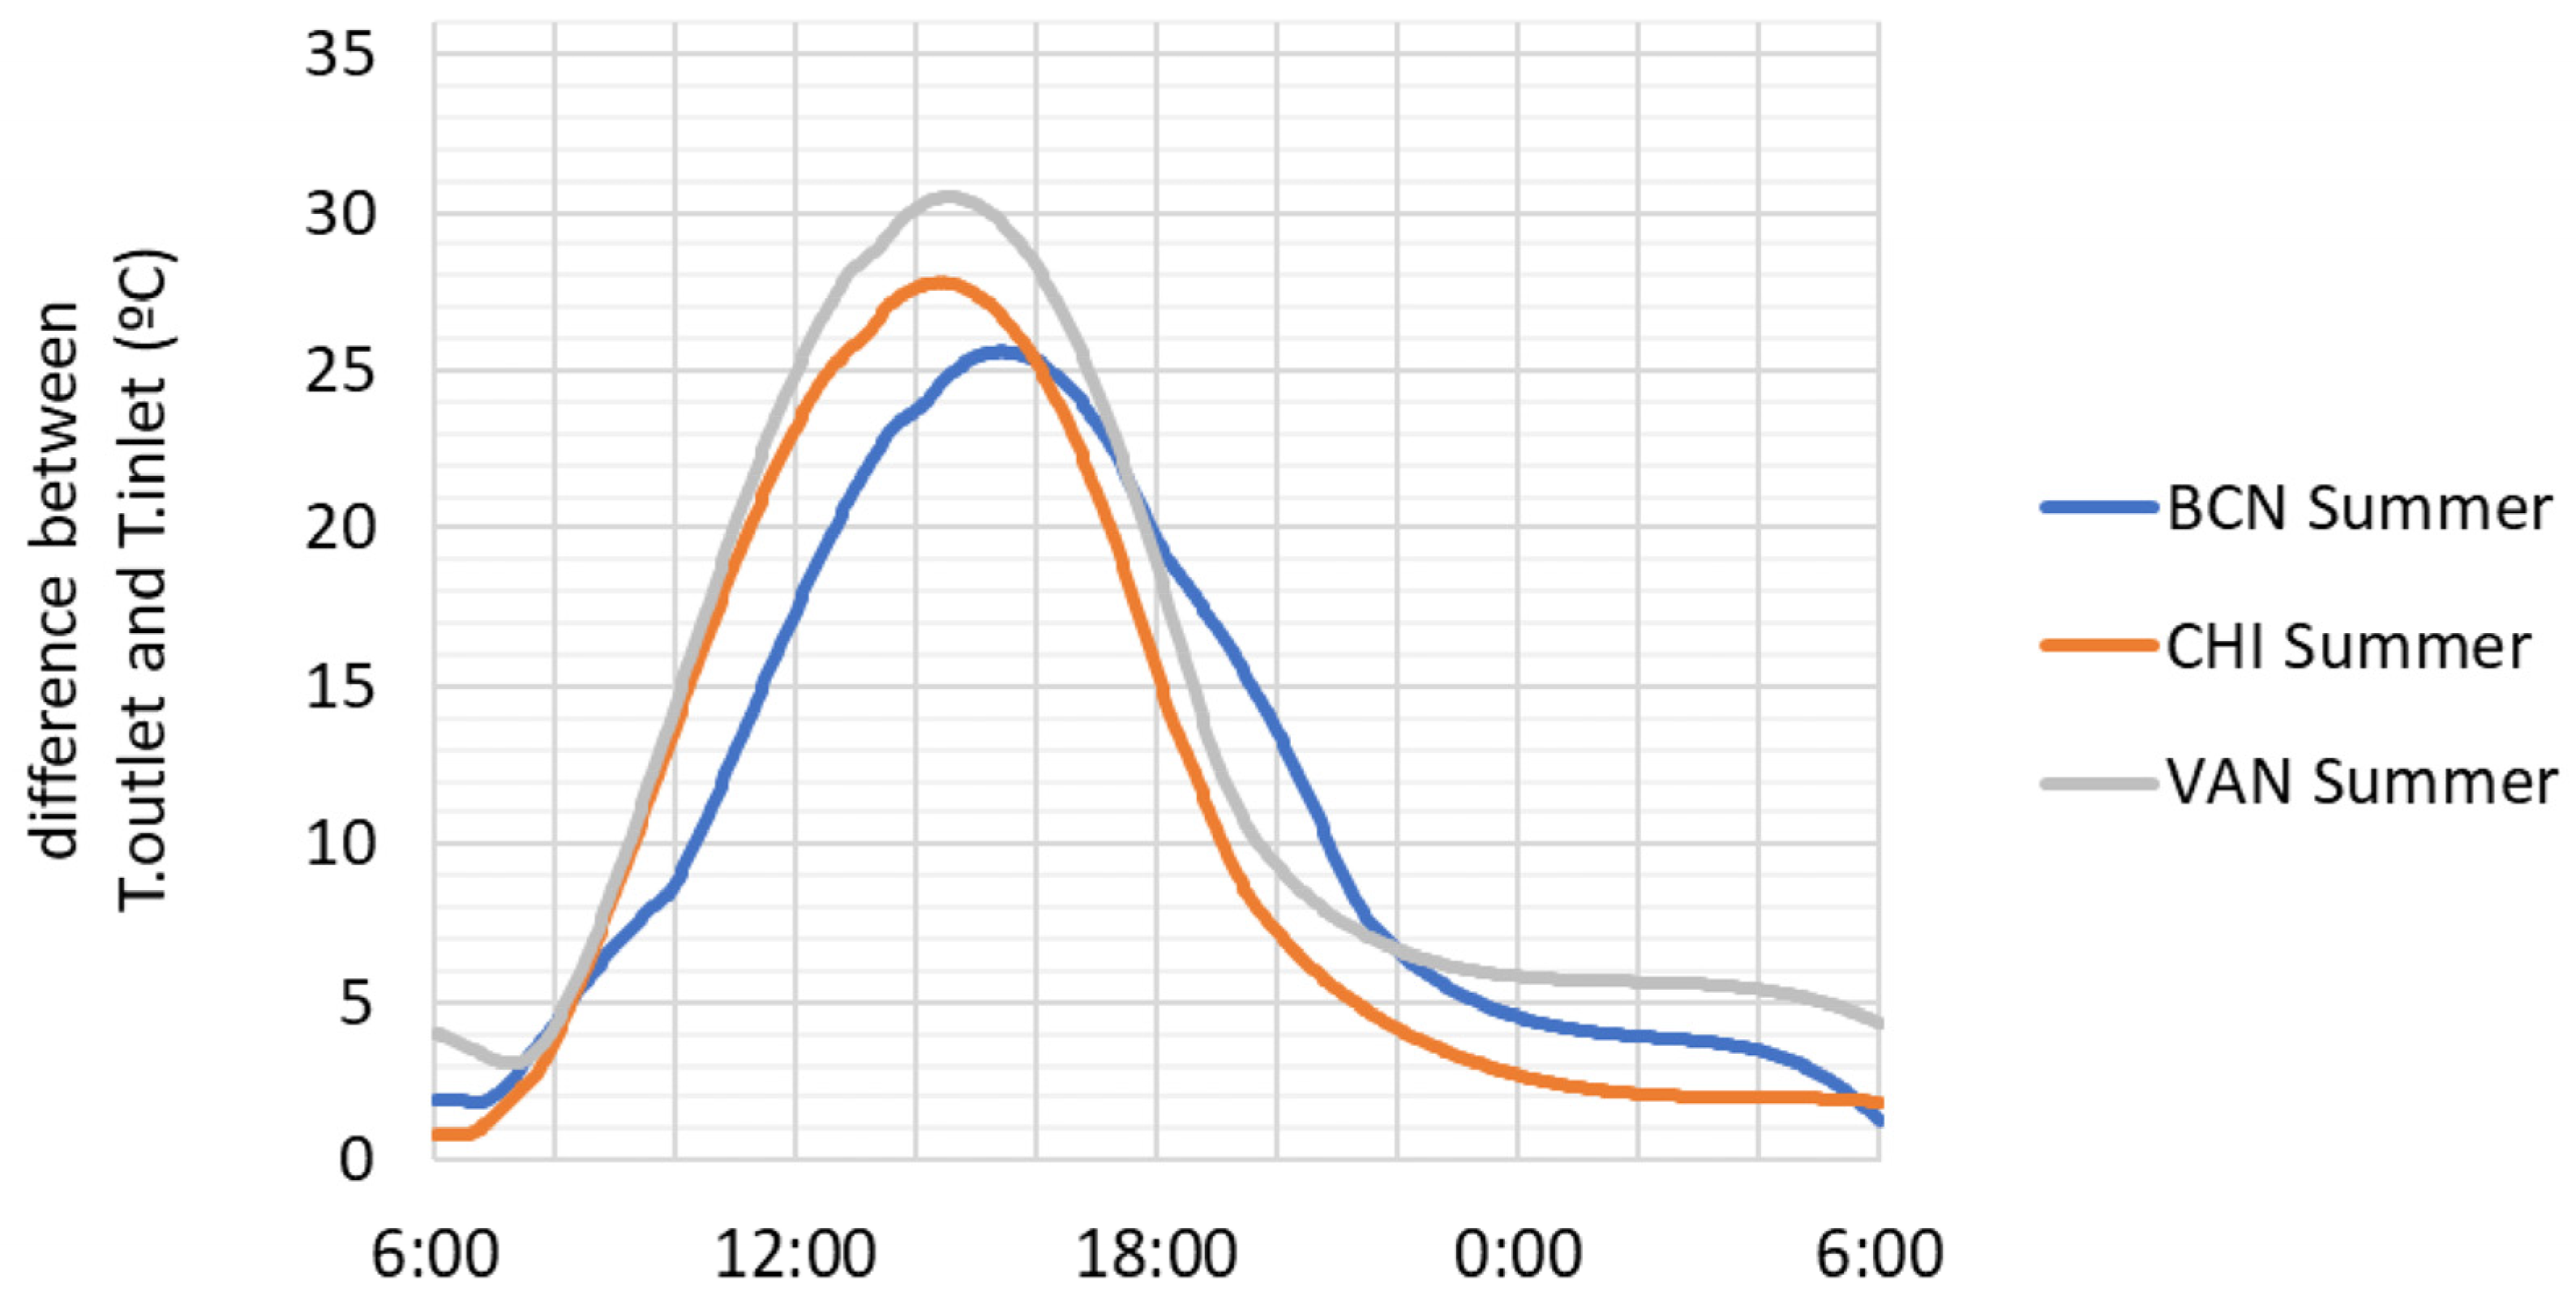
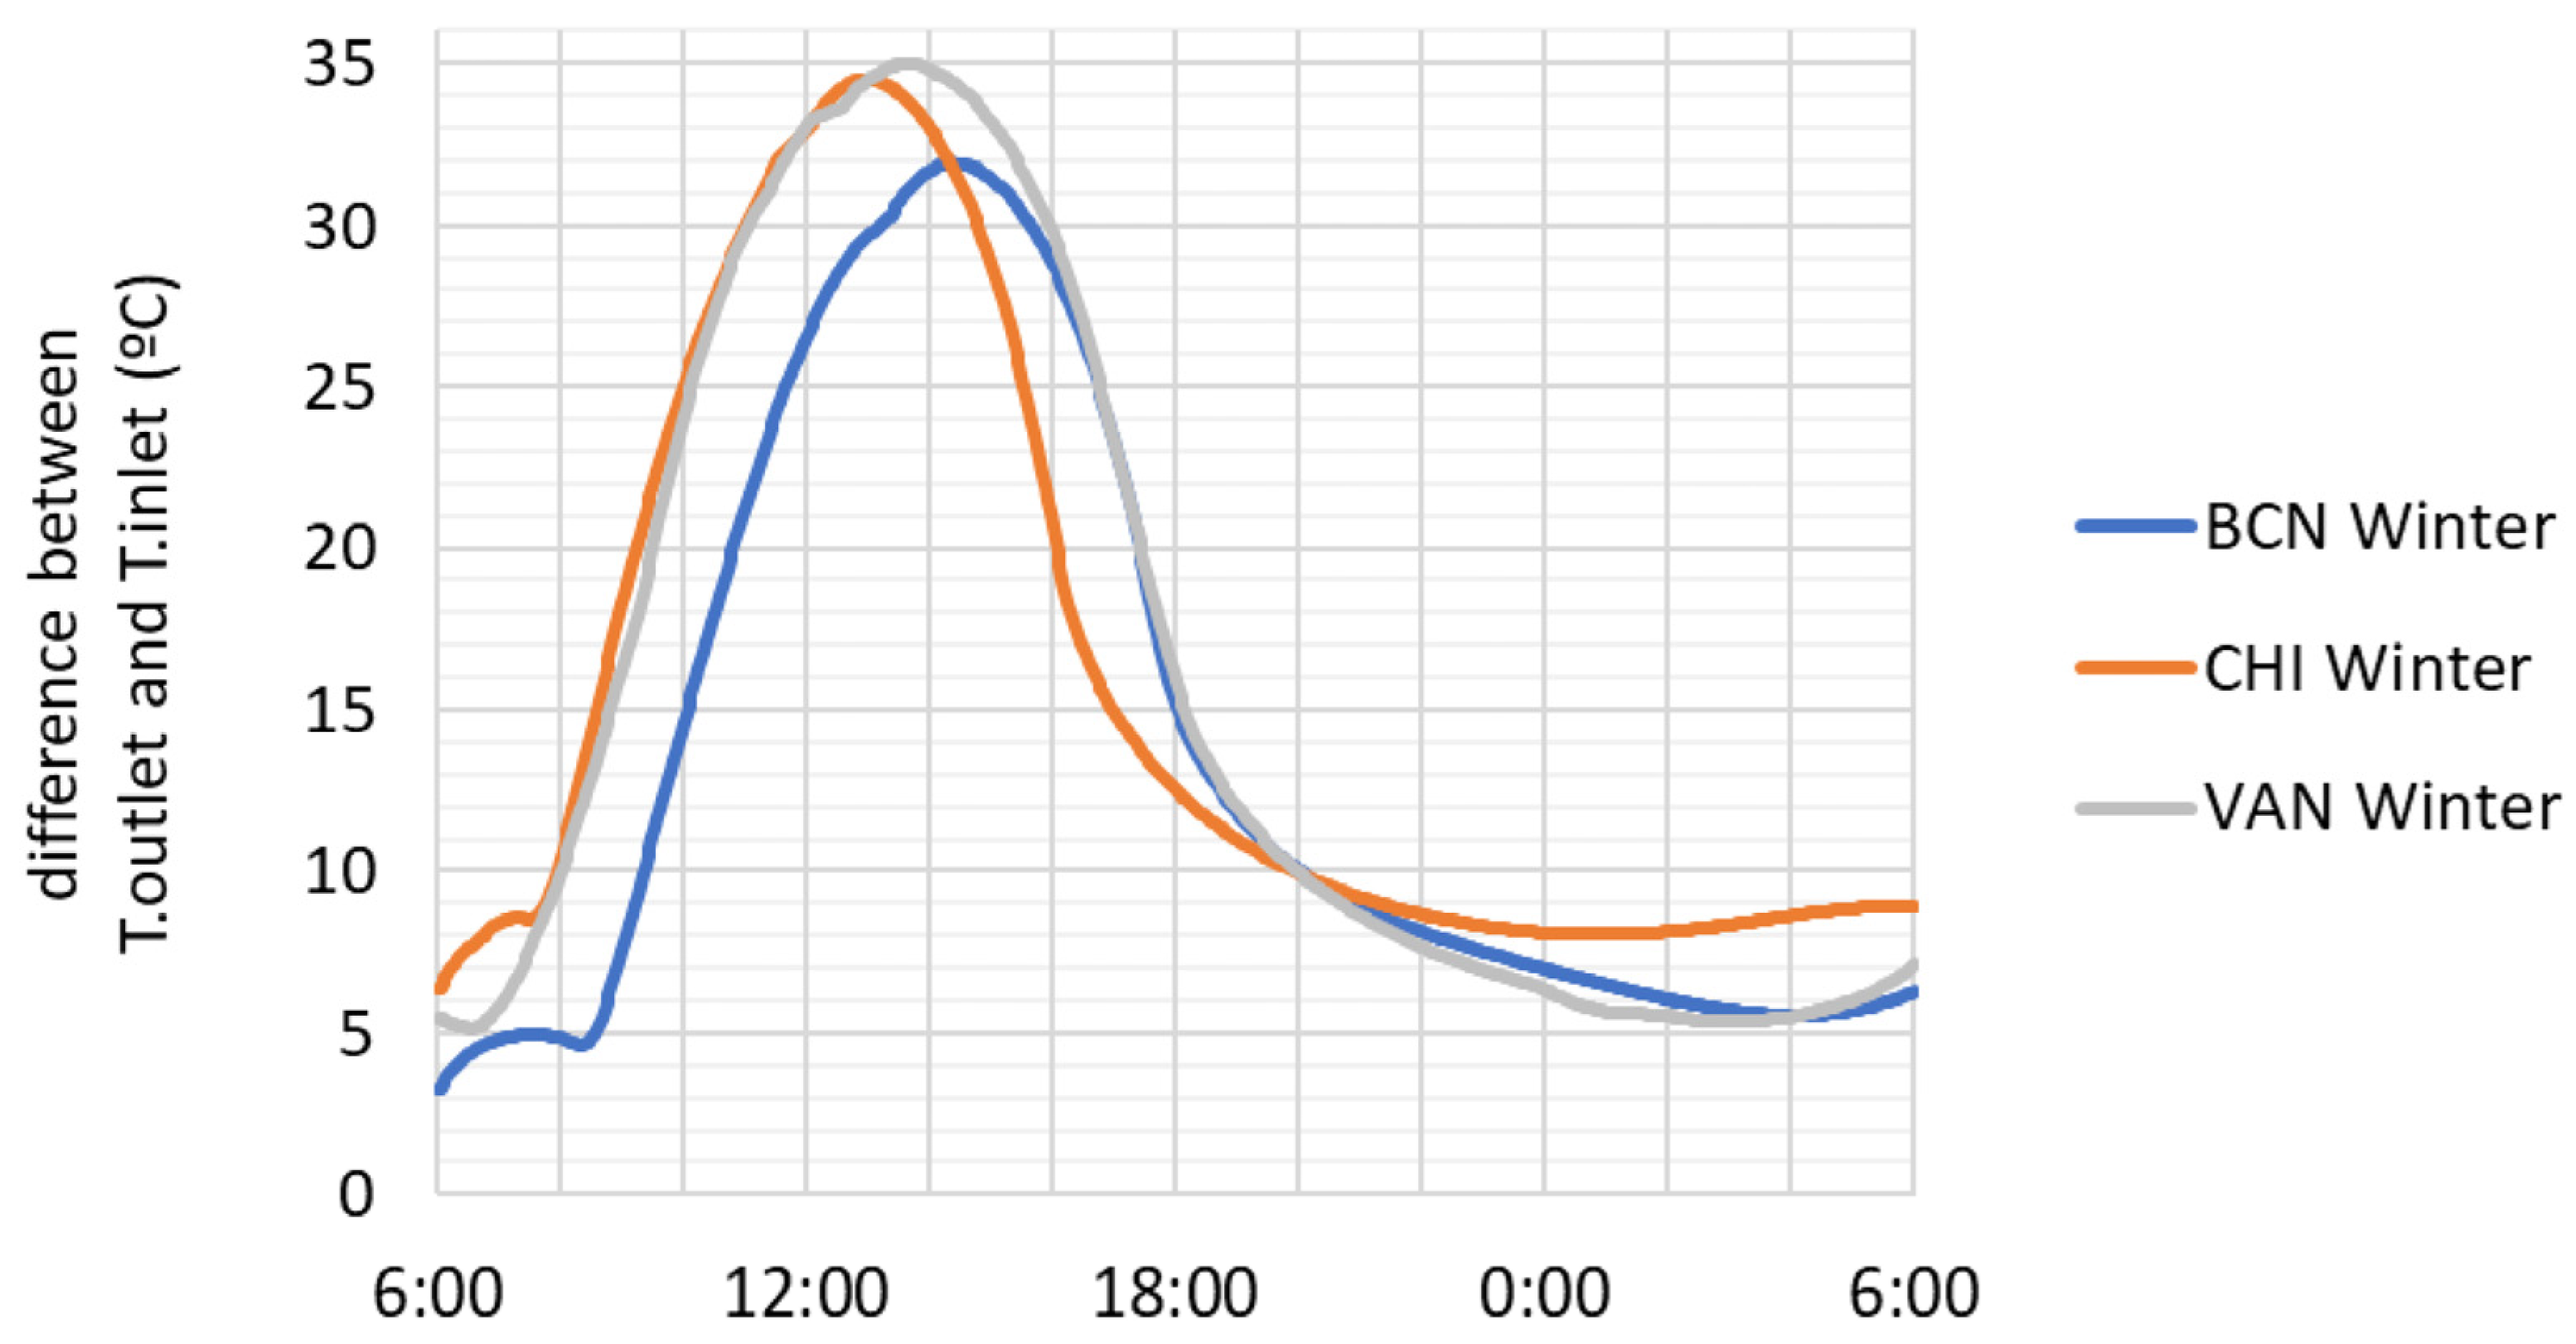
| Summer | Winter | |||||
|---|---|---|---|---|---|---|
| BCN | CHI | VAN | BCN | CHI | VAN | |
| MAX. | 25.6 °C | 27.8 °C | 30.5 °C | 31.9 °C | 34.5 °C | 35.0 °C |
| Avg. | 11.1 °C | 10.7 °C | 13.1 °C | 13.6 °C | 15.6 °C | 15.6 °C |
| min. | 1.2 °C | 0.8 °C | 3.1 °C | 3.3 °C | 6.4 °C | 5.1 °C |
| fluct. MAX–min | 24.4 °C | 27.0 °C | 27.4 °C | 28.6 °C | 28.1 °C | 29.9 °C |
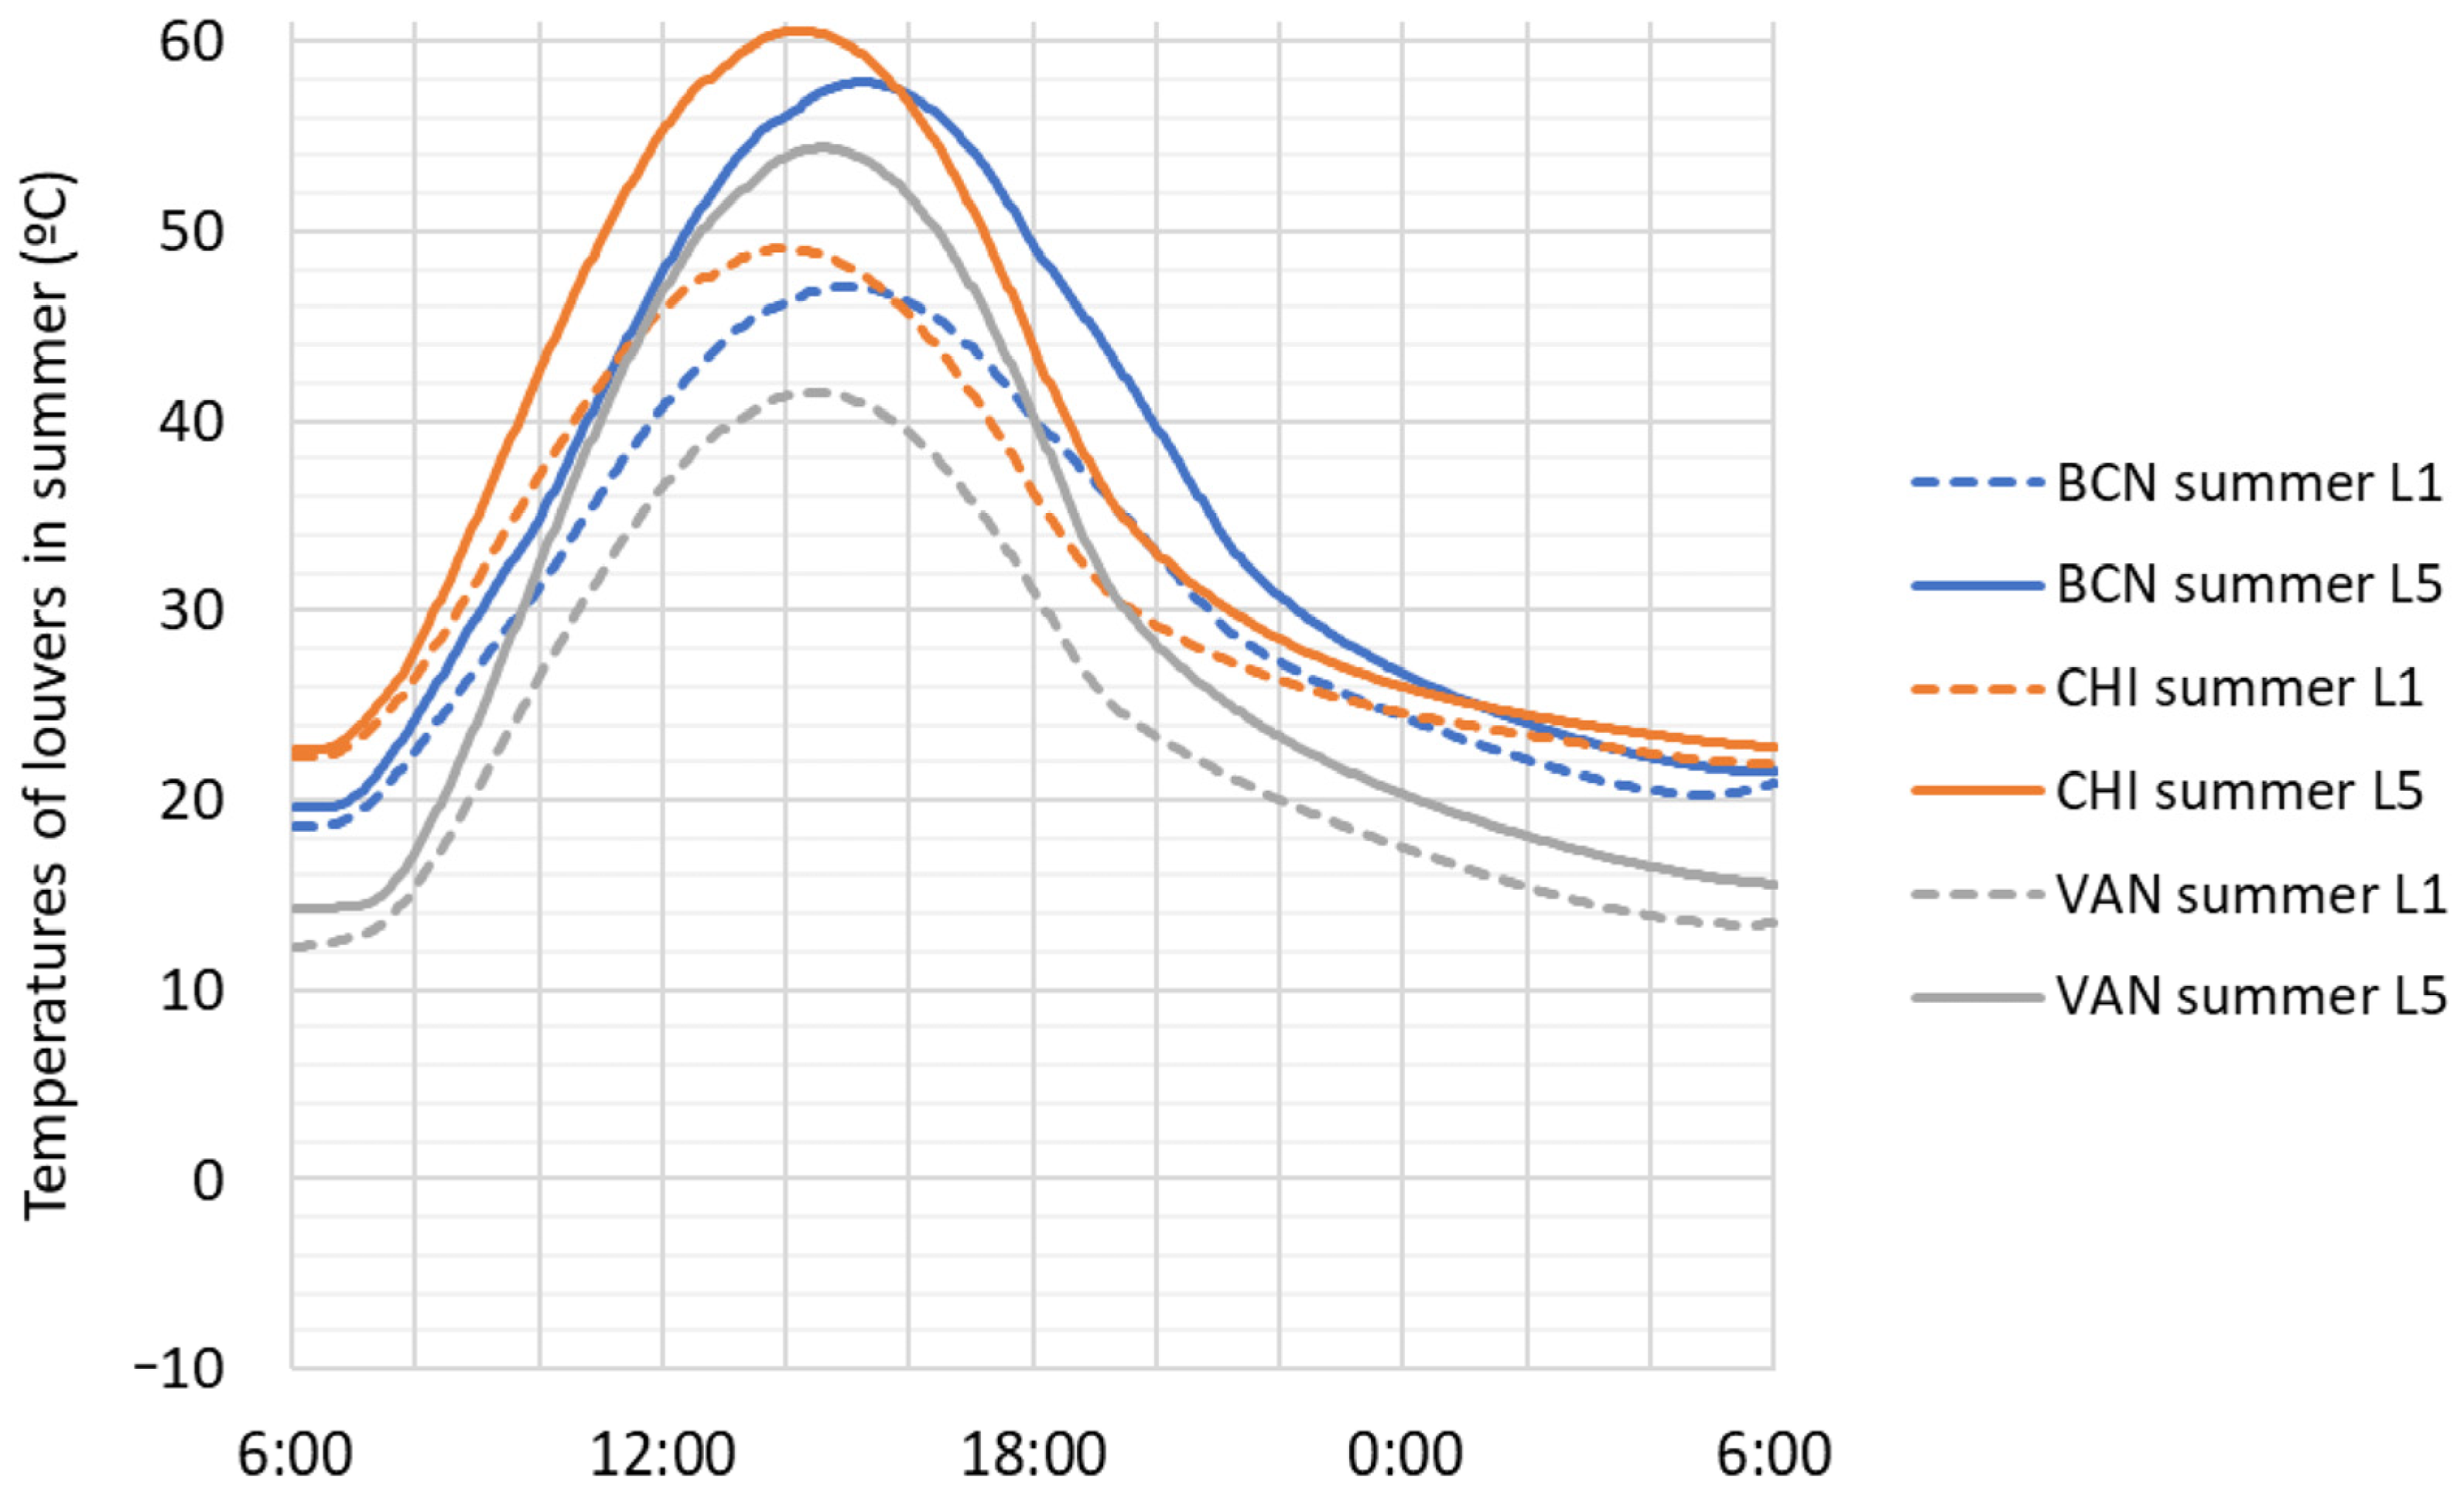
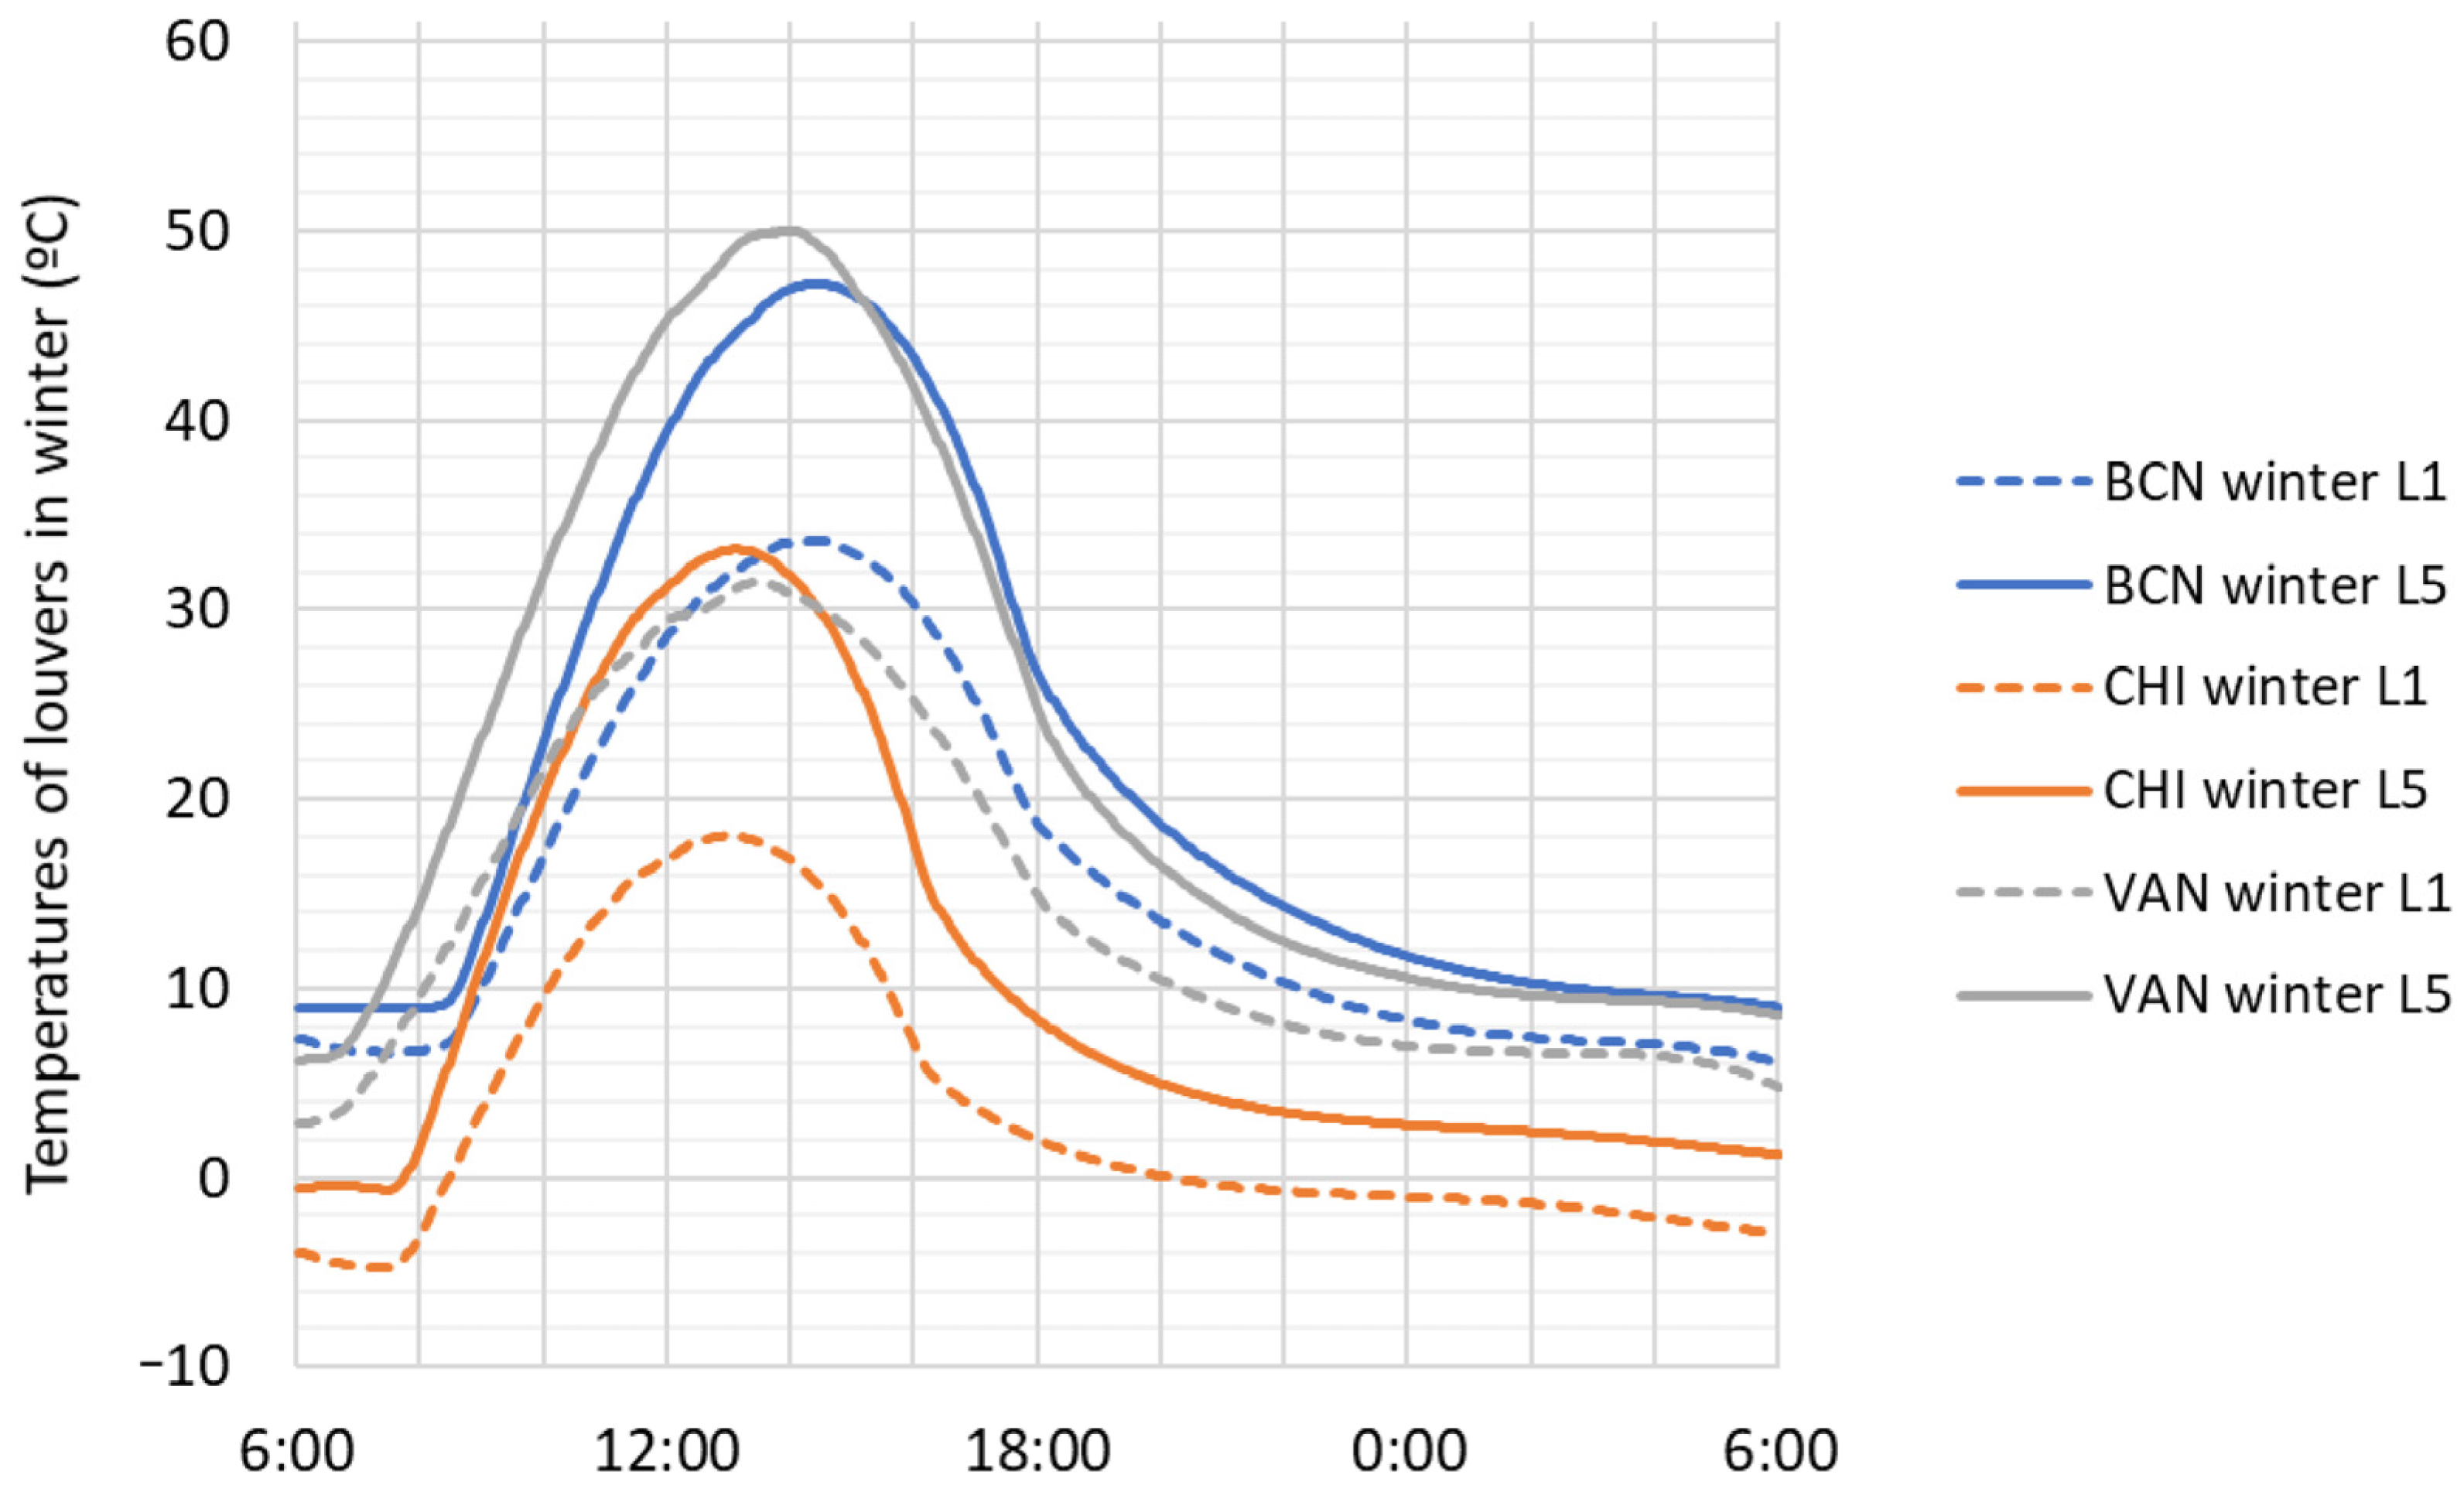
| Daily | Annual | ||||||||
|---|---|---|---|---|---|---|---|---|---|
| Summer | Winter | ||||||||
| BCN | CHI | VAN | BCN | CHI | VAN | BCN | CHI | VAN | |
| max. thermal fluctuation (°C) | 38.2 | 37.9 | 40.1 | 38.2 | 33.8 | 43.8 | 48.9 | 61.2 | 48.2 |
| thermal exp. (mm/m) | 0.9 | 0.9 | 0.9 | 0.9 | 0.8 | 1.0 | 1.2 | 1.4 | 1.1 |
Disclaimer/Publisher’s Note: The statements, opinions and data contained in all publications are solely those of the individual author(s) and contributor(s) and not of MDPI and/or the editor(s). MDPI and/or the editor(s) disclaim responsibility for any injury to people or property resulting from any ideas, methods, instructions or products referred to in the content. |
© 2023 by the authors. Licensee MDPI, Basel, Switzerland. This article is an open access article distributed under the terms and conditions of the Creative Commons Attribution (CC BY) license (https://creativecommons.org/licenses/by/4.0/).
Share and Cite
Roig, O.; Cuerva, E.; Pardal, C.; Guardo, A.; Isalgue, A.; Lopez-Besora, J. Thermal Assessment of a Ventilated Double Skin Façade Component with a Set of Air Filtering Photocatalytic Slats in the Cavity. Buildings 2023, 13, 272. https://doi.org/10.3390/buildings13020272
Roig O, Cuerva E, Pardal C, Guardo A, Isalgue A, Lopez-Besora J. Thermal Assessment of a Ventilated Double Skin Façade Component with a Set of Air Filtering Photocatalytic Slats in the Cavity. Buildings. 2023; 13(2):272. https://doi.org/10.3390/buildings13020272
Chicago/Turabian StyleRoig, Oriol, Eva Cuerva, Cristina Pardal, Alfredo Guardo, Antonio Isalgue, and Judit Lopez-Besora. 2023. "Thermal Assessment of a Ventilated Double Skin Façade Component with a Set of Air Filtering Photocatalytic Slats in the Cavity" Buildings 13, no. 2: 272. https://doi.org/10.3390/buildings13020272