
Interpretability Analysis of Convolutional Neural Networks for Crack Detection

 ,
,  and
and
Abstract
:1. Introduction
2. Interpretability of CNNs
2.1. Convolutional Neural Network Interpretation Algorithm
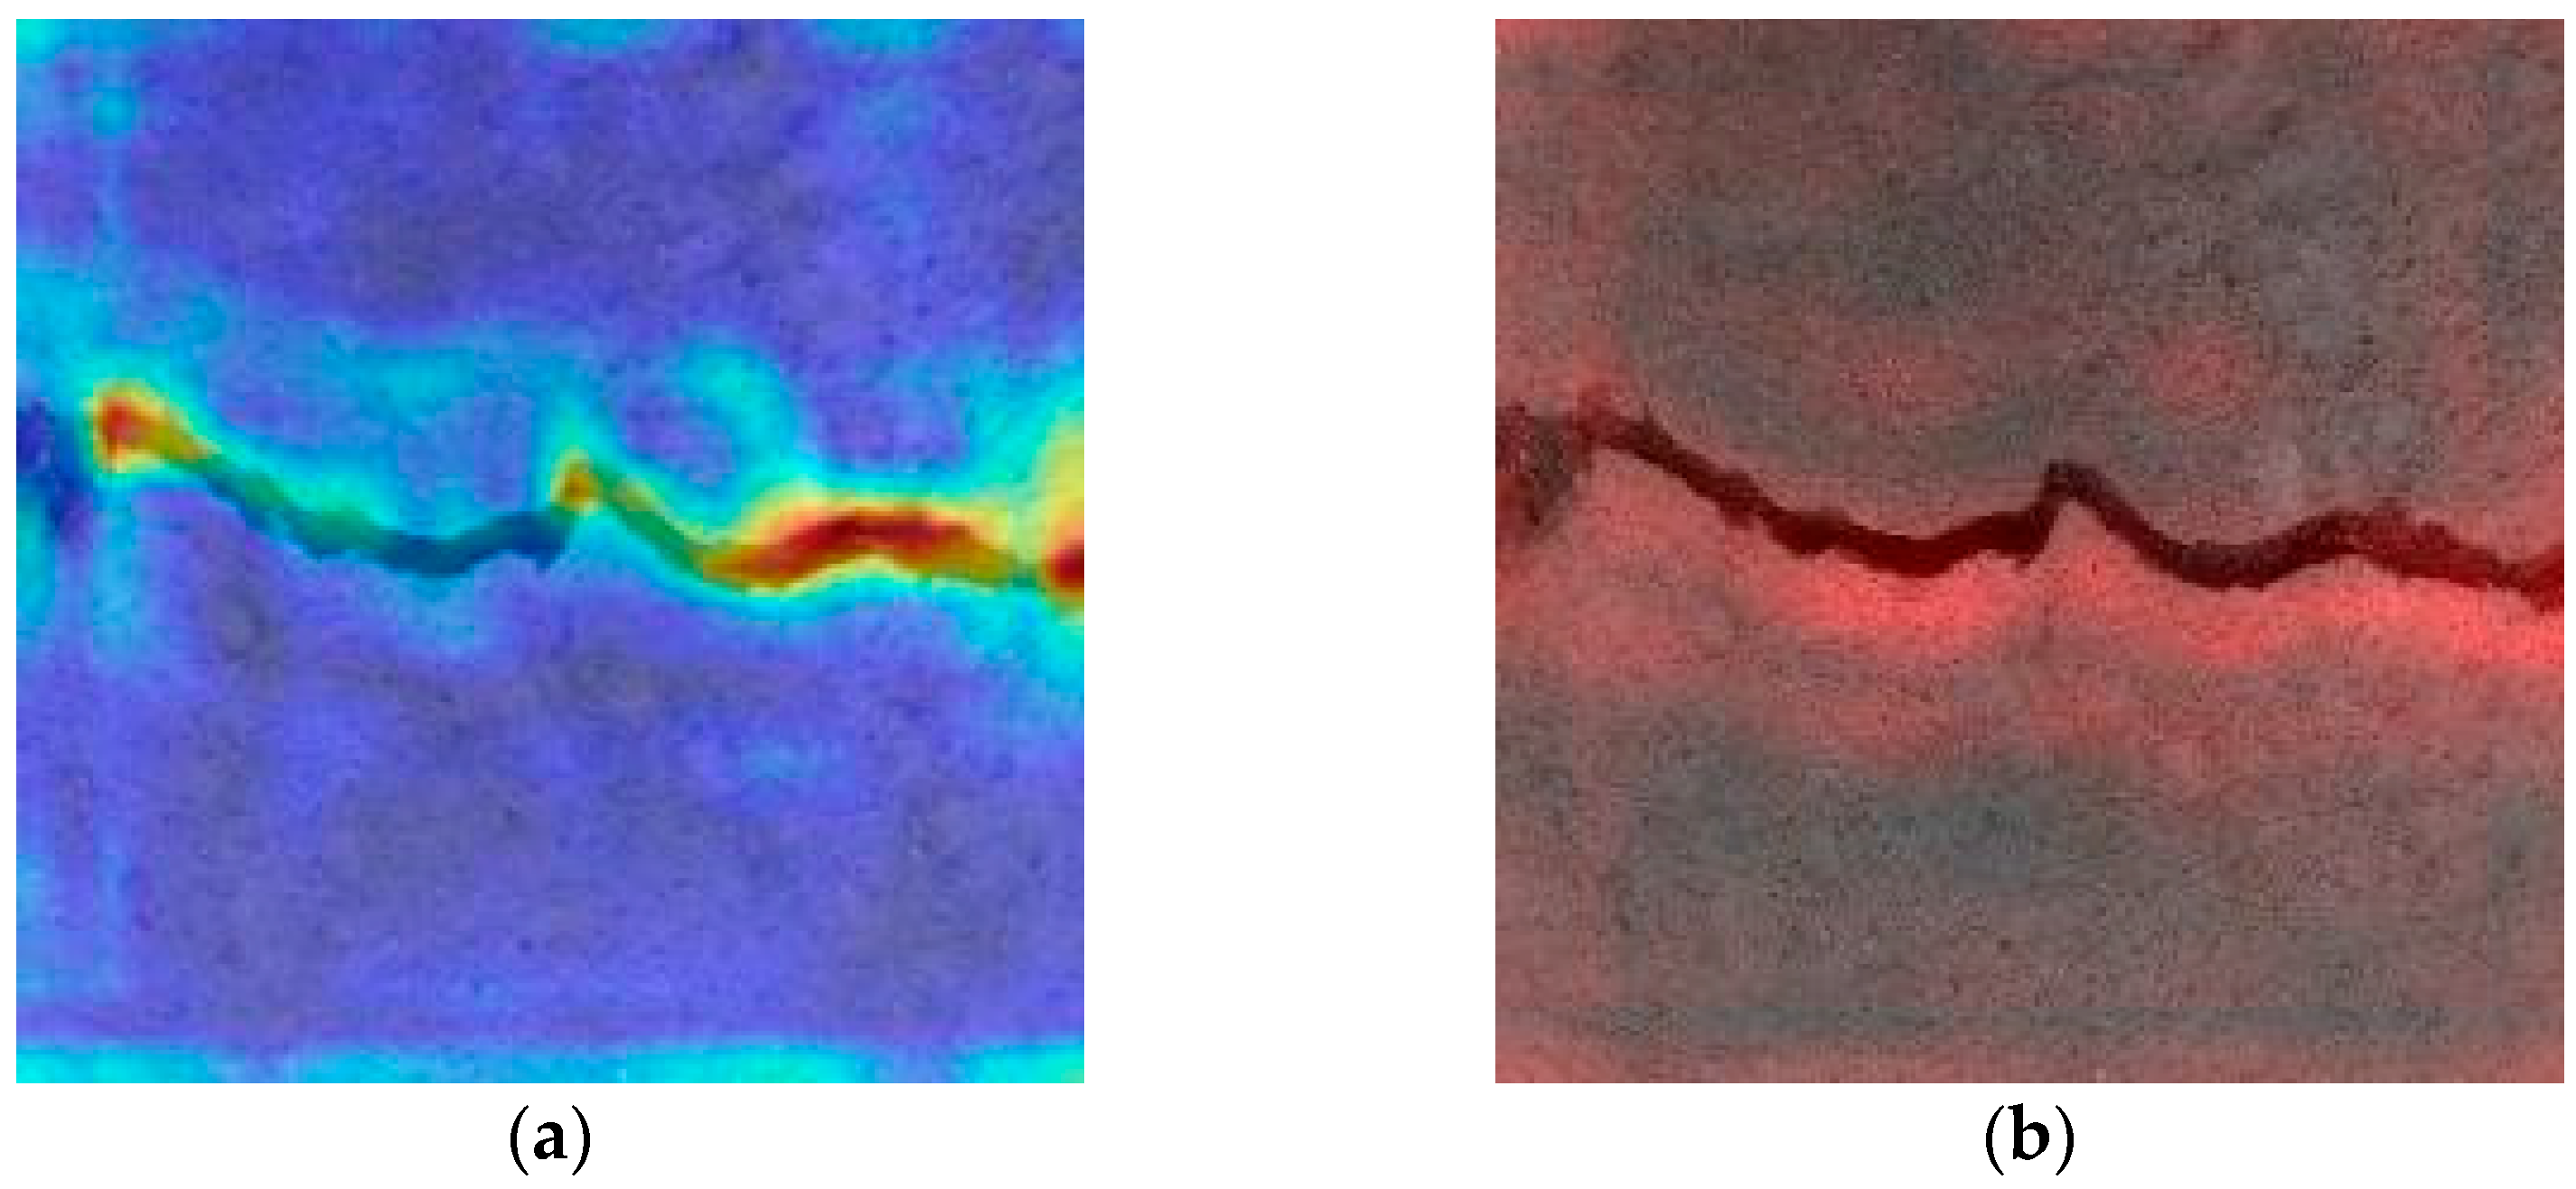
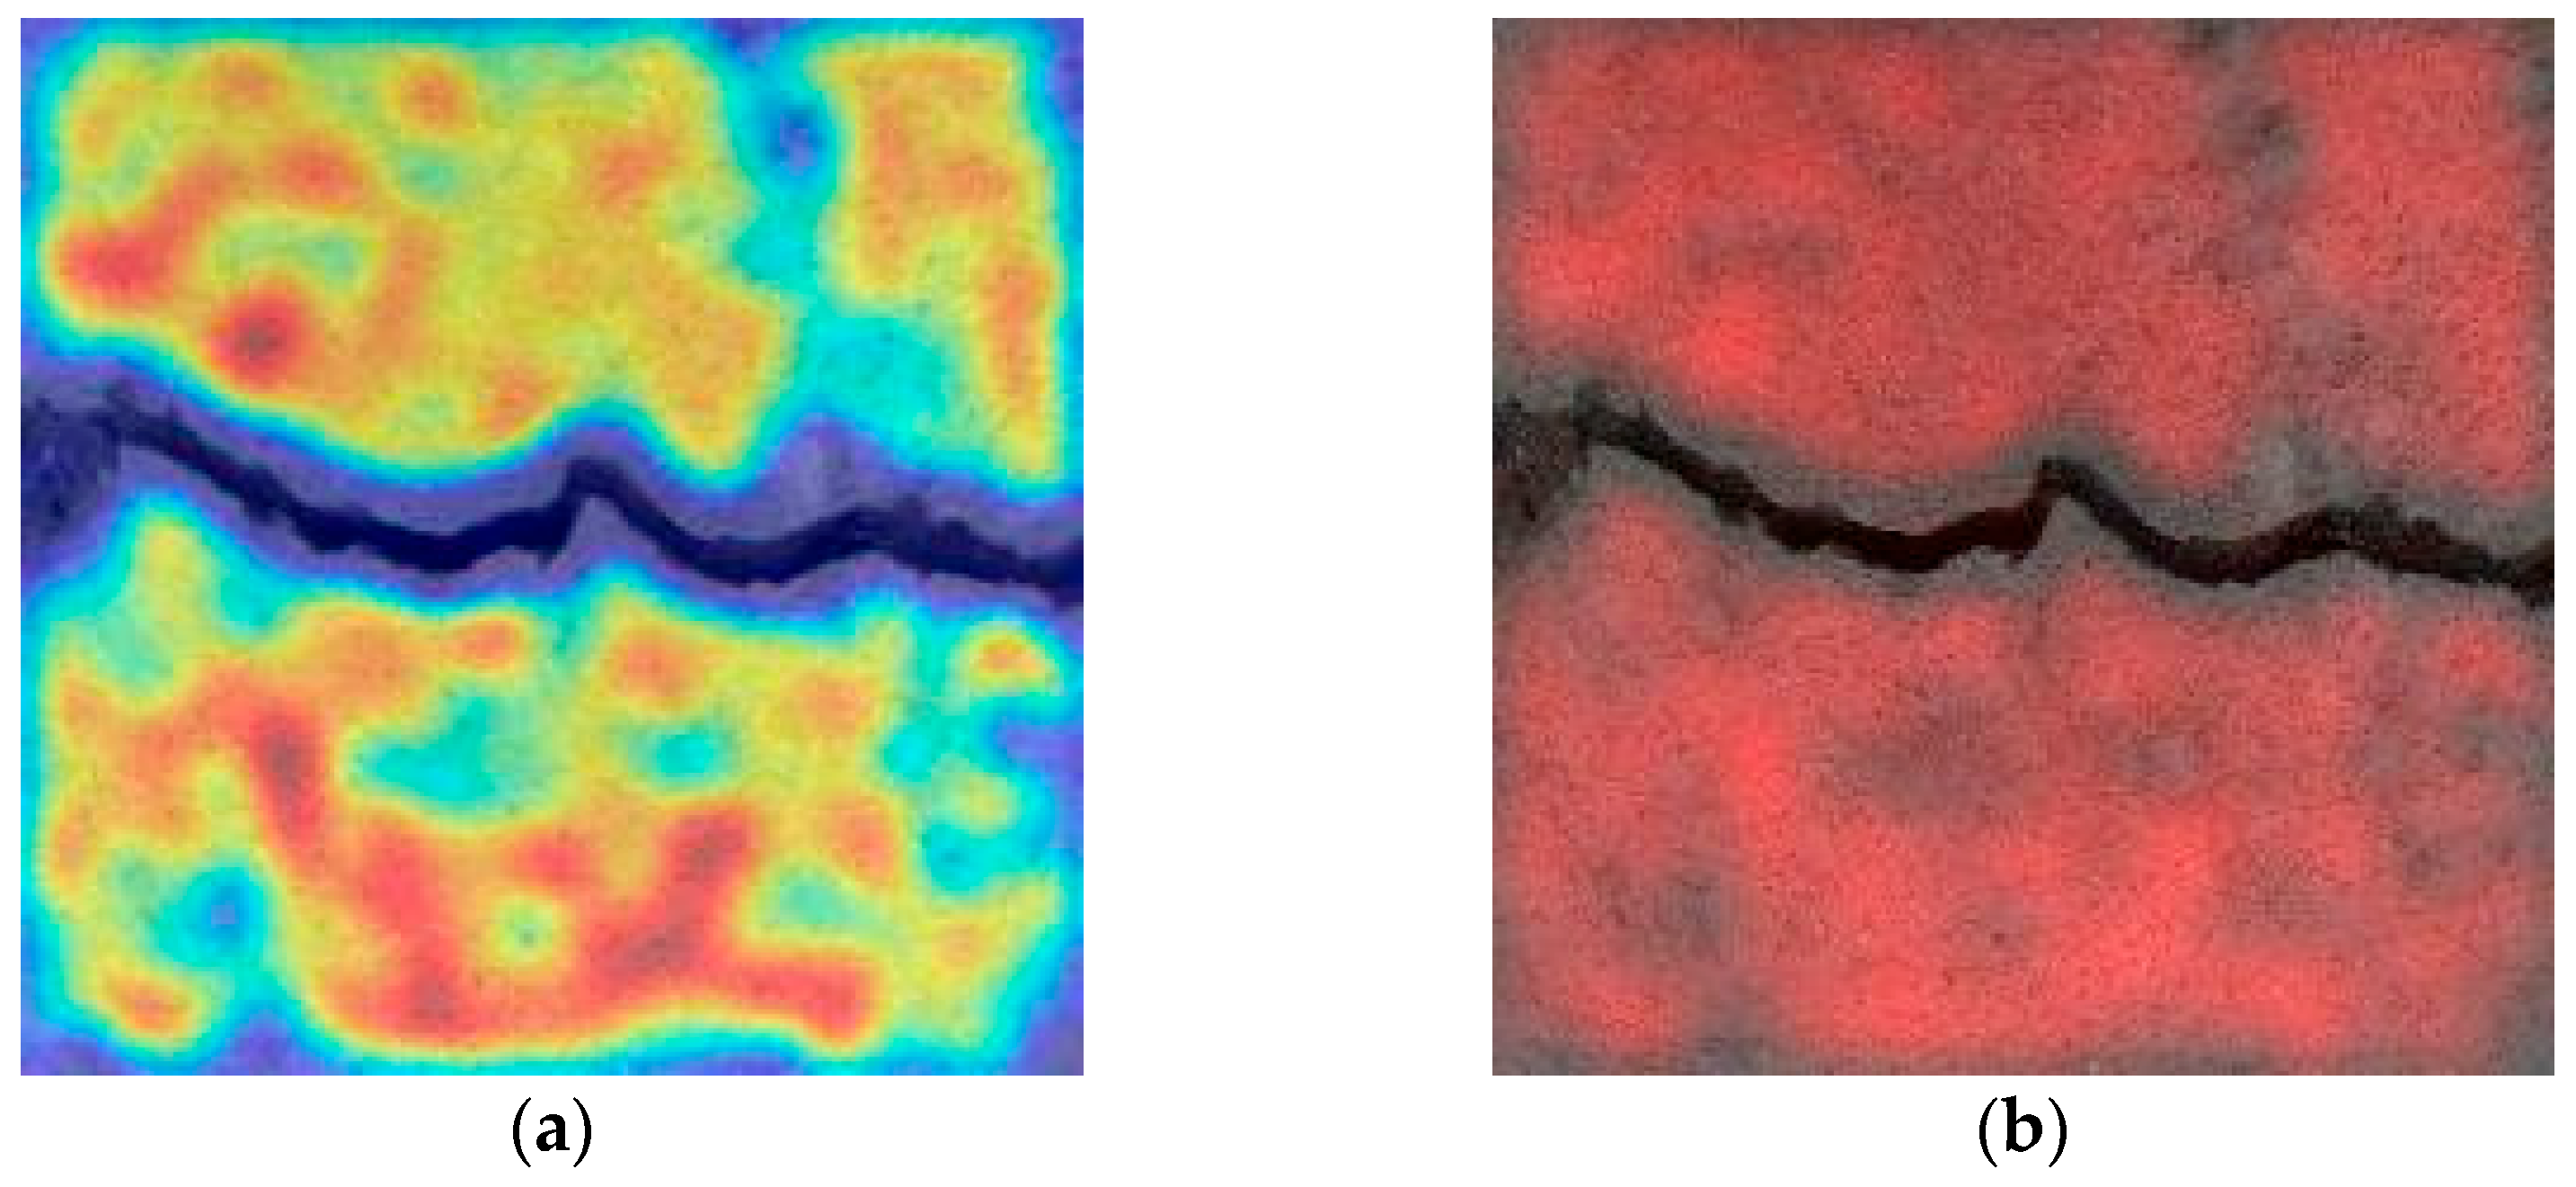
2.1.1. Grad-CAM
2.1.2. Score-CAM
3. Results
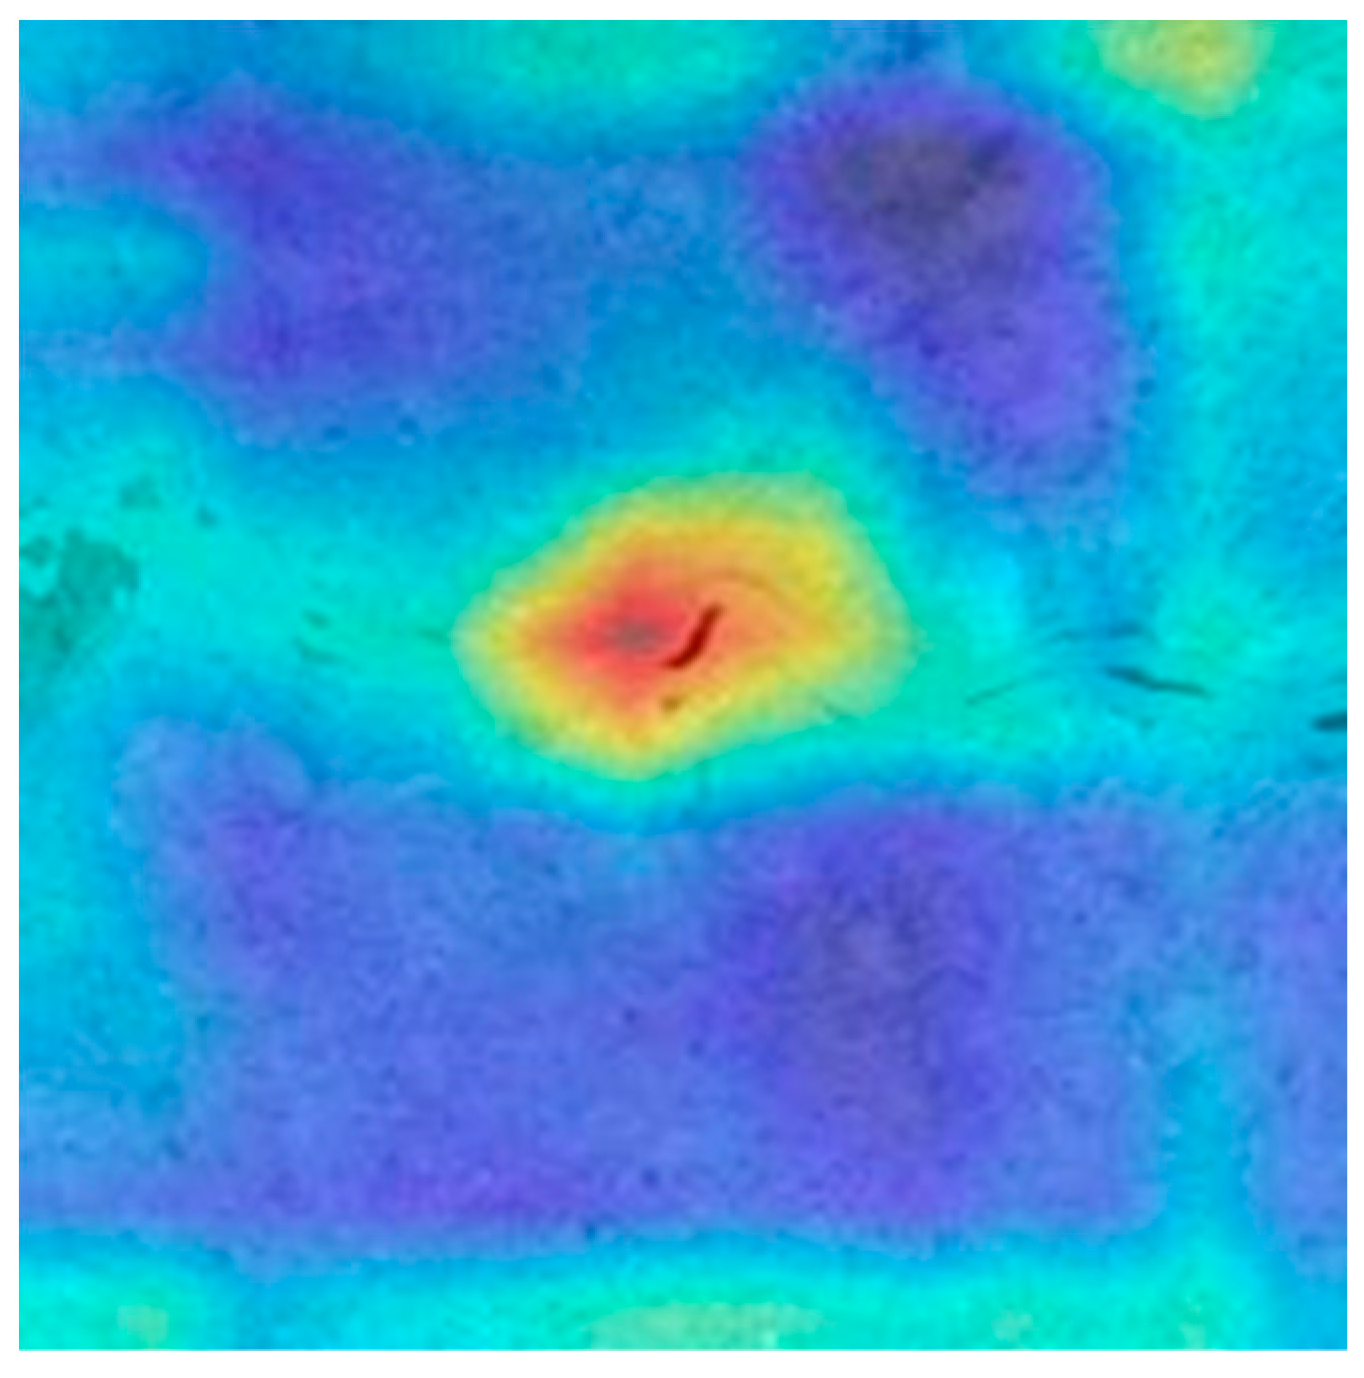
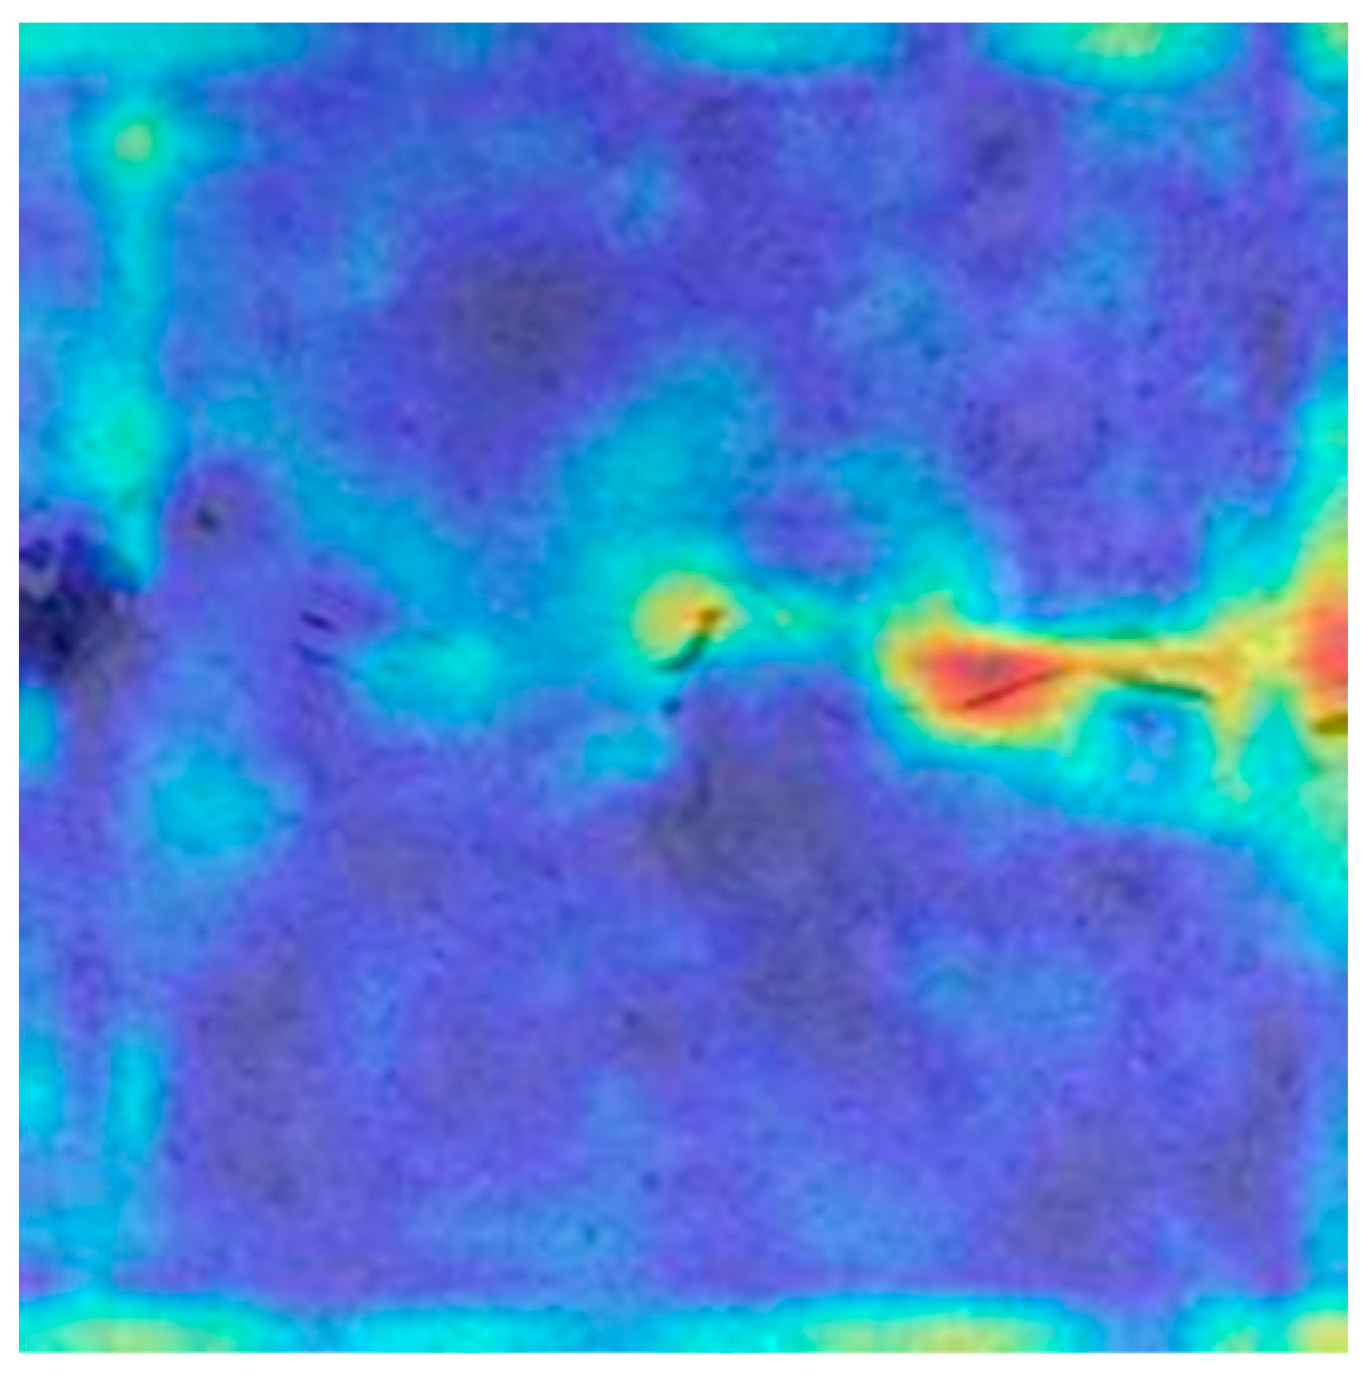
3.1. Interpretability Analysis of Convolutional Neural Networks
- (1)
- VGG16
- (2)
- VGG16_gap
- (3)
- VGG4
- (4)
- VGG4_gap
- (5)
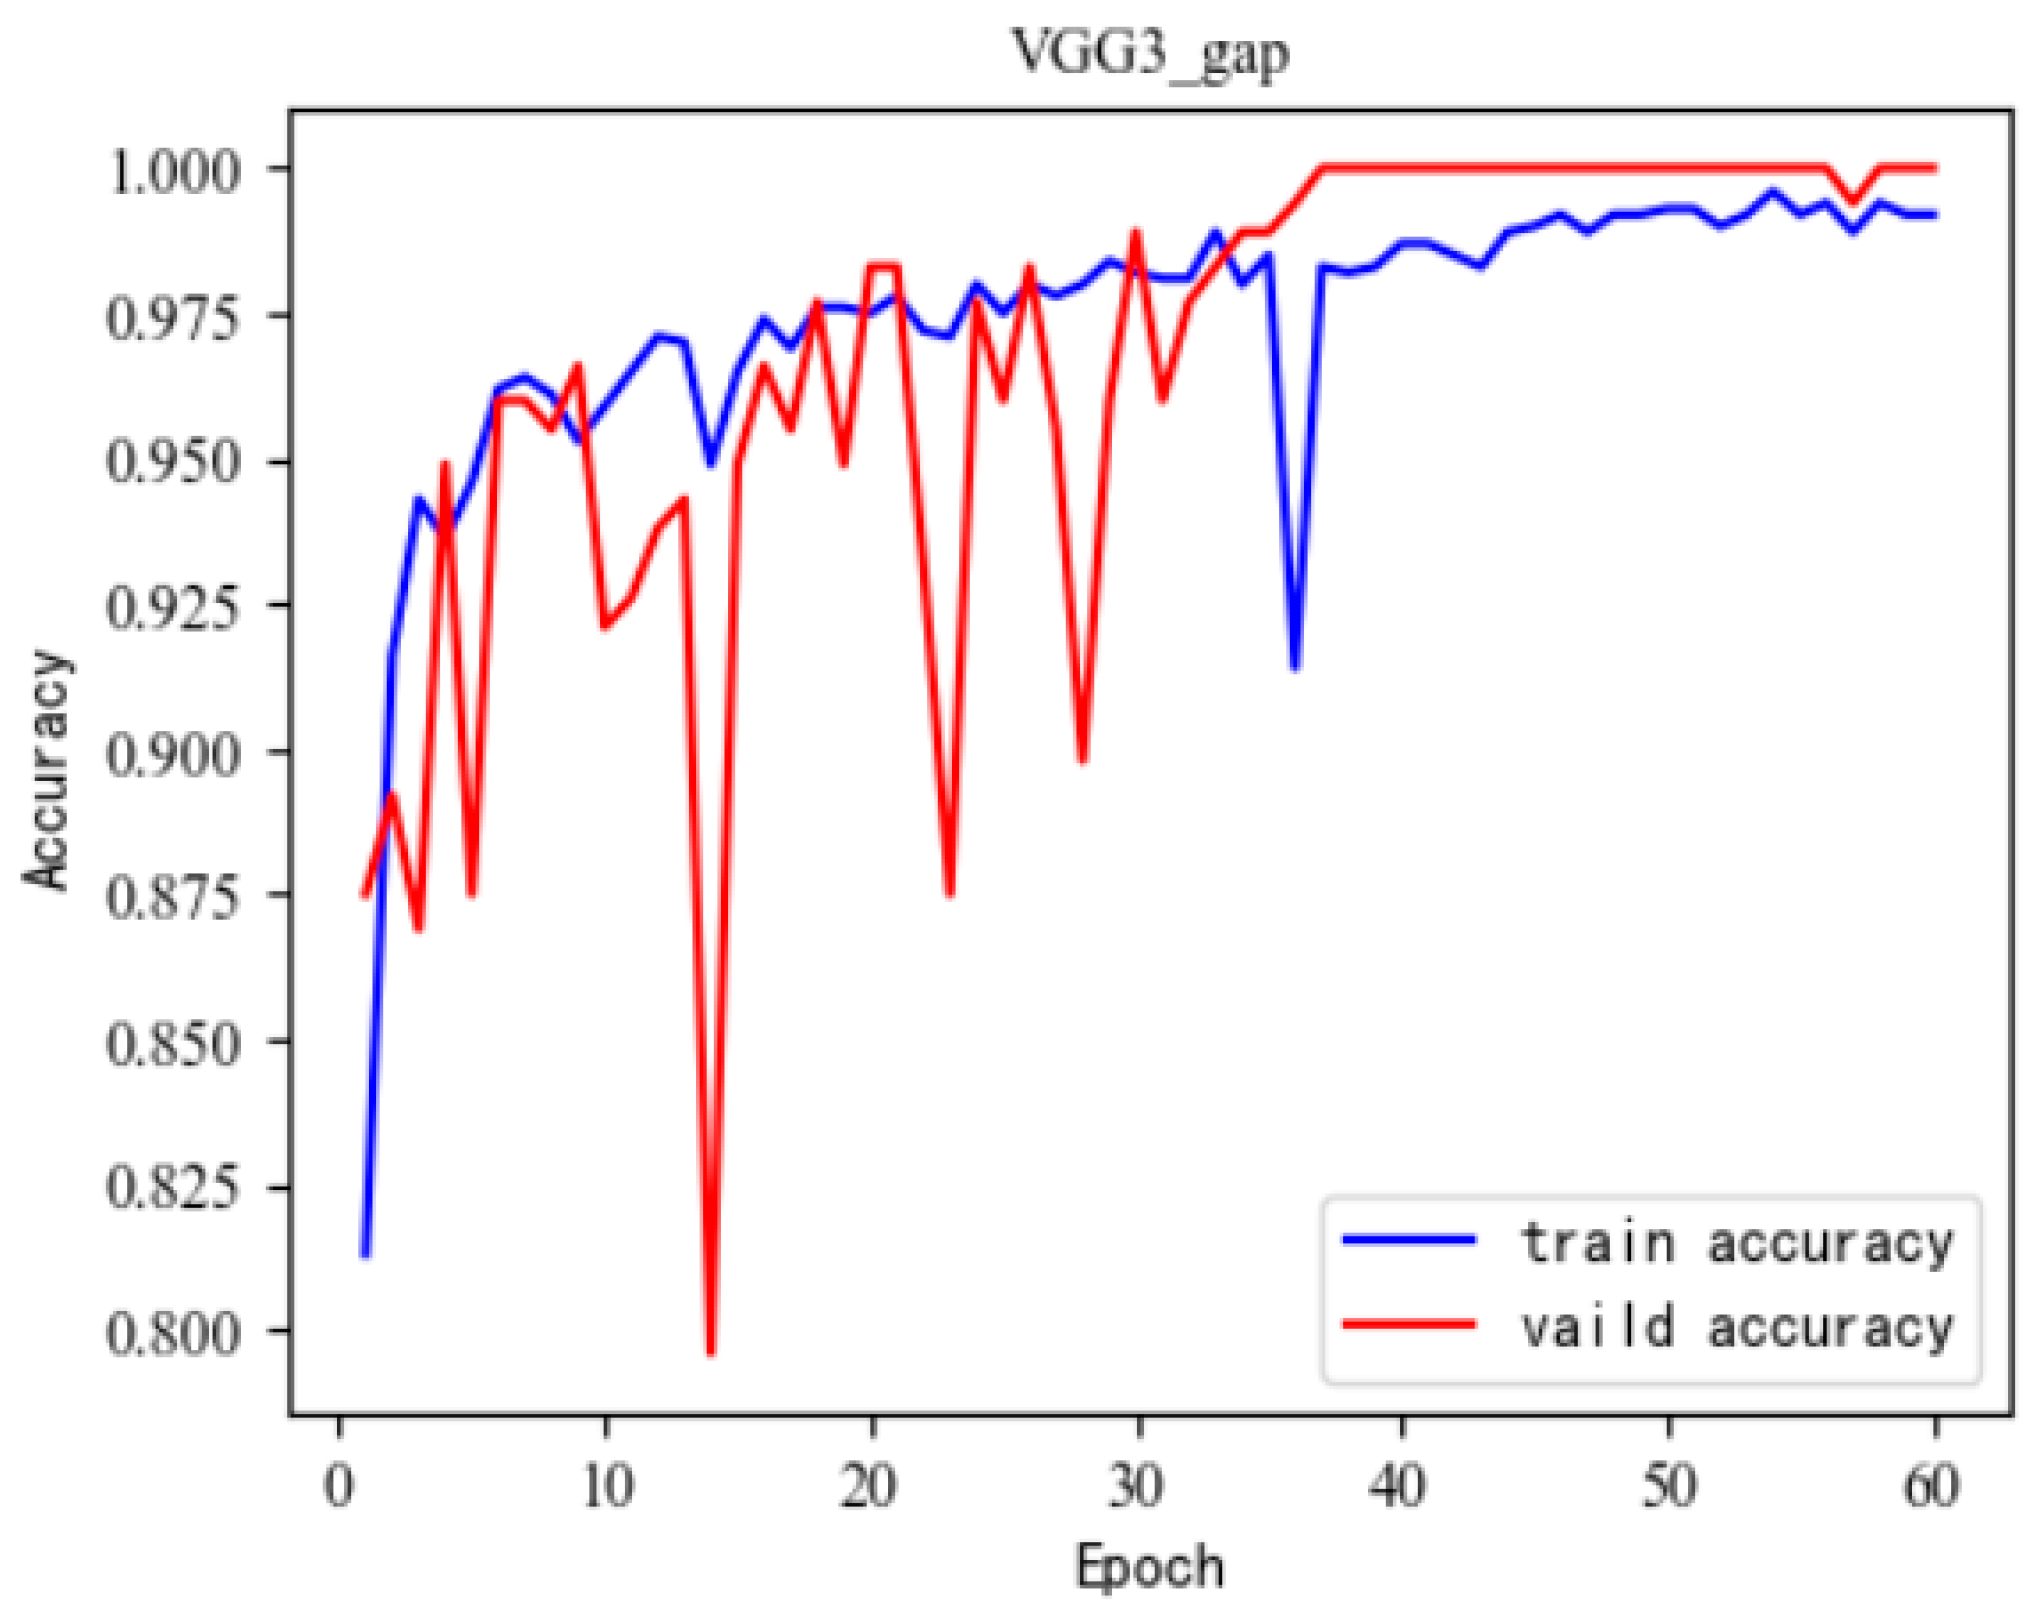
- VGG3
3.2. Optimized Training Methods
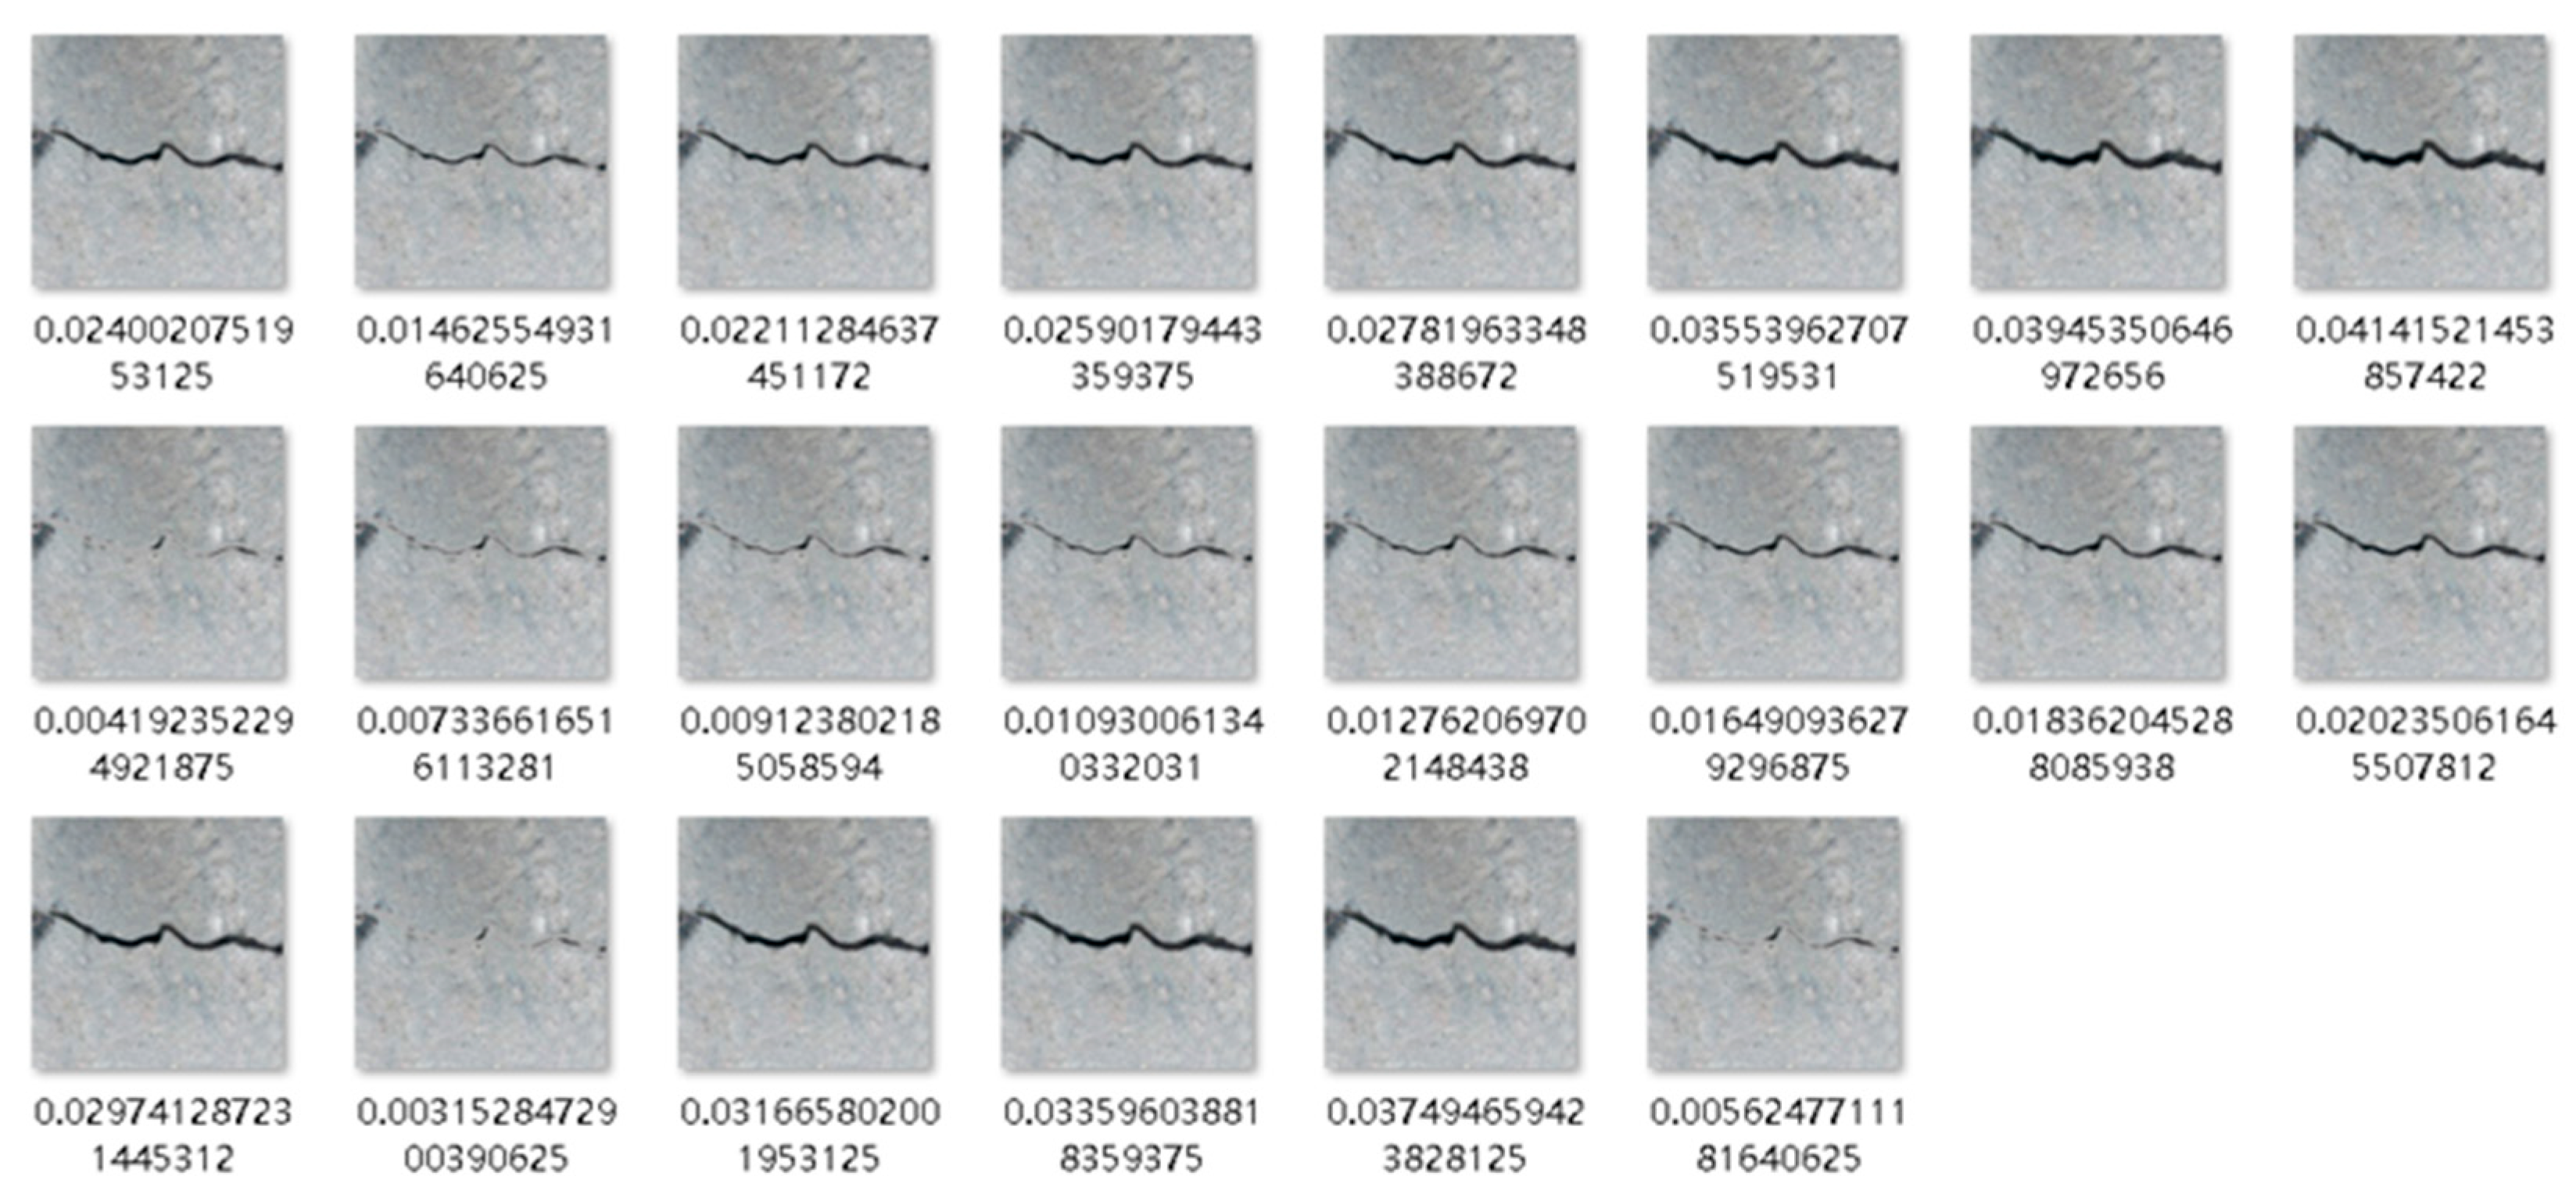
3.3. Evaluation Indicators for Crack Recognition Network Based on GradCAM
- (1)
- VGG16
- (2)
- VGG16_gap
- (3)
- VGG4
- (4)
- VGG4_gap
- (5)
- VGG3
4. Conclusions
- Some crack recognition networks have the problem of learning background features as crack features. This type of network does not have the ability to identify cracks, and direct application in engineering may cause missed identification problems, thus burying safety risks. Therefore, it is necessary to evaluate the basis for identifying cracks through the crack recognition network.
- This article proposes a solution for optimizing training methods to address the problem of network error learning features. The optimized training method first uses a small dataset with a single background to train the network’s ability to recognize crack features, and then uses a large dataset to increase the network’s generalization ability. This method successfully solved this type of problem.
- This article proposes an index based on a convolutional network interpretation algorithm to evaluate the crack recognition performance of crack detection networks based on the amount of crack information contained in the image. And based on this indicator, a calculation example was designed. Based on the analysis of the results of the calculation example, the crack recognition networks trained in this article can at least recognize small cracks that only account for 0.32% of the total image information. However, the VGG3 network’s recognition ability for small cracks in the image is not as good as that of other networks, possibly due to the lack of a convolutional block in VGG3 compared to other networks and partial feature loss caused by using global average pooling.
Author Contributions
Funding
Institutional Review Board Statement
Informed Consent Statement
Data Availability Statement
Conflicts of Interest
References
- Tao, X.; Hou, W.; Xu, D. A survey of surface defect detection methods based on deep learning. Acta Autom. Sin. 2021, 47, 1017–1034. [Google Scholar]
- He, S.; Wang, A.; Zhu, Z.; Zhao, Y. Research Progress on Intelligent Detection Technologies of Highway Bridges. China J. Highw. Transp. 2021, 34, 12–24. [Google Scholar]
- Wang, L.; Wang, Q.; Zhu, Z.; Zhao, Y. Current Status and Prospects of Research on Bridge Health Monitoring Technology. China J. Highw. Transp. 2021, 34, 26–45. [Google Scholar]
- Lin, M.; Chen, Q.; Yan, S. Network in Network. arXiv 2013, arXiv:1312.4400. [Google Scholar]
- Krizhevsky, A.; Sutskever, I.; Hinton, G.E. Imagenet classification with deep convolutional neural networks. Commun. ACM 2017, 60, 84–90. [Google Scholar] [CrossRef]
- He, K.; Zhang, X.; Ren, S.; Sun, J. Deep Residual Learning for Image Recognition. In Proceedings of the 2016 IEEE Conference on Computer Vision and Pattern Recognition (CVPR), Las Vegas, NV, USA, 27–30 June 2016. [Google Scholar]
- Howard, A.G.; Zhu, M.; Chen, B.; Kalenichenko, D.; Wang, W.; Weyand, T.; Andreetto, M.; Adam, H. MobileNets: Efficient Convolutional Neural Networks for Mobile Vision Applications. arXiv 2017, arXiv:1704.04861. [Google Scholar]
- Sandler, M.; Howard, A.; Zhu, M.; Zhmoginov, A.; Chen, L.-C. MobileNetV2: Inverted Residuals and Linear Bottlenecks. In Proceedings of the 2018 IEEE/CVF Conference on Computer Vision and Pattern Recognition (CVPR), Salt Lake City, UT, USA, 18–23 June 2018. [Google Scholar]
- Howard, A.; Sandler, M.; Chen, B.; Wang, W.; Chen, L.-C.; Tan, M.; Chu, G.; Vasudevan, V.; Zhu, Y.; Pang, R.; et al. Searching for MobileNetV3. In Proceedings of the 2019 IEEE/CVF International Conference on Computer Vision (ICCV), Seoul, Republic of Korea, 27 October–2 November 2019. [Google Scholar]
- Silva, W.; Lucena, D. Concrete Cracks Detection Based on Deep Learning Image Classification. Proceedings 2018, 2, 489. [Google Scholar]
- Xu, H.; Su, X.; Wang, Y.; Cai, H.; Cui, K.; Chen, X. Automatic Bridge Crack Detection Using a Convolutional Neural Network. Appl. Sci. 2019, 9, 2867. [Google Scholar] [CrossRef]
- Cha, Y.J.; Choi, W.; Suh, G.; Mahmoudkhani, S.; Büyüköztürk, O. Autonomous Structural Visual Inspection Using Region based Deep Learning for Detecting Multiple Damage Types. Comput. Aided Civ. Infrastruct. Eng. 2018, 33, 731–747. [Google Scholar] [CrossRef]
- Liu, Y.; Yao, J.; Lu, X.; Mahmoudkhani, G.; Buyukozturk, O. DeepCrack: A Deep Hierarchical Feature Learning Architecture for Crack Segmentation. Neurocomputing 2019, 338, 139–153. [Google Scholar] [CrossRef]
- Fan, Z.; Li, C.; Chen, Y.; Wei, J.; Loprencipe, G.; Chen, X.; Di Mascio, P. Automatic crack detection on road pavements using encoder-decoder architecture. Materials 2020, 13, 2960–2974. [Google Scholar] [CrossRef] [PubMed]
- Knig, J.; Jenkins, M.D.; Mannion, M.; Barrie, P.; Morison, G. Optimized deep encoder-decoder meethods for crack segmentation. Digit. Signal Process. 2021, 108, 102907. [Google Scholar] [CrossRef]
- Sattar, D.; Thomas, R.J.; Marc, M. Comparison of deep convolutional neural networks and edge detectors for image-based crack detection in concrete. Constr. Build. Mater. 2018, 186, 1031–1045. [Google Scholar]
- Gopalakrishnan, K.; Khaitan, S.K.; Choudhary, A.; Agrawal, A. Deep Convolutional Neural Networks with transfer learning for computer vision-based data-driven pavement distress detection. Constr. Build. Mater. 2017, 157, 322–330. [Google Scholar] [CrossRef]
- Geetha, G.K.; Sim, S.H. Fast identification of concrete cracks using 1D deep learning and explainable artificial intelligence-based analysis. Autom. Constr. 2022, 143, 104572. [Google Scholar] [CrossRef]
- Cardellicchil, A.; Ruggieri, S.; Nettis, A.; Renò, V.; Uva, G. Physical interpretation of machine learning-based recognition of defects for the risk management of existing bridge heritage. Eng. Fail. Anal. 2023, 149, 107237. [Google Scholar] [CrossRef]
- Kavitha, S.; Baskaran, K.; Dhanapriya, B. Explainable AI for Detecting Fissures on Concrete Surfaces Using Transfer Learning. In Proceedings of the 2023 International Conference on Inventive Computation Technologies (ICICT), Lalitpur, Nepal, 26–28 April 2023; pp. 376–384. [Google Scholar]
- Luigs, H.G.T.; Mahlein, A.K.; Kersting, K. Making deep neural networks right for the right scientific reasons by interacting with their explanations. Nat. Mach. Intell. 2020, 2, 476–486. [Google Scholar]
- Zech, J.R.; Badgeley, M.A.; Liu, M.; Costa, A.B.; Titano, J.J.; Oermann, E.K. Variable generalization performance of a deep learning model to detect pneumonia in chest radiographs: A cross-sectional study. PLoS Med. 2018, 15, e1002683. [Google Scholar] [CrossRef]
- Badgeley, M.A.; Zech, J.R.; Oakden-Rayner, L.; Gilcksberg, B.S.; Liu, M.; Gale, W.; Mcconnell, M.V.; Percha, B.; Snyder, T.M.; Dudley, J.T. Deep learning predicts hip fracture using confounding patient and healthcare variables. NPJ Digit. Med. 2019, 2, 31. [Google Scholar] [CrossRef]
- Hamamoto, R.; Suvarna, K.; Yamada, M.; Kobayashi, K.; Shinkai, N.; Miyake, M.; Takahashi, M.; Jinnai, S.; Shimoyama, R.; Sakai, A.; et al. Application of Artificial Intelligence Technology in Oncology: Towards the Establishment of Precision Medicine. Cancers 2020, 12, 3532. [Google Scholar] [CrossRef]
- Dou, H.; Zhang, L.; Han, F.; Shen, F.; Zhao, J. Survey on Convolutional Neural Network Interpretability. J. Softw. Available online: http://www.jos.org.cn/1000-9825/6758.htm (accessed on 28 December 2020).
- Piano, S.L. Ethical principles in machine learning and artificial intelligence: Cases from the field and possible ways forward. Humanit. Soc. Sci. Commun. 2020, 7, 1–7. [Google Scholar] [CrossRef]
- Brundage, M.; Avin, S.; Wang, J.; Belfield, H.; Krueger, G.; Hadfield, G.; Khlaaf, H.; Yang, J.; Toner, H.; Fong, R.; et al. Toward Trustworthy AI Development: Mechanisms for Supporting Verifiable Claims. arXiv 2020, arXiv:2004.07213. [Google Scholar]
- Selvaraju, R.R.; Cogswell, M.; Das, A.; Vedantam, R.; Parikh, D.; Batra, D. Grad-CAM: Visual Explanations from Deep Networks via Gradient-Based Localization. arXiv 2016, arXiv:1610.02391. [Google Scholar]
- Wang, H.; Wang, Z.; Du, M.; Yang, F.; Zhang, Z.; Ding, S.; Mardziel, P.; Hu, X. Score-CAM: Score-Weighted Visual Explanations for Convolutional Neural Networks. arXiv 2019, arXiv:1910.01279. [Google Scholar]


| Accuracy | Recall | |
|---|---|---|
| VGG16 | 98.7% | 98.2% |
| VGG16_gap | 99.7% | 100% |
| VGG4 | 100% | 100% |
| VGG4_gap | 99.7% | 100% |
| VGG3 | 100% | 100% |
Disclaimer/Publisher’s Note: The statements, opinions and data contained in all publications are solely those of the individual author(s) and contributor(s) and not of MDPI and/or the editor(s). MDPI and/or the editor(s) disclaim responsibility for any injury to people or property resulting from any ideas, methods, instructions or products referred to in the content. |
© 2023 by the authors. Licensee MDPI, Basel, Switzerland. This article is an open access article distributed under the terms and conditions of the Creative Commons Attribution (CC BY) license (https://creativecommons.org/licenses/by/4.0/).
Share and Cite
Wu, J.; He, Y.; Xu, C.; Jia, X.; Huang, Y.; Chen, Q.; Huang, C.; Dadras Eslamlou, A.; Huang, S. Interpretability Analysis of Convolutional Neural Networks for Crack Detection. Buildings 2023, 13, 3095. https://doi.org/10.3390/buildings13123095
Wu J, He Y, Xu C, Jia X, Huang Y, Chen Q, Huang C, Dadras Eslamlou A, Huang S. Interpretability Analysis of Convolutional Neural Networks for Crack Detection. Buildings. 2023; 13(12):3095. https://doi.org/10.3390/buildings13123095
Chicago/Turabian StyleWu, Jie, Yongjin He, Chengyu Xu, Xiaoping Jia, Yule Huang, Qianru Chen, Chuyue Huang, Armin Dadras Eslamlou, and Shiping Huang. 2023. "Interpretability Analysis of Convolutional Neural Networks for Crack Detection" Buildings 13, no. 12: 3095. https://doi.org/10.3390/buildings13123095