Article

Seismic Performance Evaluation and Retrofit Strategy of Overhead Gas-Insulated Transmission Lines

1
College of Civil Engineering, Tongji University, Shanghai 200092, China
2
College of Civil Engineering, Nanjing Forestry University, Nanjing 210037, China
*
Author to whom correspondence should be addressed.
Buildings 2023, 13(12), 2968; https://doi.org/10.3390/buildings13122968
Submission received: 5 November 2023 / Revised: 20 November 2023 / Accepted: 25 November 2023 / Published: 28 November 2023

Abstract

:
The overhead gas-insulated transmission line (GIL) in ultra-high-voltage converter stations, distinct from traditional buried pipelines, demands a thorough investigation into its seismic behavior due to limitations in existing codes. A refined finite element model is established, considering internal structure, slip between various parts, and the relative displacement at the internal conductor joint. Seismic analysis reveals the vulnerability of the GIL at the corner of the pipeline height change, with two failure modes: housing strength failure and internal conductor displacement exceeding the limit. Furthermore, the acceleration amplification coefficient of the support generally exceeds 2.0. Two retrofit methods, namely increasing the fundamental frequency of all supports and fixing the connections between all supports and the housing, have been proposed. The results indicate the effectiveness of both methods in reducing the relative displacement. Fixing all the supports effectively reduces the stress, whereas the other one yields the opposite effect. The seismic performance of a GIL is determined not by the dynamic amplification of supports, but by the control of relative displacement between critical sections, specifically influenced by the angular deformation of the pipeline’s first-order translational vibration mode along the line direction. Seismic vulnerability analysis reveals a reduction of over 50% in the failure probability of the GIL after the retrofit compared to before the retrofit, with the PGA exceeding 0.4 g.

1. Introduction

A gas-insulated transmission line (GIL) is a crucial component within an ±800 kV converter power station, serving as a central connectivity hub that reliably links various functional zones, as depicted in Figure 1. In the figure, the Ⅰ and Ⅱ denote the bipolar configuration within the ultra-high voltage converter station, where bipolar operation in ultra-high voltage direct current transmission involves utilizing two DC circuits—termed positive and negative circuits—to transmit electrical energy effectively in the system. In ultra-high-voltage substations, the GIL is typically designed as an overhead pipeline to minimize space occupation and the need for extensive civil engineering work. This compact layout, combined with its substantial transmission capacity and high reliability, positions the GIL as an ideal choice for long-distance electric power transmission [1,2].
Shown in Figure 2, a GIL embodies an overhead pipeline structure that utilizes three-pillar insulators (TPIs) to establish a coaxial relationship between the internal conductor and the outer housing. The TPI not only ensures uniform distribution of the internal magnetic field, but also enables the GIL standard straight-line segment length to reach 18 m, significantly reducing installation complexity and costs. Both the outer housing and the internal conductor are constructed from aluminum, while the TPI is crafted from cast resin. The space between the outer housing and the internal conductor is filled with insulating gas, fulfilling the engineering criteria of significantly reducing equipment size and spacing.
In the face of burgeoning electricity demands and a growing reliance on long-distance GIL transmission in ultra-high-voltage converter power stations, particularly within regions prone to frequent seismic activity [3,4,5,6], it has become increasingly imperative to gain profound insights into the seismic behavior of GIL systems. At present, seismic research on pipelines mostly focuses on water [7,8,9], oil [10,11], and gas [12,13,14] pipelines, and most of them are buried pipelines [15,16,17,18,19]. The other part is for indoor small-diameter water pipes or non-structural pipes [20,21,22], which are mostly suspended pipes. Jahangiri et al. [15] assess economic seismic risks for buried steel gas pipelines, finding factors like thickness ratio, burial depth-to-diameter ratio, soil properties’ impact failure probabilities, and economic losses. Karamanos et al. [7] investigate seismic methodologies for buried steel water pipelines, emphasizing soil interaction modeling, resistance, mitigation measures, and design provisions. Sultanov et al. [18] address seismic effects on underground pipelines, proposing a wave theory-based model that highlights the significance of dynamic stress considerations. Obviously, seismic research for buried pipelines should prioritize soil conditions and pipeline–soil interaction. In the case of the GIL, an overhead system comprising supports, pipelines, and internal conductors, the emphasis is on investigating the dynamic amplification effect of supports, seismic responses of the pipeline itself, and the interior of the pipeline.
This article presents an advanced finite element model that faithfully replicates diverse connections between support, housing, and internal conductors to thoroughly investigate the seismic behavior of GILs. The study initiates by pinpointing the critical seismic response and weak positions of GILs through nonlinear time history analysis. Following this, three retrofit strategies are introduced, accompanied by an in-depth analysis of the key factors influencing GILs’ seismic performances. Ultimately, the article employs seismic vulnerability analysis to evaluate the failure probability of a GIL before and after effective retrofit at different Peak Ground Accelerations (PGAs).

2. Seismic Performance of GIL

To evaluate the seismic performance of a complex overhead pipeline structure such as a GIL, it is necessary to first clarify the structural characteristics of its various components and the different connection methods between them, and then use dynamic characteristic analysis to grasp its main vibration modes and natural frequency range. Finally, we select appropriate seismic motion records and perform seismic response calculations on the GIL to explore its key seismic responses and weak locations.

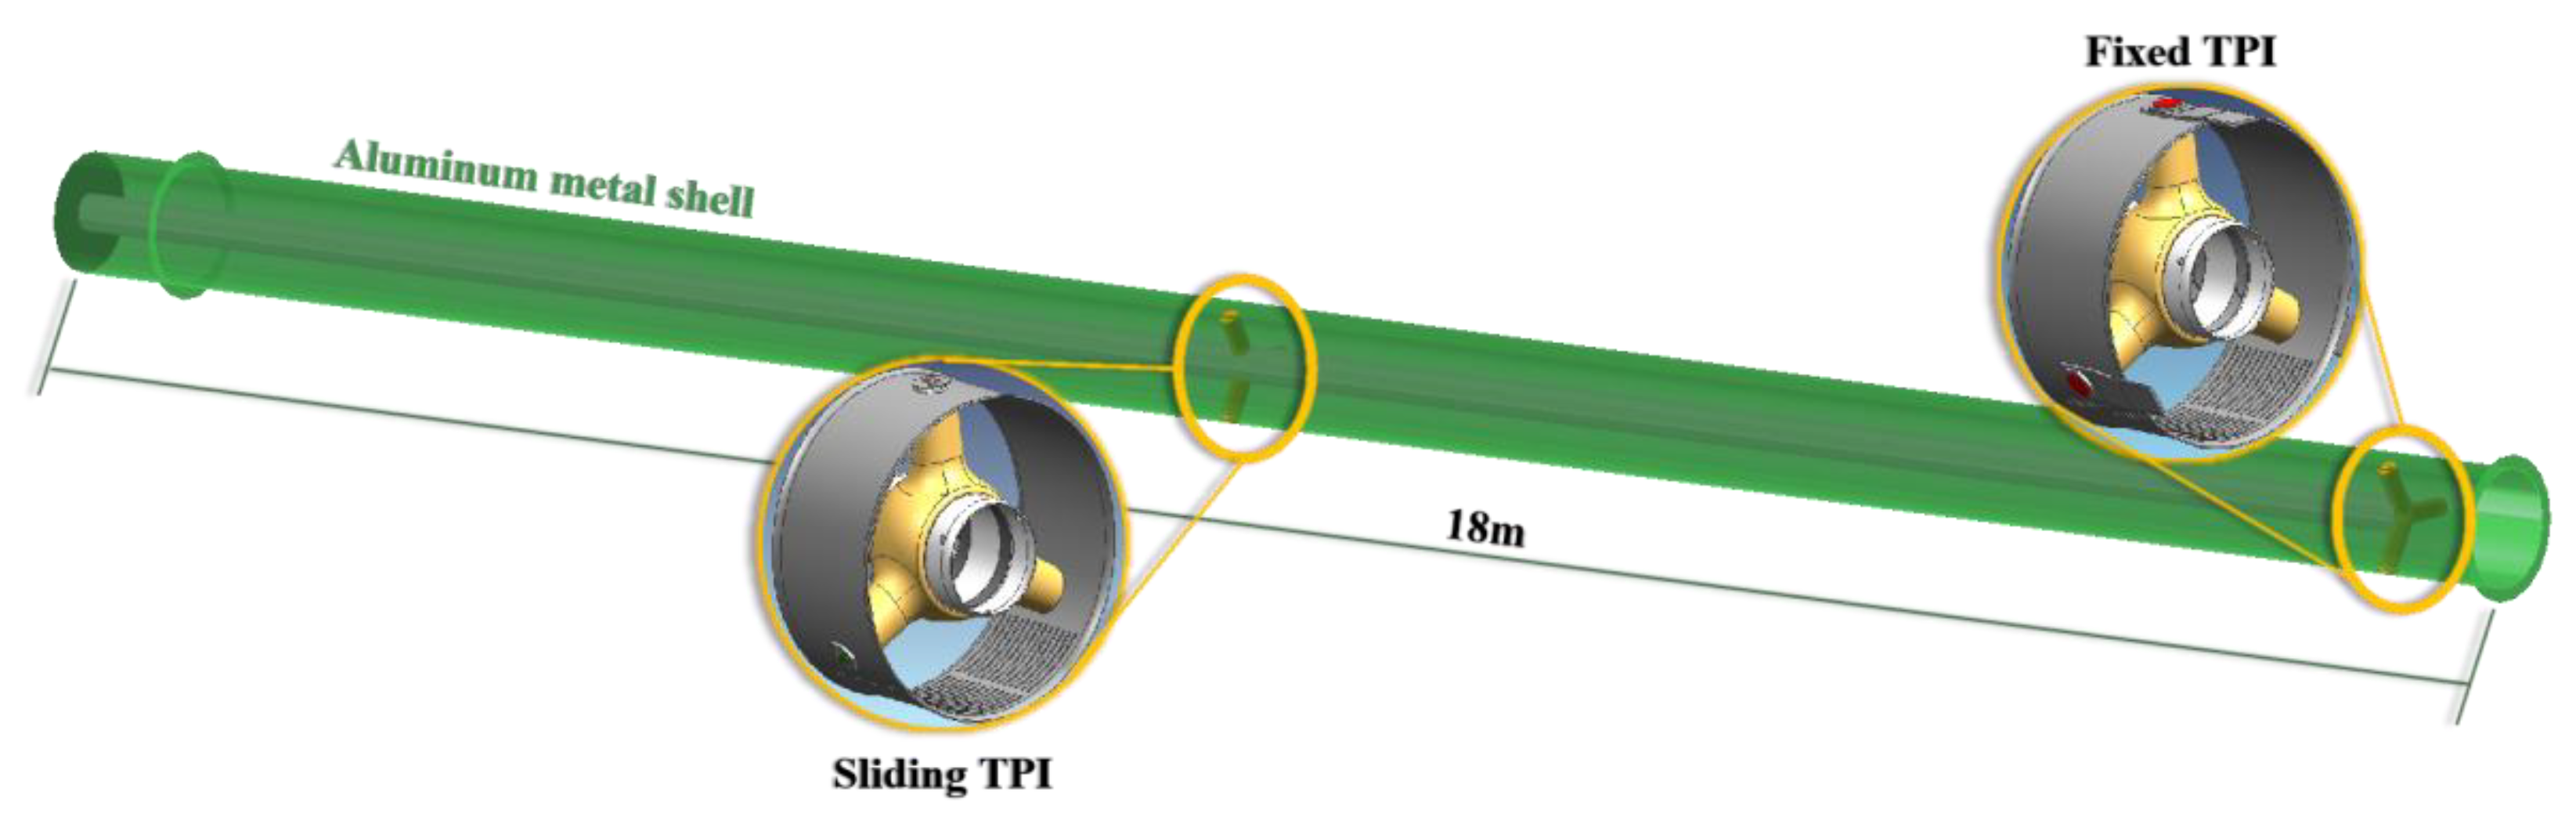
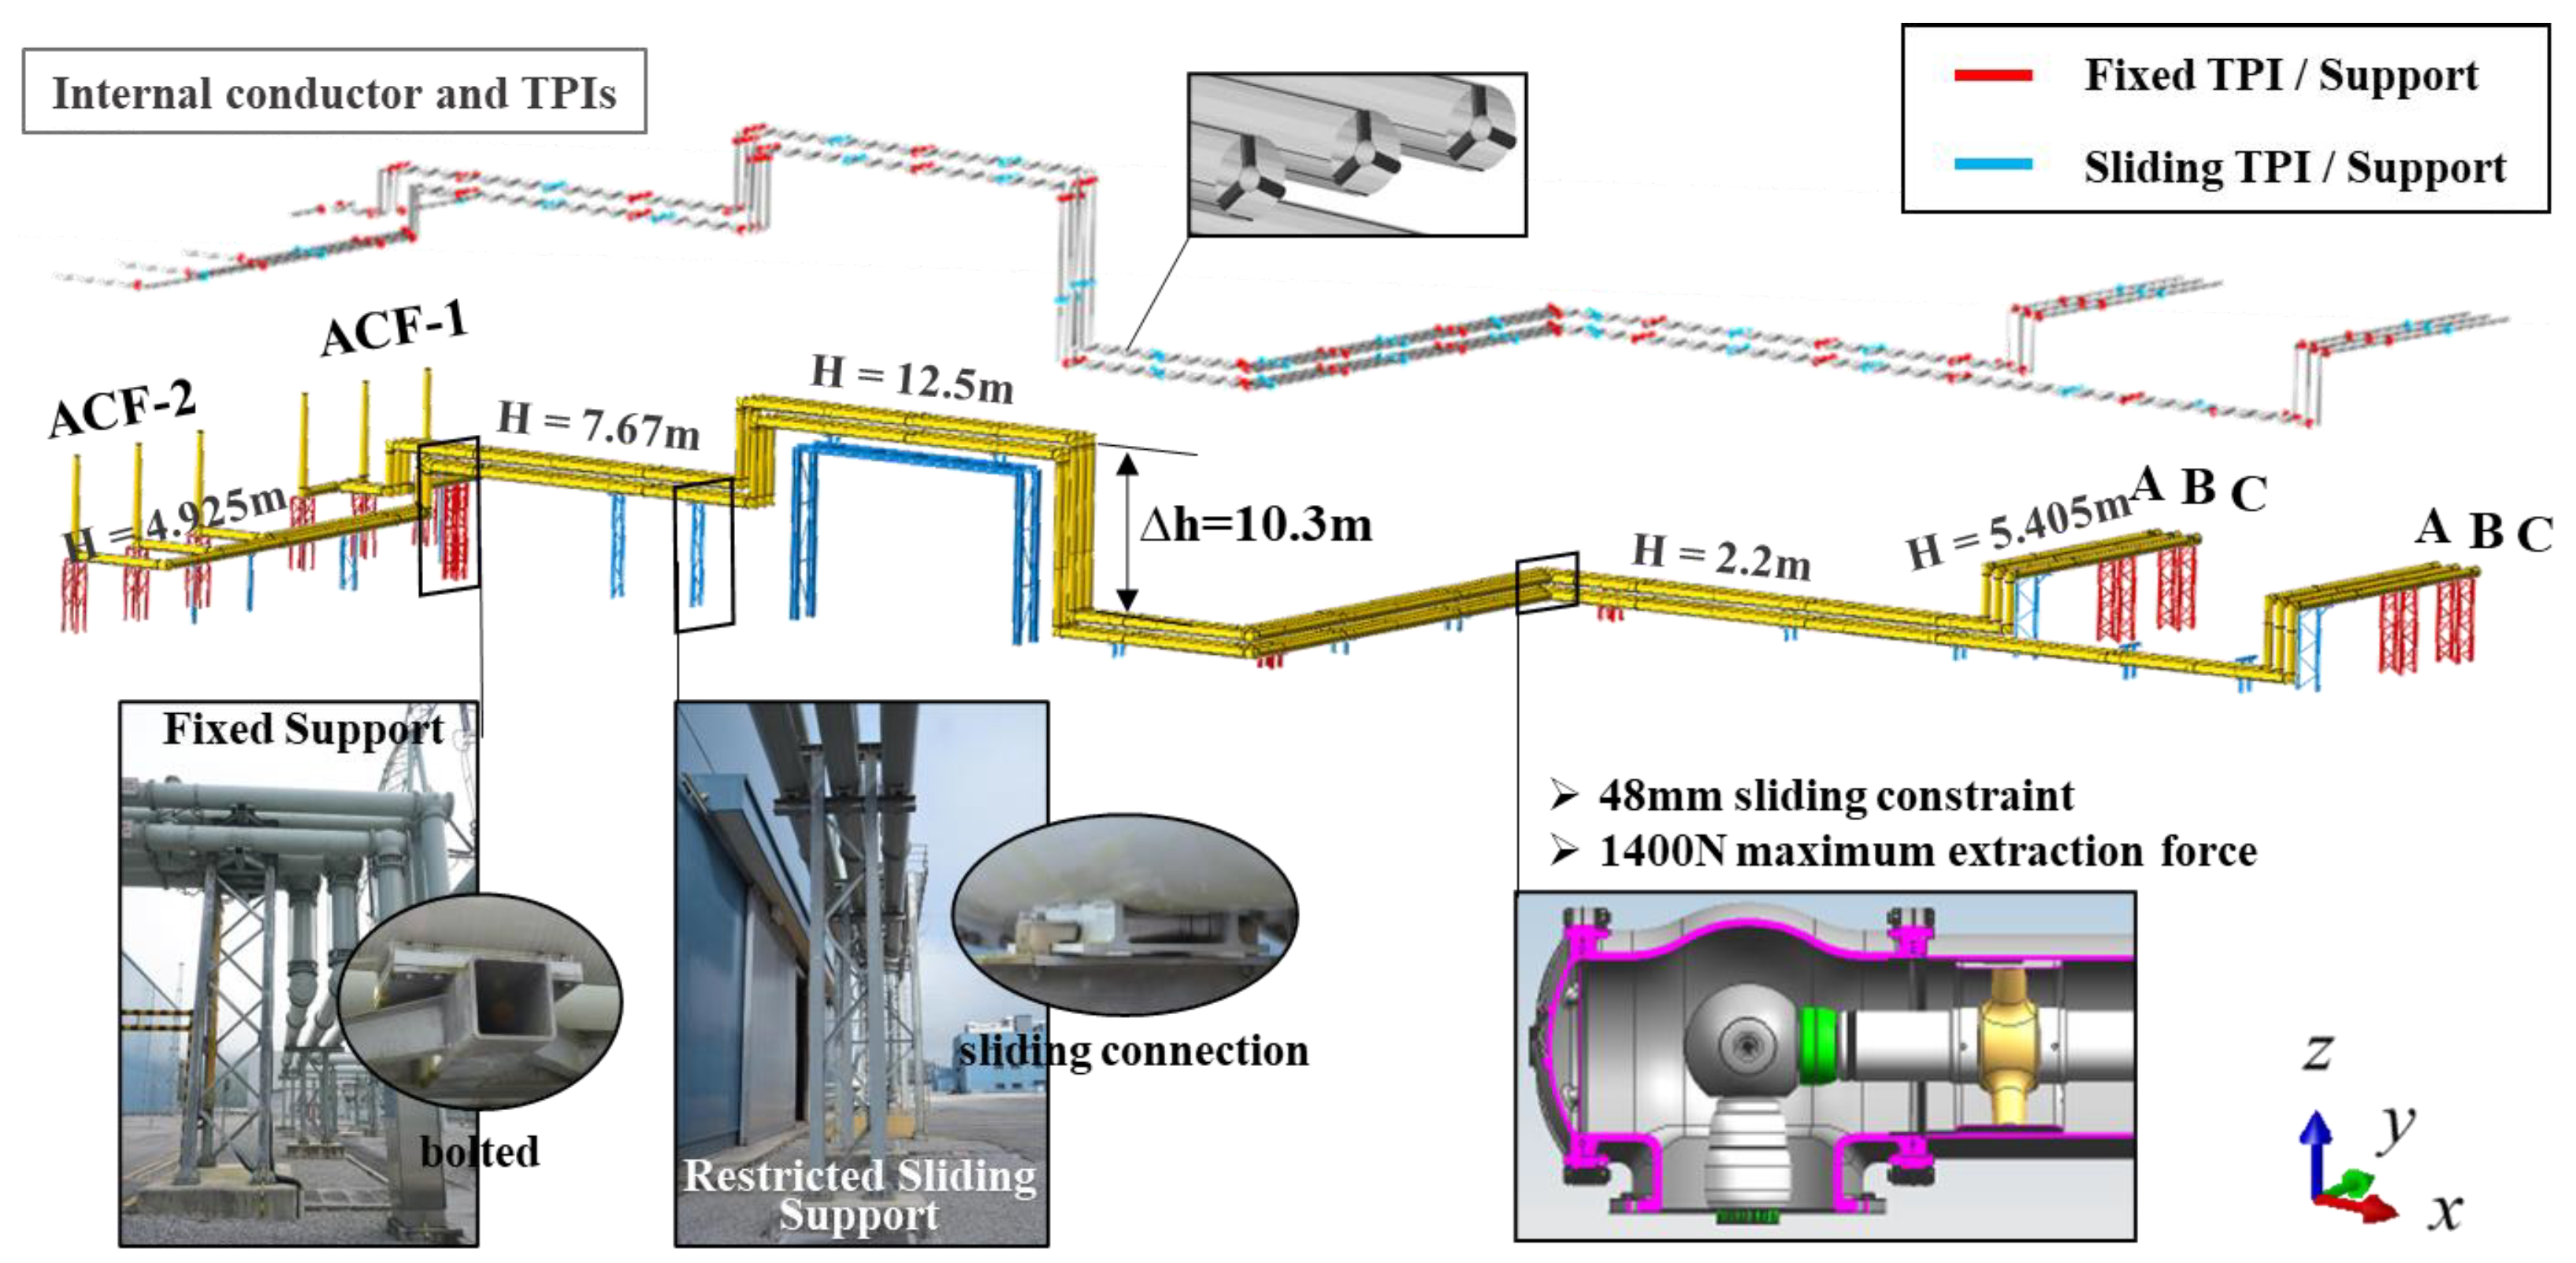
2.1. The Finite Element Model of GIL

This paper focuses on the seismic performance of two specific GILs, namely the incoming GIL of the first group of 550 kV AC filters (ACF-1) and the second group of AC filters (ACF-2), as shown in Figure 3. The line lengths of the GILs in two horizontal directions are 117.5 m and 78.3 m, respectively. The heights of the internal conductor axes of each section of the ACF-1 incoming GIL relative to the ground are 5.405, 2.200, 12.500, 7.670, and 4.925 m, respectively. Notably, the layout of the ACF-2 incoming line is closely coincident with that of the ACF-1 incoming line, with a mere 1 m variation in height. It is worth noting that both GILs traverse through the entrance of a factory building, following a plane layout, and are elevated using a steel platform. As a result, the maximum height difference between the GILs reaches 10.3 m, potentially rendering them susceptible to seismic vulnerability.
From a structural perspective, a gas-insulated transmission line (GIL) constitutes a complex and large-span system, encompassing supports, pipelines, and internal conductors. The critical structural components responsible for force transmission include the inner conductor, three-pillar insulators (TPIs), outer housing, and supports. The finite element model for GIL components utilizes shell elements for the housing due to their intricate forces, beam elements for the support, TPIs, and an inner conductor based on their structural characteristics. The finite element model of the GIL system is depicted in Figure 3. To provide a comprehensive understanding, Table 1 outlines the materials, cross-sectional dimensions, and main mechanical properties of each component.
As illustrated in Figure 3, TPIs and supports play crucial roles as supporting structures for the inner conductor and outer housing, respectively. To account for boundary constraints, they can be categorized into two types: fixed supports/TPIs and limited sliding supports/TPIs. For both types of supports, their bottom ends are anchored to the ground. The top of the fixed support is firmly connected to the housing through bolts, effectively limiting the movement of the housing in all directions at the connection point, while the top of the sliding support is connected to the housing through a limit device, which limits all degrees of freedom of the housing except for the axis. Along the axis direction, the housing is only subjected to friction. Therefore, fixed supports employ coupling to simulate support–housing connections, ensuring dynamic convergence by associating a control point on the support with the controlled surface of the housing. The connection between the sliding support and the housing is modeled using the connector element SLOT, resembling a one-way moving pin. This element facilitates controlled points on the housing’s directional movement, allowing the friction coefficient to be set at 0.3. The movement of the sliding support and the housing in other directions is interlinked.
For two types of TPI, which share the same main structure, they differ solely in the method of connection with the housing. As depicted in Figure 2, the central component of a TPI is a hollow aluminum sleeve, cast together with three epoxy resin insulators that are evenly spaced along the circumference of the sleeve. The internal conductor passes through this hollow aluminum sleeve and is welded to the TPI. Consequently, all TPIs and the internal conductor form an integrated unit, with their relative positions remaining constant throughout their operation. The distinguishing feature between the two TPI types lies in their respective connection methods with the housing. For the fixed TPI, direct welding with three metal connectors secures it to the housing. In contrast, the sliding TPI employs nylon rollers for connection, facilitating limited sliding movement along the axis direction within the inner side of the housing. For the connection between fixed/sliding three-pillar insulators (TPIs) and the housing, a coupling is uniformly used for simulation. The points on the housing are selected as the control points, and the points on the base of the TPI are selected as the controlled points. The difference is that the coupling connection between the sliding TPI and the housing will release the axial degrees of freedom and couple the remaining degrees of freedom. The fixed TPI is coupled to the surgical coupling in all six directions of freedom.
In addition, considering the influence of thermal expansion, a displacement margin of 48 mm with a maximum extraction force of 1400 N is left at the corner joint of the internal conductor of the GIL, as shown in Figure 3. The inner conductor joint is simulated using the connector element SLOT, illustrating its axial mechanical behavior, shown in Figure 4.
The nonlinearity in our model is primarily manifested in two aspects: the friction between the sliding support and the housing, and the connection at the corner of the inner conductor.

2.2. Modal Analysis of GIL and Selected Ground Motions

The modal analysis results of the GIL model indicate that its frequency range of the first 120 orders is 1.99 to 9.80 Hz, indicating that it belongs to a modal-intensive structure. And the natural frequency range of the GIL coincides with the predominant frequency range of earthquakes, which is not conducive to earthquake resistance. The first six modal shapes of the GIL model are shown in Figure 5 and can be mainly divided into two categories: one is the vibration of the sliding support along the pipeline axis, and the other is the local deformation of the pipeline accompanied by the support. In fact, this is a common feature of all mode shapes in GILs. In the direction of the pipeline axis, the sliding support provides little constraint on the pipeline, and at places with large height differences or corners, the pipeline deformation is obvious. In addition, the vibration frequencies of the sliding support and the pipeline are not the same, and further analysis is needed for the dynamic amplification effect of the support on the pipeline; the two may generate significant relative displacement in earthquakes.
According to the Chinese regulation Code for Seismic Design of Electrical Installations (GB 50260-2013) [23], seven sets of seismic ground motion records were selected for seismic response analysis, including five sets of natural earthquake records and two sets of artificial waves, as listed in Table 2.
The acceleration response spectra of the selected seismic records and the average response spectrum of seven sets of seismic records are plotted in accordance with the required response spectrum (RRS), as shown in Figure 6. It can be seen that in all three directions, within the frequency range corresponding to the main vibration modes of the structure, the average response spectrum can better cover the RRS. When calculating seismic response, the ground peak acceleration ratio in the three directions of XYZ is 1:0.85:0.65. According to the importance level of the substation to which the GIL belongs and the seismic fortification requirements of the site [24], and in accordance with the requirements of the Code for Seismic Design of Electrical Installations (GB 50260-2013) [22], the peak ground acceleration in the X-direction is classified as a nine-degree seismic fortification intensity and a rare occurrence intensity (seismic fortification intensity), with a probability of exceeding it in 50 years of 10%; rare earthquakes with a 50-year probability of exceeding 2% to 3% are taken as 0.4 g and 0.62 g, respectively.

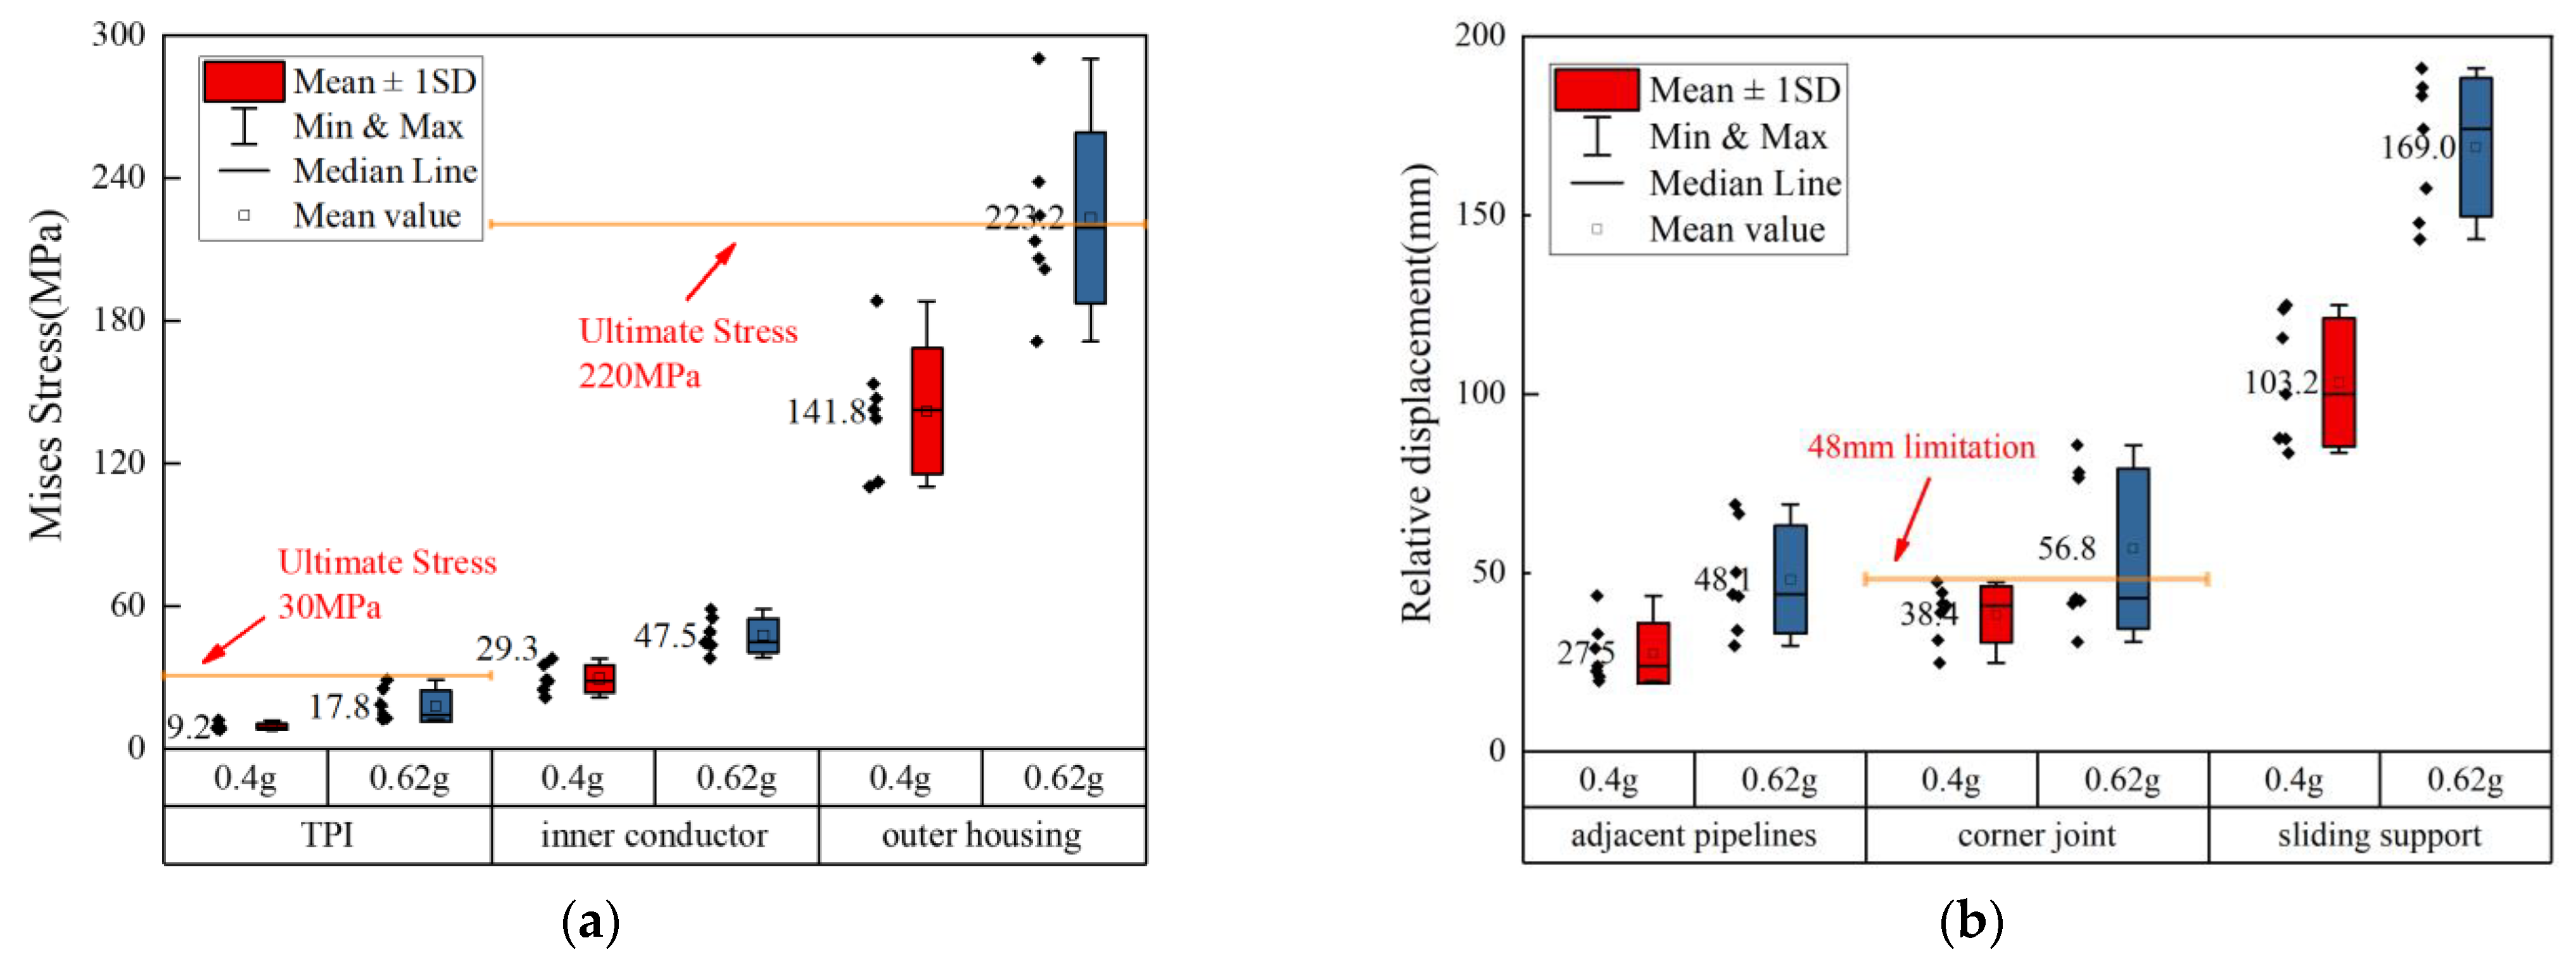
2.3. Key Seismic Responses and Vulnerable Locations of GIL

The seismic performance of GILs can be evaluated from two aspects: stress response and relative displacement response. Figure 7a,b respectively list the stress response peaks and relative displacement peaks at some key locations in a GIL under seven sets of ground motions.
Regarding stress response, the main focus is on whether the peak stress responses of the TPI, internal conductor, and housing exceed their corresponding ultimate stress. According to the information provided by the design manufacturer, the ultimate stress of the TPI is 30 MPa. Even when the PGA is 0.62 g, both the average peak stress response and the maximum peak stress response under seven sets of seismic motions do not exceed the ultimate stress of the TPIs. The stress safety factor is defined as the ratio of the ultimate stress to the average peak stress response under seismic action. It can be obtained that when the PGAs are 0.4 g and 0.62 g, the stress safety factors of the three-pillar insulators are 3.26 and 1.69, respectively, which comply with the requirement that the stress safety factor should be greater than 1.67 in GB 50260-2013. Therefore, it can be considered that the three-pillar insulators will not undergo stress damage under earthquake action. The ultimate stress of both the internal conductor and the housing is 220 MPa. From Figure 7a, it can be seen that the peak stress response of the internal conductor is much smaller than the ultimate stress, and there is no risk of stress failure. However, for the peak stress response of the housing, when the PGA is 0.4 g, although the average peak stress does not exceed the limit stress, the stress safety factor is only 1.55, which does not meet the specification requirements. When the PGA is 0.62 g, the average peak stress under the seven seismic actions exceeds the limit stress. Therefore, from the perspective of stress response, the possible failure mode of the GIL is housing stress failure.
For displacement response, the main focus is on the peak relative displacement response between adjacent pipelines (A, B, C three-phase), internal conductor corner joints, and sliding supports and housings. The distance between adjacent pipelines is 338 mm. From Figure 7b, it can be seen that the relative displacement between adjacent pipelines under seismic action is much smaller than the distance, so there is no risk of collision between them. With respect to the relative displacement at the corner joint of the internal conductor, as previously described in Figure 3, it should be less than 48 mm. However, when the PGA is 0.62 g, the average peak relative displacement at the corner joint of the internal conductor will exceed the limit displacement by nearly 20%. This can cause damage to the connector by pulling it out, affecting the normal operation of the GIL’s electrical functions and causing significant losses. There is no limit to the relative displacement between the sliding support and the housing, but under the condition of a 0.4 g earthquake, the average peak relative displacement will reach 103.2 mm. When the PGA is 0.62 g, the average peak relative displacement will reach 169.0 mm. Therefore, from the perspective of displacement response, the possible failure mode of the GIL is internal conductor corner pull-out failure.
Figure 8 shows the weak position of a GIL under earthquake action, which is the position where the maximum peak stress response of the housing occurs or the position where the maximum relative displacement occurs at the corner joint of the internal conductor. It can be seen that the maximum seismic response of the GIL is concentrated at the vertical corner of the line, and its position does not change with the increase in PGA.

3. Retrofit Measures of GIL

According to relevant Chinese regulations [25,26], the seismic design of overhead pipelines is often simplified into a single-degree-of-freedom system for seismic response calculation, or through the implementation of structural measures to ensure seismic reliability. However, findings from the preceding section reveal the seismic vulnerability of GILs at specific corners where there is a change in pipeline height, indicating a potential composite failure mode involving housing strength and the risk of excessive relative displacement of the inner conductor. Consequently, the standardized calculation method offers only limited insight into the peak displacement and maximum stress response of the support, falling short of the comprehensive seismic performance evaluation demanded by the intricate GIL system. This underscores the need for an in-depth exploration of the dynamic response characteristics inherent in the GIL, a complex support–pipeline system, with the aim of developing precise seismic enhancement strategies.

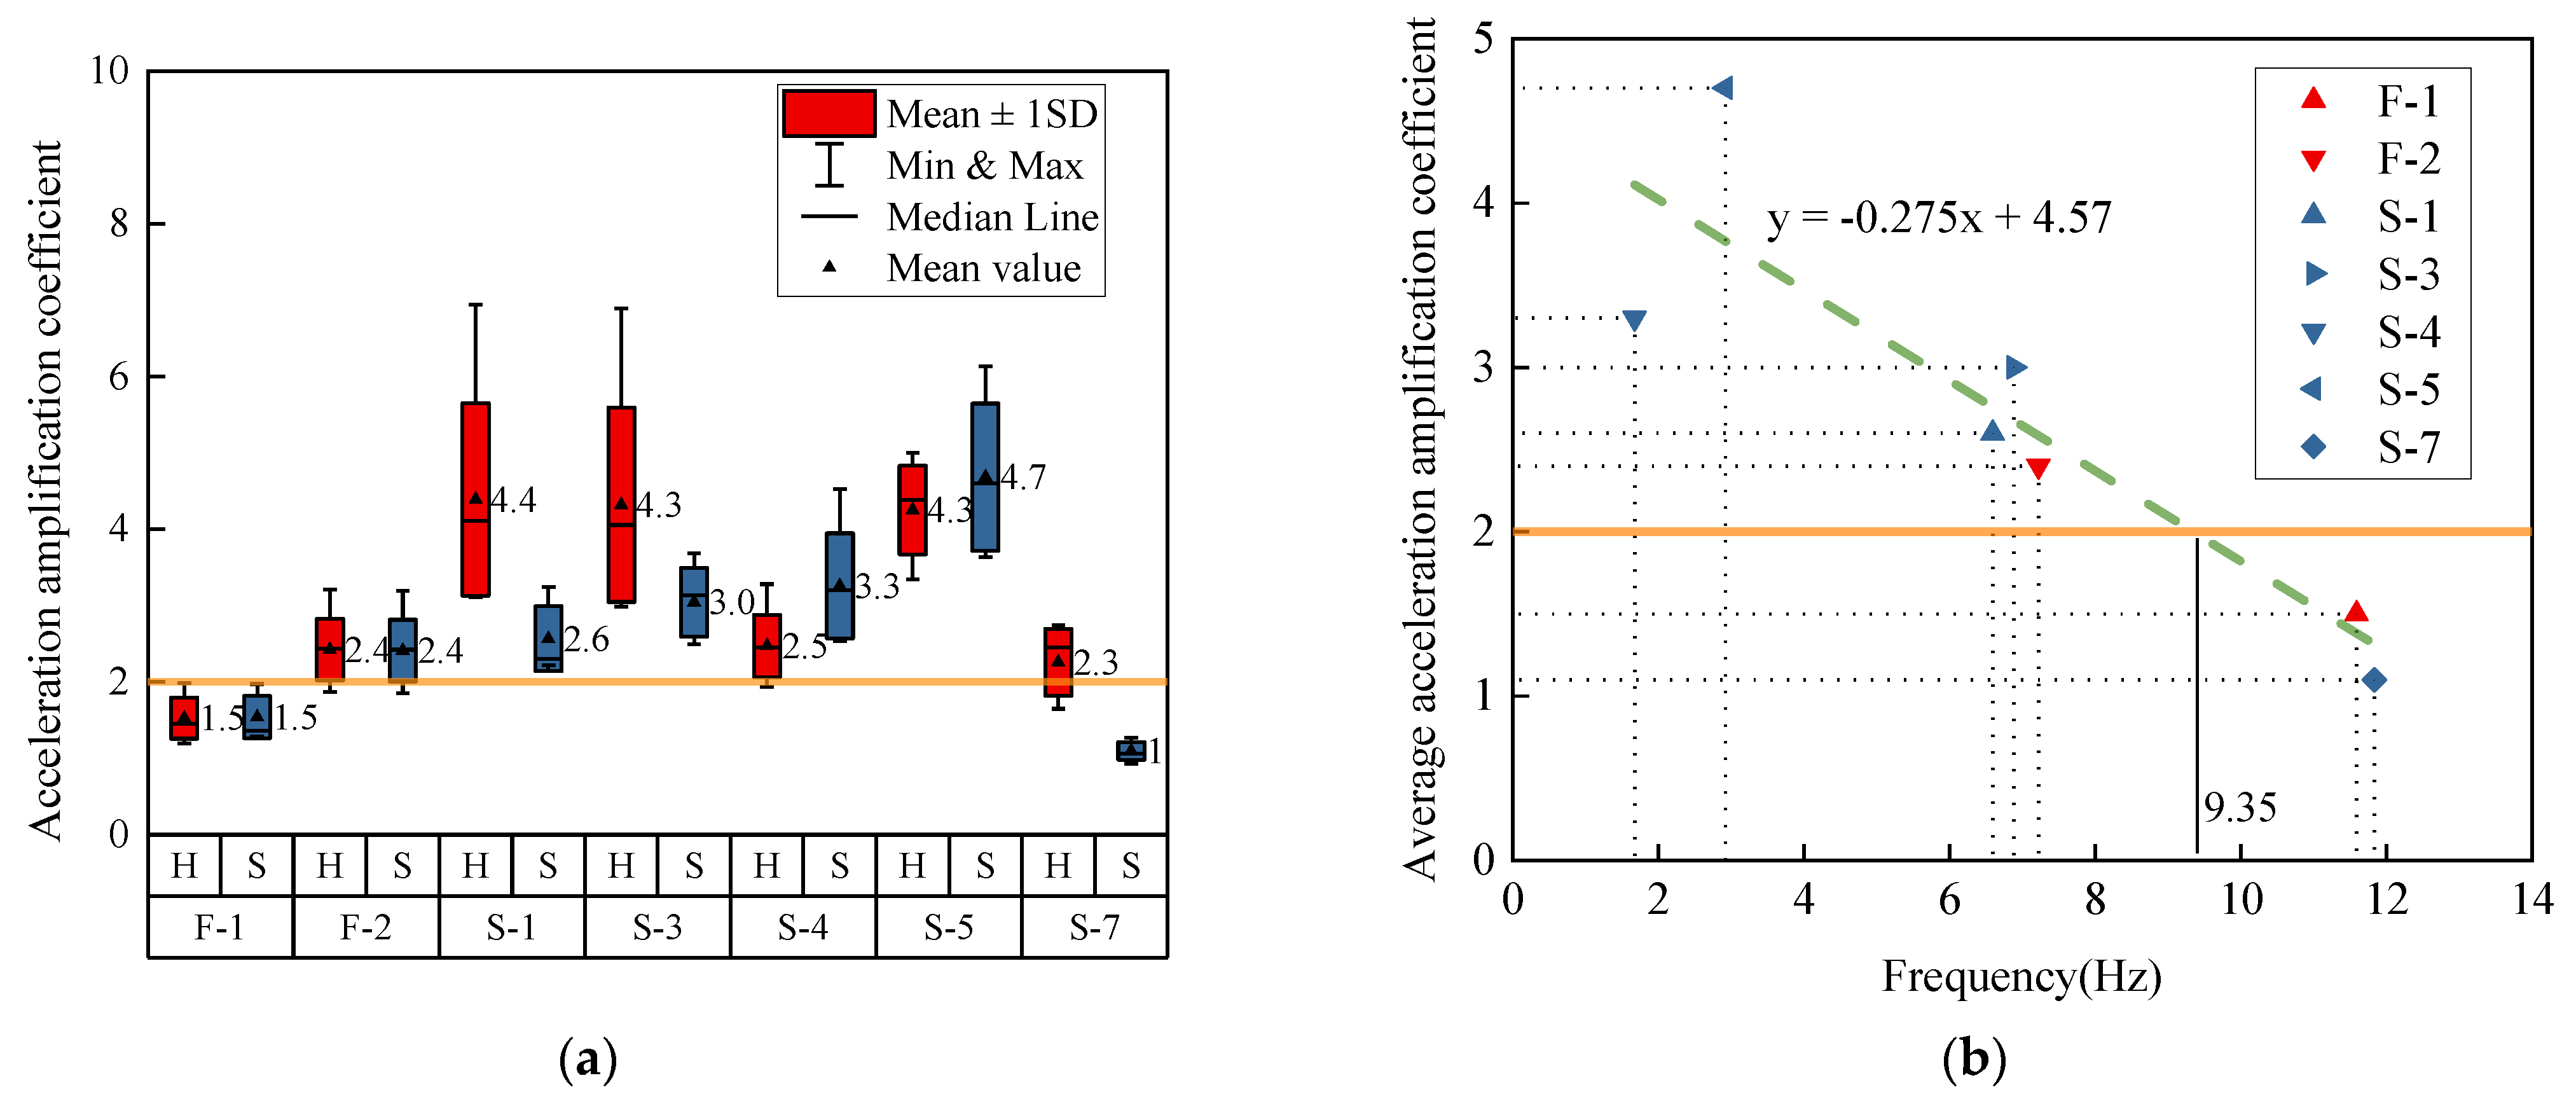
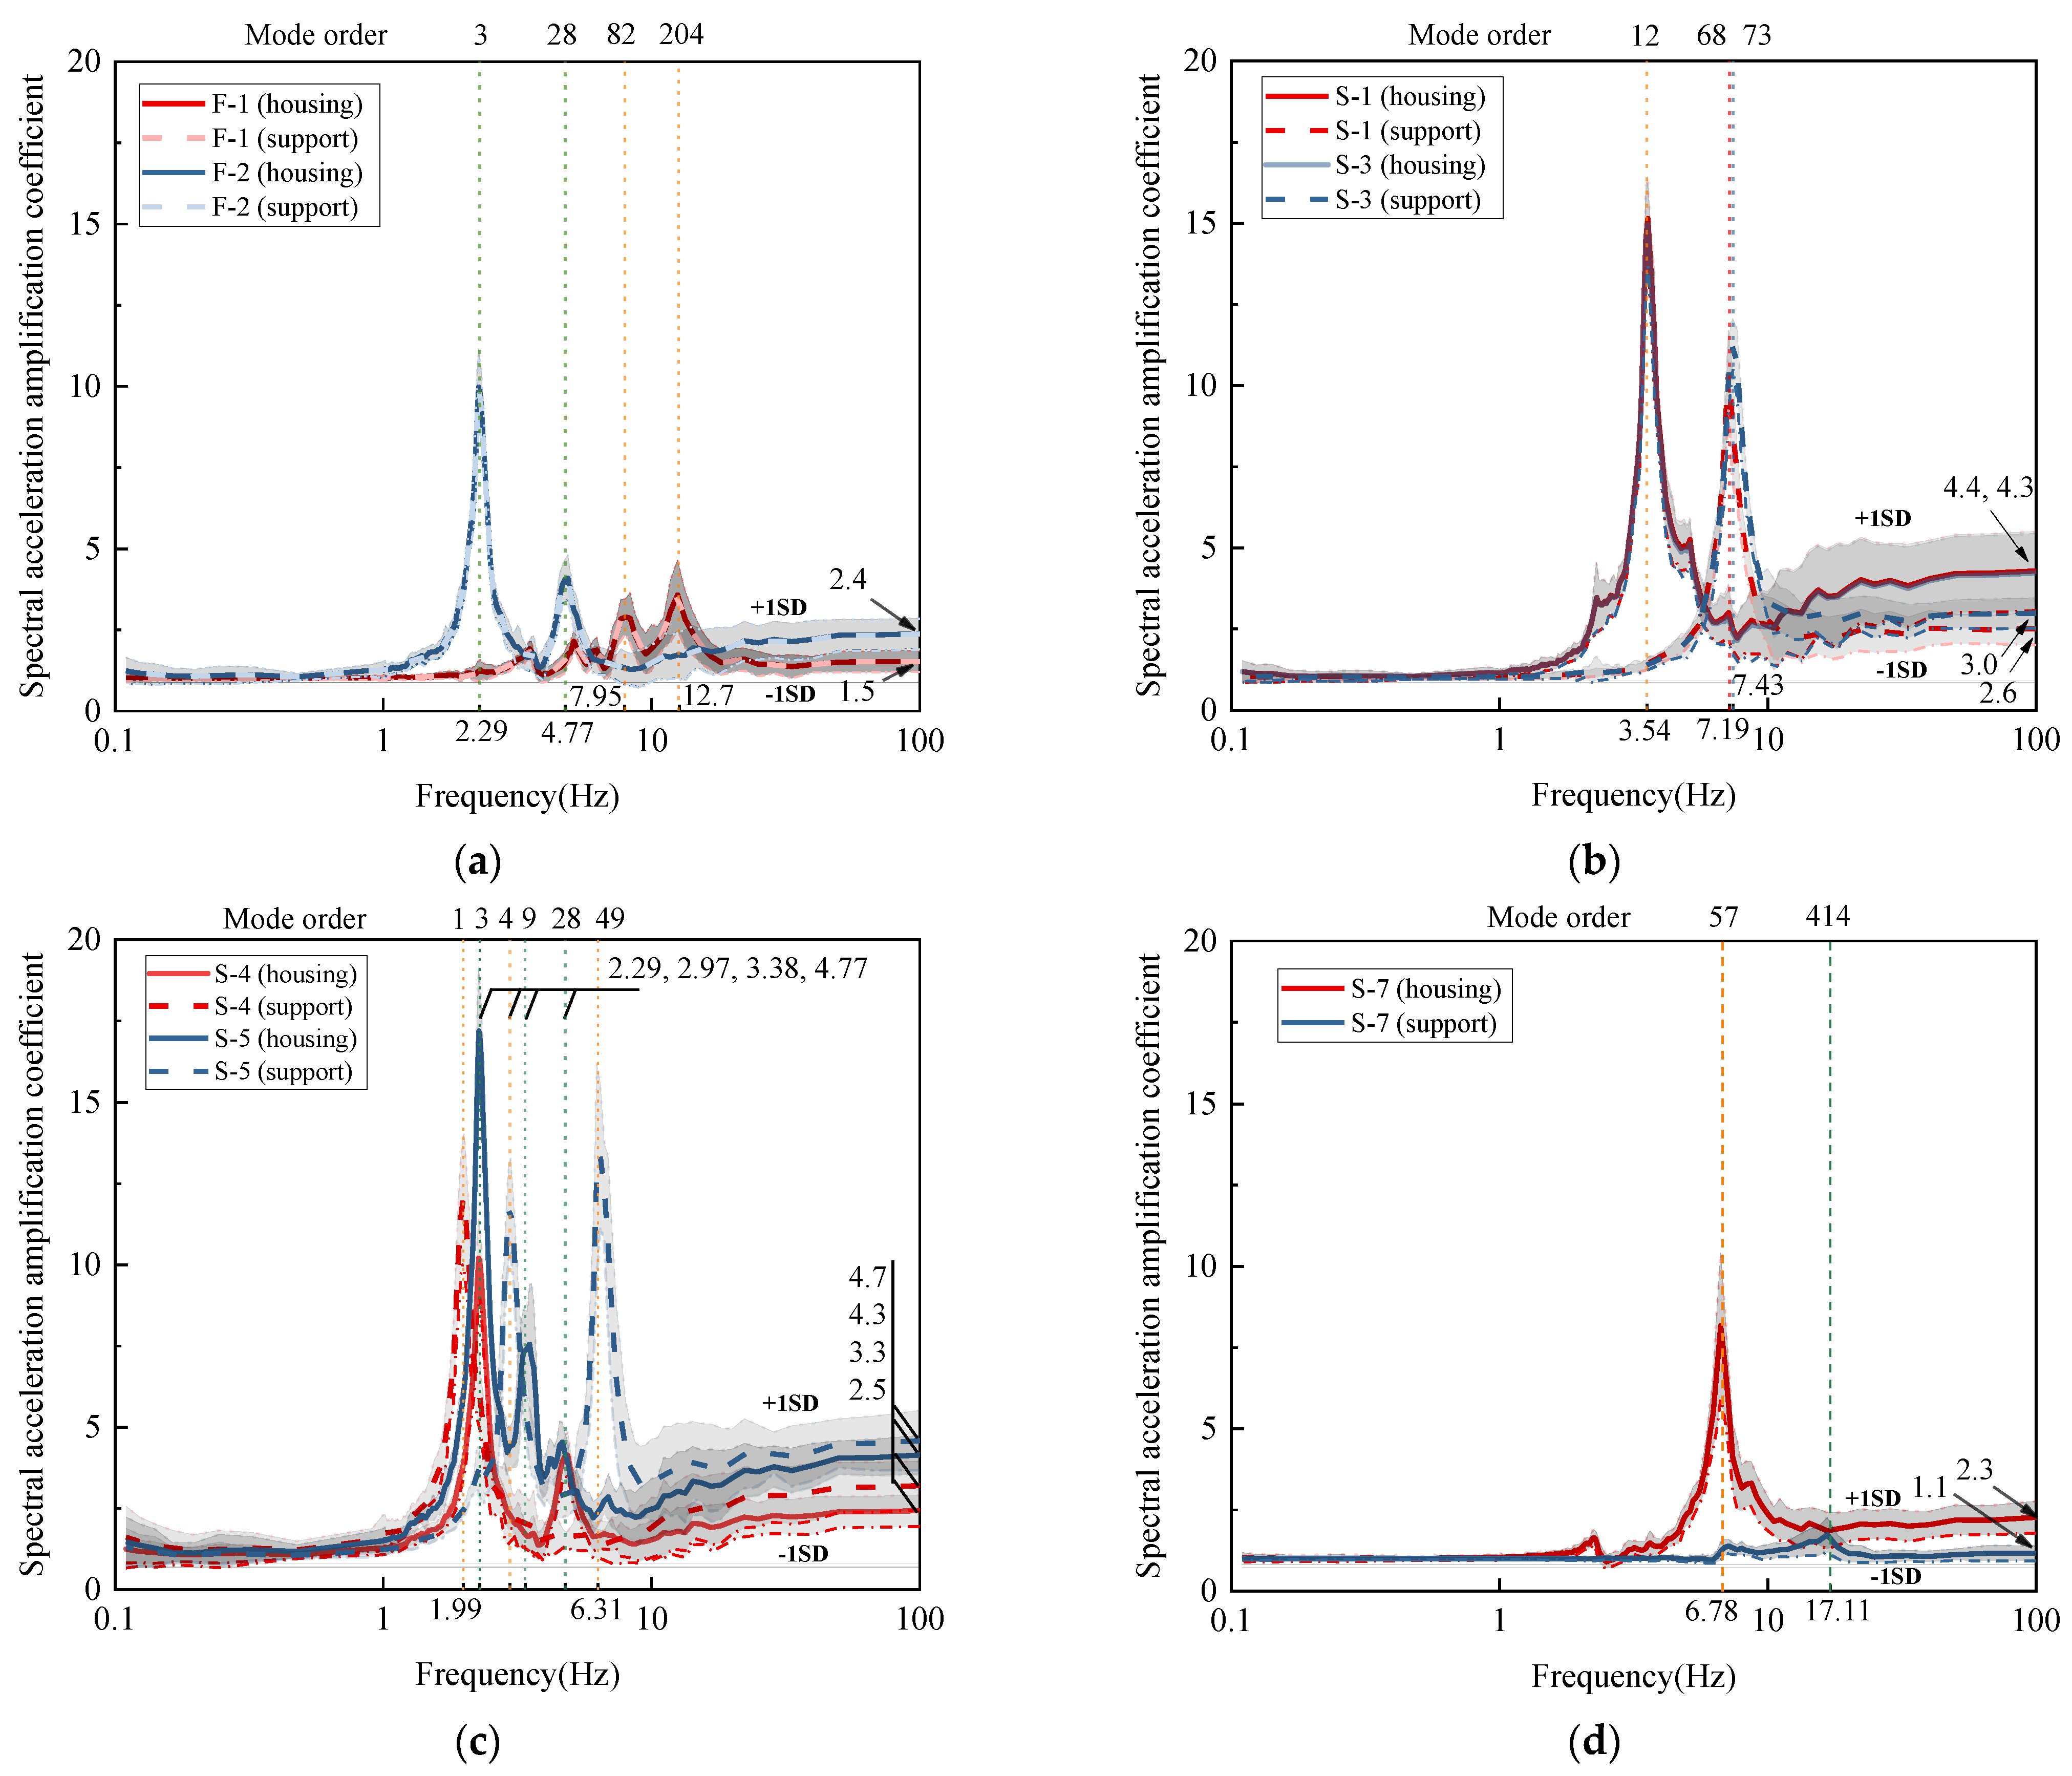
3.1. The Dynamic Amplification Effect of Supports

The initial focus of analysis pertains to the dynamic amplification effect of supports. As detailed in Section 2.1, GIL supports are classified into fixed and sliding types. For clarity in subsequent analyses, each support type is systematically designated and numbered within the GIL system, as depicted in Figure 9. Fixed supports are predominantly located at specific points: the initial section (connected to a GIS), the terminal section (adjacent to the AC filter bushing), and the line corners, representing a comparatively smaller subset. Conversely, sliding supports are evenly distributed along straight line segments, averaging 13.05 m per piece. Figure 10 provides a visual representation of the configuration and heights of all supports. Fixed supports adopt a four-column steel structure, forming composite spatial architectures ranging in height from 1.95 m to 7.40 m. In contrast, sliding supports utilize a two-column steel structure, spanning heights from 1.95 m to 12.05 m.
Based on the findings in Section 2, the vulnerable locations of a GIL are primarily situated in the latter segment. Consequently, this section focuses on the supports and pipelines in the latter half of a GIL. Figure 11a illustrates the acceleration amplification coefficients at the tops of various supports and the corresponding housing linked to the support along the pipeline axis direction under seven sets of ground motions; “H” denotes the housing, and “S” signifies the support. The acceleration amplification coefficient is defined as the ratio of the peak acceleration response to the peak ground acceleration.
Figure 11a reveals several crucial findings. Firstly, with the exceptions of F-1 and S-7, the average acceleration amplification coefficients for all other support types and the housing consistently surpass 2.0. Secondly, a considerable variation exists in the average acceleration amplification coefficients across different support types, ranging from 1.1 to 4.7. Similarly, there are significant differences in the average acceleration amplification coefficients of the corresponding housing with different supports, ranging from 1.5 to 4.4. Thirdly, the presence of asynchronous vibrations along the axis between the housing and the sliding support leads to a notable disparity in acceleration amplification coefficients, with a ratio spanning from 0.76 to 2.09. This diversity corresponds to two distinct scenarios: for S-1, S-3, and S-7, the housing’s acceleration amplification coefficient significantly exceeds that of the support, whereas for S-4 and S-5, an inverse trend is observed. These outcomes emphasize that the seismic performance of a GIL is inadequately evaluated by simplifying this complex system as a single-degree-of-freedom structure and conducting seismic response calculations.
Figure 11b illustrates the scatter plot and linear fitting relationship between the natural frequency of the support and the acceleration amplification coefficient. According to the GIL analysis presented in this study, restraining the dynamic amplification coefficient of the support to less than 2.0 requires a fundamental frequency exceeding 9.35 Hz. Moreover, to ensure that the support does not amplify the ground input, the fundamental frequency should be greater than 12.98 Hz. However, in many instances, the fundamental frequency of the support falls below these critical values, implying that most supports will amplify the ground acceleration by more than twice its value.
We introduced the concept of “spectral acceleration amplification” to elucidate the relationship between dynamic amplification and inherent dynamic features. The curves in Figure 12 depict spectral acceleration amplifications for various support types and housing, showcasing peaks at frequencies corresponding to multiple higher-order vibration modes within the 2–10 Hz frequency range.
Key observations from Figure 12 include:
(1)
The spectral acceleration amplification curve at high frequencies (100 Hz) represents the average acceleration amplification coefficient in the time domain.
(2)
Prominent peaks at frequencies corresponding to multiple higher-order vibration modes indicate the influence of these modes on the dynamic amplification effect of supports and housing within the 2–10 Hz frequency range.

3.2. Three Retrofit Methods and Comparison of Results

Through the in-depth analysis of the dynamic amplification effect of the support in Section 3.1, it becomes evident that the dynamic amplification effect of the support on the pipeline cannot be ignored, with the acceleration amplification coefficient generally surpassing 2.0. Moreover, while notable disparities exist in the acceleration amplification coefficients among various types of supports and housing at distinct positions, there is a fundamental inverse relationship between the dynamic amplification effect and the fundamental frequency of the supports. This correlation suggests that enhancing the fundamental frequency of the supports can effectively diminish the dynamic amplification coefficient. Consequently, the focus of this section is to regulate the support’s dynamic amplification effect by adjusting its fundamental frequency or altering the connection between the support and the pipeline, thereby accomplishing the seismic performance objective of mitigating the GIL’s critical responses. Three retrofit methodologies were assessed and compared.
The first two methods increase the frequency of the support by changing the material of the support or increasing the cross-sectional area of the support, respectively, to increase the fundamental frequency of the support to 2 and 5 times the original fundamental frequency, recorded separately as 2 f s u p p o r t and 5 f s u p p o r t . The third approach entails converting all supports to fixed supports. The peak ground acceleration in the X-direction is taken as 0.62 g. Table 3 presents the acceleration amplification coefficients of various support tops and housings under different retrofit methods. It is apparent that elevating the fundamental frequency of the support effectively reduces the acceleration amplification coefficient at the top of the support, and a similar trend is observed for the acceleration amplification coefficient at the top housing of the support. Notably, after all supports are fixed, the acceleration amplification coefficients of the supports and housings exhibit a trend of convergence toward a median value compared to before the retrofit. For supports with an acceleration amplification coefficient exceeding 4.0, the coefficient decreases after the retrofit, whereas supports with a coefficient below 4.0 experience an increase in acceleration amplification after the retrofit. This trend can be attributed to the enhanced overall structural integrity resulting from the full fixation of the support-to-pipeline connection.
Table 4 highlights the key seismic response peaks of the GIL, where “S” represents peak housing stress and “D” represents relative displacement of internal conductor joints. The findings reveal that the first two retrofit methods not only fail to diminish the peak stress response of the GIL housing by increasing the fundamental frequency of the support, but also result in varying degrees of increased peak housing stress. Conversely, the third retrofit method, entailing the conversion of all supports to fixed ones, effectively reduces the peak housing stress, with the average peak stress response remaining below the material limit stress. All three retrofit strategies contribute to the reduction in relative displacement at internal conductor corner joints, with the “fixing all supports” method yielding the most significant reduction in relative displacement.
The findings presented in Table 3 and Table 4 suggest that while enhancing the fundamental frequency of the support reduces the dynamic amplification effect, it does not significantly improve the seismic performance of the GIL. On the other hand, altering the connection between all supports and pipelines to fixed connections may not entirely regulate the dynamic amplification effect, but it notably enhances the overall seismic performance of the GIL. These results imply that the dynamic amplification effect of the support might not be the decisive factor influencing the seismic performance of the GIL, necessitating further analysis to elucidate this outcome.

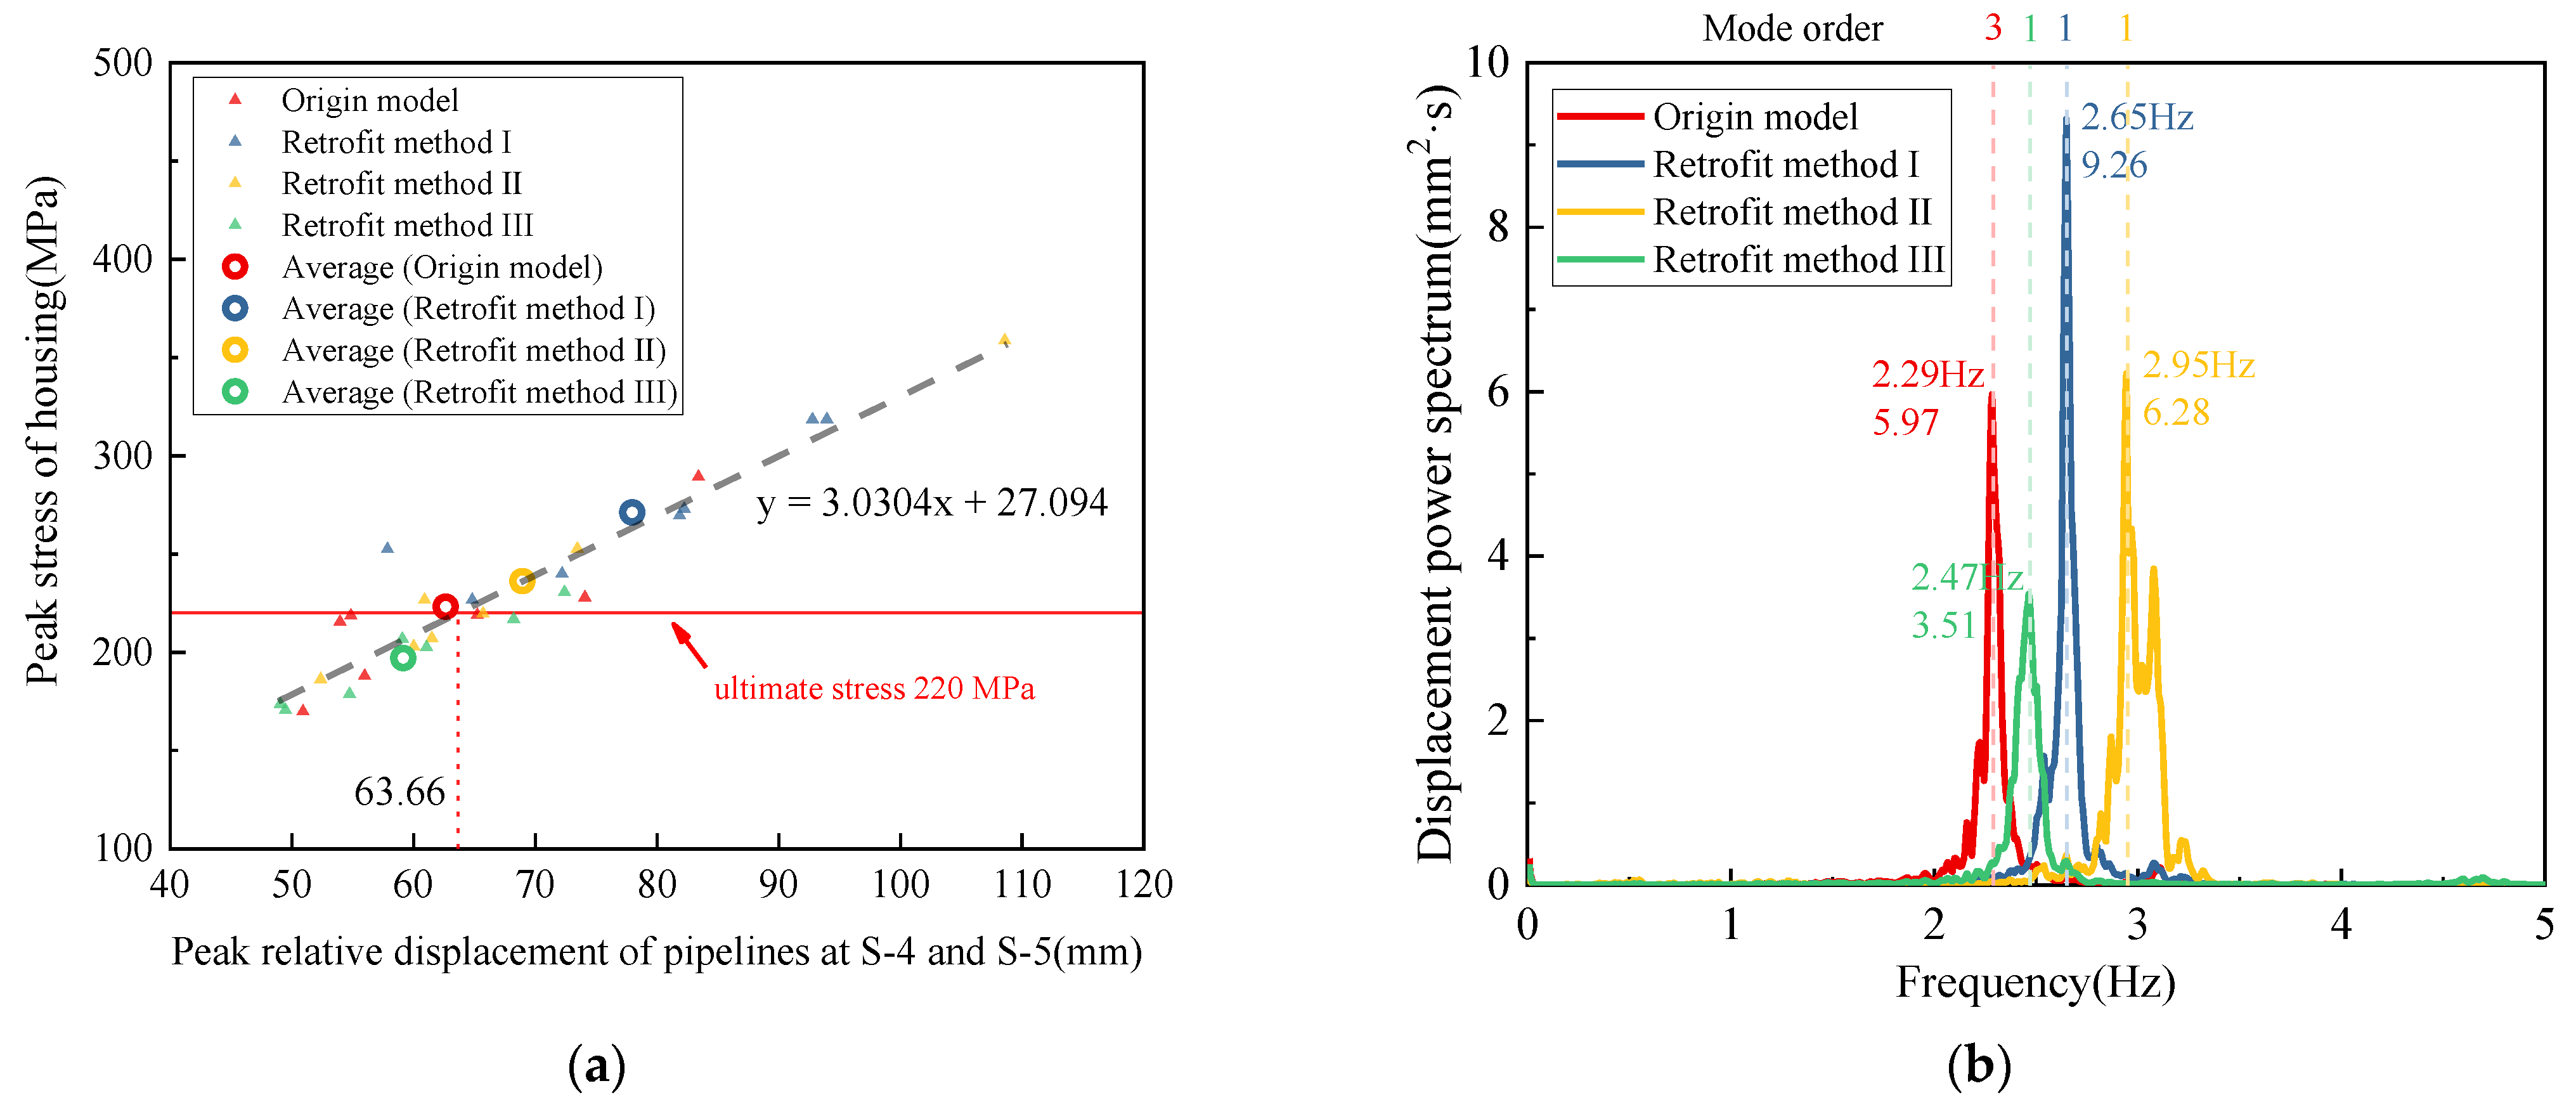
3.3. Key Factors Influencing GIL Peak Responses

This section primarily investigates the underlying reasons for the differing impacts of various retrofit methods on the peak stress response of the GIL. Given that the most significant peak stress responses of the housing and maximum relative displacement of the internal conductor joint are located at the pipeline corner between supports S-4 and S-5, special attention is warranted for the relative displacement or acceleration responses between these two positions. Figure 13a shows the scatter plot of the peak relative displacements of pipelines at S-4 and S-5 and the peak stress of the GIL housing under seven sets of seismic ground motions, including the original model and three retrofit methods. The circular markers denote the average values under these seismic conditions. Evidently, the above results indicate that the relative displacement response between S-4 and S-5 is a key factor affecting the peak response of the GIL housing. To provide a comprehensive understanding of how different retrofit measures influence relative displacement responses between S-4 and S-5 and subsequently reshape the overall seismic performance of the GIL, Figure 13b and Figure 14, respectively, depict the power spectrum of relative displacement and the displacement cloud map of corresponding vibration modes.
Figure 13b reveals a distinct pattern in the relative displacement power spectra of the original structure and the two other retrofit methods, showcasing a singular peak characteristic, except for the second retrofit method. The corresponding vibration mode order for each peak value is visibly denoted in Figure 14. Notably, the peak values of the relative displacement power spectrum for the three reinforced models are all aligned with the first-order vibration mode, while the peak values for the original structure correspond to the third-order vibration mode. These vibration modes are all associated with the X-direction translational motion of the pipeline, as illustrated in Figure 14. Furthermore, across all four cases, the relative magnitudes of the relative displacement power peaks mirror the relative magnitudes of the relative displacement peaks of S-4 and S-5, in the following order: retrofit method I > retrofit method Ⅱ > original structure > retrofit method III. These insights emphasize the pivotal role played by the first-order vibration of pipelines in shaping relative displacement responses.
Figure 14 compares crucial mode shapes governing the relative displacement of supports S-4 and S-5, controlled across four distinct scenarios. Evidently, all vibration modes correspond to the first-order X-direction translational vibration of the pipeline, and the most significant deformation occurs at the corner of the pipe joint between supports S-4 and S-5. In the case of the third retrofit method, wherein all supports are fixed with the housing, supports S-4 and S-5 deform synchronously with the pipeline. Conversely, in the other three cases, sliding supports S-4 and S-5 remain undeformed. Noteworthy angular changes at the corners of key pipe joints are highlighted in the partially enlarged image. Similar to the peak values of the displacement power spectrum in Figure 13b, the relative magnitudes of the rotation angles in the key modes of different models in Figure 14 correspond to the relative magnitudes of the peak responses of the GIL for each model, which is also retrofit method I > retrofit method Ⅱ > original model > retrofit method III.
Based on the analysis of the power spectrum of the relative displacement between supports S-4 and S-5 and the associated modal shape corresponding to the power spectrum peak, the following conclusions emerge:
  • Mitigating the relative displacement peak between supports S-4 and S-5 effectively diminishes the critical peak response of the GIL and enhances its seismic performance.
  • The peak relative displacement between supports S-4 and S-5 is governed by the first-order X-direction translational vibration mode of the pipeline, with the angle change value at the pipeline corner in this vibration mode displaying a positive correlation with the peak relative displacement between supports S-4 and S-5.
  • Insights from the deformation indicated that the pivotal factor affecting the seismic performance of the GIL is the deformation of the pipeline corner in the first mode of vibration, rather than the frequency corresponding to the first mode.

4. Seismic Vulnerability of GIL

Seismic vulnerability analysis can offer reasonably accurate failure probabilities for GILs under varying PGAs, thereby establishing a foundation for the seismic design and performance assessment of GILs [26,27]. The findings in Section 3 demonstrate that only retrofit method III can effectively diminish the critical seismic response of the GIL. Consequently, this section exclusively conducts seismic vulnerability analysis on the original structure of the GIL and retrofit method III.

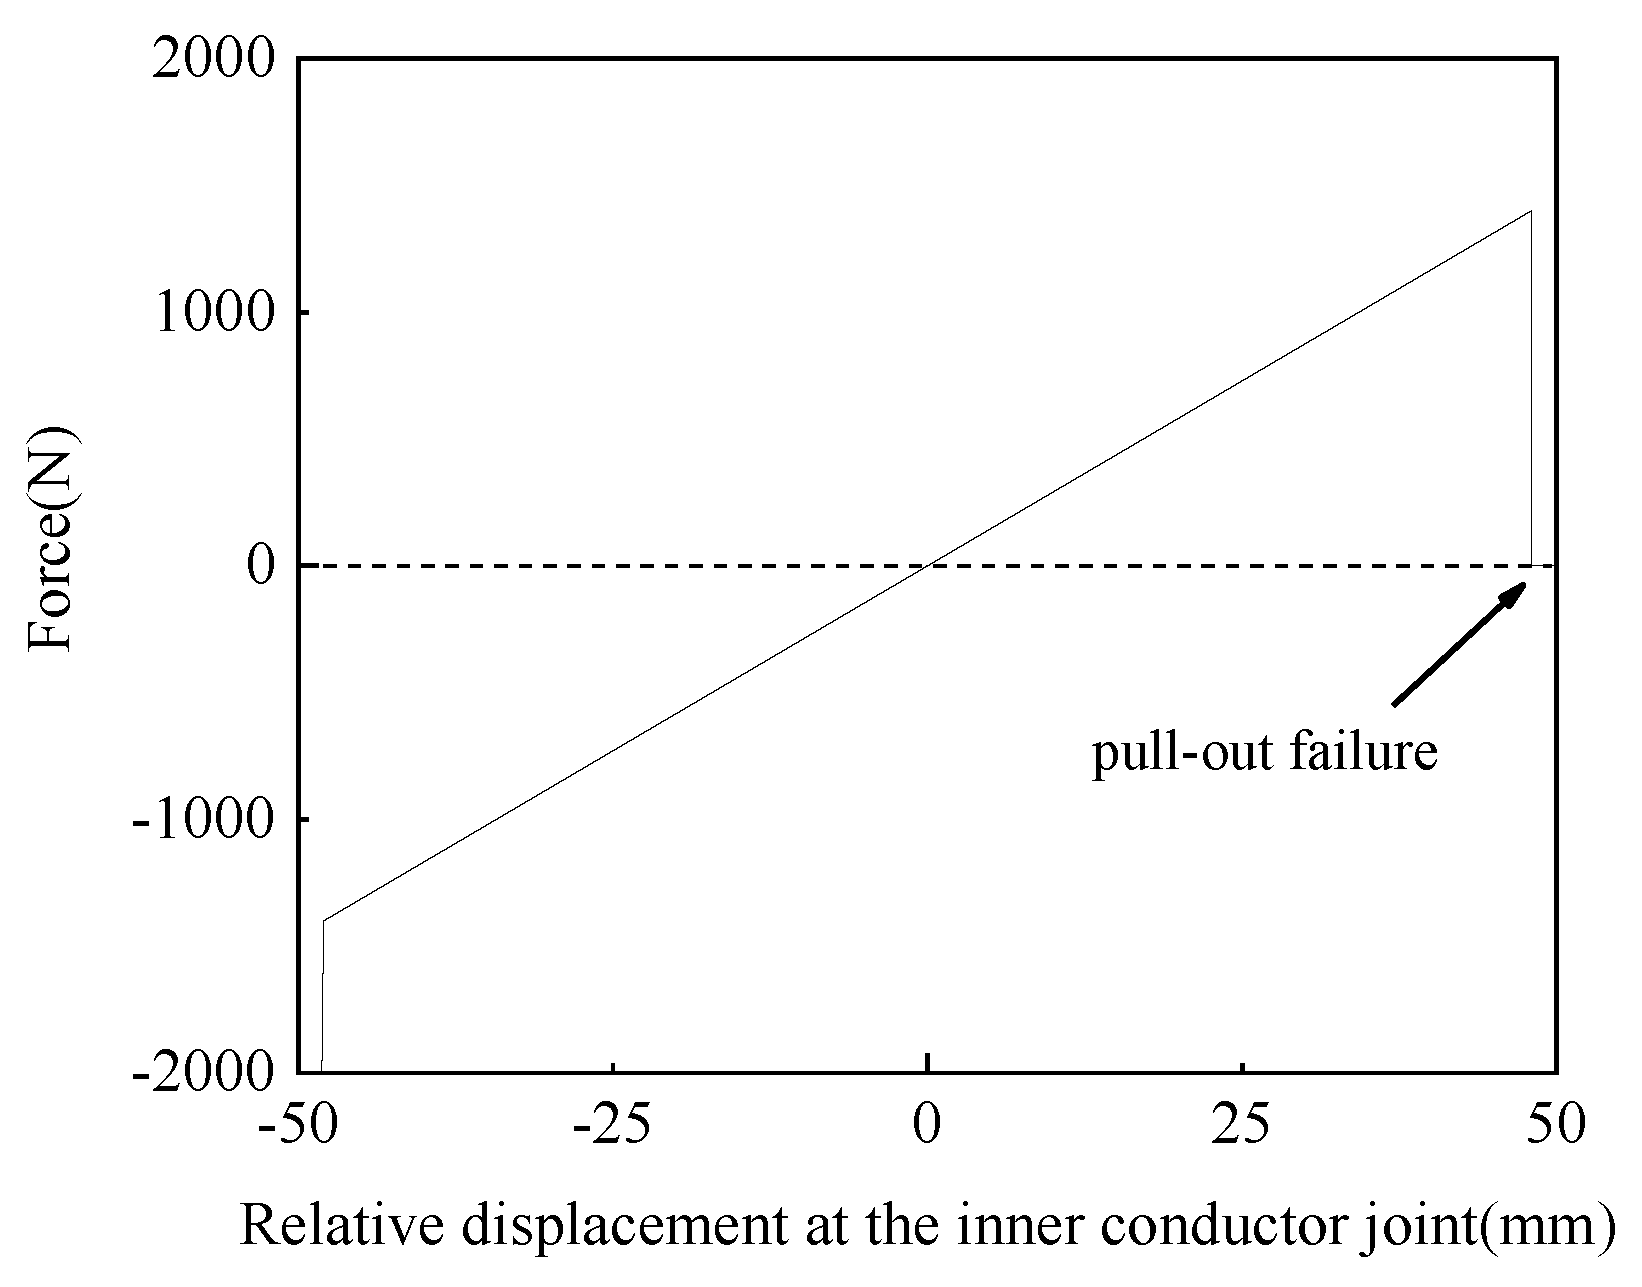
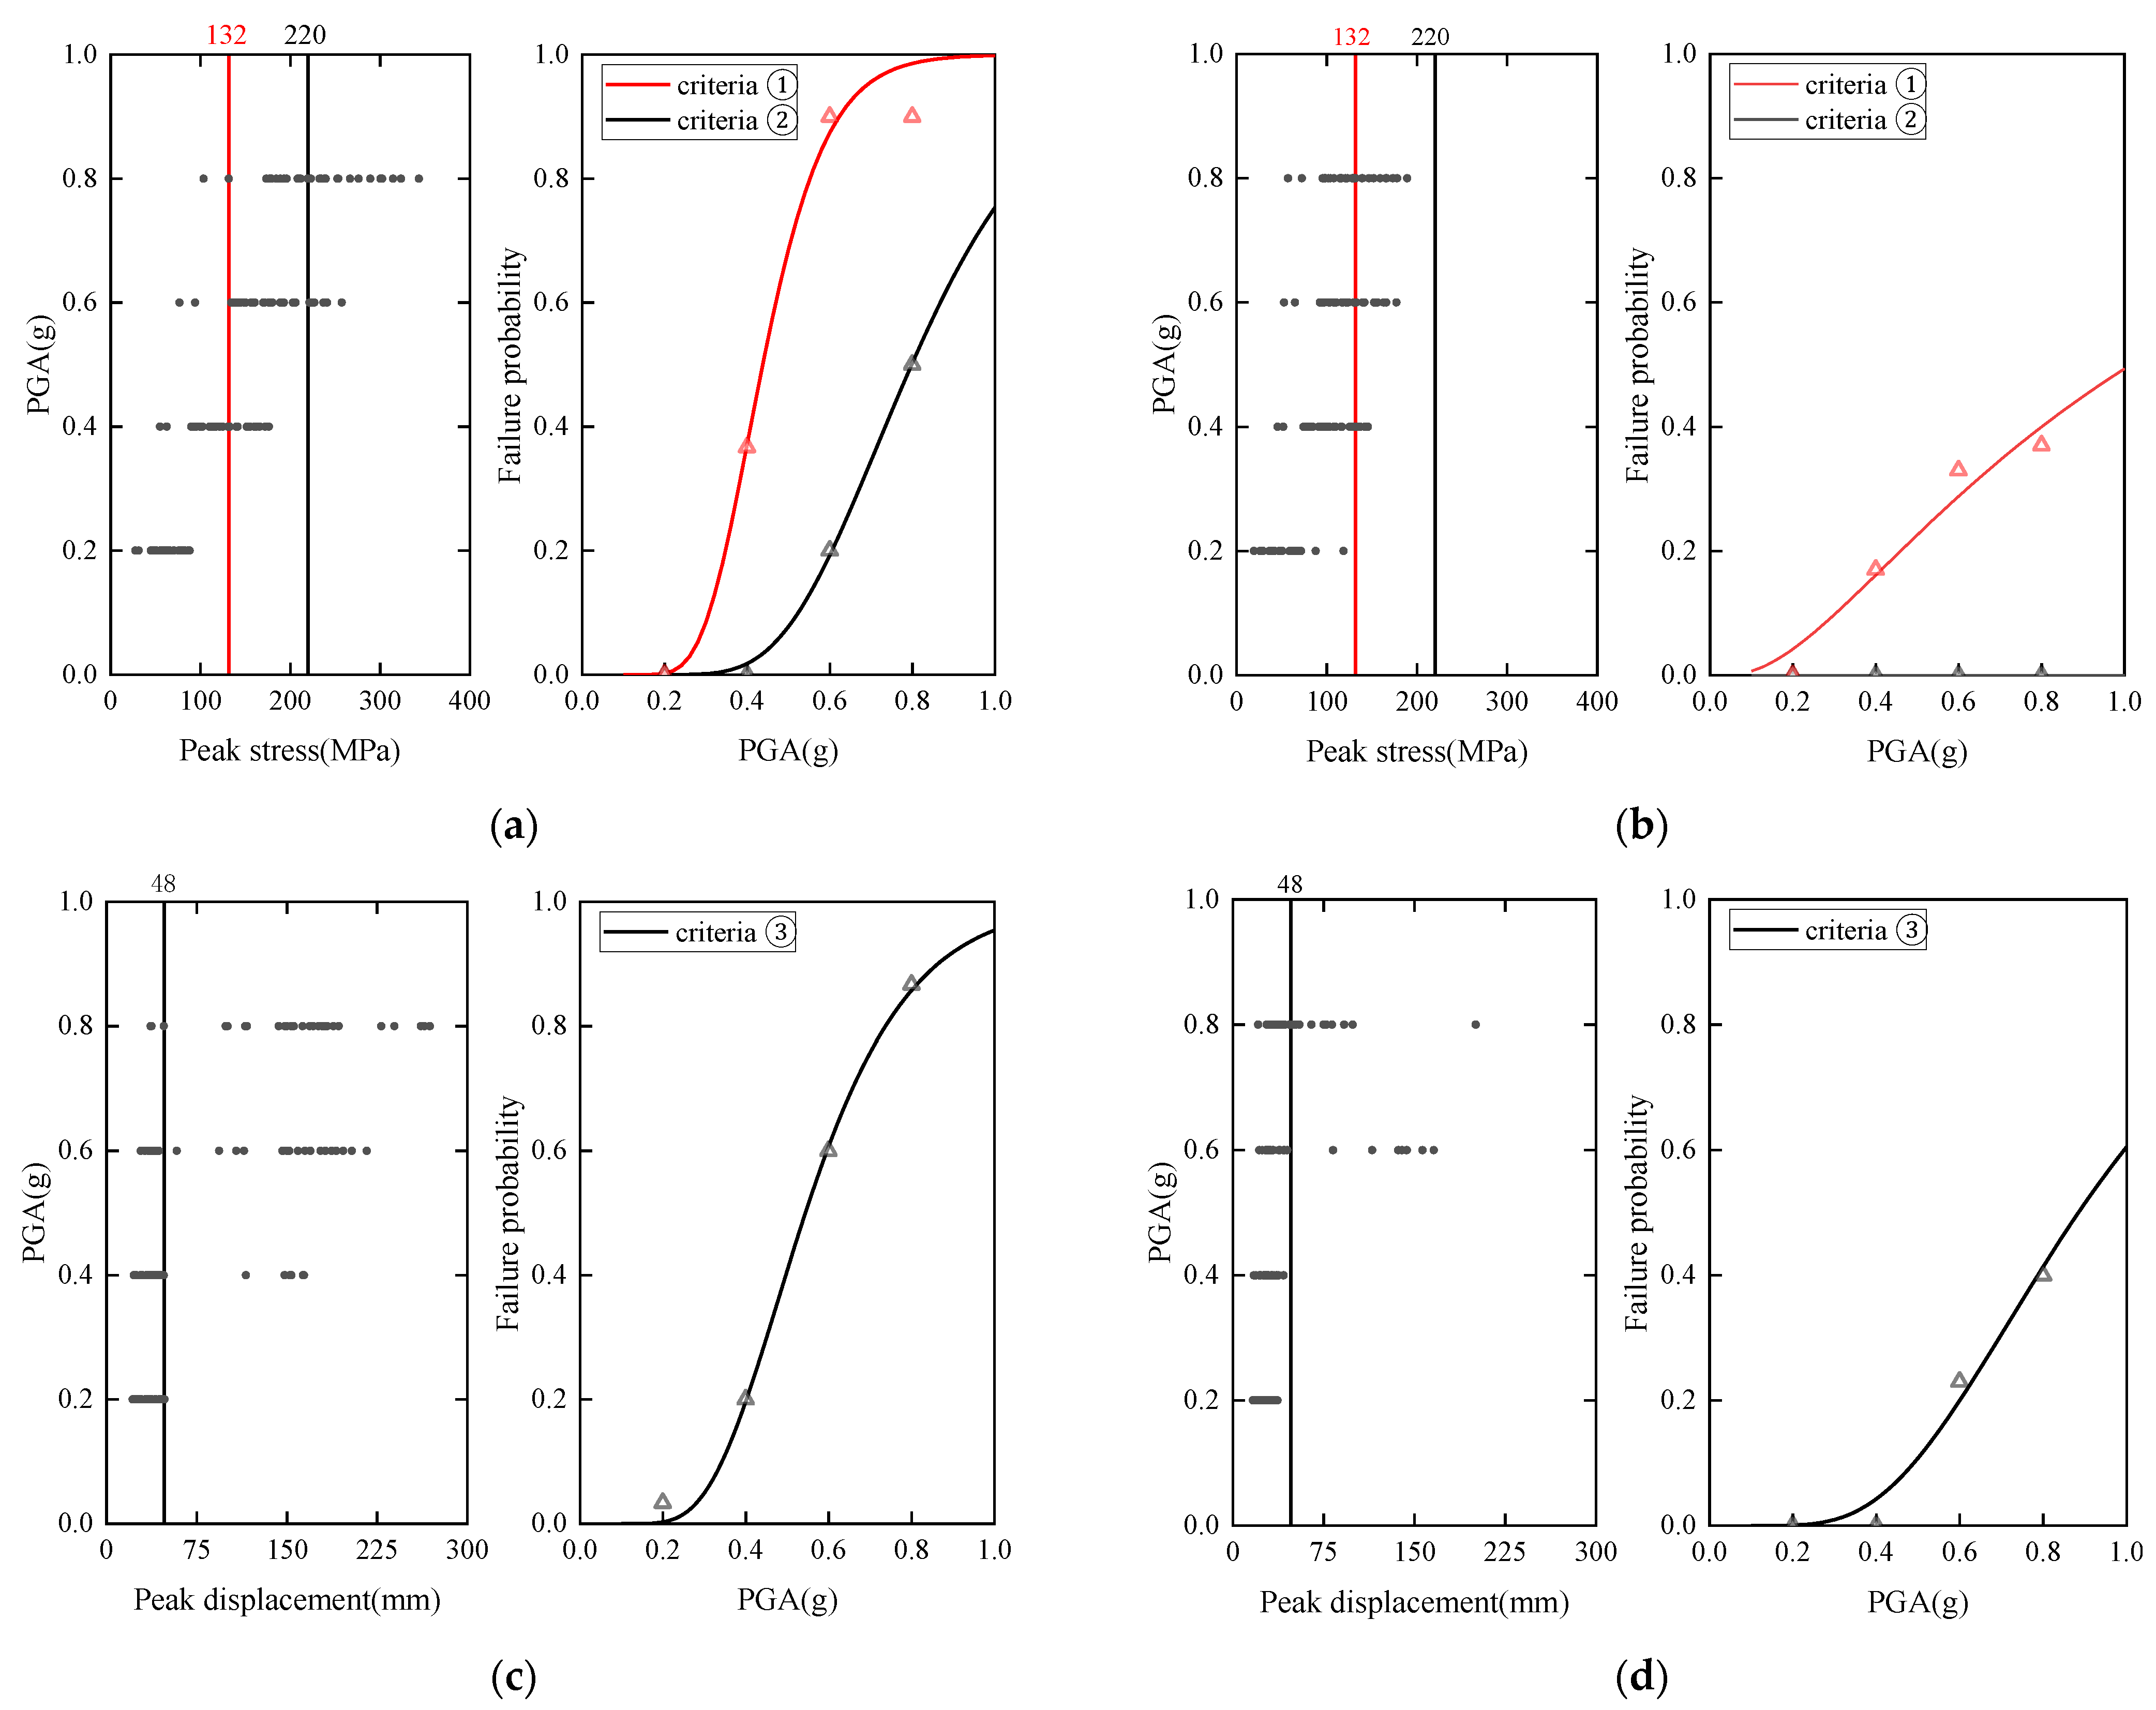
4.1. Seismic Failure Criteria of GIL

Previous research has indicated that the seismic vulnerability of power equipment typically adheres to a logarithmic normal distribution [28,29,30]. When the peak ground acceleration (PGA) is x, the failure probability of a GIL can be represented by Formula (1).
P ( P G A = x ) = Φ ln x θ β
where Φ denotes the cumulative distribution function of the standard normal distribution. θ and β represent the mean and variance, respectively. Based on the fitting results, the seismic vulnerability curve of the GIL can be derived. To obtain the fitting results, it is crucial to acquire a specific number of sample points, namely the failure probabilities of the GIL under varying PGAs. Initially, this study selected 30 ground motion records, with the screening conditions and average acceleration response spectra of these seismic records outlined in the following text. Subsequently, these 30 seismic records were normalized with amplitudes of 0.2 g, 0.4 g, 0.6 g, and 0.8 g, allowing for the calculation of the GILs’ failure probability under these four sets of PGAs. The determination of the failure probability necessitates a clear understanding of the failure index.
Based on the previous research findings, two distinct failure modes of a GIL during seismic events have been identified: strength failure, indicated by a peak stress response exceeding the ultimate stress, and displacement exceeding the limit, leading to failure due to excessive relative displacement at the joint of the internal conductor corner. For the strength failure mode, the stress safety factor concept, as outlined in specification [20], is introduced. This implies that the ratio of ultimate stress to the actual stress response peak should not be less than 1.67, with an associated failure index. Consequently, the following three failure indicators have been established for GILs.
① The peak stress of the housing exceeds 60% of the limit stress (the factor of safety is 1.67, that is, 131.74 MPa), which is considered to cause damage.
② The peak stress of the housing exceeds that of the limit stress, 220 MPa, which is considered to cause damage.
③ The maximum displacement of the inner conductor joint exceeds 48 mm (limit value), which is considered to cause damage.
Among them, failure criteria ① and ② are considered from the perspective of strength and therefore become strength failure criteria, while failure criterion ③ is called the displacement failure criterion.

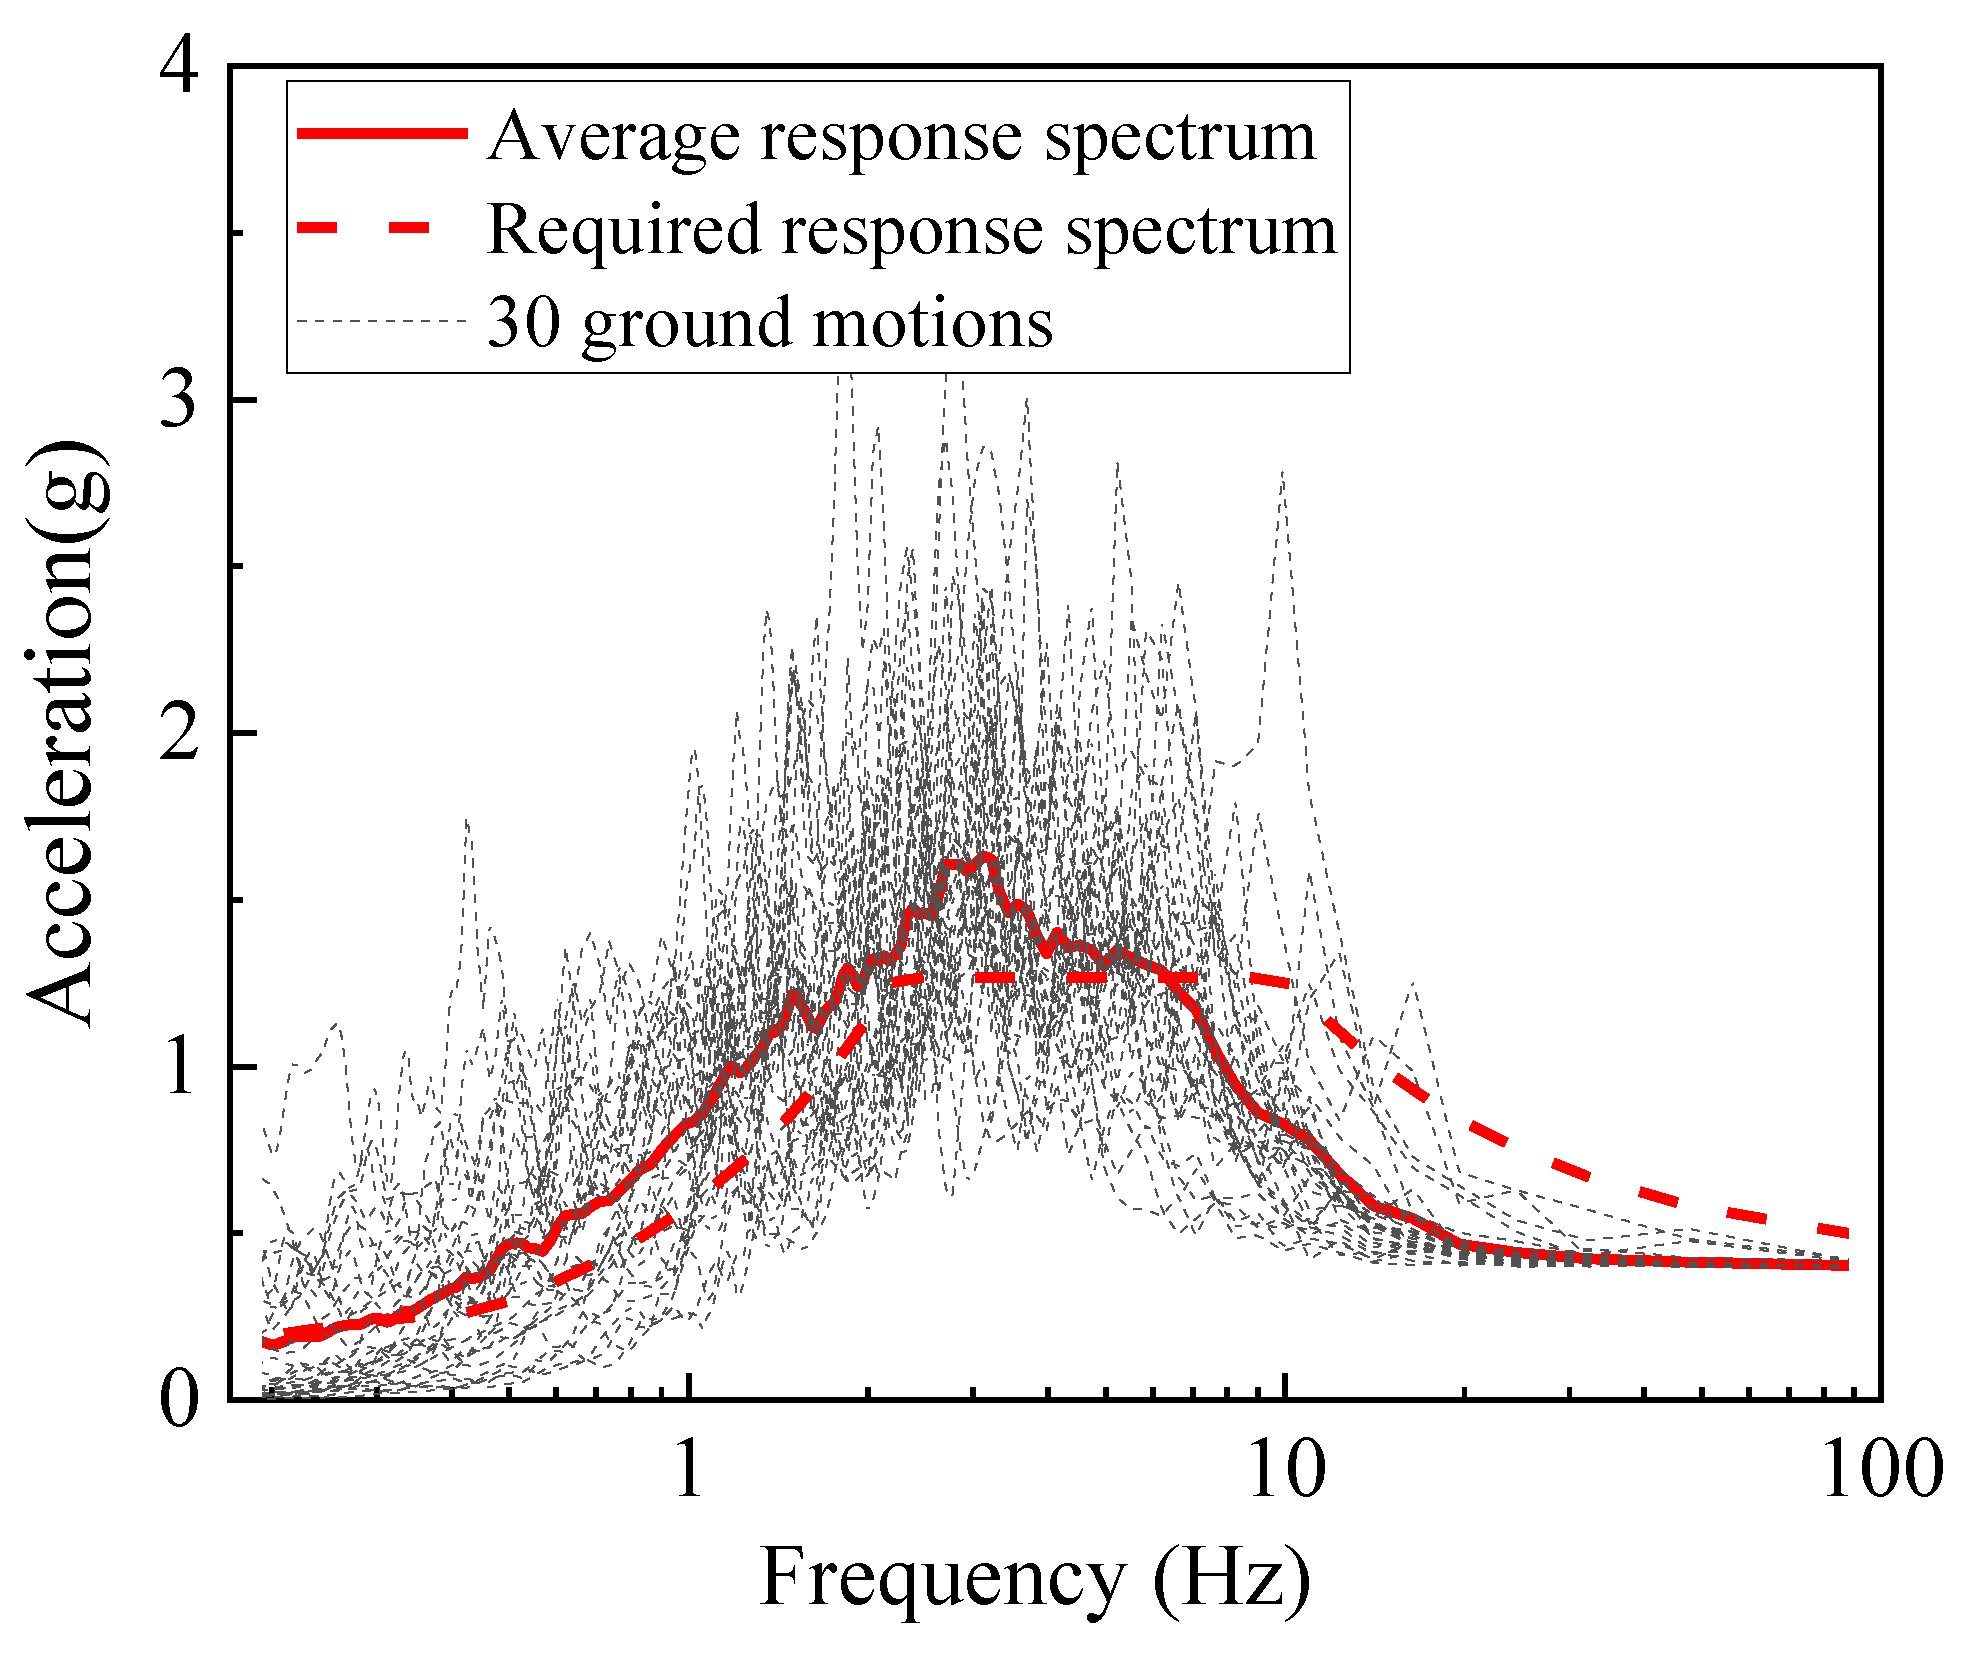
4.2. Selected Ground Motion Records

In accordance with the Chinese regulations, [23], the GIL site falls under the Class II category, with a shear wave velocity range of 140~250 m/s at a 30 m depth [31,32,33] and a characteristic period of 0.45 s. Utilizing these parameters, 30 natural seismic records were curated from the PEER database. Figure 15 illustrates their acceleration response spectra, average response spectra, and specification demand spectra, assuming a damping ratio of 2%. Notably, the average acceleration response spectrum of the 30 seismic motions effectively encapsulates the demand spectrum within the frequency range associated with the primary vibration modes of the GIL.

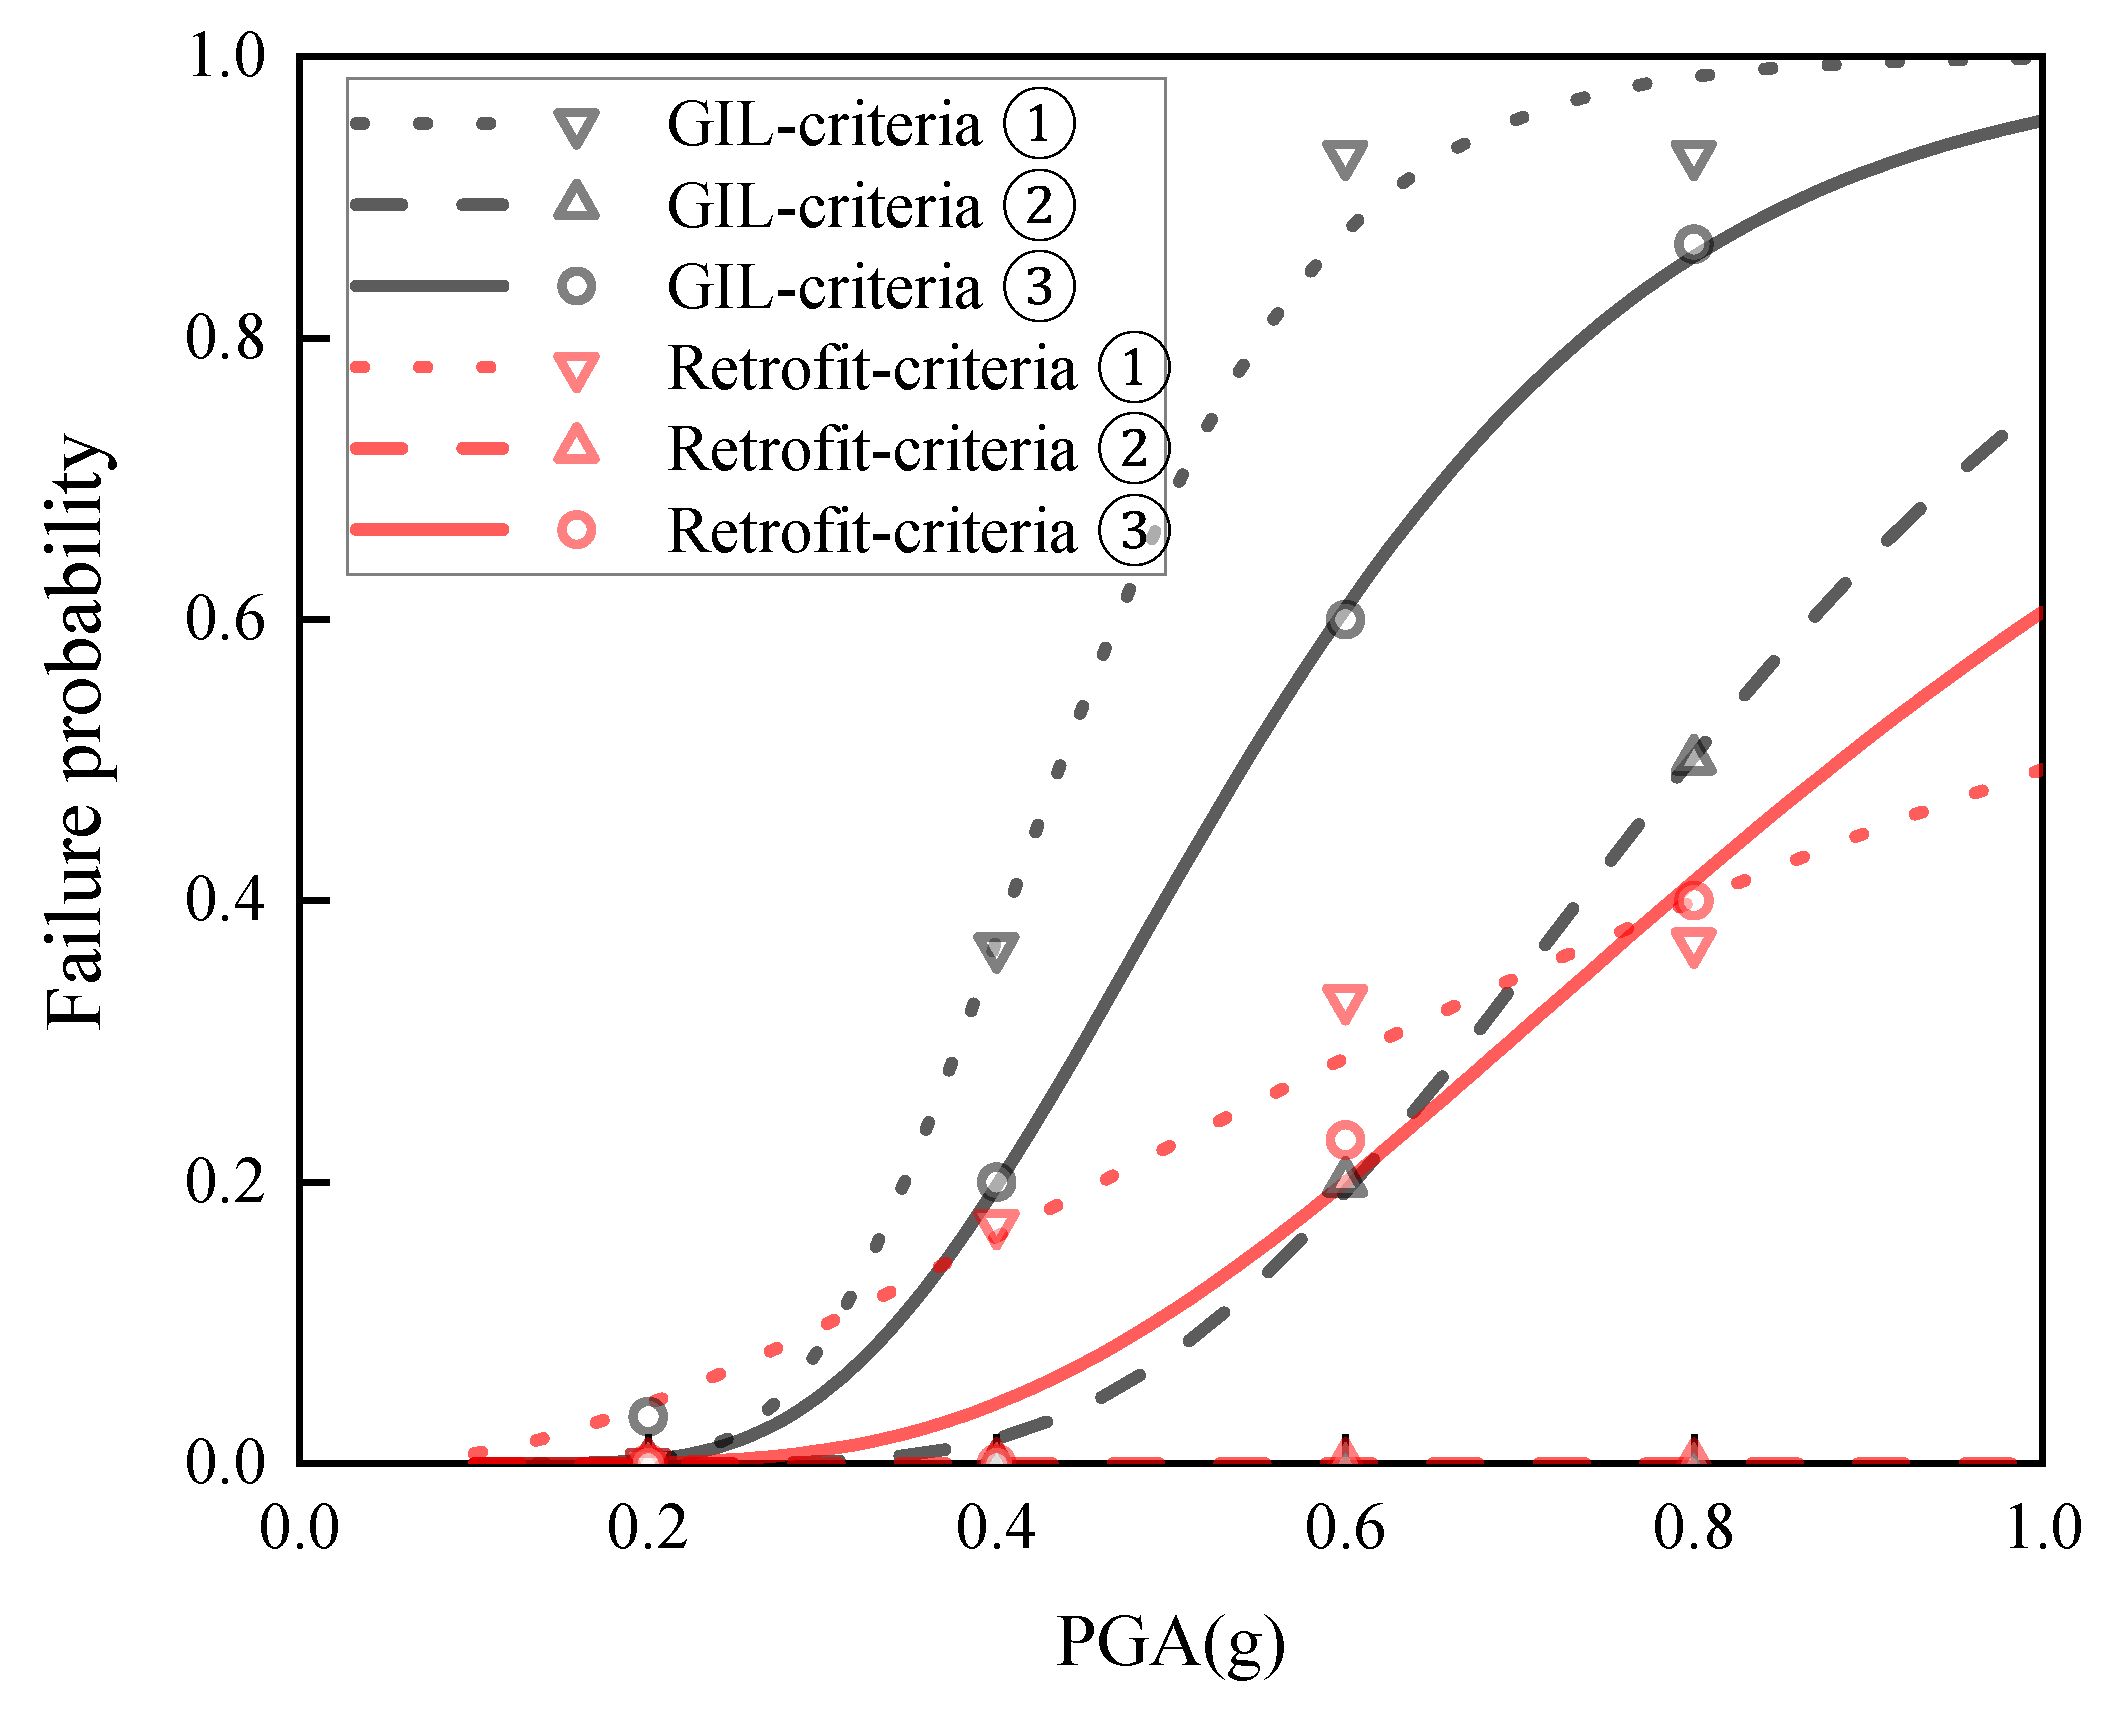
4.3. Seismic Fragility Curves of GIL

Under different failure criteria, the parameters in Formula (1) are determined through fitting based on the calculation results, as depicted in Table 5. Notably, for failure criterion ②, the failure probability of the reinforced GIL is 0; hence, parameter fitting was unnecessary. It is evident from the data that under each failure criterion, the average value for the reinforced GIL has noticeably increased compared to its unreinforced state. This increase signifies a significant decrease in the failure probability of the structure when the PGA is small.
For the GIL and reinforced GIL models, the seismic vulnerability curves fitted based on the calculation results are shown in Figure 16. The triangular markers on the vulnerability curve signify the failure probability, calculated by dividing the count of seismic waves causing failure by the total waves across time history calculations at PGAs of 0.2, 0.4, 0.6, and 0.8 g.
Figure 17 shows the seismic vulnerability curves of the GIL system before and after retrofitting under different failure criteria.
The following conclusions can be drawn from Figure 16 and Figure 17:
  • It can be clearly seen that under any failure criterion, the seismic vulnerability of the reinforced GIL is significantly reduced. Under failure criterion ①, when the PGA is 0.4 g, the failure probabilities of the GIL before and after the retrofit are 0.37 and 0.17, respectively, indicating a 53.7% reduction. When the PGA is 0.6 g, the failure probabilities of the GIL before and after the retrofit are 0.93 and 0.33, respectively, indicating a 64.5% reduction. Under failure criterion ②, when the PGA is 0.4 g, the failure probability of the GIL before and after the retrofit is 0. When the PGA is 0.6 g, the failure probabilities of the GIL before and after the retrofit are 0.2 and 0, respectively, indicating a 100% reduction. Under failure criterion ③, when the PGA is 0.4 g, the failure probabilities of the GIL before and after the retrofit are 0.2 and 0, respectively, indicating a 100% reduction. When the PGA is 0.6 g, the failure probabilities of the GIL before and after the retrofit are 0.6 and 0.23, respectively, indicating a 61.7% reduction.
  • Before the retrofit, the seismic vulnerability of the GIL under the strength failure criterion is higher than that under the displacement failure criterion. After the retrofit, the GIL seismic vulnerability curves corresponding to the two failure criteria intersect at a PGA of 0.8 g. When the PGA is less than 0.8 g, the strength failure criterion dominates, and when the PGA is greater than 0.8 g, the displacement failure criterion dominates.

5. Discussion

Currently, gas-insulated transmission lines (GIL) are increasingly prevalent in ultra-high-voltage converter power plants. However, with the constant threat of earthquakes, there is a growing need to enhance the seismic performance evaluation and retrofitting of GILs to ensure the safety of critical power transmission and transformation nodes during seismic events. This article conducts a comprehensive study on GILs, focusing on three key aspects: seismic performance, seismic retrofit methods, and seismic vulnerability, leading to the following conclusions:
(1)
The research begins by developing a detailed finite element model for the GIL, accounting for its internal structure and simulating the connections between the TPI, the housing, and the supports. The results indicate that the seismic weak point of the GIL is located at the corner where the axis height changes, and there are two types of failure modes, namely housing strength failure and displacement-exceeding-limit failure at the internal conductor joint.
(2)
An essential finding is the significant dynamic amplification effect of the supports, with an acceleration amplification coefficient generally exceeding 2.0. Importantly, the study reveals that the larger the fundamental frequency, the smaller the acceleration amplification coefficient of the supports. To reinforce the GIL, two approaches are explored: increasing the fundamental frequency of the support and altering the connection method between the support and the housing. The results indicate that both retrofit methods can effectively reduce peak displacements at the internal conductor joint. While increasing the fundamental frequency of the support reduces the acceleration amplification coefficient, it paradoxically increases the peak stress response of the housing. Conversely, fixing all mobile supports to the housing has a limited impact on the acceleration amplification coefficient but significantly reduces the peak stress response of the housing. These findings suggest that the dynamic amplification effect of the support is not the sole decisive factor influencing a GIL’s seismic performance.
(3)
The study delves further into the relationship between the relative displacement peak between key positions (S-4 and S-5) and the peak stress response of the GIL housing. It reveals a linear correlation, indicating that the peak housing stress increases proportionally with the rise in the relative displacement peak between these positions. The relative displacement between S-4 and S-5 primarily follows the first-order translational vibration mode of the pipeline in the X-direction, irrespective of the frequency associated with this vibration mode. Instead, it is solely dictated by the deformation of the pipeline angle between S-4 and S-5 within this vibration mode.
(4)
The study reinforces a GIL by fixing the connections between the sliding supports and the housing. The seismic vulnerability of the GIL is substantially reduced after the retrofit, particularly when the PGA surpasses 0.4 g. The seismic vulnerability of the GIL after the retrofit is found to decrease by over 50% compared to its pre-retrofit state, underscoring the effectiveness of this retrofit approach in minimizing the system’s susceptibility to seismic events.
In conclusion, the research establishes a foundational understanding of the seismic performance of GILs in ultra-high-voltage converter power substations and similar overhead pipelines in earthquake-prone areas. It introduces innovative reinforcement measures and uncovers that the relative displacement between key sections, rather than the support acceleration amplification effect, is the pivotal factor influencing the seismic performance of GILs. The limitations in this study include the exclusive consideration of one GIL layout, neglecting the impacts of height difference and diverse support arrangements. Additionally, vulnerability studies did not encompass intensity measure (IM) indicators beyond PGA, and earthquake-induced electrical function failure modes were not addressed.

Author Contributions

Writing—original draft, X.L.; Writing—review & editing, Q.X. and J.W. All authors have read and agreed to the published version of the manuscript.

Funding

This research was funded by National Key R&D Program of China grant Number: 2018YFC0809400 and The APC was funded by Natural Science Foundation of Jiangsu Province grant Number: BK20230400.

Data Availability Statement

Data are contained within the article.

Conflicts of Interest

The authors declare no conflict of interest.

References

  1. Zebouchi, N.; Haddad, M.A. A Review on Real-Size Epoxy Cast Resin Insulators for Compact High Voltage Direct Current Gas Insulated Switchgears (GIS) and Gas Insulated Transmission Lines (GIL)—Current Achievements and Envisaged Research and Development. Energies 2020, 13, 6416. [Google Scholar] [CrossRef]
  2. Koch, H.; Schuette, A. Gas insulated transmission lines for high power transmission over long distances. Electr. Power Syst. Res. 1998, 44, 69–74. [Google Scholar] [CrossRef]
  3. Khalil, M.; Ruggieri, S.; Tateo, V.; Nascimbene, R.; Uva, G. A numerical procedure to estimate seismic fragility of cylindrical ground-supported steel silos containing granular-like material. Bull. Earthq. Eng. 2023, 21, 5915–5947. [Google Scholar] [CrossRef]
  4. Işık, E. Structural Failures of Adobe Buildings during the February 2023 Kahramanmaraş (Türkiye) Earthquakes. Appl. Sci. 2023, 13, 8937. [Google Scholar] [CrossRef]
  5. Işık, E.; Avcil, F.; Büyüksaraç, A.; İzol, R.; Arslan, M.H.; Aksoylu, C.; Harirchian, E.; Eyisüren, O.; Arkan, E.; Güngür, M.Ş.; et al. Structural damages in masonry buildings in Adıyaman during the Kahramanmaraş (Turkiye) earthquakes (Mw 7.7 and Mw 7.6) on 06 February 2023. Eng. Fail. Anal. 2023, 151, 107405. [Google Scholar] [CrossRef]
  6. Bülbül, M.A.; Harirchian, E.; Işık, M.F.; Aghakouchaki Hosseini, S.E.; Işık, E. A Hybrid ANN-GA Model for an Automated Rapid Vulnerability Assessment of Existing RC Buildings. Appl. Sci. 2022, 12, 5138. [Google Scholar] [CrossRef]
  7. Karamanos, S.A.; Sarvanis, G.C.; Keil, B.D.; Card, R.J. Analysis and Design of Buried Steel Water Pipelines in Seismic Areas. J. Pipeline Syst. Eng. Pract. 2017, 8, 04017018. [Google Scholar] [CrossRef]
  8. Tian, Y.; Filiatrault, A.; Mosqueda, G. Seismic Response of Pressurized Fire Sprinkler Piping Systems II: Numerical Study. J. Earthq. Eng. 2014, 19, 674–699. [Google Scholar] [CrossRef]
  9. Tian, Y.; Filiatrault, A.; Mosqueda, G. Seismic Response of Pressurized Fire Sprinkler Piping Systems I: Experimental Study. J. Earthq. Eng. 2014, 19, 649–673. [Google Scholar] [CrossRef]
  10. Hosseini, M.; Ghalyani, E.; Ghorbani Amirabad, N. Development of double-variable seismic fragility functions for oil refinery piping systems. J. Loss Prev. Process Ind. 2020, 68, 104259. [Google Scholar] [CrossRef]
  11. Liu, A.; Chen, K.; Wu, J. State of art of seismic design and seismic hazard analysis for oil and gas pipeline system. Earthq. Sci. 2010, 23, 259–263. [Google Scholar] [CrossRef]
  12. Tsinidis, G.; Di Sarno, L.; Sextos, A.; Furtner, P. A critical review on the vulnerability assessment of natural gas pipelines subjected to seismic wave propagation. Part 2: Pipe analysis aspects. Tunn. Undergr. Space Technol. 2019, 92, 103056. [Google Scholar] [CrossRef]
  13. Tsinidis, G.; Di Sarno, L.; Sextos, A.; Furtner, P. A critical review on the vulnerability assessment of natural gas pipelines subjected to seismic wave propagation. Part 1: Fragility relations and implemented seismic intensity measures. Tunn. Undergr. Space Technol. 2019, 86, 279–296. [Google Scholar] [CrossRef]
  14. Zhao, K.; Jiang, N.; Zhou, C.; Li, H.; Cai, Z.; Zhu, B. Dynamic behavior and failure of buried gas pipeline considering the pipe connection form subjected to blasting seismic waves. Thin-Walled Struct. 2022, 170, 108495. [Google Scholar] [CrossRef]
  15. Jahangiri, V.; Shakib, H. Seismic risk assessment of buried steel gas pipelines under seismic wave propagation based on fragility analysis. Bull. Earthq. Eng. 2017, 16, 1571–1605. [Google Scholar] [CrossRef]
  16. De Risi, R.; De Luca, F.; Kwon, O.S.; Sextos, A. Scenario-Based Seismic Risk Assessment for Buried Transmission Gas Pipelines at Regional Scale. J. Pipeline Syst. Eng. Pract. 2018, 9, 04018018. [Google Scholar] [CrossRef]
  17. Rashidov, T.R.; Yuldashev, T.; Bekmirzaev, D.A. Seismodynamics of Underground Pipelines with Arbitrary Direction of Seismic Loading. Soil Mech. Found. Eng. 2018, 55, 243–248. [Google Scholar] [CrossRef]
  18. Sultanov, K.S.; Vatin, N.I. Wave Theory of Seismic Resistance of Underground Pipelines. Appl. Sci. 2021, 11, 1797. [Google Scholar] [CrossRef]
  19. Sun, D.; Guo, E.; Wu, H.; Liu, Z.; Mao, C.; Zhang, H.; Sun, X. Shaking Table Test of a Full-Scale RC Frame Structure with an Indoor Gas Piping System. Adv. Civ. Eng. 2022, 2022, 6869621. [Google Scholar] [CrossRef]
  20. Blasi, G.; Perrone, D.; Aiello, M.A.; Pecce, M.R. Seismic performance assessment of piping systems in bare and infilled RC buildings. Soil Dyn. Earthq. Eng. 2021, 149, 106897. [Google Scholar] [CrossRef]
  21. Kim, S.W.; Jeon, B.G.; Ahn, S.W.; Wi, S.W. Seismic behavior of riser pipes with pressure and groove joints using an in-plane cyclic loading test. J. Build. Eng. 2021, 34, 101911. [Google Scholar] [CrossRef]
  22. GB 50260-2013; Ministry of Housing and Urban-Rural Development of the People’s Republic of China (MOHURD), Code for Seismic Design of Electrical Installations. Ministry of Housing and Urban-Rural Development: Beijing, China, 2013.
  23. GB 50011-2016; Ministry of Housing and Urban-Rural Development of the People’s Republic of China (MOHURD), Code for Seismic Design of Buildings. Ministry of Housing and Urban-Rural Development: Beijing, China, 2016.
  24. GB 50191-2012; Ministry of Housing and Urban-Rural Development of the People’s Republic of China (MOHURD), Code for Seismic Design of Special Structures. Ministry of Housing and Urban-Rural Development: Beijing, China, 2012.
  25. GB 50981-2014; Ministry of Housing and Urban-Rural Development of the People’s Republic of China (MOHURD), Code for Seismic Design of Mechanical and Electrical Equipment. Ministry of Housing and Urban-Rural Development: Beijing, China, 2014.
  26. Kwag, S.; Ryu, Y.; Ju, B.S. Efficient Seismic Fragility Analysis for Large-Scale Piping System Utilizing Bayesian Approach. Appl. Sci. 2020, 10, 1515. [Google Scholar] [CrossRef]
  27. Ju, B.S.; Gupta, A.; Ryu, Y. Seismic Fragility of Steel Piping System Based on Pipe Size, Coupling Type, and Wall Thickness. Int. J. Steel Struct. 2018, 18, 1200–1209. [Google Scholar] [CrossRef]
  28. Bender, J.; Farid, A. Seismic vulnerability of power transformer bushings. Eng. Struct. 2018, 162, 1–10. [Google Scholar] [CrossRef]
  29. Wen, J.; Li, X.; Xie, Q. Cost-effectiveness of base isolation for large transformers in areas of high seismic intensity. Struct. Infrastruct. Eng. 2021, 18, 745–759. [Google Scholar] [CrossRef]
  30. Baker, J.W. Efficient Analytical Fragility Function Fitting Using Dynamic Structural Analysis. Earthq. Spectra 2015, 31, 579–599. [Google Scholar] [CrossRef]
  31. Dobry, R.; Borcherdt, R.D.; Crouse, C.B.; Idriss, I.M.; Joyner, W.B.; Martin, G.R.; Power, M.S.; Rinne, E.E.; Seed, R.B. New Site Coefficients and Site Classification System Used in Recent Building Seismic Code Provisions. Earthq. Spectra 2000, 16, 41–67. [Google Scholar] [CrossRef]
  32. Borcherdt, R.D. Estimates of Site-Dependent Response Spectra for Design (Methodology and Justification). Earthq. Spectra 1994, 10, 617–653. [Google Scholar] [CrossRef]
  33. Seed, H.B.; Ugas, C.; Lysmer, J. Site-dependent spectra for earthquake-resistant design. Bull. Seismol. Soc. Am. 1976, 66, 221–243. [Google Scholar] [CrossRef]
Figure 1. Gas-insulated transmission line.
Buildings 13 02968 g001
Figure 2. Standard linear unit structural form of GIL.
Buildings 13 02968 g002
Figure 3. The composition and structure of GIL.
Buildings 13 02968 g003
Figure 4. Axial mechanical behavior of corner of conductor.
Buildings 13 02968 g004
Figure 5. The first six vibration modes of the GIL model.
Buildings 13 02968 g005
Figure 6. RRS, acceleration response spectra and average acceleration response spectrum of selected ground motions. (a) X-direction; (b) Y-direction; (c) Z-direction.
Buildings 13 02968 g006
Figure 7. Key seismic response peaks at different parts of a GIL. (a) Peak stress responses; (b) peak relative displacement responses.
Buildings 13 02968 g007
Figure 8. The weak position and failure mode of GIL under earthquake.
Buildings 13 02968 g008
Figure 9. Layout and numbering of support types.
Buildings 13 02968 g009
Figure 10. Outline drawings and numbering of different supports.
Buildings 13 02968 g010
Figure 11. Support dynamic amplification effect. (a) Acceleration amplification coefficient of supports and housing; (b) relationship of support fundamental frequency and amplification coefficient.
Buildings 13 02968 g011
Figure 12. Spectral acceleration amplification curves of supports and housing. (a) F-1 and F-2; (b) S-1 and S-3; (c) S-4 and S-5; (d) S-7.
Buildings 13 02968 g012
Figure 13. Key factors influencing GIL peak responses. (a) Relationship of peak stress of housing and relative displacement between S-4 and S-5; (b) power spectrum of relative displacement between S-4 and S-5.
Buildings 13 02968 g013
Figure 14. Comparison of target vibration modes under different retrofit conditions.
Buildings 13 02968 g014
Figure 15. Average acceleration response spectrum of 30 sets of ground motion records and required response spectrum.
Buildings 13 02968 g015
Figure 16. Seismic vulnerability analysis results of GIL before and after retrofit. (a) GIL under strength failure criterion; (b) reinforced GIL under strength failure criterion; (c) GIL under displacement failure criterion; (d) reinforced GIL under displacement failure criterion.
Buildings 13 02968 g016
Figure 17. Seismic vulnerability curves of GIL before and after retrofit under different failure criteria.
Buildings 13 02968 g017
Table 1. Structural and mechanical parameters of GIL components.
ComponentsDimensions (mm)Elastic Modulus (GPa)Density (kg/m3)Ultimate Strength (MPa)
Inner conductorΦ 175.0, t 7.5 1694225220
TPI 2Φ 41.115232030
Outer housingΦ 258.0, t 8.0 1692690220
Supports/2067850235
Φ 1 represents the outer diameter, t represents the thickness; TPI 2 with solid cross-section.
Table 2. Information of seven sets of selected ground motions.
RecordEarthquakeStationYearMwEpicentral Distance (km)
El CentroImperial Valley—02El Centro Array #919406.9512.98
Chi-ChiChi-Chi, TaiwanTCU05419997.6237.64
RSN66San Fernando, CA, USAHemet Fire Station19716.61153.8
RSN82San Fernando, CA, USAPort Hueneme19716.6180.21
RSN1527Chi-Chi, TaiwanTCU10019997.6242.77
Arti-1 (RSN1101)Kobe, JapanAmagasaki19956.9038.79
Arti-2 (RSN4031)San Simeon, CA, USATempleton20036.5036.63
Table 3. Acceleration amplification coefficients of housing and support under different retrofit conditions.
SupportsOriginal Model 2 f s u p p o r t 5 f s u p p o r t Fixed All Supports
HousingSupportHousingSupportHousingSupportHousingSupport
F-11.531.531.241.221.121.091.601.62
F-22.432.412.422.401.971.952.752.73
S-14.392.573.782.003.741.344.234.41
S-34.323.053.722.183.671.364.294.29
S-42.473.262.513.552.032.852.802.81
S-54.254.684.004.273.312.813.623.64
S-72.261.102.251.082.111.081.181.18
Table 4. Critical peak responses of GIL under different retrofit conditions.
Ground MotionsOriginal Model 2 f s u p p o r t 5 f s u p p o r t Fixed All Supports
S (MPa)D (mm)S (MPa)D (mm)S (MPa)D (mm)S (MPa)D (mm)
El Centro206.330.70 239.91 42.82 186.14 42.22 170.48 23.57
RSN66171.285.70 318.37 46.21 252.64 46.29 230.49 35.00
RSN82236.4576.51 318.49 39.99 358.64 38.11 202.45 26.16
RSN1527212.9878.13 272.84 60.33 202.88 59.63 216.87 40.44
Chichi29042.20 269.47 42.96 207.14 38.97 178.69 21.01
Arti-1226.4841.37 226.59 41.04 226.63 40.03 173.43 23.84
Arti-2219.0442.88 252.43 41.87 219.56 42.87 206.79 22.99
Average223.2156.78 271.16 45.03 236.23 44.02 197.03 27.57
Table 5. Fitting results of seismic vulnerability parameters.
Failure CriteriaOrigin Model of GILReinforced GIL
θβθβ
−0.840.230.020.94
−0.230.33//
−0.610.36−0.120.46
Disclaimer/Publisher’s Note: The statements, opinions and data contained in all publications are solely those of the individual author(s) and contributor(s) and not of MDPI and/or the editor(s). MDPI and/or the editor(s) disclaim responsibility for any injury to people or property resulting from any ideas, methods, instructions or products referred to in the content.

