Article

High-Speed Videogrammetry with Mutually Guided Target Tracking under Occlusion for Masonry Building Structure Displacement on a Shaking Table

1
Key Laboratory for Urban Geomatics of National Administration of Surveying, Mapping and Geoinformation, Beijing University of Civil Engineering and Architecture, 1 Zhanlanguan Road, Beijing 100048, China
2
National Key Laboratory of Intense Pulsed Radiation Simulation and Effect, Northwest Institute of Nuclear Technology, Xi’an 710024, China
*
Author to whom correspondence should be addressed.
Buildings 2023, 13(12), 2959; https://doi.org/10.3390/buildings13122959
Submission received: 5 November 2023 / Revised: 19 November 2023 / Accepted: 24 November 2023 / Published: 28 November 2023

Abstract

:
High-speed videogrammetric measurements are widely used on shaking tables. However, during progressive collapse experiments, the protective string used to ensure the safety of personnel and the shaking table, mandated by safety considerations, can partially occlude the structural model. To address the problem of inaccurate tracking of the ellipse targets in image sequences due to the partial occlusion, this paper proposes a novel mutually guided tracking method for the partial occlusion situations. Firstly, the strategy of loopback detection is proposed to eliminate the cumulative errors with the initial tracking model and to replace the initial results of the tracking with those from the loopback detection. Secondly, tiny offset compensation is used to solve the problem of deviations. The experimental results demonstrate that the proposed method can achieve single-point localization at the sub-millimeter level and interlayer localization at the millimeter level within partially occluded environments. It is important that the proposed method meets the requirements of experimental accuracy on shaking tables and ensures the safety of personnel and facilities.

1. Introduction

At present, there are many masonry buildings around the world, which can easily undergo a progressive collapse during earthquakes [1]. Almost all of the damaged buildings in the 7.6 magnitude earthquake in the northern region of Pakistan in 2005 were masonry buildings [2]. Moreover, over the past 100 years, 77 percent of fatalities were caused primarily by the progressive collapse of masonry buildings in earthquakes [3]. Therefore, it is crucial to test the scaled masonry building models on a shaking table with the simulated seismic condition before many practical applications, as this can provide the response parameter to evaluate the tested structure model [4,5,6].
Displacement is a typical response parameter employed to analyze seismic performance [7]. There are many contact-based transducers that can be used to obtain the dynamic displacement response, such as dial gauges, fiber-based sensors and linear variable differential transformers (LVDTs) [8]. However, when a structure is damaged, the contact-based transducer may be unavailable, which also greatly depends on experts’ experience in selecting the mounting positions. In addition, in progressive collapse experiments, contact-based transducer may be damaged due to the potential collapse risk, resulting in some property damage. To overcome these limitations, non-contact-based transducers have been applied to obtain the dynamic displacement response, such as the global positioning system (GPS), laser Doppler vibrometer (LDV) and terrestrial laser scanning (TLS) [9]. GPS and TLS can only obtain the dynamic displacement response at lower sampling frequencies, which are not suitable for application on shaking tables [10,11]. LDV is one of the most reliable equipment for dynamic monitoring, but its high cost means be a significant expenditure [12].
With its advantages of being non-contact and having a high frame rate, high precision and low cost, high-speed videogrammetry has been widely used for structure monitoring on the shaking table in civil engineering [13]. The captured video date is processed to obtain the displacement response of the monitored target. However, in the field of progressive collapse experiments on the shaking table, the precision of the displacement response will be decreased because the indispensable protective facilities (e.g., protection frames [14] to prevent the specimen from falling and foam and nylon string [15] to prevent damage to the artifact) will occlude the monitoring targets. The monitored targets can be divided into two categories: natural targets [16,17] and artificial targets [18,19]. The natural targets usually disappear completely when they are occluded, making it impossible to obtain continuous displacement. To obtain the continuous displacement response under occlusion, the artificial targets which disappear partially are usually pasted on the surface of the interested key location of the tested objects [20,21,22,23,24]. The ellipse target is widely used as one type of artificial target in photogrammetry and computer vision, because it is characterized by geometric and rotational invariance. Therefore, it is a fundamental prerequisite to accurately obtain the ellipse targets under partial occlusion in order to analyze the displacement response. The center and radius of the ellipse targets are obtained by a detection algorithm in the first frame. The pixel-wise motion is obtained by a tracking algorithm in image sequences. However, the detection and tracking of ellipse targets under partial occlusion need to be discussed in more detail.
In the field of ellipse detection, there are three generalized methods without designing for specific scenarios, including the Hough transform method [25,26], deep-learning methods [27] and point-fitting methods [28,29,30,31]. The basic idea of the Hough transform method is that arbitrary edge pixels are voted into a 5D parameter space and then detecting the ellipse when the local peak occurs. But this is not compatible with the characteristics of large data owing to its heavy computation burden [31]. Deep-learning methods are still inappropriate for direct ellipse detection due to the non-interpretability of the detection method and the high cost associated with manual annotation. What is more significant is its limited generalizability [31]. Point-fitting methods use the connectivity between edge pixels and geometric constraints to fit ellipses accurately by finite edges. Furthermore, the method is especially valuable in partially occluded conditions, as it performs well in fitting ellipses even when supplied with limited arc segment information.
After the initial ellipse target is detected in the first frame, target tracking methods will be applied to obtain all the ellipse targets in image sequences. It is generally accepted that conventional object tracking methods can be divided into two categories: discriminative model methods and generative model methods [32,33,34]. Discriminative model methods usually train samples using machine learning to track the region of detection [34,35,36,37]. However, it is difficult to determine the coordinates of the ellipse’s center at a sub-pixel level. The generative methods model the object area in the current frame and find the most similar area in the next frame. The methods can track ellipse targets at the sub-pixel level. Commonly used methods are those such as the mean shift method [38] and optical flow method. The mean shift method is only suitable for single-target tracking. The Kanada-Lucas-Tomasi (KLT) method [39] as a type of optical flow method that is more suitable for ellipse target tracking because its fundamentals are highly related with high-speed videogrammetry. But under partially occluded conditions, it is still difficult for the KLT method to track the targets accurately and effectively [17].
This study investigated the displacement response issue with the help of ellipse targets under partially occluded conditions on a shaking table. In part, the partially occluded condition is caused by the introduction of nylon string that is used to protect the safety of the expensive shaking table and to reduce the shock to the cover-plate system, which is equipped to provide physical protection to the servo-hydraulic system in the reaction mass from falling debris and objects [40]. Especially in the progressive collapse of masonry buildings experiments, partial or global facades will collapse with an increase in the seismic amplitude [41]. Therefore, it is important to utilize the nylon string for protection. However, the introduction of the nylon string makes ellipse targets partially occluded, which decreases the accuracy of the displacement response. To address this issue, a novel high-speed videogrammetry framework is proposed, which mainly includes ellipse target detection, mutually guided tracking and 3D reconstruction. Our main contribution is to propose the mutually guided tracking method to solve the problem of ellipse target tracking under partial occlusion. Firstly, the strategy of ellipse-target loopback detection is used to update the initial KLT tracking model and to replace the initial result of tracking with that from the loopback detection. Secondly, the tiny offset is calculated through robust SIFT (scale-invariant feature transform) [42] filtering to compensate for the deviations in local frames when the loopback detection is invalid. The sequential image coordinates of ellipse targets are obtained by the proposed tracking method. The 3D spatial coordinates are obtained by reconstruction of the image coordinates to analyze the displacement response to help monitor the masonry building on the shaking table.
The rest of this paper is organized as follows: The proposed methodology is expressed in Section 2. The results and analysis of both the simulated experiments and the structural model experiments are delved into in Section 3. Finally, Section 4 presents the conclusions drawn from the study.

2. Methods

The entire framework of the proposed novel high-speed videogrammetric measurement method under a partially occluded environment is shown in Figure 1, which mainly includes three key components: ellipse target detection, mutually guided tracking and 3D reconstruction. Firstly, the ellipse targets are detected in the first frame to obtain the center and radius using the arc-support line segment (LS) [31] method, which is one of the widely used point-fitting methods. Secondly, after detecting the ellipse targets in the first frame, the proposed mutually guided tracking method is applied to obtain the image coordinates of all ellipse targets in image sequences. Finally, the 3D spatial coordinates of ellipse targets are reconstructed to obtain the displacement response. Additional details will be presented in the following sections.

2.1. Ellipse Target Detection in the First Frame

To obtain a precise dynamic displacement response in the high-speed videogrammetric measurements, the first step is to detect the ellipse targets accurately, including both the centers and the radii. The accuracy of the detection will directly affect the image sequence tracking and the ellipse-target 3D reconstruction results. Especially in the partially occluded environment, it is more difficult to detect the ellipse target accurately because the edge of the ellipse may be occluded by strings or other things. Thus, it is essential to fit a complete ellipse accurately only under finite ellipse edge conditions. The arc-support LS method, which is a type of point-fitting method, can be applied to fit an accurate ellipse by setting the completeness of the ellipse and the ratio of supported edge inliers. When the string goes through the central region of the ellipse, complete ellipses can be fitted well based on finite edges by using this method, which can determine the center and radius of the ellipse targets. The detected center is used to track the center of ellipse targets in image sequences and to reconstruct the 3D spatial coordinates. Many detected ellipses are outlying due to occlusion of the string. Thus, the radius is used to select the interested ellipse by prior knowledge. However, when the string goes through the edge region of the ellipse, available edges are damaged, so there will be some inaccuracy in fitting the ellipse. Thus, the first frame does not represent the photographic moment but, rather, the moment when the ellipse target is accurately detected. The center and radius of the ellipse target are accurate at this point.

2.2. Mutually Guided Tracking in Image Sequences

After detecting the initial ellipse targets in the first frame, the KLT method, which is a type of tracking method at the pixel level, is used to obtain the center in image sequences. But in a partially occluded environment, the accuracy of the KLT method is unsatisfactory. To overcome the inaccuracy of the KLT method in a partially occluded environment, a mutually guided tracking method is proposed to track ellipse targets accurately in image sequences. It includes three key components: the initial KLT tracking model, loopback detection and tiny offset compensation. The initial tracking model is built using the KLT method. When the protective string goes through the ellipse target, this will produce cumulative errors in the initial tracking model due to the different moving trends between the string and the ellipse target. Hence, the strategy of loopback detection is introduced in this study to eliminate these cumulative errors by updating the tracking model and replacing the initial tracking results with those from the loopback detection. The center of the ellipse targets is then compensated for by calculating the tiny offset through robust SIFT filtering to solve the problem of deviations when the loopback detection is invalid. The methods of KLT, loopback detection and tiny offset compensation are discussed as follows.

2.2.1. Initial Tracking Model Using the KLT Method

After detecting the ellipse targets in the first frame, the initial tracking model is also built according to KLT using the first frame. The assumptions of the KLT method are highly related to the high-speed videogrammetry. It assumes that the brightness is invariable in consecutive frames. In addition, it assumes that the movement of the object is very slow in consecutive frames. Since the exposure time of high-speed cameras is extremely short, the captured object exists in an instantaneous state during each frame. In the instantaneous state, the brightness is invariable, and the object (ellipse target in this study) is nearly stationary. Moreover, the method also assumes that the object has the same trends in mobility as the surrounding pixels. This is a highly consistent hypothesis because the ellipse target occupies an image block.
The specific process of the KLT method is expressed as follows. Under the assumptions of brightness invariance and mobility instantaneity, an obtained grayscale feature point I x , y at frame t will be I x + d x , y + d y at the t + d t frame:
I x + d x , y + d y , t + d t = I x , y , t .
The Taylor expansion of the first-order term on the left-hand side is
I ( x + d x , y + d y , t + d t ) I ( x , y , t ) + I x d x + I y d y + I t d t .
Based on the assumption of the brightness invariance,
I x d x + I y d y + I t d t = 0 .
Divide both sides simultaneously by dt,
I x d x d t + I y d y d t = I t ,
where d x / d t and d y / d t are the moving speed along the x-axis and y-axis, respectively. They can be denoted as u and v , respectively. I / x and I / y are the gradients along the x-axis and y-axis, respectively, which can also be denoted as I x and I y , respectively. I / t can be interpreted as the degree of change in the image gray level over time, denoted as I t . Equation (4) can be rewritten as
[ I x I y ] u v = I t .
Considering the third assumption, which states that all pixels within the image block of w w has the same motion trends, there will be w 2 formulas.
[ I x I y ] k u v = I t k ,   k = 1 , …… , w 2 .
Then, it can be rewritten as
A = [ I x , I y ] 1 [ I x , I y ] k ,   b = I t 1 I t k .
The least square equation can be listed as
u v * = ( A T A ) 1 A T b .
The sequential image coordinates of the ellipse targets’ center are obtained using the KLT method. However, in the initial tracking model that is built using the first frame, matrix A , which belongs to ellipse targets, will be substituted by some string grayscales I x I y k , where k represents the number of the string grayscale. The substitution of the string grayscale leads to inaccuracy due to different moving trends between the string and the ellipse target because they are not rigidly connected. If the initial tracking model is used for tracking, errors must be eliminated or they will accumulate gradually. To overcome the inaccuracy of the KLT method due to the substitution problem caused by partial occlusion, loopback detection and tiny offset compensation are proposed.

2.2.2. Loopback Detection

Ellipse target loopback detection is a redetection strategy conducted after the KLT approach. The typical strategy of tracking is to build the initial tracking model in the first frame and to track the ellipse target in the current frame. However, the initial tracking model will generate cumulative errors due to the introduce of the string. In terms of modelling methods, KLT utilizes the image gradient of the interested image block to track the center of ellipse targets. However, when the string occludes the central region of the ellipse target, the image block that should belong to the ellipse target will be substituted by the string. The phenomenon of image block substitution leads to the problem of inconsistent gradient-calculation changes due to the moving trend inconsistency between the string and the ellipse target. Hence, cumulative errors will be produced when using the initial tracking model. These can be eliminated by updating the tracking model using the loopback detection strategy. When the string goes through the central region of the ellipse target, the edges of the ellipse are at their clearest. As a result, it is opportune for accurate ellipse detection in the current frame. The tracking model is updated using the new image block in the current frame to track subsequent ellipse targets if the loopback detection is successful. And the initial result of the KLT approach will be replaced with the loopback detection result too. Cumulative errors will not be generated using the loopback detection strategy.

2.2.3. Tiny Offset Compensation

If the string occludes the edge of the ellipse target to some extent but the central region of the ellipse target is clear, the ellipse target loopback detection maybe invalid because finite edges are like straight line segments without curves. The invalid case only occurs in local frames due to the dynamic string. Although the image block of the tracking model is established around the center of ellipse targets, sub-pixel deviations may be generated because the phenomenon of image block substitution occurs in the region of the edges, not the center. Tiny offset compensation is proposed for the problem of deviations at the sub-pixel level in local frames using the updated tracking model. 
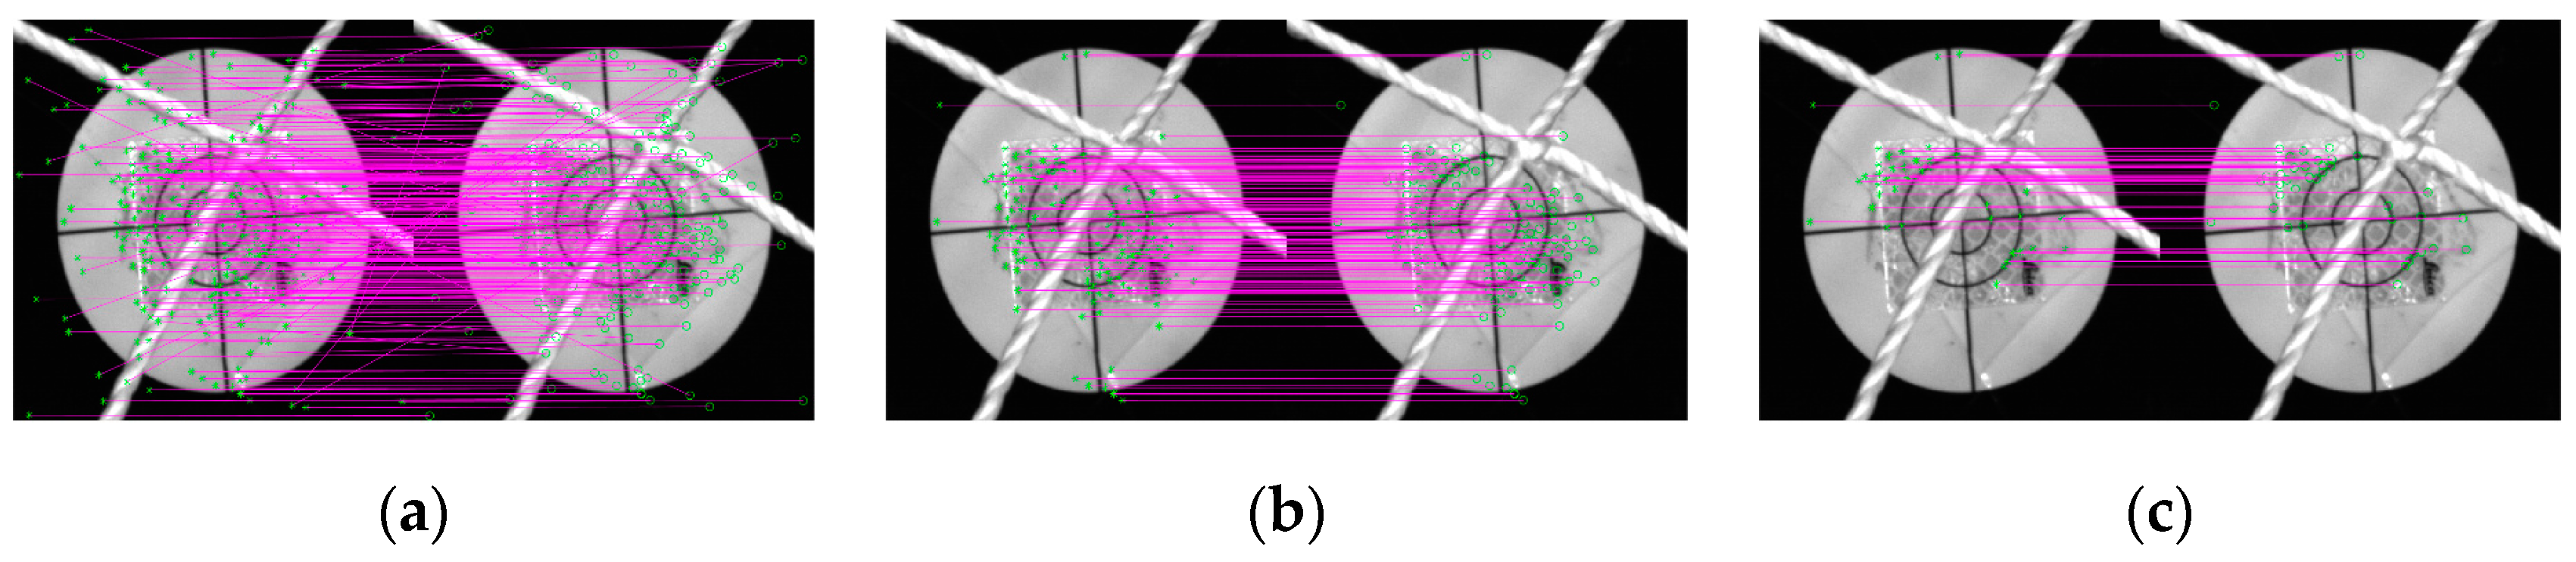
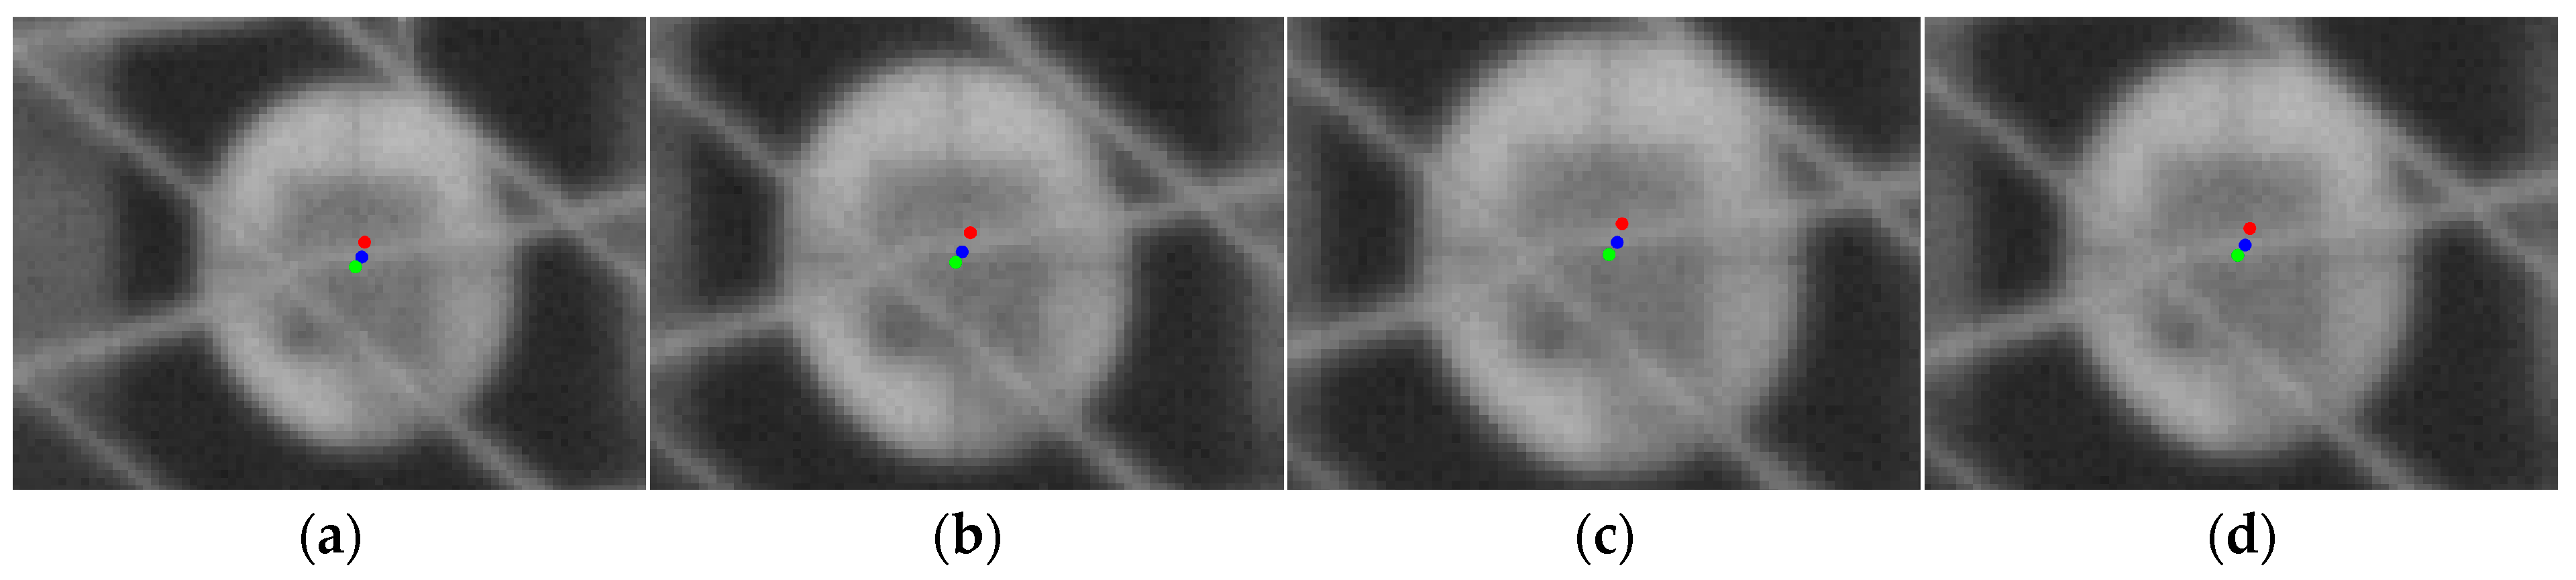
Figure 2 illustrates the schema of the tiny offset compensation using SIFT. Scale-invariant feature transform (SIFT) is a very stable local feature for image matching. Particularly in the consecutive image sequences where rotations, scales and brightness are all constant, SIFT is especially effective. In Figure 2a, the left picture is the ellipse target in frame i , and the right picture is in frame i + 1 . It illustrates the image matching between neighboring frames. The blue and green points are the center of the ellipse target obtained by the KLT method. A little deviation of the center points is generated due to partial occlusion. The yellow and red points correspond to SIFT features that can still be detected accurately, either on the ellipse target or on the string. The red lines represent the moving string. In Figure 2b, the tiny offset is calculated by the average of the overall shift value SIFT seed points because the motion of SIFT features on the ellipse target are the same as the center of the ellipse. If there are N inliers for matching, the average of shift values can be calculated by:
dx = i = 1 N dx i N dy = i = 1 N dy i N ,
where dx and dy are the tiny offset values of the ellipse’s center along the x-axis and y-axis, respectively. dx i and dy i are the tiny offset values of the inliers on the x-axis and y-axis, respectively. The offset direction is determined by dx and dy . The center direction is determined by dx K L T and dy K L T , which are obtained through neighboring frames using the KLT method as shown in Figure 2c. The condition of the compensation of the center is judged by the direction and numerical value. In image coordinates, the direction can be decomposed into x and y. If the signs of dx and dx K L T are opposite, the value of compensation along the x-axis, dx c o m , is obtained by dx c o m = dx K L T + dx . If the signs of dx and dx K L T are the same, the value of dx c o m is equal to the smaller of dx K L T and dx . The reason for selecting the smaller value as the compensation value is that the ellipse target will not have a large coordinate difference when it is captured by the high-speed camera. The condition of judgement in the y direction is same as with the x direction. The dx c o m values are added to the KLT result in i + 1 . Thus, to compensate for the deviations, effective filtering of SIFT features is proposed. As shown in Figure 2b, the outliers will be eliminated.
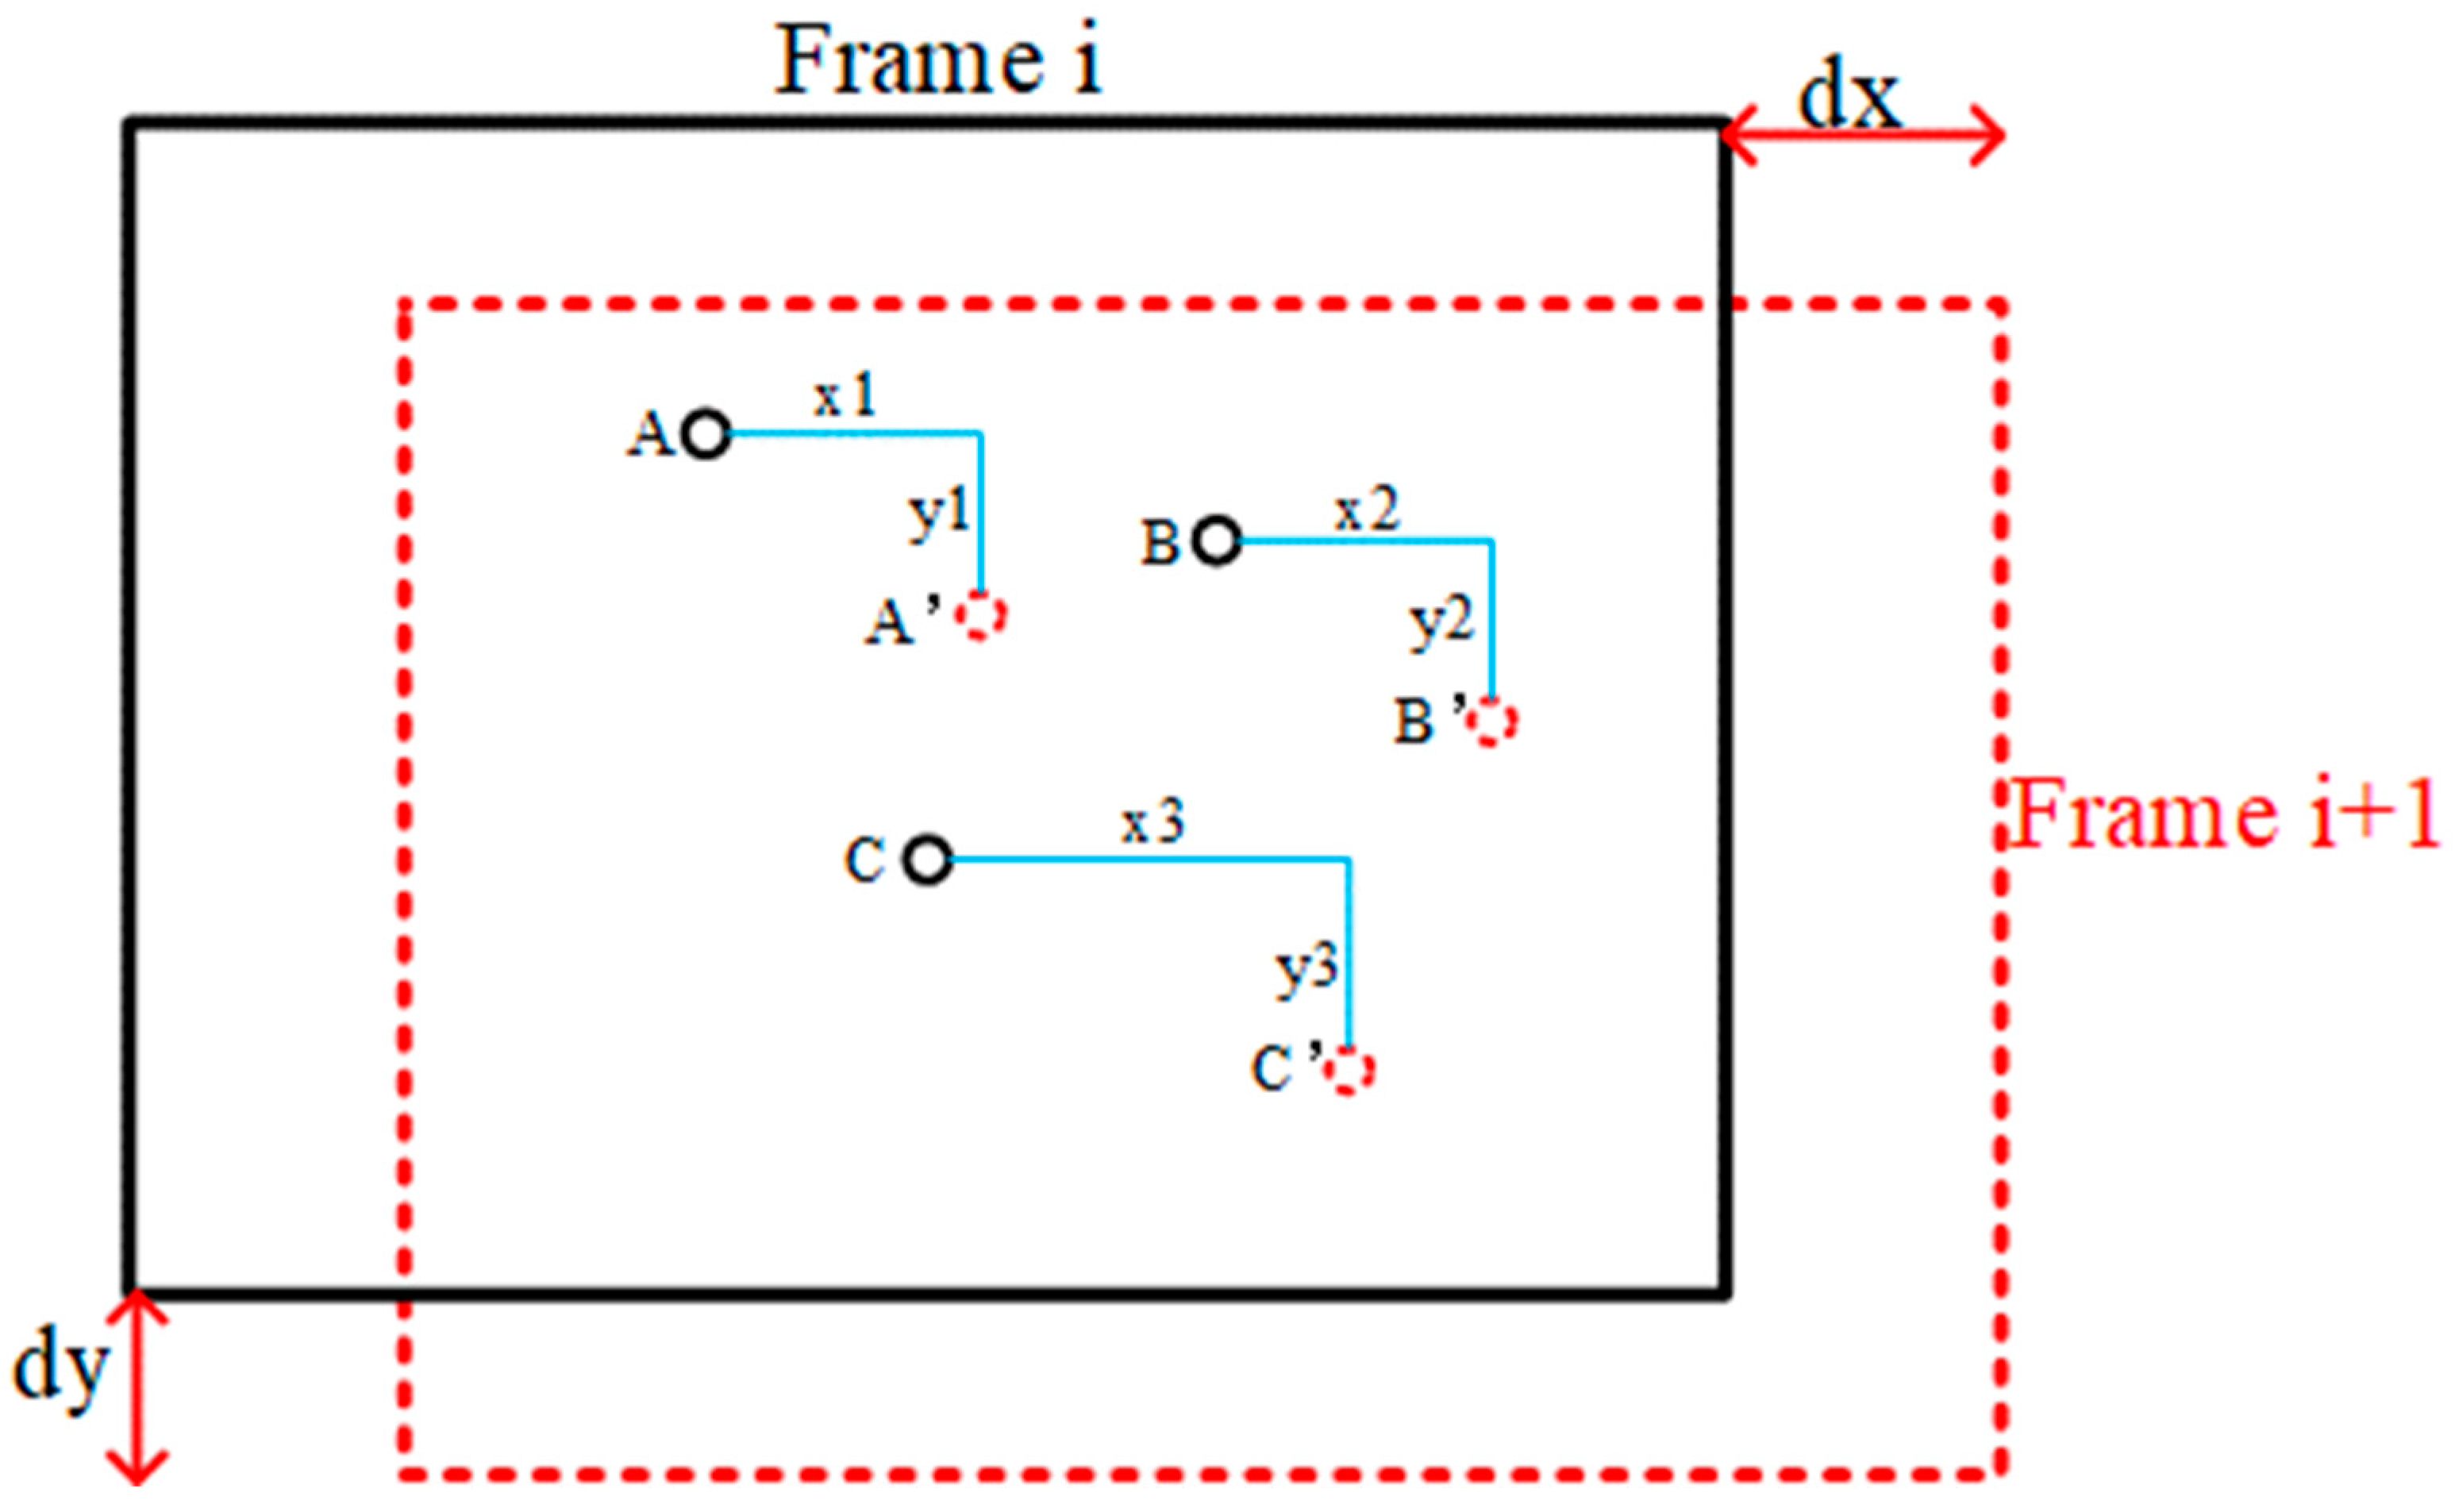
Typically, the RANSAC (Random Sample Consensus) method is used to filter SIFT features. Nevertheless, numerous mismatches still exist after RANSAC, especially for the ellipse targets. Therefore, this study proposes the distance constraint (DC) and rigid constraint (RC) to filter robust SIFT features. The DC is defined as the maximum shift value of SIFT feature points, calculated using the Euclidean distance (denoted as dx 2 + dy 2 ) in the image coordinates between neighboring frames. A high-speed camera has a very high frame-per-second (fps) rate. So, objects in the image are almost nearly static between neighboring frames. When represented as image coordinates, the shift value between neighboring frames is exceedingly small, basically at the sub-pixel level. The DC between the i frame and the i + 1 frame is shown in Figure 3. The shift value of C to C’ exceeds the DC, while the values of A to A’ and B to B’ fall within it. Consequently, the matching of A to A’ and B to B’ exhibits greater robustness compared with C to C’. They are considered inliers. Only SIFT features with shift values less than the DC can be classified as inliers.
After using the DC to filter the SIFT features, a few features still exist on the string. The rigid constraint (RC) is proposed to filter them based on the notion that the ellipse target can be considered rigid with regard to the structural model on the shaking table because of the powerful adhesion of the nanoglue. In contrast, the string is flexible with regard to the structural model when interacting. Due to the disparity in rigidity between the target and string, the direction of the shift values of SIFT features on the ellipse targets along the x-axis and y-axis is same as the center of the ellipse targets. In contrast, the direction is different when features are on the string. The features located on the ellipse target are inliers, while the features on the string are outliers. An efficient and simple way known as Otsu [43], which is a binarization method, is used to reject outliers. Observing that the string is commonly brighter than the background, an adaptive threshold is obtained by Otsu for binarizing the string and the ellipse target. SIFT features located on the string are rejected based on their affiliation with either the prospects or background in the binarized image. The retained SIFT features through RANSAC, DC and RC processing are considered the robust SIFT seed points. They are used to calculate the tiny offsets for compensating for the deviations.

2.3. 3D Reconstruction and Displacement Response

After mutually guided tracking, the centers of the ellipse targets are obtained in image sequences. The corresponding tracking points in stereo images can be further matched manually. The reconstruction of 3D spatial coordinates of the tracking points can be calculated using techniques such as camera calibration [44], PnP [45] and bundle adjustment [46]. The displacement means the distance from the current position of a tracking point relative to its initial position. It is calculated by
D X n = X n X 1 D Y n = Y n Y 1 D Z n = Z n Z 1 ,
where D X n , D Y n and D Z n denote the displacement of the ellipse target in the X, Y and Z direction and n frame, respectively. X 1 , Y 1 and Z 1 are the spatial coordinates in the first frame. X n , Y n and Z n are the spatial coordinates in the n frame.

3. Results

3.1. Simulated Experiments in a Partially Occluded Environment

To verify the accuracy of the proposed novel high-speed videogrammetric measurement method in a partially occluded environment, a simulated indoor experiment was designed as shown in Figure 4. In the simulated experiment, ellipse targets were static while the string was dynamic, as shown in Figure 4a. As shown in Figure 4b, by observing the object with two stationary high-speed cameras called Cyclone-16-300, the impact of string sway on ellipse detection could be verified. The key parameters of the Cyclone-16-300 camera are provided in Table 1.

3.1.1. Ellipse Target Detection

To validate the accuracy of ellipse detection using the arc-support LS, a partially occluded ellipse target was selected for the experimental data. Figure 5 shows the process of ellipse detection. The edges of the image were detected by the Canny detector [47], as shown in Figure 5a. Through calculating the direction and the polarity of the arc-support LS, the arc-support LS was built, as shown in Figure 5b. After ellipse clustering and candidate verification, some ellipse candidates were obtained, as shown in Figure 5c. The interested ellipse target was retained after applying a radius-based qualification, as shown in Figure 5d. Although the string passes through the region of ellipse, it can still be detected accurately.

3.1.2. Mutually Guided Tracking in Image Sequences

To verify the accuracy of the proposed mutually guided tracking method, the typical single-point tracking methods, KLT and LSM [48], were selected to make a comparison. In the simulated experiment, the cameras and ellipses are both static. Thus, the image coordinates will not change. The detection result of the first frame is used as a reference value for comparison. Figure 6 shows the tracking results using KLT, LSM and the proposed method, respectively. Table 2 shows the comparison of the three methods for the left-image coordinates. The results indicate that the method proposed in this study is more accurate and stable compared with the KLT and LSM methods. The LSM method has larger errors than the KLT approach. The errors of the proposed method is no more than 0.05 pixels compared with the references. The proposed method and reference are in approximate agreement in Figure 6 due to their very close proximity.
Figure 7 shows the process of filtering robust seed points for tiny offset compensation. The initial SIFT matching is shown in Figure 7a. There are many mismatches. Figure 7b shows the RANSAC process. While many significant mismatches are rejected, there are still some SIFT points with small errors. Robust seed points are retained after DC and RC filtering, as shown in Figure 7c. Table 3 shows the number of features from the initial SIFT matching to DC and RC filtering.

3.1.3. 3D Reconstruction

Ideally, the coordinates of static target points captured by static high-speed cameras should be constant. However, the results of reconstruction may fluctuate to some extent due to the swaying of the string. Thus, the stabilization of the results can directly reflect the effectiveness of the methodology. The displacement response is obtained by reconstructing the image coordinates obtained from the three methods. Figure 8 shows the comparison of coordinate reconstruction results with total station measurements, which can be treated as reference values. The simulated experimental results show that the proposed method can obtain both sub-millimeter accuracy and stabilization. Table 4 shows the comparison of spatial coordinates from the three methods. The RMSE values calculated by the proposed method are closest to the references. The point error is no more than 0.8 mm compared with the references.

3.1.4. Discussion

Since the static ellipse targets were captured by static high-speed cameras, the results of the tracking and 3D reconstruction should be constant. The proposed method was able to achieve these goals. The influence of the string could be eliminated, and sub-millimeter accuracy could be achieved in simulated experiments.

3.2. On-Site Experiments and Analysis

The 5 m by 5 m shaking table, located at the Beijing University of Civil Engineering and Architecture, was used in the study. The table had a single load of 60 tons, a maximum horizontal acceleration of 1.5 g and a maximum vertical acceleration of 1.5 g. Its walls were constructed using monolithic wall masonry. The size of the bricks was 230 × 105 × 42 mm and the model had a 2.6 m height and 5.0 m width. Figure 9a shows the tested shaking table structure model and Figure 9b shows the actual experimental scene. A binocular high-speed camera system is used to monitor the structure model. Total station is used to obtain the initial spatial coordinates. Figure 10 shows the distribution of target points that are used to monitor the important locations of interest. Points 1, 2 and 3, highlighted within red boxes, served as example points in this experiment. To ensure the safety of personnel and the shaking table due to the progressive collapse of masonry building, protective string is used. Figure 11 shows ellipse targets partially occluded by thicker strings. The key parameters of the used CP80-4-M-500 camera are presented in Table 5.

3.2.1. Ellipse Target Detection

To validate the accuracy of ellipse detection using the arc-support LS, point 1 was selected for the experimental data. Figure 12 shows the steps of detection on a pre-defined ROI. Many edge line segments were extracted by the Canny detector, as shown in Figure 12b. But they were not suitable for ellipse detection because the ellipse’s segments were distributed like a curve. Figure 12c shows the arc-support LS image. Figure 12d shows the interested ellipse after radius-based qualification. The center’s coordinates and radius were obtained after detection.

3.2.2. Mutually Guided Tracking in Image Sequences

To verify the accuracy of the tracking methods, the KLT and LSM methods and our proposed method were selected to make a comparison. When the ellipse target is partially occluded by the string, the verification of the methodology requires further discussion to clarify both the magnitude value and the trend of the curves. The right-image coordinates of tracking point 1 is shown in Figure 13. The tracking results are similarly constant in the x direction. However, there are variations in the y direction. The KLT method has pixel-level offsets in the y direction, while the LSM method consistently produces results that are approximately 0.5 pixels higher than the proposed method. From the actual situation of shaking, the seismic waves input had stopped at that time and the shaking due to inertia was nearly negligible at point 1. It needs to be further explained why the curvilinear motions of the KLT and LSM methods are consistently similar from a principle point of view. Both the KLT and LSM methods rely on the principle of establishing a grayscale-based equation for the image blocks in neighboring frames. For example, KLT builds on the grayscale Equation (1) and LSM builds on the grayscale equation
g 1 ( x , y ) + n 1 ( x , y ) = h 0 + h 1 g 2 ( a 0 + a 1 x + a 2 y + b 0 + b 1 x + b 2 y ) + n 2 ( x , y ) .
The KLT approach considers that the moving trend is the same as the surrounding pixels in image blocks of neighboring frames. So, the change in image points can be represented as x + δ x . The LSM method considers that the moving trend has geometric transformations. So, the change in image points can be represented as a 0 + a 1 x + a 2 y . Therefore, similar computational logic and similar image blocks result in similar trends.
By comparing the results of the visual interpretation in Figure 14, the proposed method is shown to be more accurate than the others. (a)–(d) in Figure 14 represent keyframes 1782, 1828, 1916 and 2035, respectively. The red, blue and green points in Figure 14 represent the KLT, LSM and proposed methods, respectively. By qualitative comparison, the red point has shifted upward, and blue point has shifted rightward. Thus, the results from the proposed method are closer to the real values and more consistent with the real physical laws of motion.
All the RMSE values acquired from the proposed method are the lowest compared with the other two methods, as shown in Table 6. Consequently, from the quantitative perspective, the proposed method is more stable than the others.
The process of tiny offset compensation is shown as follows. In Figure 15, ellipse target 1 was selected as the example attached on the model. Figure 15a shows the initial SIFT matching results. Many feature points are distributed on the ellipse target, and one feature point also appears on the string. Figure 15b shows the RANSAC results. Many outliers are rejected compared with Figure 15a. DC is used to reject the outliers, as shown in Figure 15c. Considering that the experiment was designed using a high-speed camera with 200 fps, the shift value of the movement should be small in neighboring frames. The DC was set to 0.3 pixels by referring the value of the movement at the ellipse’s center when it was not occluded by the string. RC can be used to reject the SIFT features on the string as shown in Figure 15d. SIFT feature points located on the strings, especially at string crossings, can be effectively filtered out by evaluating the value of the feature point on the binary image (0 or 1). The binary image is shown in Figure 16. Table 7 shows the obtained number of SIFT features.

3.2.3. Accuracy Verification of Displacement in the Seismic Wave Direction

The displacement response is obtained by reconstructing the image coordinates obtained from the KLT, LSM and proposed methods. Table 8 shows the accuracy of point coordinates using the proposed method. By comparing this with the total station measurements, the photogrammetric network could achieve sub-millimeter accuracy. The RMSE values in the X, Y and Z directions are 0.83 mm, 0.87 mm and 0.57 mm, respectively.
Firstly, the comparison of reconstruction results for point 3 without anything occluded is shown in Figure 17. The red, blue and green lines are the results using the KLT, LSM and proposed methods, respectively. KLT and LSM could achieve sub-millimeter accuracy on the shaking table [7,49]. Meanwhile the proposed method has the same level of accuracy as these two methods.
Figure 18 shows the displacement at point 1 in the direction of the seismic waves. Results from the KLT method are not shown because its trend of tracking motion does not match reality. Results from the LSM and the proposed method have the same trend before 2500 frames. But after 3000 frames, their trends start to diverge. The proposed method is more accurate because there is no significant displacement of the structural model after the seismic wave ends.
Figure 19 shows the comparison of the displacement in the direction of the seismic waves using the proposed and LSM methods at points 1 and 2. Since point 1 and point 2 are on the same floor slab that consists of an 80 mm thick cast-in-place concrete structure with internal steel mesh reinforcement, the trend and magnitude of the motion of the two points should be the same. The proposed method can also meet this requirement, as shown in Figure 19a, while the LSM approach does not achieve the same level of consistency, as shown in Figure 19b. Hence, the LSM method is susceptible to the impact of string occlusions at various points, whereas our method exhibits greater robustness in handling such occlusions.
Figure 20 shows a comparison of the displacement between layers calculated by point 1 and point 3. The relative displacement between the upper and lower floors was calculated by subtracting the displacement of point 3 from the displacement of point 1. The references were obtained by means of displacement gauges placed between the upper and lower floors through the diagonal tension. The datum of the horizontal coordinate is standardized to absolute time to solve the problem of frequency inconsistency. Unfortunately, because points 3 and 1 were not perfectly aligned with the direction of the seismic waves, as shown in Figure 10, there were variations of a few millimeters compared with the reference. Additionally, the progressive collapse of the structural model can result in errors introduced by the displacement gauges. But the trend of the proposed method is more similar to the reference. Table 9 shows the quantitative results, including the RMSE value and the correlation coefficient. The correlation coefficient is used to describe the similarity to the reference. The RMSE value of the proposed method is lower than LSM. And the proposed method is closer to the reference than that of the LSM method.

3.2.4. Discussion

In summary, our proposed method can satisfy the health monitoring of masonry buildings on the shaking table. It is important that the proposed method meets the requirements of experimental accuracy and ensures the safety of personnel and facilities. Through the comparison of reconstruction results for point 3 without anything occluded, our proposed method was able to achieve precision at the sub-millimeter level. Through the comparison of displacement on the same floor and in different layers, our proposed method is more accurate and robust.

4. Conclusions

The dynamic displacement response is used to analysis the seismic performance of masonry buildings in progressively collapsing environments. For safety reasons, our experiments need to be surrounded by protective string to ensure the safety of the experimental environment. In this case, optically based non-contact measurements would be rendered ineffective due to occlusion by the protective string. To solve the limitation of partial occlusions in high-speed videogrammetric measurement, a new methodology is proposed to obtain the displacement response.
In this study, the experiments were conducted on a shaking table at the Beijing University of Civil Engineering and Architecture. The experimental structural model was observed by two high-speed cameras. To obtain an accurate displacement response, a novel high-speed videogrammetry framework was proposed, which mainly includes ellipse target detection, mutually guided tracking and 3D reconstruction. Our main contribution is the proposal of this mutually guided tracking method to solve the problem of ellipse target tracking under partial occlusion. The results presented in this paper clearly highlight the following points:
(1)
The strategy of loopback detection is used to eliminate cumulative errors by updating the tracking model and replacing the initial results of tracking with those from the loopback detection.
(2)
The ellipse target is compensated for to solve the problem of deviations at the sub-pixel level in local frames by conditional judgement about the center direction and tiny offsets when the loopback detection is invalid. The tiny offset is obtained through robust SIFT filtering.
Based on the two points mentioned above, this study can achieve the accurate sub-pixel location of ellipse targets in image coordinates. This ensures single-point displacement measurement accuracy at the sub-millimeter level and interlayer displacement measurement accuracy at the millimeter level. It satisfies the health monitoring of masonry buildings on the shaking table. In a progressive collapse experimental environment, the proposed methodology prioritizes the safety of personnel and the shaking table. It reduces the potential economic losses that could be caused by using contact transducers, all while ensuring high measurement accuracy. There are some limitations of the proposed method herein: (a) the ROIs needed to be manually selected; (b) the result of detection is demanding for imaging, especially in the occluded experiments; (c) the solving efficiency needs to be improved. Future studies are still required to improve the robustness and intelligence of the method.

Author Contributions

Conceptualization, X.L., S.L. and R.W.; methodology, X.L., S.L. and R.W.; validation, X.L., D.Z., J.Y. and R.W.; formal analysis, S.L., Y.C., Y.Z. and Y.Y.; investigation, X.L. and S.L.; writing—original draft preparation, S.L., Y.C., Y.Z. and Y.Y.; writing—review and editing, X.L., S.L., D.Z., J.Y. and R.W.; funding acquisition, X.L. and R.W. All authors have read and agreed to the published version of the manuscript.

Funding

This study was funded by the National Natural Science Foundation of China (grant numbers 41871367, 42171416 and 42201488); the National Youth Talent Support Program (grant number SQ2022QB01546); the Joint Project of the Beijing Municipal Commission of Education and Beijing Natural Science Foundation (grant number KZ202210016022); the Pyramid Talent Training Project of the Beijing University of Civil Engineering and Architecture (grant number JDJQ20220804); the Fundamental Research Funds for Beijing Universities (grant number X20150) and the BUCEA Postgraduate Innovation Project.

Data Availability Statement

Some or all data or models used during the study are available from the corresponding author upon request. The data are not publicly available due to confidentiality.

Conflicts of Interest

The authors declare no conflict of interest.

References

  1. Jiménez, B.; Pelà, L. Numerical modelling of traditional buildings composed of timber frames and masonry walls under seismic loading. Int. J. Archit. Herit. 2023, 17, 1256–1289. [Google Scholar] [CrossRef]
  2. Khan, S.U.; Naseer, A.; Fahim, M.; Ashraf, M.; Badshah, E. Experimental seismic performance evaluation of brick masonry cavity-wall buildings. Structures 2022, 41, 1781–1791. [Google Scholar] [CrossRef]
  3. Wang, C.F.; Antos, S.E.; Triveno, L.M. Automatic detection of unreinforced masonry buildings from street view images using deep learning-based image segmentation. Autom. Constr. 2021, 132, 103968. [Google Scholar] [CrossRef]
  4. Liu, X.L.; Zhang, P.F.; Jia, Z.K.; Chen, Y.X.; Li, S.L.; Wang, R.J. High-Speed Videogrammetry for Seismic Performance of the Spherical Reticulated Shell Structure on the Shaking Table. Buildings 2023, 13, 553. [Google Scholar] [CrossRef]
  5. Chen, M.C.; Pantoli, E.; Wang, X.; Astroza, R.; Ebrahimian, H.; Hutchinson, T.C.; Conte, J.P.; Restrepo, J.I.; Marin, C.; Walsh, K.D. Full-scale structural and nonstructural building system performance during earthquakes: Part I–specimen description, test protocol, and structural response. Earthq. Spectra 2016, 32, 737–770. [Google Scholar] [CrossRef]
  6. Pantoli, E.; Chen, M.C.; Wang, X.; Astroza, R.; Ebrahimian, H.; Hutchinson, T.C.; Conte, J.P.; Restrepo, J.I.; Marin, C.; Walsh, K.D. Full-scale structural and nonstructural building system performance during earthquakes: Part II–NCS damage states. Earthq. Spectra 2016, 32, 771–794. [Google Scholar] [CrossRef]
  7. Liu, X.L.; Tong, X.H.; Lu, W.S.; Liu, S.J.; Huang, B.F.; Tang, P.B.; Guo, T.X. High-speed videogrammetric measurement of the deformation of shaking table multi-layer structures. Measurement 2020, 154, 107486. [Google Scholar] [CrossRef]
  8. Huang, L.; Lu, Y.Q.; Yan, L.B.; Kasal, B.; Wang, L.; Zhang, T.Y. Seismic performance of mortarless reinforced masonry walls. J. Build. Eng. 2020, 31, 101368. [Google Scholar] [CrossRef]
  9. Liu, X.L.; Jia, Z.K.; Zhang, P.F.; Chen, Y.X.; Li, S.L.; Wang, R.J. EET-Hamming monocular high-speed measurement for long-span bridge structure displacement on a shaking table. Measurement 2023, 211, 112591. [Google Scholar] [CrossRef]
  10. Brown, N.; Schumacher, T.; Vicente, M.A. Evaluation of a novel video- and laser-based displacement sensor prototype for civil infrastructure applications. J. Civ. Struct. Health 2021, 11, 265–281. [Google Scholar] [CrossRef]
  11. Im, S.B.; Hurlebaus, S.; Kang, Y.J. Summary review of GPS technology for structural health monitoring. J. Struct. Eng. 2013, 139, 1653–1664. [Google Scholar] [CrossRef]
  12. Siringoringo, D.M.; Fujino, Y. Experimental study of laser Doppler vibrometer and ambient vibration for vibration-based damage detection. Eng. Struct. 2006, 28, 1803–1815. [Google Scholar] [CrossRef]
  13. Maas, H.-G. Concepts of single highspeed-camera photogrammetric 3D measurement systems. In Videometrics IX; SPIE: San Jose, CA, USA, 2007; Volume 6491, pp. 178–184. [Google Scholar] [CrossRef]
  14. Nakashima, M.; Nagae, T.; Enokida, R.; Kajiwara, K. Experiences, accomplishments, lessons, and challenges of E-defense—Tests using world’s largest shaking table. Jpn. Archit. Rev. 2018, 1, 4–17. [Google Scholar] [CrossRef]
  15. Zou, X.; Yang, W.; Liu, P.; Wang, M. Shaking table tests and numerical study of a sliding isolation bearing for the seismic protection of museum artifacts. J. Build. Eng. 2023, 65, 105725. [Google Scholar] [CrossRef]
  16. Zhao, J.; Bao, Y.; Guan, Z.; Zuo, W.; Li, J.; Li, H. Video-based multiscale identification approach for tower vibration of a cable-stayed bridge model under earthquake ground motions. Struct. Control Health Monit. 2019, 26, e2314. [Google Scholar] [CrossRef]
  17. Jeong, J.H.; Jo, H. Real-time generic target tracking for structural displacement monitoring under environmental uncertainties via deep learning. Struct. Control Health Monit. 2022, 29, e2902. [Google Scholar] [CrossRef]
  18. Won, J.; Park, J.-W.; Song, M.-H.; Kim, Y.-S.; Moon, D. Robust vision-based displacement measurement and acceleration estimation using RANSAC and Kalman filter. Earthq. Eng. Eng. Vib. 2023, 22, 347–358. [Google Scholar] [CrossRef]
  19. Feng, D.; Feng, M.Q. Vision-based multipoint displacement measurement for structural health monitoring. Struct. Control Health Monit. 2016, 23, 876–890. [Google Scholar] [CrossRef]
  20. Tong, X.; Gao, S.; Liu, S.; Ye, Z.; Chen, P.; Yan, S.; Zhao, X.; Du, L.; Liu, X.; Luan, K. Monitoring a progressive collapse test of a spherical lattice shell using high-speed videogrammetry. Photogramm. Rec. 2017, 32, 230–254. [Google Scholar] [CrossRef]
  21. Sánchez-Aparicio, L.J.; Herrero-Huerta, M.; Esposito, R.; Roel Schipper, H.; González-Aguilera, D. Photogrammetric solution for analysis of out-of-plane movements of a masonry structure in a large-scale laboratory experiment. Remote Sens. 2019, 11, 1871. [Google Scholar] [CrossRef]
  22. Salmanpour, A.; Mojsilovic, N. Application of digital image correlation for strain measurements of large masonry walls. In Proceedings of the APCOM & ISCM, Singapore, 11–14 December 2013. [Google Scholar] [CrossRef]
  23. Yadav, S.; Sieffert, Y.; Vieux-Champagne, F.; Malecot, Y.; Hajmirbaba, M.; Arléo, L.; Crété, E.; Garnier, P. Shake table tests on 1:2 reduced scale masonry house with the application of horizontal seismic bands. Eng. Struct. 2023, 283, 115897. [Google Scholar] [CrossRef]
  24. Liu, X.; Tong, X.; Yin, X.; Gu, X.; Ye, Z. Videogrammetric technique for three-dimensional structural progressive collapse measurement. Measurement 2015, 63, 87–99. [Google Scholar] [CrossRef]
  25. Shortis, M.R.; Seager, J.W.; Robson, S.; Harvey, E.S. Automatic recognition of coded targets based on a Hough transform and segment matching. In Videometrics VII; SPIE: San Jose, CA, USA, 2003; pp. 202–208. [Google Scholar] [CrossRef]
  26. Dong, S.; Ma, J.; Su, Z.L.; Li, C.X. Robust circular marker localization under non-uniform illuminations based on homomorphic filtering. Measurement 2021, 170, 108700. [Google Scholar] [CrossRef]
  27. Hong, Z.H.; Li, Z.P.; Tong, X.H.; Pan, H.Y.; Zhou, R.Y.; Zhang, Y.; Han, Y.L.; Wang, J.; Yang, S.H.; Ma, Z.L. A High-Precision Recognition Method of Circular Marks Based on CMNet Within Complex Scenes. IEEE J. Sel. Top. Appl. Earth Obs. Remote Sens. 2022, 15, 7431–7443. [Google Scholar] [CrossRef]
  28. Zheng, S.; Chen, P.; Liu, S.; Ma, X.; Gaol, S.; Tong, X. A high-precision elliptical target identification method for image sequences. In Proceedings of the IGARSS 2018-2018 IEEE International Geoscience and Remote Sensing Symposium, Valencia, Spain, 22–27 July 2018; pp. 3374–3377. [Google Scholar] [CrossRef]
  29. Maalek, R.; Lichti, D.D. Robust detection of non-overlapping ellipses from points with applications to circular target extraction in images and cylinder detection in point clouds. Isprs J. Photogramm. Remote Sens. 2021, 176, 83–108. [Google Scholar] [CrossRef]
  30. Liu, Y.; Su, X.; Guo, X.; Suo, T.; Yu, Q.F. A Novel Concentric Circular Coded Target, and Its Positioning and Identifying Method for Vision Measurement under Challenging Conditions. Sensors 2021, 21, 855. [Google Scholar] [CrossRef]
  31. Lu, C.; Xia, S.; Shao, M.; Fu, Y. Arc-support line segments revisited: An efficient high-quality ellipse detection. IEEE Trans. Image Process. 2019, 29, 768–781. [Google Scholar] [CrossRef]
  32. Wu, Y.; Lim, J.; Yang, M.-H. Online object tracking: A benchmark. In Proceedings of the IEEE Conference on Computer Vision and Pattern Recognition (CVPR), Portland, OR, USA, 23–28 June 2013; pp. 2411–2418. [Google Scholar] [CrossRef]
  33. Fiaz, M.; Mahmood, A.; Javed, S.; Jung, S.K. Handcrafted and Deep Trackers: Recent Visual Object Tracking Approaches and Trends. Acm Comput. Surv. 2019, 52, 1–44. [Google Scholar] [CrossRef]
  34. Cui, Y.Y.; Hou, B.A.; Wu, Q.; Ren, B.; Wang, S.; Jiao, L.C. Remote Sensing Object Tracking With Deep Reinforcement Learning Under Occlusion. IEEE Trans. Geosci. Remote Sens. 2022, 60, 1–13. [Google Scholar] [CrossRef]
  35. Khan, Z.H.; Gu, I.Y.-H. Nonlinear dynamic model for visual object tracking on Grassmann manifolds with partial occlusion handling. IEEE Trans. Cybern. 2013, 43, 2005–2019. [Google Scholar] [CrossRef]
  36. Li, T.; Zhao, S.Y.; Meng, Q.H.; Chen, Y.F.; Shen, J.B. A stable long-term object tracking method with re-detection strategy. Pattern Recognit. Lett. 2019, 127, 119–127. [Google Scholar] [CrossRef]
  37. Zhang, Y.; Wang, X.; Ye, X.; Zhang, W.; Lu, J.; Tan, X.; Ding, E.; Sun, P.; Wang, J. ByteTrackV2: 2D and 3D Multi-Object Tracking by Associating Every Detection Box. arXiv 2023, arXiv:2303.15334. [Google Scholar] [CrossRef]
  38. Comaniciu, D.; Ramesh, V.; Meer, P. Real-time tracking of non-rigid objects using mean shift. In Proceedings of the Proceedings IEEE Conference on Computer Vision and Pattern Recognition. CVPR 2000 (Cat. No. PR00662), Hilton Head, SC, USA, 15 June 2000; pp. 142–149. [Google Scholar] [CrossRef]
  39. Lucas, B.D.; Kanade, T. An iterative image registration technique with an application to stereo vision. In Proceedings of the IJCAI’81: 7th International Joint Conference on Artificial Intelligence, Vancouver, BC, Canada, 24–28 August 1981; pp. 674–679. [Google Scholar] [CrossRef]
  40. Van Den Einde, L.; Conte, J.P.; Restrepo, J.I.; Bustamante, R.; Halvorson, M.; Hutchinson, T.C.; Lai, C.-T.; Lotfizadeh, K.; Luco, J.E.; Morrison, M.L. NHERI@ UC San Diego 6-DOF large high-performance outdoor shake table facility. Front. Built Environ. 2021, 6, 580333. [Google Scholar] [CrossRef]
  41. Mendes, N.; Lourenço, P.B.; Campos-Costa, A. Shaking table testing of an existing masonry building: Assessment and improvement of the seismic performance. Earthq. Eng. Struct. Dyn. 2014, 43, 247–266. [Google Scholar] [CrossRef]
  42. Lowe, G. Sift-the scale invariant feature transform. Int. J. 2004, 2, 2. [Google Scholar]
  43. Akagic, A.; Buza, E.; Omanovic, S.; Karabegovic, A. Pavement crack detection using Otsu thresholding for image segmentation. In Proceedings of the 2018 41st International Convention on Information and Communication Technology, Electronics and Microelectronics (MIPRO), Opatija, Croatia, 21–25 May 2018; pp. 1092–1097. [Google Scholar] [CrossRef]
  44. Zhang, Z. Flexible camera calibration by viewing a plane from unknown orientations. In Proceedings of the Seventh IEEE International Conference on Computer Vision, Kerkyra, Greece, 20–27 September 1999; pp. 666–673. [Google Scholar] [CrossRef]
  45. Lepetit, V.; Moreno-Noguer, F.; Fua, P. EP n P: An accurate O (n) solution to the P n P problem. Int. J. Comput. Vis. 2009, 81, 155–166. [Google Scholar] [CrossRef]
  46. Zach, C. Robust bundle adjustment revisited. In Proceedings of the Computer Vision–ECCV 2014: 13th European Conference, Zurich, Switzerland, 6–12 September 2014; pp. 772–787. [Google Scholar] [CrossRef]
  47. Canny, J. A computational approach to edge detection. IEEE Trans. Pattern Anal. Mach. Intell. 1986, PAMI-8, 679–698. [Google Scholar] [CrossRef]
  48. Ackermann, F. Digital image correlation: Performance and potential application in photogrammetry. Photogramm. Rec. 1984, 11, 429–439. [Google Scholar] [CrossRef]
  49. Wang, X.; Lo, E.; De Vivo, L.; Hutchinson, T.C.; Kuester, F. Monitoring the earthquake response of full-scale structures using UAV vision-based techniques. Struct. Control Health Monit. 2022, 29, e2862. [Google Scholar] [CrossRef]
Figure 1. Framework of the entire methodology.
Buildings 13 02959 g001
Figure 2. The schema of tiny offset compensation. (a) SIFT matches between neighboring frames. (b) The tiny offset calculated with the shift value of overall SIFT seed points. (c) The center direction obtained with the KLT method. (d) The compensation of the ellipse target.
Buildings 13 02959 g002
Figure 3. Distance Constraint (DC) between neighboring frames.
Buildings 13 02959 g003
Figure 4. Experimental layout. (a) Ellipse and string layout. (b) Experimental scene.
Buildings 13 02959 g004
Figure 5. Process of ellipse target detection. (a) Edge detection by the Canny detector. (b) Detected arc-support LS image. (c) Ellipse candidates. (d) Interested ellipse.
Buildings 13 02959 g005
Figure 6. Comparison of tracking results with the reference results. (a) Coordinates of the left image in the x direction, (b) Coordinates of the left image in the y direction, (c) Coordinates of the right image in the x direction, (d) Coordinates of the right image in the y direction.
Buildings 13 02959 g006aBuildings 13 02959 g006b
Figure 7. Process of robust seed point generation: (a) SIFT feature matching; (b) RANSAC; (c) robust SIFT seed points matches after DC and RC filtering.
Buildings 13 02959 g007
Figure 8. Comparison of 3D reconstruction results with total station reference results. (a) Coordinates in the x direction. (b) Coordinates in the y direction. (c) Coordinates in the z direction.
Buildings 13 02959 g008aBuildings 13 02959 g008b
Figure 9. Experimental layout. (a) Structural model. (b) Camera layout.
Buildings 13 02959 g009
Figure 10. The distribution of ellipse targets.
Buildings 13 02959 g010
Figure 11. Example of images in a partially occluded environment captured by high-speed cameras. (a) Image captured by the left camera. (b) Image captured by the right camera.
Buildings 13 02959 g011
Figure 12. Process of ellipse target detection. (a) ROI (70 × 70 pixels). (b) Edge extraction by the Canny detector. (c) Detected arc-support LS image. (d) Interested ellipse.
Buildings 13 02959 g012
Figure 13. Comparison of tracking results. (a) Right-image coordinates in the x direction. (b) Right-image coordinates in the y direction.
Buildings 13 02959 g013
Figure 14. Qualitative comparison results for point 1 on the right image. (a) Key frame 1782. (b) Key frame 1828. (c) Key frame 1916. (d) Key frame 2035.
Buildings 13 02959 g014
Figure 15. Process of robust seed point generation. (a) Initial SIFT feature matching. (b) The RANSAC process. (c) Distance Constraint. (d) Rigid Constraint.
Buildings 13 02959 g015
Figure 16. Example of Otsu at ellipse target 1.
Buildings 13 02959 g016
Figure 17. Comparison of displacement at point 3 in the seismic wave direction.
Buildings 13 02959 g017
Figure 18. Comparison of displacement at point 1 in the seismic wave direction.
Buildings 13 02959 g018
Figure 19. Comparison of displacement in the seismic wave direction using the proposed method and the LSM method at points 1 and 2. (a) Displacement at different points using the proposed method. (b) Displacement at different points using the LSM method.
Buildings 13 02959 g019aBuildings 13 02959 g019b
Figure 20. Comparison of displacement in seismic waves results.
Buildings 13 02959 g020
Table 1. Key parameters of Cyclone-16-300.
ParametersValue
maximum resolution4672 (H) × 3416 (V) pixels
pixel size3.9 um
frame full resolution293 fps
active area18.221 mm × 13.322 mm
shortest exposure time2 ms
Table 2. Maximum displacement residual and RMSE values in left sequences from the three methods.
MethodsKLTLSMProposed Method
Max-res (pixel)0.3231.7890.05
RMSE (pixel)0.1430.5150.05
Table 3. The number of SIFT features after filtering.
MethodsSIFTRANSACDC and RC
number31315741
Table 4. RMSE values in 3D reconstruction from the three methods.
MethodsKLTLSMProposed Method
RMSE-x (mm)0.0480.3610.043
RMSE-y (mm)0.2421.9760.167
RMSE-z (mm)0.9322.7590.812
point error (mm)0.9643.4120.830
Table 5. Key parameters of CP80-4-M-500.
ParametersValue
maximum resolution2304 (H) × 1720 (V) pixels.
pixel size7 um × 7 um
frame full resolution500 fps
active area16.13 mm × 12.04 mm
shortest exposure time2 ms
Table 6. RMSE values in right-image sequences from the three methods.
MethodsKLTLSMProposed Method
RMSE-x (mm)0.6610.6560.648
RMSE-y (mm)1.6820.3750.132
Table 7. The number of SIFT features after filtering about point 1.
MethodsSIFTRANSACDCRC
Number22201514
Table 8. Accuracy of point-coordinate network configurations.
IDResults of Videogrammetry (m)Results of Total Station (m)Difference (mm)
XYZXYZXYZ
12.1339−5.0240−0.53740.2734−5.0237−0.53700.5−0.30.4
22.9973−5.0277−0.53062.9979−5.0269−0.5304−0.6−0.80.4
32.5013−0.50310.64952.5016−0.50330.6494−0.30.2−0.1
RMSE 0.830.870.57
Table 9. Evaluation of results.
ResultsLSMProposed Method
RMSE (mm)3.5053.371
Correlation Coefficient0.9330.980
Disclaimer/Publisher’s Note: The statements, opinions and data contained in all publications are solely those of the individual author(s) and contributor(s) and not of MDPI and/or the editor(s). MDPI and/or the editor(s) disclaim responsibility for any injury to people or property resulting from any ideas, methods, instructions or products referred to in the content.

