Article

Drainage Performance of Long Longitudinal Slope and High Safety Permeable Asphalt Pavement

1
Binzhou Highway Development Center, Binzhou 256600, China
2
Research Institute of Highway Ministry of Transport, Beijing 100088, China
3
Zhong Lu Gao Ke (Beijing) Road Technology Co., Ltd., Beijing 102600, China
4
Shandong Binzhou Highway Engineering Co., Ltd., Binzhou 256600, China
5
Shijiazhuang Expressway Group Co., Ltd., Shijiangzhuang 050051, China
*
Author to whom correspondence should be addressed.
Buildings 2023, 13(12), 2955; https://doi.org/10.3390/buildings13122955
Submission received: 22 October 2023 / Revised: 8 November 2023 / Accepted: 11 November 2023 / Published: 28 November 2023
(This article belongs to the Special Issue New Building Materials in Structural Engineering Applications)

Abstract

:
Permeable asphalt pavement refers to an asphalt mixture layer with an air void content of more than 18% and internal water permeability and drainage capabilities that can quickly drain away water on the road surface, improve rainy day travel safety, and improve ride comfort. This paper aims to explore the optimal asphalt mixture design for long longitudinal slope pavement (referred to as the FAM mixture). By using CT scanning technology to analyze the air void content of different rotated and compacted asphalt mixture specimens and extensively testing and evaluating the performance of permeable pavement mixtures, the following conclusions are drawn: Based on the research philosophy of functional integration, a new asphalt mixture gradation suitable for long longitudinal slope roads is proposed, with the optimal key factor composition being: 0.075 mm passing rate of 7%, 2.36 mm passing rate of 20%, 9.5 mm passing rate of 55%, and an oil-stone ratio of 4.8%. The FAM mixture was divided into three parts for air void analysis, with the upper part having a slightly higher air void content than the lower part. The air void distribution diagram of the FAM mixture is concave, with higher air void rate curves on both sides and a lower middle curve. Through dynamic modulus testing, the strength requirement for the road asphalt mixture in the pavement structure design was evaluated. It was found that at high temperature conditions (50 °C), the minimum dynamic modulus value of the FAM mixture was 323 MPa, with a peak value of 22,746 MPa at a temperature of −10 °C and a frequency of 25 HZ. The dynamic modulus value at high temperature conditions is lower than at low temperature conditions, while the dynamic modulus value at high frequency conditions is higher than at low frequency conditions. This study provides useful information and experimental data for the design of new asphalt mixtures for long longitudinal slope roads and has conducted in-depth research on the air void distribution and performance of the mixture, providing strong support for related research fields and practical applications.

1. Introduction

Due to different conditions such as rainfall intensity and duration, rainwater may completely penetrate through the permeable asphalt pavement after satisfying the absorption and accumulation of water by the road surface, or some rainwater may not have time to penetrate into the pavement or the asphalt pavement structure may be saturated, resulting in surface runoff that adversely affects the functional performance of the road surface [1]. Therefore, it is necessary to study and analyze the drainage characteristics of long-slope asphalt pavement to provide a theoretical basis for subsequent pavement structure design [2,3].
Permeable asphalt pavement structures typically use open-grade asphalt mixtures with large void spaces as surface layer materials, with void rates up to 25%. Cabrera proposed the use of dry packing methods for the design of open-graded asphalt mixtures. The basic principle is to gradually compact the coarse aggregates to the maximum particle size with the minimum void space until the target void space rate is achieved after compacting the coarse aggregates of the minimum particle size. Subsequently, Zoorob et al. improved the dry packing method and introduced the wet packing method as a design method for open-graded asphalt mixtures. This method involves mixing the aggregates with asphalt before compaction and then determining the optimal blending form of the aggregates [4]. Hardiman et al. used a dry packing method to design an open-graded mixture with a maximum particle size of 14 mm. Studies have found that the minimum void space generated by several mixtures is always smaller than the minimum void space of a single component, and when designing open-graded mixtures, the packing essence of the aggregates was not considered. Therefore, the designed void space obtained using this method is essentially achieved by adjusting the proportion of fine aggregates, so this design method does not have general applicability [5]. In response to the limitations of dry packing methods, Zhang and others proposed the use of “reserved void space” concepts and applied the Beiley method to the design of open-graded asphalt mixtures [6]. On this basis, Zhang and others further studied the differences between the improved Beiley method and traditional empirical design methods for open-graded asphalt mixtures, concluding that the improved Beiley method can accurately calculate the blending ratio of aggregates of different sizes [7]. William J.K. studied and analyzed the void space rate, permeation performance, and noise reduction function of open-graded asphalt mixtures through laboratory experiments. He used the Corelok vacuum-seal device and volume methods to measure the void space rate and compared them to obtain a regression relationship between them; he used a variable water head permeameter to study and analyze the permeation performance of open-graded asphalt mixtures, finding that their permeation performance is linearly correlated with their void space rate; he studied and analyzed the noise reduction effect of open-graded asphalt mixtures mixed with different materials at different frequencies [8]. Mallick and others studied the void space rate and permeation performance of open-graded granulite friction course (OGFC), finding that when the void space rate of OGFC is greater than 17%, its permeation coefficient increases rapidly with increases in void space rate. When the void space rate of OGFC is between 17% and 20%, it simultaneously exhibits excellent permeation performance and excellent road performance [9].
Alvarez et al. studied and analyzed the durability of permeable asphalt pavement and identified the influencing factors affecting the durability of permeable asphalt pavement through analysis [10]. Hamzah M.O. et al. used a rotary compactor to simulate the effect of heavy loads on single-layer and double-layer drainage asphalt pavements. The height changes of the specimens of single-layer and double-layer drainage asphalt pavement mixtures were observed before and after the experiment, and the permeation parameters of the specimens before and after the experiment were measured and recorded [11]. The results showed that after being compacted by the rotary compactor, the height of all specimens decreased and the void space decreased. The specimens of single-layer drainage asphalt pavement mixed with small-size aggregates and ordinary asphalt showed poor resistance to heavy loads, while those mixed with SBS-modified asphalt showed good resistance to heavy loads. After being compacted by the rotary compactor, the height of double-layer drainage asphalt pavement specimens decreased the most, indicating that double-layer drainage asphalt pavement specimens had poor resistance to heavy loads compared to single-layer ones. After compaction, both single-layer and double-layer drainage asphalt pavement specimens had a longer drainage time, and the specimens made with SBS-modified asphalt had better water permeability performance than those made with ordinary asphalt [12,13]. Kimberly et al., studied the influence of different fibers on the performance of permeable asphalt pavement. The results showed that adding fibers can improve the wear resistance of permeable asphalt pavement mixtures, but adding too much fiber will reduce its water permeability performance [14]. Hokari et al. conducted a detailed study on the internal characteristics of voids in drainage asphalt pavement using the sound absorption spectrum [15]. Alber et al. introduced a modular hydromechanical approach for evaluating both short-term and long-term surface drainage behavior in deformable asphalt pavements. The paper demonstrated how road geometry, road surface conditions, and rainfall properties impact the drainage capacity of the pavement surface through selected numerical examples [16]. Awwad examined the impact of water floods and rainfall on Jordan’s roads and highways, focusing on their effects on road sustainability and performance. The paper delves into the influence of factors such as road slopes, asphalt surface conditions, rainfall intensity, and water flow velocity on drainage length, drainage duration, and water depth [17]. Kalore et al. presented an analytical model for estimating drainage time in pavement base material, considering unsaturated characteristics. The model was calibrated using a mechanistic approach and compared with FHWA and finite element analysis. It performed comparably to finite element analysis, offered different results from FHWA, and was sensitive to key design parameters. The model was recommended for drainage layer design and parametric studies [18]. Ma et al. introduced an innovative method to assess clogging in porous asphalt pavement. It evaluated permeability anisotropy, considering the decrease in voids and increase in clogging grains. Finite element models based on porous media and Biot’s theory were proposed. Results suggested that assessing maximum drainage capacity (MDC) using the drainage capacity coefficient (DCC) was essential to avoid surface ponding. Clogging increased the pore water pressure, which is affected by pavement layer height. To enhance road safety, consider pavement thickness and drainage evaluations under clogging and load conditions [19].
The evaluation of the water stability of asphalt concrete mainly uses methods such as the Marshall test, splitting test, immersion compressive test, Texas bearings freeze−thaw test, Lottman test, improved Lottman test, Tunniclif and Root test, and immersion rutting test [20,21]. Currently, China commonly uses the immersion Marshall test, the vacuum saturation Marshall test, and the freeze−thaw splitting test [22]. It is not difficult to see from the above that the current research on asphalt concrete water damage is quite insufficient [23,24]. In experimental research, most studies focus on the experimental methods and evaluation of water damage to pavement and do not accurately express and demonstrate the mechanism and microscopic evolution process of water damage. In theoretical research, although there has been some progress, most studies have remained at the stage of qualitative description of the mechanism of water damage and local surface description [25,26]. In fact, there are many influencing factors for the occurrence of water damage in asphalt concrete pavement. A single factor cannot lead to the occurrence of water damage [27,28]. It is necessary to study and propose a theoretical analysis and calculation method that reflects the damage process of pavement structure and materials under vehicle load and water pressure [29]. In numerical analysis, most studies start from the saturated state to analyze the distribution law of excess pore water pressure and study the fatigue damage process in the saturated state, which is different from the actual situation of the non-saturated state road surface [30]. How to more closely approximate the actual situation and reflect the non-saturated seepage process is not yet well studied [31]. As a typical section in road engineering, the long-slope section shows different failure modes during long-term service. Currently, research on the asphalt mixture for long slope sections mainly focuses on high temperature resistance to rutting, shear resistance, water damage resistance, fatigue resistance, etc.
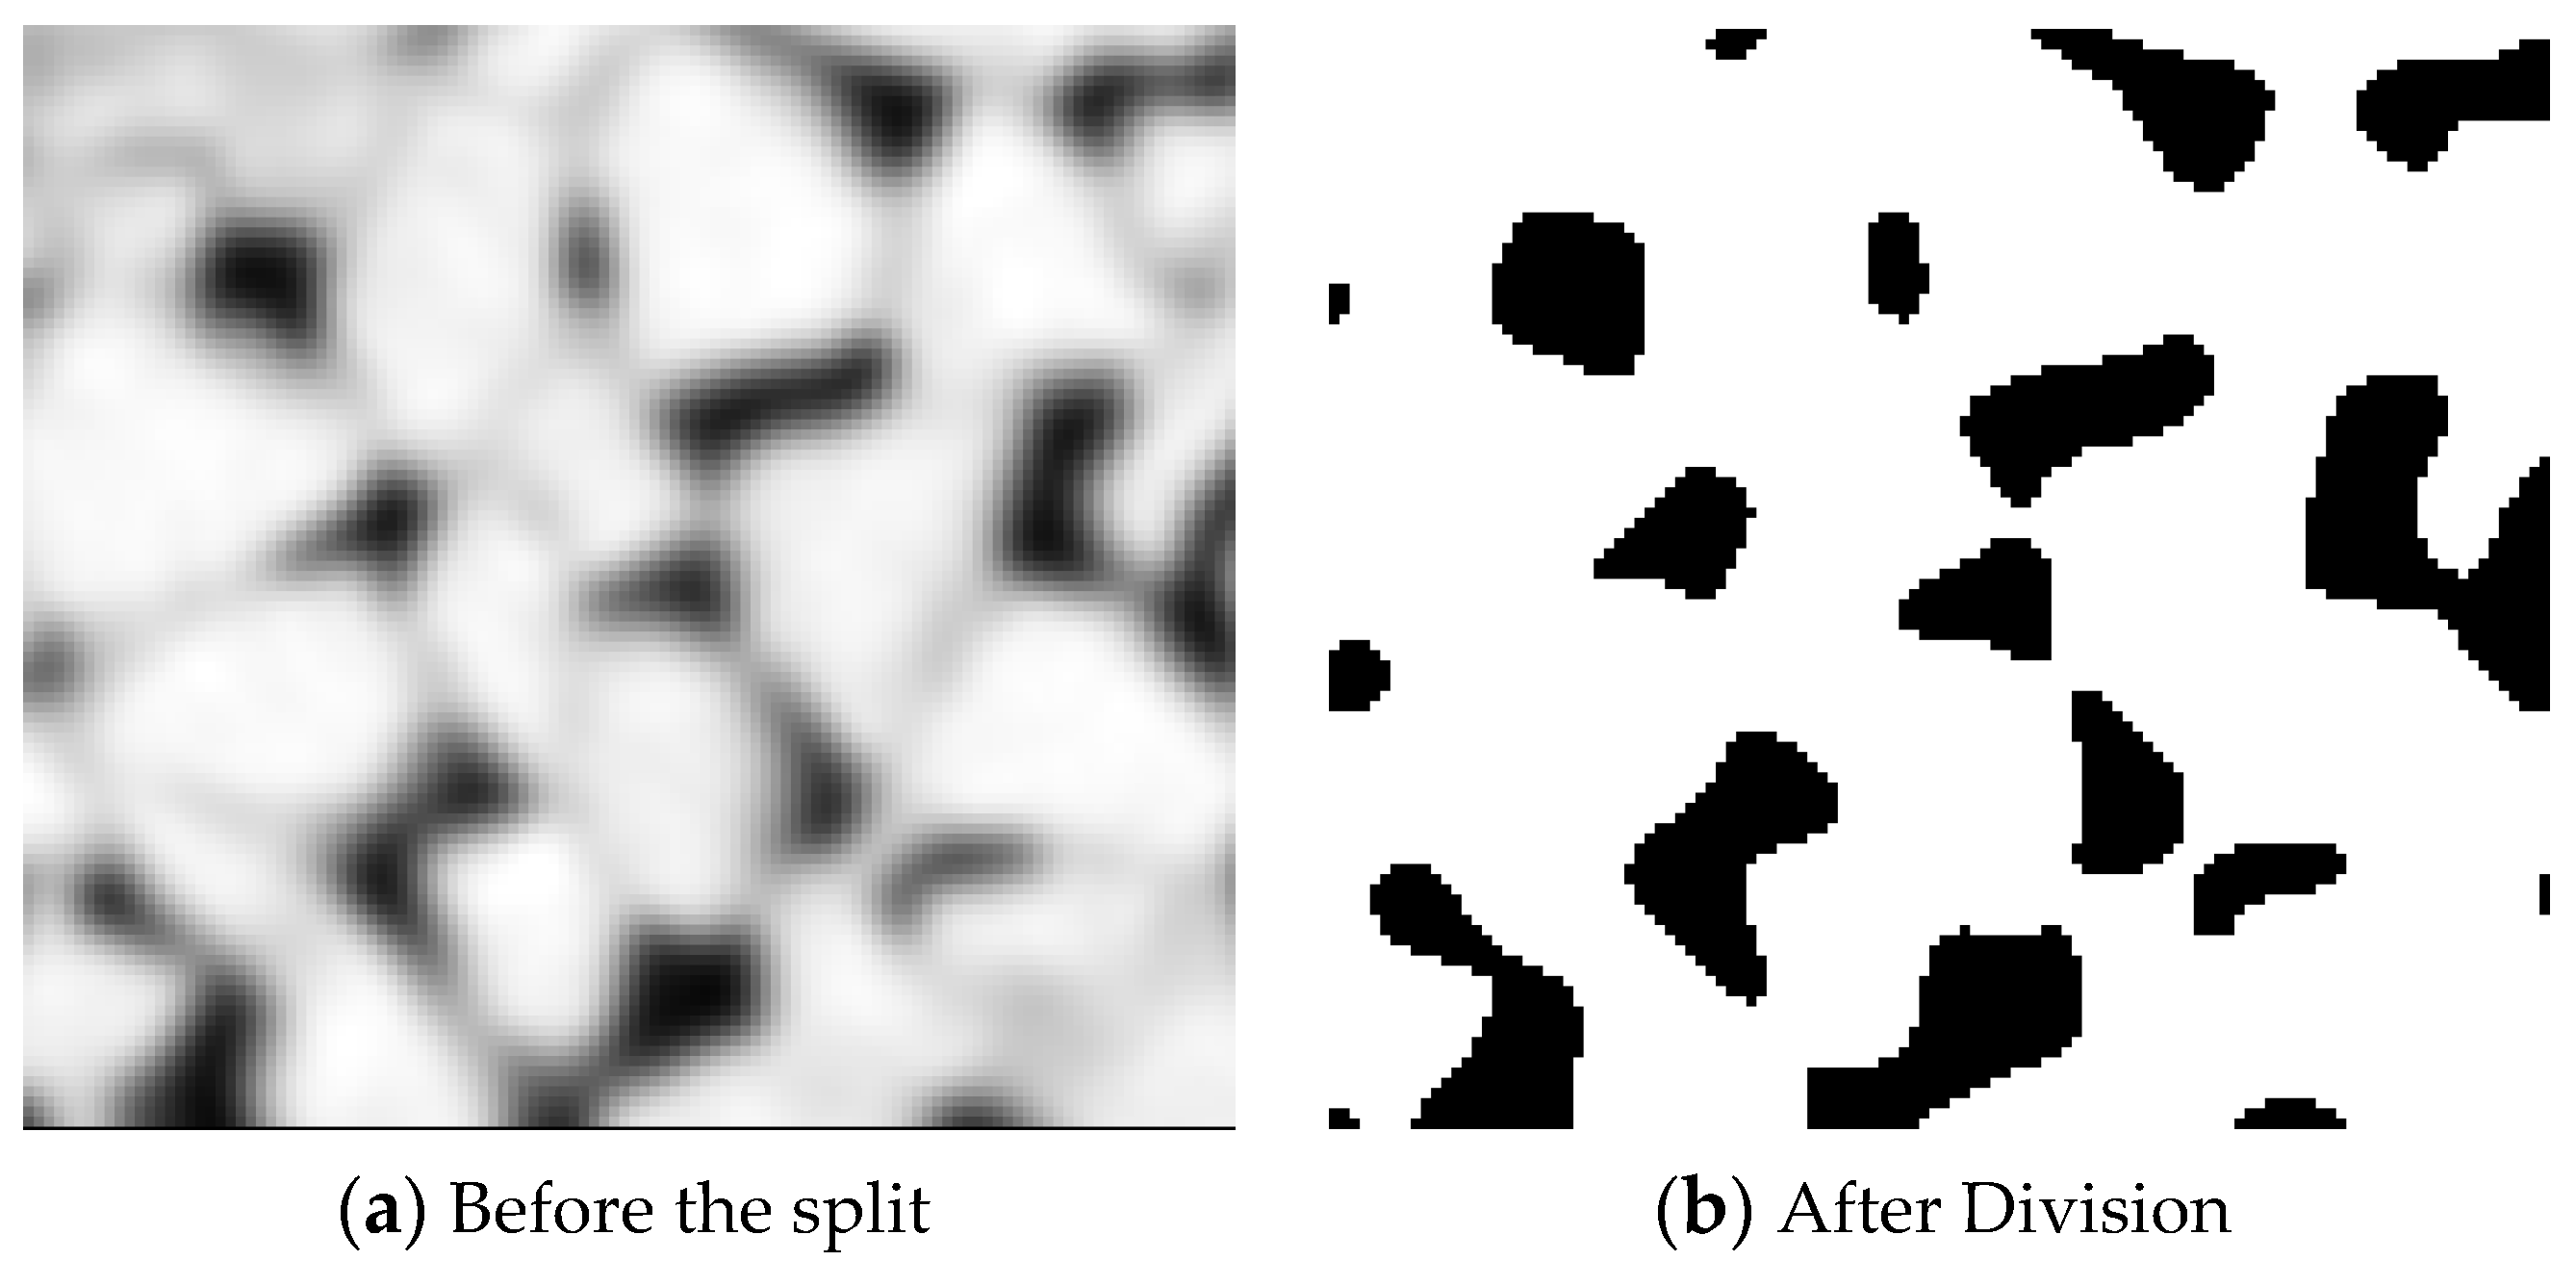
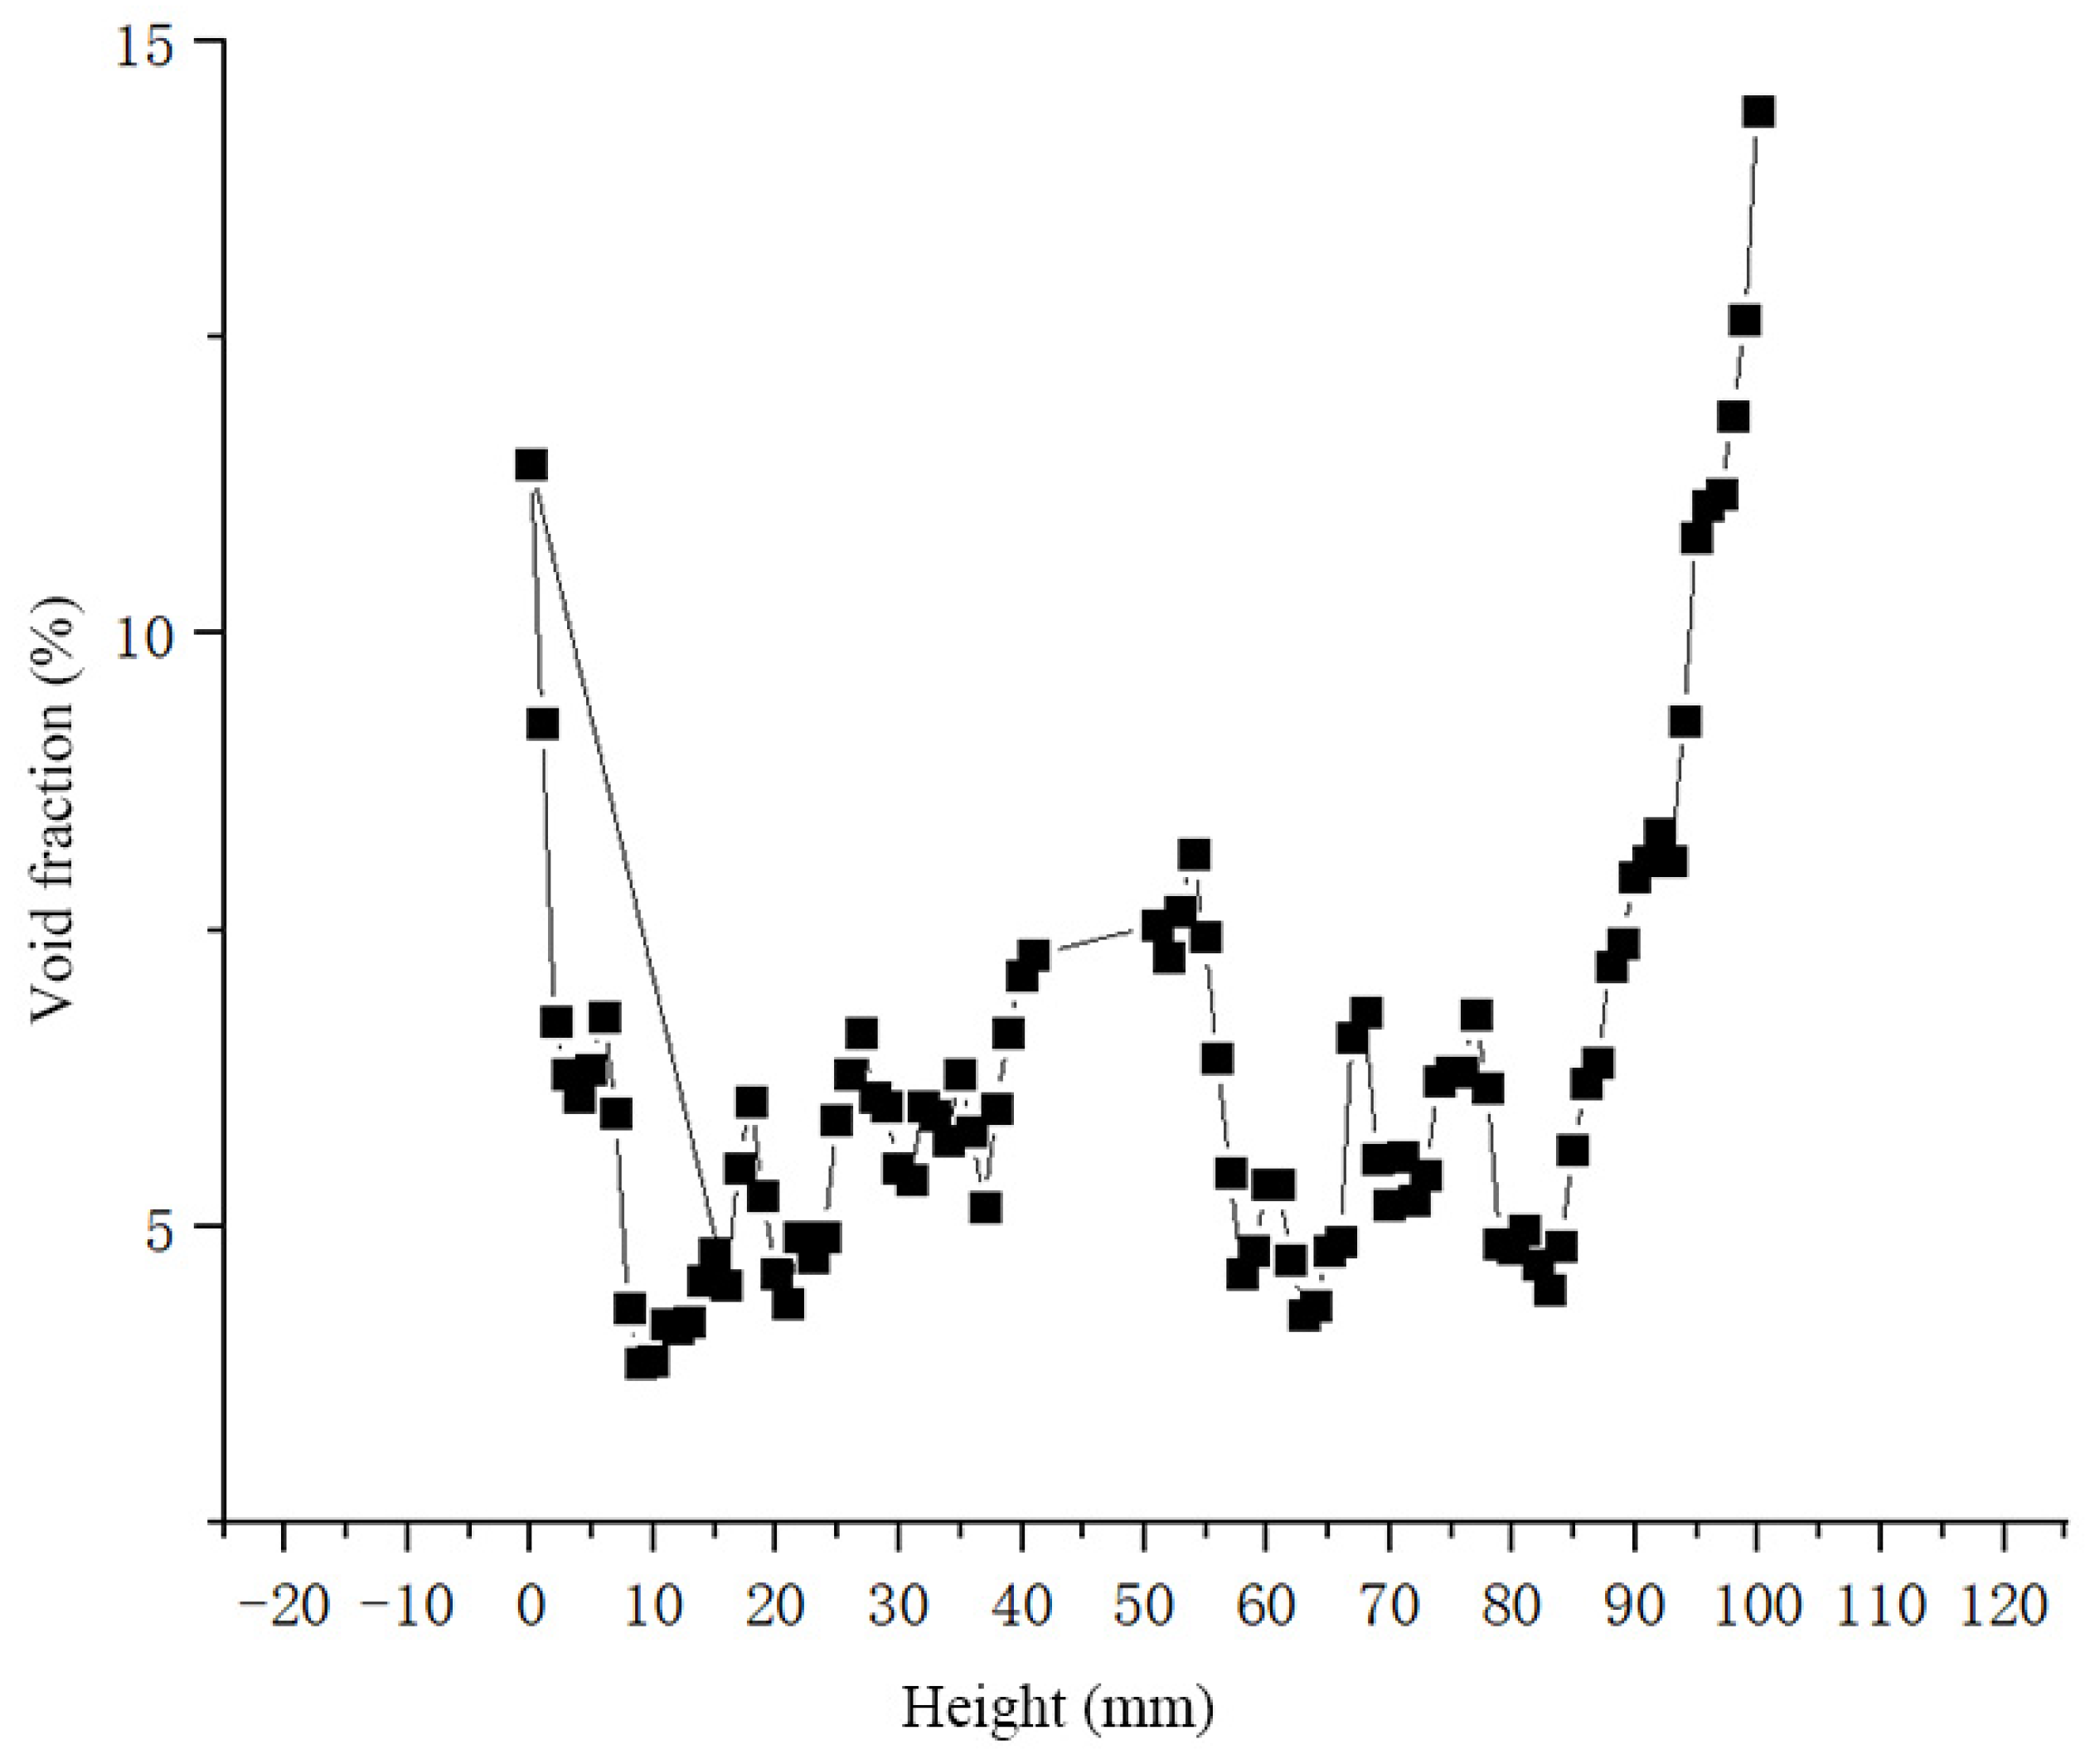
The gradation design of asphalt mixtures for long-slope sections has been studied in the paper. Taking the high-performance asphalt mixture (high functional asphalt mixture) gradation as a starting point, an orthogonal experiment was used to design asphalt mixtures for long-slope roads (referred to as FAM mixtures). The main control indexes are the shear performance and void space ratio of the mixture. Then, the void space characteristics of the mixture were analyzed through CT scanning. Subsequently, the performance of permeable pavement structures in long slope-sections was analyzed to provide references for the promotion of permeable pavements in long slope sections.

2. Materials and Methods

2.1. A New Asphalt Mixture Grading Scheme Suitable for Long and Long Longitudinal Slope Pavements

The main cause of damage to longitudinal gradient road surfaces is rutting due to wheel compression from vehicular loads. Based on their load-bearing characteristics and functional usage, primary evaluation metrics include shear strength and porosity. Shear strength is determined through the uniaxial penetration test. Using orthogonal design principles, we focus on two key factors: the 2.36 mm sieve passing rate and asphalt content. Additionally, by incorporating the 9.5 mm and 0.075 mm sieve passing rates, we designed the experiment to explore variations in these four factors. Detailed experimental factors and levels can be found in Table 1.
In this study, the theory of orthogonal experimental design with multiple factors and levels is adopted. By varying the control sieve sizes and asphalt content, we select transformation factors. After determining the factors, levels for each factor are decided based on empirical methods to conduct the orthogonal design. The L (34) orthogonal design table is used, leading to nine distinct experimental setups. The aggregate passing rates for these nine gradation experiments can be found in Table 2.
Specimens were prepared using the gyratory compaction method. According to the experimental scheme, void ratio and shear strength tests were conducted on different experimental groups. The results of these tests are presented in Table 3.
After consulting domestic standards on the shear strength of asphalt mixtures, it was found that for asphalt pavement surface layers, when considering the most unfavorable situations where shear fatigue failure is likely to occur, the shear strength of the asphalt mixture should be above 1.04 MPa to meet the requirements. For general traffic areas, the shear strength of the asphalt surface layer mixture should also be above 0.55 MPa to satisfy the design criteria. The gradation ranges for FAM mixtures with good shear performance are shown in Table 4.
Performance tests were conducted on the mixture specimens, and the results met the construction technical specifications. Notably, the shear strength index reached 1.73 MPa, which is significantly higher than the required value of 0.7 MPa specified in the standards. Additionally, the dynamic stability showed a notable improvement compared to the standard values.

2.2. Digital Image Processing and Recognition of Asphalt Mixture Based on CT Technology

During the image processing of the scanned images of the asphalt mixture specimens, the aggregate part in the picture was close to white, while the voids tended to be black or gray. Therefore, based on the principle of contrast, in the processed image, the voids are treated as the subject, with the aggregate and binder serving as the background. In this experiment, a CT scanner was used, from Sanying Precision Instrument Co., Ltd., Tianjin, China. The asphalt mixture specimens were formed using the gyratory compaction method, with the height controlled at around 100 mm. Cross-sectional and longitudinal images of the specimens were obtained through scanning. The technical parameters of the CT machine are detailed in Table 5.
The objective of this research is to distinguish between the voids, asphalt, and aggregate in the scanned images. Based on comparative studies, the thresholding method is employed to segment the CT images of the asphalt mixture. The selection of the threshold is the crux of threshold segmentation. Through thresholding, pixels below this level are re-designated as black, while those above this level are re-designated as white. The standard approach is to set values below the threshold to 0 and those above the threshold to 1. Based on our research and comparisons, the threshold for the image was determined empirically. Figure 1 showcases the segmentation results of the CT-scanned mixture specimen.

2.3. Experimental Method for Water Permeability

2.3.1. Shear Performance Test

Based on the uniaxial penetration test conditions, a small diameter of 28.5 mm is used as the pressure head. The cylindrical sample has a diameter of 100 mm and a height of 100 mm, as shown in Figure 2a. The sample preparation method is rotary compaction, with a loading speed of 1 mm/min, as shown in Figure 2b. The test environment temperature is 60 °C, and the sample is placed in a 60 °C constant temperature box for 6 h before the experiment.
Due to the cylindrical sample size of 100 mm × 100 mm, in the standard Marshall compaction process, a mixed material of 1200 g is typically used to compact the sample to a height of 63.5 mm. Based on this information, the amount of material required for the rotary compaction process can be calculated using Equation (1).
1200 S 0 · h 0 = m S · h
In Equation (1), S0 refers to the base area of the small Marshall specimen, h0 refers to the height of the small Marshall specimen, which is 63.5 mm, m refers to the mass of the uniaxial penetration or ring shear test specimen, S refers to the base area of the uniaxial penetration test specimen, and h refers to the height of the uniaxial penetration test specimen.
After determining the amount of material required, the number of rotational compaction cycles is set. For SMA and FAM asphalt mixtures, the rotation compaction cycles are 100 times, and for permeable asphalt mixtures, the rotation compaction cycles are 75 times.

2.3.2. Anti-Slip Performance Test

Asphalt pavement on long slopes must adapt to heavy traffic and ensure traffic safety; therefore, it must have excellent anti-skid performance. Two methods were used to evaluate the anti-skid performance of different asphalt mixtures: the sand method for constructing the depth test and the Brinell method for the friction coefficient test.

2.3.3. Dynamic Modulus Test

The dynamic modulus is an important dynamic parameter in road structure design, and it is of great significance to explore and study the test methods of dynamic modulus for asphalt pavement. First, the rotary compaction test specimen was formed with a size of 150 mm × 170 mm (diameter × height). A core was taken out with a diameter of 100 mm and a height of 150 mm in preparation for the dynamic modulus test using a drill core machine. The dynamic modulus test adopts the NCHRP9-29-SPT pavement design basic performance test system of the Beijing Transportation Ministry Highway Test Station. By applying a semi-sinusoidal pressure load to the specimen, the dynamic modulus and phase angle of the asphalt mixture under different temperatures and load frequencies can be determined. During the test, the specimen was placed in the environmental chamber for a long time to ensure that the temperature of the entire specimen was consistent. The test temperatures were 5 °C, 20 °C, 35 °C, and 50 °C, and the frequencies were 25 Hz, 10 Hz, 5 Hz, 1 Hz, 0.5 Hz, and 0.1 Hz. The stress−strain relationship of viscoelastic hot-mixed asphalt mixtures under continuous sinusoidal load is determined by its complex dynamic modulus, E*. The complex modulus is defined as the ratio of stress to strain at any temperature and frequency. During the experiment, the dynamic modulus and phase angle of the asphalt mixture under each test condition were determined by measuring the average peak-to-peak amplitude of the load and the average peak-to-peak amplitude of the recoverable axial deformation in the last five loading cycles. The average time delay t between the deformation peak and load peak in the same loading cycle was also determined. For dynamic modulus tests on core samples, due to the test specimen diameter of 100 mm and height of 150 mm, the specimens were first taken to 100 mm in height using a coring machine along the vertical midline. Then, a cutting machine was used to cut 10 mm from each end of the specimen, resulting in a final height of 150 ± 0.5 mm. However, due to the displacement sensor installation location limitations for dynamic modulus testing, as shown in Figure 3, the resulting size was only about 138 mm ± 0.5 mm in height after processing.

3. Results and Discussion

3.1. Analysis of Void Distribution Characteristics of Long Longitudinal Slope New Asphalt Mixture

By using computed tomography scanning to obtain the cross-section and longitudinal section of an asphalt mixture sample, and through digital image processing of these images, the distribution of void fractions in different gradation test specimens can be analyzed.

3.1.1. Analysis of Longitudinal Distribution Characteristics of Voids in Mixture

To study the longitudinal distribution of void fractions in FAM mixtures, cross-sectional CT scans were taken of the rotated and compacted test specimens. The scanning scheme is shown in Figure 4, with a scanning interval of 1 mm. The resulting cross-sectional images were processed to extract the void features. To demonstrate the void fraction variations in the vertical direction, the experiment first selected FAM mixture specimens at distances of 25 mm, 50 mm (mid-plane), and 75 mm from the base surface for threshold processing and void feature extraction.
Perform gap feature extraction on the selected sections at three positions, as shown in Figure 5, Figure 6 and Figure 7. During image enhancement, median filtering was used for processing, with a 3 × 3 two-dimensional median filter as an example. The threshold method (threshold method) was used for image segmentation, with the threshold set to 128. The void parameters of the three cross-sections were statistically analyzed and are shown in Table 6.
From Table 6, it can be seen that the void distribution at the 75 mm height cross-section is more complex than the other two. Based on the void fraction index, the void fraction is smallest near the bottom at 25 mm, followed by 50 mm and 75 mm, which is consistent with the height change pattern of the cross-section. The maximum equivalent diameter of voids obtained by conversion is 0.312 mm at a height of 75 mm, which is considered the pore diameter of each void in the specimen. The minimum equivalent diameter is 0.292 mm at a height of 25 mm.
Through analysis, it can be concluded that there are differences in void parameters at different heights, and the void distribution is uneven, but the difference is not significant. Considering the direction of different heights, during the molding process, some fluid-like asphalt and asphalt cement will be affected by gravity and flow towards the bottom, resulting in more fine aggregates and asphalt fluid at the bottom compared to the upper part, leading to a lower void fraction.
The experiment also included a control group with two specimens of the SMA mixture and the PAC mixture. Similarly, the CT scanning sections were enhanced, and voids were segmented, as shown in Figure 8.
The void parameters of the three types of mixtures are shown in Table 7. By analyzing Figure 8 and Table 7, it can be seen that the void indices of FAM mixtures are between the other two types of mixtures. Specifically, PAC mixtures have a high value of 1328 mm2, with a void fraction of 16.92% and an equivalent diameter of each void of 2.595 mm. FAM mixtures have the smallest values for all indices, followed by SMA mixtures.
It is believed that the CT scanning parameters of each void are closely related to the mixture gradation. When the maximum particle size is maintained at 13.6 mm, the FAM mixture controls the key gradation of 2.36 mm aperture pass rate to ensure that the overall water permeability is not exceeded while achieving a void fraction between 4% and 7%.

3.1.2. Analysis of Lateral Distribution Characteristics

To understand the lateral distribution of void fractions in asphalt mixtures, CT scanning was used to scan the rotated and compacted test specimens. The scanning position schematic is shown in Figure 9, with six cross-sections scanned. The void feature extraction image is shown in Figure 10.
The statistical results of the void parameters for these three cross-sections are shown in Table 8.
As shown in Figure 9, the void parameters of the vertical cross-sections are not significantly different from the horizontal cross-sections, but the skeleton structure of the FAM mixture can be more easily observed from the vertical cross-sections. There are no continuous voids found in the different cross-sections, indicating that the mixture is non-permeable.
From the void parameters in Table 8, it can be seen that the void fraction remains consistent across different cross-sections and the equivalent diameter of voids varies little. Therefore, it can be concluded that the lateral distribution of the FAM mixture is relatively uniform, which is speculated to be due to the uniform stress applied to the mixtures during the rotational compaction process. This uniform stress results in a uniform distribution of asphalt mixture in the transverse direction.

3.2. Analysis of the Spatial Distribution Characteristics of Voids in Mixtures

3.2.1. The Spatial Distribution Pattern of Porosity

In order to obtain a more intuitive pattern of void change, the void content of FAM mixture specimens was statistically analyzed at the longitudinal height, and the void content change curve was obtained, as shown in Figure 10.
As shown in Figure 10, the void fraction distribution image resembles a bucket shape, with higher void fractions on both sides and a smaller void fraction in the middle. The void fraction distribution is uneven across different heights, with a relatively large dispersion. The minimum void fraction occurred at a distance of 9.7 mm from the bottom of the specimen, with a value of 3.2%. The maximum internal void fraction of the mixture occurred at a distance of 54 mm from the bottom, with a value of 7.4%. The void fraction in the upper part of the specimen is generally slightly higher than that in the lower part.
Further analyzing the void fraction distribution of the three types of mixtures, as shown in Figure 11, it can be observed that the void fraction distribution of all three mixtures is concave, with the void fraction in the top and bottom parts much higher than in the middle part. The overall void fraction distribution curve of the FAM-13 mixture is similar to the SMA. The PAC mixture has a much higher void fraction value than the other two types of mixtures. To compare the internal dispersion of the mixtures, the height range of 30 mm to 70 mm was classified as the internal mixture. By analyzing the range of void fractions in the three types of mixtures, it was found that the minimum was SMA-13 with a range of 3.99% from 30 mm to 70 mm, followed by PAC-13 with a range of 4.62%, and FAM-13 with a range of 4.23%, which is between the other two.
From the vertical change law of void fractions, it was found that the upper part of the mixture has a slightly higher void fraction than the lower part. To further verify this conclusion, the CT scanning data of void fractions were divided into three equal parts according to their height during molding, and each part’s CT scanning data of void fractions was calculated. The results are shown in Table 9.
Based on the results in Table 9, it can be further verified that the void fraction of the FAM mixture in the rotating compaction specimen is slightly higher in the upper part than in the lower part. In terms of molding, during the molding process, the mixture is subjected to pressure to form a skeleton interlock structure. At the same time, under the influence of gravity, some high-temperature fluid and some fine aggregates flow to the bottom. Overall, the upper part of the specimen lacks fine aggregates and binder, and some voids are not filled, resulting in a slightly higher void fraction in the upper part and a slightly lower void fraction in the lower part.
In addition, the change rates of different parts relative to the overall void fraction were calculated. When the change rate is positive, it means that the void fraction of this part is higher than the overall average void fraction, and the density of this part is lower than the overall value. When the change rate is negative, it means that the density of this part is higher than the overall average void fraction. From the data in Table 9, it can be seen that the upper part has a positive change rate of 0.17, which means that the void fraction of this part is 17% higher than the overall average void fraction, indicating that this part is relatively loose. The middle part has a negative change rate of −0.06, which is not significantly different from the overall average void fraction. The lower part has a negative change rate of −0.11, which means that the void fraction of this part is 11% lower than the overall average void fraction, indicating that this part is relatively dense. Therefore, it can be inferred that using the middle part of the FAM mixture to characterize the void fraction characteristics of this type of mixture is the most accurate and appropriate method.
To verify the conclusions derived from CT scanning data and explore the correlation between mixture experiments and CT scanning data, laboratory void fraction testing was conducted on FAM mixture specimens with the same gradation, as shown in Figure 12.
We measured the porosity of these three parts using the surface dry method, and the measurement results are shown in Table 10.
The void fraction data obtained by the two methods were processed and are shown in Figure 13.
Based on Figure 13 and Table 10, it can be observed that the experimental results on the void fraction of different parts also show variations, with a similar trend to the CT scan results. The upper part has a slightly higher void fraction compared to the average, while the middle part has the closest void fraction to the average. The lower part has a smaller void fraction and is relatively dense. However, the differences between each part are not significant, with the highest change rate of 0.014 for the upper part.
Furthermore, the experimental values for each part’s void fraction are overall lower than the CT scan values. From the perspective of the overall void fraction, the experimental value is 5.6% while the CT scan value is 6.3%, with an experimental value that is 11% lower than the scan value. This difference can be attributed to the experimental method using the immersion method to measure the void fraction of the mixture. During the process of immersing the sample in water, water cannot enter the non-connected voids inside the mixture. On the other hand, CT scanning can detect all the voids in the sample, leading to a higher void fraction value in the scan experiment compared to the experimental one.

3.2.2. The Spatial Distribution Pattern of Gap Types and Quantities

In order to visualize the distribution of voids inside the FAM mixture more intuitively, we classified the voids based on their size into four categories: 0–5 mm3, 5–10 mm3, 10–50 mm3, and 100 mm3 and above. The separation plot is shown in Figure 14. By analyzing the distribution of voids based on their size, we can gain a better understanding of the internal structure of the FAM mixture and how it affects its performance. For example, larger voids may have a greater impact on the strength and durability of the mixture, while smaller voids may not significantly impact these properties but may still influence other factors like water absorption. Understanding the distribution and size of voids can help guide mix design and optimization efforts to improve the performance of FAM mixtures.
Calculate the number of classified gaps, and the statistical results are shown in Table 11.
In the FAM mixture, voids with a volume of 0–5 mm3 account for the majority, far exceeding the number of other types of voids. Void volume of 50–100 mm3 is the least. Observing the distribution of various types of voids, 0–5 mm3 voids are most evenly distributed, which is directly related to their number. On the other hand, voids with a volume greater than 100 mm3 are distributed more on the top and bottom of the mixture, with some on the sides and less in the interior.

3.2.3. Gap Modeling Based on VG Studio Software

In order to further study the spatial distribution of FAM mixture, CT scanning was used to reconstruct the three-dimensional model of FAM mixture specimens, as shown in Figure 15 and Figure 16.
Based on Figure 16, it can be observed that the void distribution in the FAM mixture is relatively uniform. In the figure, the red areas represent voids with a volume greater than or equal to 100 mm3. It can be seen that these larger voids are more prevalent on the top of the mixture, while there is also some distribution at the bottom, but it is much less than on the top. Additionally, the blue areas represent voids with a volume less than or equal to 30 mm3, which are mainly found within the internal regions of the mixture.
The analysis suggests that during the molding process of the mixture, fine aggregates and asphalt are influenced by gravity and settle towards the bottom, resulting in a lack of fine aggregates between the coarse aggregates on the top surface. This causes a higher void volume on the top of the mixture. On the other hand, due to the edges of the mixture not being fully loaded during molding, there are some larger voids present on the sides and bottom of the mixture.
By considering these observations, it can be inferred that improving the molding process, especially for the top surface of the mixture, to ensure proper compaction and even distribution of fine aggregates may result in a more uniform void distribution and improved overall performance of the FAM mixture.

3.3. Performance Analysis of a New Type of Asphalt Mixture with Long Longitudinal Slopes for Road Use

Through experimental analysis and evaluation of the road performance and different mechanical indicators of FAM mixtures, comparisons were made with commonly used mixture types such as SMA and PAC, including shear resistance, water stability, skid resistance, and the dynamic modulus of the mixtures.

3.3.1. Shear Performance Results

The shear strength test results for different asphalt mixtures are shown in Table 12.
From Table 12, it can be seen that the uniaxial penetration test results indicate that the shear strength of the FAM asphalt mixture is higher than the other two mixtures at both temperatures, followed by the SMA and the PAC mixtures with the lowest shear strength. The order of shear strength from high to low for the three asphalt mixtures is the FAM asphalt mixture, SMA asphalt mixture, and PAC asphalt mixture. The experimental data also show that the test temperature has a significant impact on the shear strength of the mixtures. From 20 °C to 60 °C, the shear strength of the FAM asphalt mixture decreased from 2.05 KN to 1.62 KN, a 21% reduction; the permeability of the asphalt mixture experienced a 36.75% decrease. Among them, the SMA asphalt mixture exhibited the best temperature stability, with a temperature change resulting in a 16.76% decrease in performance. This indicates that the temperature sensitivity of the shear strength of these three asphalt mixtures is consistent with their high-temperature anti-rutting performance.

3.3.2. Anti-Slip Performance Results

Long longitudinal-slope asphalt pavement must adapt to heavy traffic and ensure driving safety; therefore, it must have excellent anti-slip performance. The study evaluates the anti-slip performance of different asphalt mixture specimens using two methods: the sand spreading method to construct the depth test and the pendulum friction coefficient test.
According to the current testing regulations, the structural depth test was conducted, and the results are shown in Table 13.
As can be seen from Table 13, the previous asphalt mixture has a larger TD compared to the other asphalt mixtures. This is due to the fact that TD is sensitive to the oil-stone ratio and has a strong correlation with the voidage. When there is a high use of coarse aggregates in the surface mixture, the opening voids become larger, resulting in greater structural depth. The structural depth of the FAM surface is also quite different from that of the SMA asphalt mixture and is comparable to that of the previous asphalt mixture. Based on the construction depth index, the anti-skid performance of the three mixtures is ranked as follows: previous asphalt mixture, FAM asphalt mixture, and SMA asphalt mixture.
According to the current testing regulations, the friction coefficient test was conducted, and the results are shown in Table 14.
The friction coefficient of asphalt pavement is influenced not only by the microstructure of coarse aggregates but also by the number of contact points in the sliding area. When the strength of the former is greater than the latter, the coarser the aggregates, the higher the friction coefficient of asphalt pavement. On the other hand, when there are fewer coarse aggregates and more asphalt and fine aggregates, the more contact points formed by the passing of the sliding block, the greater the anti-skid force. The above experimental results should meet the requirements of the “Asphalt Pavement Design Code for Expressways and Primary Highways”, which proposes that FB > 45 bpn. The PAC asphalt mixture has a maximum BPN value of 75.1, and the FAM mixture is similar. The friction coefficient of asphalt pavement decreases as the content of fine aggregates increases. This is due to the increase in the addition of fine aggregates in the gradation, which increases the number of contact points between the sliding block and the test plate, leading to an increase in friction force.

3.3.3. Dynamic Modulus Results

The dynamic modulus test results of the FAM mixture are shown in Table 15.
Based on the dynamic modulus results, it can be observed that the FAM mixture exhibits an increase in dynamic modulus with increasing test frequency at different temperatures. Additionally, the dynamic modulus at high temperatures is lower than at low temperatures, which is attributed to the softening of the asphalt at higher temperatures, resulting in a decrease in the cohesive force between the aggregates and between the aggregates and the asphalt. Similarly, the dynamic modulus under high-frequency test conditions is higher than under low-frequency conditions.
According to the research results of NCHRP Project 9-19, the value of E*/sin Φ (E*-dynamic modulus; Φ-phase angle) is more representative of the high-temperature anti-rutting performance of asphalt mixtures. A larger value of E*/sin Φ indicates a stronger high-temperature anti-rutting performance of the mixture, while a smaller value indicates a weaker performance. In this article, the dynamic modulus data under different test conditions were processed to calculate the rut factor, as shown in Table 16.
At high temperatures, asphalt mixtures for long longitudinal slope roads typically become more pliable with reduced viscosity, making them prone to deformation. This can have a positive impact on the pavement’s flexibility and compression performance, but it may also lead to plastic deformation and the formation of ruts. At low temperatures, asphalt mixtures become more brittle, losing their elasticity and becoming susceptible to cracking. This can pose a threat to the pavement’s resistance to freeze−thaw cycles and overall durability. Under high-frequency loading, asphalt mixtures dissipate more energy due to their stress−strain response, which can result in material deformation and reduced fatigue performance. Low-frequency loading may induce plastic deformation in asphalt mixtures, affecting their permanent deformation characteristics.
To assess the performance of asphalt mixtures, it is crucial to consider the influence of temperature and frequency. This involves conducting bending and compression tests under different temperature conditions to understand the material’s real-world performance. Additionally, frequency affects material properties such as dynamic modulus and damping, which are vital considerations in designing road structures and predicting material service life. Taking the rut factor (E*/sin Φ) under different test temperatures and analyzing it, as shown in Figure 17, it can be observed from the graph that, at each temperature, the rut factor increases with the increase in test frequency. Among them, at low temperature conditions (−10 °C, 5 °C), the rate of change in rut factor with frequency is much greater than at high temperature conditions (50 °C, 35 °C). The relevant results indicate that the proposed long longitudinal slope asphalt mixture can meet the application requirements.

4. Conclusions

This article conducts a study on the design of new asphalt mixtures for long slopes, using CT scanning to analyze the void fraction of different rotated and compacted test specimens. Through image processing technology, the article analyzes their void characteristics. Meanwhile, the article also carries out experimental research and technical evaluations on the various performance characteristics of the FAM mixture. Parallel experiments are set up to compare and analyze the performance of the mixture. The main conclusions are as follows:
(1)
Based on the research philosophy of functional integration, a new asphalt mixture gradation suitable for long slopes is proposed. The optimal key factor composition is: 0.075 mm passing rate of 7%, 2.36 mm passing rate of 20%, 9.5 mm passing rate of 55%, and an oil-stone ratio of 4.8%.
(2)
The spatial distribution of void fractions in the upper image of the test specimen is similar to a bucket shape. By statistically analyzing the internal void fraction of the test specimen, it is found that the minimum value is located 9.7 mm away from the bottom with a value of 3.2%, which is 49.2% smaller than the average void fraction.
(3)
Analysis of the void fractions show that the upper part has a slightly higher void fraction overall than the lower part, while the middle part is closest to the overall void fraction. The largest voids are distributed mostly on the top part of the test specimen, followed by the bottom and side parts, while small voids are evenly distributed within the mixture test specimen.
(4)
The three tested mixtures’ void distribution profiles all follow an inverted V-shape pattern, with high void fraction curves on both sides and a low curve in between.
(5)
It is found that under high-temperature conditions (50 °C), FAM mixtures have a minimum dynamic modulus value of 323 Mpa, a peak value of 22,746 MPa at −10 °C, and a frequency of 25 Hz. Under high-temperature conditions, dynamic modulus values are lower than under low-temperature conditions; high-frequency conditions have higher dynamic modulus values than low-frequency conditions.
(6)
In the future, comprehensive research should be conducted on the mix design of asphalt lakes and rivers with long longitudinal slopes from the perspectives of resistance to weathering and temperature changes, vehicle loads, and long-term maintenance.

Author Contributions

Conceptualization, H.L. and B.X.; methodology, H.W.; software, A.G.; validation, X.Y., S.P. and S.Z.; formal analysis, S.Z.; investigation, A.G.; resources, S.Z.; data curation, X.Y.; writing—original draft preparation, H.W.; writing—review and editing, S.P.; visualization, H.L.; supervision, S.P.; project administration, H.L.; funding acquisition, S.Z. All authors have read and agreed to the published version of the manuscript.

Funding

This research was funded by Shandong Provincial Transportation Technology Project: Research on Application Technology of Large Void Asphalt Pavement under Low Speed and Heavy Load Traffic.

Data Availability Statement

Data are contained within the article.

Conflicts of Interest

Author Bin Xu was employed by the Research Institute of Highway Ministry of Transport, Zhong Lu Gao Ke (Beijing) Road Technology Co., Ltd. Author Hongshan Wang was employed by the Shandong Binzhou Highway Engineering Co., Ltd. Author Aodong Gao was employed by the Research Institute of Highway Ministry of Transport, Zhong Lu Gao Ke (Beijing) Road Technology Co., Ltd. Author Shiqing Zhang was employed by the Shijiazhuang Expressway Group Co., Ltd. The remaining authors declare that the research was conducted in the absence of any commercial or financial relationships that could be construed as a potential conflict of interest.

References

  1. Khalid, S.W.; AL-Hadad, B.M.A. A comparison study of using polyethylene terephthalate and limestone fillers on porous asphalt mixture behaviours. Ain Shams Eng. J. 2023, 102426. [Google Scholar] [CrossRef]
  2. Chen, X.; Wang, H.; Li, C.; Zhang, W.; Xu, G. Computational investigation on surface water distribution and permeability of porous asphalt pavement. Int. J. Pavement Eng. 2022, 23, 1226–1238. [Google Scholar] [CrossRef]
  3. Zhang, Y.; Li, H.; Lu, Q.; Yang, J.; Wang, T. Effect of Different Admixtures on Pore Characteristics, Permeability, Strength, and Anti-Stripping Property of Porous Concrete. Buildings 2022, 12, 1020. [Google Scholar] [CrossRef]
  4. Zoorob, S.; Cabrera, J.; Takahashi, S. Effect of aggregate gradation and binder type on the properties of porous asphalt. In Proceedings of the 3rd European Symposium on Performance and Durability of Bituminous Materials and Hydraulic Stabilised Composites, Leeds, UK, April 1999; University of Leeds: Leeds, UK, 1999; pp. 145–162. [Google Scholar]
  5. Hardiman, H. Application of packing theory on grading design for porous asphalt mixtures. Civ. Eng. Dimens. 2004, 6, 57–63. [Google Scholar]
  6. Zhang, M.M.; Hao, P.W. Effects of parameters designed by bailey method on the property of porous asphalt mixture. Adv. Mater. Res. 2012, 374, 1414–1419. [Google Scholar] [CrossRef]
  7. Ma, X.; Li, Q.; Cui, Y.-C.; Ni, A.-Q. Performance of porous asphalt mixture with various additives. Int. J. Pavement Eng. 2018, 19, 355–361. [Google Scholar] [CrossRef]
  8. Gupta, A.; Rodriguez-Hernandez, J.; Castro-Fresno, D. Incorporation of additives and fibers in porous asphalt mixtures: A review. Materials 2019, 12, 3156. [Google Scholar] [CrossRef]
  9. Zhang, Z.; Sha, A.; Liu, X.; Luan, B.; Gao, J.; Jiang, W.; Ma, F. State-of-the-art of porous asphalt pavement: Experience and considerations of mixture design. Constr. Build. Mater. 2020, 262, 119998. [Google Scholar] [CrossRef]
  10. Alvarez, A.E.; Martin, A.E.; Estakhri, C. A review of mix design and evaluation research for permeable friction course mixtures. Constr. Build. Mater. 2011, 25, 1159–1166. [Google Scholar] [CrossRef]
  11. Xu, B.; Ding, R.; Yang, Z.; Sun, Y.; Zhang, J.; Lu, K.; Cao, D.; Gao, A. Investigation on performance of mineral-oil-based rejuvenating agent for aged high viscosity modified asphalt of porous asphalt pavement. J. Clean. Prod. 2023, 395, 136285. [Google Scholar] [CrossRef]
  12. Hamzah, M.O.; Yatim, H.M. Resistance to Overcompaction of Single Layer and Double Layer Porous Asphalts. J. East. Asia Soc. Transp. Stud. 2007, 7, 1973–1986. [Google Scholar]
  13. Wang, T.; Weng, Y.; Cai, X.; Li, J.; Xiao, F.; Sun, G.; Zhang, F. Statistical modeling of low-temperature properties and FTIR spectra of crumb rubber modified asphalts considering SARA fractions. J. Clean. Prod. 2022, 374, 134016. [Google Scholar] [CrossRef]
  14. Lyons, K.R.; Putman, B.J. Laboratory evaluation of stabilizing methods for porous asphalt mixtures. Constr. Build. Mater. 2013, 49, 772–780. [Google Scholar] [CrossRef]
  15. Hokari, K.; Maruyama, T.; Ohkawa, H.; Koyama, K. A fundamental study on void structure of the drainage asphalt pavement. Doboku Gakkai Ronbunshu 1994, 1994, 69–76. [Google Scholar] [CrossRef] [PubMed]
  16. Alber, S.; Schuck, B.; Ressel, W.; Behnke, R.; Canon Falla, G.; Kaliske, M.; Leischner, S.; Wellner, F. Modeling of surface drainage during the service life of asphalt pavements showing long-term rutting: A modular hydromechanical approach. Adv. Mater. Sci. Eng. 2020, 2020, 8793652. [Google Scholar] [CrossRef]
  17. Awwad, M. Studying the effects of roads geometry and design parameters on the pavement drainage system. Civ. Eng. J. 2021, 7, 49–58. [Google Scholar] [CrossRef]
  18. Kalore, S.A.; Babu GL, S.; Mallick, R.B. Design approach for drainage layer in pavement subsurface drainage system considering unsaturated characteristics. Transp. Geotech. 2019, 18, 57–71. [Google Scholar] [CrossRef]
  19. Ma, Y.; Chen, X.; Geng, Y.; Zhang, X. Effect of clogging on the permeability of porous asphalt pavement. Adv. Mater. Sci. Eng. 2020, 2020, 4851291. [Google Scholar] [CrossRef]
  20. Zhang, Q.; Ji, T.; Wang, Z.; Xiao, L. Experimental Study and Calculation of a Three-Dimensional Finite Element Model of Infiltration in Drainage Asphalt Pavement. Materials 2020, 13, 3909. [Google Scholar] [CrossRef]
  21. Cheng, Z.; Li, X.; Yang, Q.; Liang, N.; Chen, L.; Zheng, S.; Wang, D. Study on Compaction Properties and Skeleton Structural Characteristics of Porous Asphalt Mixture. Sustainability 2023, 15, 13911. [Google Scholar] [CrossRef]
  22. Luo, W.; Li, L. Development of a new analytical water film depth (WFD) prediction model for asphalt pavement drainage evaluation. Constr. Build. Mater. 2019, 218, 530–542. [Google Scholar] [CrossRef]
  23. Raaberg, J.; Schmidt, B.; Bendtsen, H. Technical Performance and Long-Term Noise Reduction of Porous Asphalt Pavements; The Danish Road Directorate: Copenhagen, Denmark, 2001. [Google Scholar]
  24. Ghafari Hashjin, N.; Zarroodi, R.; Payami, M.; Aghdasi Gehraz, S.H. Effect of type and aggregate gradation on the functional properties of porous asphalt (case study of Iran). SN Appl. Sci. 2023, 5, 265. [Google Scholar] [CrossRef]
  25. Takahashi, S. Comprehensive study on the porous asphalt effects on expressways in Japan: Based on field data analysis in the last decade. Road Mater. Pavement Des. 2013, 14, 239–255. [Google Scholar] [CrossRef]
  26. Wang, T.; Dra, Y.A.S.S.; Cai, X.; Cheng, Z.; Zhang, D.; Lin, Y.; Yu, H. Advanced cold patching materials (CPMs) for asphalt pavement pothole rehabilitation: State of the art. J. Clean. Prod. 2022, 366, 133001. [Google Scholar] [CrossRef]
  27. Wang, T.; Chen, Z.; Wang, Y.; Cui, Y.; Sun, Y.; Ning, R.; Tian, Y.; Zhang, Y. The Effect of Aging on the Molecular Distribution of Crumb Rubber Modified Asphalt Based on the Gel Permeation Chromatography Test. Buildings 2023, 13, 1165. [Google Scholar] [CrossRef]
  28. Cai, X.; Tang, X.; Pan, S.; Wang, Y.; Yan, H.; Ren, Y.; Chen, N.; Hou, Y. Intelligent recognition of defects in high-speed railway slab track with limited dataset. Comput.-Aided Civ. Infrastruct. Eng. 2023. [Google Scholar] [CrossRef]
  29. Chen, J.-S.; Yang, C.H. Porous asphalt concrete: A review of design, construction, performance and maintenance. Int. J. Pavement Res. Technol. 2020, 13, 601–612. [Google Scholar] [CrossRef]
  30. Alfatlawi, T.J.; Naji, A.; Hamid, Z.; Hussein, M. Grate Inlet Hydraulic Efficiency with Varying Porous Asphalt Aprons. J. Irrig. Drain. Eng. 2021, 147, 04021014. [Google Scholar] [CrossRef]
  31. Autelitano, F.; Longo, S.; Giuliani, F. Phyto-based sodium chloride hydrogel for highway winter maintenance of porous asphalt pavements. Constr. Build. Mater. 2022, 319, 126082. [Google Scholar] [CrossRef]
Figure 1. Comparison diagram before and after image segmentation.
Buildings 13 02955 g001
Figure 2. Single-axis penetration test instrument.
Buildings 13 02955 g002
Figure 3. Dynamic modulus specimen drilling and sensor installation.
Buildings 13 02955 g003
Figure 4. Schematic diagram of transverse scanning of the specimen (scanning interval of 1 mm).
Buildings 13 02955 g004
Figure 5. CT Scan Original Image.
Buildings 13 02955 g005
Figure 6. Image enhancement of CT scan images.
Buildings 13 02955 g006
Figure 7. Gap separation.
Buildings 13 02955 g007
Figure 8. 50 mm height CT scan void separation diagram of different mixtures.
Buildings 13 02955 g008
Figure 9. Extraction map of side section gap separation at different distances from the center of the circle.
Buildings 13 02955 g009
Figure 10. Distribution of FAM-13 porosity along height.
Buildings 13 02955 g010
Figure 11. Porosity distribution of different mixtures along height.
Buildings 13 02955 g011
Figure 12. Porosity test pieces in different parts.
Buildings 13 02955 g012
Figure 13. Void ratio measured by CT scan and test.
Buildings 13 02955 g013
Figure 14. Effect of void separation for different volume types.
Buildings 13 02955 g014aBuildings 13 02955 g014b
Figure 15. CT scan restoration image.
Buildings 13 02955 g015
Figure 16. A three-dimensional model of voids in FAM mixture.
Buildings 13 02955 g016
Figure 17. The variation of rutting factor with load frequency at different temperatures.
Buildings 13 02955 g017
Table 1. FAM-13 asphalt mixture factors and levels.
Serial Number1234
Factor9.5 mm2.36 mm0.75 mmAsphalt content/%
Horizontal 1551654.8
Horizontal 2591875.1
Horizontal 3632095.4
Table 2. Target grading passing rate data table.
Number1613.29.54.752.361.180.60.30.150.075Asphalt Content
1100955522161514121054.8
2100955522181514121075.1
3100955522201514121095.4
4100955922161514121075.4
5100955922181514121094.8
6100955922201514121055.1
7100956322161514121095.1
8100956322181514121055.4
9100956322201514121074.8
Table 3. Orthogonal experimental results.
Factor9.52.360.075Asphalt BinderPorosityShearing Strength
Experiment 111116.851.24
Experiment 212226.81.32
Experiment 313334.61.90
Experiment 421236.151.82
Experiment 522317.851.58
Experiment 623125.91.25
Experiment 731327.751.53
Experiment 832136.21.57
Experiment 933217.551.60
Table 4. FAM-13 mixture grading range.
Screen Hole Size (mm)1613.29.54.752.361.180.60.30.150.075
Pass rate (%)upper limit1001006230261815131110
lower limit1009054201812111097
Table 5. Machine parameters of CT detection equipment.
VoltageCurrentFDDFODResolutionIntegration TimeThe Number of Projection SheetsDevice Model
240 KV140 μA805 mm232 mm0.04 mm2000 ms1800Diondo D2
Table 6. Summary table of CT image parameters at different heights.
Height (mm)Number of Voids (pcs)Void Area (mm2)Void Equivalent Diameter (mm)Porosity (%)
25544400.2925.62
50574450.3095.66
75614790.3125.83
Table 7. The results of void parameters of different mixtures.
Mix TypeNumber of Voids (pcs)Void Area (mm2)Void Equivalent Diameter (mm)Porosity (%)
FAM-13574450.3095.66
SMA-13312600.1523.32
PAC-139513282.59516.92
Table 8. Statistics table of void parameters of different side sections.
Distance from Center of Circle (mm)Number of Voids (pcs)Void Area (mm2)Void Equivalent Diameter (mm)Porosity (%)
0744620.3125.63
10583720.3115.63
30322210.3075.64
Table 9. Porosity statistics table of upper, middle and lower specimens.
PositionPorosity (%)Rate of Change
Surface7.380.17
Central5.98−0.06
Bottom5.62−0.11
Specimen void rate6.3-
Table 10. Summary of porosity of different parts measured by dry method of FAM mixture.
PositionPorosity (%)Rate of Change
Surface5.680.014
Central5.610.002
Bottom5.57−0.005
Specimen void rate5.6-
Table 11. Distribution of void volume and quantity.
Void Volume (mm3)0–55–1010–5050–100100 or MoreTotal
quantity1062436718601250
Divination ratio (%)84.963.45.361.444.8-
Table 12. The shear strength results of three types of asphalt mixtures tested by uniaxial penetration method.
Mixture TypeTemperature1 #2 #3 #Average Value
FAM20 °C2.122.012.022.05
60 °C1.731.591.541.62
SMA20 °C1.681.741.771.73
60 °C1.41.61.321.44
PAC20 °C1.251.161.11.17
60 °C0.830.710.680.74
Table 13. Structural depth test results.
Mixture TypePaving Area Diameter (mm)Construction Depth TD (mm)
FAM7.151.44
SMA8.91.35
PAC6.551.56
Table 14. Three types of asphalt mixture pendulum test results.
Mix TypeSerial NumberAverage Value
1 #2 #
FAM71.772.972.3
SMA62.563.162.8
PAC75.474.875.1
Table 15. Dynamic modulus experimental results under different temperature and frequency conditions.
Temperature (°C)Frequency (Hz)
2510510.50.1
|E*| (MPa)φ (°)|E*| (MPa)φ (°)|E*| (MPa)φ (°)|E*| (MPa)φ (°)|E*| (MPa)φ (°)|E*| (MPa)φ (°)
−1022,7468.221,6078.4918,64211.0115,43213.5113,83015.5994220.6
515,70112.6813,86013.8512,48716.84921619.46786620.74522123.72
20826620.85674221.96550424.96349927.95282028.78175529.1
35424026.14321225.9231630.01134930.18107629.6366727.3
50168925.57154922.7179627.8751825.5843624.8432322.44
Table 16. Rutting factor E*/sin Φ values at different test temperatures.
Temperature (°C)Rutting Factor (E*/sin Φ)
2510510.50.1
−10159,476.8146,352.497,612.1566,057.3851,751.5528,257.03
571,528.9157,899.3743,103.227,663.3222,212.3212,978.93
2023,224.1518,028.713,043.17465.3165857.3333608.621
359623.9847353.454630.62683.4122176.3881454.269
503913.2234012.2561702.7941199.711037.883846.1794
Disclaimer/Publisher’s Note: The statements, opinions and data contained in all publications are solely those of the individual author(s) and contributor(s) and not of MDPI and/or the editor(s). MDPI and/or the editor(s) disclaim responsibility for any injury to people or property resulting from any ideas, methods, instructions or products referred to in the content.

