1. Introduction
Since the expansion of urban areas, the necessity of maintaining a cleaner groundwater table has increased. Historically polluted sites, such as old landfills or underground reservoirs of diverse chemicals, need to be isolated in order to prevent the infiltration of damaging elements into the groundwater table [
1]. Reducing the infiltration of contaminants into groundwater from surrounding industrial sites requires the use of effective soil barriers. There are several different materials and mixtures of materials that can be used to create these barriers [
2,
3]. Geomembranes made of materials such as polyethylene, PVC, or EPDM are excellent barriers against the seepage of contaminants into groundwater [
4,
5]. They can be used alone or as part of comprehensive environmental protection systems. In some cases, filter layers are used to allow the treatment of rainwater and the process of separating contaminants before they reach groundwater. These layers can include a variety of materials, such as sand and gravel [
6]. In certain situations, phytoremediation plants that have the ability to remove contaminants from the soil can be used in industrial neighborhoods to reduce the risk of contaminants seeping into groundwater [
7]. To minimize the impact of pollution on the environment, settling tanks are often used in the industry to settle and separate pollutants from flowing water before that water reaches groundwater [
8].
One possibility is to contain the harming elements by means of impervious structures. Besides the isolation function, this type of structure may be used for dam remediation or seepage control. Special mixtures of concrete or other cementitious materials can be used to create such barriers in the ground. These barriers can be injected into the ground or constructed as cut-off walls to stop the movement of contaminants. Impermeable cut-off barriers are used to prevent contamination of groundwater by chemicals such as petroleum products, pesticides, heavy metals, etc. Impermeable cut-off barriers are necessary in landfills, for example, to prevent harmful substances in the waste from seeping into the soil and groundwater. These barriers protect the environment from contamination and migration of hazardous substances and are effective protection against all types of pollution.
Impermeable cut-off barriers are structures made of concrete or reinforced concrete that are formed in a slot dug into the ground. Reinforcement is used before concrete is inserted into the slot. Bentonite slurry or other substances, such as polymer or hardening solutions, are often used to ensure the stability of the slot walls during excavation and concreting. The slurry wall, which is part of an impermeable barrier, is designed to limit the filtration of contaminants, preventing the spread of groundwater. Groundwater that is isolated by the barrier can then be treated by methods such as pump and treat, or chemical or biological methods, which break down contaminants into less harmful forms. Impermeable barriers in the soil–water environment can also be used to direct the flow of water to control and distribute groundwater in a specific direction.
Bentonite used in this type of construction, especially in the form of Sodium-Activated Bentonite, is a natural clay mineral that can be used to create airtight barriers in the ground [
9]. When soaked, bentonite swells and becomes an airtight mass that effectively stops the penetration of contaminants. Bentonite, a clay primarily composed of montmorillonite, is widely recognized as a crucial component in engineering barriers due to its favorable properties. It serves as a buffer material for various safety functions within these barriers [
10,
11,
12]. One of its key attributes is its ability to expand when groundwater infiltrates from the surrounding bedrock, creating a low-permeability barrier [
13]. This low-permeability quality effectively hinders the transport of contaminants while offering sites for the sorption of cationic radionuclide species and colloid filtration. Recent research has also revealed that bentonite allows the permeation of gases. When subjected to increased gas pressure, bentonite forms dilatation pathways that subsequently reseal [
14,
15].
The swelling behavior of bentonite varies significantly depending on factors such as its density, montmorillonite content, and the types of interlayer cations present. The latter two attributes are often influenced by the specific source of the bentonite. In international waste management initiatives, sodium (Na)-dominant and calcium (Ca)-dominant bentonites have been extensively studied [
16]. Typically, Na-dominant bentonites exhibit higher swelling pressures compared with Ca-dominant ones. Other crucial parameters of bentonite, including iron and organic matter content, can also impact its suitability as an engineering barrier material [
10,
17]. Moreover, the suitability of bentonite is influenced by factors such as the bedrock, groundwater conditions, and the chosen disposal concept. For instance, the swelling capacity of sodium bentonite tends to decrease as groundwater salinity levels rise.
Another essential aspect of an effective buffer material is its ability to inhibit microbial activity. Properly designed bentonite with low permeability should prevent the transport of microbes and the essential nutrients they require for growth [
16,
18]. Additionally, the swelling pressure generated during bentonite supersaturation can exert stress on any microbial cells present by increasing pore pressure. Various microbial processes have the potential to impact the functionality of a bentonite buffer, and these have been studied to varying degrees. However, it remains unclear from these studies how microorganisms, particularly bacteria, can specifically affect the safety functions of components within the disposal system. Further research is needed to elucidate these interactions and their implications [
19].
In summary, due to economical, technical, and hydro-geological considerations, the proposed isolating structures were built of plastic concrete. Plastic concrete is a material similar to the already well-known and widely researched classic concrete but, in addition, bentonite is added in order to increase its water retention capabilities. It is important to note that the effectiveness of bentonite in plastic concrete depends on factors such as the type and dosage of bentonite used, the mix design of the concrete (the relation between water, cement, and bentonite), and the specific requirements of the construction project.
The materials used for the construction of this type of cut-off wall vary based on the function of the design requirements and the geotechnical conditions of the site. Various authors have proposed different combinations of materials in order to meet the performance criteria imposed by specific projects, including soil–bentonite mixtures [
20,
21], soil–cement mixtures [
22,
23], cement–bentonite mixtures [
21], or plastic concrete [
22,
23,
24,
25]. It is also worth considering aspects of acid corrosion and heat conduction, for example [
1,
26].
This paper proposes, on the basis of a literature review, a thorough analysis of the relationships between the three most important components of the mixture, namely water, cement, and bentonite. The analysis is conducted in qualitative terms, focusing on permeability, viscosity, and compressive strength. Also, another important element of this analysis consists in the proposed representation of the mixtures and their parameter variations using a ternary diagram. The results presented herein are also a consequence of the previous research carried out by the authors, which will be briefly presented in the following chapters.
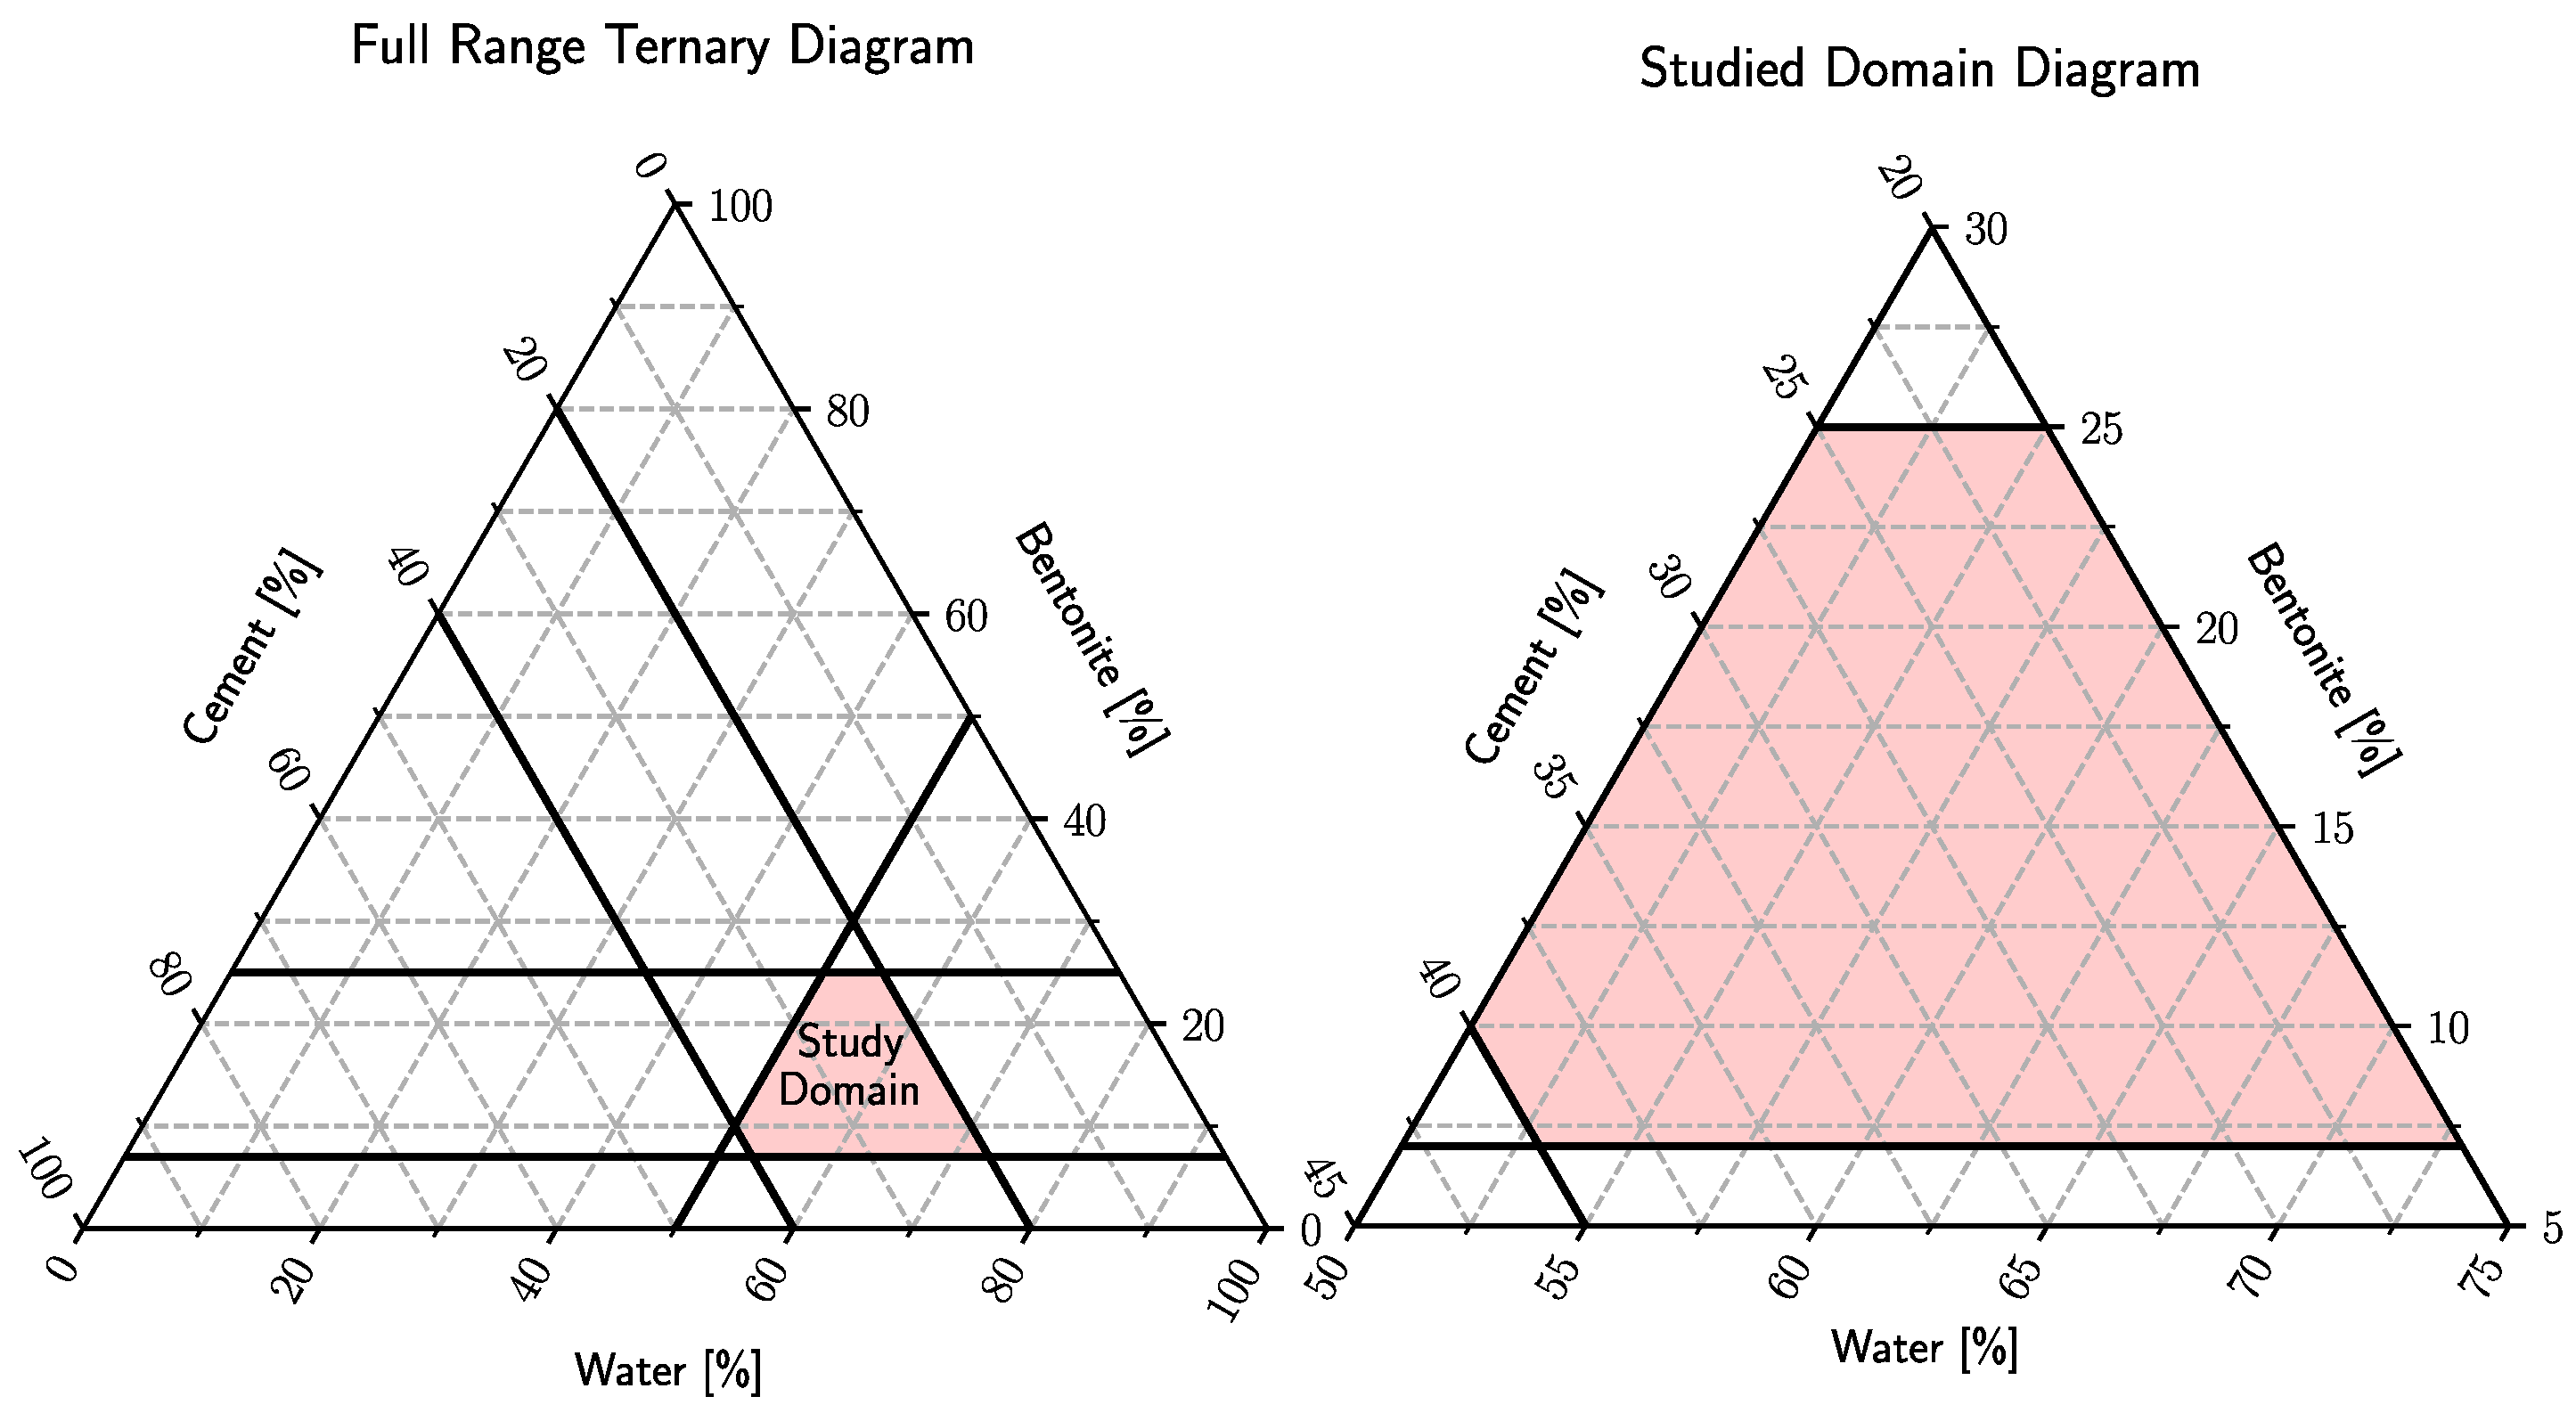
Starting from the previous studies found in the specialty literature, in the first stage of the previous research conducted by Barbu, Sabău, Manoli, and Șerbulea in [
27], fifty-two (52) combinations of water–cement–bentonite were elaborated. In the attempt to cover the ranges described in the referenced articles, it was observed that extreme values of one of the components lead to obtaining unsatisfactory effects such as shrinkage, cracking, or crumbling of the material mixture. For this reason, the range of each material was limited to the values presented in
Table 1 and
Figure 1. Besides the three components, standard sand in a ratio of 1:1 was used in creating the material samples with respect to the mass of cement and bentonite.
Because of the negative effects of using extreme quantities of one of the components, the entire study domain was limited to a subdomain that presented only feasible mixtures that were tested in order to determine their viscosity, permeability, and undrained cohesion.
The conclusions of the first testing program indicated that a large quantity of bentonite negatively influences the compressive strength, leading to unsatisfactory crack control of the structure and decreased permeability, but it induces good hydraulic performances when it is used at a dosage of around 17%. Also, extreme values of the component tend to produce unwanted effects such as segregation, shrinkage, or low workability. [
27] For the next step of the study [
27], a new reduced study domain is proposed, where the results regarding the workability, permeability, and undrained cohesion are satisfying (see
Figure 2).
The second part of the study [
27] concentrated on determining the influence of the standard sand on the mixtures presented in the green area of
Figure 2. The study was aimed at determining how the quantity of sand used in the mixtures influences the fabrication process, the water retention capacity, and the strength of the resulting materials. The ratios of standard sand to solids (cement and bentonite) used in the experimental part were 0.5:1, 2:1, 3:1, and 4:1.
Several conclusions can be drawn after finishing the testing program [
27]:
The hydraulic behavior of the material is enhanced by using a larger quantity of bentonite regardless of the quantity of sand used.
The viscosity of the mixtures in the fresh state is influenced by increasing the quantity of standard sand, and the compressive strength does not significantly modify the function of the sand.
Considering the negative effects (cracking) induced by using too much or too little standard sand, a ratio of sand to solids of 2:1 was considered enough to fabricate the samples as this material does not interfere with the hydration process of the binder [
33].
Consequently, as it was already established that a ratio of sand to solids of 2:1 is enough to use in order to not interfere with the hydraulic and mechanical properties of the mixtures and at the same time to not affect the integrity of the samples, in the last stage of the study program [
27] the objective was to fabricate and test 4 of each of the 11 studied mixtures in order to have sufficient data necessary for the statistical processing.
The paper provides an easy tool as a graphical representation with isocurves where the optimal water–cement–bentonite mixture can be found starting from the required design parameters (such as viscosity–workability, permeability, and undrained cohesion).
2. Materials and Methods
The cement used for the sample preparation was Portland cement with high initial strength, having a maximum compressive strength of 42.5 N/mm2 (CEM IIA 42.5R). The other hydraulic binder used was calcium bentonite which is normally used as a drilling fluid when mixed with water. The main advantages of calcium bentonite are its capacity of increasing viscosity and its water-retaining characteristics. The water used for sample preparation was regular tap water.
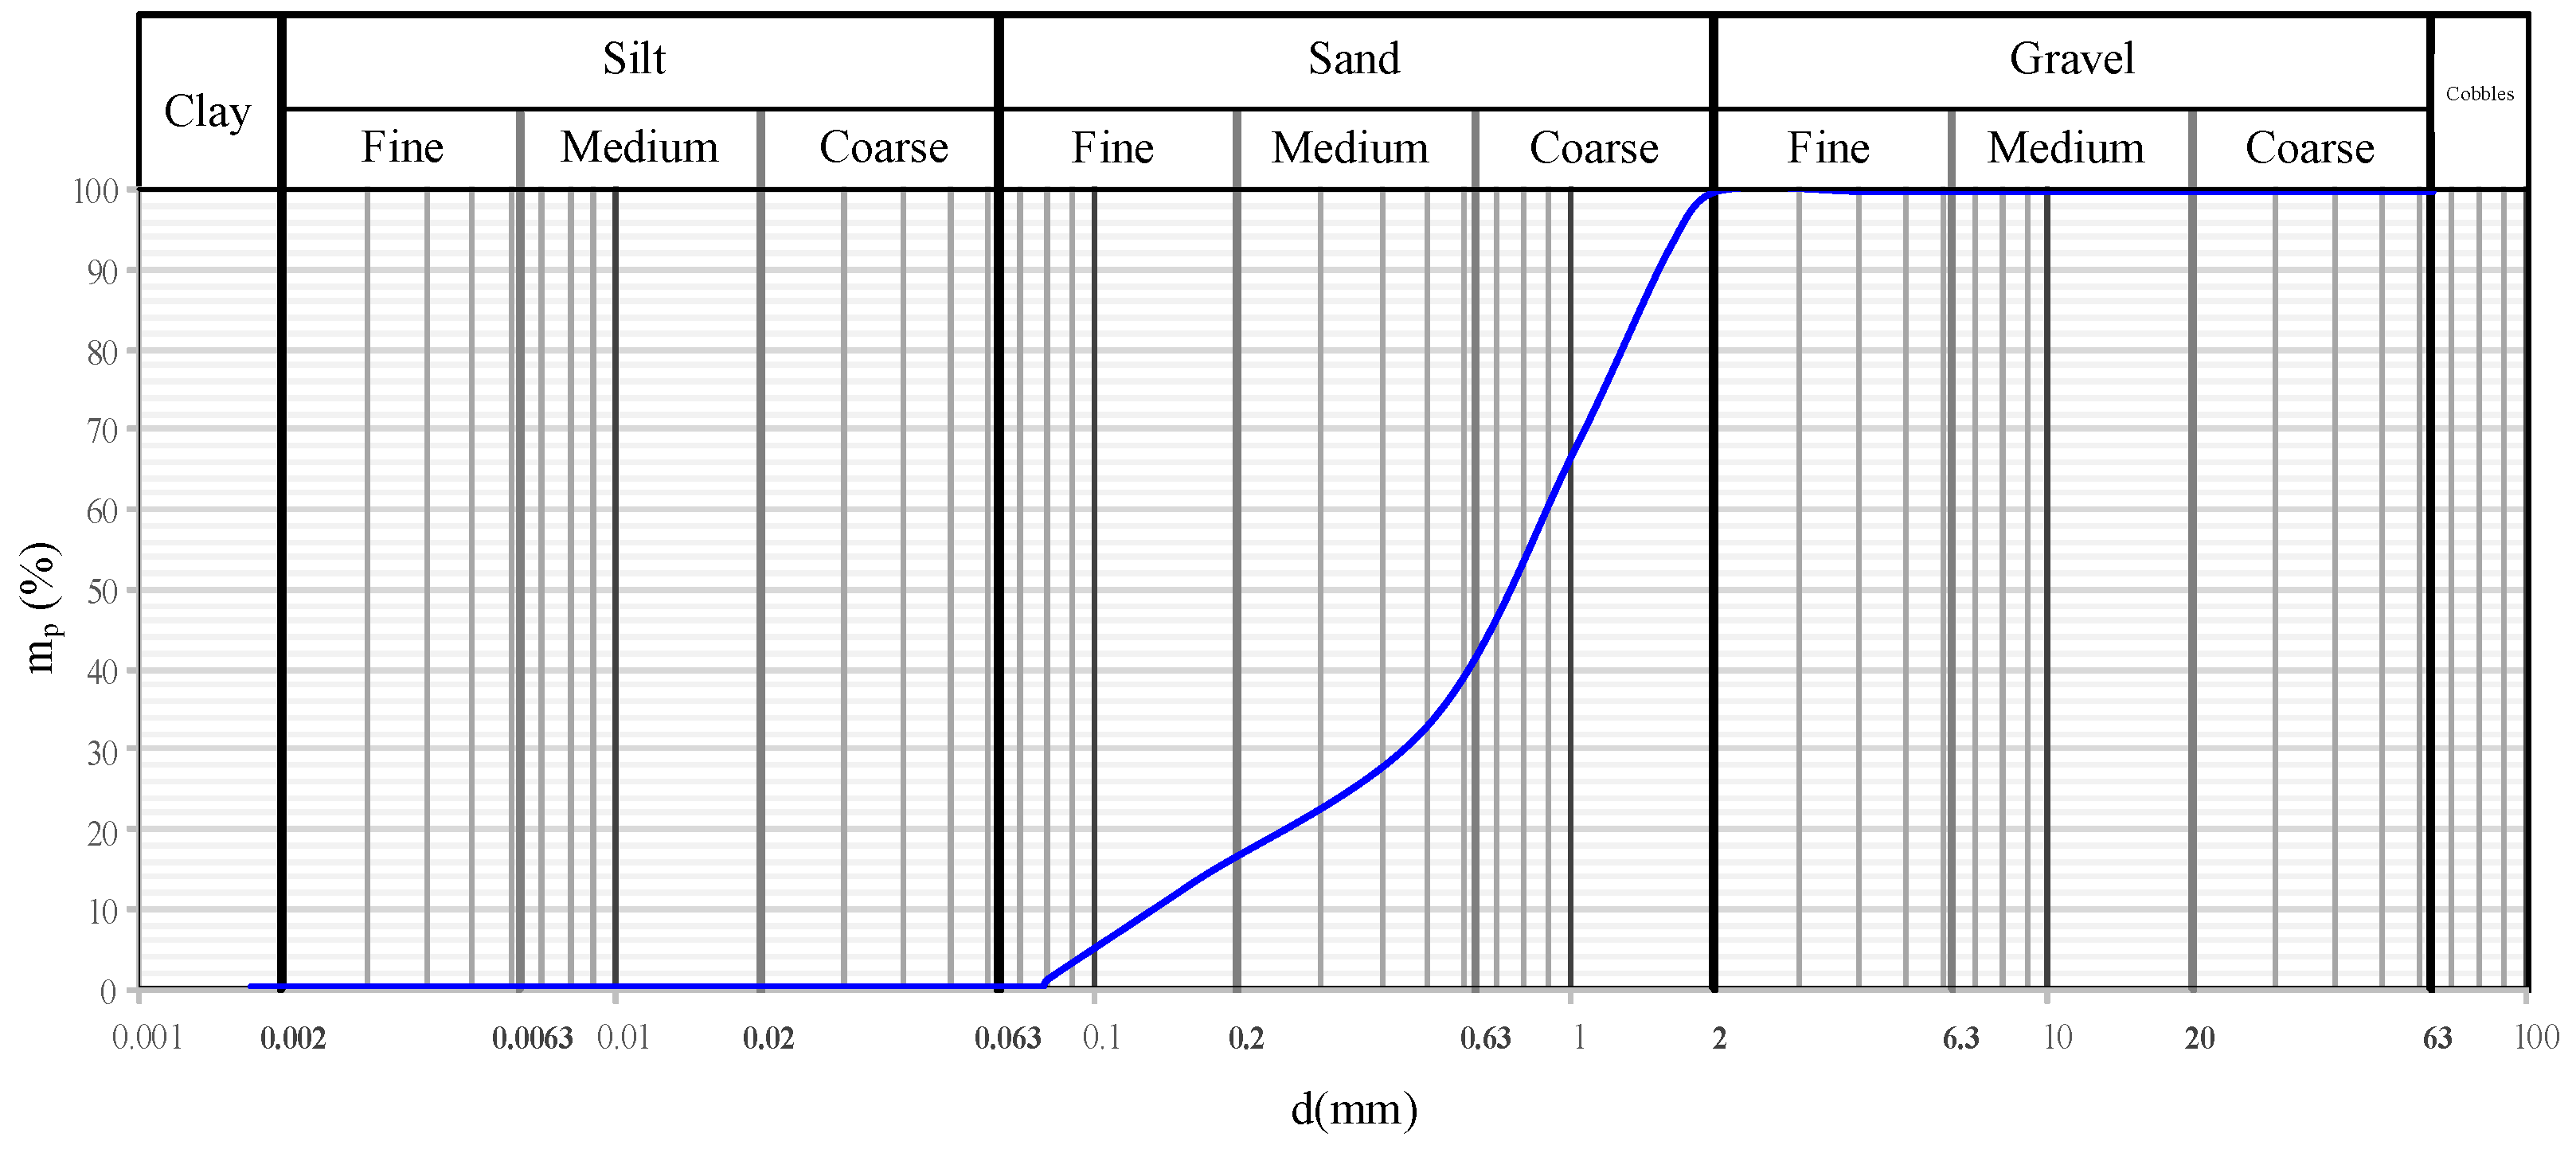
In order to analyze the relationships between water–cement–bentonite and to prevent cracking phenomena, standard sand was chosen for sample fabrication. This material is recommended and is defined in EN196-1:2016 [
34]. The grain size distribution of the standard sand is presented in
Table 2 and
Figure 3.
Regarding the mixing sequence of the components, the majority of the previous studies suggested that the bentonite should be hydrated in advance for 8 to 24 h, and then the other components should be added. In an article published by Fadaie and Nekooei [
6], it was demonstrated that for a sufficiently long interval of time, the characteristics of the plastic concrete are no longer influenced by the hydration of bentonite, becoming similar.
During all the stages of the study, the samples were fabricated using the same mixing sequence. Initially, a dry mixture of sand, bentonite, and cement was made, then the established water quantity was introduced and the whole composition was mixed until a homogeneous paste was obtained. Special attention was given to the correct mixing of bentonite in order to not create lumps of material that would cause irregular properties along the sample. After obtaining the homogeneous paste, the material was cast in cylindrical Ø50 × 100 mm molds and left to air-dry cure for a minimum of 28 days at room temperature without direct sun exposure [
35].
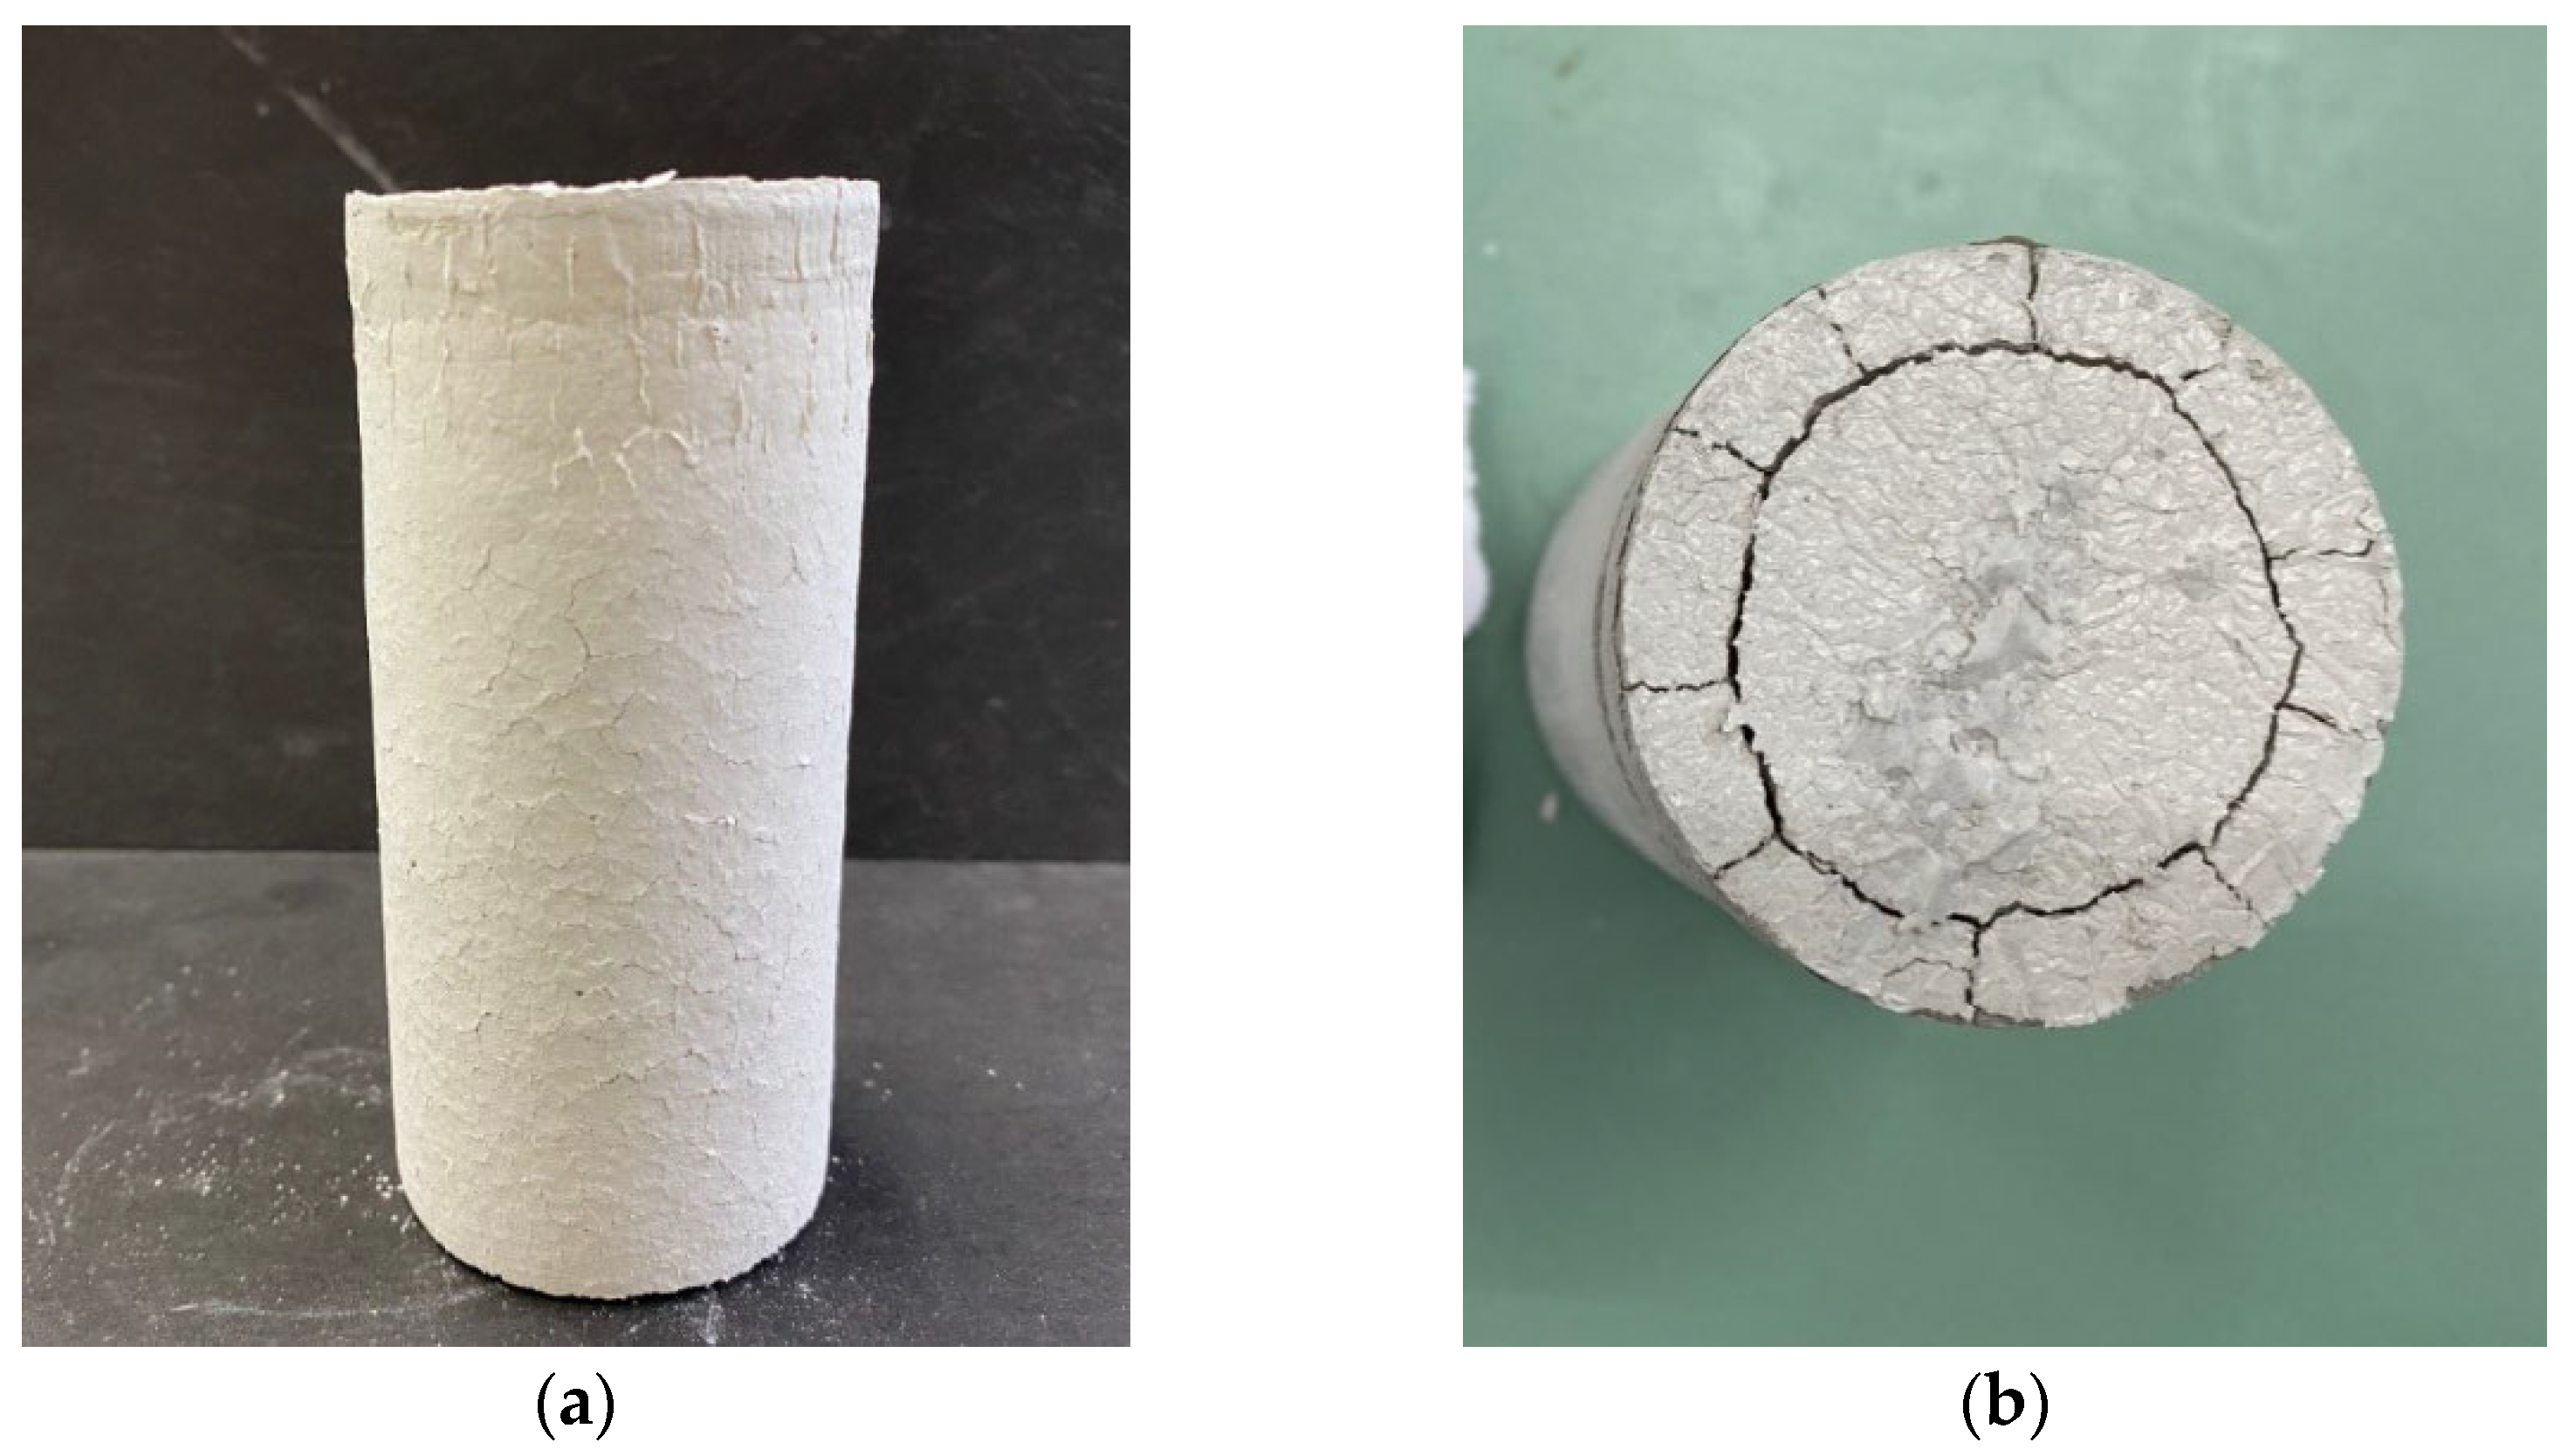
The sufficient extension of the study domain was demonstrated by the unfavorable phenomena that occurred in samples that contained larger quantities of bentonite or water. Problems such as cracking, shrinkage, or segregation were associated with extreme values of components (
Figure 4). In the cases when a larger quantity of cement was used, a decrease in the workability of the material in the fresh state was observed. An excessive quantity of bentonite led to a crumbling behavior of the material.
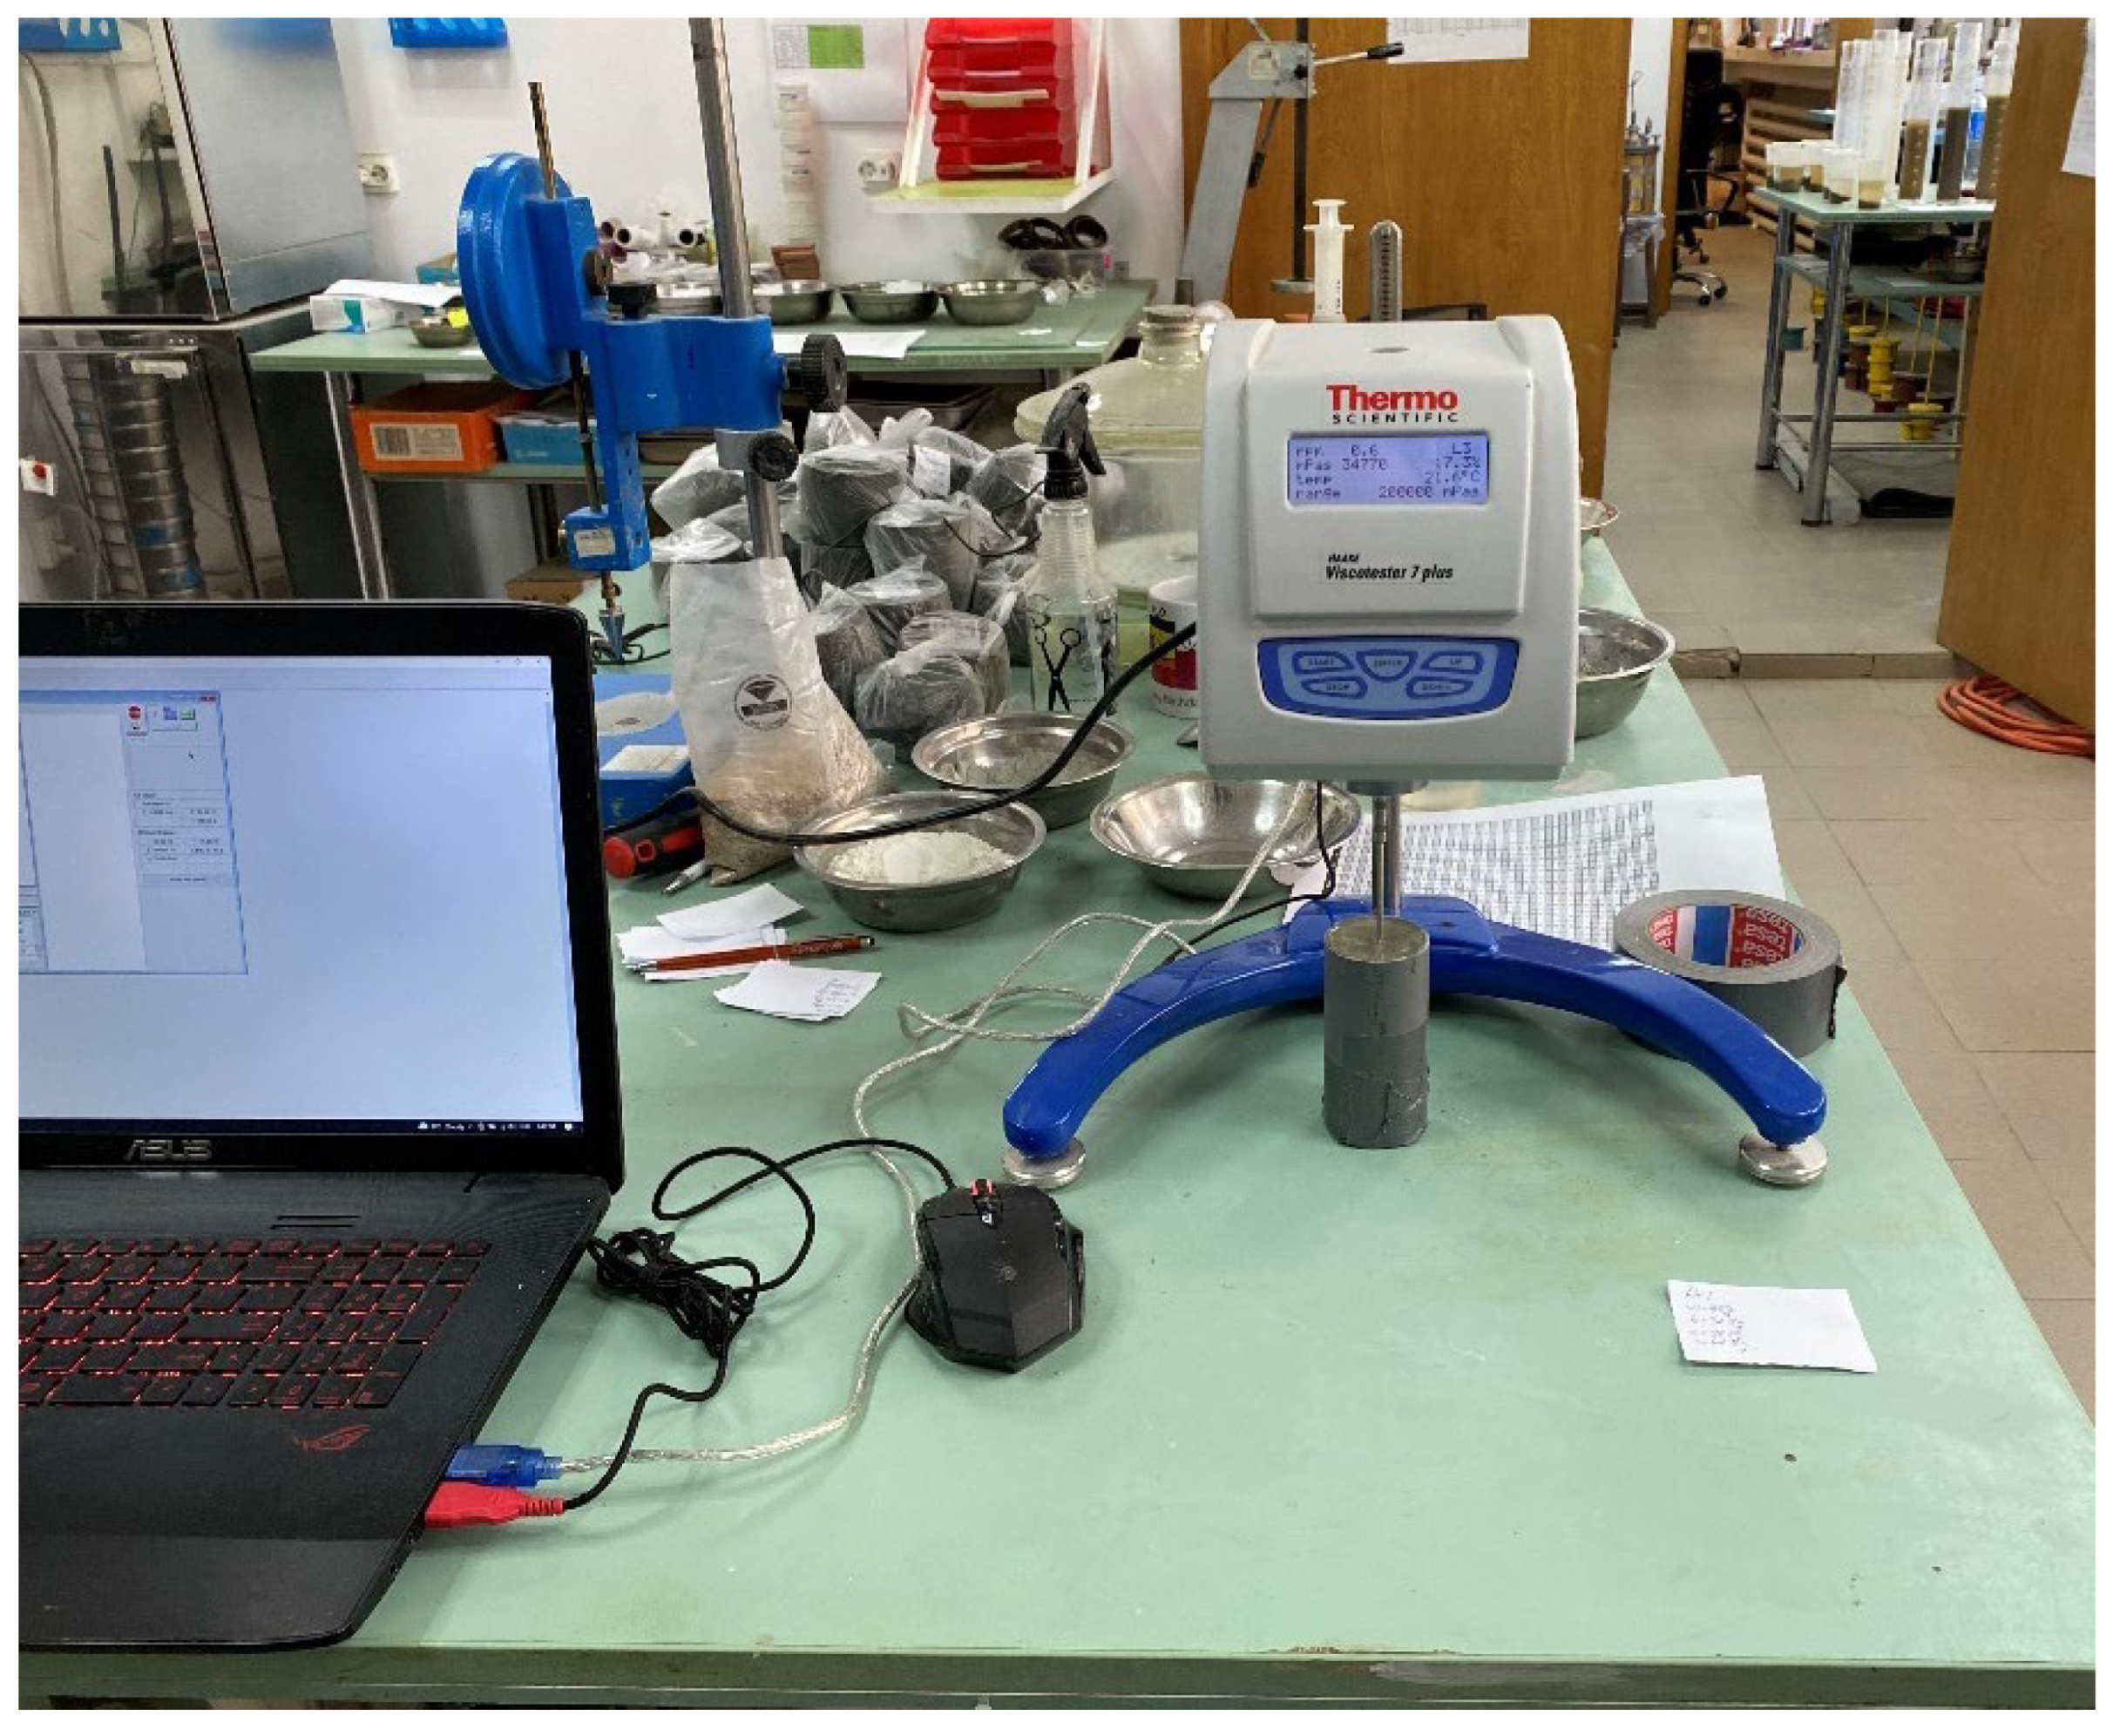
The viscosity of the material was determined immediately after it was cast in the molds. The test was carried out using a rotational viscosimeter Haake Viscotester 7 Plus (
Figure 5). The device measures the resistance of the material on the different-shaped rods, based on the chosen function of the tested material. The rotation speed of the rods varied between 0.1 ÷ 100 rot/min. The test procedure for each mixture was adapted in terms of rotating plates to fit the measurement range of the device. The viscosity was chosen as the tangent in origin for the τ-
curve. The results used in the analysis were chosen as a function of the stability of the measurement indicated by the device. If important variations were noticed during measurements indicating poor homogeneity, the sample was removed, remixed, and reinstalled.
The permeability coefficient of the materials was determined in the triaxial compression apparatus, using the constant head permeameter method. Using the same device, the undrained cohesion of the samples was determined. During this test, no supplementary pressures were applied to the sample. The test followed the prescriptions of ISO 17892 [
36].
3. Test Results
Because of the important variation in viscosity values, a normalized logarithmic scale was employed in order to obtain a more balanced distribution of colors when representing the results. For this purpose, the logarithmic scale is described by Equation (1) [
37]:
The graphs were plotted using Python 3.9.9 and numpy, mpltern, and ternary libraries.
Regarding the workability of the samples, according to
Figure 6, the viscosity of the material in the fresh state varies from 29–155 Pa·s.
Figure 7 represents the coefficient of variation in viscosity over the study domain, which varies from 8 to 45%, meaning that locally a wider spread of measured values was recorded. The coefficient of variation represents the ratio between the standard deviation and the mean value of the dataset.
The large interval of variation corresponding to the viscosity may be attributed to the thixotropic properties of the water–cement–bentonite mixtures. The thixotropic nature of the material is stimulated by the stirring and mixing during the preparation and casting phase of sample fabrication. This phenomenon is closely identified as the determination of viscosity and was carried out immediately after the casting of the material in the provided formworks.
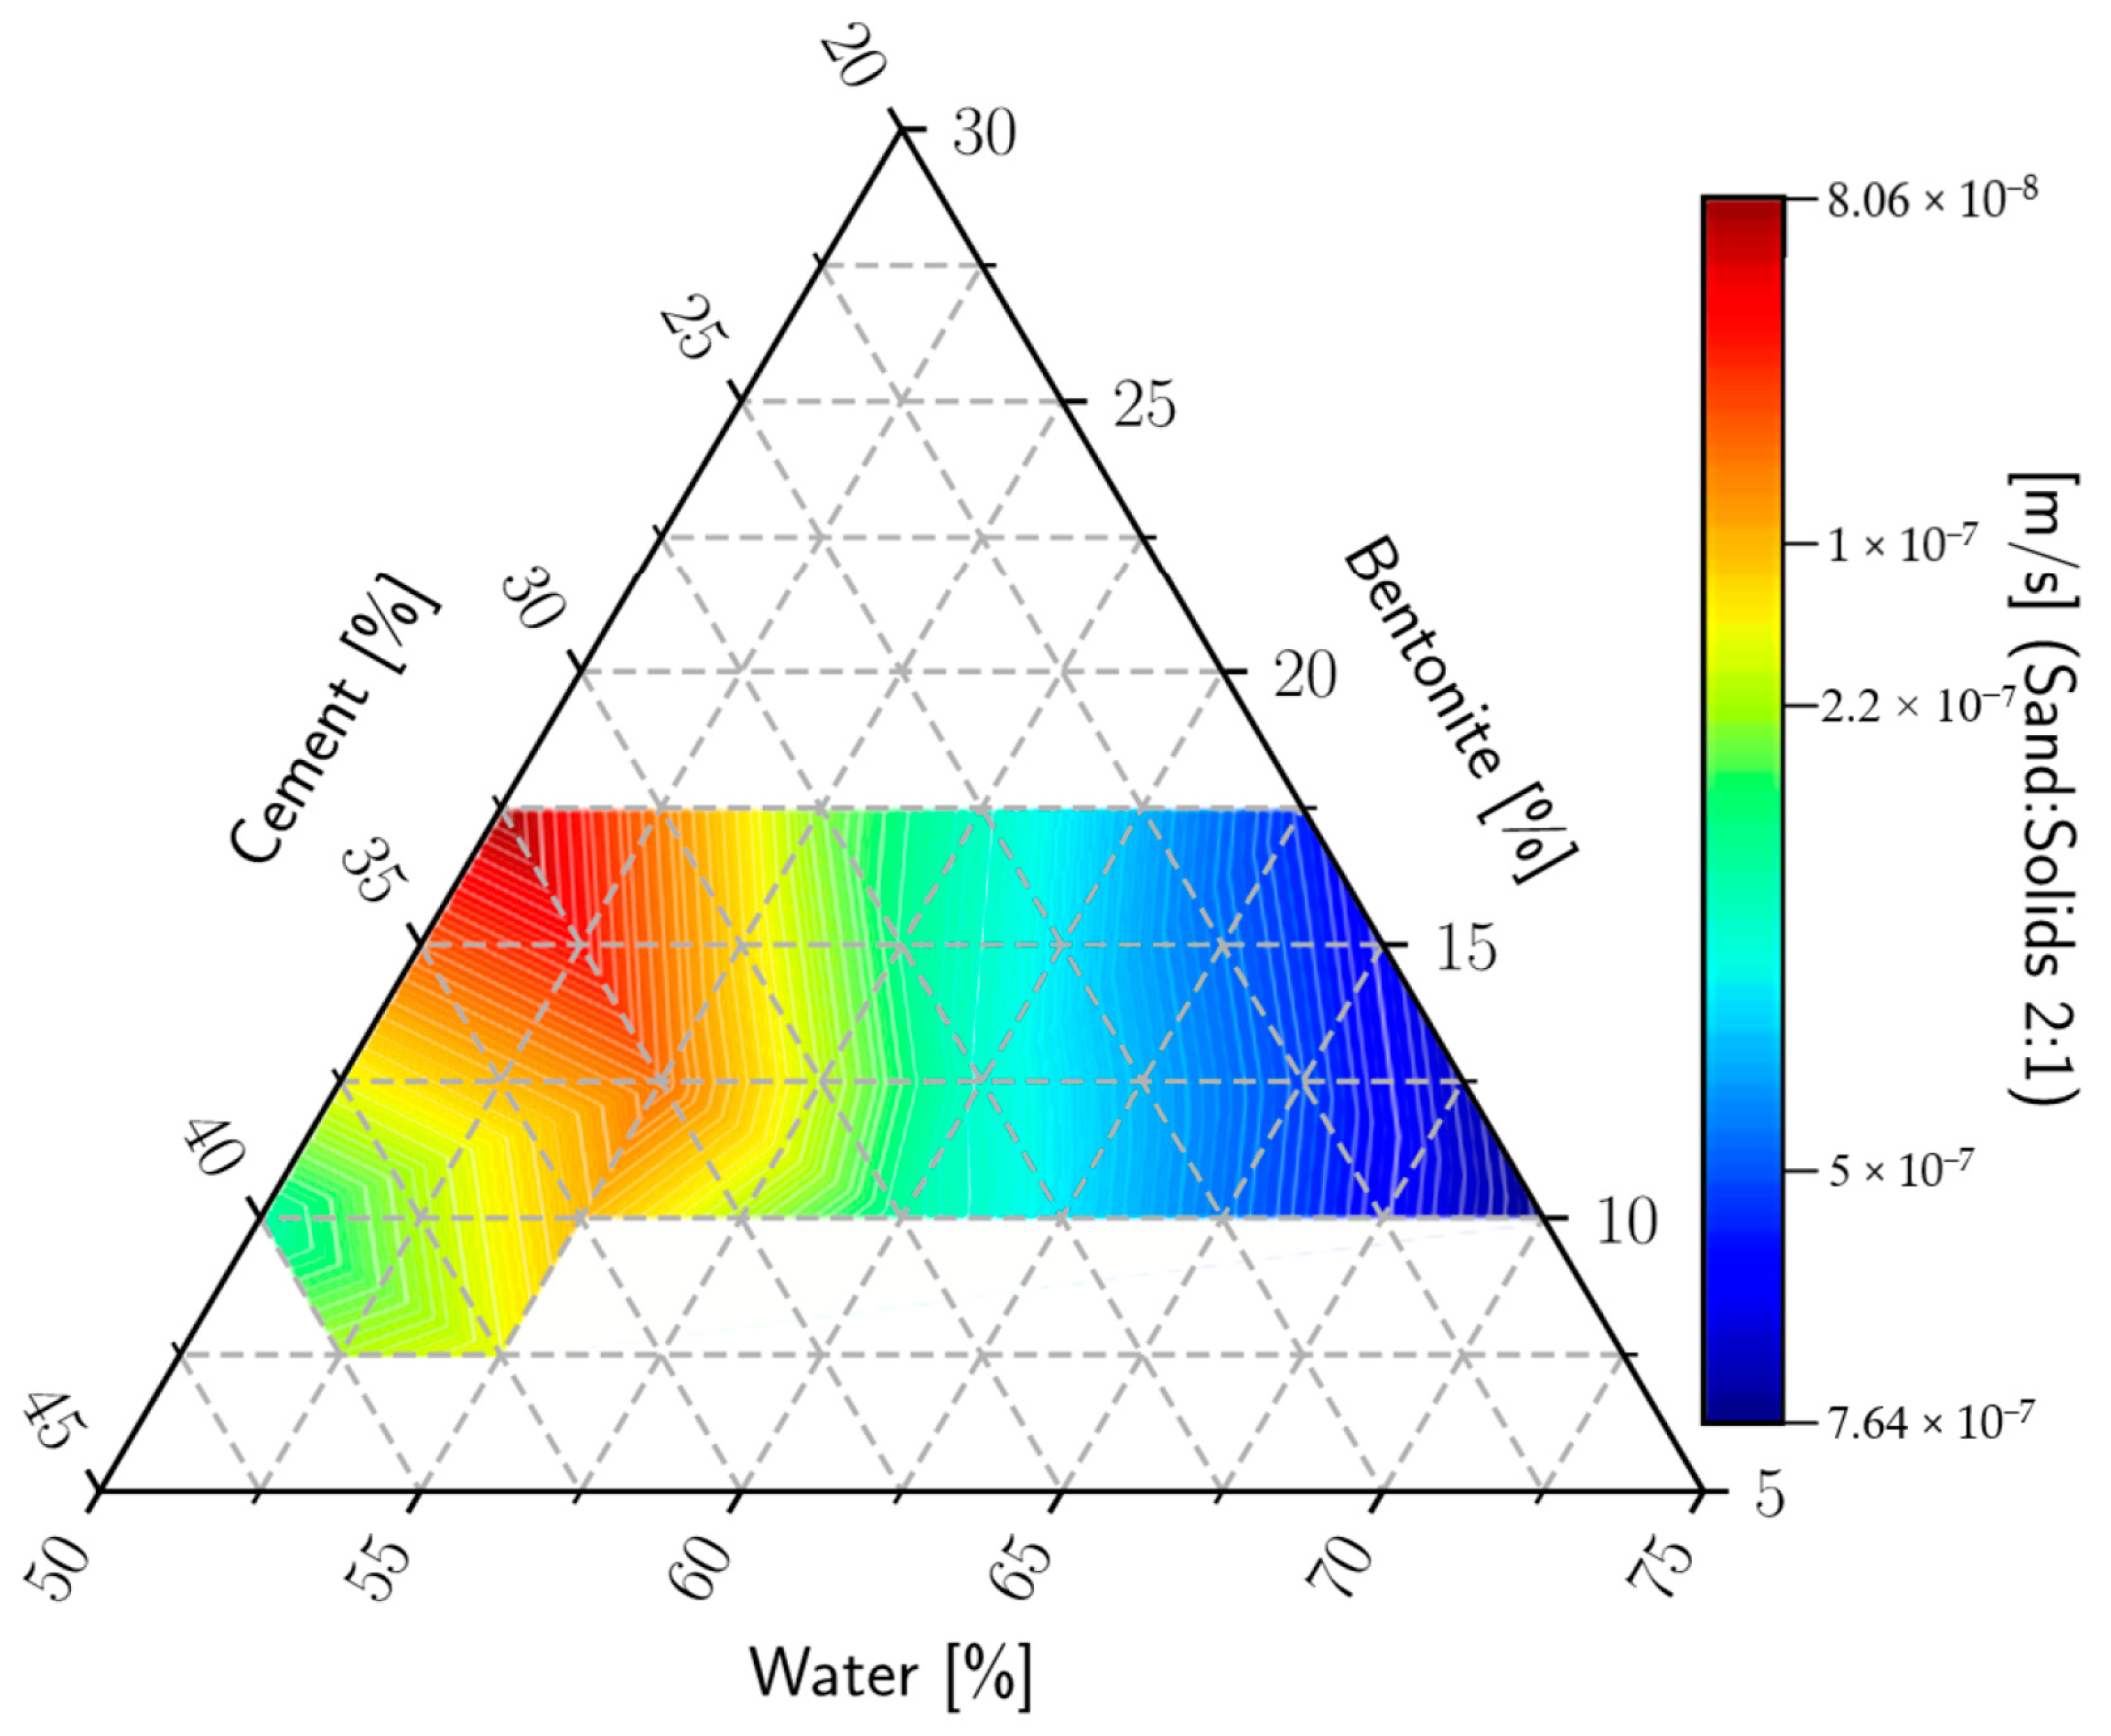
The undrained cohesion variation is represented in
Figure 8. The average values determined for this parameter vary between 138 to 1164 kPa. As was forecasted and also demonstrated in the other stages of the laboratory study, the samples that contained a larger quantity of cement and a smaller quantity of water provided better behavior when submitted to compression. Also, the samples with behavior dominated by the quantity of cement, when tested, presented a failure mechanism similar to the one observed in simple, weak concrete.
Reversely, for the samples with behavior governed by bentonite or water, the values of the undrained cohesion are significantly lower, with a maximum of 250 kPa. The failure mechanism observed for this type of sample is similar to the one met for strong soils, being described by a shear plane oriented at an angle of 45°. In
Figure 9, the most representative failure mechanisms met during the testing phase are presented.
In order to determine the reliability of the laboratory results, the coefficient of variation in the undrained cohesion results obtained on the four samples of each of the 11 mixtures was computed. The dispersion of the data with respect to the average value indicates that the results are closer to the mean value in the case of cement-governed samples, while for the samples containing more water or bentonite, the results are spread on a wider range. The coefficient of variation in the undrained cohesion over the study domain is presented in
Figure 10.
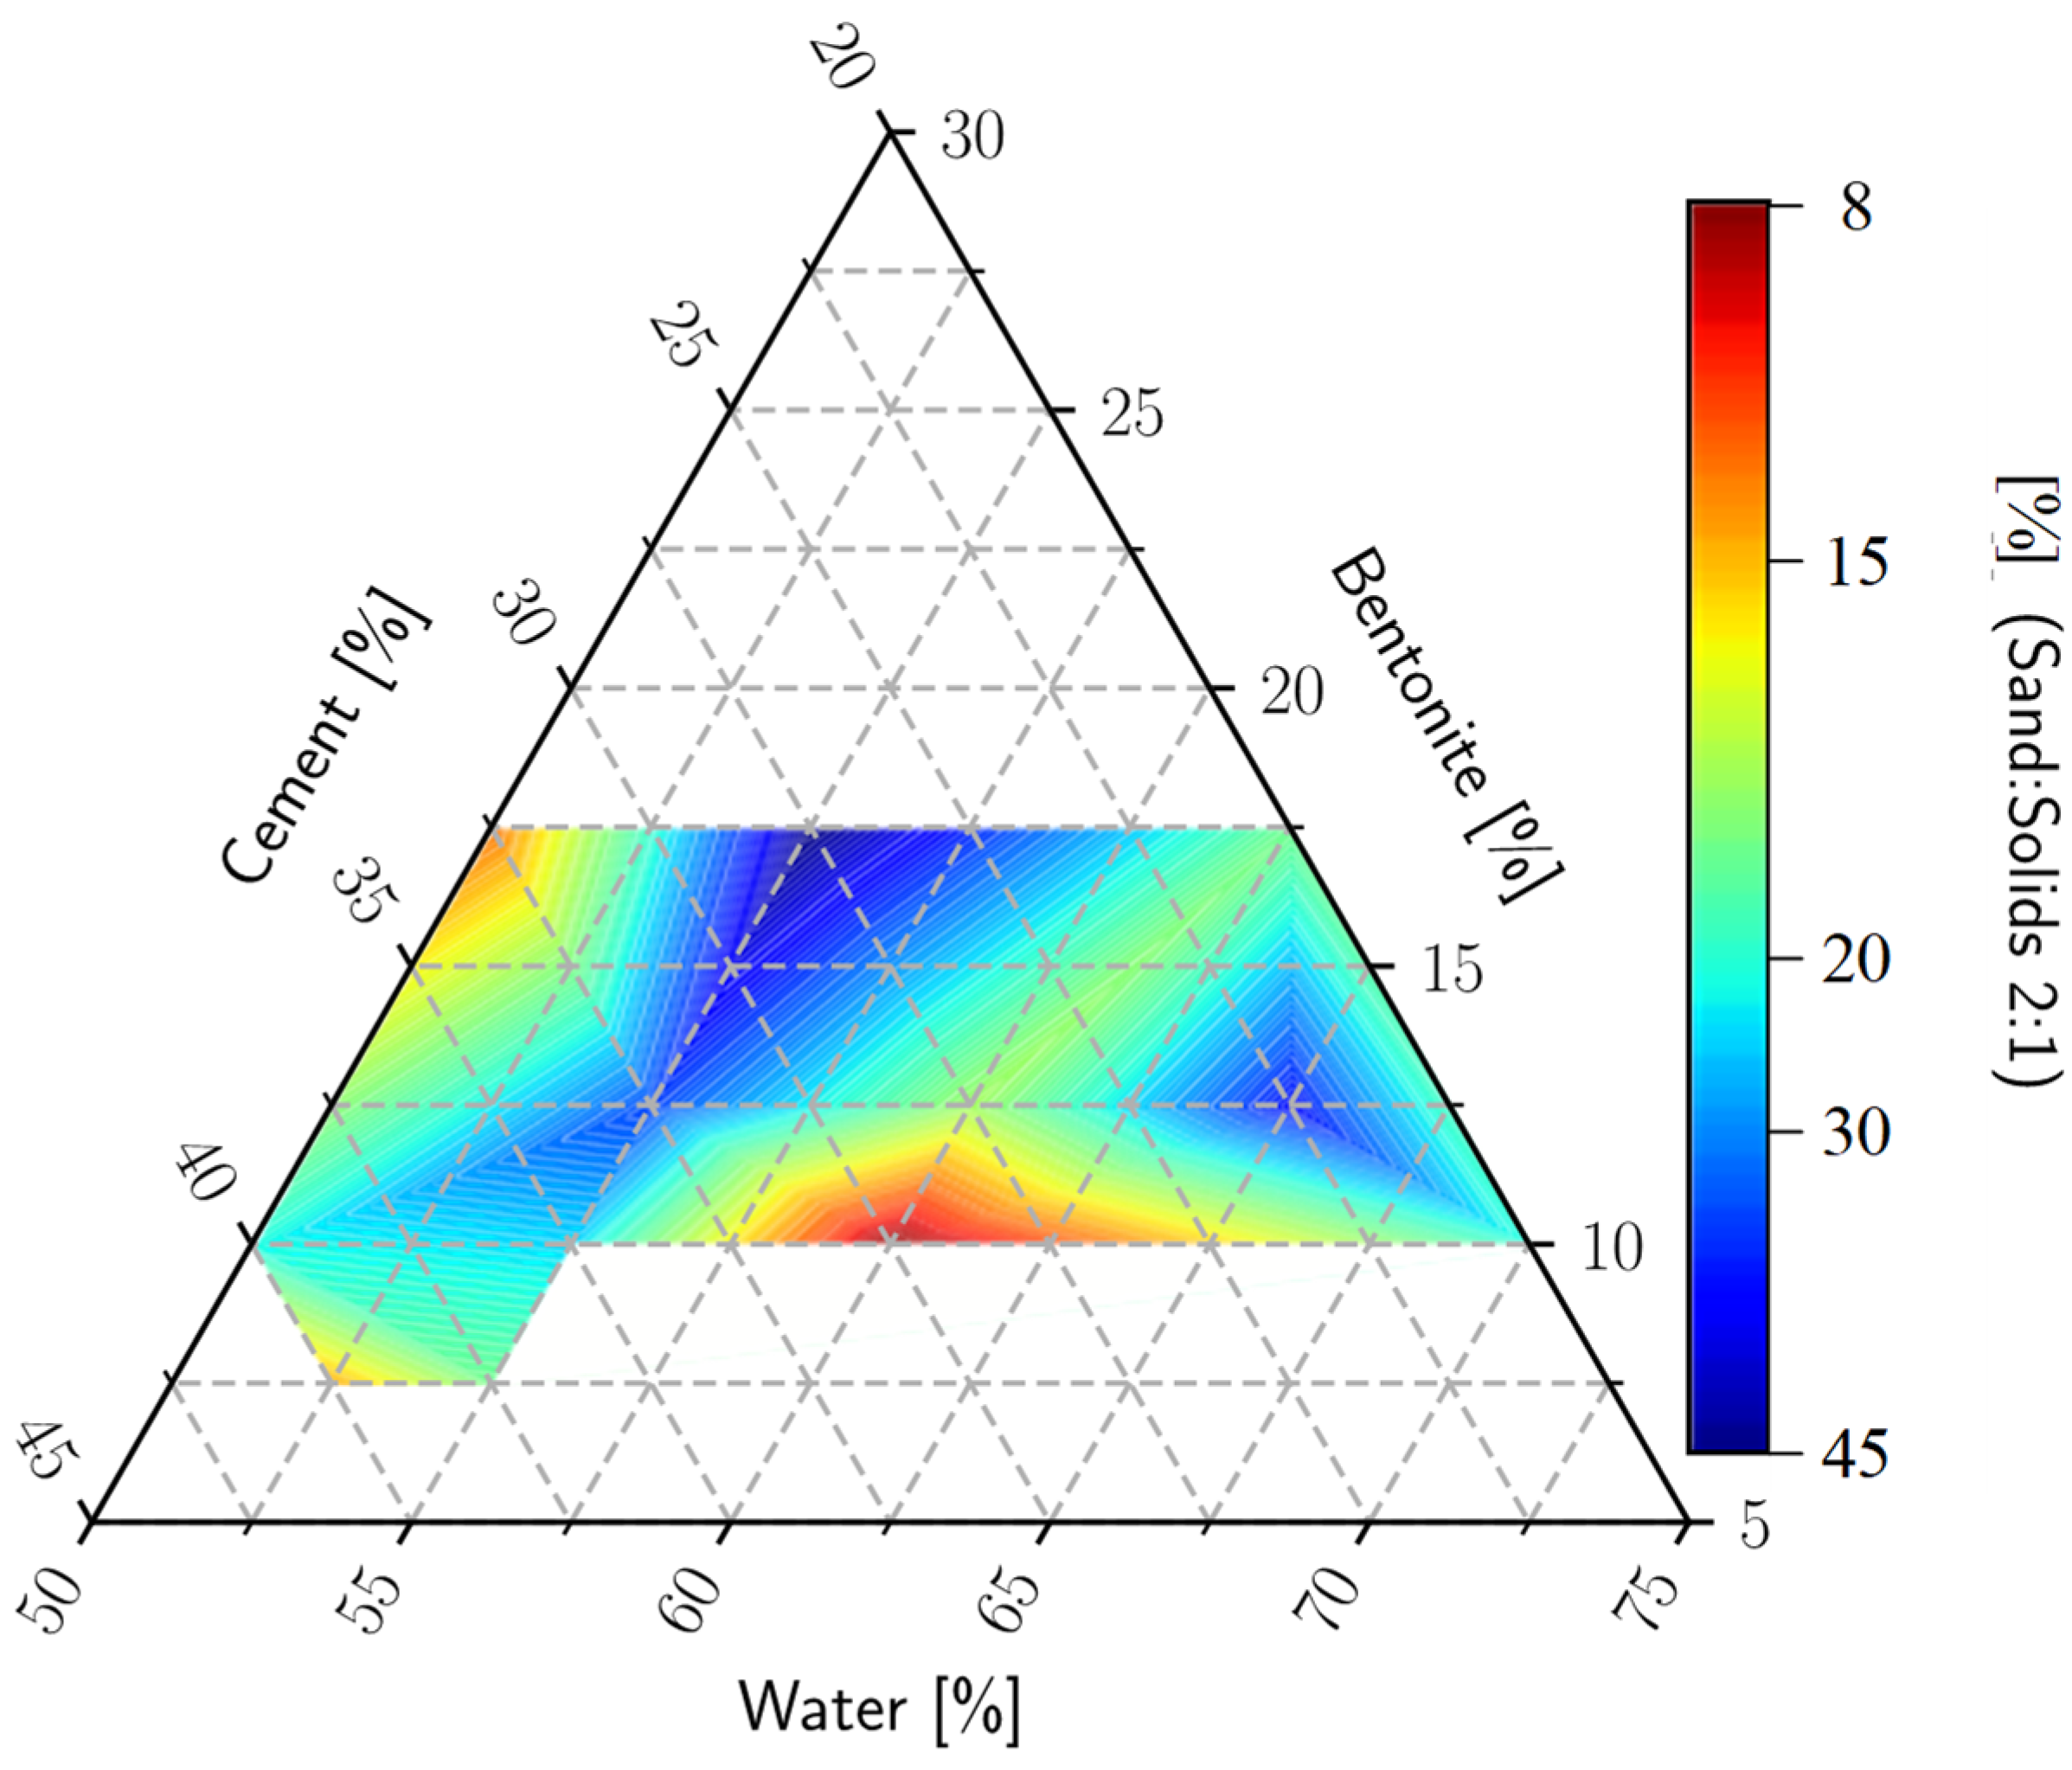
The values of permeability vary in the study domain from 7.46 × 10
−7–8.06 × 10
−8 m/s (
Figure 11). Contrary to our expectations, the lowest permeability was determined in the samples with a larger quantity of concrete, while for the samples rich in bentonite or water, the maximum values were recorded. This fact may be attributed to the cracking of the samples due to excessive amounts of water or, on the other hand, not enough water, which is necessary for the hydration process of the bentonite.
The coefficient of variation in permeability indicates the fact that for the samples rich in bentonite or water the values are reliable and, in all four samples, the results obtained are close to the mean (
Figure 12). On the other hand, the samples governed by concrete present a wider spread of results.
The mass percentage for each mixture of water–cement–bentonite and the laboratory test results shown in the plotted diagrams are presented in
Table 3.
4. Discussion
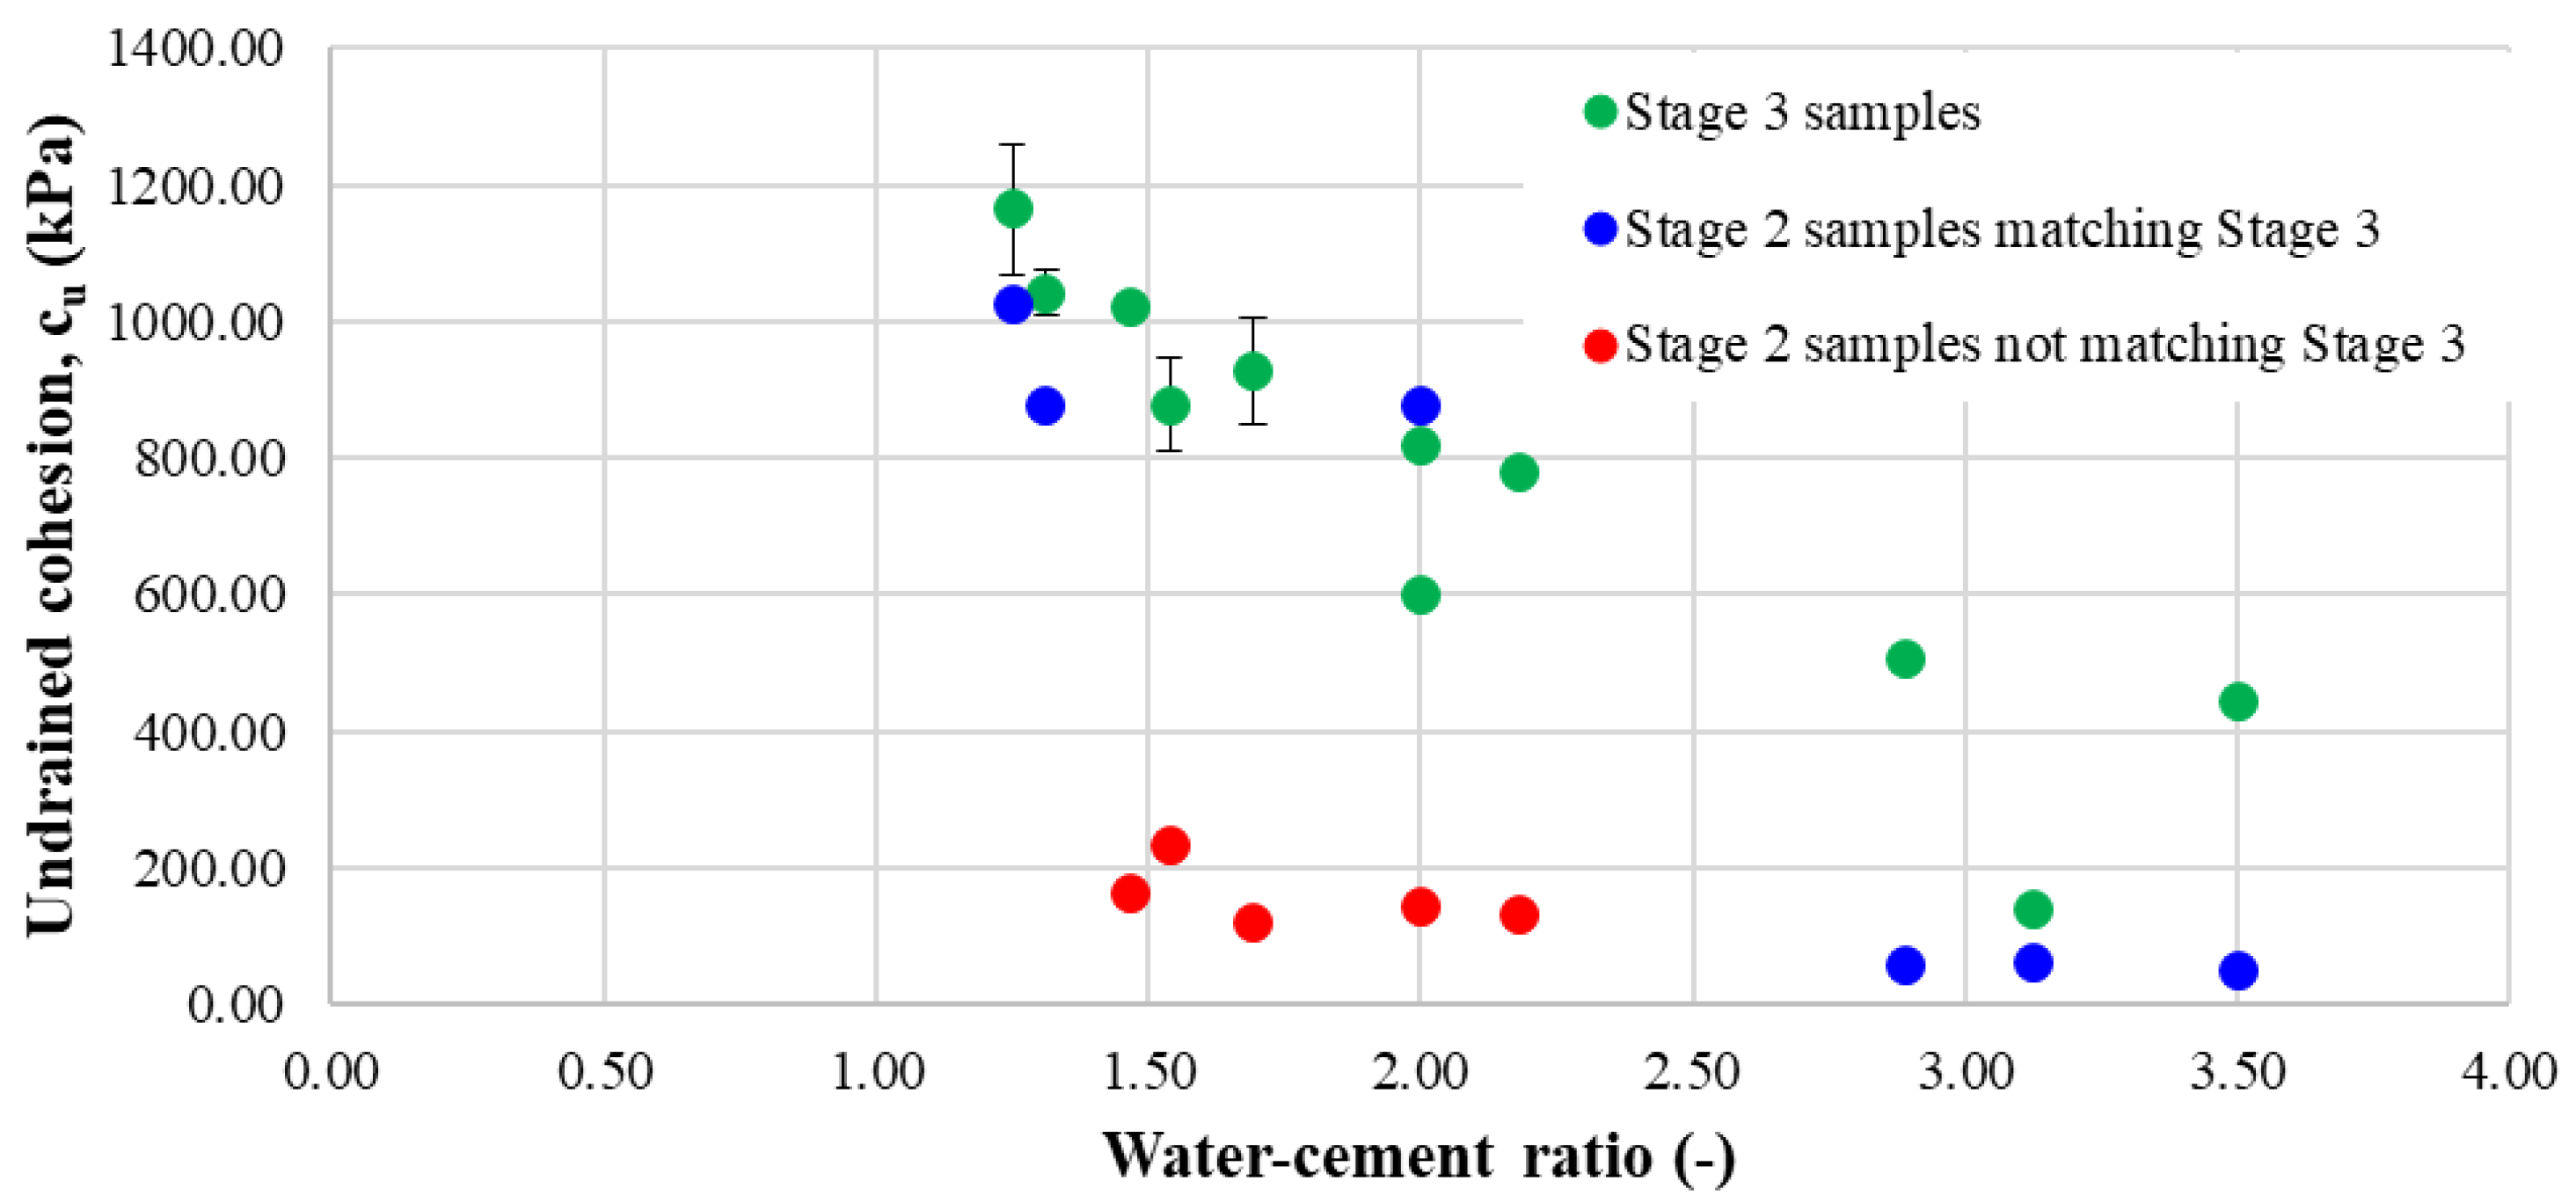
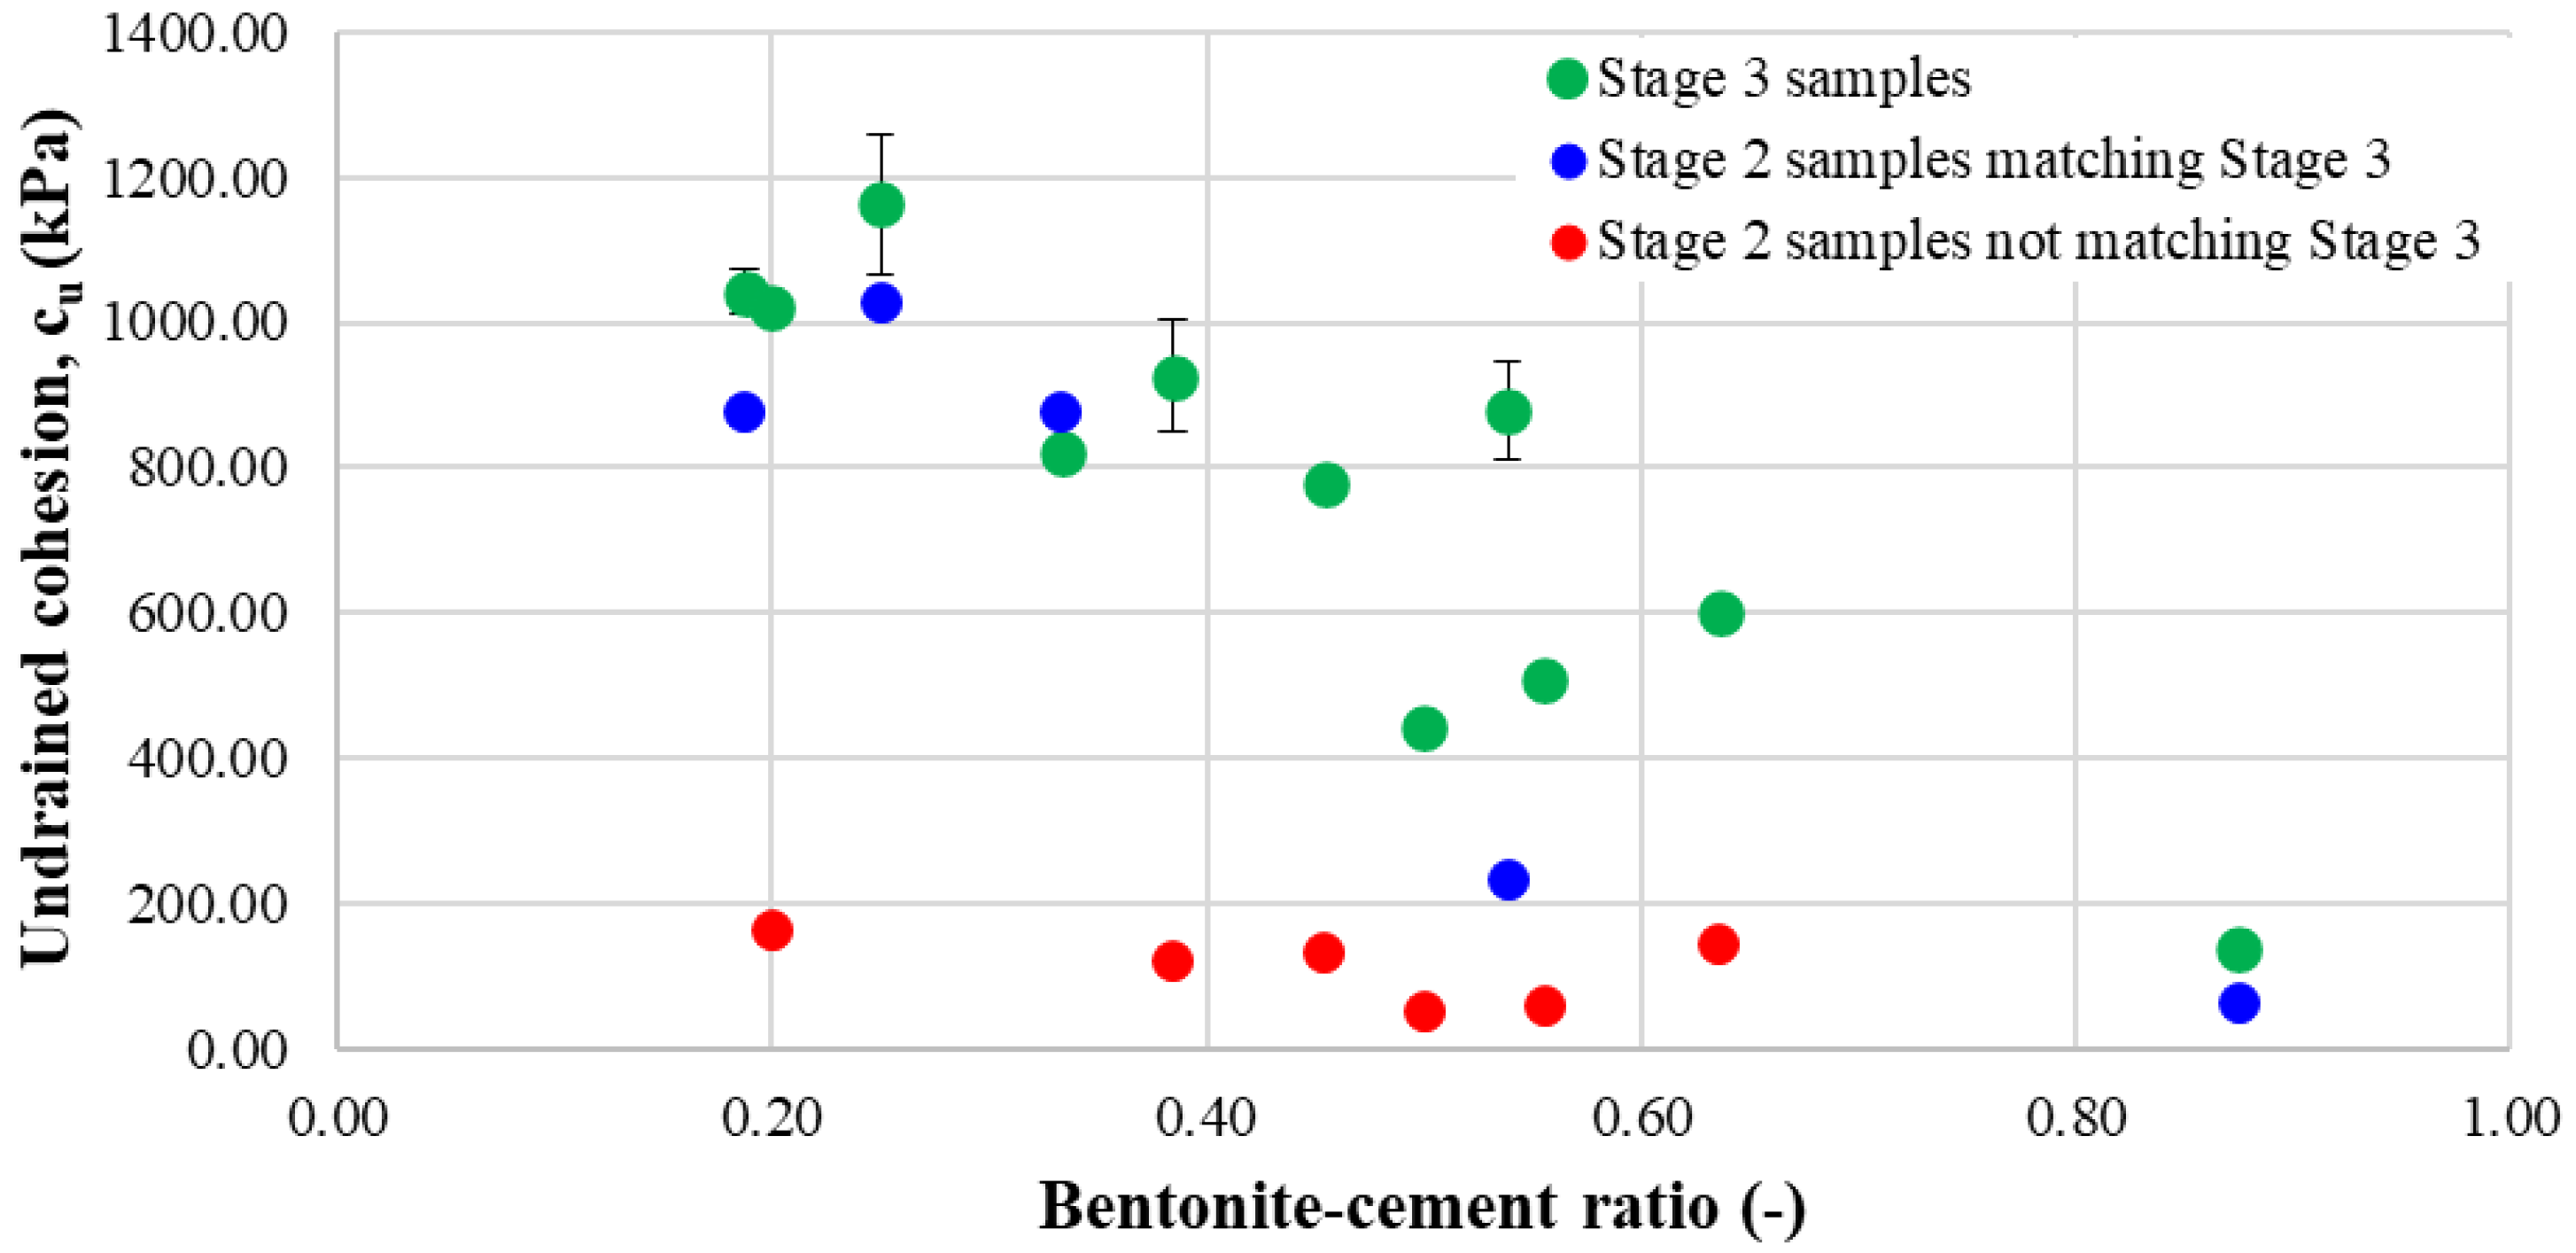
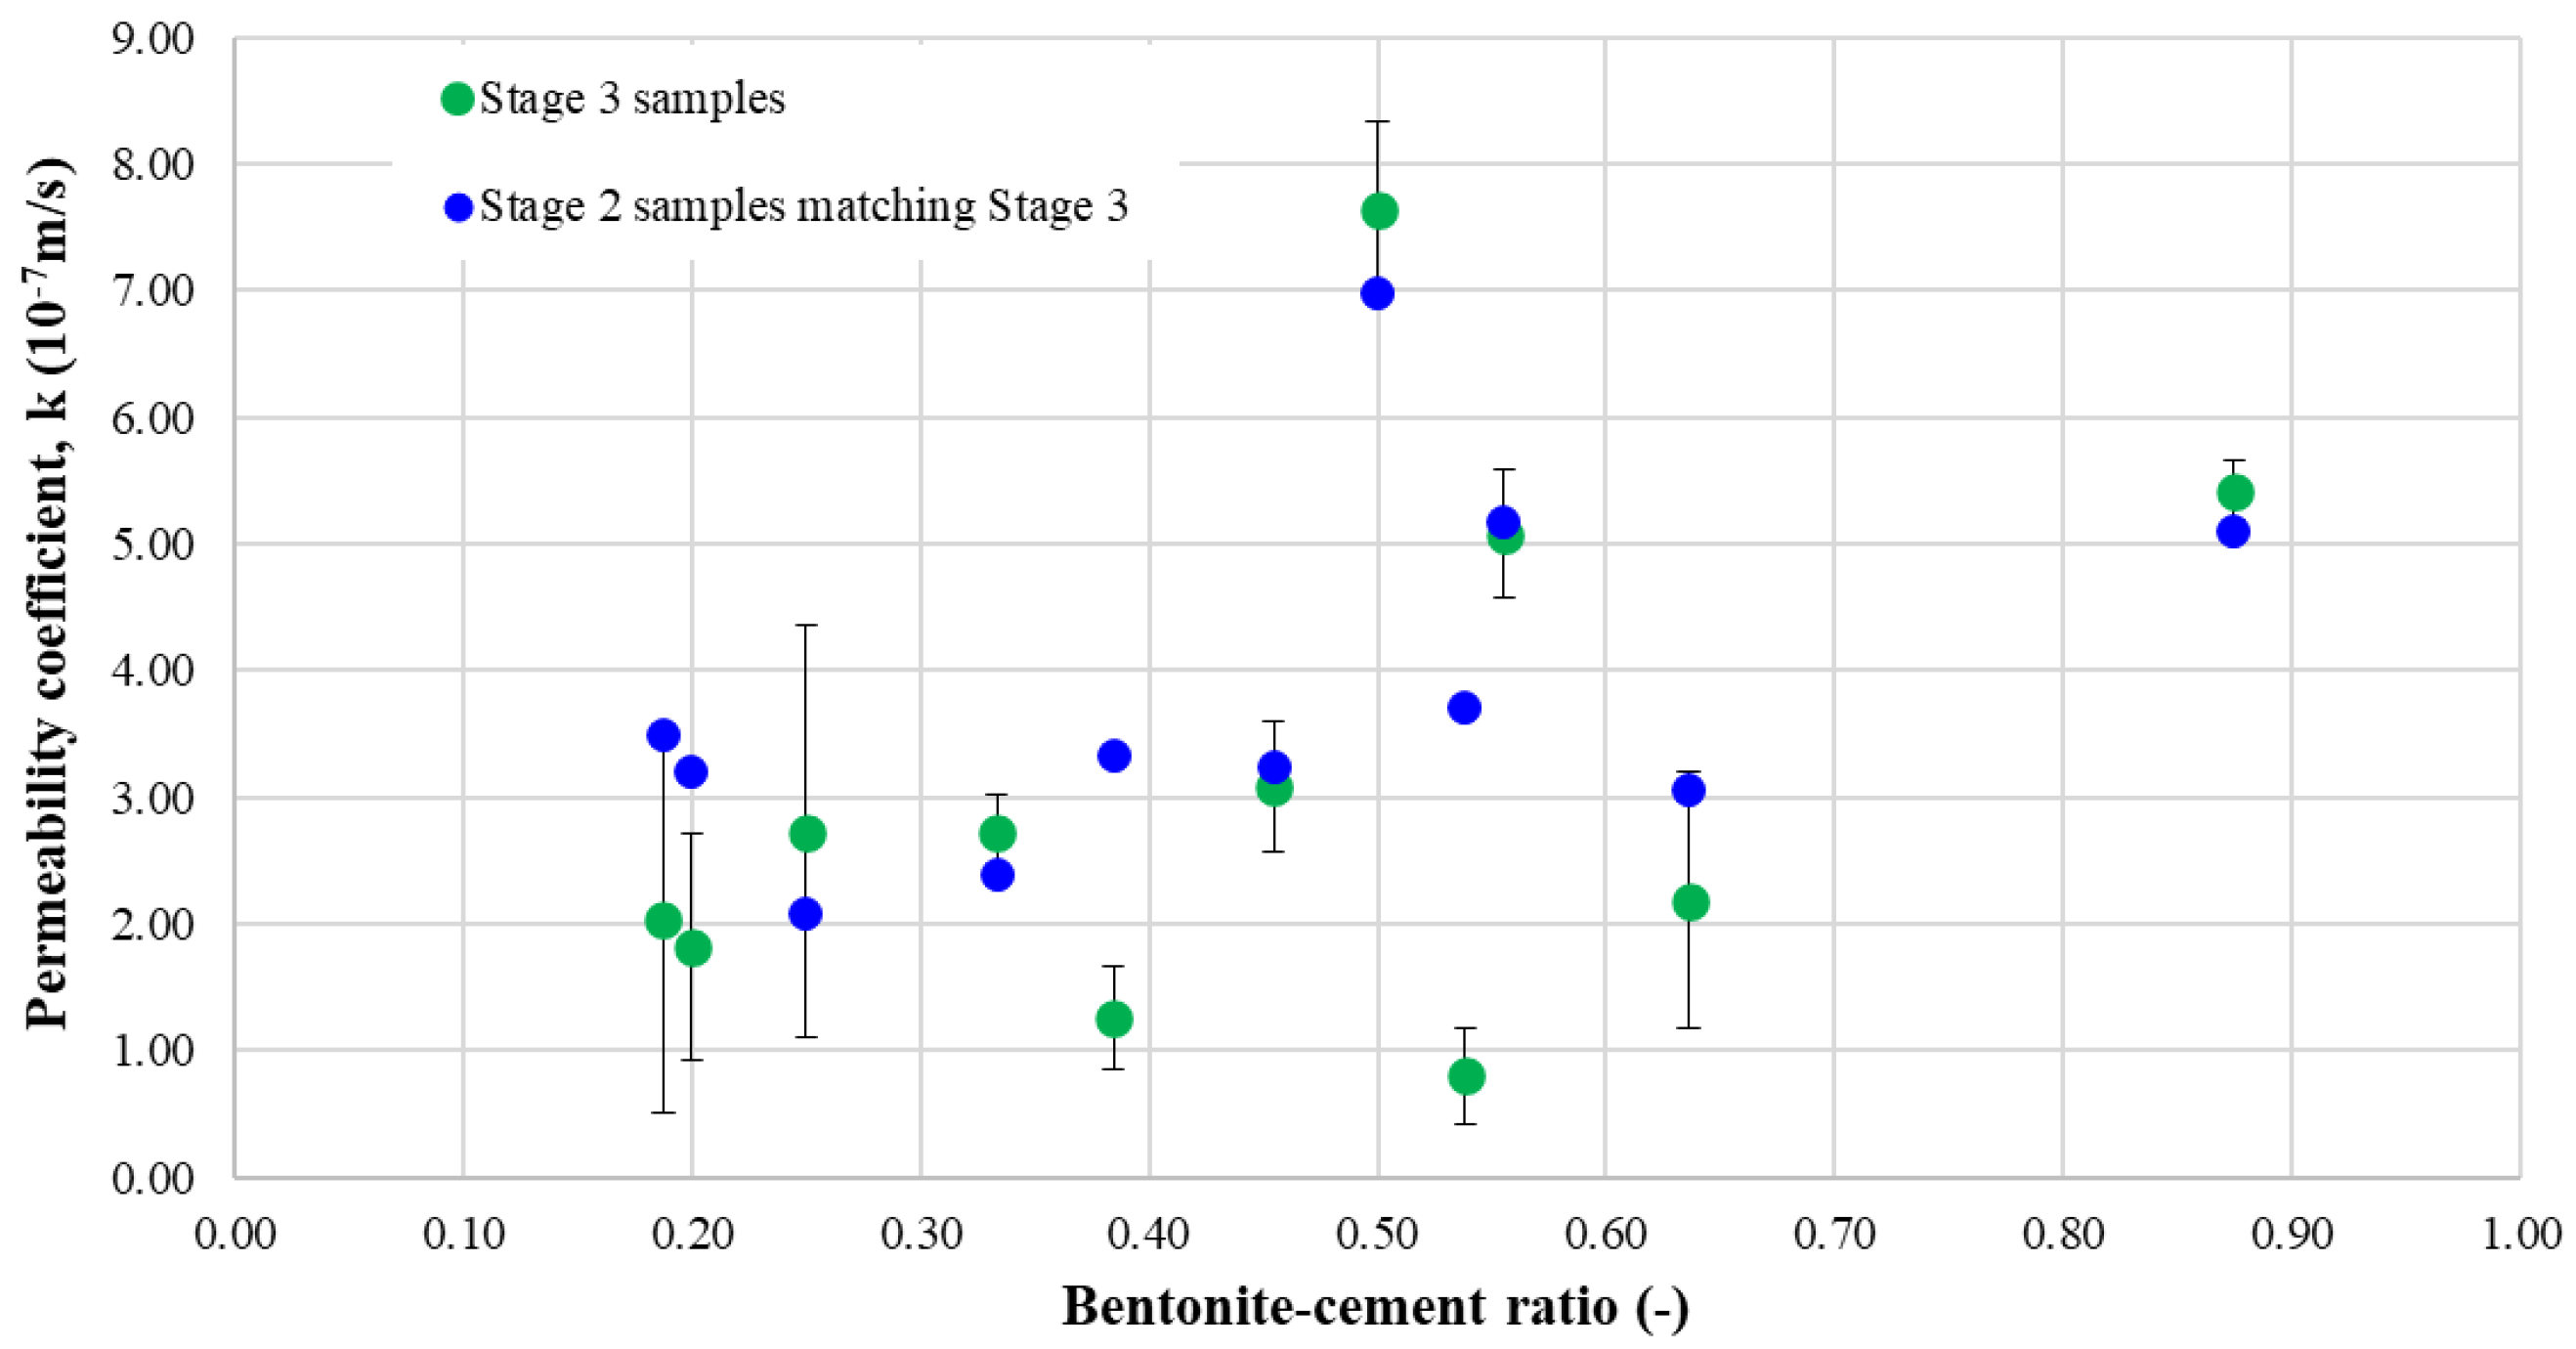
In order to highlight the distribution and the reliability of the test results, each determined parameter was plotted on graphs against the representative ratios for the mixtures, namely the water–cement ratio, bentonite–cement ratio, and the water–bentonite ratio.
For each graph, the color legend was kept the same so the results would be easier to track down and visualize. Green markers represent the samples tested during the third stage of the laboratory study (the current one presented in this paper), blue markers represent samples from the second stage of the study [
27], which match the present results, and red markers represent the samples from the second stage [
27], which do not have a correspondent with the latest stage of testing. Moreover, because of the sufficient number of samples tested in the current stage, the green markers were provided with error bars that represent the standard deviation computed for each batch of results.
From the plots presented in
Figure 13,
Figure 14 and
Figure 15, it can be observed that for certain mixtures, especially the ones with high undrained cohesion, the results were similar in the last two stages. This indicates that for the concrete-governed samples, the mixtures were more stable and thus the results obtained are more reliable. On the other hand, the samples that contained a larger quantity of bentonite present a wider spread of results, indicating the fact that bentonite negatively influences the curing process of the material and also induces effects that cannot be controlled nor quantified. The latter is demonstrated by the large differences between the stage 3 samples (green markers) and the substantially different stage 2 samples (red markers). The difference between the values of the undrained cohesion obtained in the third stage may be five times greater.
Regarding the permeability coefficient, the samples from the two test stages are similar from the order magnitude point of view, with all the mixtures fitting into a 10
−7 m/s order of magnitude. Although there are some differences between the values of similar samples (same water–cement ratio or same water–bentonite ratio), the results are consistent enough to highlight the fact that the preparation and testing procedures were correct for the determination of the permeability coefficient. The results obtained are plotted in
Figure 16,
Figure 17 and
Figure 18.
Moreover, the plots suggest that larger quantities of water used for the fabrication of samples induce higher permeability but are still in the same range and, at the same time, because of the more stable mixtures created, the cement-governed samples reach the lowest permeability. In almost every case, the stage 2 samples fit in the standard deviation computed for the results obtained in stage 3 of laboratory testing.
The results regarding the viscosity of the material in the fresh state with respect to the characteristic ratios are presented in
Figure 19,
Figure 20 and
Figure 21. The viscosity was tested in order to determine the workability of the material in the fresh state and the degree to which it might be employed on-site.
The viscosity results were plotted and show that for more than half of the mixture combinations, the results are consistent from one stage to another. Four types of samples that did not fit in the same interval as their correspondent from the third stage were determined, with their values being significantly different; these are not included in the standard deviation interval plotted around the green markers. This observation, once again, highlights the importance of having more results from the same laboratory tests in order to determine a more precise interval of variation in one parameter. The fact that the values represented by the red markers are at least twice the values obtained in the third stage of testing suggests that there might be a problem regarding the staged procedure for manufacturing the samples. One issue that might be raised is the insufficient bentonite or cement hydration during the mixing sequence.
5. Conclusions
This study did not intend to obtain the ideal mixture of materials; rather, our aim was to investigate the various functional requirements and possibilities regarding strength, workability, and hydraulic behavior. In order to ease the illustration of the results and to better represent the mixtures and their components, the ternary diagram was employed.
The adequate mixtures made of water, cement, and bentonite need to have a certain set of properties which is often influenced by the tradeoff between the components. In this paper, it was demonstrated that the excessive use of one of the components led to a mixture of behaviors governed by the respective material. Even though it was foreseeable that a larger quantity of cement would lead to a greater strength, in the case of the other components it was proven that larger quantities of water or bentonite may lead to unsatisfactory hydraulic behavior of the mixtures and, also, induce some unwanted phenomena, like shrinkage or cracking, during the casting and maturing process of the mixtures.
The research allowed us to compile the barycentric abacus shown in
Figure 22 that can be used to select the optimal mixture for a given set of parameters. It is obvious that it is not always possible to find a certain combination of properties but the graph helps to reach a tradeoff between them. Once the compatible properties are set, the choice of the mixture is straightforward.
According to the literature, the undrained cohesion of the plastic concrete varies between 500–1500 kPa [
28,
29,
32]. Considering the interval of variation determined in this paper, most of the mixtures are located in this interval, with only two mixtures being outside of it, namely 137 and 442 kPa. Also, the results regarding the undrained cohesion match the requirements of German and Austrian norms for cut-off walls which are a minimum of 150 kPa 28 days after casting [
38] and a minimum of 250 kPa 28 days after casting, respectively [
39].
Regarding the permeability of the mixtures, according to the literature, for plastic concrete, the permeability coefficient varies between 10
−7 – 10
−10 m/s [
32]. In this paper, all the values obtained for this parameter belong to the same order of magnitude, respectively, 10
−7 m/s, placing the results in the upper part of the variation interval indicated in the literature. These results were attributed to the on-spot hydration of the bentonite that was preferred for simulating actual site conditions, rather than pre-hydrating it before the construction of the samples as is usually carried out in laboratory tests.
Future research should focus on the behavior of mixtures using other types of bentonites or cement. The mixture timing in this paper is similar to the one used when mixed on-site, namely mixing bentonite and cement immediately before placement, rather than the most frequent laboratory approach where bentonite is allowed to hydrate prior to mixing with cement. An important future study should focus on the result differences between the two methods. Last but not least, the method should be checked against constructed cut-off walls, since the large-scale mixture in automated site mixers and the placement of the material in the ground could influence the final properties of the material. The presence of additives can drastically modify the results given herein; therefore, this research direction should also be considered for future development on the subject of cut-off wall materials and mixtures.

 ,
, 


