Article

Integrating Passive Energy Efficient Measures to the Building Envelope of a Multi-Apartment Building in Sweden: Analysis of Final Energy Savings and Cost Effectiveness

1
Department of Built Environment and Energy Technology, Linnaeus University, 351 95 Växjö, Sweden
2
Department of Building Technology, Linnaeus University, 351 95 Växjö, Sweden
3
Department of Applied Physics and Electronics, Umeå University, 901 87 Umeå, Sweden
*
Author to whom correspondence should be addressed.
Buildings 2023, 13(10), 2654; https://doi.org/10.3390/buildings13102654
Submission received: 15 September 2023 / Revised: 6 October 2023 / Accepted: 11 October 2023 / Published: 21 October 2023
(This article belongs to the Topic Building Energy Efficiency)

Abstract

:
A major challenge in building energy renovation is to cost effectively achieve notable energy savings. This paper investigates cost-effective passive energy-efficiency measures for thermal envelope retrofit of a typical Swedish multi-apartment building from the 1970s. Here, the use of different types of insulation materials for the retrofits of roof, exterior walls, and ground floor are analyzed along with changing windows and doors with varying thermal transmittance values. The cost-effectiveness analysis is based on the net present value of the investment costs of the energy-efficiently measures and the achieved energy cost saving. Different economic scenarios and renovation cases are considered in techno-economic analyses to determine the cost-effective energy-efficiency retrofit measures. The results indicate that improved windows reduce energy demand for space heating by up to 23% and yield the highest final energy savings. However, additional mineral wool roof insulation is the most cost-effective measure under all economic scenarios. This measure gave the lowest ratio of cost effectiveness of about 0.1, which was obtained under the stable scenario. The final energy savings that can be achieved in a cost-effective manner vary between 28% and 61%, depending on the economic scenario and renovation case. This analysis emphasizes the influence of different renovation cases and economic parameters on the cost effectiveness of passive energy-efficiency measures.

1. Introduction

The building and service sector in the European Union (EU) is responsible for approximately 40% of the total final energy consumption and 36% of all greenhouse gas emissions [1]. EU member states have set targets to reduce energy use in the building sector, and the recast Energy Performance of Buildings Directive (EPBD recast, Directive 2010/31/EC) is a key EU policy to realize these targets [2]. The Swedish government has set strategies for energy renovation in the building and service sector, which is responsible for almost 40% of the total final energy use [3]. The primary goal is to reduce the total energy demand of the building sector by 50% by 2050 with respect to levels in 1995 [4].
It is estimated that the energy use in the Swedish residential sector could be reduced by 53% when existing buildings are renovated to achieve the current Swedish building energy standard [5]. Almost one third of Swedish multi-dwelling buildings were built between 1964 and 1974 under the so-called Million Program [6]. These dwellings were constructed with modest design requirements to increase their wide implementation and overcome the housing shortage at that time [7]. However, most of these buildings require renovation due to material deterioration and poor indoor air quality [8]. This provides an opportunity to improve the energy performance by integrating energy efficiency measures (EEMs) into the building envelope. In addition to energy savings, energy renovation offers multiple co-benefits, including improved indoor environments, enhanced aesthetics, and increased building value [9].
The majority of existing Swedish multi-apartment buildings are located in populated areas covered by district heating. Space heating accounts for the highest percentage of the total final energy use in the operation phase of these buildings [3]. Hence, upgrading building envelope elements and replacing low-energy performance elements could contribute to improving the energy performance of the existing building stock. In buildings with district heating, prioritizing passive EEMs seems to be pertinent since such measures give higher primary energy efficiency than active EEMs [10,11]. Passive EEMs include such measures as thermal envelope insulation, improved airtightness as well as high performance windows and doors, in contrast to active EEMs such as heat recovery ventilation systems which require mechanical energy input.

1.1. State of the Art

A major challenge in energy renovation projects is to achieve energy efficiency requirements cost effectively [12,13]. Different studies [14,15,16,17,18,19,20,21,22,23,24] have investigated the economic benefits of EEMs for existing buildings. Dodoo et al. [17] found that adding insulation to the basement walls is the most cost-effective EEM for a multi-apartment building located in southern Sweden. However, an analysis in a similar context done by [14] indicated that roof insulation is the most cost-effective EEM. Table 1 provides a summary of the reviewed literature dealing with the cost effectiveness of renovating existing buildings.
The selection of EEMs for a particular building entails a multi-objective optimization process that depends on various parameters, including specific building characteristics, budgetary constraints, building function [25]. Applying a similar EEM package to different buildings with different typologies may result in failure to realize cost effectiveness for some of the selected buildings [15]. Hence, it is important to follow a specific approach in cost-effectiveness analysis of buildings, and for implementation of the obtained outcomes to buildings of similar typologies. Today, various insulation materials may be used for building thermal envelope retrofits, each with different cost implications. However, despite the large number of publications in this field, the variation in the insulation material type was not analyzed from an economical point of view.
The most common method followed in economic analysis and optimization of building EEMs is the net present value (NPV) [17]. The cost-effectiveness analysis is influenced by economic parameters such as real discount rates and annual increases in energy prices. Most studies analyzed the cost effectiveness of integrating EEMs into existing buildings with the main renovation purpose of improving the energy performance. However, high savings could be achieved when combining EEMs with already required renovation measures due to material deterioration [26]. The total investment costs of EEMs could be reduced to marginal costs when the costs of replacing deteriorated and worsened elements are excluded. Hence, in this analysis, the cost effectiveness of EEM investments is analyzed according to two renovation cases. First, the building is renovated merely to improve the energy performance. Second, EEMs are combined with already needed measures due to deteriorated elements such as roof waterproofing layer, outer façades, windows, and flooring.

1.2. Aim and Purpose
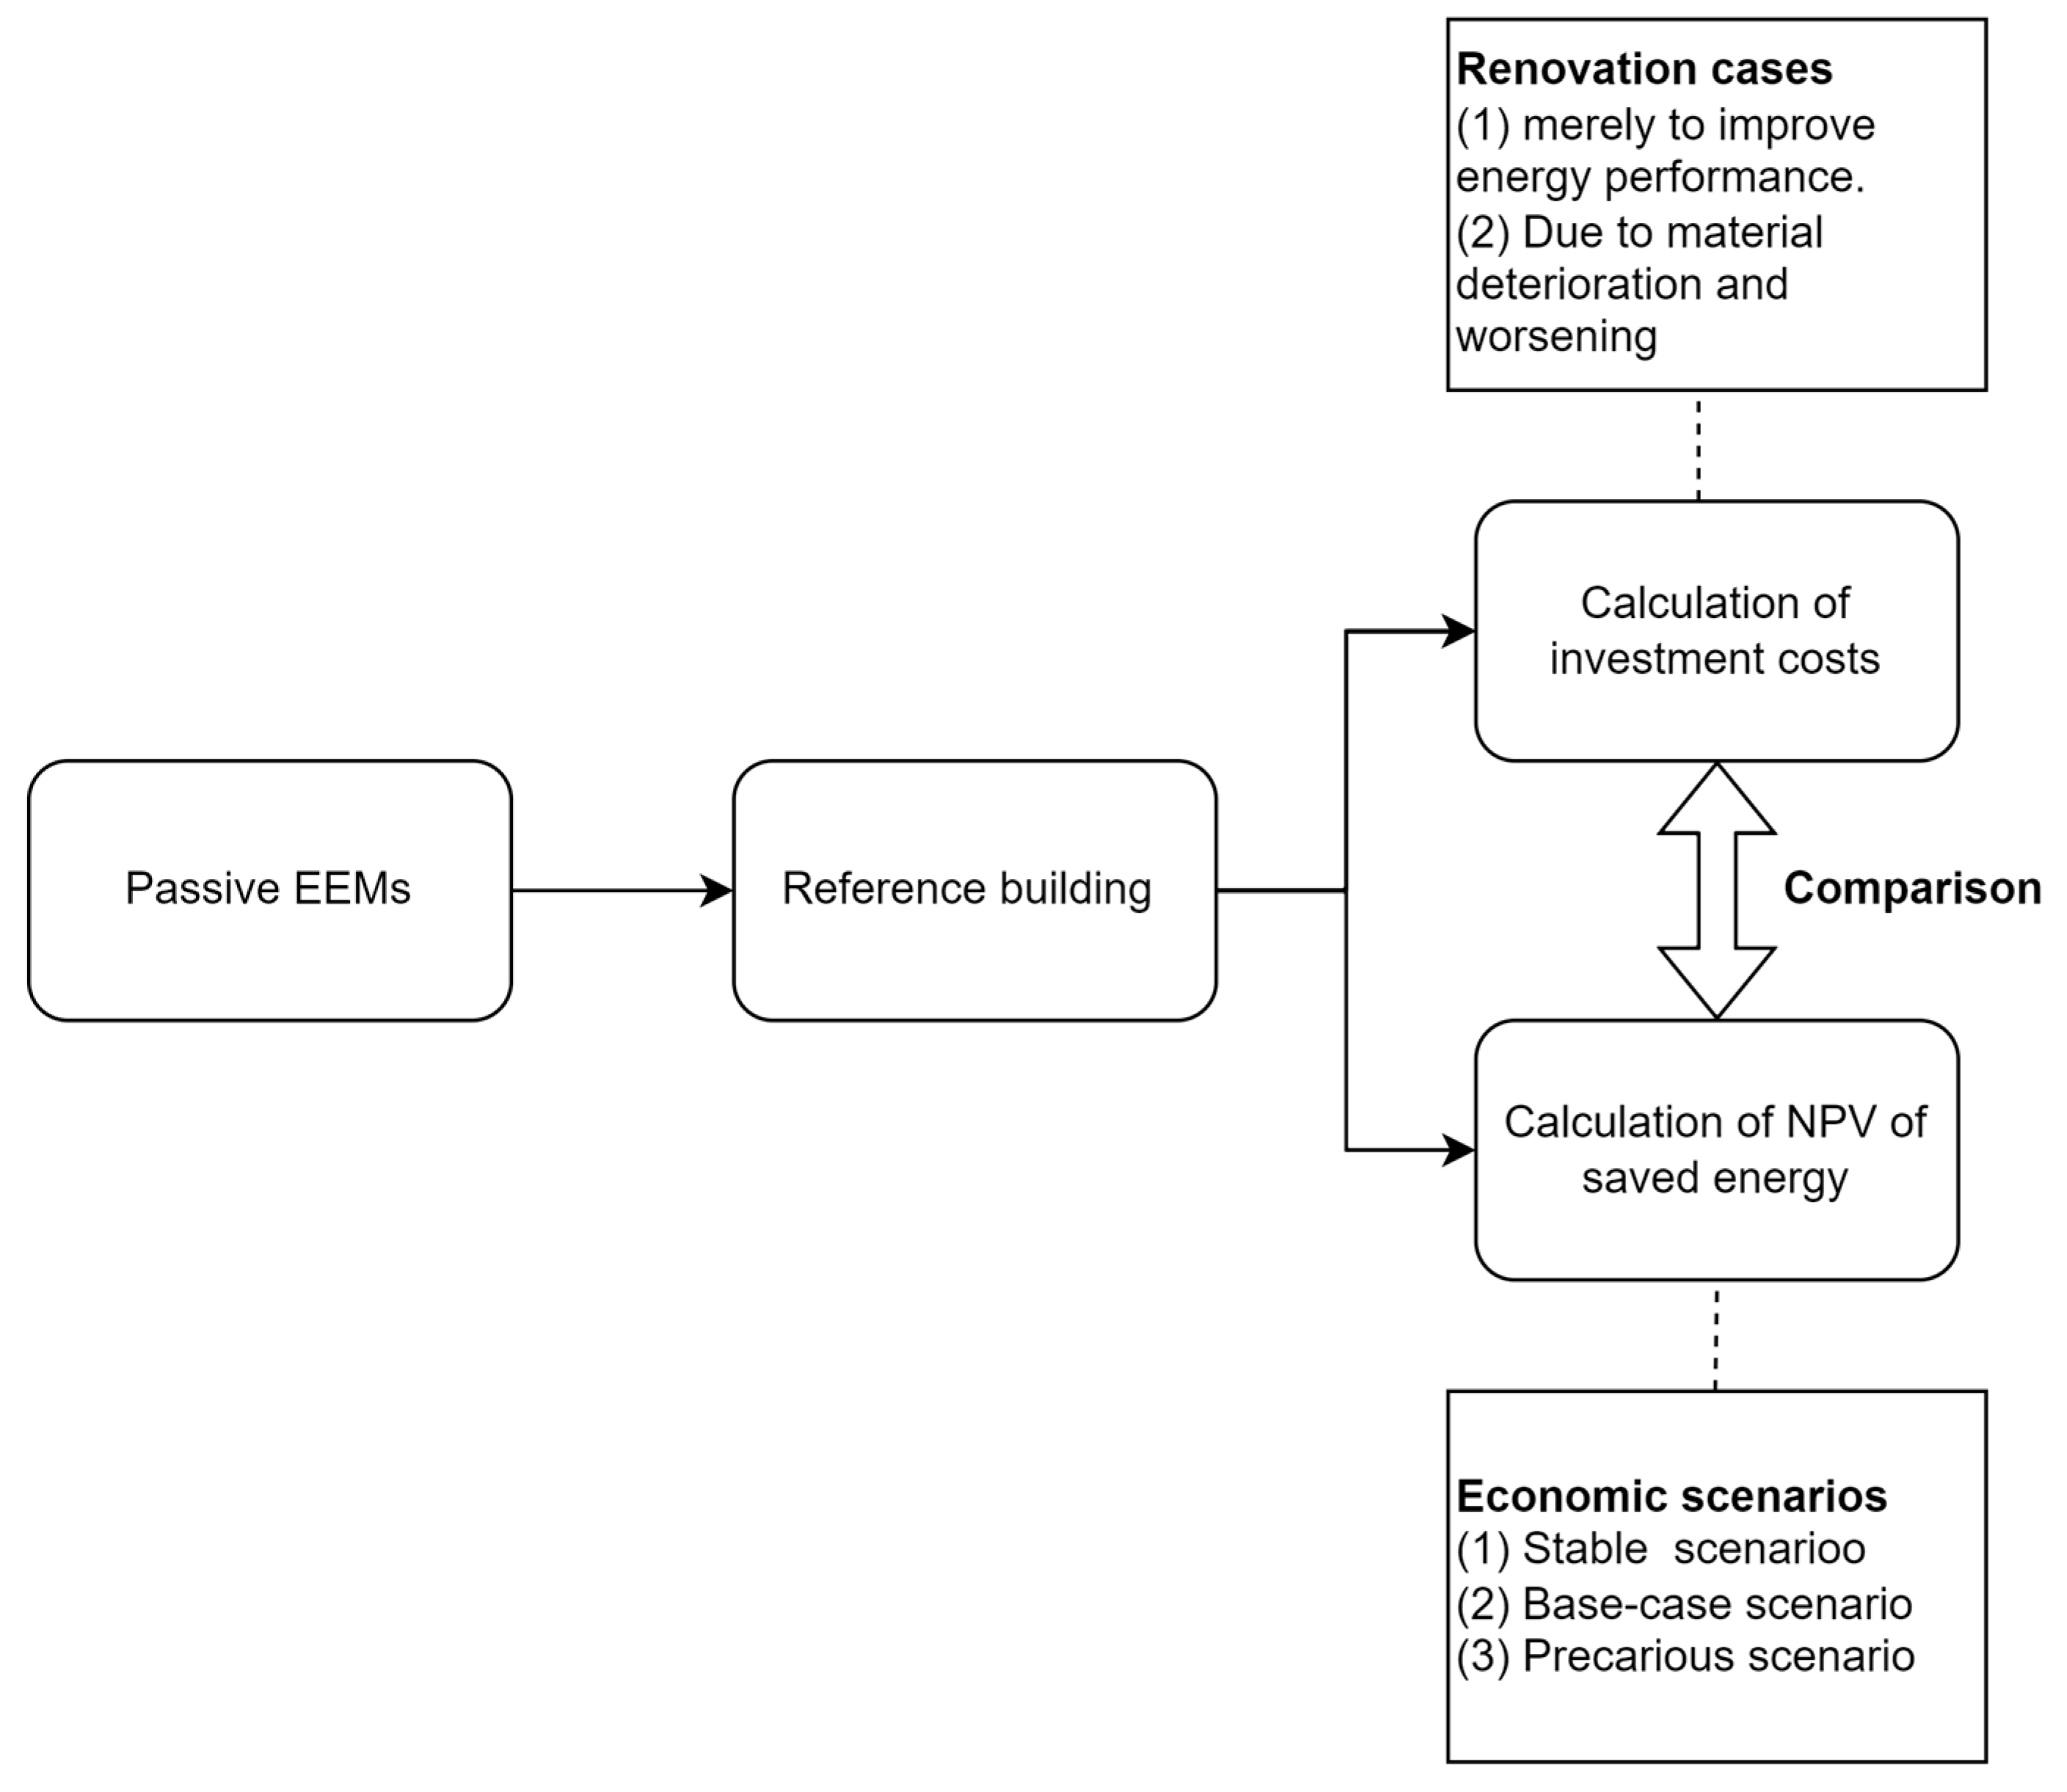
Most of the multi-apartment buildings constructed during 1970s under the Million Program in Sweden are located in low-income areas [27]. Hence, it is vital to ensure that the renovation will not result in higher rents, which may lead to the tenants moving out. Nevertheless, most of the retrofitting companies in Sweden focus on luxurious and non-viable measures which significantly increase the value of the building after renovation [28]. Accordingly, the aim of this paper is to determine the achievable energy use levels by incorporating cost-effective passive EEMs to the building envelope of an existing multi-apartment building. Different types and thicknesses of additional insulations for the roof, exterior walls, and ground floor combined with different new windows and doors exhibiting a better thermal performance are considered. Cost-effectiveness analysis of the considered measures is performed under different economic scenarios and two renovation cases. In each of these economic scenarios, the discount rates and energy price escalations are defined according to a prescriptive approach that considers the effects of future economic and environmental issues on economic growth. Consequently, cost-effective packages of EEMs are determined for each analyzed economic scenario. Furthermore, this study evaluates the impact of the lifespan of the considered passive EEMs on their cost effectiveness in a sensitivity analysis.
Compared to existing publications, this study presents the comprehensive procedure for performing cost-optimal analysis for renovating existing multi-apartment buildings by incorporating passive EEMs under different techno-economic scenarios. This study analyzes the cost effectiveness with respect to two assumptions. First, that the building is renovated merely to improve the energy performance. Second, that the building is mainly renovated due to material deterioration and worsening. The study’s methodology, including consideration of different insulation alternatives and techno-economic parameters as well as renovation scenarios, presents a novelty compared to the existing body of work.

2. Methodology

A typical multi-apartment building representative of almost one third of all the residential buildings in Sweden is used as a case-study building in this analysis. Different variants of each EEM are considered individually to analyze the reduction in energy use. For the roof, exterior walls, and ground floor elements, different types and thicknesses of insulation materials are considered. Additionally, windows and doors with different U-values are analyzed. The investment costs are compared to the total NPV of the achieved energy savings over a 50-year lifespan in cost-effectiveness analysis and based on the different economic scenarios and renovation cases.
The cost effectiveness of each individual EEM is analyzed under each economic scenario assuming the above two renovation cases. If all the options of that EEM are cost-effective, a marginal cost-effectiveness analysis is performed to determine the optimal option. Then, the most cost-optimal options of EEMs are combined in packages according to the considered economic scenario. Figure 1 shows an overview of the approach followed in this analysis.

2.1. Applied EEMs

Different types of thermal insulation materials for the exterior walls, roof, and ground floors are considered based on common practices and market availability. Currently, the most common and applicable types of insulation materials include mineral wool, foam glass, glass wool, EPS, and XPS [29]. In the case of mineral wool, there are various variants available on the market with different thermal conductivity (λ) values. The available variant with the lowest conductivity value was chosen to yield the maximum thermal performance. The thermal properties of the analyzed insulation materials are obtained from [30], and are presented in Table 2. The applied insulation types for the roof and exterior walls included mineral wool, glass wool, and EPS. In terms of the ground floor, the added insulation material must have an adequate moisture resistance. Accordingly, the analyzed types of insulation materials for the ground floor include foam glass, XPS, and EPS. For each element, three types of insulation materials are considered at thicknesses in the range 50–500 mm. The existing windows and doors are replaced with windows that have low thermal transmittance coefficients. Table 3 provides the considered types of windows. For the doors, two replacements options having overall U-values of 1.1 and 1.2 W/m2 K are considered. These analyzed doors contain layers of aluminum, wood, and light insulation material.
The cost-effectiveness analysis is performed to assess and compare various energy-efficient retrofit solutions based on their investment costs and the economic benefits they offer. It assists in identifying the most financially feasible measures for enhancing the building’s energy performance. To determine the cost effectiveness of various EEMs, the costs and benefits are compared. The economic benefits are mainly the lower costs of energy as a result of reduce energy demand. These costs are determined by calculating the total NPV of the final energy cost savings over a 50-year period. In this analysis, the estimated remaining lifetime of 50 years was based on a site-specific assessment of the studied building. This determination took into account factors such as the building’s condition, construction materials, and expected durability. It is worth noting that a remaining lifetime of less than 50 years, such as 40 years, was considered relatively short when compared to similar multi-apartment buildings from the Million Program, as discussed in the study [17].
The NPV of the energy savings was calculated according to Equation (1).
N P V = i = 1 n F i ( 1 + r ) i
where: NPV is the NPV of the energy savings (Euro), n is the considered lifespan of the measure (year), Fi denotes the annual energy cost savings in year i (Euro), and r is the discount rate (%).
The cost effectiveness of each option in each EEM is evaluated based on the ratio of the total investment costs to the total NPV of the final energy cost savings over a 50-year period. A measure is considered to be cost effective when this ratio does not exceed 1. The investment costs of the analyzed building energy renovation measures are calculated using a bottom-up model and Swedish building renovation works tariff for 2021/2022 [31]. This model includes standard price lists for building materials as well as construction, electricity, and plumbing works, based on real-market conditions. Other costs which are not included in [31] were obtained from the specific suppliers of the materials. For example, the material costs of foam glass insulation were obtained from the manufacturer [32]. The calculated investment costs for each energy renovation measure include costs for materials and their on-site installations, as well as costs for required preparatory and ancillary works, e.g., installation of scaffold. For the exterior wall insulations, the investment cost calculations include costs involved in extending roof overhangs where it is insufficient, and making good windows and door sills due to increased insulations. Additionally, the roof extension costs due to the increase in wall thickness are also taken into account.
In some of the typical Swedish multi-apartments from Million Program, elements such as asphalt waterproofing layers in roof, outer facades, windows, doors, and ground floor are already in need of renovation due to material deterioration. For example, in case the exterior walls are worn out and need to be replaced anyway, additional thermal insulation may be incorporated after demolishing the existing wall to further improve the energy performance of the building. Hence, this analysis analyses the cost effectiveness of incorporating the EEMs assuming two renovation cases. First, that the building components are in good condition and renovation was performed merely to improve the energy performance of the building. Second, components such as waterproofing layers in roof, outer façades, the top layers of the ground floor, windows, and doors already in need for replacement due to material deterioration and worsening were identified. In this alternative, the costs of replacing the deteriorated components are excluded from the total investment costs.
In each EEM, if all the considered insulation thicknesses or window U-values are cost effective, marginal cost-effectiveness analysis was subsequently performed to determine the optimal option. Here, the marginal energy cost savings are plotted against the marginal investment costs of each option within that EEM. The intersection defines the optimal point. Marginal cost-effectiveness analysis is significant to determine the best option in relation to the additional investment costs within an EEM.

2.2. Economic Scenarios

Numerous economic factors, such as real discount rates and annual energy price increases, have a substantial impact on the financial viability of energy savings. The objectives of this study are to examine the buildings’ cost-optimal energy performance in accordance with the Delegated Regulation No. 244/2012 of the European Commission [33]. In order to calculate the overall cost of EEMs for buildings in financial assessments, these guidelines suggest conducting a sensitivity analysis on discount rates and energy price changes. Three economic scenarios were created for the analysis based on these suggestions. As proposed by the European Commission, a genuine discount rate of 3% was applied in the base-case scenario. Regarding the annual percentage of energy price escalations, the trend from 2010 to 2020 shows an average yearly increase of 2%, this trend was assumed to remain in the base-case scenario. As a result, the base-case scenario included both a 3% discount rate and a 2% yearly increase in energy prices.
Two more economic scenarios were developed in addition to the base case. By employing a lower discount rate, the first scenario intended to create a financial incentive to implement more energy-efficient measures. Because of the higher annual increase in energy costs, this scenario, referred to as the “stable scenario”, resulted in a higher total (NPV) of averted final energy consumption than the other scenarios. The second scenario, the “precarious scenario”, represented a possible scenario where the economic motivation to adopt EEMs would be restricted due to greater discount rate and a small annual increase in energy prices into account. Accordingly, the number of applied EEMs could be limited in this scenario due to higher project potential risks.
A prescriptive approach was followed in the development of the economic scenarios. We took into account the project-specific risks along with a risk-free scenario when assigning discount rates in the precarious and stable scenarios. We took into account the opportunity cost of capital as well as the projected return that capital owners require. Since the risks faced by various businesses and projects vary, no single standard discount rate can be used in all financial computations.
In the case of Sweden, each business estimates the precise yield requirement (discount rate) for cost project calculations. Risks related to investing in EEMs from the viewpoint of the investor, in this case a public housing company, include construction risks, regulatory changes, market conditions, financial risks, and stakeholders’ engagement. According to these risks, the public housing company took these risks into account and calculated an expected secure real interest rate of 2% plus a 2% risk premium which resulted in a discount rate of 4% in real terms. This value was used for the precarious economic scenario which took into consideration the project-specific risks that might occur in future. Furthermore, a smaller yearly energy price increase of 1% was also presumable in this scenario to reflect higher investment risks and a lower overall NPV of the saved energy. For the stable scenario which represented a risk-free scenario, we assumed that the public housing company might acquire compensation for potential risks, such as inflation risk, through governmental bonds or other comparable mechanisms. In this case, the risk premium was kept at 0% but the secure real interest rate of 2% was maintained, resulting in a 2% real discount rate. We also enhanced the likelihood of the EEMs to realize cost-effectiveness by assuming higher annual energy price escalations of 3% under this scenario. Table 4 shows the three economic scenarios used in this analysis.
District heating prices were obtained from the local district heat supplier, i.e., VEAB [34]. All costs were expressed in Euros considering an average exchange rate of 1.00 Euro = 10.59 SEK [35]. Table 5 summarizes the 2022 district heating tariff, which consists of capacity, energy, and flow costs, including the value-added tax (VAT).
For the EEMs that did not realize the cost effectiveness, sensitivity analysis is performed to evaluate the effect of assumed life span on the cost effectiveness of these EEMs. The lifespan is increased at 10-year intervals up to 100 years. Sensitivity analysis was performed under the stable economic scenario to enhance the likelihood of EEMs realizing cost-effectiveness.

2.3. Case-Study Building

Approximately half of the multi-apartment buildings constructed under the Million Program encompasses three-story slab blocks [27]. These buildings were constructed in neighborhoods with at least ten buildings of the same sort. These buildings were constructed based on the technical and architectural ideas prevailing during this period, and the form is strictly geometrical with plain undecorated façades. This geometric character is emphasized by the vertical jams of balconies or the horizontal contours of windows. Entrances are usually located at a certain offset distance to the façade line to avoid rainwater from entering. Furthermore, the roof elements are mostly flat or exhibit low inclination.
Our case study is a typical three-story multi-apartment building built in 1965 under the Million Program. It represents approximately 70% of the existing building stock in Sweden and other European countries [27]. The unique characteristics of these buildings including their construction technology and building technical systems make the renovation process challenging. This building is located in Växjö, Sweden (latitude 56°88′ N, longitude 14°81′ E) which belongs to a warm temperate climate zone according to the Köppen–Gieger classification [36]. Figure 2 shows a picture of the analyzed building. This concrete frame building consists of 12 housing units with a total heated area and a ventilated volume of 1223 m2 and 3173 m3, respectively. Currently, this building is heated by the local district heating system. Space heating is fulfilled through waterborne radiators, which is a typical configuration in these multi-apartment buildings. Ventilation is currently based on a mechanical exhaust system maintaining a constant air flow rate of 0.35 l/s m2. Table 6 lists the areas and thermal transmittance values (U-values) of the building envelope elements.

2.4. Energy Simulation
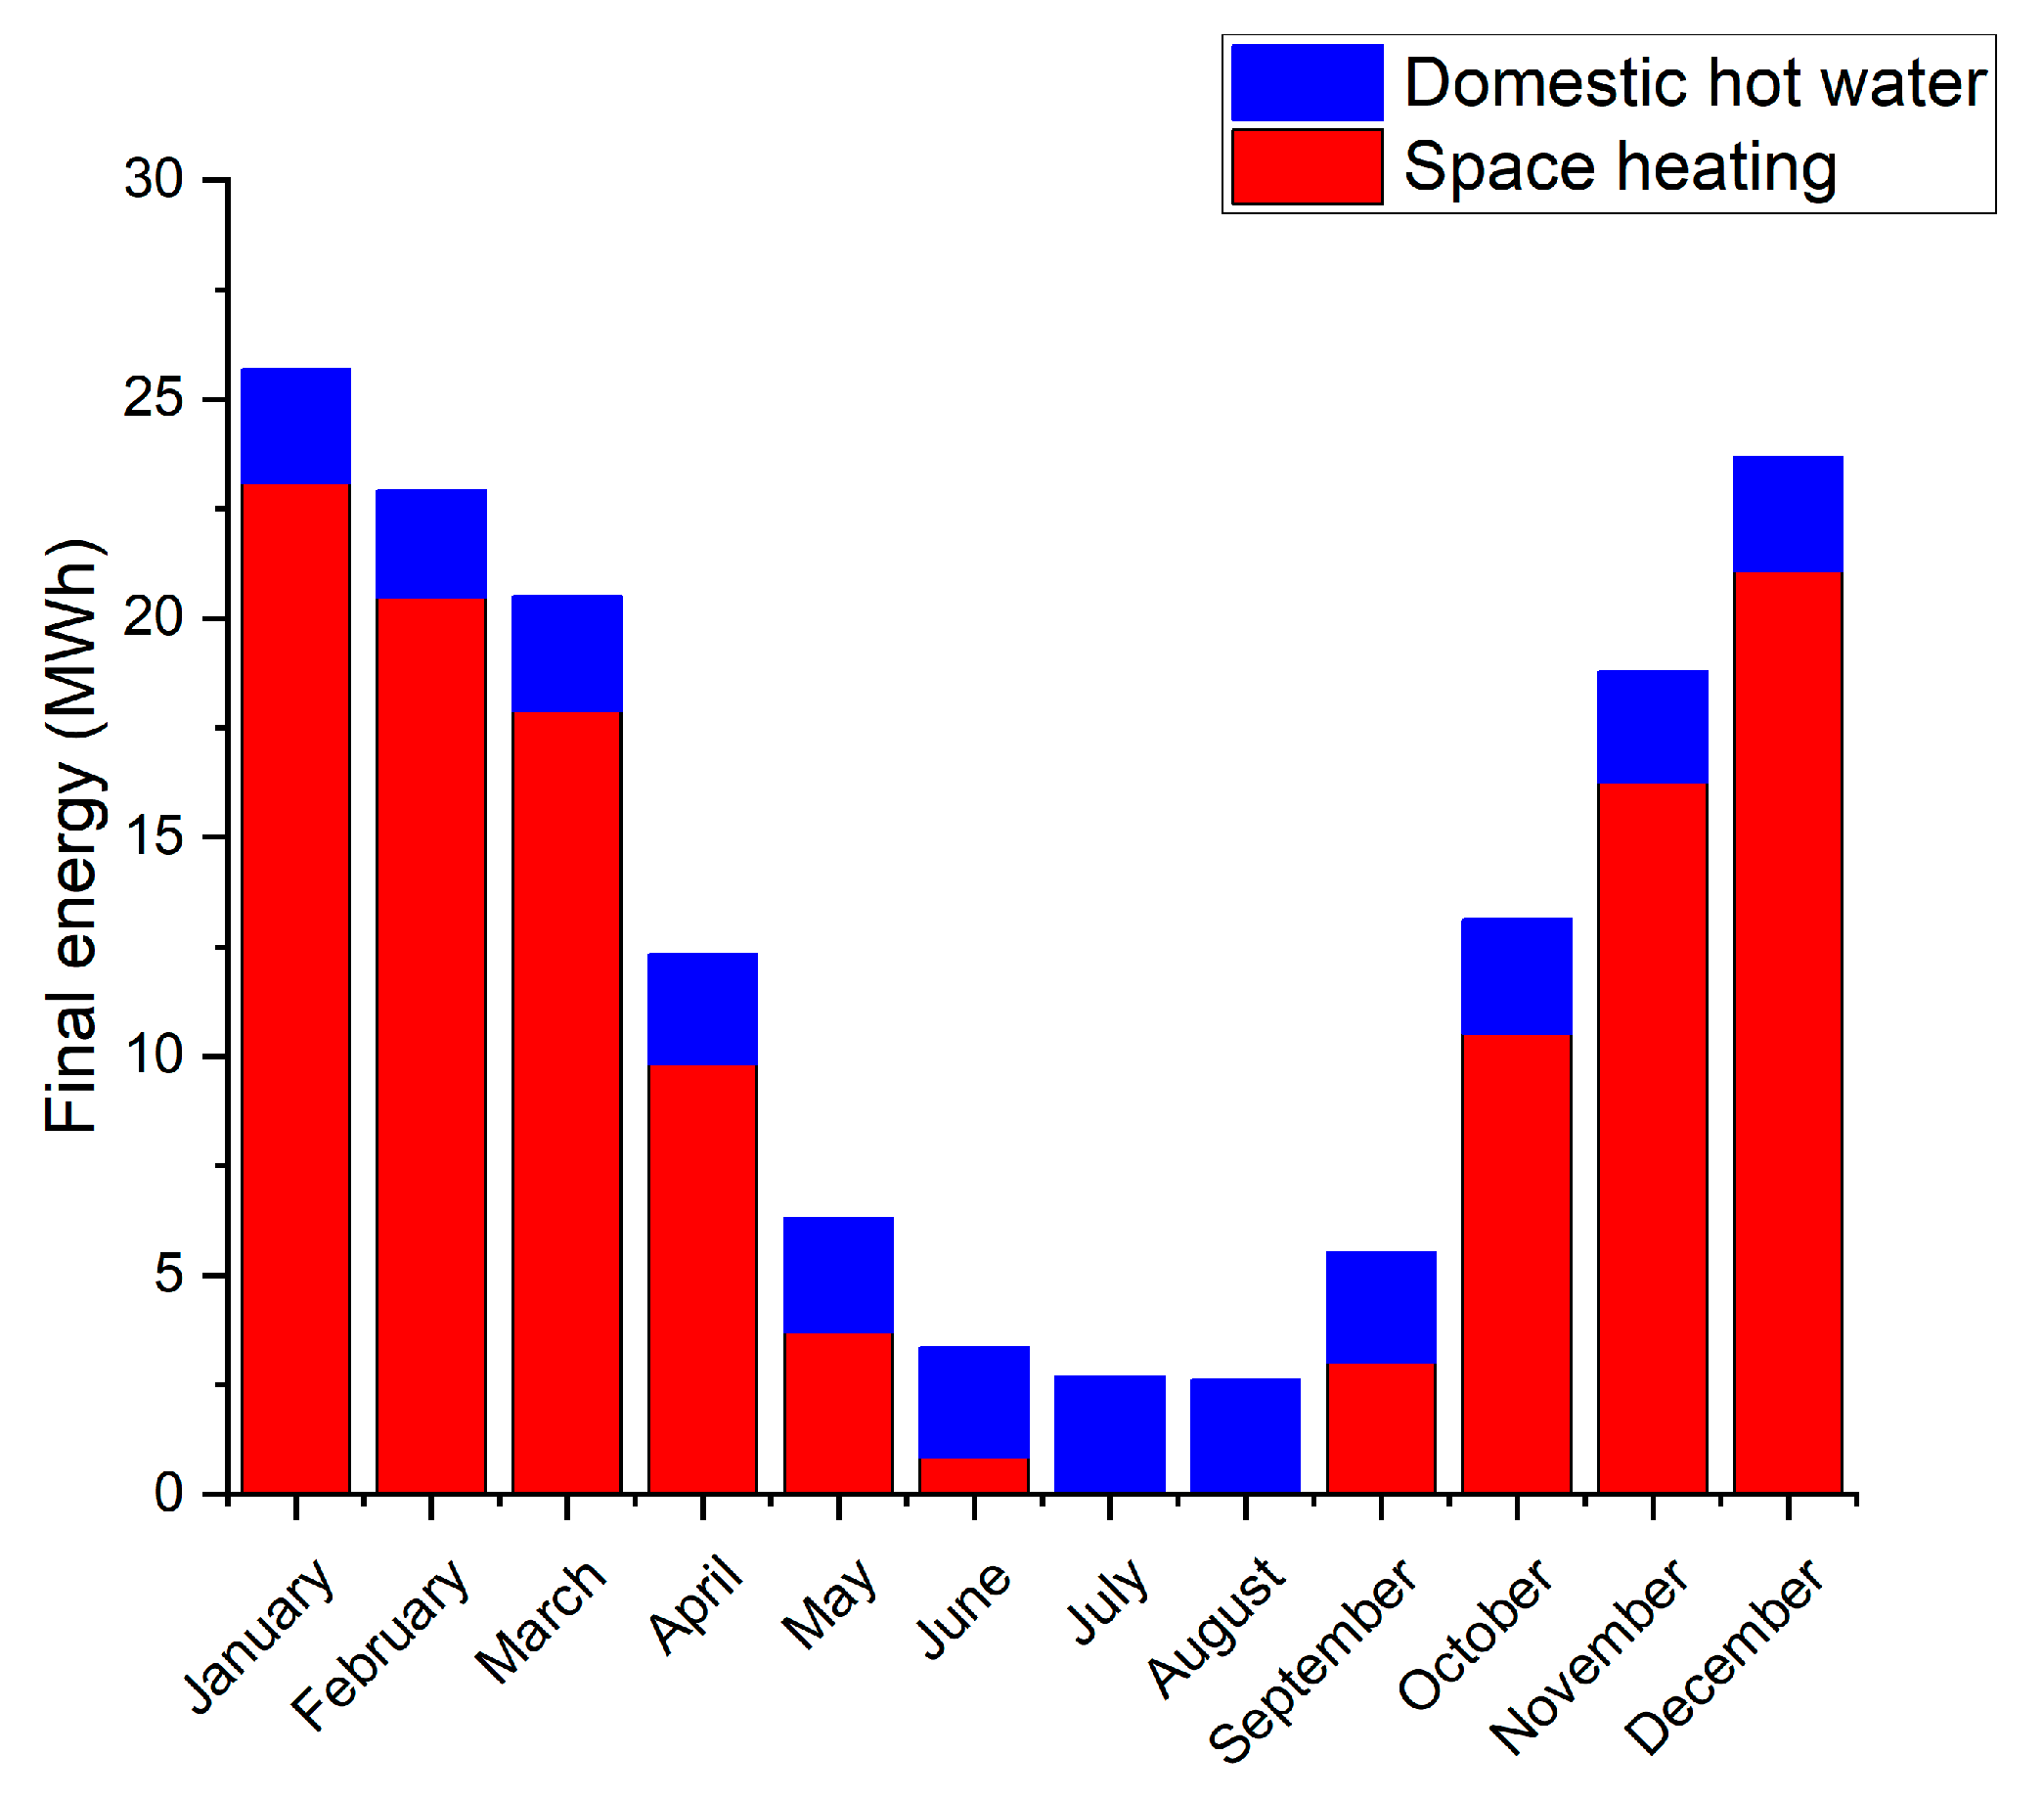
In this analysis, the final energy balance and savings of the EEMs are determined with simulation tool IDA ICE 4.8 [37]. This software provides whole-year detailed and dynamic multi-zone simulations that facilitate analysis of the indoor climate and energy use of buildings. Figure 3 shows the developed building model of the case-study building. The tool allows for the performance of an in-depth analysis of a building’s energy performance. Moreover, it models the flow of heat, cooling, and energy consumption throughout the building, providing insights into how various factors impact energy use. It comprehensively models how factors like weather, occupancy patterns, and control strategies affect energy consumption and indoor comfort.
Values of the linear thermal transmittance (Ψ) are obtained by modeling each building envelope component in VIP-Energy software version 4.2.2 [38], according to ISO 10211:2017 [39]. A 2019 weather file for the city of Växjö, Sweden, is obtained from the Meteonorm database [40]. Occupancy schedules were constructed and assumed to follow a constant profile throughout the year. The airtightness of the building was assumed to reach 0.8 l/s m2 based on [41], who established a database classifying buildings according to their airtightness. Table 7 summarizes the main key data and assumptions considered in the energy simulations.

3. Results

3.1. Final Energy Savings and Investment Costs

The building in its initial state exhibited annual final energy demands for space heating, domestic hot water (DHW) heating, and facility electricity of 103.7, 25.1, and 5.1 kWh/m2, respectively. Figure 4 shows the monthly delivered final energy for space and DHW heating before the EEM implementation.
The highest delivered final energy for space heating occurred in January, with a maximum peak demand of 63.14 kW. In July and August, the building exhibited almost no demand for space heating. The delivered energy for DHW heating remained constant throughout the year, at an average monthly value of 2.10 kWh/m2. In Appendix A, Table A1, Table A2 and Table A3 summarize the improved U-values, space heating demands, peak load demands, total and marginal investment costs of the different insulation material types, and thicknesses for the roof, exterior walls, and ground floor under both renovation cases.
In Appendix A, Table A4 lists the U-values, space heating demands, final energy savings, peak load demands, and total and marginal investment costs of the different types of windows and doors under both renovation cases. When assuming the renovation case due to material deterioration, the total costs for labor and equipment needed to remove the deteriorated element was excluded from the total investment costs. For example, in case of exterior walls, the total costs for removing the worn-out facades are excluded from the total investment costs for the insulation materials since they already needed to be replaced. The marginal investments column shows the difference between the cost of installing a higher thickness or U-value compared to the preceding one.
Among the applied EEMs, replacement of the existing windows with new types exhibiting a U-value of 0.80 W/m2 K resulted in the highest final energy savings. This individual measure reduced the annual space heating demand by 23%. Additionally, applying 500 mm of glass wool insulation to either the roof or exterior walls reduced the space heating demand by approximately 14% or 9%, respectively. The highest achieved final energy reduction percentage resulting from replacing doors and insulating the ground floor reached 8% and 5%, respectively.
The highest investment cost obtained was for ground floor insulation with foam glass, while the lowest cost was determined for roof insulation with mineral wool. The assumed renovation cases exerted a significant influence on the calculated investment costs. Regarding exterior walls, the total investment costs decreased by 51% when we assumed the renovation case associated with deteriorated façades. Similarly, regarding the ground floor, the total investment costs decreased by 32% when the performed renovation targeted slab top layer deterioration. The total investment costs for installing windows were reduced by 8% when assuming the renovation case associated with window deterioration. Furthermore, the total investment costs for door renovation increased by 18% on average.

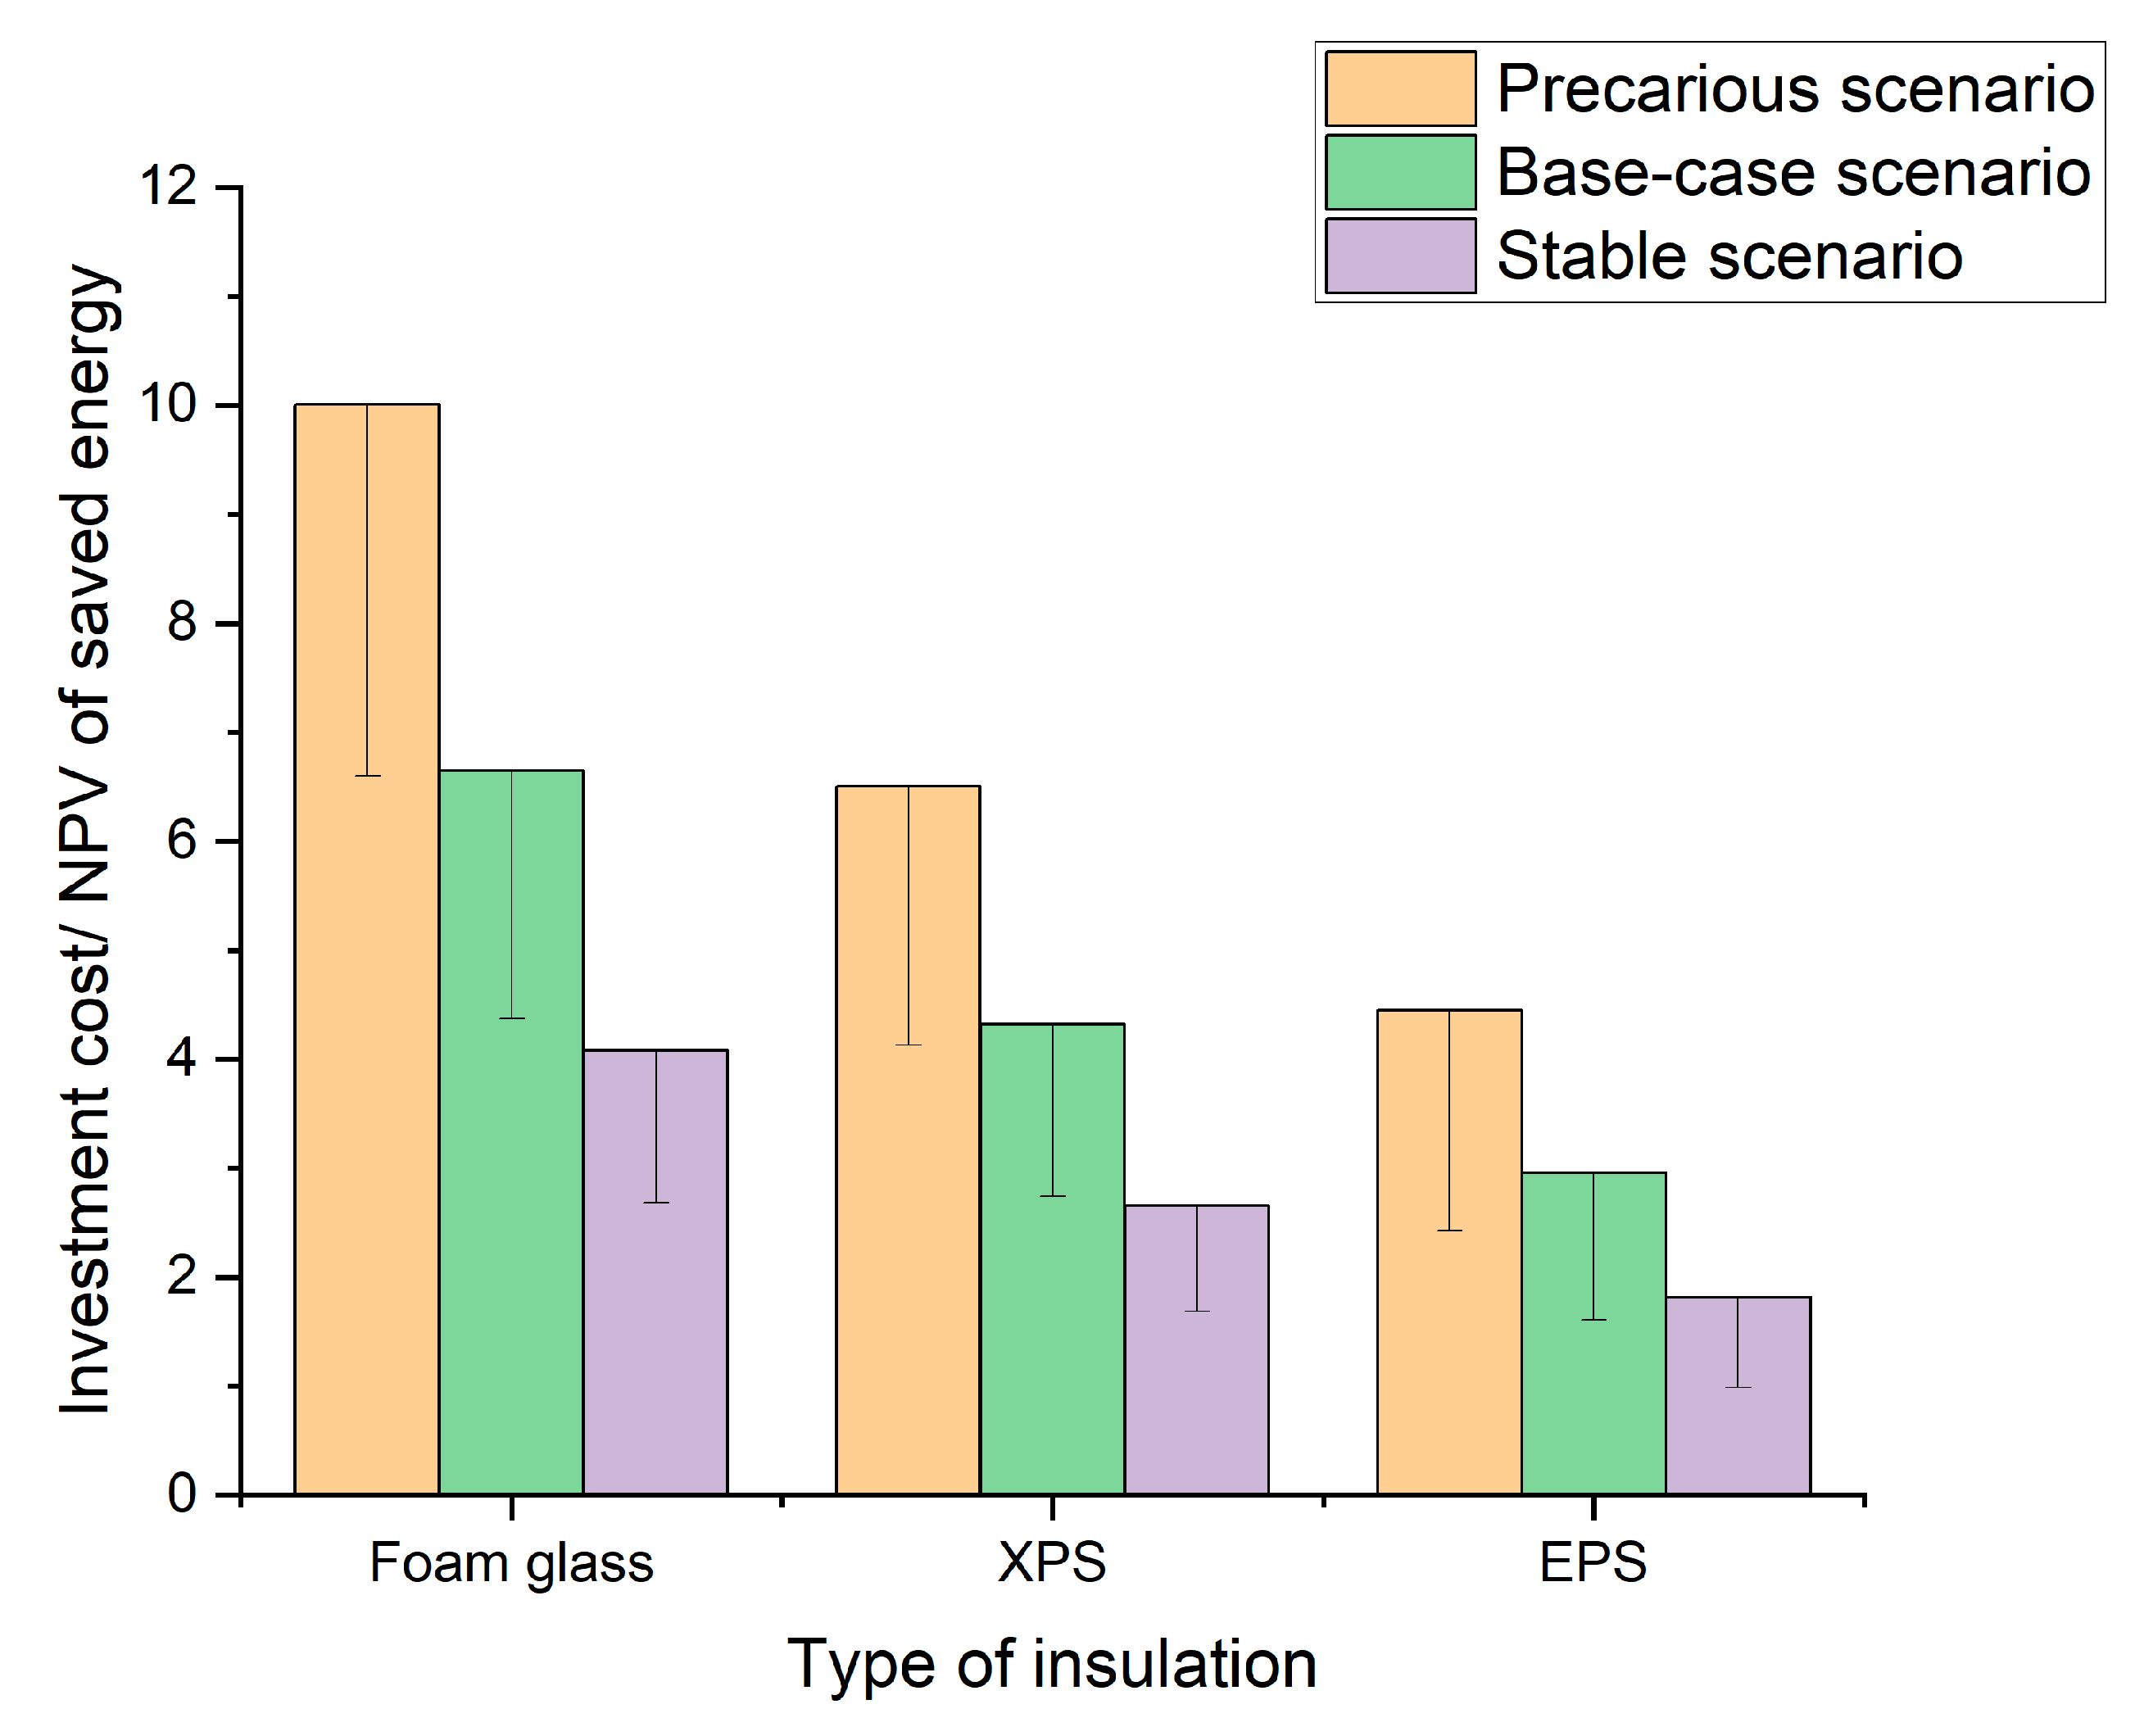
3.2. Cost-Effectiveness Analysis

In Appendix B, Table A5, Table A6, Table A7 and Table A8 list the NPV of the total final energy savings under the base-case, stable, and precarious economic scenarios. The highest value of the total NPV of energy savings was achieved when replacing the existing windows with 0.8 W/m2 K U-value windows under the stable economic scenario, i.e., a discount rate of 2% and annual energy price escalations of 3%. Adding insulation to the ground floor resulted in the lowest total NPV of energy savings. Among all EEMs, the NPV of the total energy savings was higher under the stable scenario because of the lower discount rates and higher energy price escalations. The total NPV of energy savings was approximately 145% higher under the stable scenario than that under the precarious scenario.
Figure 5, Figure 6 and Figure 7 show values of the lowest ratio of the investment costs to the NPV of the total energy savings for the different types and thicknesses of insulation materials applied to the roof, exterior walls, and ground floor. Figure 8 shows values of the lowest ratio of the investment costs to the NPV of the total energy savings for the different types of windows and doors. The error bars indicate the ratio values when assuming the need to renovate due material deterioration and worsening.
The results reveal that it is cost effective to insulate the roof with all the types of insulation materials. Additionally, it is cost effective to install any thickness under all the economic scenarios and renovation cases. This EEM gave the highest NPV for saved energy with the lowest investment costs. The ratio of the investment costs to the NPV of the total energy savings are lowest under the stable economic scenario because of the higher NPV for saved energy as a result of lower discount rates and high energy price escalation.
In contrast, it is not cost effective to incorporate any type of insulation material into the exterior walls when renovation is conducted merely for the purpose of improving the energy performance. However, under the stable scenario and the renovation case of replacing the outer façade due to deterioration, it is cost effective to place mineral wool with thicknesses of 50, 150, and 250 mm. Under the same economic scenario and renovation case, it is cost effective to install up to 100 mm of glass wool, and 100 mm thickness of EPS insulation materials on the exterior walls. This indicates the importance of incorporating EEMs along with the already needed renovation measures due to material deterioration.
The results also indicate that it is not cost effective to install insulation materials on the ground floor under all the economic scenarios. This is mainly due to the high labor and equipment costs since these multi-apartment buildings have a top concrete layer which requires drilling and relining. Moreover, due to the high cost of the insulation material type adequate for ground floors such as, foam glass, and XPS. However, for EPS insulation material, and under the stable scenario and renovation case due to deteriorated top floor, it was cost effective to install EPS insulation with 250 mm thickness.
Under the base-case scenario and renovation case merely to improve energy use, it was cost effective to install windows with U-Values of 0.8, 1.1, and 1.2 W/m2 K. For the stable scenario and both renovation cases, all the analyzed windows realized the cost effectiveness. However, under the precarious scenario and both renovation cases, it is only cost effective to replace by that with U-values of 1. W/m2 K. Moreover, it is not cost effective to replace doors under the base-case and precarious scenarios. However, it is cost effective to install doors with a U-value of 1.2 W/m2 K under the stable scenario and assuming the need to replace the existing doors due to material worsening.

Marginal Cost-Effectiveness Analysis

In the cases where all the analyzed insulation thicknesses are cost effective, marginal analysis was performed to determine the optimal insulation thickness. At which point, it is not feasible to select a higher thickness. Since all roof insulation material types realized the cost effectiveness, the one with lowest conductivity value, i.e., glass wool is selected for the marginal cost-effectiveness analysis. This is to yield the highest possible final energy savings.
In order to find the optimal thickness, we calculated the difference between the marginal energy cost saving and the corresponding marginal investment for consecutive measures for the considered elements. In this method, the ultimate target is to maximize the difference between the NPV of saved final energy cost and the total investment cost for implementing the measure. The maximum point occurs at the intersection point between the curves of marginal investments costs and marginal NPV of saved energy in the following graphs. Figure 9 show the marginal NPV of energy cost savings versus the marginal investment costs of each EEM.
Figure 9a shows that the optimal glass wool thickness under the base-case, stable, and precarious scenarios is 300, 500, and 200 mm, respectively, when assuming renovation to merely improve the energy performance. This indicates that, under the base-case scenario, selecting a thickness larger than 450 mm will yield a lower marginal NPV of energy savings than the marginal investment cost. Hence, it is more viable to apply a thickness of 450 mm than 500 mm. When assuming the renovation due to material deterioration, the optimal glass wool thickness under the base-case, stable, and precarious scenarios is 500, 500, and 300, respectively.

3.3. EEM Packages under the Different Economic Scenarios

Table 8 summarizes the packages of cost-optimal EEMs under each economic scenario with respect to both renovation cases.
As can be seen from Table 8, when assuming the renovation is done merely to improve the energy performance of the building, the cost-optimal EEMs were adding roof insulation and replacing existing windows. The optimal insulation thickness varies depending on the economic scenario. Whereas the optimal U-values for windows are identical for all economic scenarios as indicated by the marginal analysis in (Figure 9). For the other renovation case, i.e., the costs of removing the deteriorated parts are excluded from the total investment costs, it was possible to cost effectively increase the thicknesses for the roof insulation. Under this renovation case and the stable scenario, more EEMs realized the cost effectiveness where it was possible to integrate exterior walls and ground floor insulation along with changing existing windows and doors to that having a U-value of 1.1 and 1.2, respectively. These EEMs are not included under other economic scenarios and cases since they did not achieve the cost effectiveness. Figure 10 shows the final energy use before and after implementation of the cost-optimal EEM packages under the different economic scenarios. The error bars indicate the final energy use when assuming renovation mainly due to material deterioration.
The figure shows that the highest final energy savings achieved for space heating occurred under the stable economic scenario and considering the need to replace certain parts due to material deterioration and worsening. Under this economic scenario and material deterioration-related renovation case, it was possible to apply EEMs to all the building envelope elements while realizing cost effectiveness. The annual space heating demand was reduced by approximately 61% below the initial demand. Where an annual space heating demand of 49.2 kWh/m2 was achieved. Under the other economic scenarios and renovation cases, the final energy savings reached an average value of 37.6 MWh/year.

3.4. Sensitivity Analysis of the Assumed Lifespan of the EEMs

The results reflect the influence of increasing the assumed lifespan of the EEMs on the cost effectiveness. A sensitivity analysis is performed merely under the stable scenario to enhance the possibility of the EEMs becoming cost effective. A higher NPV of energy savings is achieved under this economic scenario because of the lower discount rate and high future energy price escalations. Furthermore, both renovation cases are considered in this sensitivity analysis to determine their effect on the lifespan. The lifespan at which the previously cost-ineffective EEMs become viable is provided in Table 9.
All the analyzed EEMs, except XPS and foam glass ground floor insulation, became cost effective when increasing the assumed lifespan. Most of the EEMs are already cost effective when assuming renovation due to material deterioration at the reference assumed lifespan of 50 years. Additionally, installing 1.1 U-value doors required an assumed lifespan of 70 years to achieve cost effectiveness.

4. Discussion

The cost effectiveness of different EEMs for the building envelope of a typical multi-apartment dwelling from the Million Program was analyzed in this study. Three types of insulation materials with different thermal performance levels were analyzed for the roof, exterior walls, and ground floor elements. The study included windows and doors with varying thermal transmittance and solar heat gain values. Cost-effectiveness analysis considered different economic scenarios based on different discount rates and future energy price development scenarios. A prescriptive approach was followed in the establishment of these economic scenarios. This complements the comparative methodology framework and propositions for the analysis of the cost-effective energy performance of buildings suggested by the European Commission and stated in the delegated regulation No. 244/2021 and accompanying guidelines [33]. Additionally, the total investment costs were calculated considering two different renovation cases.
This study took into account the effects of economic and environmental uncertainties such as future inflation rates and climate change effects on economic growth. This in lines with [13] which recommended focusing on these uncertainties in research concerning optimal decisions regarding the energy performance of existing buildings toward sustainability.
The energy balance simulation results demonstrated that replacing the existing windows yielded the highest final energy savings. This corroborates the findings of [14,17,22], who analyzed implementations of EEMs in multi-apartment buildings located in similar climate conditions as the studied building. This indicates the vital role of windows as the largest contributor to heat losses in buildings in winter and the potential for a broader implementation of this EEMs. Additionally, out of the three analyzed types of insulation materials, glass wool insulation gave the highest final energy savings when incorporated into the roof and exterior walls, followed by mineral wool and EPS. This mainly occurs because of the low thermal conductivity value of this insulation material. The emphasis was placed on achieving high final energy savings with modest EEMs. Since these types of buildings are usually located in suburbs where residents have a low income [27], it is vital to achieve high energy savings with the lowest investment costs. However, higher energy savings could be achieved by including active EEMs such as ventilation with heat recovery unit and solar PV panels. Further analysis should investigate the possibility of renovating these buildings to achieve nearly zero energy building levels in a cost-effective manner.
The outcomes of the cost-effectiveness analysis reveal that adding insulation to the roof resulted in the highest total NPV of energy cost savings and the lowest total investment costs. This EEM tends to be the most cost-effective measure for typical multi-apartment buildings under similar climate conditions [44]. Moreover, despite the high investment costs of window replacement, it was cost effective to replace windows with any U-values under most economic scenarios. The high final energy cost savings offset the investment costs of materials and labor. The marginal cost-effectiveness analysis results indicated that windows with a U-value of 1.2 W/m2 K were sufficient to optimally achieve cost effectiveness. Hence, the reserved costs by not selecting more expensive windows, such as those with U-values of 0.8 and 1.1 W/m2 K, may be reallocated to other EEMs. In future studies, the influence of these reserved costs on the cost effectiveness of other EEMs could be analyzed.
The difference in energy performance versus cost effectiveness between improved windows and additional mineral wool roof insulation can be attributed to different factors. Firstly, the building envelope’s configuration plays a significant role. Additionally, the initial condition of the building’s envelope is crucial. For example, in case of an insufficient roof insulation, adding mineral wool insulation can result in substantial reductions in heat losses. The investment costs of the EEM are crucial in determining their cost effectiveness. Therefore, significant disparities in materials and installation costs for the new improved windows and additional mineral wool roof insulation further contribute to the differences in energy savings versus cost effectiveness.
This study emphasizes the importance of integrating energy renovation projects into buildings when they require renovation due to deteriorated and worn-out building components. Typical muti-apartment buildings may require replacement of outer façades due to deterioration, which presents an opportunity to incorporate insulation material to improve the energy performance. In these cases, the potential of EEMs to realize cost effectiveness increases greatly. This is notably vital for the exterior walls and ground floor, which require higher costs of material and labor. These solutions may vary among buildings and depend on the specific building design and layouts. Furthermore, the sensitivity analysis results emphasized the influence of the assumed lifespan on the cost effectiveness of EEMs, which were not viable in the initial analysis. All analyzed EEMs turned cost effective when increasing the assumed lifespan under the stable economic scenario. However, this study did not consider the potential change in the thermal conductivity properties of insulation materials over a relatively longer time span due to moisture problems and this could be an area for further investigation.

5. Conclusions

The results indicated that the final energy use could be cost effectively reduced by 28–61% with respect to the economic scenarios. The highest energy savings is achieved cost effectively under the stable economic scenario and when the EEMs are combined with already needed renovation measures. In this case, the annual final energy use was reduced by approximately 7.5 kWh/m2 under this economic scenario. As a result, the energy use level achieved after implementing EEMs meets the current Swedish building standard for newly built buildings. The cost effectiveness of the passive EEMs is influenced by the economic scenarios, i.e., discount rates and energy price escalations. The main focus of this analysis was on improving the energy performance of the building envelope through the integration of cost-effective passive EEMs. Future studies could analyze the cost effectiveness of active EEMs, such as ventilation with heat recovery, efficient appliances and lighting systems, and renewable energy production units.
In summary, our findings advocate for a holistic approach to energy renovation strategies. This includes customizing strategies to the building’s specific needs, considering different economic scenarios, and addressing aspects to promote both energy efficiency and affordable housing. These recommendations can be adapted and applied in Sweden and other countries with similar building stock and energy-efficiency goals.

Author Contributions

Conceptualization, Y.B., A.D., T.N. and K.R.-G.; Methodology, Y.B., A.D., T.N. and K.R.-G.; Software, Y.B.; Validation, A.D., T.N. and K.R.-G.; Formal analysis, Y.B.; Investigation, Y.B.; Writing—original draft, Y.B.; Writing—review & editing, A.D., T.N. and K.R.-G.; Visualization, Y.B.; Supervision, A.D., T.N. and K.R.-G. All authors have read and agreed to the published version of the manuscript.

Funding

The authors gratefully acknowledge the financial support from the Association of Energy Efficient and Sustainable Buildings in the Southeast (GodaHus).

Data Availability Statement

No new data were created.

Conflicts of Interest

The authors declare that they have no known competing financial interests or personal relationships that could have appeared to influence the work reported in this paper.

Appendix A

Improved U-values, space heating demands, final energy savings, peak loads, and total and marginal investment costs of the different insulation material types and thicknesses for building envelope’s elements.
Table A1. Improved U-values, space heating demands, final energy savings, peak loads, and total and marginal investment costs of the different insulation material types and thicknesses for the roof.
Insulation Material TypeThickness [mm]U-Value
[W/m2 K]
Space Heating Demand
[mwh/Year]
Final Energy Savings
[mwh/Year]
Peak Load
[kw]
Total Investment Assuming Energy Renovation [kEuro]Marginal Investment Assuming Energy Renovation [kEuro]Total Investment Excluding the Replacement Costs of Any Deteriorated Parts [kEuro]Marginal Investment Excluding the Replacement Costs of Any Deteriorated Parts [kEuro]
Reference-0.510126.77-63.14----
Mineral wool500.299119.737.0461.807.50-2.70-
1000.211116.979.8161.118.881.384.081.38
1500.163115.2411.5360.6610.001.125.201.12
2000.133113.9312.8560.3011.111.126.311.12
2500.112113.1113.6660.0912.231.127.431.12
3000.097112.1814.6059.8313.611.388.811.38
3500.086111.7914.9959.6414.721.129.931.12
4000.077111.2515.5359.5216.101.3811.311.38
4500.069110.6516.1259.3417.491.3812.691.38
5000.063109.8616.9159.2218.871.3814.071.38
Glass wool500.288119.437.3461.767.84-3.04-
1000.201116.6410.1361.069.571.724.771.72
1500.154114.9411.8360.6411.031.466.231.46
2000.125113.6613.1160.3112.491.467.691.46
2500.105112.8613.9160.0513.941.469.151.46
3000.091111.9514.8259.8615.671.7210.871.72
3500.080111.5915.1959.7917.131.4612.331.46
4000.071111.0615.7159.5418.851.7214.051.72
4500.064110.4916.2959.4720.571.7215.781.72
5000.058109.7017.0759.2722.301.7217.501.72
EPS500.510119.856.9361.867.68-2.88-
1000.303117.089.6961.179.241.564.441.56
1500.215115.3411.4360.7410.531.305.741.30
2000.167114.0312.7560.3811.831.307.031.30
2500.136113.1913.5860.1713.131.308.331.30
3000.115112.2514.5259.9114.681.569.891.56
3500.099111.8514.9259.8115.981.3011.181.30
4000.088111.3115.4759.5917.541.5612.741.56
4500.078110.7116.0659.5419.101.5614.301.56
5000.071109.9216.8659.3120.661.5615.861.56
Table A2. Improved U-values, space heating demands, final energy savings, peak loads, and total and marginal investment costs of the different insulation material types and thicknesses for the exterior walls under both renovation cases.
Insulation Material TypeThickness [mm]U-Value
[W/m2 K]
Space Heating Demand
[mwh/Year]
Final Energy Savings
[mwh/Year]
Peak Load
[kw]
Total Investment Assuming Energy Renovation [kEuro]Marginal Investment Assuming Energy Renovation [kEuro]Total Investment Excluding the Replacement Costs of Any Deteriorated Parts [kEuro]Marginal Investment Excluding the Replacement Costs of Any Deteriorated Parts [kEuro]
Reference-0.320126.77-63.14----
Mineral wool500.221121.285.4962.1740.48-16.25-
1000.157121.135.6462.0951.6611.1827.4411.18
1500.136116.979.861.2062.8411.1838.6211.18
2000.115115.2411.5360.7873.3010.4649.0810.46
2500.099113.9112.8660.5085.3912.0961.1712.09
3000.087112.7813.9960.2495.8510.4671.6310.46
3500.078111.8514.9260.07107.3411.4883.1111.48
4000.070110.8915.8859.83118.4011.0694.1711.06
4500.064110.5416.2359.77129.8811.48105.6611.48
5000.059109.6517.1259.54141.3711.48117.1411.48
Glass wool500.215121.025.7562.1341.07-16.84-
1000.162118.328.4561.5652.8411.7728.6111.77
1500.130116.6510.1261.2264.6111.7740.3911.77
2000.115114.9511.8260.8075.6611.0551.4311.05
2500.093113.6213.1560.5288.3312.6764.1112.67
3000.082112.5214.2560.2799.3811.0575.1611.05
3500.073111.6115.1660.09111.4612.0787.2312.07
4000.065110.6616.1159.86123.1111.6598.8811.65
4500.060110.3316.4459.83135.1812.07110.9512.07
5000.055109.7017.0759.60147.2512.07123.0312.07
EPS500.256123.263.5162.6140.80-16.58-
1000.171118.748.0361.6452.3111.5128.0911.51
1500.139117.079.761.2763.8211.5139.6011.51
2000.117115.3511.4260.8774.6110.7950.3810.79
2500.101114.0012.7760.5987.0212.4162.8012.41
3000.089112.8713.960.3297.8110.7973.5810.79
3500.079111.9414.8360.11109.6211.8185.3911.81
4000.072110.9715.8059.87121.0011.3996.7811.39
4500.065110.6216.1559.83132.8111.81108.5911.81
5000.060109.7217.0559.63144.6211.81120.4011.81
Table A3. Improved U-values, space heating demands, final energy savings, peak loads, and total and marginal investment costs of the different insulation material types and thicknesses for the ground floor under both renovation cases.
Insulation Material TypeThick-Ness [mm]U-Value
[W/m2 K]
Space Heating Demand
[mwh/Year]
Final Energy Savings
[mwh/Year]
Peak Load
[Kw]
Total Investment Assuming Energy Renovation [kEuro]Marginal Investment Assuming Energy Renovation [kEuro]Total Investment Excluding the Replacement Costs of Any Deteriorated Parts [kEuro]Marginal Investment Excluding the Replacement Costs of Any Deteriorated Parts [kEuro]
Reference-2.700126.77-63.14----
Foam glass500.730124.971.8063.1220.31-9.57-
1000.422124.132.6462.9729.509.1918.769.19
1500.297123.643.1362.8939.159.6528.419.65
2000.229122.933.8462.7654.6915.5543.9615.55
2500.186122.504.2762.6863.618.9252.888.92
3000.157122.114.6662.6173.9910.3863.2610.38
3500.136121.775.0062.5482.928.9272.188.92
4000.120121.535.2562.5094.6811.7783.9511.77
4500.107121.385.3962.47104.539.8593.809.85
5000.096121.055.7262.36115.9011.37105.1711.37
EPS500.581124.422.3663.0013.12-7.75-
1000.326123.802.9762.9315.122.009.752.00
1500.226123.293.4862.8517.582.4612.212.46
2000.173122.574.2062.7125.938.3615.202.99
2500.140122.134.6462.6327.671.7316.941.73
3000.118121.765.0262.5630.863.1920.123.19
3500.102121.425.3562.5032.591.7321.861.73
4000.089121.205.5762.4537.174.5826.444.58
4500.080121.075.7162.4339.832.6629.102.66
5000.072120.606.1762.3344.014.1833.284.18
XPS500.543124.662.1263.0716.83-11.46-
1000.302123.703.0762.9122.535.7117.175.71
1500.209123.183.6062.8328.716.1723.346.17
2000.160122.803.9862.7535.416.7030.046.70
2500.130122.024.7562.6240.855.4435.485.44
3000.109121.655.1262.5347.756.9042.386.90
3500.094121.335.4562.4753.195.4447.825.44
4000.082121.105.6762.4361.488.2956.118.29
4500.074120.975.8062.4167.856.3762.486.37
5000.066120.656.1262.3575.747.8970.377.89
Table A4. Improved U-values, space heating demands, final energy savings, peak loads, and total and marginal investment costs of the different types of windows and doors under both renovation cases.
OpeningU-Value
[W/m2 K]
Space Heating Demand
[mwh/Year]
Final Energy Savings
[mwh/Year]
Peak Load
[kw]
Total Investment Assuming Energy Renovation [kEuro]Marginal Investment Assuming Energy Renovation [kEuro]Total Investment Excluding the Replacement Costs of Any Deteriorated Parts [kEuro]Marginal Investment Excluding the Replacement Costs of Any Deteriorated Parts [kEuro]
Reference2.90 (windows)/3.00 (doors)126.77-63.14----
Windows1.80101.8824.9056.7747.69-43.26-
1.20100.5026.2755.1756.558.8652.128.86
1.1099.4427.3354.6563.827.2759.397.27
0.8097.1129.6653.6184.7620.9480.3320.94
Doors1.20116.999.7960.9945.15-35.31-
1.10116.7210.0660.8555.9010.7546.0610.75

Appendix B

NPV of the total energy savings for the different types and thicknesses of building envelope’s elements materials under the different economic scenarios.
Table A5. NPV of the total energy savings for the different types and thicknesses of roof insulation materials under the different economic scenarios (the improved U-values are listed in Table 6).
Insulation Material TypeThickness [mm]NPV of the Total Energy Savings [kEuro]
PrecariousBase CaseStable
Mineral wool5010.7416.1426.25
10015.4623.2537.81
15018.4427.7345.11
20020.7631.2350.79
25022.1733.3554.24
30023.8335.8458.30
35024.7737.2560.59
40025.6438.5662.72
45026.7240.1965.39
50027.8041.8368.07
Glass wool5011.1516.7727.27
10015.9223.9538.95
15018.8028.2745.98
20021.0031.5951.37
25022.5433.8955.13
30023.9736.0458.62
35024.5336.8960.00
40025.7638.7563.02
45026.5039.8764.86
50027.8141.8568.10
EPS5010.4615.7325.58
10015.1722.8237.11
15018.1227.2444.31
20020.4430.7449.99
25021.8632.8853.48
30023.5335.3857.55
35024.2136.4159.22
40025.3838.1762.08
45026.0839.2363.82
50027.4841.3567.29
Table A6. NPV of the total energy savings for the different types and thicknesses of exterior wall insulation materials under the different economic scenarios (the improved U-values are shown in Table 7).
Insulation Material TypeThickness [mm]NPV of the Total Energy Savings [kEuro]
PrecariousBase CaseStable
Mineral wool508.9713.5021.98
1009.3714.1222.98
15016.5024.8440.44
20019.6029.5148.04
25023.5337.7867.81
30023.8535.9158.47
35025.3638.1862.16
40027.1040.8066.42
45027.6441.6367.78
50029.2544.0671.76
Glass wool509.3614.1022.95
10013.9721.0434.25
15016.7925.2741.15
20019.8729.9148.70
25022.1233.3154.23
30024.0636.2258.97
35025.5738.5062.68
40027.2741.0666.85
45027.7141.7367.94
50029.2944.1271.86
EPS505.528.3213.54
10013.2820.0032.55
15016.1824.3739.67
20019.2228.9447.12
25021.5032.3752.70
30023.5235.4157.65
35025.1437.8661.63
40026.8940.4965.93
45027.3941.2467.15
50028.9143.5670.94
Table A7. NPV of the total energy savings for the different types and thicknesses of ground floor insulation materials under the different economic scenarios (the improved U-values are listed in Table 8).
Insulation Material TypeThickness [mm]NPV pf the Total Energy Savings [kEuro]
PrecariousBase CaseStable
Foam glass502.263.425.57
1003.545.338.67
1504.276.4210.46
2005.388.1013.19
2506.069.1214.84
3006.6610.0216.32
3507.2110.8517.67
4007.5711.4018.57
4507.2210.8617.68
5008.3112.5220.39
XPS502.744.136.73
1004.166.2610.19
1504.927.4112.06
2005.538.3213.55
2506.7210.1116.47
3007.3511.0718.02
3507.8611.8419.27
4008.2012.3520.11
4508.3812.6220.56
5008.8813.3721.78
EPS503.204.837.86
1003.996.019.79
1504.757.1511.63
2005.908.8814.46
2506.579.9016.11
3007.1610.7817.56
3507.6811.5618.82
4008.0512.1219.73
4508.2312.4020.19
5009.0013.5522.08
Table A8. NPV of the total energy savings for the different types of windows and doors under the different economic scenarios.
OpeningU-ValueNPV pf the Total Energy Savings [kEuro]
[W/m2 K]PrecariousBase CaseStable
Windows1.845.9669.20112.66
1.253.2480.16130.51
1.156.0784.42137.43
0.861.6092.68150.83
Doors1.217.0325.6441.75
1.117.7326.7043.46

References

  1. European Commission. Focus on Energy Efficiency in Buildings. 2020. Available online: https://commission.europa.eu/news/focus-energy-efficiency-buildings-2020-02-17_en (accessed on 21 December 2020).
  2. The European Parliament and the Council of the European Union. Directive 2010/31/EU of the European Parliament and of the Council of 19 May 2010 on the Energy Performance of Buildings (Recast); Official Journal of the European Union: Strasbourg, France, 2010. [Google Scholar]
  3. Swedish Energy Agency. Energy in Sweden 2020, An Overview of Energy in Sweden; Energimyndigheten: Eskilstuna, Sweden, 2010. [Google Scholar]
  4. Ministry of Sustainable Development. National Programme for Energy Efficiency and Energy-Smart Construction; Regeringskansliet: Stockholm, Sweden, 2006. [Google Scholar]
  5. Mata, É.; Sasic Kalagasidis, A.; Johnsson, F. Energy usage and technical potential for energy saving measures in the Swedish residential building stock. Energy Policy 2013, 55, 404–414. [Google Scholar] [CrossRef]
  6. Statistics Sweden. Number of Dwellings by Region, Type of Building and Period of Construction; Statistical Database, Official Statistics of Sweden: Solna, Sweden, 2021; Available online: https://www.scb.se (accessed on 13 July 2021).
  7. Farahani, A.S. Maintenance, Renovation and Energy Efficiency in the Swedish Multi-Family Housing Market; Department of Civil and Environmental Engineering, Division of Building Services Engineering, Chalmers University of Technology: Gothenburg, Sweden, 2017. [Google Scholar]
  8. Končalović, D.; Nikolic, J.; Vukasinovic, V.; Gordić, D.; Živković, D. Possibilities for Deep Renovation in Multi-Apartment Buildings in Different Economic Conditions in Europe. Energies 2022, 15, 2788. [Google Scholar] [CrossRef]
  9. Baldini, M.; Brøgger, M.; Jacobsen, H.K.; Wittchen, K.B. Cost-effectiveness of energy efficiency improvements for a residential building stock in a Danish district heating area. Energy Effic. 2020, 13, 1737–1761. [Google Scholar] [CrossRef]
  10. Dodoo, A.; Gustavsson, L.; Tettey, U.Y.A. Cost-optimized energy-efficient building envelope measures for a multi-storey residential building in a cold climate. Energy Procedia 2019, 158, 3760–3767. [Google Scholar] [CrossRef]
  11. Gustavsson, L.; Dodoo, A.; Truong, N.L.; Danielski, I. Primary energy implications of end-use energy efficiency measures in district heated buildings. Energy Build. 2011, 43, 38–48. [Google Scholar] [CrossRef]
  12. Lidelöw, S.; Örn, T.; Luciani, A.; Rizzo, A. Energy-efficiency measures for heritage buildings: A literature review. Sustain. Cities Soc. 2019, 45, 231–242. [Google Scholar] [CrossRef]
  13. Hashempour, N.; Taherkhani, R.; Mahdikhani, M. Energy performance optimization of existing buildings: A literature review. Sustain. Cities Soc. 2020, 54, 101967. [Google Scholar] [CrossRef]
  14. Bonakdar, F.; Dodoo, A.; Gustavsson, L. Cost-optimum analysis of building fabric renovation in a Swedish multi-story residential building. Energy Build. 2014, 84, 662–673. [Google Scholar] [CrossRef]
  15. Wang, Q.; Holmberg, S. A methodology to assess energy-demand savings and cost effectiveness of retrofitting in existing Swedish residential buildings. Sustain. Cities Soc. 2015, 14, 254–266. [Google Scholar] [CrossRef]
  16. Dodoo, A.; Gustavsson, L.; Truong, N.L. Primary energy benefits of cost-effective energy renovation of a district heated multi-family building under different energy supply systems. Energy 2018, 143, 69–90. [Google Scholar] [CrossRef]
  17. Dodoo, A.; Gustavsson, L.; Tettey, U.Y.A. Final energy savings and cost-effectiveness of deep energy renovation of a multi-storey residential building. Energy 2017, 135, 563–576. [Google Scholar] [CrossRef]
  18. Niemelä, T.; Kosonen, R.; Jokisalo, J. Cost-effectiveness of energy performance renovation measures in Finnish brick apartment buildings. Energy Build. 2017, 137, 60–75. [Google Scholar] [CrossRef]
  19. Ekström, T.; Blomsterberg, Å. Renovation of Swedish Single-family Houses to Passive House Standard—Analyses of Energy Savings Potential. Energy Procedia 2016, 96, 134–145. [Google Scholar] [CrossRef]
  20. Moran, P.; O’Connell, J.; Goggins, J. Sustainable energy efficiency retrofits as residenial buildings move towards nearly zero energy building (NZEB) standards. Energy Build. 2020, 211, 109816. [Google Scholar] [CrossRef]
  21. Hu, X.; Jokisalo, J.; Kosonen, R.; Lehtonen, M.; Shao, T. Cost-Optimal Renovation Solutions for Detached Rural Houses in Severe Cold Regions of China. Buildings 2023, 13, 771. [Google Scholar] [CrossRef]
  22. Blázquez, T.; Dalla Mora, T.; Ferrari, S.; Romagnoni, P.; Teso, L.; Zagarella, F. Renovating Building Groups in the Mediterranean Climate: Cost-Effectiveness of Renewable-Based Heating Alternatives in the Italian Context. Sustainability 2022, 14, 12303. [Google Scholar] [CrossRef]
  23. Valančius, K.; Grinevičiūtė, M. Reconstruction of Soviet-Type Building to Energy Class A—Simulation and Actual Data Validation. Buildings 2023, 13, 353. [Google Scholar] [CrossRef]
  24. Yang, X.; Chen, Z.; Zou, Y.; Wan, F. Improving the Energy Performance and Economic Benefits of Aged Residential Buildings by Retrofitting in Hot–Humid Regions of China. Energies 2023, 16, 4981. [Google Scholar] [CrossRef]
  25. Johansson, T.; Olofsson, T.; Mangold, M. Development of an energy atlas for renovation of the multifamily building stock in Sweden. Appl. Energy 2017, 203, 723–736. [Google Scholar] [CrossRef]
  26. Farahani, A.; Wallbaum, H.; Dalenbäck, J.O. The importance of life-cycle based planning in maintenance and energy renovation of multifamily buildings. Sustain. Cities Soc. 2019, 44, 715–725. [Google Scholar] [CrossRef]
  27. Thomas, H.; Sonja, V. The Million Homes Programme: A review of the great Swedish planning project. Plan. Perspect. 2005, 20, 301–328. [Google Scholar] [CrossRef]
  28. Boussaa, Y.; Dodoo, A.; Nguyen, T.; Rupar-Gadd, K. Comprehensive renovation of a multi-apartment building in Sweden: Techno-economic analysis with respect to different economic scenarios. Build. Res. Inf. 2023, 1–16. [Google Scholar] [CrossRef]
  29. Leng, G.; Zhang, X.; Shi, T.; Chen, G.; Wu, X.; Liu, Y.; Fang, M.; Min, X.; Huang, Z. Preparation and properties of polystyrene/silica fibres flexible thermal insulation materials by centrifugal spinning. Polymer 2019, 185, 121964. [Google Scholar] [CrossRef]
  30. Burström, P.; Nilvér, K. Byggnads Material. Tillverkning, Egenskaper Och Användning [Building Materials. Development, Properties and Use; Studentlitteratur AB.: Lund, Sweden, 2018. [Google Scholar]
  31. Wikells Byggberäkningar AB. Sektionsfakta—ROT: Teknisk-Ekonomisk Sammanställning av ROT-Byggdelar för 21–22 år [Section Facts-ROT: Technical and Economic Compilation of Renovation, Refurbishment]; Wikells Byggberäkningar AB: Växjö, Sweden, 2022. [Google Scholar]
  32. FOAMGLAS Nordic AB. Foamglas Cellglasisolering. 2023. Available online: https://www.foamglas.com/sv-se/produkter/ (accessed on 12 January 2023).
  33. European Commission. Regulations, Commission Delegated Regulation (EU) No 244/2012 of 16 January 2012 Supplementing Directive 2010/31/EU of the European Parliament and of the Council on the Energy Performance of Buildings by Establishing a Comparative Methodology Framework for Calculating Cost-Optimal Levels of Minimum Energy Performance Requirements for Buildings and Building Elements; Official Journal of the European Union: Strasbourg, France, 2012. [Google Scholar]
  34. VEAB. Prislista Fjärrvärme [Price List for District Heating]; VEAB: Växjö, Sweden, 2022. [Google Scholar]
  35. European Central Bank. Euro Reference Exchange Rate: Swedish Krona (SEK); ECB: Frankfurt, Germany, 2021; Available online: https://sdw.ecb.europa.eu/quickview.do?SERIES_KEY=120.EXR.D.SEK.EUR.SP00.A (accessed on 1 June 2021).
  36. Rubel, F.; Kottek, M. Observed and projected climate shifts 1901-2100 depicted by world maps of the Köppen-Geiger climate classification. Meteorol. Z. 2010, 19, 135–141. [Google Scholar] [CrossRef]
  37. EQUA Simulation AB. IDA Indoor Climate and Energy. 2020. Available online: https://www.equa.se/en/about-us/about-equa (accessed on 12 March 2020).
  38. StruSoft AB. VIP-Energy Program. 2020. Available online: https://www.vipenergy.net/English_Home.htm (accessed on 18 March 2021).
  39. ISO 10211:2017; Thermal Bridges in Building Construction—Heat Flows and Surface Temperatures—Detailed Calculations. International Organization for Standardization: Geneva, Switzerland, 2017. Available online: https://www.iso.org/standard/65710.html (accessed on 22 December 2021).
  40. Meteonorm. METEONORM 7: Global Meteorological Database for Engineers, Planners and Education. 2019. Available online: https://meteonorm.com/en/ (accessed on 27 January 2020).
  41. Zou, Y. Classification of Buildings with Regard to Airtightness; Department of Civil and Environmental Engineering, Chalmers University of Technology: Gothenburg, Sweden, 2010. [Google Scholar]
  42. Boverket. Byggregler Föreskrifter och Allmänna Råd i Boverkets Byggregler [Building Regulations, Regulations and General Advice in the Housing Authority’s Building Regulations]; National Board of Housing, Building and Planning: Karlskrona, Sweden, 2021; Available online: https://www.boverket.se/sv/PBL-kunskapsbanken/regler-om-byggande/boverkets-byggregler/om-bbr/foreskrifter-och-allmanna-rad/#:~:text=BBR%20inneh%C3%A5ller%20regler%20i%20form,allm%C3%A4nna%20r%C3%A5d%20inom%20sitt%20verksamhetsomr%C3%A5de (accessed on 1 August 2021).
  43. SVEBY. Brukarindata Böstader [User Data in Buildings]; SVEBY, Branschstandard för Energi i Byggnader: Stockholm, Sweden, 2012; Available online: https://www.sveby.org/wp-content/uploads/2011/06/brukarindata_bostader.pdf (accessed on 26 December 2020).
  44. Bonakdar, F.; Sasic Kalagasidis, A.; Mahapatra, K. The Implications of Climate Zones on the Cost-Optimal Level and Cost-Effectiveness of Building Envelope Energy Renovation and Space Heat Demand Reduction. Buildings 2017, 7, 39. [Google Scholar] [CrossRef]
Figure 1. Overview of the approach followed in this analysis.
Buildings 13 02654 g001
Figure 2. Case-study building located in Växjö, Sweden.
Buildings 13 02654 g002
Figure 3. Three-dimensional view of the case-study building constructed by the IDA-ICE simulation tool.
Buildings 13 02654 g003
Figure 4. Final energy use for space and domestic hot water heating before EEM implementation.
Buildings 13 02654 g004
Figure 5. Cost-effectiveness ratio of the analyzed insulation materials for the roof.
Buildings 13 02654 g005
Figure 6. Cost-effectiveness ratio of the analyzed insulation materials for the exterior walls.
Buildings 13 02654 g006
Figure 7. Cost-effectiveness ratio of the analyzed insulation materials for the ground floor.
Buildings 13 02654 g007
Figure 8. Cost-effectiveness ratio of the analyzed windows and doors.
Buildings 13 02654 g008
Figure 9. Marginal cost-effectiveness analysis to determine the optimal thickness of glass wool for the roof for the two cases of investment. (a) Renovation merely to improve energy performance. (b) Renovation due to material deterioration.
Buildings 13 02654 g009aBuildings 13 02654 g009b
Figure 10. Space heating demand before and after implementation of the cost-optimal EEM packages under the different economic scenarios.
Buildings 13 02654 g010
Table 1. Summary of the reviewed articles with key findings.
ReferencePassive EEMs StudiedVariations Insulation TypeRenovation CasesKey Findings and Conclusions
[14]New windows of different thermal transmittance values (U-values)and different thicknesses of extra insulation for exterior and basement walls and attic floor.NoSingle
  • Renovating the multi-apartment building to passive criteria is not cost-effective in one of the economic scenarios.
  • It is possible to renovate to achieve the Swedish building code requirements.
[15]New insulation material for exterior and interior walls. Extra insulation layers for ground floors, and for ducts and hot water pipes. Existing windows replacements with high-performance alternatives. Solar shading devices. Sealing of cracks and air leakages in joists.NoSingle
  • Retrofits that yield high energy savings are not always the most cost-effective.
  • Payback period of energy retrofit is strongly influenced by building type.
  • In-depth investigation of the building typology contributes to the retrofitting strategic decisions.
  • Rankings of retrofits in terms of energy and financial performances simplifies the design of retrofitting.
[17]Improved thermal insulations for the attic floor, basement walls and exterior walls. Efficient windows and doors.NoSingle
  • Assumed economic parameters, e.g., real discount rates and energy price increase, play an important role in the optimization of EEMs.
  • Space heat savings achieved for implementation of improved new windows are substantially greater than that for glazed enclosed balcony systems.
[18]Additional thermal insulation thickness for external walls and roof elements. Replacement of old windows with new ones that have U-value of 1.0 or 0.8 W/m2 KNoSingle
  • EEMs should include high performance renewable energy production systems to enhance cost effectiveness.
  • Financial incentives may motivate building owners to perform deep renovation of existing buildings.
[16]Attic insulation improvement, basement walls and exterior walls insulation improvement. Improved windows. NoSingle
  • Heat demand in existing Swedish building could be halved while electricity use may be reduced considerably with cost-effective energy renovation measures.
  • Exterior walls insulation improvement is the least cost effective of the studied renovation measures.
  • Economic viability of the renovation measures is sensitive to the economic parameters such as discount rates and energy price increase.
[19]Addition of insulation to external walls, cellar walls, roof, and foundation. Replacement of existing doors with new ones that have U-values of 1.2 and 0.8 W/m2 K. NoSingle
  • Package of renovation measures that achieve the passive house standard is cost effective for direct electric heated houses.
  • Installation of new windows is the least cost effective of the studied renovation measures.
[20]Roof and wall insulation improvements, and window and door replacements.YesSingle
  • Cost-optimal approach is effective for identification of retrofit packages that are among the best alternatives.
  • Environmental impact of the electricity grid plays a significant role in the ranking of the examined retrofit packages for the Irish context.
[21]Expanded polystyrene (EPS) insulation and extruded polystyrene (XPS) insulation for ground floor and exterior walls. Installation of new efficient windows and doors.YesSingle
  • The ideal solution for each assessed site fails to deliver cost effectiveness throughout the building’s lifespan.
  • The implementation of further subsidies or incentives, such as carbon taxes and initial subsidies, becomes essential.
[22]EPS external thermal insulation composite system (ETICS) on the existing façades. Insulation of distribution pipes. Replacement of the existing windows with low-e double and triple glazed ones.YesDouble
  • In general, insulating the building envelopes is only cost effective in the colder climates.
  • To enhance the cost effectiveness, the building envelope should be insulated prior to installation of active EEMs such as, decentralized low-temperature air-to-water heat pumps with PV.
[23]Renewing the passive (external envelopes) parts of the building, i.e., replacing the heated walls, roof, and windows with new ones.NoSingle
  • The refurbishment of the building’s exterior shell, encompassing walls, window frames, glazing, and the roof, which involved insulating the outer walls and ceiling, as well as replacing old windows with new ones, had a substantial influence on the building’s energy efficiency.
  • High heat energy savings in the building after modernization as a result of 72% reduction in the wall heat transfer coefficient, approximately 68% in the roof, and a reduction of 25% in the overall heat losses through windows.
[24]Incorporating insulation to roof element. Replacing exiting windows and installation of overhangs.NoSingle
  • The economic advantages of retrofitting for residents play a pivotal role in curbing energy consumption and achieving carbon emission targets for existing buildings.
  • Although extensive retrofitting to mitigate carbon emissions is a desirable goal, residents may be discouraged by the significant upfront costs and uncertain prospects of future energy savings, especially if they anticipate a short stay in the building, making it unlikely to realize substantial savings.
  • To ensure energy security and ecological preservation, it is advisable to incorporate long-term cost effectiveness into renovation planning.
Table 2. Thermal properties of the analyzed insulation materials.
Insulation MaterialThermal Conductivity
[W/m K]
Density
[kg/m3]
Specific Heat Capacity
[J/kg K]
Glass wool0.03316640
EPS0.037201000
XPS0.034321000
Mineral wool0.03690840
Foam glass0.0501651000
Table 3. Characteristics of the analyzed windows [31].
U-Value
[W/m2 K]
Solar Heat Gain Coefficient
(G-Value)
Solar Transmittance
(T)
Visible Transmittance
(Tvis)
Glass Panes Frame
1.80.680.600.74DoubleWooden frame
1.20.460.420.70TripleAluminum-coated wood
1.10.450.380.70TripleAluminum-coated wood
0.80.400.380.70Triple Aluminum-coated wood
Table 4. Considered economic scenarios.
Economic ParameterScenario
PrecariousBase CaseStable
Discount rate [%]432
Annual energy price increase [%]123
Table 5. District heating prices in Växjö [34].
ParameterValueNote
Capacity cost [Euro/kW year]119.02For the range 50–74 kW. The capacity is determined based on the daily average demand during November–March for the outdoor temperature of −10 °C.
Energy cost [Euro/kWh] The price applies to each kWh of district heating used. The prices vary between the seasons.
  ● 1 November–31 March0.044
  ● 1 April–31 October0.026
Pumping cost [Euro/m3] Based on the volume of district heating water being circulated. The flow fee is charged only during the winter period.
  ● 1 November–31 March0.504
  ● 1 April–31 October0
Table 6. Total areas and U-values of the building envelope elements.
Building Envelope ElementU-Value
[W/m2 K]
Total Area
[m2]
Description
Doors3.0054.7Wooden exterior doors
Windows2.90135.5Double pane windows with wooden frames
Roof0.51407.7Flat concrete roof with existing insulation of 50 mm mineral wool (λ = 0.04 W/m K)
Ground floor2.70407.7Non-insulated concrete slab
Exterior walls0.32653.4Pre-fabricated concrete walls with existing insulation of 100 mm mineral wool (λ = 0.04 W/m K)
Table 7. Main key data and assumptions considered in the energy simulation.
ParameterValueNotes
Indoor temperature set points: According to the Swedish building code [42]
  - Living areas21 °C
  - Common areas18 °C
Controlled air flow of central ventilation unit0.35 l/s m2According to the Swedish building code [42]
Internal heat gain values Constant profile throughout the year, based on the SVEBY program [43]
  - Tenants1.0 W/m2
  - Equipment and lighting3.0 W/m2
Table 8. Cost-effective EEM packages under each economic scenario considering both renovation purposes.
Economic ScenarioRenovation Case
Merely to Improve the Energy PerformanceDue to Material Deterioration and Worsening
PrecariousRoof: 200 mm glass wool
Windows: 1.2 W/m2 K
Roof: 300 mm glass wool
Windows: 1.2 W/m2 K
Base caseRoof: 300 mm glass wool
Windows: 1.2 W/m2 K
Roof: 500 mm glass wool
Windows: 1.2 W/m2 K
StableRoof: 500 mm glass wool
Windows: 1.2 W/m2 K
Roof: 500 mm glass wool
Walls: 250 mm mineral wool
Ground floor: 250 EPS
Windows:1.1 W/m2 K
Doors: 1.2 W/m2 K
Table 9. Summary of the lifespans at which the previously cost-ineffective EEMs become economically viable.
Building Envelope ElementInsulation Type or Door U-Value [W/m2 K]Lifespan at Which Cost Effectiveness Is Realized [Year]Cost-Effective Thickness [mm]
Renovating merely to improve the energy performance of the building
Exterior wallsMineral wool80(150–300)
Glass wool80(100–250)
EPS80(100–250)
Doors1.260-
1.170-
Renovating due to material deterioration and worsening
Doors1.160-
Disclaimer/Publisher’s Note: The statements, opinions and data contained in all publications are solely those of the individual author(s) and contributor(s) and not of MDPI and/or the editor(s). MDPI and/or the editor(s) disclaim responsibility for any injury to people or property resulting from any ideas, methods, instructions or products referred to in the content.

