Article

Exploring the Limitations of Pedestrian Route Directness: A Correlation between Sensitivity and Radius Variability

1
Civil Infrastructure and Environmental Engineering Department, College of Engineering, Khalifa University of Science and Technology, Abu Dhabi P.O. Box 127788, United Arab Emirates
2
Architectural Engineering Department, College of Engineering, United Arab Emirates University, Alain P.O. Box 15551, United Arab Emirates
3
Faculty of Engineering, Northwestern College, Orange City, IA 51041, USA
*
Authors to whom correspondence should be addressed.
Buildings 2023, 13(10), 2612; https://doi.org/10.3390/buildings13102612
Submission received: 31 August 2023 / Revised: 27 September 2023 / Accepted: 30 September 2023 / Published: 17 October 2023

Abstract

:
Amid the growing emphasis on the environmental and health benefits of walking, enhanced network connectivity emerges as a significant determinant in promoting pedestrian activity, as proven by scholars statistically and theoretically. Recent academic endeavors have introduced metrics such as pedestrian route directness (PRD) to measure connectivity, which maps the directness of routes between critical origins and destinations of the urban layout. However, there have been concerns from scholars about the limitations of PRD in theory, especially its sensitivity to larger radii of analysis. Addressing this theoretical inconsistency, this paper employs Pearson’s correlation and linear regression analysis to explore the correlation between the radius of analysis and variance of results, the significance of this correlation for subsequent research, and the geographical context’s influence on metric selection. The findings have revealed an r-value of −0.82, suggesting a strong and negative correlation. Moreover, the p-value of 0.0003 demonstrates the significance of the correlation and the rejection of the null hypothesis. These results bridge the gap between theoretical discussions and empirical analysis, revealing that, as the analysis radius expands, the sensitivity of results diminishes. The findings of this study hold significant implications for policy development and regulation of PRD, offering crucial insights that particularly advance the field of street connectivity.

1. Introduction

Researchers and urban planners such as Cervero and Kockelman (1997) [1], Ewing and Cervero (2001) [2], Dill (2004) [3], and Hamidi et al. (2015) [4] are showing a growing interest in street connectivity, due to its potential to enhance transportation efficiency. This includes promoting walking, which lowers CO2 emissions, reduces air pollution, and minimizes fossil fuel consumption, thereby improving ambient air quality and consequently, enhancing public health [4,5]. Street networks, encompassing features like street connectivity, directness of routing, and block sizes, form the essence of urban design [2]. At the heart of these networks is the concept of connectivity, which comprises the extent to which spaces integrate seamlessly with their surroundings [6]. Connected streets offer more opportunities for walking, therefore enhancing physical activity, and reducing ailments like diabetes, cholesterol, heart disease, and obesity [7,8]. As the scholarly focus on connectivity grows, the development of instruments to quantify it has seen a corresponding surge. The current literature now features a diverse array of metrics, encompassing pedestrian route directness, space syntax, multiple centrality indicators, and node-to-road ratios, among others, signaling a dynamic and expanding field of inquiry. However, the studies on the impact of street connectivity and methods to measure it have not yet been conclusive. While numerous studies identify a positive relationship between topological metrics and street connectivity, many of these associations, though widely applied, are mostly subjective to the studied area [9]. Stangl [9] suggests that there are no standard methods to measure street connectivity. Despite this, theories and other ways of gauging street connectivity have steered much of the research, yet efficient methods have been elusive.
Pedestrian route directness (PRD) is one of the metrics introduced to assess connectivity within transportation and street networks. PRD was first introduced to the street network by Paul Hess [10]. PRD characterizes a certain location on the network by calculating the ratio of the actual path distance to the straight-line distance between an origin and a destination [10]. A lower PRD value indicates greater connectivity, with the lowest possible value being 1.00, as actual distance then equals ‘as the crow flies’ [3]. While it has been regarded by many urban planners as an optimal tool for measuring street efficiency and has been incorporated into regulatory codes, critics argue that PRD has limitations in route directness assessment against the size of the studied areas. Stangl [9] has discussed how distance influences the PRD value. He proved that the more extensive the distance between origins and destinations, the less accurate the PRD assessment is. This foundational work was augmented through ensuing research works by Ellis et al. [11] and Stangl [12], which further underscored the limitations of PRD along with other connectivity metrics, providing additional statistical evidence of the drawbacks of the metric. Several researchers, adhering to Stangl’s theory, restricted their study area to a 3 km radius [13,14,15], while others emulated Stangl’s testing methodology, fixing both parcel size and street density to evaluate network patterns. This study delves into the imperfections of the PRD metric, providing more statistical insights into such limitations.
The novelty of this paper lies in its three significant academic contributions to the field. Firstly, this article adds to the literature by providing an extensive review of PRD. Previous studies have merely reviewed PRD, along with other metrics, under the concept of connectivity, and only a handful have addressed PRD’s limitations through theoretical and observational methods. Secondly, by delving deeply into the pedestrian route directness’ complexities, this study aims to shed light on the existing inconsistencies and their practical application. This effort surpasses a rudimentary understanding of PRD and paves the way for an enriched, evidence-based assessment of its viability. Such a comprehensive understanding has been achieved through rigorous statistical methodologies, including regression analysis and ANOVA. These tools have been instrumental in determining the metric’s reliability amidst the contemporary urban planning discourse. Thirdly, the statistical rigor of this research serves a dual purpose. Beyond establishing correlations between the chosen sample size and the resultant variance, this study elucidates the maximum adequate radius for analysis. This insight is pivotal, acting as a beacon for future connectivity investigations, ensuring they are both relevant and accurate.
This study reviews and analyzes the findings from twelve distinct studies, culminating in a total of fourteen observations. This selection was carried out judiciously, adhering to stringent eligibility criteria anchored in the established, existing literature. Through statistical analysis, this paper attempts to answer the following questions: (a) Is there a correlation between the radius of analysis and the variance in results? (b) If such a correlation is present, does it possess the statistical significance to influence subsequent analyses? (c) how does the policy development in geographical context interplay with the choice of this particular metric? (d) What implications does the radius of analysis in PRD have for code regulation, particularly in terms of assessing street network efficiency?

2. Literature Review

The term “connectivity” determines the interconnectivity between the segments of a road network, thus the ease with which individuals traverse from one locale to another. In simpler terms, a well-structured road network without frequent dead-ends promotes better movement compared to a convoluted one dominated by cul-de-sacs and leads to only a few arterial roads [16]. For pedestrians, the intertwined concepts of walkability and connectivity are paramount. A community’s walkability is defined as “how much the built environment and land use patterns either encourage or discourage residents from walking for leisure, exercise, recreation or to access services or commute to work” [17] (p. 113). Porta and Renne [18] and Saelens et al. [19] highlight the vital relationship between street connectivity and walkability, positing that longer distances and poor network connectivity deter walking, cycling, and by extension, physical activity [20].
Over the years, researchers have explored diverse methodologies to evaluate walkability and connectivity. Pafka et al. [21], for instance, categorized connectivity into network connectivity (the promotion of flow) and morphological connectivity (the extent to which urban form obstructs flow). Offering another dimension, Dill [3] assessed connectivity in Portland through four metrics, including street network density, connected node degree, intersection density, and link–node ratio. From another perspective, Marshall [22] focused on network design; he classified the network patterns into different types. Nevertheless, these approaches often fall short of accurately representing the nuanced structural differences in networks [23,24].
To deviate from the limitations of morphological metrics, Hiller [25] introduced the “space syntax” approach in the 1970s, offering a novel method to evaluate connectivity. Rooted in graph theory, this method harnesses a dual graph approach, translating street segments into nodes and intersections into edges, to decipher topological spatial relationships within the mathematical framework of street networks. Space syntax encompasses methodologies like integration, choice, and depth distance, which facilitate the in-depth analysis of a street network’s centrality, accessibility, and overall connectivity. However, its adoption has not been without contention. The model drew criticism, particularly around its mathematical consistency, after anomalies surfaced in certain geometric configurations, notably within the “axial maps,” a pivotal component of space configuration representation. In addition to the lack of realistic results, the model only provides a representation of the spatial connection between edges and nodes, regardless of the actual distances and the presence of other urban elements. Nevertheless, space syntax has come under critique for its failure to adequately consider the physical distance between key points, an essential factor in urban planning and design. Additionally, critics have argued that it lacks integration with traditional planning methodologies that are already implementable in practice [26,27]. Pafka et al. [21] argue that the axial analyses of space syntax privilege visibility over accessibility and connectivity, and that they produce distorted mapping at pedestrian-friendly scales. Ratti [27] criticizes the discarding of all metrics information through the topological representation of axial analysis, and the discounting of complex geometrical information in axial maps. In addition, he argues that space syntax maps ignore building heights and land-use distribution, which are key influencers in modifying pedestrian flow patterns. He presents more arguments addressing the unnecessary simplification of street networks in driving the axial maps and the discontinuous nature of such maps, failing to represent real urban textures.
Porta et al. [28] presented the Multiple Centrality Assessment (MCA), a distinct approach relying on the primal graph and emphasizing actual distances over space syntax’s dual graph approach (refer to Figure 1). This MCA technique offers detailed insights into node relationships, linking trip projections with network designs and proximity considerations. Recognizing its potential, Sevtsuk and Mekonnen [29] presented the urban network analysis (UNA) toolbox, a computational tool designed to incorporate MCA measures for a comprehensive street network analysis. This tool promises a more nuanced perspective by considering urban elements like buildings and plots. It allows the planners to evaluate how easily individuals can access specific locations or run into them through the planned mobility networks. The UNA toolbox simulations consist of computing the scores of several different indices, including Reach, Gravity, Straightness, and Betweenness. Yet, even with the MCA’s two-decade existence, the complicated nature of its results has somewhat hindered its widespread adoption and recognition in the academic literature.
Expanding on the primal graph methodology, Hess et al. [30] pioneered pedestrian route directness (PRD), a simpler metric for connectivity assessment. PRD quantifies the efficiency of travel by dividing the actual traversed network distance over the straight-line Euclidean distance between two points represented by dashed lines in Figure 2. Euclidean distance, also known as ‘as-the crow-flies’, is the straight-line distance between two points in a space [3]. A lower PRD value indicates a more direct and efficient route for pedestrians, where a straight line or the Euclidean distance has the ideal measure of 1, while a higher PRD value indicates a more circuitous and less efficient route [12]. Metro Portland established design standards for better pedestrian connectivity that requires the PRD value from any origin to certain local destinations, to be no more than 1.5 [31]. Randall and Baetz [32] found that neighborhoods with grid street typologies and short blocks had PRD values of 1.4 to 1.5, while neighborhoods featuring curvilinear streets and cul-de-sacs had PRD values between 1.63 and 1.88. The INDEX model advocates for internal street connectivity and advises against street networks with PRD values of more than 1.5 [3].
PRD has been proven to have the advantage of identifying parcels with poor route directness and suggesting network modifications to enhance pedestrian connectivity. Building on this concept, Randall and Baetz [32] provided a GIS-based technique to measure PRD within communities. This method facilitates the evaluation of residential areas against set standards by assessing the average route directness and distance to various amenities like parks, schools, and retail areas. Ensuing studies have leveraged this ArcGIS methodology, as evidenced by [33,34,35]. Moreover, Sevtsuk’s UNA toolbox, developed by City Form Lab at MIT in the USA, is an alternative software to derive PRD insights. Through its core features, it allows researchers to utilize the results of reach and straightness analysis to derive PRD for their samples. This approach has garnered significant traction among academics, with numerous studies attesting to its growing popularity [13,14,15,34,36,37,38]. Along with academic scholarship, several municipalities have employed PRD as part of their network design standards to enhance connectivity. For instance, Abu Dhabi’s Estidama program, aimed at pioneering sustainable urbanization in its built environment, has introduced the Pearl Community Rating System (PCRS). This system serves as a sustainability index for communities, buildings, and villas across the emirate. Estidama employs PRD analysis as a metric to set connectivity standards within its framework dedicated to fostering “livable communities”. Emphasizing pedestrian/cycle connectivity within neighborhoods, Abu Dhabi’s street design stipulates a threshold for PRD indicating that a route should be, at most, 1.5 times longer than its straight-line counterpart [39]. In India, the Indian Road Congress has advocated the use of the PRD method to measure network connectivity. The manual stated that a well-connected grid street network should score a PRD value of less than 1.5 [40].
Despite the simplicity of the metric, it has limitations related to the analyzed sample size. Stangl [9] explored these limitations using ArcGIS, emphasizing how both the study area’s size and the parcel size of the sample can influence the outcomes. He observed that directness is less sensitive over expansive distances and more reactive over shorter ones. Additionally, directness can differ from one neighborhood to another, complicating comprehensive neighborhood studies. Stangl’s assessment, when maintaining a constant parcel size but varying the study area size, revealed that “the larger the study area, the better the directness measure.” This means that the routes are perceived to be more direct after a certain distance. Ellis et al. [11] built on Stangl’s research, and the findings stated that PRD is inconsistent when generalized as a connectivity and walkability index. Moreover, it states that PRD should only be applied when the destination is set to certain locations, such as parks. Several researchers have implemented the PRD method in their studies while considering its limitations and limiting the study radii to a maximum of 3 km, based on previous observations. This study attempts to provide a statistical analysis of the previous PRD-extracted results and give recommendations regarding the radii of analysis, as well as the studies in which PRD would be significant.

3. Research Design and Methods

3.1. Research Approach

This research uses a regression analysis approach to investigate whether the theoretical conclusions on PRD limitations possess a grounded statistical foundation, or if these limitations are overly emphasized in the academic literature. Regression analysis is a sophisticated technique designed to create statistical and mathematical models that illustrate the relationship between a dependent variable, which is ratio-based, and one or more independent variables that are numerical in nature, either as a ratio or a category [41]. Predominantly, there are two main types of regression models: time-series data models and cross-sectional data models. The time-series data model concentrates on forecasting using time or a function of time as the independent variables, making it more suitable for comparing changes in a single study area over time [41]. Conversely, the cross-sectional data model is used for studies that compare certain variables across different study areas, regardless of time. Both models are the most frequently used in data analysis. For the scope of this study, the cross-sectional data regression model is selected, given that consistent variables are utilized across diverse samples. Simple linear regression, a specific method within regression analysis, aims to identify a linear relationship between a single independent variable (X), which tends to be unaffected by other variables, and a dependent variable (Y), which is affected by changes in X and tends to be tested in studies. In this article, the regression analysis technique is applied to quantitatively synthesize the existing literature on the relationship between the results and the change in the radius of the analysis. The study started by introducing the mean PRD value for each study radius as the dependent variable and the radius of the analysis as the independent variable. However, the choice of the variables led to an inconsistency in the analysis results. It was deemed more adequate to continue with the variance of the PRD results for each study radius as the dependent variable and the radius of the analysis expressed in kilometers as the independent variable.
Equation (1) below presents the mathematical formula of the regression analysis used in this study. Where Y i is the variance in the results for each study radius i; X i is the value of the radius in kilometers of the selected study i; β0 is the intercept term, which is the predicted value of the dependent variable when the independent variable is zero; and β1 is the coefficient for the independent variable, representing the predicted change in the dependent variable. ε i is the error term, representing the difference between the actual and predicted values of the dependent variable.
Y i = β 0 + β 1 X i + ε i

3.2. Search Strategy to Select Relevant Studies

The regression analysis adhered to the methodology described in “Preferred Reporting Items for Systematic Review and Meta-analysis: The PRISMA Statement” authored by Moher D et al. [42]. The identification of pertinent primary studies for this research was conducted by a systematic four-step procedure, encompassing the stages of Identification, Screening, Eligibility, and Included studies. First, identification was accomplished by conducting a search using the keywords “pedestrian route directness” and “route directness.” Subsequently, only articles published after 1997 were considered, on account of Hess’s [10] study which laid the foundation for PRD analysis. A search was conducted in the Scopus database using the specified keywords, limited to the title, keywords, or abstract sections. The search yielded a total of (N = 21) articles related to “pedestrian route directness” and (N = 57) articles related to “route directness.” The aforementioned findings were obtained following the removal of irrelevant portions, specifically those associated with medicine, biology, chemistry, and economy. In a separate directory, the “urban network analysis” and “walkability assessment” categories of the Emirates Planning Association (EPA) library were screened for papers containing the phrase “pedestrian route directness” in the title, abstract, or keywords. This led to the inclusion of N = 40 studies, which encompassed both Ph.D. and Master’s theses. An alternative approach for assessing relevance was utilizing the “Connected Papers” website, establishing connections between a given paper and additional papers that share the same citation, as depicted in Figure 3. Hess’s (1997) study was selected in this approach as the publication for relevance. The website led to the identification of N = 31 linked articles. The identification stage resulted in a total of N = 149 related articles.
Next, a screening process was used to eliminate any duplicate research across the various resources. A total of N = 76 duplicates were identified, resulting in a total of N = 73 studies. Additional screening was conducted by carefully examining the abstracts of the papers, resulting in a subsequent decrease to a final selection of only N = 36 articles that were considered relevant.
For the final selection of studies that would be integrated into the statistical analysis, a rigorous eligibility criterion was set. This criterion is pivotal to ensuring that the studies incorporated were relevant and comprehensive for our analysis. The research incorporated four specific criteria to evaluate the suitability of the results from past studies:
  • Analysis Tool: The studies under consideration should have employed at least one of the two primary methods for extracting PRD measures, namely the UNA toolbox or the GIS.
  • Quantitative Results for PRD: It was essential that the accepted studies either directly reported quantitative outcomes for PRD or provided equivalent measures. In the absence of direct PRD values, the study should present data that facilitates the manual calculation of PRD.
  • Detailed Quantitative Data: The studies should furnish detailed quantitative information regarding their selected samples. Essential details like the sample area and the radius used for analysis were considered mandatory for inclusion.
  • Language of Report: For ease of understanding and uniformity, only those studies that reported their findings in English were considered for this research.
By adhering to these criteria, a total of N = 12 studies were selected for inclusion in the final statistical analysis after completing a review of all the text in the studies. The list of papers that were excluded is addressed in Table 1. The studies included in this analysis are presented in Table 2 and organized to include (1) the year of publication, (2) the city where the study was conducted, or the geographical scale. This data is important to contextualize the different studies, (3) the level of the samples (city or neighborhood), (4) the number of samples utilized in each study (which impacts result variance), (5) the sample area measured in square kilometers, (6) the analysis radius in kilometers, (7) the result variance, (8) the degrees of freedom in each analysis (uncontrolled samples utilize the actual network map and plot density, while controlled samples use a fixed plot density to assess network pattern efficiency), (9) the metrics employed in the research, and (10) the software utilized (GIS or UNA toolbox). The findings of the relevant studies and the accepted investigations indicate a noticeable upward trend in the number of publications of the PRD metric over the past decade (see Figure 4).

3.3. Data Extraction

This research approach is structured and systematic to ensure the effective manual extraction of relevant data from all incorporated studies. The process was broken down into several phases for clarity and precision. First, the contextual data extraction through which the fundamental information was gleaned from each study. This involved gathering details about sample characteristics, including the sample size, the nature of the geographical location under study, and the publication year of the research. The next phase involved extracting data related to the radii used in each study’s analysis. For the extraction of the results’ variance, the PRD results in each study are separated if they correspond to different analysis radii. The variance for each set of results is then calculated so that under each study, each analysis radius has a corresponding variance for its results. It is important to note that not all studies provided complete radii analysis results. In some instances, studies presented an average value for the radius. For our research’s clarity, such average values were clearly marked in gray in Table 2. Other studies provided only the dimensions of the studied samples; the radius was then assumed to be equal to the longest distance between two points on the perimeter of the sample. Once preliminary data extraction was complete, the focus shifted to studies that directly presented PRD results across different radii. The study aimed to include only values of analysis from all plots to all plots. For instance, a study by Scoppa et al. [61] was particularly insightful, as it analyzed ten controlled samples of the same size to understand the internal connectivity provided by the street network. The number of papers discussing the PRD directly was N = 10. After identifying and collecting the PRD values, they were paired with their respective sample and radius details. The primary objective here was to determine the variance value for each sample. This was achieved using the variance equation as mentioned in [41]:
Sample   Variance   =   S 2 =   ( X X ¯ ) 2 n 1
In the case of the two remaining studies, rather than extracting the PRD results directly, they had to be derived from the provided data. One of the studies employed the Reach, Gravity, and Straightness metrics as a means to evaluate aspects like connectivity, walkability, and overall integration of the urban layout. It is noteworthy that both the Reach and Straightness metrics can be employed in the calculation of PRD. For a deeper insight, the concept of ‘Reach’ essentially provides a count of how many nodes can be accessed from a singular node within a given radius. On the other hand, ‘Straightness’ offers a comparative measure, showcasing the shortest available path between two points against a direct line or the Euclidean distance between them [29]. With these metrics in hand, the succeeding step was to apply a specific equation to determine the PRD for these studies.
P R D = M e t r i c   R e a c h S t r a i g h t n e s s
The final study included the Euclidean and the actual distances only without calculating the PRD values. The results for that paper were calculated by the equation mentioned in [11]:
P R D   [ i ] = 1 n j i n d i , j d i , j E u c l
Equation (4) above is the mathematical formula for this metric, where PRD (i) is the directness value of origin plot (i); (dij) is the shortest network distance from origin plot i to all destinations j; (d) Euclid (i,j) is the Euclidean or origin plot i to all destinations j; and n is the total number of destinations reached.
Table 2. The accepted studies and the studies’ characteristics.
SIStudyGeographical LocationGeographical Scale *SampleAverage Sample Size (km2)Radius of Analysis (km)VarianceDegree of FreedomMetric UsedSoftware Used
1Alawadi et al.
[37]
Dubai1120.500.400.024uncontrolledPRDUNA Tool
2.000.800.017
8.031.600.008
2Scoppa et al.
[61]
Abu Dhabi1100.500.40 controlledPRDUNA Tool
0.500.80
0.600.035
3Anabtawi et al.
[75]
Abu Dhabi1100.541.100.013controlledPRDGIS
4Alawadi et al.
[13]
Dubai1114.130.800.029uncontrolledPRDUNA Tool
4.130.800.015
5Alawadi et al.
[15]
Dubai and Abu Dhabi1322.130.400.014uncontrolledPRDUNA Tool
6Alawadi et al.
[14]
Abu Dhabi1100.581.000.012controlledPRDUNA Tool
7Ahmed [76]UAE12NA0.35 **0.002uncontrolledReach, Gravity, Straightness, PRD (derived data)UNA Tool
NA0.600.031
NA0.800.023
8Chin et al.
[33]
Western Australia14NA1.610.002uncontrolledPRDGIS
NA2.150.001
9Wang et al.
[35]
Changchun, China26NA1.500.002uncontrolledPRD (derived from Euclidean distance)GIS
10Scoppa et al.
[34]
Abu Dhabi1100.751.000.023controlledPRDGIS
11Hess et al.
[30]
Washington DC113NA0.800.040uncontrolledPRDGIS
12Jiao et al.
[77]
Shanghai13NA1.000.013uncontrolledPRDGIS
* 1 = Neighborhood; 2 = City, ** = Inadequate data.

4. Results

4.1. Sample Characteristics

The gathered contextual data and specific attributes of the samples are comprehensively presented in Table 2. The values represent the total number of samples considered, the radii at which these samples were analyzed, and the degree of freedom. A closer look at the data reveals a significant portion of the studies, approximately 58%, analyzed between 10 and 20 samples. Meanwhile, about 33% concentrated their efforts on a more limited set of 1 to 9 samples, and an even smaller portion, only 9%, opted to evaluate over 20 samples. Notably, studies with a higher count of samples tend to provide a broader perspective, allowing a more comprehensive comparison of the results. In terms of the radii used in the analysis, the spectrum stretches from 400 meters to 2.15 kilometers. These radii were selected with pedestrian convenience in mind; they roughly translate to walkable distances that span from a 5 min walk to an extended 30 min walk, which can cover up to 3 km [37]. However, it is essential to note an outlier: only one study applied a radius of 0.35 km in the analysis, and after the evaluation, the PRD results under this radius were insufficient to be considered in this research. In this study, a balanced use of analytical tools among the studies analyzed was observed. Exactly half of the studies, or 6 out of 12, utilized Geographic Information System (GIS) techniques for their analyses. The other half employed urban network analysis (UNA) tools, indicating a diverse approach to examining the respective research variables.

4.2. Locational Context of Studies

All the selected studies covered research contexts from both developed and developing countries, with regions such as the United Arab Emirates (UAE), China, Australia, and the United States (US) prominently featured, with more details about the geographical location in Table 2. When it comes to a broader continental perspective, Asia clearly dominates the research landscape, accounting for a significant 83% of the studies. Given that Asian countries, including the UAE and India, have adopted PRD as a sustainable tool for assessing walkability, these results appear to underscore a tangible correlation between policy development and the focus of walkability studies. For instance, a discernible surge in studies can be traced back to actions undertaken by the UAE, especially post-2010, coinciding with the implementation of PRD within the Estidama green rating system. This initiative marked a period where research started to develop at an accelerated pace, underscoring the pivotal role policy adaptations can have in steering academic investigations. Australia and North America came in second, each contributing 6.5% of the studies. The study’s geographical scale, neighborhood or city, is also addressed in Table 2. A substantial majority of the analyses, approximately 92%, focused on the neighborhood scale, while a mere 8% expanded their scope to encompass an entire city or town. This is a unique study among the twelve that are selected in the paper. In the context of the UAE, it is interesting to highlight that all research undertakings concentrated exclusively on the neighborhood level. This trend might be influenced by the UAE’s strategic policy framework on suburban forms, which is often highlighted in several research studies including [15,34,36,38].

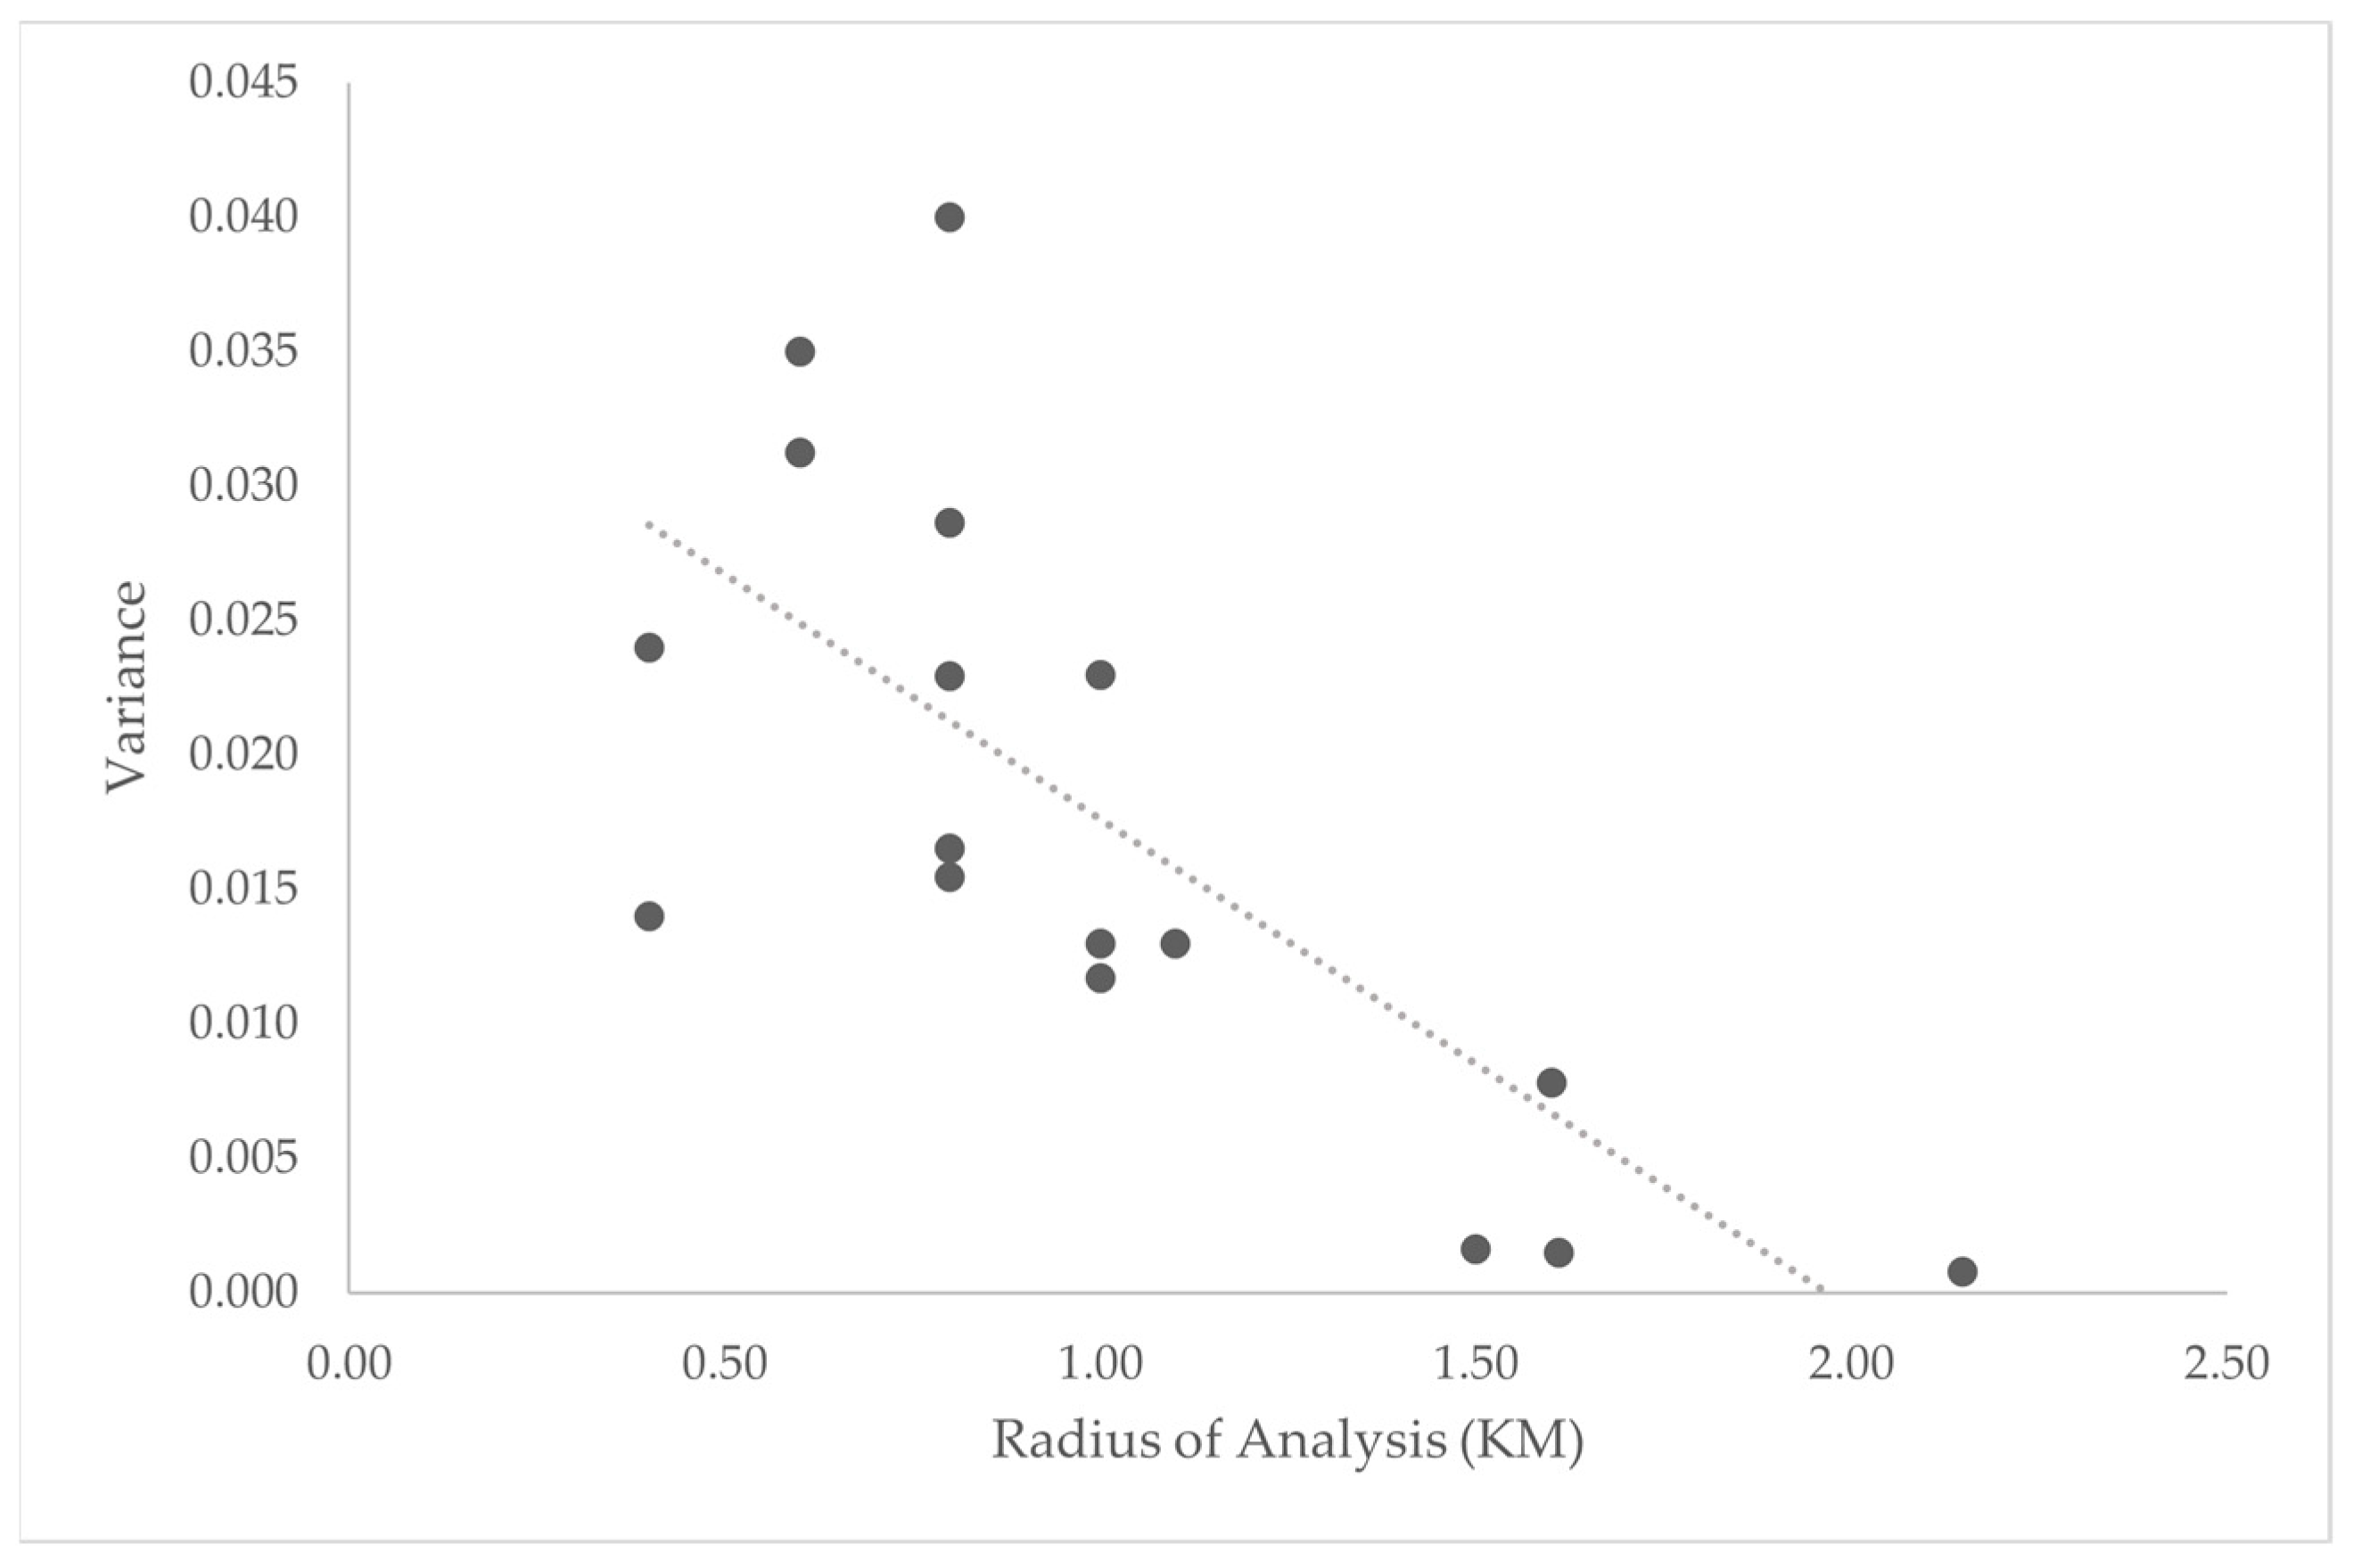
4.3. Regression Analysis Results

The findings from the regression analysis, paired with the ANOVA results regarding the relationship between the radii of the analysis and the variance in outcomes, are detailed in Table 3, Table 4 and Table 5. Table 3 specifically showcases values that suggest a correlation between the radii and the variance of the results. To better understand this relationship, Pearson’s correlation coefficient, often represented as ‘r’, was utilized. In this study, the computed r value stood at −0.82.
An r value that falls below zero and nears −1 signifies a strong negative correlation between the analysis radius (independent variable X) and the outcome variance (dependent variable Y). This strong negative relationship is visually evident when observing the trajectory of the results in relation to the expected trend line, as depicted in Figure 5 below.
The study calculated the coefficient of determination, or R squared (R2). The R2 value obtained for this research was 0.67. It is important to note that an R2 value equal to or exceeding 0.6 is often considered to demonstrate a “very good” alignment of the data with the regression line [41]. Proceeding to ANOVA, a technique frequently employed to gauge the significance of regression, the study was able to determine the ‘significance F’, a metric representing the p-value of the F-test. The ‘Significance F’ (Table 4) was found to be 0.0003, a value substantially below the typical threshold of 0.05, indicating strong statistical evidence of the relationship’s significance.
Table 4. Results of the ANOVA analysis.
dfSSMSFSignificance F
Regression10.0013077340.00130773424.442043250.000339855
Residual130.0006420425.35035 × 10−5
Total140.001949776
Lastly, Table 5 reveals the coefficient value. This value enables the conclusion that the null hypothesis can be dismissed. The values given in the table indicate that the determined p-value (0.0003) is lower than the listed coefficient value (0.018).
Table 5. Results of the regression analysis.
CoefficientsStandard Errort Statp-ValueLower 95%Upper 95%
Intercept0.0357278360.004050118.8214477081.3636 × 10−60.0269034040.044552268
Radius of Analysis (KM)−0.018417290.003725263−4.9438894860.000339855−0.026533941−0.010300638

5. Discussion

PRD has been widely employed for network enhancement, not only from a theoretical point of view but also in applications with policies and practices in different cities. Although some studies have explored its limitations through trial-and-error tests, resulting in observational and theoretical implications, there is still a knowledge gap in quantitative studies regarding the radius against the sensitivity of the results. This study has introduced statistical data and a theoretical overview of the metric in an effort to address this gap in the literature. Through the eligibility criteria, only twelve studies were accepted for statistical review. The variables of the study were determined after a trial-and-error phase to select the dependent variable that best represents the sensitivity of the PRD. The mean PRD value was selected first as the dependent variable. Previous studies and observations have shown that it is more common that with larger radii, the studied areas tend to have passing PRD results. However, some outliers in studies have presented failing PRD values at large radii due to the complexity of the network configuration, resulting in inconsistencies between the selected variables in the regression analysis. Therefore, the study built on the commonality that PRD is less indicative of failure at larger radii, and reduced the effect of the outliers by considering the variance of the results as the dependent variable since the study’s main focus is examining the PRD’s sensitivity. The findings implicate that there is a strong negative correlation between the radius of the analysis and the variance of the results. In other words, the wider the radius of the analysis, the lower the variance and sensitivity of the resulting values. The correlation of the 12 reviewed studies aligns with previous observations in the existing literature, from which results are sensitive to the sample size [9,14].
This article provides multiple insights for future studies and policy development. First, the study found that, statistically, the maximum radius for a fairly adequate variance in the results is between 1 km and 1.5 km, which is equivalent to a 10 to 15 min walking distance. This could be incorporated with the “15-min city” concept proposed by Moreno et al. [78]. The concept gained popularity as a result of Mayor Anne Hidalgo’s successful 2020 re-election campaign, which promoted walkable potential as a way of recovering from the COVID-19 disturbances in Paris. The “15-min city” concept seeks to create sustainable, well-integrated neighborhoods with open spaces and amenities within walking distance, as well as incorporating the smart city’s digital infrastructure. Following Paris, cities such as Madrid, Dubai, Shanghai, New York, and Rome integrated this model into their development plans, and the list of cities continues to grow. Considering many cities are developing and implementing the concept of a 15 min city, introducing PRD in the policy framework to ensure the proximity of all services along with overall connectivity would be an efficient strategy to ensure cities’ walkability. Second, this study demonstrates that cities that incorporate PRD into their policy plans, such as the UAE, tend to encourage and support more connectivity research. According to the findings, more than 66% of the studies included have been conducted in the UAE. The widespread use of PRD analysis in the UAE may be attributed to the Estidama guidelines, which utilize PRD as a way of gauging connectivity at a PRD threshold of 1.5 and acting as a sustainability index.
This study gives a wider perspective on PRD to enhance the theory and practicality of the metric, adding to previous studies that have attempted to augment PRD to address its limitations. A similar study by Stangl [12] has presented an augmentation to the metric aiming to address the shortcomings of the PRD, which he addressed previously in [9]. He introduced Modified Route Directness, through which he altered the PRD with two adjustments. First, he advocated considering the midpoint of every street segment in the analysis rather than measuring the distance from every intersection. Second, he advised that, instead of taking the measurements from the starting point to the points where the radius circle cuts the network (intersection points), the measurements would be taken to the mid-point of the shortest path on the street network linking each connected pair of such intersection points. This method relates the sensitivity of the results to the actual permeability rather than the network configuration. In addition to the radius of the analysis, several morphological characteristics, such as block size, block length, intersection density, street density, street network patterns, and weight when accounting for land use (as it affects the desirability of the place), have also influenced PRD [3,9,12]. Scoppa et al. [61] developed controlled samples of the original network to examine the connectivity of the network design within a smaller area with a fixed plot density. This has provided researchers with a better understanding of network efficiency, disregarding morphological variations, and a more accurate cross-sectional comparison within a smaller radius. This review is restricted to a single factor, the radius of the analysis, through which its limitations have been statistically proven. During the conduct of the research, several limitations prevented delving deeper into the metric’s shortcomings. The urban layout and planning ideologies for each city’s street networks, for instance, have prompted this research to separate the results of each study by city to prevent implausible variation. In addition, some studies have employed alleyways as part of the network, resulting in straighter routes and less sensitivity in the results. The analysis only considered street networks for a consistent evaluation across all studies. Furthermore, studies addressing specific destinations such as parks, schools, and malls, have been avoided for two reasons: such studies do not use a radius for the analysis, and it has been stated previously by Ellis et al. [11] that PRD performs better as a connectivity index of a specific point.

6. Conclusions

This study utilized Pearson’s correlation and regression analysis in an attempt to provide statistical evidence of the limitations of PRD in terms of its sensitivity to larger radii of analysis, as previously addressed theoretically in research studies. Findings displayed that there is a significant, strong, and negative correlation between the radius of analysis and the variance of the results. In addition, the findings revealed that the majority of the selected studies for analysis are from Asian content countries, with the UAE dominating in research studies utilizing PRD as a metric for gauging street connectivity. Such dominance in selecting PRD as a research tool in connectivity studies has been fueled by the country’s guidelines for sustainable developments, specifically the Estidama green rating system. Estidama, as a rating system, uses PRD as a metric to set street connectivity standards as a pillar in developing livable communities in the UAE. This implies that policies and codes within the geographical context indeed affect the choice of the metric in assessing connectivity. Furthermore, the study provided insights for the inclusion of PRD in future policy development, taking into consideration its limitations. It was statistically proven that the maximum adequate variance in results would correspond to a radius between 1 km and 1.5 km, marking PRD as a metric worth considering as part of the “15-min city” implementation policy framework that is growing globally. Future studies are recommended to explore new methodologies and test their limitations. Among the recently introduced applications is UR Connect, developed by Dr. Haofeng Wang and his team from Shenzhen University, China [79]. The UR Connect software is a trial to address the limitations of space syntax, as it could be used in a larger geographical context, albeit through centerline maps and metric distances. It combines both the cognitive approach of the space syntax, under the assessment of the directional changes, and the physical endurance of pedestrians through the metric distance. Academic scholarship frequently introduces new methods to researchers, and such methods should be evaluated to provide policymakers with more effective decision-making tools.

Author Contributions

Conceptualization, F.D.; methodology, F.D.; software, F.D.; validation, R.A. and Y.-J.B.; formal analysis, F.D.; investigation, F.D., R.A. and Y.-J.B.; resources, R.A., F.D. and K.A.; data curation, F.D.; writing—original draft preparation, F.D.; writing—review and editing, F.D. and R.A.; visualization, F.D.; supervision, Y.-J.B., R.A. and K.A.; project administration, R.A.; funding acquisition, R.A. All authors have read and agreed to the published version of the manuscript.

Funding

This research received no external funding and The APC was funded by United Arab Emirates University.

Data Availability Statement

Not applicable.

Conflicts of Interest

The authors declare no conflict of interest.

Correction Statement

This article has been republished with a minor correction to an author's ORCID, author's name and author's email. This change does not affect the scientific content of the article.

References

  1. Cervero, R.; Kockelman, K. Travel demand and the 3Ds: Density, diversity, and design. Transp. Res. D Transp. Environ. 1997, 2, 199–219. [Google Scholar] [CrossRef]
  2. Ewing, R.; Cervero, R. Travel and the Built Environment: A Synthesis. Transp. Res. Rec. 2001, 1780, 87–114. [Google Scholar] [CrossRef]
  3. Dill, J. Measuring Network Connectivity for Bicycling and Walking. In Proceedings of the 83rd Annual Meeting of the Transportation Research Board, Washington, DC, USA, 11–15 January 2004. [Google Scholar]
  4. Hamidi, S.; Ewing, R.; Preuss, I.; Dodds, A. Measuring Sprawl and Its Impacts. J. Plan. Educ. Res. 2015, 35, 35–50. [Google Scholar] [CrossRef]
  5. Sugiyama, T.; Neuhaus, M.; Cole, R.; Giles-Corti, B.; Owen, N. Destination and route attributes associated with adults’ walking: A review. Med. Sci. Sports Exerc. 2012, 44, 1275–1286. [Google Scholar] [CrossRef]
  6. Porta, S.; Latora, V.; Wang, F.; Rueda, S.; Strano, E.; Scellato, S.; Cardillo, A.; Belli, E.; Càrdenas, F.; Latora, L.; et al. Street Centrality and the Location of Economic Activities in Barcelona. Urban Stud. 2011, 49, 1471–1488. [Google Scholar] [CrossRef]
  7. Haskell, W.L.; Blair, S.N.; Hill, J.O. Physical activity: Health outcomes and importance for public health policy. Prev. Med. 2009, 49, 280–282. [Google Scholar] [CrossRef]
  8. Thorp, A.A.; Owen, N.; Neuhaus, M.; Dunstan, D.W. Sedentary behaviors and subsequent health outcomes in adults a systematic review of longitudinal studies, 1996–2011. Am. J. Prev. Med. 2011, 41, 207–215. [Google Scholar] [CrossRef]
  9. Stangl, P. The pedestrian route directness test: A new level-of-service model. Urban Des. Int. 2012, 17, 228–238. [Google Scholar] [CrossRef]
  10. Hess, P.M. Measures of Connectivity [Streets: Old Paradigm, New Investment]. 1997. Available online: https://escholarship.org/uc/item/9599t9f1 (accessed on 31 August 2023).
  11. Ellis, G.; Hunter, R.; Tully, M.A.; Donnelly, M.; Kelleher, L.; Kee, F. Connectivity and physical activity: Using footpath networks to measure the walkability of built environments. Environ. Plann B Plann Des. 2016, 43, 130–151. [Google Scholar] [CrossRef]
  12. Stangl, P. Overcoming flaws in permeability measures: Modified route directness. J. Urban 2019, 12, 1–14. [Google Scholar] [CrossRef]
  13. Alawadi, K.; Alameri, H.; Scoppa, M. Reclaiming Alleyways to Improve Network Connectivity: Lessons from Dubai’s Neighborhoods. J. Plan. Educ. Res. 2020, 2020, 1–23. [Google Scholar] [CrossRef]
  14. Alawadi, K.; Hong Nguyen, N.; Alrubaei, E.; Scoppa, M. Streets, density, and the superblock: Neighborhood planning units and street connectivity in Abu Dhabi. J. Urban 2023, 16, 168–195. [Google Scholar] [CrossRef]
  15. Alawadi, K.; Khanal, A.; Al Hinai, S. Rethinking suburban design: Streets v/s alleys in improving network connectivity. J. Urban Des. 2021, 26, 725–745. [Google Scholar] [CrossRef]
  16. Litman, T.; Steele, R. Land Use Impacts on Transport; Victoria Transport Policy Institute: Victoria, BC, Canada, 2005. [Google Scholar]
  17. Leslie, E.; Coffee, N.; Frank, L.; Owen, N.; Bauman, A.; Hugo, G. Walkability of local communities: Using geographic information systems to objectively assess relevant environmental attributes. Health Place 2007, 13, 111–122. [Google Scholar] [CrossRef]
  18. Porta, S.; Renne, J.L. Linking urban design to sustainability: Formal indicators of social urban sustainability field research in Perth, Western Australia. Urban Des. Int. 2005, 10, 51–64. [Google Scholar] [CrossRef]
  19. Saelens, B.E.; Sallis, J.F.; Frank, L.D. Environmental correlates of walking and cycling: Findings from the transportation, urban design, and planning literatures. Ann. Behav. Med. 2003, 25, 80–91. [Google Scholar] [CrossRef]
  20. Gori, S.; Nigro, M.; Petrelli, M. Walkability Indicators for Pedestrian-Friendly Design. Transp. Res. Rec. 2014, 2464, 38–45. [Google Scholar] [CrossRef]
  21. Pafka, E.; Dovey, K.; Aschwanden, G.D.P.A. Limits of space syntax for urban design: Axiality, scale and sinuosity. Environ. Plan. B 2018, 47, 508–522. [Google Scholar] [CrossRef]
  22. Marshall, S. Streets and Patterns, 1st ed.; Routledge: New York, NY, USA, 2004. [Google Scholar] [CrossRef]
  23. Stangl, P. Block size-based measures of street connectivity: A critical assessment and new approach. Urban Des. Int. 2015, 20, 44–55. [Google Scholar] [CrossRef]
  24. Knight, P.L.; Marshall, W.E. The metrics of street network connectivity: Their inconsistencies. J. Urban 2015, 8, 241–259. [Google Scholar] [CrossRef]
  25. Hillier, B.; Leaman, A.; Stansall, P.; Bedford, M. 1976 Space Syntax. Environ. Plan. B Plan. Des. 1976, 3, 147–185. [Google Scholar] [CrossRef]
  26. Dovey, K. Framing Places: Mediating Power in Built Form, 2nd ed.; Routledge, Taylor and Francis Group: London, UK, 2014. [Google Scholar]
  27. Ratti, C. Space Syntax: Some Inconsistencies. Environ. Plan. B 2004, 31, 487–499. [Google Scholar] [CrossRef]
  28. Porta, S.; Crucitti, P.; Latora, V. The network analysis of urban streets: A primal approach. Environ. Plan. B Plan. Des. 2006, 33, 705–725. [Google Scholar] [CrossRef]
  29. Sevtsuk, A.; Mekonnen, M. Urban network analysis: A new toolbox for ArcGIS. Rev. Int. Geomat. 2012, 22, 287–305. [Google Scholar] [CrossRef]
  30. Hess, P.M.; Moudon, A.V.; Snyder, M.C.; Stanilov, K. Site design and pedestrian travel. Transp. Res. Rec. 1999, 1674, 9–19. [Google Scholar] [CrossRef]
  31. Handy, S.; Paterson, R.; Butler, K. Planning for Street Connectivity: Getting from Here to There; American Planning Association, Planning Advisory Service: Chicago, IL, USA, 2003. [Google Scholar]
  32. Randall, T.A.; Baetz, B.W. Evaluating Pedestrian Connectivity for Suburban Sustainability. J. Urban Plan. Dev. 2001, 127, 1–15. [Google Scholar] [CrossRef]
  33. Chin, G.K.W.; Van Niel, K.P.; Giles-Corti, B.; Knuiman, M. Accessibility and connectivity in physical activity studies: The impact of missing pedestrian data. Prev. Med. 2008, 46, 41–45. [Google Scholar] [CrossRef]
  34. Scoppa, M.; Bawazir, K.; Alawadi, K. Walking the superblocks: Street layout efficiency and the sikkak system in Abu Dhabi. Sustain. Cities Soc. 2018, 38, 359–369. [Google Scholar] [CrossRef]
  35. Wang, F.; Chen, C.; Xiu, C.; Zhang, P. Location analysis of retail stores in Changchun, China: A street centrality perspective. Cities 2014, 41, 54–63. [Google Scholar] [CrossRef]
  36. Alawadi, K.; Khaleel, S.; Benkraouda, O. Design and planning for accessibility: Lessons from Abu Dhabi and Dubai’s neighborhoods. J. Hous. Built Environ. 2021, 36, 487–520. [Google Scholar] [CrossRef]
  37. Alawadi, K.; Khanal, A.; Doudin, A.; Abdelghani, R. Revisiting transit-oriented development: Alleys as critical walking infrastructure. Transp. Policy 2021, 100, 187–202. [Google Scholar] [CrossRef]
  38. Scoppa, M.; Bawazir, K.; Alawadi, K. Straddling boundaries in superblock cities. Assessing local and global network connectivity using cases from Abu Dhabi, UAE. Transp. Res. Part A Policy Pract. 2019, 130, 770–782. [Google Scholar] [CrossRef]
  39. The USDM Manual. 2010. Available online: https://usdm.upc.gov.ae/USDM/help/EN/The%20USDM%20Manual.html (accessed on 23 August 2023).
  40. Koti Marg, K.; Puram, R. Manual For Planning and Development of Urban Roads and STREETS. Indian Roads Congress, November 2018. Available online: https://law.resource.org/pub/in/bis/irc/irc.gov.in.sp.118.2018.pdf (accessed on 23 August 2023).
  41. Evans, J.R. Business Analytics; Pearson: London, UK, 2017. [Google Scholar]
  42. Moher, D.; Liberati, A.; Tetzlaff, J.; Altman, D.G. Preferred reporting items for systematic reviews and meta-analyses: The PRISMA statement. J. Clin. Epidemiol. 2009, 62, 1006–1012. [Google Scholar] [CrossRef] [PubMed]
  43. Stangl, P. The US Pedestrian Plan: Linking Practice and Research. Plan. Pract. Res. 2011, 26, 289–305. [Google Scholar] [CrossRef]
  44. Ozbil, A.; Peponis, J.; Stone, B. Understanding the link between street connectivity, land use and pedestrian flows. Urban Des. Int. 2011, 16, 125–141. [Google Scholar] [CrossRef]
  45. Stangl, P.; Guinn, J. Neighborhood design, connectivity assessment and obstruction. Urban Des. Int. 2011, 16, 285–296. [Google Scholar] [CrossRef]
  46. Region, A.; Kim, J. Testing the Street Connectivity of New Urbanism Projects and Their Surroundings In Metro. In Proceedings of the 6th International Space Syntax Symposium in Istanbul, Istanbul, Turkey, 12–15 June 2007. [Google Scholar]
  47. Ozbil, A. Modeling Walking Behavior In Cities Based On Street Network And Land-Use Characteristics: The Case Of İstanbul. Metu J. Fac. Archit. 2013, 30, 17–33. [Google Scholar]
  48. Feng, C.; Peponis, J. Pathways to creating differentiated grids: Types, benefits and costs. Environ. Plan. B Urban Anal. City Sci. 2021, 49, 535–548. [Google Scholar] [CrossRef]
  49. Christova, P.; Scoppa, M.; Peponis, J.; Georgopoulos, A.P. Exploring small city maps “Exploring small city maps”. Exp. Brain Res. 2012, 223, 207–217. [Google Scholar] [CrossRef]
  50. Haynie, D.; Peponis, J. Atlanta: A Morphological History. In Proceedings of the 7th International Space Syntax Symposium, Stockholm, Sweden, 8–11 June 2009. [Google Scholar]
  51. Greene, M. Housing and community consolidation in informal settlements. In Proceedings of the 4th International Space—Syntax Symposium, London, UK, 17–19 June 2003. [Google Scholar]
  52. Baran, P.K.; Rodriguez, D.A.; Khattak, A.J. Space Syntax and Walking in a New Urbanist and Suburban Neighborhoods. J. Urban Des. 2008, 13, 5–28. [Google Scholar] [CrossRef]
  53. Feng, C.; Peponis, J. Algorithmic definitions of street network centrality sub-shapes: The case of superblocks. Environ. Plan. B Urban Anal. City Sci. 2022, 49, 2451–2466. [Google Scholar] [CrossRef]
  54. Ozbil, A.; Peponis, J. Modeling Street Connectivity and Pedestrian Movement According to Standard GIS Street Network Representations 018. In Proceedings of the 6th International Space Syntax Symposium, Istanbul, Turkey, 12–15 June 2007. [Google Scholar]
  55. Haynie, D. Examining the Measures of Street Connectivity in the American City and their Interdependencies as applied in Practice. In Proceedings of the 56th ACSP Conference, Portland, OR, USA, 3–6 November 2016. [Google Scholar]
  56. Mehaffy, M.W.; Porta, S.; Romice, O. The “neighborhood unit” on trial: A case study in the impacts of urban morphology. J. Urban. Int. Res. Placemaking Urban Sustain. 2015, 8, 199–217. [Google Scholar] [CrossRef]
  57. Karimi, K.; Parham, E.; Acharya, A. Integrated sub-regional planning informed by weighted spatial network models: The case of Jeddah sub-regional system. In Proceedings of the 10th International Space Syntax Symposium, London, UK, 13–17 July 2015. [Google Scholar]
  58. Alawadi, K. Rethinking Dubai’s urbanism: Generating sustainable form-based urban design strategies for an integrated neighborhood. Cities 2017, 60, 353–366. [Google Scholar] [CrossRef]
  59. Aultman-Hall, L.; Roorda, M.J.; Baetz, B.W. Using GIS for Evaluation of Neighborhood Pedestrian Accessibility. J. Urban Plan. Dev. 1997, 123, 10–17. [Google Scholar] [CrossRef]
  60. Alawadi, K.; Benkraouda, O. What happened to Abu Dhabi’s urbanism? The question of regional integration. J. Urban Des. 2018, 23, 367–394. [Google Scholar] [CrossRef]
  61. Scoppa, M.; Anabtawi, R. Connectivity in superblock street networks: Measuring distance, directness, and the diversity of pedestrian paths. Sustainability 2021, 13, 13862. [Google Scholar] [CrossRef]
  62. Marshall, W.E.; Garrick, N.W. Community Design and How Much We Drive. J. Transp. Land Use 2020, 5, 5–21. [Google Scholar] [CrossRef]
  63. Marshall, W.E.; Garrick, N.W. Effect of Street Network Design on Walking and Biking. Transp. Res. Rec. 2010, 2198, 103–115. [Google Scholar] [CrossRef]
  64. Haynie, S.D. Measuring the Scale, Density and Directness of American Cities; Georgia State University: Atlanta, GA, USA, 2017. [Google Scholar]
  65. Peponis, J.; Bafna, S.; Zhang, Z. The connectivity of streets: Reach and directional distance. Environ. Plan. B Plan. Des. 2008, 35, 881–901. [Google Scholar] [CrossRef]
  66. Van Nes, A. The Configurable Urban Sustainability. In what ways a morphological or configurational approach contribute to our understanding of urban sustainability? In Proceedings of the Open Building Conference, Hong Kong University, Hong Kong, China, 23–26 October 2003. [Google Scholar]
  67. Kan, H.Y.; Forsyth, A.; Rowe, P. Redesigning China’s superblock neighbourhoods: Policies, opportunities and challenges. J. Urban Des. 2017, 22, 757–777. [Google Scholar] [CrossRef]
  68. Meeder, M.; Weidmann, U. Measuring Neighborhood Walkability Using Detour Factor Distributions. J. Urban Plan. Dev. 2018, 144, 04018017. [Google Scholar] [CrossRef]
  69. Almardood, M.A.; Maghelal, P. Enhancing the use of transit in arid regions: Case of Abu Dhabi. Int. J. Sustain. Transp. 2020, 14, 375–388. [Google Scholar] [CrossRef]
  70. Lin, T.G.; Xia, J.C.; Robinson, T.P.; Goulias, K.G.; Church, R.L.; Olaru, D.; Han, R. Spatial analysis of access to and accessibility surrounding train stations: A case study of accessibility for the elderly in Perth, Western Australia. J. Transp. Geogr. 2014, 39, 111–120. [Google Scholar] [CrossRef]
  71. Qian, C.; Zhu, D.; Zhou, Y.; Chen, J. Measurements of Pedestrian Friendliness of Residential Area: A Case Study in Hexi District of Nanjing. Sustainability 2018, 10, 1993. [Google Scholar] [CrossRef]
  72. Zhang, Y.; Jin, Y.; Steemers, K.; Cao, K. The Study of the Effects of Built Form on Pedestrian Activities: A GIS-Based Integrated Approach. Compr. Geogr. Inf. Syst. 2017, 3, 330–344. [Google Scholar] [CrossRef]
  73. Aras, R.L.; Ouellette, N.T.; Jain, R.K. Quantifying the pedestrian access potential of suburban street network retrofits. Environ. Plan B Urban Anal. City Sci. 2023. [Google Scholar] [CrossRef]
  74. Alkhaja, N.; Alawadi, K.; Ibrahim, H.M. Title: Post-pandemic planning: Do we have enough and efficient access to parks? Front. Built. Environ. 2023, 9, 1158430. [Google Scholar] [CrossRef]
  75. Anabtawi, R.; Scoppa, M. Measuring Street Network Efficiency and Block Sizes in Superblocks—Addressing the Gap between Policy and Practice. Buildings 2022, 12, 1686. [Google Scholar] [CrossRef]
  76. Ahmed, K.G. From ‘Orthogonal’ Sprawl to ‘Curvilinear’ Dense: Assessing Accessibility Indices for Urban Networks of Social Housing in UAE. IOP Conf. Ser. Mater. Sci. Eng. 2021, 1203, 022066. [Google Scholar] [CrossRef]
  77. Jiao, J.; Chen, Y.; He, N. Plan pedestrian friendly environments around subway stations: Lessons from Shanghai, China. J. Urban Des. 2017, 22, 796–811. [Google Scholar] [CrossRef]
  78. Moreno, C.; Allam, Z.; Chabaud, D.; Gall, C.; Pratlong, F. Introducing the “15-Minute City”: Sustainability, Resilience and Place Identity in Future Post-Pandemic Cities. Smart Cities 2021, 4, 93–111. [Google Scholar] [CrossRef]
  79. Feng, C.; Zhang, W. Algorithms for the parametric analysis of metric, directional, and intersection reach. Environ. Plan. B Urban Anal. City Sci. 2019, 46, 1422–1438. [Google Scholar] [CrossRef]
Figure 1. A graphical representation of the primal and dual graphs, the numbers represent the street segments in both graphs.
Buildings 13 02612 g001
Figure 2. A graphical representation of the pedestrian route directness (PRD) method.
Buildings 13 02612 g002
Figure 3. The resulting map of papers from the Connected Papers website [9,10,11,12,13,14,23,24,32,34,38,43,44,45,46,47,48,49,50,51,52,53,54,55,56,57,58,59,60,61,62,63,64,65,66].
Buildings 13 02612 g003
Figure 4. A graphical representation of the accepted and related studies against the publication year.
Buildings 13 02612 g004
Figure 5. A graphical representation of the observed results, represented as dots, against the expected trendline.
Buildings 13 02612 g005
Table 1. The rejected list of papers and the reason for rejection.
StudyReason for Exclusion
Alawadi K, Benkraouda O [64]
H. Kan [67]
The study contains no numerical analysis of PRD
Nes A [66]
Randall and Baetz [32]
Meeder et al. [68]
Almardood et al. [69]
The study contains theoretical discussion only about planning ideals and pedestrian movement
Stangl P [23]The study assesses pedestrian movement by block characteristics
Alawadi et al. [36]
Ellis et al. [11]
Stangl [9]
Dill [3]
Lin et al. [70]
Qian et al. [71]
Insufficient amount of data
Knight et al. [24]The study discusses the inconsistencies in the connectivity measurements
Marshall et al. [62]The study includes vehicle travel
Marshall et al. [63]The study assesses pedestrian movement by network intersection density and physical characteristics
Peponis et al. [65]
Haynie [64]
The study uses Directional Change to assess Route Directness
Zhang et al. [72]
Stangl [12]
The study contains theoretical and statistical discussion only about planning ideals and pedestrian movement
Wang F, Chen C [35]
Scoppa M, AlAwadi K [38]
Aras et al. [73]
AlKhaja et al. [74]
The study focuses on certain destinations not all-to-all analysis
Table 3. Results of the regression analysis.
Regression Statistics
Multiple R0.818968871
R Square0.670710012
Adjusted R Square0.643269179
Standard Error0.007314607
Observations15
Disclaimer/Publisher’s Note: The statements, opinions and data contained in all publications are solely those of the individual author(s) and contributor(s) and not of MDPI and/or the editor(s). MDPI and/or the editor(s) disclaim responsibility for any injury to people or property resulting from any ideas, methods, instructions or products referred to in the content.

