Article

The Structural Behavior of Reinforced Concrete Beams Made with Locally Produced Recycled Aggregate in the UAE

Department of Civil Engineering, College of Engineering, American University of Sharjah, Sharjah P.O. Box 26666, United Arab Emirates
*
Author to whom correspondence should be addressed.
Buildings 2023, 13(10), 2597; https://doi.org/10.3390/buildings13102597
Submission received: 19 September 2023 / Revised: 7 October 2023 / Accepted: 10 October 2023 / Published: 14 October 2023
(This article belongs to the Special Issue Sustainable Construction Materials, Structures, and Buildings)

Abstract

:
In this study, the feasibility of utilizing locally produced coarse recycled aggregate (RA) from demolition waste in the UAE for structural applications was investigated. A comprehensive literature review on the subject showed that the shear and flexural responses of reinforced beams utilizing aggregate from concrete demolition waste are greatly dependent on the aggregate replacement ratio and the quality of the recycled aggregate. The experimental program in this study consisted of three phases. Phase I focused on the evaluation of the physical and mechanical characteristics of the RA, Phase II addressed the mix design and fresh and hard properties of the concrete, and Phase III dealt with the flexural and shear behavior of structural members. The research involved twelve 150 mm × 300 mm reinforced concrete beams with a length of 1500 mm or 2000 mm that were made with 0% (control), 50%, or 100% recycled coarse aggregate, replacing natural coarse aggregate (NA). Two target concrete compressive strengths, 25 and 35 MPa, were considered in the investigation. The results showed that the recycled aggregates had lower crushing and LA abrasion values by 40% and 18–28%, respectively, whereas the absorption capacity was 40–300% higher compared to the natural aggregate. In addition, the mechanical properties of the concrete made with different replacement ratios (R%) of RA were either similar or slightly less than those of the control mix. The shear beam tests with f c = 25 MPa showed that the 50%- and 100%-replacement-ratio beams demonstrated closely matched normalized shear strength values that exceeded their corresponding NA beam by 12.5%, while the shear beam tests with f c = 35 MPa showed that the NA beam exhibited normalized shear strength surpassing the 50% RA and 100% RA beams by 12.5% and 17.5%, respectively. In the flexural beam tests, the flexural strength exhibited minimal disparities for the beams that shared the same RA% but differed in their compressive strength targets, and overall, the variation in the RA% had a marginal impact on the flexural strength of the beams. Further, an increase in the RA% corresponded to an increase in the shear ductility index, which was in contrast with the findings on the flexural ductility index. Furthermore, predictions of flexural strength using the ACI318-19 code and shear strength using the strut-and-tie model yielded comparable results to the experimental ones.

1. Introduction and Background

More sustainable choices need to be made to maintain the planet’s ecosystems. If the harmful effects of humans on the environment are continued with no alteration, raw material and mineral deposits will be depleted, leading to permanent damage to the earth and atmosphere. Sustainable living methods not only help reduce contamination and waste but also conserve natural resources. For non-renewable construction materials, the rate of depletion should not exceed the rate of development of renewable alternatives. Also, regarding pollution, the rate of waste production should not exceed the environmental ability to absorb that waste.
For many years, the construction sector has been exploring ways to alleviate its negative impact on the environment. Construction and demolition waste (CDW) causes harm to the underground water and surrounding habitations. This negative impact on the environment could be considerably decreased by recycling such materials. Recycled construction material is any product that has formerly been used in a structure, including masonry, steel, concrete, and timber. Recycling concrete consists of breaking, removing, and crushing concrete from old structures or rejected precast units. Crushed concrete is used to create recycled aggregate (RA) that can be utilized for the partial or full replacement of natural aggregate (NA) in new constructions. In the United Arab Emirates, recycled aggregate (RA) is used for non-structural applications as a subbase or base material in roads, parking lots, and driveways. Recently, RA has been used as a partial replacement (up to 20%) for normal-weight coarse aggregate (NWA) in making new concrete mixes for buildings and bridges. However, a high percentage or the full replacement of NWA for structural applications is not widely accepted due to the variability of RA properties, which might affect the mechanical properties of concrete. Several research efforts have been devoted to improving concrete mixes prepared with a high percentage or 100% of RA to meet the strength and durability requirements of structural elements.

1.1. Properties of Recycled Aggregates

The source of CDW and the recovery process from demolished concrete structures affect the physical and mechanical properties of recycled aggregates. The exposure of concrete structures to loading and different environmental conditions might lead to weaker or contaminated RA. In addition, the recovery process can produce cracked aggregates, different particle distribution, and aggregates with adhered mortar, which affect the absorption capacity of recycled aggregates. Past experience [1,2,3] has shown that recycled aggregate has somewhat inferior properties compared to natural aggregates, which impacts the mechanical behavior of hardened concrete. In general, the compressive strength, modulus of elasticity, tensile capacity, bond, and shear strength of concrete made with RA tend to be slightly lower than those of conventional concrete. This is mainly because recycled aggregates from demolition waste are partially coated with old mortar, which is usually weaker and possesses less stiffness than natural stone.

1.2. Performance of Concrete Structures Prepared with RA

At the structural level, most studies have supported the notion that stiffness tends to decrease, while strength and deflection tend to increase, when RA is used in place of NA in reinforced concrete members. Although there is a wealth of published research on the appropriateness of using RA in concrete for structural applications, clear design guidelines are lacking or, at best, incomplete. Hence, there is a need for further research on the short- and long-term effects of RA on structural behavior and durability.
Table 1 summarizes some of the research efforts found in the literature that have focused on the evaluation of the flexural behavior of structural concrete made with recycled aggregate. The majority of the published research on the subject indicates that beams made with recycled aggregate concrete (RAC) often have slightly less initial stiffness, more cracks, larger deflection, and either similar or marginally lower ultimate flexural strength compared to corresponding beams made with natural aggregate concrete (NAC). In addition, the current theoretical approaches in design codes were found to be applicable to predicting the flexural capacity of recycled aggregate concrete beams [4,5,6,7,8,9,10,11,12,13,14,15,16,17,18].
Most of the available research on the shear behavior of structural concrete made with recycled aggregate suggests that beams made with RA concrete possess either just about the same or marginally inferior ultimate shear strength compared to corresponding beams made with NA concrete. Table 2 summarizes some of the related research efforts found in the literature [19,20,21,22,23,24,25,26,27,28,29,30,31,32,33].
In this study, the primary aim of the investigation was to delve deeper into the shear and flexural strength aspects of concrete beams constructed using RA from a local recycling facility in the UAE. In addition, the application of the ACI 318-19 [34] provisions to predict concrete shear strength and flexural strength was evaluated. Furthermore, the pseudo-strut-and-tie simplified model devised by Matamoros and Wong [35] was utilized to predict the shear strength of the concrete beams, in alignment with the ACI 318 code’s recommendation of the strut-and-tie method for deep beams ( a / d < 2), as is evident in the shear beams under study. The predictions were then compared with the experimental results. Ultimately, this study’s overarching goal was to make design recommendations for shear and flexure, encompassing the potential integration of locally produced recycled coarse aggregate within concrete beams. This research builds on the previous work of the senior authors on the subject by greatly extending the experimental and theoretical components of the study [36,37].

2. Research Significance

In a world that increasingly values substantial data repositories, there is a growing need for extensive records to improve building codes that endorse sustainable materials and green building methodologies. This research contributes to the efforts that aim to provide more sustainable choices and the preservation of natural resources. It is expected that the outcome of this research will encourage design engineers to consider recycled aggerates for structural applications.

3. Experimental Study

The main objective of the experimental program was to investigate the feasibility of utilizing a coarse recycled aggregate produced at a local facility [38] in structural applications and assess the applicability of the ACI 318 code to predict the design strength of concrete prepared with recycled aggregates. To achieve the study’s objectives, the influences of both concrete compressive strength and the proportion of coarse aggregate replacement on shear and flexural strength were evaluated. The experimental program consisted of three phases. Phase I focused on the evaluation of the recycled aggregate materials. Phase II was devoted to mix proportioning and the evaluation of the concrete’s hardened properties, and in Phase III, the performance of 12 reinforced recycled aggregate concrete beams was evaluated. The 12 beams were divided into two groups. The first group of six beams was designed for a shear strength assessment, having dimensions of 1.5 m × 0.2 m × 0.3 m, and was subjected to a single load close to one support. The remaining six beams were tailored to evaluate flexural strength, having exhibited dimensions of 2.0 m × 0.2 m × 0.3 m and been subjected to two equal loads near the central region. The beams underwent assessment as simple spans within the confines of a universal testing machine (UTM) in a structural laboratory, utilizing a displacement-controlled loading procedure. During these evaluations, a periodic recording of the actuator’s load and extension occurred. Two levels of recycled coarse aggregate replacement ratios were explored, 50% and 100%, in conjunction with control specimens featuring no replacement (0%). The study focused on two distinct concrete compressive strengths, specifically, f c values of 25 MPa and 35 MPa.
Figure 1 summarizes the experimental program and specifications followed during the evaluations.

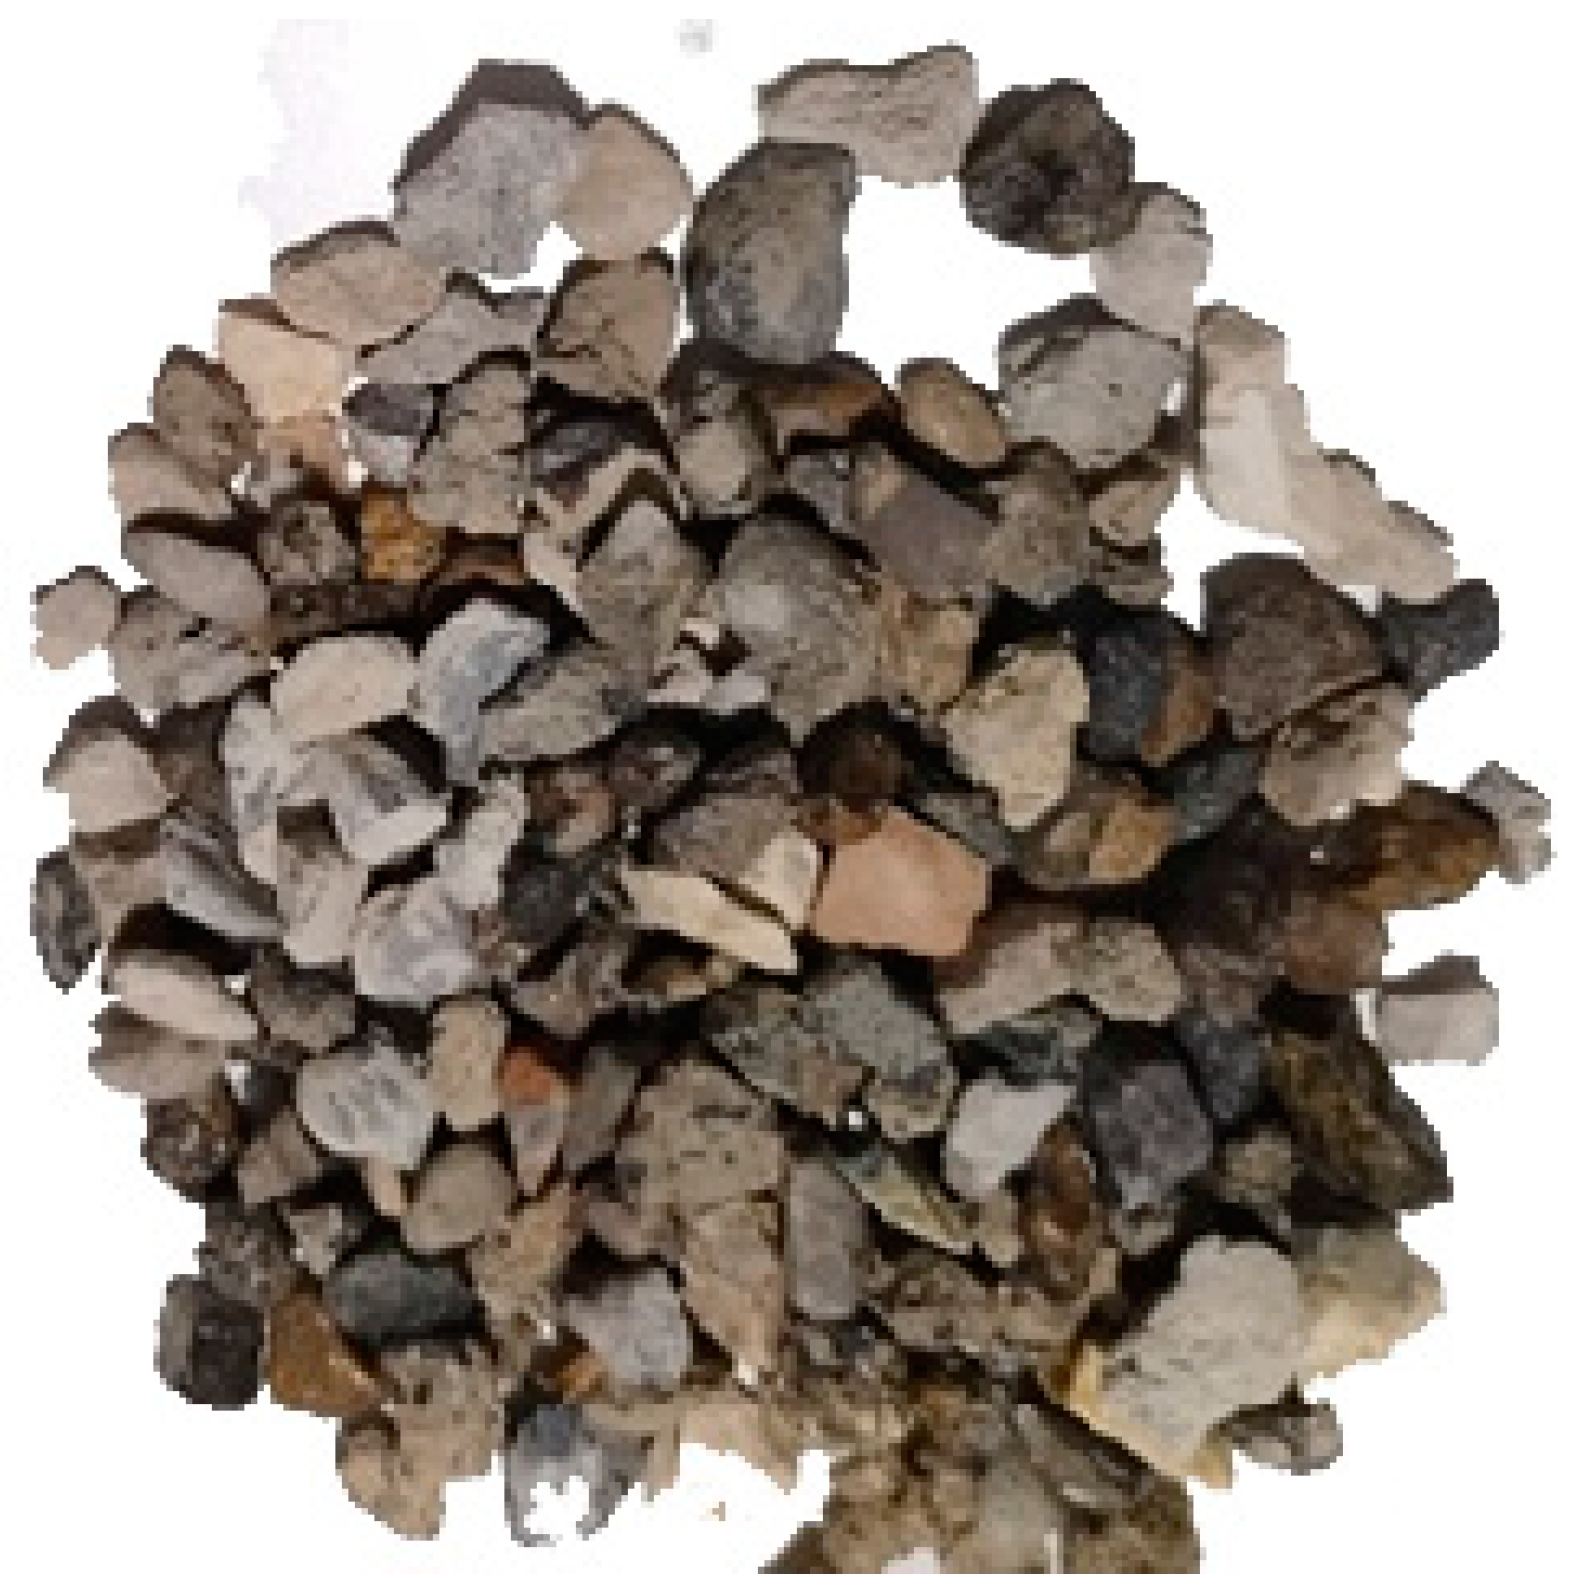
3.1. Material Properties

ASTM type I Ordinary Portland cement was used in all concrete mixes. Samples of the steel bars used in this study, specifically 8 mm, 10 mm, and 16 mm in size, underwent testing to determine their yield strength, ultimate strength, and modulus of elasticity. Figure 2 illustrates the stress–strain relationships of the three different steel samples: 8 mm, 10 mm, and 16 mm. The testing of the steel samples revealed that the modulus of elasticity (E) for the steel was found to be 200,000 MPa. Furthermore, the yield strength ( f y ) of the steel ranged between 540 and 590 MPa, while the ultimate strength ( f u ) ranged between 625 and 700 MPa. Understanding the characteristics of steel reinforcement is crucial for evaluating the structural behavior and performance of reinforced concrete elements.
The recycled coarse aggregate (RA) utilized in this study was derived from old concrete demolition waste. The waste material underwent a processing procedure at Beeah’s Waste Management facility [38] located in Sharjah, the United Arab Emirates (UAE). In all the mixtures investigated in this study, two distinct maximum coarse aggregate sizes were employed, specifically 10 mm and 20 mm. Sieve analysis was conducted to determine the grading of aggregates in the mix design and to make sure that the mix ratios were between the upper and lower bounds. The experiment was conducted in accordance with ASTM C-136 [39], and the results were evaluated according to ASTM C-33 [40]. Several trial concrete mixes were evaluated. Then, it was determined that a combination of 80% 20-mm-size aggregates and 20% 10-mm-size aggregates yielded the optimal results for both target strengths. Figure 3 presents the sieve analysis results for the concrete mixes.
Moreover, a set of tests and experiments summarized in Figure 1 to cover the properties of the aggregates were conducted at the American University of Sharjah (AUS) lab. Firstly, the RA was visually compared to natural aggregate (NA) by taking random samples of aggregate and checking the aggregate’s visual characteristics and the availability of impurities. It was found that the 10 mm RA contained a higher percentage of impurities (contamination) than the 20 mm RA. Figure 4 shows a sample taken from the 20 mm RA. Also, in general, the NA were compacted and rounded with a smooth texture, while the RA were angular and elongated and had a rough texture.
Then, an aggregate crushing value (ACV) experiment was conducted following the guidelines outlined in BS 812: Part 110: 1990 [41]. This test provides a relative measure of an aggregate’s resistance to crushing when subjected to a gradually applied compressive load. In this study, it was observed that the NA exhibited lower ACV values compared to the RA. Specifically, the 20 mm NA demonstrated a reduction in ACV ranging from 23% to 42% when compared to the 20 mm RA, whereas the 10 mm NA displayed a decrease in ACV by up to 12% when compared to the 10 mm RA. Furthermore, the LA (Los Angeles) abrasion test, as per ASTM C131-20 [42], was employed to evaluate the aggregate’s resistance to degradation. The results indicated that the 20 mm NA exhibited an 18% to 28% lower LA abrasion value in comparison to the 20 mm RA. Similarly, the 10 mm NA demonstrated a decrease in its LA abrasion value by 6% to 23% when compared to the 10 mm RA. The results of both tests for the NA and RA samples are presented in Table 3. It is important to note that high values of ACV and LA indicate a weak aggregate. In the case of RA, a high percentage value could be attributed to the loss of adhered mortar that is attached to the aggregate during the recovery process.
To gain further insights into the properties of the aggregates and facilitate the mix design process, several tests were conducted on the aggregates, including bulk density (according to ASTM C29 [43]), specific gravity, and absorption, as per ASTM C127 [44]. The obtained results using the NA and RA samples are presented in Table 4.
As indicated in Table 4, the bulk specific gravity (BSG) of the 20 mm NA was found to be approximately 9% higher than that of the 20 mm RA. Also, the BSG of the 10 mm NA showed a slight, 3% increase compared to the 10 mm RA. This can be attributed to the residual mortar attached to RA. However, the apparent specific gravity (ASG) of both the 20 mm and 10 mm NA was observed to be nearly equivalent to the respective 20 mm and 10 mm RA values. A noticeable distinction was evident in the absorption values between NA and RA. The absorption of the 20 mm RA was approximately three times higher than that of the 20 mm NA, while the absorption of the 10 mm RA was about 40% higher than that of the 10 mm NA. This disparity can be attributed to the higher porosity of RA compared to NA and the existing mortar around the RA. In general, RA tends to have higher porosity due to the presence of residual mortar and the potential presence of surface cracks or voids. These factors contribute to the increased absorption capacity of RA compared to NA. The higher absorption of RA should be considered during concrete mix design and proportioning to ensure the appropriate adjustment of water content and achieve the desired concrete properties. Natural fine aggregate was incorporated in all the mixes, and the fineness modulus is presented in Table 5.

3.2. Mix Design

Concrete mixes with two target compressive strengths, low (25 MPa) and medium (35 MPa), were prepared. In addition, three RA replacement ratios (0%, 50%, and 100%) were considered. Several trials were conducted to decide the best mix design proportions utilizing the experimental results and the properties of the materials. Due to variations in aggregate properties and the specific objectives of the study, the researchers developed six distinct mix designs. Four of these designs involved the incorporation of RA with replacement ratios of 50% and 100% while targeting the two concrete compressive strengths. The remaining two mix designs served as control specimens, utilizing only NA and also targeting the same two compressive strengths. The proportions of each mix design pertaining to the RA concrete are summarized in Table 6, while the mixing proportions of the NA concrete are presented in Table 7. To provide standardized terms for each mix design, a specific labeling scheme was followed. Each mix design was assigned a specific label according to the format “Z-X-YY.” The letter “Z” was R for RA and N for NA, followed by “X,” which indicates the targeted concrete compressive strength and has two values, “L” and “M.” “YY” represents the RA replacement ratio. For example, Mix Design 1 with a 50% RA replacement ratio and a targeted compressive strength of 25 MPa would be labeled as “R-L-50.” Likewise, Mix Design 4 with a 100% RA replacement ratio and a targeted compressive strength of 35 MPa would be labeled as “R-M-100.” This labeling scheme ensured a consistent and easily identifiable referencing system for each mix design throughout the study.
Two factors influenced the performance of the RA mixes positively: the pre-soaking of the recycled aggregates for 30 min in water and the addition of a super-plasticizer admixture. The pre-soaking process improved the water absorption of the aggregate, reducing its tendency to absorb water during mixing and, thus, enhancing its workability. A detailed discussion of the pre-soaking effect on the concrete properties has been presented elsewhere, in [52,53], whereas the inclusion of a super-plasticizer admixture further improved workability without compromising the concrete’s strength.

3.3. Fresh and Hardened Concrete Properties

Following the mixing process, the concrete underwent a series of evaluations and tests utilizing various experimental procedures. The initial assessment involved the slump test, conducted in accordance with ASTM C143-20 [45]. The slump test was designed to assess the workability of cement concrete. Workability, in essence, measures the concrete’s capacity to be mixed, handled, placed, and compacted effectively to attain its desired final shape. RA concrete is commonly associated with low workability due to its higher water absorption ratio resulting from the presence of old mortar adhering to the aggregates [1]. However, as previously mentioned, the implementation of pre-soaking and the addition of a super-plasticizer effectively addressed this concern. Based on the conducted tests, the slump measurement yielded similar values for both concrete types: RA and NA. The slump test shown in Figure 5 resulted in a value of around 10~12 cm for the NA and for the RA concrete.
The subsequent stage involved assessing the hardened concrete through various testing procedures. The initial test conducted was to determine the compressive strength of the concrete using cube samples. For each mix, cube specimens were prepared and subjected to crushing tests at 3-, 7-, 14-, and 28-day ages, following the guidelines specified in BS EN 12390–3:2019 [46]. This allowed for the monitoring of the compressive strength development of both the RAC and the control NAC over time. Table 8 presents an average of two cubes’ compressive strength obtained from the cube samples that were prepared during the concrete mixes.
The development of the concrete strength of all mixes was, interestingly, very close for each target group, as can be seen in Figure 6.
Moreover, at the age of 28 days, cylinders were tested according to ASTM C39 [47] for compression strength and the modulus of elasticity, following ASTM C469 [48]. The results showed that the compressive target was somewhat achieved for all the concrete mixes and that the 28-day results were very close for the concrete mixes that had the same targets but different RA replacement ratios. The results of cylinder compressive strength are depicted in Figure 7. Figure 8 shows typical failure modes for cubes and cylinders.
Moreover, the splitting tensile strength in concrete specimens was tested in accordance with ASTM C496 [49]. The test involved using a cylinder with dimensions of 100 mm in diameter and 200 mm in height, which was positioned horizontally on its sides. A compression machine was employed to apply a load to the cylinder until it split, providing a measure of the concrete’s tensile strength, as shown in Figure 9.
Figure 10 displays the outcomes of the split tests conducted on concrete mixes. It is noteworthy that the N-L-0 and R-L-50 mixes exhibited similar reported tensile strengths, while the R-L-100 mix showed a lower tensile strength, which could be expected due to the higher proportion of RA and the potential presence of impurities associated with it. The R-M-100 mix achieved the highest tensile strength among all the mixes, recording a remarkable 23% increase in comparison to its NA mix counterpart. This improved result of the R-M-100 mix can be attributed to the rough texture of the RA, which enhances the interlocking action within the concrete. This interlocking effect contributes to an improved tension behavior in concrete containing RA [31]. The presence of such surface characteristics in the RA can create a more efficient stress transfer mechanism, resulting in the observed increase in tensile strength.
The modulus of elasticity (E) test was conducted following the guidelines outlined in ASTM-C469 [48]. In this study, the secant method was utilized to determine E. Figure 11 summarizes the modulus of elasticity values of the six mixes. It can be noticed that the value of the samples from within each group was very comparable for all R%.
Typically, the modulus of elasticity exhibits a decline as the content of RA increases. However, the decrease is contingent upon the inherent attributes of the RA, including its type and size and the quality of the initial material [54].
Furthermore, an important step was to determine the modulus of rupture according to ASTM C293 [50]. This test assesses the flexural strength of concrete using a center-point-loading configuration with rectangular beam specimens. The maximum load at which the specimen fractured was recorded, and Equation (1) was used to calculate the modulus of rupture. The test is shown in Figure 12, and the results are presented in Table 9.
R = 3 P L 2 b d 2
where R = the modulus of rupture in MPa, P = the maximum applied load indicated by the testing machine, N, L = the span length, mm, b = the average width of the specimen at the fracture in mm, and d = the average depth of the specimen at the fracture in mm.

4. Beam Testing

Beams were cast from each mix design, including the control mixes, at the laboratory of AUS to examine the flexural and shear behavior of RA concrete. Subsequently, the beams underwent testing using a universal testing machine (UTM) until failure. The experimental results were then compared to the provisions outlined in ACI 318-19 [34] and other theoretical predictive methods to assess the applicability of these equations to beams constructed with RA.

4.1. Beams’ Preparation and Instrumentation
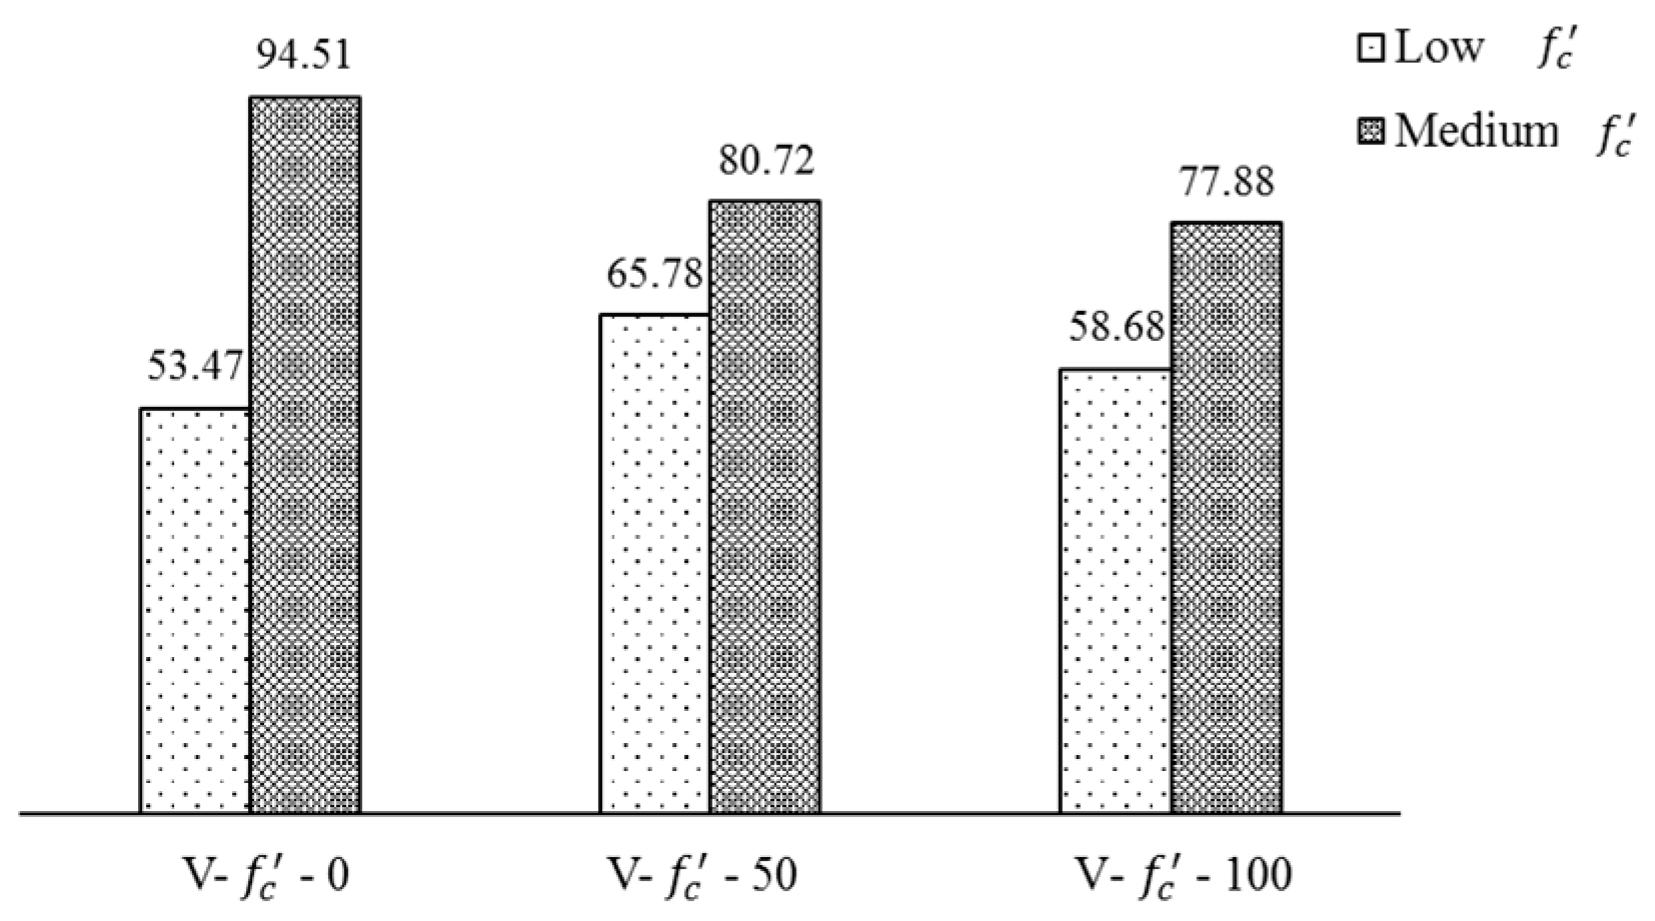
Six beams with dimensions of 2.0 m × 0.3 m × 0.15 m were tested for their flexure, while another six beams with dimensions of 1.5 m × 0.3 m × 0.15 m were tested for their shear. The load was applied to the specimens in a displacement-controlled environment at a rate of 2 mm/min for the flexural tests and 1 mm/min for the shear tests. This controlled rate allowed for the capturing of the descending portion of the load–displacement relationship accurately. In the shear beam configuration, stirrups with 100 mm spacing were terminated at a distance of 500 mm from one of the beam ends. This deliberate arrangement allowed the beam to primarily experience shear-induced failure in the instrumented area. The remaining sections of the beam were equipped with stirrups to prevent premature failure. Furthermore, the load was applied at the end of the area without stirrups (a = 400 mm). On the other hand, the flexure beams were designed with stirrups positioned at both ends at up to 750 mm of the beam’s length with 100 mm spacing. However, the middle 500 mm were intentionally left without stirrups. This design allowed the beam to experience failure primarily due to flexural force. Figure 13 shows the dimensions and details of a shear and a flexure beam specimen. Also, Table 10 shows the characteristics of the 12 beams tested in the study. To maintain consistency with the naming convention used for the concrete mixes, the beams’ labels in the table were assigned with the prefix “V” to indicate the beams that were specifically tested for their shear and with “F” for the beams tested for their flexure.
The initial step involved the preparation of steel cages for the beams, taking into consideration the specific steel details mentioned earlier. The steel cages were constructed according to the specified dimensions, reinforcement requirements, and placement instructions outlined in the study. The steel cages of the shear and the flexure beam specimens are shown in Figure 14.
In addition, strain gauges were meticulously affixed to the bottom reinforcement bars of the shear beams and precisely positioned beneath the loading point. For the flexure beams, the strain gauges were strategically placed at the mid-span region, where the stresses were anticipated to reach their maximum values. These strain gauges were utilized to measure and monitor the strain levels undergone by the reinforcement bars during the testing process. Furthermore, in the flexure beams, three strain gauges were installed on the surface of the concrete, in the middle of the beam, and at a distance of 20 mm from the top surface of the beam, while the other two were positioned at 50 mm intervals.
Additionally, linear variable displacement transformers (LVDTs) were used to measure the vertical linear displacement of the beams during the loading protocol. Each beam was equipped with an LVDT positioned at locations where the maximum stresses were anticipated to occur, mirroring the placement of the strain gauges. The beams were supported in a simply supported configuration, which allowed for controlled lateral movement. In addition, the beams exhibited an overhang length of 100 mm beyond the two supports. The shear beams were subjected to a loading scheme characterized by a single-point load, while the beams tested for flexure were loaded using a four-point loading configuration. The setup of both beam types during the testing procedure is illustrated in Figure 15. During the testing procedure, the cracks that developed on the surface of the specimens were tracked and traced using markers. Additionally, photographs were captured at different stages of the tests.

4.2. Shear Results

One of the experimental program’s objectives was to investigate the shear strength of concrete beams constructed utilizing RA. A total of six beams with dimensions of 1.5 m × 0.3 m × 0.2 m were tested, two of which served as control specimens utilizing NA. All beams were subjected a single load such that the shear span-to-effective depth ratio a/d = 1.5, in which a is the horizontal distance between the applied load and near support and d is the vertical distance between the top of the beam and the center of the longitudinal reinforcement. The investigation focused on two key parameters: the concrete compressive strength ( f c ) and the RA replacement ratio (R%). Among the RA beams, two were designed with a targeted compressive strength of f c = 25 MPa, one was designed with an RA replacement ratio of R% = 50%, and the other was designed with R% = 100%. Similarly, the remaining two RA beams had R% = 50% and R% = 100%, respectively, while targeting a compressive strength of f c = 35 MPa. By varying the R% and f c while keeping other parameters, such as the span-to-depth ratio, the vertical and longitudinal reinforcement ratio, and beam dimensions, constant, the study aimed to ensure consistent and reliable results. This approach provides valuable insights into the independent effects of these parameters on the shear strength of the concrete beams, contributing to a better understanding of their impact on structural applications. Following the shear beam testing inside the UTM, the load-versus-deflection relationships of all six beams were obtained from the machine itself, and the LVDTs and are presented in Figure 16. The load obtained from the UTM was converted to shear using statics, which resulted in a maximum shear within the instrumented region between the applied load and near support equal to V = 0.69 P, where P is the load applied by the actuator head. The shear strength results obtained from the testing of the beams are presented in Table 11.
The results revealed that all the tested beams failed due to shear since the beams were designed as shear-deficient structures. As the applied load increased, initial flexural cracks emerged on the surfaces of the beams under the loading point, where the bending moment was at its maximum. These flexural cracks progressively extended vertically, while additional cracks formed in a similar vertical orientation away from the loading point. Subsequently, shear cracks with inclined angles developed from near the critical support towards the loading point within the instrumented region. These shear cracks continued to propagate with an increasing load until diagonal tension failure occurred. Figure 17 illustrates the vertical cracks that developed due to bending under the loading point. Additionally, the figure displays the major shear crack that led to the failure of the beam, exhibiting the characteristic shear failure pattern.
For all the tested beams, the primary cause of failure was a significant diagonal crack, leading to a sharp reduction in the beam’s load carrying capacity. Notably, the strain gauge readings confirmed that none of the longitudinal flexural steel reinforcements at the bottom of the beam reached the yielding state. Figure 18 presents a typical reading of one of the strain gauges that was used in this study, specifically the one that was installed on the longitudinal bottom rebars of the V-L-100 beam. At the maximum load, the reading of that strain gauge reached a maximum value of 0.0014 (mm/mm), which was below the nominal yield strain of reinforcement bars used in this study (0.00295 mm/mm), thus indicating that the flexural reinforcement did not yield during the test. Additionally, there was no compressive crushing of the concrete due to flexure at the location of the applied load, further validating the failure mode primarily as shear-induced.

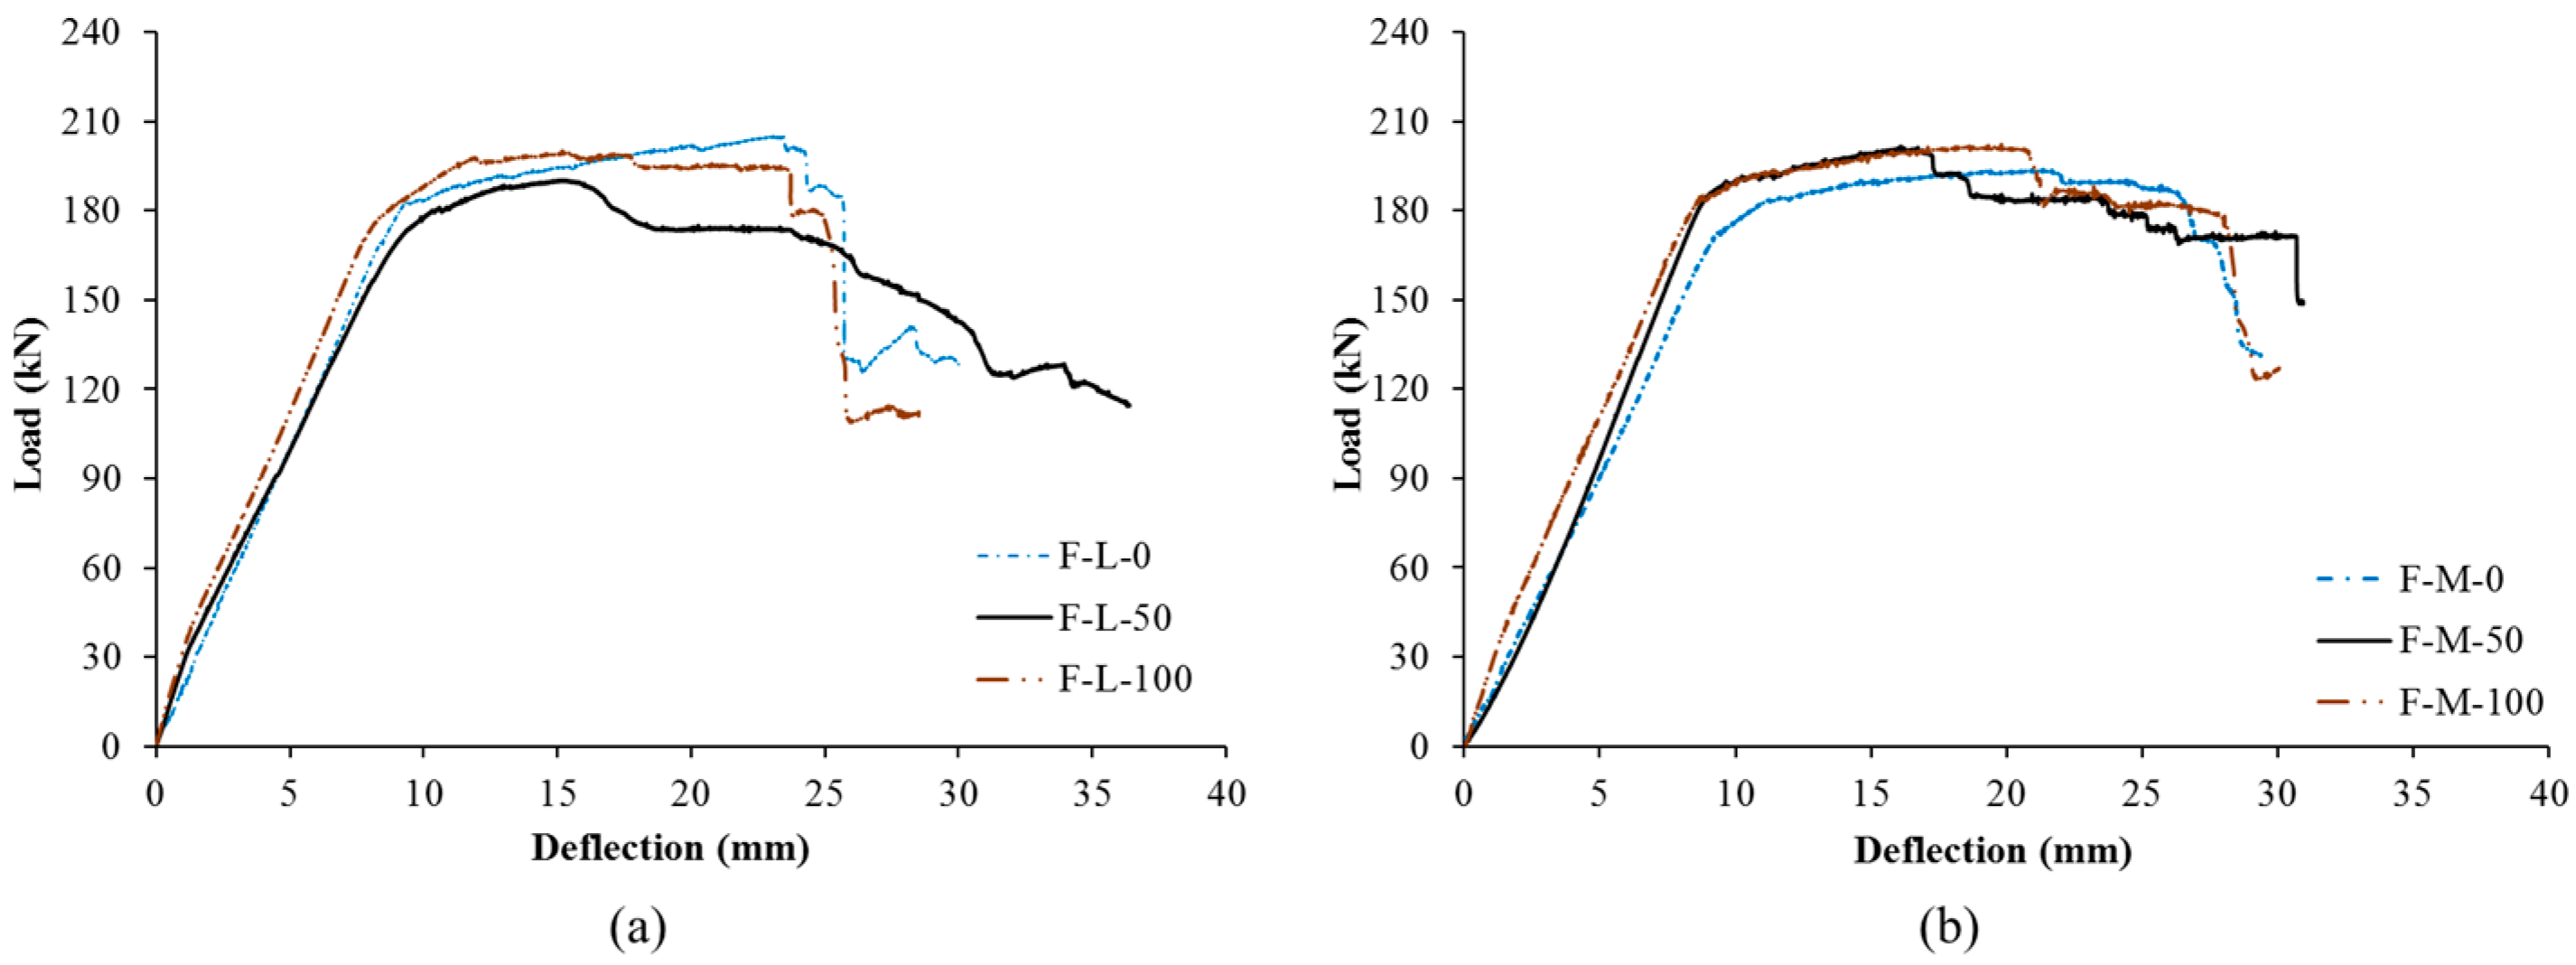
4.3. Flexure Results

Similar to their shear, the flexural behavior of beams constructed with RA was investigated. A total of six beams with dimensions of 2 m × 0.3 m × 0.2 m were tested, with two of them constructed using NA to serve as control samples. However, the beams were loaded using a four-point loading protocol, as shown in Figure 15b. Following the testing of the beams in the UTM, the load–deflection curves were obtained, and they are presented in Figure 19. By analyzing the results, the maximum load sustained by the beams before failure was determined. The load from the UTM was converted to the bending moment using statics, which resulted in maximum flexure within the instrumented central region between the applied loads equal to M = 0.3 P, where P is the total load applied by the actuator head. The maximum load and corresponding moment of each beam are summarized in Table 12.
All the beams underwent failure due to flexure, which resulted in bending and the development of tension at the bottom of the beams and compression at the top regions. The failure of the beams was primarily attributed to the compression of the concrete, particularly since the bottoms of the beams were reinforced with two No. 16 rebars. The readings from the strain gauges that were installed on the bottom longitudinal reinforcement confirmed that the bottom steel indeed yielded. Figure 20 presents the reading record from one of the strain gauges, specifically the one that was installed on the bottom steel bars of the F-L-50 beam. When the beam reached the maximum load, the strain reached up to 0.0070 (mm/mm) during the test, which exceeded the nominal yielding strain for steel reinforcement (0.00295 mm/mm).
Furthermore, an interesting observation of the load–deformation relationships is that most of the beams exhibited similar maximum load values. This can be explained by the fact that, in flexural strength, the primary resistance comes from the bottom longitudinal reinforcement, rather than the concrete itself, especially when considering tension strength. The role of concrete in resisting the bending moment is secondary in comparison to the reinforcement. Thus, the load values remained relatively consistent across the beams due to the dominant influence of the reinforcement in resisting the applied loads on beams with like dimensions. Pictures of the beams that failed in flexure are shown in Figure 21.

5. Discussion of Beam Test Results

This section focuses on discussing the results obtained from the experimental testing of the twelve beams. The analysis primarily revolves around three key aspects: the impact of concrete compressive strength, f c , the influence of the RA replacement ratio (R%), and the applicability of the ACI318 code [34] provisions for the shear and flexure of beams constructed with RA. The first objective was to examine the effect of concrete compressive strength and the RA replacement ratio on the shear and flexural strength of the RA beams by comparing their results with those of the NA beams. This comparative analysis helps identify any variations and ascertain the extent of the influence that these factors have on the shear and flexural behavior of the beams. Furthermore, the feasibility of utilizing the ACI code provisions for the shear and flexure of beams constructed with RA is investigated. This is achieved by comparing the experimental results obtained from the testing program with the theoretical predictions derived from the ACI318 code equations [34], which will help determine the compatibility and applicability of the ACI318 code provisions in the context of RA beams.

5.1. Shear Tests

The influence of concrete compressive strength on shear capacity has been extensively investigated in the existing literature. A higher compressive strength of the concrete redirects the shear plane so that it traverses through the aggregates, rather than the mortar. Consequently, this alteration increases the overall shear strength of the concrete member. Furthermore, there exists a strong correlation between the concrete’s tensile strength and its compressive strength, which directly impacts the shear strength. Diagonal tension failure, a common cause of shear-related failure, is significantly influenced by the concrete’s tensile strength. Therefore, variations in compressive strength have notable implications on the shear behavior of concrete structures. The current study investigated the effect of two concrete compressive strengths, i.e., 25 MPa and 35 MPa, on shear strength. These compressive strengths were somewhat achieved as per the cylinders’ test results. The shear strength of all beams was calculated considering V in Table 11, which was equivalent to the experimental shear strength provided by concrete, Vc. Figure 22 shows the six beams paired according to the R% but with different f c values. The comparison of all pairs of beams revealed that the beams with higher concrete strengths exhibited greater shear capacity. The increase in f c directly contributed to the enhanced shear strength of the tested beams. This finding underscores the significant role of concrete strength in governing the shear capacity of beams, reaffirming the well-established correlation between higher compressive strength and improved shear performance in concrete structures. This correlation was particularly pronounced in the first pair of beams (V- f c -0), which were made with NA, compared to the other two pairs involving 50% and 100% RA. In the NA pair, one of the beams exhibited a 33% higher f c , which resulted in a significantly increased shear strength of 43% when compared to its counterpart. Meanwhile, in the RA pairs, the difference in f c was 22.7% for the V- f c -50 beams and 39.4% for the V- f c -100 beams, but the difference in the shear strength was 18.5% and 24.7%, respectively.
These observations indicate that, while the correlation between concrete compressive strength and shear capacity remained evident in the RA beams, its impact appears to be slightly less pronounced compared to the NA beams. Other factors, such as the presence of recycled materials and potential variations in material properties, may contribute to the observed deviations in the relationship between compressive strength and shear capacity in the RA beams. This finding aligns with the conclusions drawn by [23,31,55], who also observed that there is no distinct correlation between shear strength provided by concrete and f c in the case of RA beams.
The other factor that this study considered was the RA replacement ratio (R%). To focus only on this parameter and to alleviate the effect of the slight difference in the compressive strength of the beam, shear strength was normalized by dividing it by the term f c b d . Figure 23 illustrates the normalized shear strength of all beams organized into two groups, based on their similar compressive strength targets.
In the first group, which comprised beams with a lower compressive strength target, a notable observation was that the two beams with 50% and 100% replacement ratios achieved very similar normalized shear strength values. Interestingly, their normalized shear strength surpassed that of their counterpart NA beam by 12.5%. This intriguing finding could be attributed to the rough and jagged surface characteristics of the RA, which likely contributed to enhanced interlocking actions within the concrete matrix, leading to an increase in shear resistance. In contrast, in the second group, which contained beams with a higher compressive strength, the NA beam exhibited normalized shear strength which was 12.5% and 17.5% higher compared to the 50% RA and the 100% RA beams, respectively. It could be that the increase in the shear strength of the beams due to the increase in the concrete compressive strength above a certain level outweighed the increase that happened in the shear strength due to the presence of RA in the mix.
Furthermore, the load–deflection relationships presented in Figure 16 reveal additional insights into the behavior of the beams in Group 1 and Group 2. In Group 2, it was evident that the stiffness of the beams was highly comparable, showing similar slopes in their load–deflection curves. On the other hand, Group 1 exhibited variations in stiffness, as reflected in the differing slopes of their load–deflection curves. Moreover, the decrease in shear strength after reaching the ultimate load was more significant in Group 2 compared to Group 1. For instance, the V-30-50 beam in Group 1 underwent a decrease in strength of approximately 9% after failure, while its counterpart V-50-50 in Group 2 showed a more substantial decrease of approximately 50%. This observation highlights the increase in brittle behavior with the rise in concrete compressive strength.
Taking all these results into consideration, it is still important to confirm whether the shear provisions of the ACI318 [34] code can be applied to beams without stirrups.
The shear equation for beams not subjected to an axial load in the ACI 318-19 code [34] is expressed as follows:
V c = 0.66 λ s λ ρ w 1 / 3 f c b w d 0.42 λ f c b w d
where ρ w = A s b w d is the longitudinal reinforcement ratio, f c is the concrete compressive strength (MPa), λ is the light-weight concrete factor (for normal weight concrete λ = 1), d is the effective depth (mm), b w is the width of the beam (mm), and λ s is the size effect factor. The size effect factor, denoted as λ s , takes into account the thickness of the member, which is a function of the effective depth of the beam (d) in millimeters.
λ s = 2 ( 1 + d 250 ) 1.0
However, the ACI code recommends using the strut-and-tie method for deep beams. Since this is the case for all the beams that were investigated in this study ( a / d = 1.5), this study used a simplified strut-and-tie model proposed by Matamoros and Wong [35] to predict the beams’ shear strength. For beams without transverse reinforcement, the strength of the compressive strut based on the geometry of the node at the support can be determined using the following expression:
F s t r u t = f c   A = f c   l b s i n θ + h a c o s θ b
where l b is the width of the base plate (mm), h a is two times the distance between the centroid of the main reinforcement and the bottom of the beam (mm), b is the width of the web (mm), and the strut slope angle θ = tan−1(d/a). The maximum concentrated load that the simple beam can support is determined via the following expression:
P m a x = C c F s t r u t
where C c relates the applied force to the strength of the strut, which can be lower-bounded as a function of the shear-span-to-effective depth a / d ratio, obtained using
C c = 0.3 a / d 0.85   s i n θ
Figure 24 presents the ratio of the experimental shear strength obtained from the beams in this study to the predicted shear strength using both the aforementioned methods.
The V e x p / V p r e d i c t ratios that are presented in the previous figure can be easily distinguished into two groups. The first group pertains to the theoretically predicted shear strength using the ACI 318-19 code [34]. It is evident that this method tends to underestimate the shear strength of beams, yielding an average ratio of 2.4 with a standard deviation of 0.3. Notably, this observation encompasses beams made with both NA and RA. The covariance of the ACI code predictions was found to be 11%. Conversely, the second group comprises the ratios of the V e x p to the V p r e d i c t using the simplified strut-and-tie method of [35]. This method has demonstrated its suitability for predicting deep beams, as the average ratio for the considered beams was only 1.1 with a standard deviation of 0.1 and a covariance of 8.4%. This level of accuracy in the prediction encompasses both NA and RA beams.
Since shear failure is known to be due to brittleness, ductility was investigated in this study. Ductility refers to a structural element’s capacity to withstand high levels of deformation without undergoing collapse. This characteristic proves advantageous in structures necessitating energy dissipation, and it contributes significantly to the stability of a structural component as it nears its ultimate loads. In this study, the quantification of structural-member ductility was achieved through the use of the ductility index, denoted as µ, which was established based on information derived from the experimental load–deflection relationship, as follows:
μ = ( Δ 0.85 P m a x ) p o s t ( Δ 0.85 P m a x ) p r i o r
where ( Δ 0.85 P m a x ) p o s t refers to the beam deflection at the point where the load reaches 85% of the peak load after achieving its maximum. Conversely, ( Δ 0.85 P m a x ) p r i o r is the beam deflection at the juncture where the load attains 85% of the peak load prior to reaching the maximum on the load–deflection curve. The methodology employed in this study to quantify ductility aligns with that elucidated by Maekawa et al. [56], with the value of 85% serving as a representation of the minimal functional capacity of the structural element. The results are presented in Figure 25.
It can be deduced from the figure that there was a trend in which the increase in the RA replacement ratio is associated with an increase in the ductility index. This is applicable in both f c target groups. This could be due to the ability of the jagged RA to enhance the concrete bonding through their interlocking action even for larger deformations, hence delaying beam failure.

5.2. Flexure Tests

Concrete compressive strength does contribute to the flexure strength of a beam; however, this contribution is small compared to that which comes from longitudinal reinforcement. This is evident in the results presented in Figure 26. The results show that, for each pair of beams that have the same R% but different compressive strength targets (30 MPa and 50 MPa), the experimental flexural strength results were almost the same since the flexural strength of reinforced concrete beams primarily depends on the area of reinforcement, yield strength, and effective depth of reinforcement.
Moreover, the effect of the replacement ratio on the flexural strength of the beams was investigated. Figure 27 presents the flexure strengths of the beams grouped into two groups, based on their compressive strength target. The results also show that the R% had a minimal effect on the flexural strength of the beams.
Similar to shear, it is important to study the applicability of the ACI 318 code [34] provisions for flexure to the experimental results. Theoretical formulations were employed to predict the nominal bending moment capacity ( M n ) of the tested beams and to subsequently compare it with the experimental value ( M e x p ). This approach utilized nominal material properties in calculations conducted in accordance with ACI 318 [34]. The fundamental assumptions governing the flexural behavior of reinforced concrete beams, as per the ACI code, are as follows: (1) plane sections remain planes after bending; (2) a perfect bond between concrete and steel is assumed; (3) the tensile strength of concrete is ignored; (4) a maximum useful compressive strain of 0.003 mm/mm is considered in concrete; (5) compression in concrete at the ultimate state is based on the Whitney block model; and (6) the strain hardening of steel is neglected.
For under-reinforced sections, in which steel yields before concrete crushes in compression due to flexure, the ACI 318 code [34] recommends the use of the following equation to predict the ultimate moment of a beam:
M n = A s f y ( d a 2 )
in which A s is the steel reinforcement cross-sectional area (mm2), f y is the yield strength of the steel (MPa), d is the effective depth of the beam (mm), and Whitney’s block depth a = A s f y 0.85 f c b (mm).
In this study, all the cross sections were under-reinforced and doubly reinforced. In this case, the flexural strength at the ultimate state using the ACI 318 code [34] can be obtained from:
M n = A s f y A s   f s d a 2 + A s f s ( d d )
in which A s is the compression steel reinforcement cross-sectional area (mm2), d′ is the effective depth of the compression steel from the extreme compression fibers (mm), and f s is the stress in the compression steel (MPa), determined using:
f s = ρ f y 2 ρ + 300 ρ f y 2 ρ 300 2 + 510 β 1 f c d d ρ f y
where ρ = A s b d , ρ = A s b d , and β 1 is the ratio of Whitney’s block depth to the depth of the neutral axis from extreme compression fibers.
The ratios of the experimental moment results to their corresponding predicted moments are presented in Figure 28. The results show that the predicted flexure strength of the beams using ACI318 was 1.08 times the experimental results, on average, with a standard deviation of only 0.05 and a covariance of 4.31%. Also, the quantification of beam ductility was achieved by evaluating the ratio of deflection at the ultimate load, denoted as Δ P m a x , to the beam deflection at a load equivalent to 85% of the ultimate load, Δ P m a x , on the ascending segment of the load–deflection relationship obtained from tests:
μ = Δ P m a x Δ 0.85 P m a x
The ductility indices for tall beams with respect to their targeted compressive strength are illustrated in Figure 29.
The figure shows that the NA beam in the first group (low- f c -target) had a higher ductility index than the other two beams made with RA by an average of 41.5%. Also, it had the highest ductility index among all the flexure beams. This is consistent with the available literature, which has reported lower ductility in beams made with RA compared to their NA counterparts. On the other hand, the NA beam and the 100% RA beam in the medium-f’c-target group had a comparable ductility index, while the 50% RA beam had a lower value by about 20%. It should be noted that some of the flexural load–deflection relationships exhibited the maximum load early on within the test but kept more than 90% of the maximum capacity with increased deformation. This indicates significant ductility, although it is not manifested in the equation of the ductility index and results in Figure 29.

6. Conclusions

This study evaluated the feasibility of utilizing RA in concrete mixes for structural applications. The properties of NA and RA aggregates were examined. Several trail batches were prepared with different R% of RA, and the mechanical properties of the concrete were determined. In addition, the shear and flexure strength of beams made with recycled aggregate concrete were investigated. Twelve beams were experimentally tested in the lab, with six of them dedicated to shear assessment and the other six to flexure assessment. The exploration encompassed three distinct levels of recycled aggregate replacement ratios: 0%, 50%, and 100%. Additionally, the influence of concrete compressive strength was examined via two targeted values, specifically f c = 25 MPa and f c = 35 MPa. The experimental results were ultimately compared with the predictions of theoretical methods, such as the ACI and the simplified strut-and-tie method. The results of the study led to the following conclusions:
  • The mechanical properties of recycled aggregate generally exhibited lower performance compared to natural aggregate. For instance, the crushing value was reduced by up to 40%, and the LA abrasion value showed a decline ranging from 18% to 28% in the case of RA. Moreover, the absorption capacity of RA was significantly higher, reaching up to three times that of the 20-mm-size aggregate and approximately 40% higher for the 10 mm size. This variation can be attributed to the increased porosity of recycled aggregate relative to natural aggregate, which is further influenced by the presence of residual mortar surrounding the RA particles.
  • A satisfactory workability level was attainable for both the RA and NA mixes. To mitigate the impact of the elevated absorption levels inherent in RA, a combination of pre-soaking and the introduction of a super-plasticizer proved effective. The slump test yielded values of approximately 10 to 12 cm for both the NA and RA concrete specimens.
  • The progression of concrete strength development exhibited remarkable similarity across all mixes within each targeted strength category (25 MPa and 35 MPa). Additionally, a discernible pattern in terms of the tensile strength of the hardened concrete did not emerge consistently. The data revealed instances in which the RA concrete demonstrated superior values and vice versa. Notably, the modulus of elasticity observed in the RA concrete samples closely mirrored the results achieved using their NA counterparts.
  • Regarding shear strength, the six shear-tested beams with a small shear-span-to-depth ratio exhibited brittle failure due to the emergence of significant inclined shear cracks, in line with their design expectations. Notably, the beams with higher concrete strength displayed enhanced shear capacity. This correlation was particularly evident in the NA beam pair (V- f c -0). In this case, the beam with a 33% higher f c demonstrated a corresponding shear strength increase of 43% compared to its counterpart. Meanwhile, in the RA pairs, the disparity in f c was 22.7% for the V- f c -50 beams and 39.4% for the V- f c -100 beams. However, the difference in shear strength was recorded at 18.5% and 24.7%, respectively, for the corresponding RA pairs.
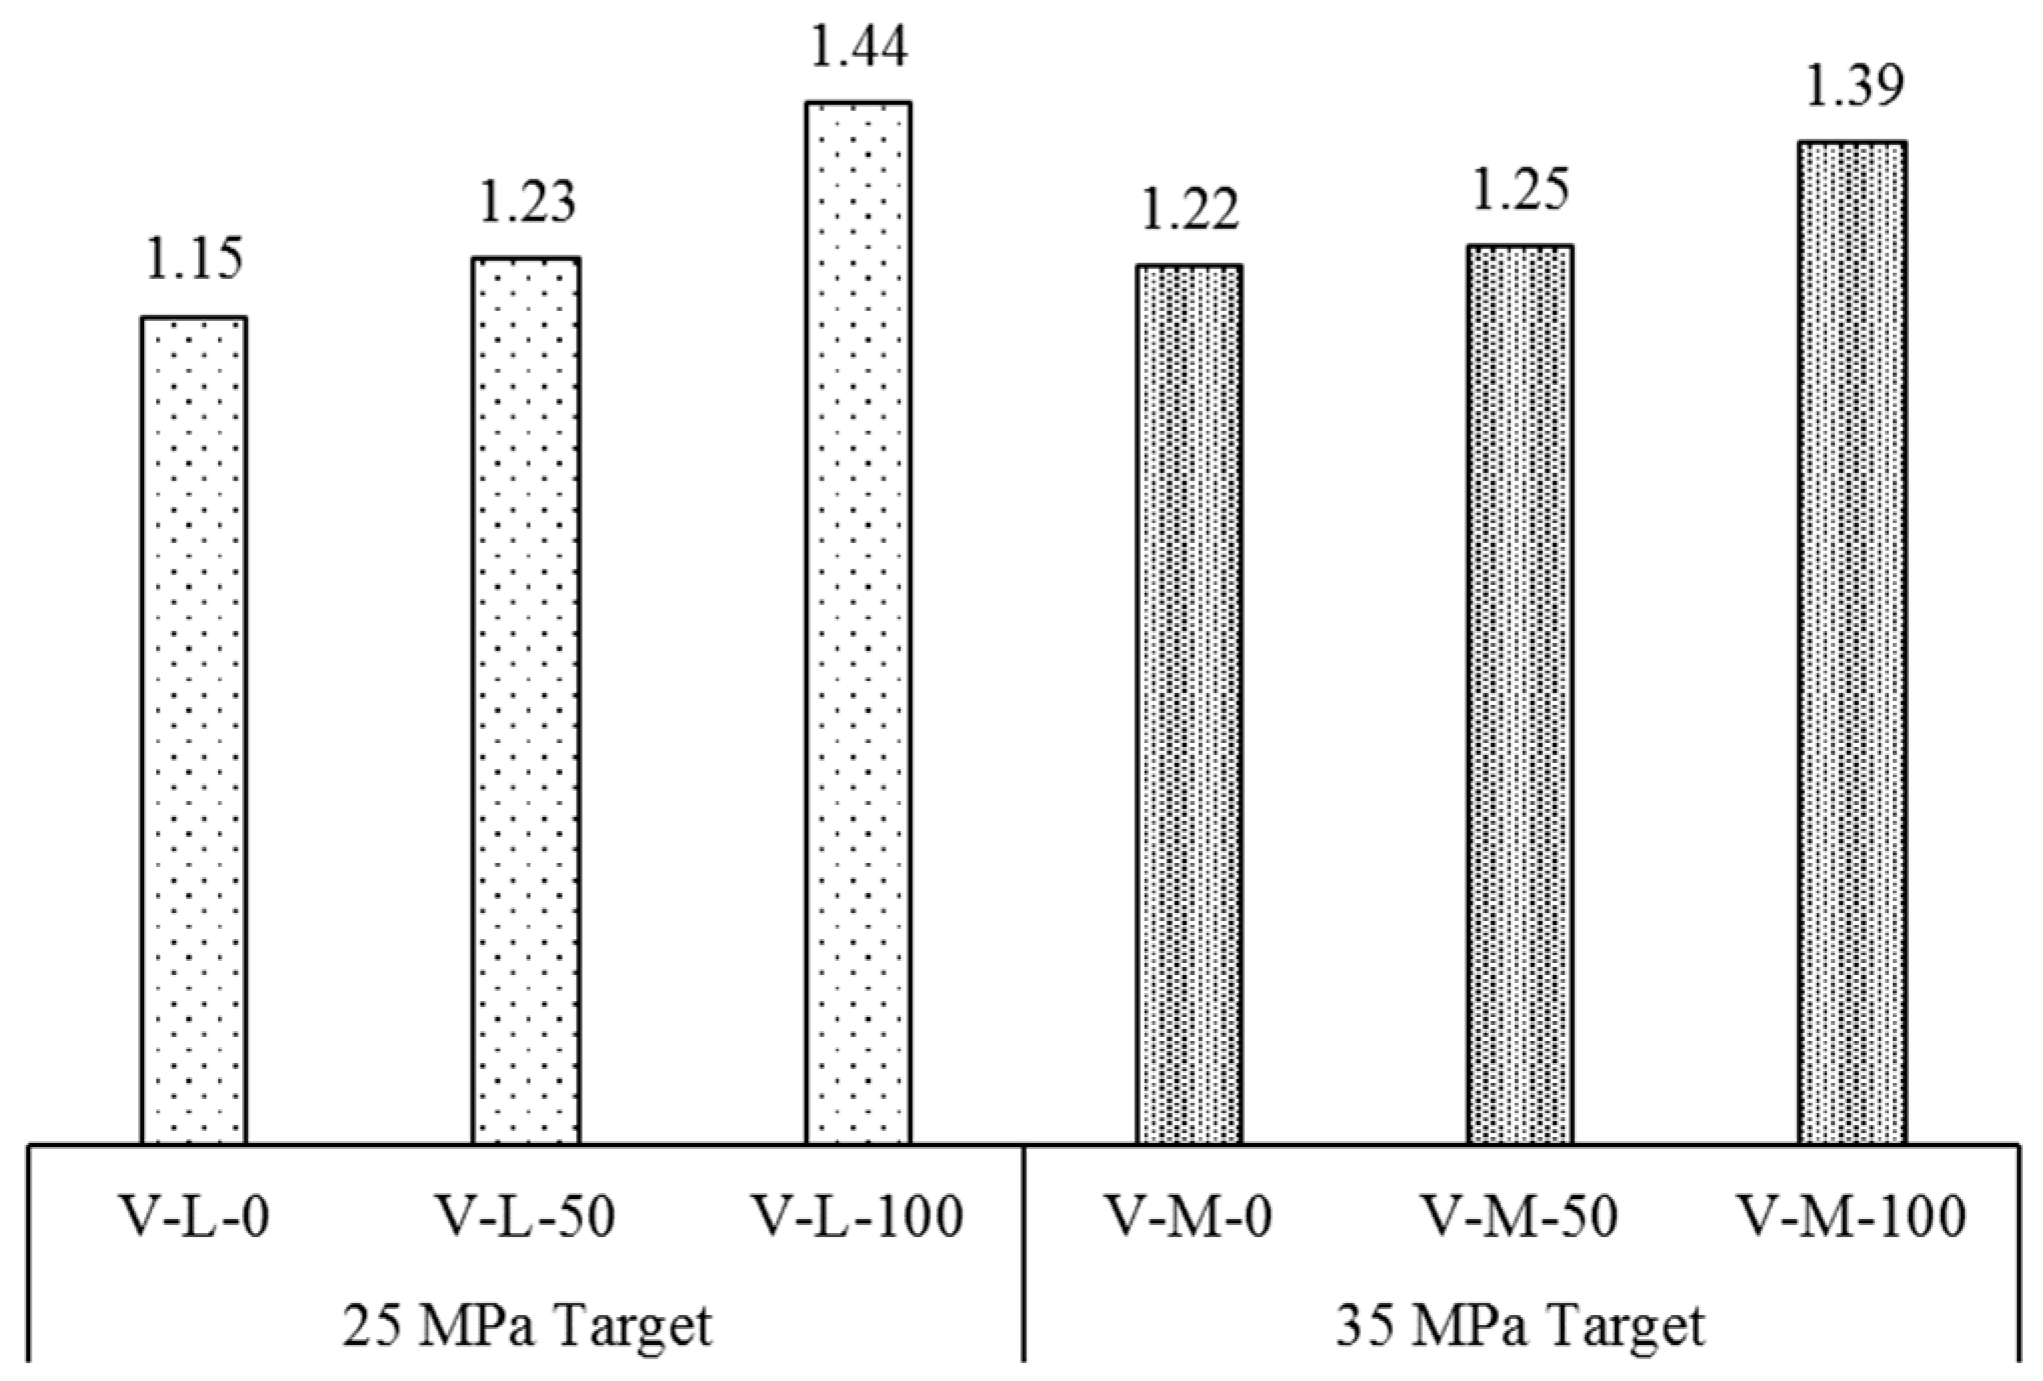
  • Among the beams targeted at f c = 25 MPa, the 50%- and 100%-replacement-ratio beams demonstrated closely matched normalized shear strength values that exceeded their corresponding NA beam by 12.5%. In contrast, for beams designed with an f c = 35 MPa target, the NA beam exhibited normalized shear strength surpassing the 50% RA and 100% RA beams by 12.5% and 17.5%, respectively. Additionally, the load–deflection relationships indicated that Group 1, which comprised beams with a low f c , underwent a post-failure strength decrease of approximately 9%, while Group 2, which comprised beams with a medium f c , encountered a more pronounced decrease of approximately 50%.
  • Concerning flexure, the results showed that the observed flexural strength exhibited minimal disparities for the beams that shared the same RA% but differed in their compressive strength targets (30 MPa and 50 MPa). This phenomenon is in line with the well-established understanding that the flexural strength of reinforced concrete beams is predominantly influenced by factors such as the cross-sectional area of reinforcement, yield strength, and effective depth of the reinforcement. The findings additionally indicate that the variation in RA% had a marginal impact on the flexural strength of the beams.
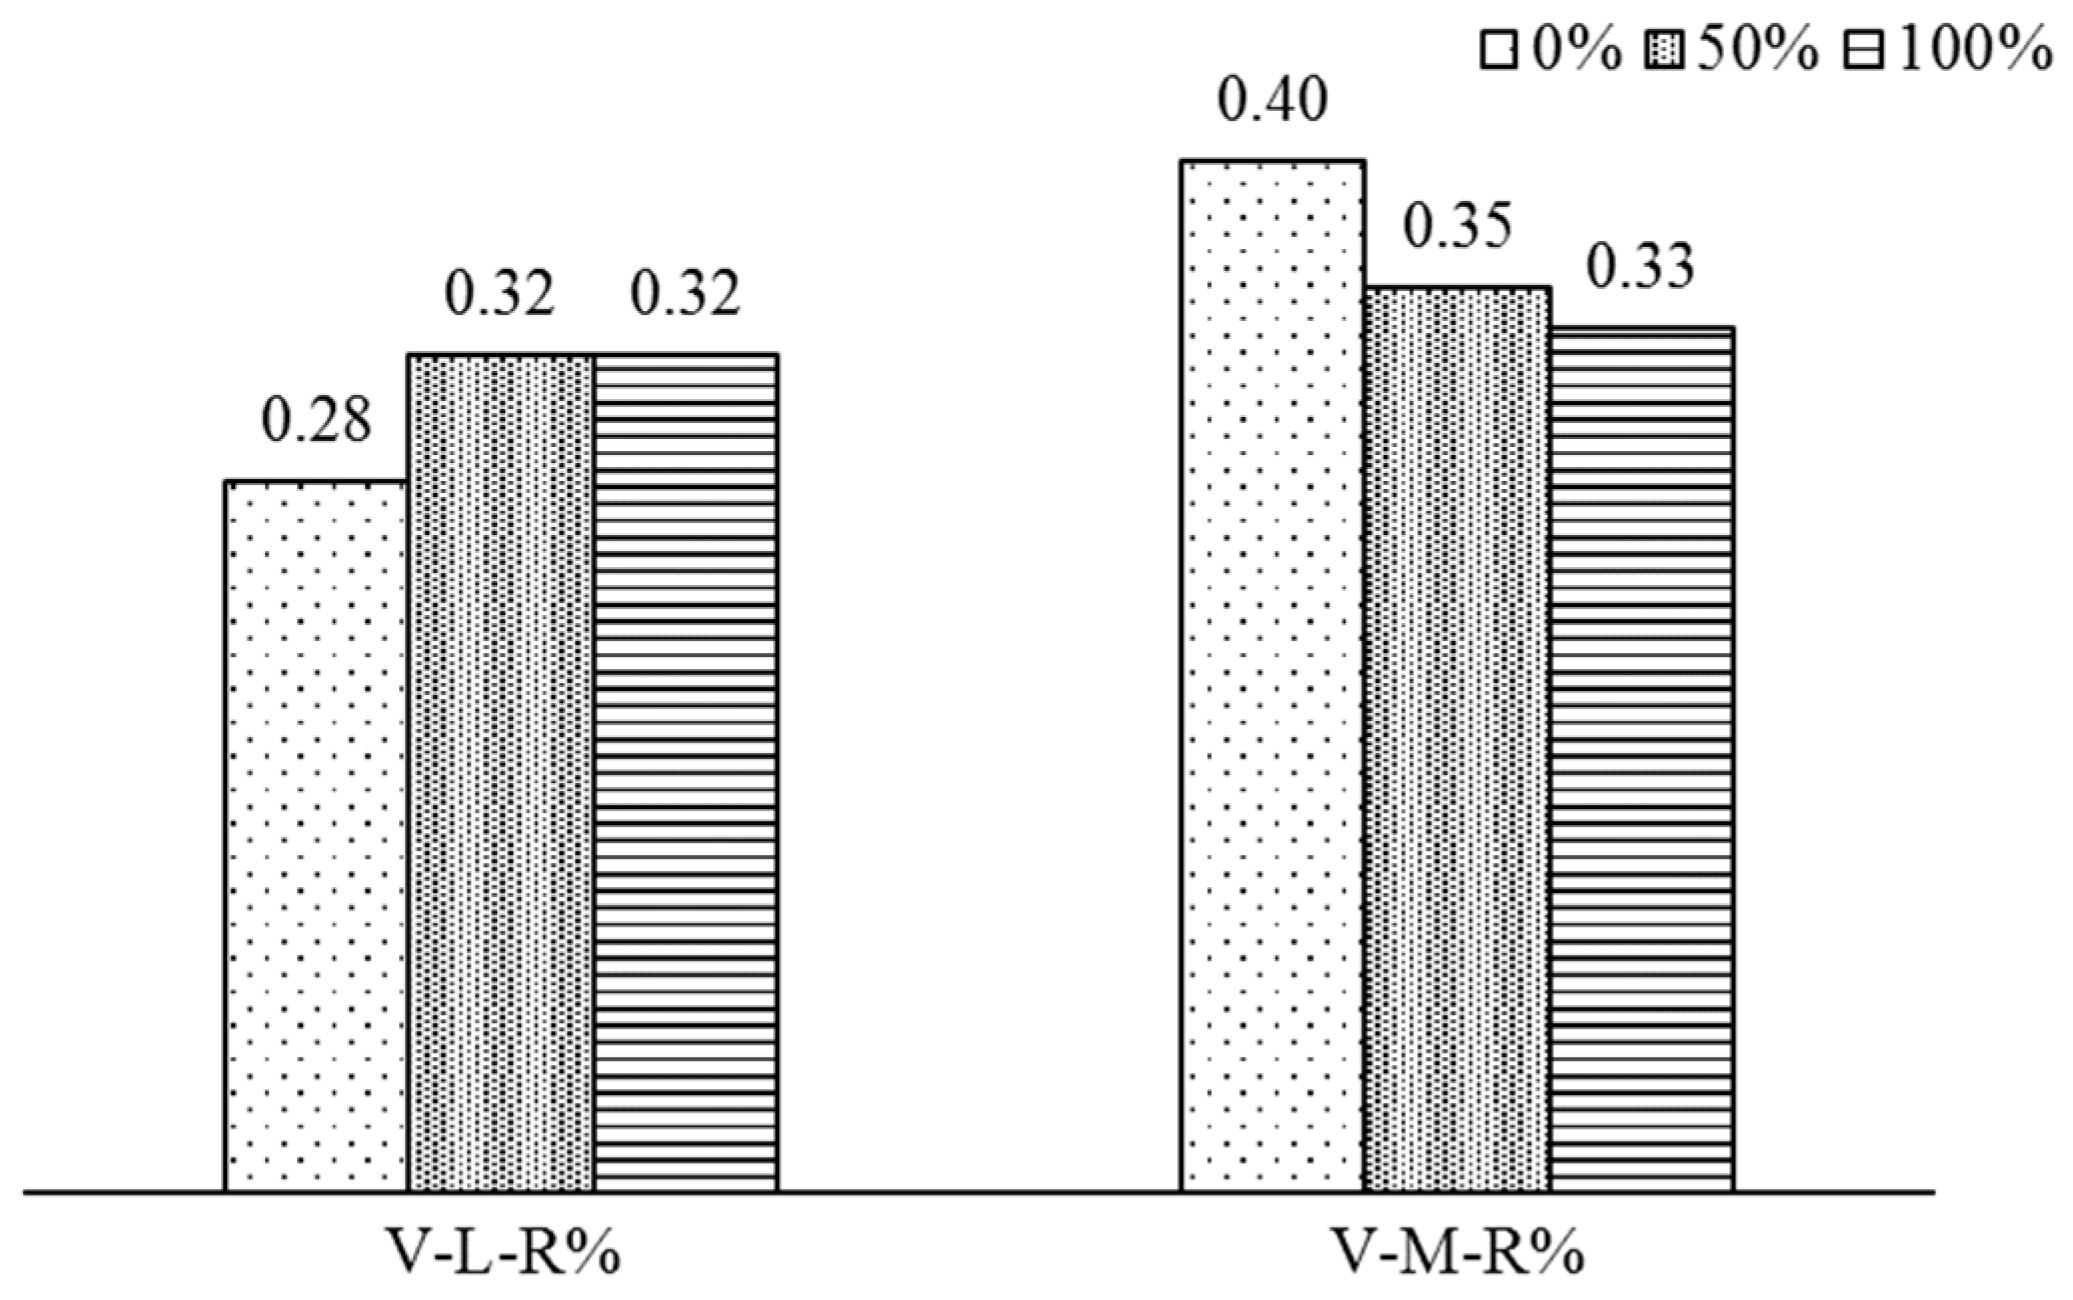
  • The calculations of the ductility index revealed that, in the case of shear, an increase in the RA replacement ratio corresponded to an increase in the ductility index. However, for flexure beams, it was observed that the NA beam within the first group (with a lower f c target) exhibited a superior ductility index compared to the other two beams made with RA, with an average difference of 41.5%. In the medium f c target group, the NA beam and the 100% RA beam demonstrated comparable ductility indices, while the 50% RA beam displayed a lower value by approximately 20%.
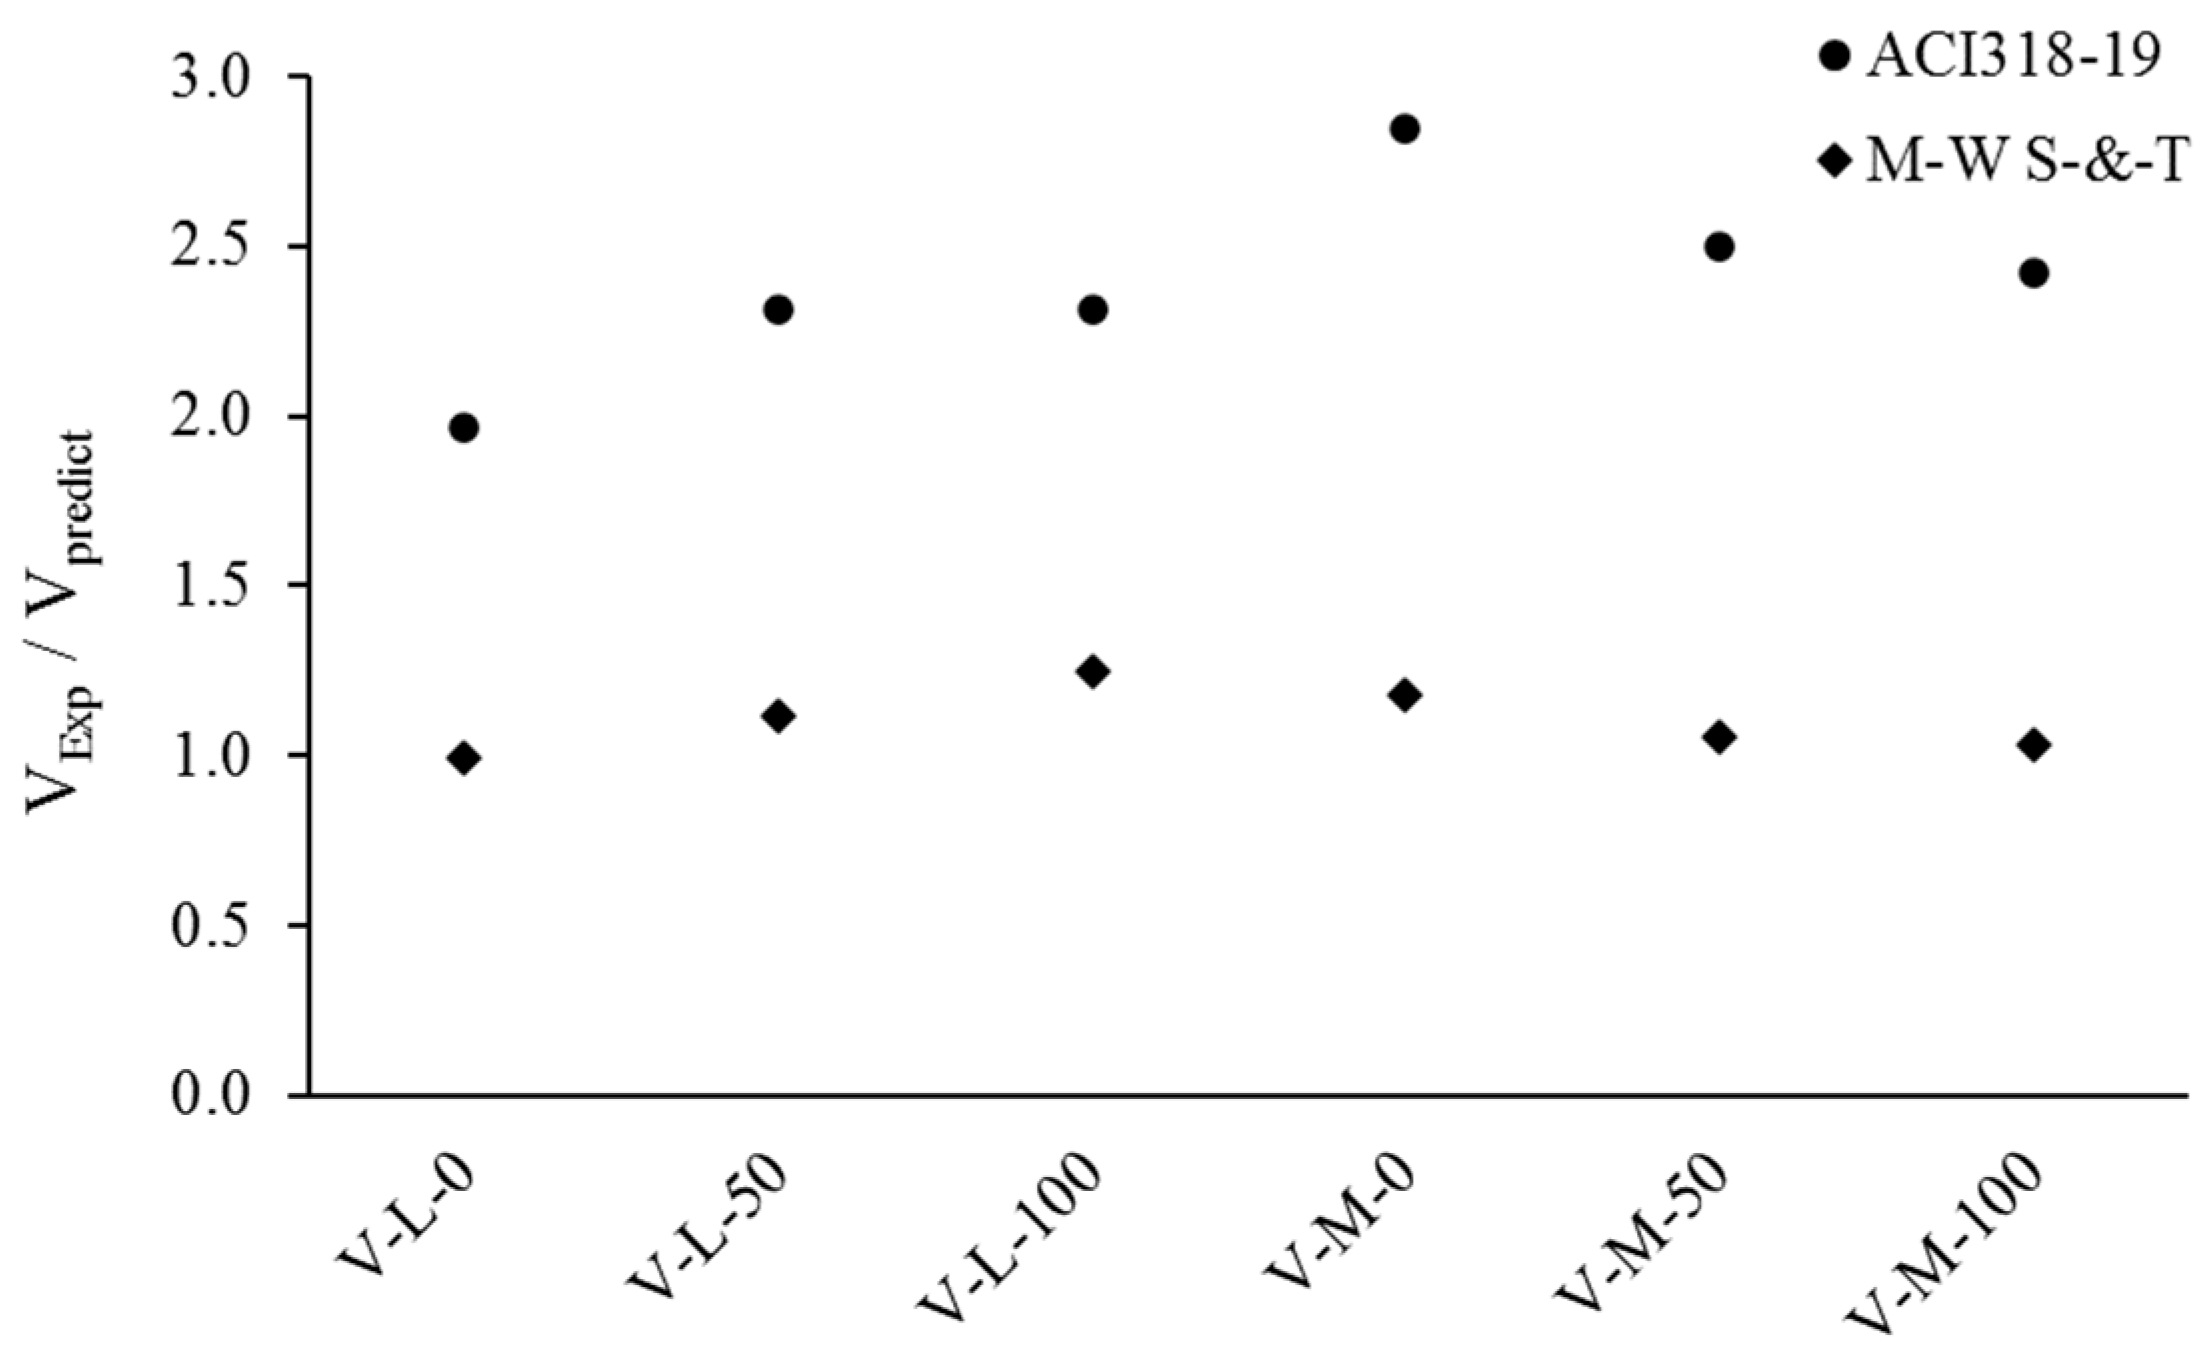
  • The shear and flexural strength of beams made with recycled aggregate concrete can be predicted theoretically using the ACI318-19. However, for deep beams ( a / d < 2), shear strength is better predicted using a pseudo-strut-and-tie method, such as Matamoros and Wong’s simplified model.
Overall, the experimental tests conducted in this study tentatively demonstrated that concrete made with locally produced aggregate from demolition waste in the UAE is feasible for structural applications involving shear and flexural load effects. Of course, more tests need to be conducted with a consideration of different concrete compressive strengths, recycled aggregate replacement percentages, longitudinal steel reinforcement ratios and shear-span-to-depth ratios, and amounts of transverse steel reinforcement. Moreover, future studies need to focus on long-term durability, fatigue strength, anchorage, and bond resistance.

Author Contributions

Conceptualization, S.W.T. and S.Y.; methodology, S.W.T. and S.Y.; formal analysis, A.M.S., S.W.T. and S.Y.; investigation, A.M.S., S.W.T. and S.Y.; writing—original draft preparation, A.M.S.; writing—review and editing, S.W.T. and S.Y.; supervision, S.W.T. and S.Y.; funding acquisition, S.W.T. and S.Y. All authors have read and agreed to the published version of the manuscript.

Funding

This research was funded by BEEAH Group|Holding Company Sharjah, UAE through the GULF eco research center at the American University of Sharjah. In addition, the research was supported, in part, by the Open Access Program from the American University of Sharjah and the College of Engineering.

Data Availability Statement

The data is unavailable and cannot be shared at this time since the work is part of ongoing research.

Acknowledgments

The authors would like to acknowledge the students Ayah Ahmed, Raafat Talih, Maged Shoman, AbdulRhman Asaad, Marwa Mousa, Salma Ahmed, Radwa Hassaballa, Amr Teaima, Rayyan Saleh, Rania Khalaf, Fady Atef, Dima Akkad, Rami Mustafa, and Sherif Elkobrsly for their help in the experimental part of the study. Thanks are also extended to Beeah Group for providing the recycled aggregate that was used in the study. The authors would like to acknowledge the support from the office of Research and Graduate Studies and the College of Engineering at the American University of Sharjah.

Conflicts of Interest

The authors declare no conflict of interest.

References

  1. Tabsh, S.W.; Abdelfatah, A.S. Influence of recycled concrete aggregates on strength properties of concrete. Constr. Build. Mater. 2009, 23, 1163–1167. [Google Scholar] [CrossRef]
  2. Yehia, S.; Helal, K.; Abusharkh, A.; Zaher, A.; Istaitiyeh, H. Strength and Durability Evaluation of Recycled Aggregate Concrete. Int. J. Concr. Struct. Mater. 2015, 9, 219–239. [Google Scholar] [CrossRef]
  3. Yehia, S.; Abdelfatah, A. Examining the Variability of Recycled Concrete Aggregate Properties. In Proceedings of the International Conference on Civil, Architecture and Sustainable Development (CASD-2016), London, UK, 1–2 December 2016. [Google Scholar] [CrossRef]
  4. Sato, R.; Maruyama, I.; Sogabe, T.; Sogo, M. Flexural Behavior of Reinforced Recycled Concrete Beams. J. Adv. Concr. Technol. 2007, 5, 43–61. [Google Scholar] [CrossRef]
  5. Du, Z.H.; Hao, T.; Liu, L.X. Experimental Study on Flexural Property of Reinforced Concrete Beams with Recycled Aggregate of Construction Waste. Key Eng. Mater. 2012, 517, 601–605. [Google Scholar] [CrossRef]
  6. Ignjatović, I.S.; Marinković, S.B.; Mišković, Z.M.; Savić, A.R. Flexural behavior of reinforced recycled aggregate concrete beams under short-term loading. Mater. Struct. 2012, 46, 1045–1059. [Google Scholar] [CrossRef]
  7. Knaack, A.M.; Kurama, Y.C. Behavior of Reinforced Concrete Beams with Recycled Concrete Coarse Aggregates. J. Struct. Eng. 2015, 141, B4014009-1–B4014009-12. [Google Scholar] [CrossRef]
  8. Arezoumandi, M.; Smith, A.; Volz, J.S.; Khayat, K.H. An experimental study on flexural strength of reinforced concrete beams with 100% recycled concrete aggregate. Eng. Struct. 2015, 88, 154–162. [Google Scholar] [CrossRef]
  9. Seara-Paz, S.; González-Fonteboa, B.; Martínez-Abella, F.; Eiras-López, J. Flexural performance of reinforced concrete beams made with recycled concrete coarse aggregate. Eng. Struct. 2018, 156, 32–45. [Google Scholar] [CrossRef]
  10. Pradhan, S.; Kumar, S.; Barai, S.V. Performance of reinforced recycled aggregate concrete beams in flexure: Experimental and critical comparative analysis. Mater. Struct. 2018, 51, 58. [Google Scholar] [CrossRef]
  11. Pacheco, J.; de Brito, J.; Chastre, C.; Evangelista, L. Uncertainty Models of Reinforced Concrete Beams in Bending: Code Comparison and Recycled Aggregate Incorporation. J. Struct. Eng. 2019, 145, 04019013. [Google Scholar] [CrossRef]
  12. Yang, I.-H.; Park, J.; Kim, K.-C.; Lee, H. Structural Behavior of Concrete Beams Containing Recycled Coarse Aggregates under Flexure. Adv. Mater. Sci. Eng. 2020, 2020, 8037131. [Google Scholar] [CrossRef]
  13. Silva, F.A.N.; Delgado, J.M.P.Q.; Azevedo, A.C.; Lima, A.G.B.; Vieira, C.S. Preliminary Analysis of the Use of Construction Waste to Replace Conventional Aggregates in Concrete. Buildings 2021, 11, 81. [Google Scholar] [CrossRef]
  14. Li, C.; Liu, T.; Fu, H.; Zhang, X.; Yang, Y.; Zhao, S. Test and Evaluation of the Flexural Properties of Reinforced Concrete Beams with 100% Recycled Coarse Aggregate and Manufactured Sand. Buildings 2021, 11, 420. [Google Scholar] [CrossRef]
  15. Abushanab, A.; Alnahhal, W. Flexural behavior of reinforced concrete beams prepared with treated Wastewater, recycled concrete Aggregates, and fly ash. Structures 2022, 45, 2067–2079. [Google Scholar] [CrossRef]
  16. Elsayed, M.; Abd-Allah, S.R.; Said, M.; El-Azim, A.A. Structural performance of recycled coarse aggregate concrete beams containing waste glass powder and waste aluminum fibers. Case Stud. Constr. Mater. 2023, 18, e01751. [Google Scholar] [CrossRef]
  17. Anike, E.E.; Saidani, M.; Olubanwo, A.O.; Anya, U.C. Flexural performance of reinforced concrete beams with recycled aggregates and steel fibres. Structures 2022, 39, 1264–1278. [Google Scholar] [CrossRef]
  18. Momeni, E.; Omidinasab, F.; Dalvand, A.; Goodarzimehr, V.; Eskandari, A. Flexural Strength of Concrete Beams Made of Recycled Aggregates: An Experimental and Soft Computing-Based Study. Sustainability 2022, 14, 11769. [Google Scholar] [CrossRef]
  19. Fathifazl, G.; Razaqpur, A.; Isgor, O.B.; Abbas, A.; Fournier, B.; Foo, S. Shear capacity evaluation of steel reinforced recycled concrete (RRC) beams. Eng. Struct. 2011, 33, 1025–1033. [Google Scholar] [CrossRef]
  20. Schubert, S.; Hoffmann, C.; Leemann, A.; Moser, K.; Motavalli, M. Recycled aggregate concrete: Experimental shear resistance of slabs without shear reinforcement. Eng. Struct. 2012, 41, 490–497. [Google Scholar] [CrossRef]
  21. Arezoumandi, M.; Drury, J.; Volz, J.S.; Khayat, K.H. Effect of Recycled Concrete Aggregate Replacement Level on Shear Strength of Reinforced Concrete Beams. ACI Mater. J. 2015, 112, 559. [Google Scholar] [CrossRef]
  22. Ignjatović, I.S.; Marinković, S.B.; Tošić, N. Shear behaviour of recycled aggregate concrete beams with and without shear reinforcement. Eng. Struct. 2017, 141, 386–401. [Google Scholar] [CrossRef]
  23. Rahal, K.; Alrefaei, Y. Shear strength of longitudinally reinforced recycled aggregate concrete beams. Eng. Struct. 2017, 145, 273–282. [Google Scholar] [CrossRef]
  24. Yun, H.-D.; Choi, W.-C. Shear Strength of Reinforced Recycled Aggregate Concrete Beams without Shear Reinforcements. J. Civ. Eng. Manag. 2017, 23, 76–84. [Google Scholar] [CrossRef]
  25. Etman, E.E.; Afefy, H.M.; Baraghith, A.T.; Khedr, S.A. Improving the shear performance of reinforced concrete beams made of recycled coarse aggregate. Constr. Build. Mater. 2018, 185, 310–324. [Google Scholar] [CrossRef]
  26. Zhang, H.; Calvi, P.M.; Lehman, D.; Kuder, K.; Roeder, C. Response of Recycled Coarse Aggregate Concrete Subjected to Pure Shear. J. Struct. Eng. 2020, 146, 04020075. [Google Scholar] [CrossRef]
  27. Wardeh, G.; Ghorbel, E. Shear strength of reinforced concrete beams with recycled aggregates. Adv. Struct. Eng. 2019, 22, 1938–1951. [Google Scholar] [CrossRef]
  28. Rahal, K.N.; Elsayed, K. Shear strength of 50 MPa longitudinally reinforced concrete beams made with coarse aggregates from low strength recycled waste concrete. Constr. Build. Mater. 2021, 286, 122835. [Google Scholar] [CrossRef]
  29. Setkit, M.; Leelatanon, S.; Imjai, T.; Garcia, R.; Limkatanyu, S. Prediction of Shear Strength of Reinforced Recycled Aggregate Concrete Beams without Stirrups. Buildings 2021, 11, 402. [Google Scholar] [CrossRef]
  30. Soltanabadi, R.; Behfarnia, K. Shear strength of reinforced concrete deep beams containing recycled concrete aggregate and recycled asphalt pavement. Constr. Build. Mater. 2022, 314, 125597. [Google Scholar] [CrossRef]
  31. Sagheer, A.M.; Tabsh, S.W. Shear Strength of Concrete Beams without Stirrups Made with Recycled Coarse Aggregate. Buildings 2022, 13, 75. [Google Scholar] [CrossRef]
  32. Yang, Q.; Peng, X.; Sun, Y. Shear Capacity Evaluation of the Recycled Concrete Beam. Materials 2022, 15, 3693. [Google Scholar] [CrossRef] [PubMed]
  33. Trindade, J.C.; Garcia, S.L.; Lacerda, T.N.; Resende, T.L. Analysis of the shear behavior of reinforced recycled aggregate concrete beams based on shear transfer mechanisms. Eng. Struct. 2023, 293, 116616. [Google Scholar] [CrossRef]
  34. American Concrete Institute ACI318 Committee. Building Code Requirements for Structural Concrete ACI 318-19 and Commentary 318R—19; American Concrete Institute: Indianopolis, IN, USA, 2019. [Google Scholar]
  35. Matamoros, A.B.; Wong, K.H. Design of simply supported deep beams using strut-and-tie models. ACI Struct. J. 2003, 100, 704–712. [Google Scholar]
  36. Tabsh, S.W.; Yehia, S. Shear Strength of Reinforced Concrete Beams Made with Recycled Aggregate. In Proceedings of the 3rd World Congress on Civil, Structural, and Environmental Engineering, (CSEE’18), Budapest, Hungary, 8–10 April 2018. [Google Scholar] [CrossRef]
  37. Tabsh, S.; Yehia, S. Flexural Strength of Reinforced Concrete Beams Made with Recycled Aggregate. In Proceedings of the International Conference on Civil and Infrastructure Engineering, ICCIE’18, Ras Al Khaimah, United Arab Emirates, 13–16 March 2018. [Google Scholar]
  38. Leading Environmental Management Company in UAE: Bee’ah. Available online: https://beeah.ae/en (accessed on 7 July 2021).
  39. ASTM C136/C136M-19; Standard Test Method for Sieve Analysis of Fine and Coarse Aggregates. ASTM: West Conshohocken, PA, USA, 2020.
  40. ASTM C33-18; Standard Specification for Concrete Aggregates. ASTM: West Conshohocken, PA, USA, 2018.
  41. B.S.812-110:1990; Testing Aggregates–Part 110: Methods for Determination of Aggregate Crushing Value (ACV). British Standards Institute: London, UK, 1990.
  42. ASTM C535-16; Standard Test Method for Resistance to Degradation of Large-Size Coarse Aggregate by Abrasion and Impact in the Los Angeles Machine. ASTM: West Conshohocken, PA, USA, 2016.
  43. ASTM C29/C29M-17a; Standard Test Method for Bulk Density (‘Unit Weight’) and Voids in Aggregate. ASTM: West Conshohocken, PA, USA, 2017.
  44. ASTM C128-22; Standard Test Method for Density, Relative Density (Specific Gravity), and Absorption of Coarse Aggregate. ASTM: West Conshohocken, PA, USA, 2023.
  45. ASTM C143/C143M-20; Standard Test Method for Slump of Hydraulic-Cement Concrete. ASTM: West Conshohocken, PA, USA, 2020.
  46. BS EN 12390-3:2002; Testing Hardened Concrete—Part 3: Compressive Strength of Test Specimens. European Committee for Standardization: Brussels, Belgium, 2009.
  47. ASTM C39-21; Standard Test Method for Compressive Strength of Cylindrical Concrete Specimens. ASTM: West Conshohocken, PA, USA, 2021.
  48. ASTM C469/C469M-22; Standard Test Method for Static Modulus of Elasticity and Poisson’s Ratio of Concrete in Compression. ASTM: West Conshohocken, PA, USA, 2022.
  49. ASTM C496/C496M-17; Standard Test Method for Splitting Tensile Strength of Cylindrical Concrete Specimens. ASTM: West Conshohocken, PA, USA, 2017.
  50. ASTM C293/C293M-16; Standard Test Method for Flexural Strength of Concrete (Using Simple Beam with Center-Point Loading). ASTM: West Conshohocken, PA, USA, 2016.
  51. ASTM C138/C138M-23; Standard Test Method for Density (Unit Weight), Yield, and Air Content (Gravimetric) of Concrete. ASTM: West Conshohocken, PA, USA, 2023.
  52. Yehia, S.; AlHamaydeh, M.; Farrag, S. High-Strength Lightweight SCC Matrix with Partial Normal-Weight Coarse-Aggregate Replacement: Strength and Durability Evaluations. J. Mater. Civ. Eng. 2014, 26, 04014086. [Google Scholar] [CrossRef]
  53. Ghoneim, M.; Yehia, A.; Yehia, S.; Abuzaid, W. Shear Strength of Fiber Reinforced Recycled Aggregate Concrete. Materials 2020, 13, 4183. [Google Scholar] [CrossRef]
  54. Silva, R.V.; de Brito, J.; Dhir, R.K. Establishing a relationship between modulus of elasticity and compressive strength of recycled aggregate concrete. J. Clean. Prod. 2016, 112, 2171–2186. [Google Scholar] [CrossRef]
  55. Rahal, K.; Alrefaei, Y. The Shear Strength of 50 mpa Concrete Beams Made Using Recycled Concrete Coarse Aggregates; ISEC Press: Fargo, ND, USA, 2015; pp. 301–605. [Google Scholar]
  56. Maekawa, K.; Okamura, H.; Pimanmas, A. Non-Linear Mechanics of Reinforced Concrete; CRC Press: Boca Raton, FL, USA, 2003. [Google Scholar] [CrossRef]
Figure 1. Summary of the experimental program [39,40,41,42,43,44,45,46,47,48,49,50,51].
Buildings 13 02597 g001
Figure 2. Stress–strain relationships of different steel samples.
Buildings 13 02597 g002
Figure 3. Particle distribution of blended RA with a targeted f c and a replacement ratio of (a) 25 MPa and 50%, (b) 25 MPa and 100%, (c) 35 MPa and 50%, (d) and 35 MPa and 100%.
Buildings 13 02597 g003
Figure 4. Sample from 20-mm-size RA.
Buildings 13 02597 g004
Figure 5. Slump test: (a) RA concrete (b) NA concrete.
Buildings 13 02597 g005
Figure 6. Cube compressive strength at different ages.
Buildings 13 02597 g006
Figure 7. Concrete compressive strength of the cylindrical samples f c (MPa).
Buildings 13 02597 g007
Figure 8. Typical failure modes for (a) a cube and (b) a cylinder.
Buildings 13 02597 g008
Figure 9. Tensile strength of a split cylinder: (a) test setup and (b) failed specimen.
Buildings 13 02597 g009
Figure 10. Tensile strength results based on split cylinder tests (MPa).
Buildings 13 02597 g010
Figure 11. Modulus of elasticity results (GPa).
Buildings 13 02597 g011
Figure 12. Modulus of rupture test as per ASTM C293.
Buildings 13 02597 g012
Figure 13. Dimensions and reinforcement of tested beams: (a) shear and (b) flexure.
Buildings 13 02597 g013
Figure 14. Steel cage of (a) shear beam and (b) flexure beam.
Buildings 13 02597 g014
Figure 15. Test setup for (a) shear (V-L-100) and (b) flexure (F-M-100).
Buildings 13 02597 g015
Figure 16. Load–deflection relations of beams tested for shear: (a) low f c and (b) medium f c .
Buildings 13 02597 g016
Figure 17. Shear failure of the six tested beams.
Buildings 13 02597 g017
Figure 18. Readings of the strain gauge installed on the bottom steel of the beam V-L-100.
Buildings 13 02597 g018
Figure 19. Load–deflection relations of beams tested for flexure: (a) low f c and (b) moderate f c .
Buildings 13 02597 g019
Figure 20. Readings of the strain gauge installed on the bottom steel of the F-L-50 beam.
Buildings 13 02597 g020
Figure 21. Flexural failure of the six tested beams.
Buildings 13 02597 g021
Figure 22. Effect of f c on the shear strength of beams (kN).
Buildings 13 02597 g022
Figure 23. The effect of R% on the beams’ normalized shear strengths.
Buildings 13 02597 g023
Figure 24. Experimental-to-predicted shear strength.
Buildings 13 02597 g024
Figure 25. Ductility indices for all shear beams.
Buildings 13 02597 g025
Figure 26. f c effect on the flexural strength of the beams.
Buildings 13 02597 g026
Figure 27. Effect of R% on the beams’ flexural strengths.
Buildings 13 02597 g027
Figure 28. Experimental-to-predicted flexural strength.
Buildings 13 02597 g028
Figure 29. The ductility indices of all flexure beams.
Buildings 13 02597 g029
Table 1. Summary of the flexural behavior of beams prepared with RAC.
ReferencesCharacteristics of Specimens and MaterialsImportant Findings
Sato et al. [4]R% = 0 and 30–50%, 37 RC beams, four-point load test, 150 × 200 mm cross-sections, L = 2800 mm (span = 2200 mm), W/B = 0.6, 0.45, and 0.3, f c = 23.5–106.4 MPa, ρ   = 0.59–1.65%, f y = 331–359 MPaThe deflections of beams with RA were larger than the corresponding ones made with virgin aggregate. Beams prepared with recycled and virgin aggregates attained similar ultimate moments, which could be predicted using current theoretical approaches in design codes.
Du et al. [5]R% = 0, 50, and 70%, six RC beams, four-point load, 200 × 400 mm, L = 3050 mm
C30 and C40, ρ = 0.484%
The average crack width in the RAC beams was found to be larger than that of the corresponding NAC beams at service. The cracking resistance of the RA beams was slightly less than that of the NA beams. The ultimate flexural capacity was the same; hence, it can be predicted using the code.
Ignjatović et al. [6]R% = 0%, 50%, and 100%, nine RC beams, four-point load, 200 × 300 mm, L = 3500 mm (span = 3000 mm), W/C = 0.524, ρ = 0.28, 1.46, and 2.54%, f c = 43.7–47.3 MPa, f y = 555–621 MPaThe results of the conducted tests showed that the flexural behavior of RAC beams is adequate when compared with NAC beams at service and under ultimate load conditions. Strain gauge readings confirmed linear strain distribution over the depth of the cross section for beams, irrespective of the RA replacement ratio.
Knaak and Kumara [7]R% = 0, 50, and 100%, 12 RC beams of which two are identical, four-point load, 150 × 230 mm, L = 1980 mm (span = 1680 mm), ρ = 1.5%, f c = 36.7–44.9 MPa, f y = 443 and 572 MPaThere was a negligible difference in the structural behavior, although there was a significant reduction in the elastic stiffness and an increase in deflection at the ultimate state. The existing code-based formulations that were derived for NAC for the most part can be used for RAC.
Arezoumandi et al. [8]R% = 0 and 100%, eight RC beams, four-point load, 300 × 460 mm, L(span) = 2700 mm, ρ = 0.47 and 0.64%, f y = 494–568 MPa, f c = 37.2 MPa for the control and 30.5–34.2 MPa for RA concreteRAC beams have a more uniform cracking pattern, lower initial stiffness, 7% lower cracking moment, and 13% higher deflection at the ultimate state. The RAC beams had similar flexural strength as the corresponding beams made with NAC.
Seara-Paz et al. [9]R% = 0, 20, 50%, and 100%, eight RC Beams, four-point load, 200 × 300 mm, L = 3600 mm (span = 3400 mm), W/C = 0.50 and 0.65, ρ = 0.76 and 0.81, f c = 42.9–60.7 MPaThe cracking moment decreases as the replacement percentage increases, and service bending moments and deflections are slightly affected by the content of RA. The flexural ductility and ultimate strength of RAC beams are similar to those of conventional concrete beams.
Pradhan et al. [10]R% = 0 and 100%, 14 RC beams, four-point load, 200 × 300 mm cross-section, L = 2400 mm (span = 2100 mm), W/C = 0.45, f c = 42.8 MPa, ρ = 0.42, 0.75, 1.31 and 1.61%, f y (nominal) = 500 MPaThere were more extensive cracks and faster crack growth rates in RAC than in NAC beams, although both had similar yield and ultimate moments. The flexural behavior of the RAC beams was slightly affected by the combined effect of the RA replacement ratio, the amount of longitudinal reinforcement, the mechanical properties of the recycled aggregate, the size of the beam, and the transverse steel reinforcement content.
Pacheco et al. [11]R% = 0–100%, theoretical study based on published results from a database composed of 174 beams. f c = 30–110 MPa, ρ = 0.5–2.75%Investigated the mean-to-nominal ratio for the flexural resistance of reinforced concrete beams made with recycled concrete aggregate from waste. A slight reduction in the bias factor of the yielding and ultimate moments when employing RA was observed compared to NA.
Yang et al. [12]R% = 0, 30, 50%, and 100%, 12 RC beams, four-point load, 200 × 300 mm, L = 3300 mm (span = 3000 mm), W/C = 0.38, f c = 31.7–38.3 MPa, ρ = 0.5, 0.79 and 1.14%RAC beams had closer crack spacing, lower flexural strength for the lightly reinforced beams, the same flexural strength for the heavily reinforced beams, and similar ductility. Flexural capacity was underestimated using the code.
Silva et al. [13]R% = 0, 50 and 100%, three RC beams, four-point load, 200 × 200 mm, L = 2200 mm, W/C = 0.5, f c = 17.49–28.0 MPa, f y (nominal) = 500 MPaThe beam with full replacement using RA performed inferior to that with recycled fine aggregate or NA at service (mainly due to the decrease in the elastic modulus of the material) and ultimate flexural conditions.
Li et al. [14]R% = 0 and 100%, 14 RC beams, four-point load, 150 × 400 mm cross-sections, L = 3500 mm (span = 3200 mm), W/C = 0.36–0.55, f c = 40.0–58.7 MPa, ρ = 0.41–3.21%Compared to conventionally reinforced concrete beams, the reinforced 100% recycled coarse aggregate and manufactured sand beams showed 20% lower cracking resistance, 15% larger crack width, and 10% higher mid-span deflection than corresponding beams with NA, although the same flexural capacity was reached.
Abushanab and Alnahhal [15]R% = 0 and 100%, four RC beams, four-point load, 180 × 250 mm, L = 2000 mm (span = 1800 mm), W/B = 0.45, f c = 40.54–57.03 MPa, f y = 512–519 MPa, ρ = 0.95%The results showed that the use of treated wastewater, RAC, and fly ash had no major effect on the yielding moment, although there was some impact on ductility and flexural strength. The CSA-A23.3 code showed an accurate prediction of the load–deflection behavior of the beams that included RAC.
Elsayed et al. [16]R% = 0 and 100%, five RC beams, four-point load, 120 × 250 mm, L = 2000 mm (span = 1800 mm), W/C = 0.5, f c = 24.5–29.7 MPa, f y = 282–383 MPa, ρ = 0.62%The findings of the study indicated that the full substitution of NA with RA results in an adverse impact on the capacity, toughness, initial stiffness, and ductility of the tested beams. The load carrying capacity of the RAC beams was improved with the addition of waste aluminum fiber.
Anike et al. [17]R% = 0, 60, and 100%, eight RC beams, four-point loads, 80 × 180 mm, L = 1500 mm (span = 1200 mm), W/C = 0.42, f c = 55–65 MPa, ρ = 1.4%The results showed that the flexural capacity of a beam containing 60% RA showed equal resistance to that of a beam made with 100% NA. The addition of steel fibers increased the capacity of the beam containing RA by more than 10%. Regardless of the aggregate type, all beams failed in a ductile manner.
Momeni et al. [18]R% = 0 and 100%, two RC beams, three-point load 200 × 300 mm, L = 1500 mm (span = 1300 mm), f y (long bars) = 520 and 562 MPa, f y (stir) = 281 MPa, long. ρ = 0.9%, a / d = 1.5, f c = 44 MPaThe results of the flexural tests exhibited a 10% reduction in ultimate flexural strength when RA was used instead of NA. The initial stiffness prior to steel yielding and the ductility of the NA and RA beams were similar.
Table 2. Summary of the shear behavior of beams prepared with RAC.
ReferencesCharacteristics of Specimens and MaterialsImportant Findings
Fathifazl et al. [19]R% = 0, 63.5, and 74.3%, 20 RC beams, four-point loading, 200 mm wide and 350–550 mm, L = 1900–3700 mm, W/C = 0.45, f c = 33.8–41.6 MPa, a / d = 1.5, 2, 2.7, and 4, ρ = 1–2.46%The shear strength of beams made with RA is comparable to, and in some cases better than, that of beams made with NA concrete; hence, the current ACI and CSA codes are applicable to recycled concrete. RAC beams follow a similar size shear effect law as conventional concrete.
Schubert et al. [20]R% = 0, 50, and 100%, 14 RC slabs, four-point loading, 200 × 500 mm, L = 2300 mm (span= 1600 mm), W/C = 0.41–0.59, ρ = 1.5%, a / d = 3.48, f c = 24.91–38.36 MPaSimilar cracking patterns for the RAC and NAC slabs. Some RAC slabs showed higher shear strength than their NAC counterparts. Predictions using the critical shear crack theory were only 5% off from the experimental findings.
Arezoumandi et al. [21]R% = 0, 50 and 100%, 18 beams, four-point loading, 300 × 460 mm, span= 3650, f c = 30–37 MPa, f y = 414 MPa, ρ = 1.3, 2.0, and 2.7%, a / d = 3 or greaterThe experimental-to-predicted shear capacity ratios for the beams with 100% aggregate replacement were about 11% lower than the 50%-replacement and conventional concrete beams.
Ignjatović et al. [22]R% = 0, 50, and 100%, nine RC beams, four-point bending tests, 200 × 300, L = 3500 mm (span = 3000 mm), Long. ρ = 4.1%, Trans ρ = 0%, 0.14%, and 0.19%, a / d = 4.25, f y = 547–706 MPa, f c u = 41.8–46.3 MPaThe shear strengths of NA and 100% RA beams without stirrups were comparable and about 15% higher than those of beams with 50% RA. The shear behavior and strength of NA beams with stirrups were similar to those of beams with RA, irrespective of the amount of RA.
Rahal and Elrefaei [23]R% = 0, 10, 20, 35, 50, 75, and 100%, 13 RCA beams, four-point load, 150 × 420 mm, L = 2900 mm (span = 2600 mm), f c = 31–39 MPa, a / d = 3, f y = 534 and 663 MPa, long. ρ = 0.79The use of RA reduced the shear strength of beams without stirrups by 13–18% if the partial aggregate replacement ratio was greater than 15%. It was suggested to apply a 20% reduction factor to the equations in the ACI and CSA codes for concrete made with recycled aggregate.
Choi and Yun [24]R% = 0, 30, 60, and 100%, 14 RC beams, four-point load, 400 × 600 mm, L = 2700–6000 mm, W/C = 0.436, Long. ρ = 1.88%, a / d = 2, 2.5, 3, 4, and 5, f c u = 29–37 MPa, f y = 433 MPaThe failure mode of reinforced concrete beams agrees with the existing theories of the shear transfer mechanism. The shear response of RAC beams is similar to that of NAC beams, and the ACI 318-14 code equations can adequately predict the shear strength of RAC beams, even with 100% replacement.
Etman et al. [25]R% = 15, 30, and 45%, 12 RC beams, four-point load, 150 × 300 mm, L = 2000 mm (span = 1800 mm), W/C = 0.5, a / d = 1, 2, and 3, fiber volumetric ratio = 1%, 1.5%, and 2%, long. ρ = 3%, f c u = 26.9–31.9 MPa Shear strength decreased by 8–19% when the RA replacement ratio increased from 15–45%, accompanied by lower stiffness in the same proportion. The addition of fibers helped compensate for the decrease in shear strength in the RAC beams.
Zhang et al. [26]R% = 0, 50, and 100%, five 890 × 890 × 70 mm panels, subjected to in-plane loads causing pure shear, W/C = 0.54, ρ t r a n = 0%, 0.46%, and 0.81%, ρ x = 2.24% and ρ y = 0.46%, f c = 35.9–43.1 MPa, f y = 457 MPaThe shear strength of heavily reinforced panels subjected to shear is not impacted by the content of recycled aggregate, and the shear stress–strain response is independent of the RA fraction. While the MCFT obtained good predictions of shear strength, it overestimated the ductility.
Wardeh and Ghorbel [27]R% = 0 and 100%, 15 RC beams of which some were in multiples, four-point load, 200 × 250 mm, L = 1900 mm (span = 1700), W/C =0.62 and 0.75, W/B = 0.41 and 0.49, f c = 35 MPa, f c u = 45 MPa, ρ l o n g = 1.8%, a / d = 1.5 and 3.0For the same concrete strength, the shear strength of RAC beams is generally lower than that of NAC beams due to the inferior tensile strength of RAC compared to NAC. A theoretical analysis of the RAC beams confirmed that the critical shear crack theory was appropriate when a / d = 3.0 and the strut-and-tie model was suitable when a / d = 1.5.
Rahal and Elsayed [28]R% = 0, 10, 20, 35, 50, 75, and 100%, seven RC beams, four-point load, 150 × 420 mm, L = 2900 mm (span = 2600 mm), Long_ ρ = 1%, a / d = 3, f y = 495–668 MPa, f c = 44.4–55.5 MPa, W/C = 0.34–0.39The use of the RA did not affect the shear mode of failure or the nature of the critical diagonal cracks of shallow beams, and the shear strength of the beams’ containing RA was 12% higher than that of the corresponding beams containing NA, which could be attributed to the higher strength of the RA with minimal adhered mortar.
Setkit et al. [29]R% = 0, 25, 50, 75, and 100%, 10 RC beams, four-point load, 200 × 300 mm, L = 2800 mm (span = 2400 mm), a / d = 3.1, Long_ ρ = 1.16% and 1.81%, W/C = 0.5, f c = 24–30 MPa, f y = 424–561 MPa, The shear strength of the beams with a high reinforcement ratio at all replacement levels was similar to the equivalent control NA beams. It was proposed to incorporate a 0.75 reduction factor to the ACI 318 shear equations for beams containing at least 50% recycled aggregate.
Soltanabadi and Behfarnia [30]R% = 0, 50, and 100%, 10 deep RC beams, four-point load, 150 × 700 mm section, L = 1600 and 2400 mm (spans = 1100 and 1900 mm), a / d = 1.6 and 2.7, f y = 320–488 MPa, W/C = 0.54 and 0.42, f c = 30–33.5 MPa, ρ v = 0.335%, ρ s k i n = 0.25%. ρ l o n g = 0.813% and 1.27%A 9% reduction in shear strength was observed when using 50% aggregate replacement, and virtually no reduction was observed when employing 100% aggregate replacement. Compared to conventional concrete, beams containing RA do not have reserve shear strength and fail in a more brittle fashion.
Sagheer and Tabsh [31]R% = 0, 50, and 100%, 15 RC beams, three-point load, 150 × 300 mm sections, L = 1500 mm (span = 1250 mm), a / d = 1.15 and 2.5, f c = 29.3–38.7 MPa, ρ l o n g = 1.03% and 1.6%, W/C = 0.46 and 0.58Shallow beams containing 50% and 100% RA had similar shear strengths to their NA concrete counterparts, whereas deep beams made with 100% RA exhibited 26% higher shear strength compared to their corresponding 50% NA beams and a 5% reduction in strength when compared with the NA beams.
Yang et al. [32]R% = 100%, four RC beams, four-point loading, b = 120 mm, h = 120–300 mm and L = 0.74–1.55 m (span = 0.54–1.35 m), W/C = 0.34, f c = 53.4 MPa, f y = 414–481 MPa, ρ l o n g = 1.6%,The results demonstrated that recycled concrete beams are affected by the size effect, the shear failure mechanism of recycled concrete beams is similar to that of ordinary concrete, and Luo’s formula is most suitable for the shear capacity computation of a recycled concrete beam.
Trindade et al. [33]R% = 0 and 100%, 12 RC beams, four-point loading, 150 × 300 mm, L = 2000 mm, W/C = 0.47–0.53, f c = 38 MPa, ρ l o n g = 1.15%, 1.75%, and 2.50%, ρ t r a n s = 0%, 0.086%, and 0.114%, a / d = 2.55The results showed a 28% average reduction in the shear strength of RAC beams with no stirrups below their reference NAC beams. For the beams with stirrups, the shear strength was similar, whatever the type of aggregate. Code predictions were less accurate than those using shear transfer mechanisms.
Table 3. ACV and LA abrasion results for RA and NA samples.
20 mm10 mm
TestNARANARA
Aggregate crushing value %19.724.019.021.5
LA abrasion value %18.631.924.027.3
Table 4. Physical properties of one of the samples.
Attribute20 mm10 mm
NA RA NA RA
Bulk SG2.642.42.442.36
Bulk SG SSD2.672.522.542.49
Apparent SG2.732.712.72.72
Water absorption %1.164.723.995.61
Moisture content %0.781.831.181
Table 5. Fineness modulus of the fine aggregate.
Type of AggregateDune SandCrushed SandCombined Dune and Crushed Sand
Fineness modulus (F.M)0.743.512.03
Table 6. RA concrete mix design proportions.
ComponentsR-L-50R-L-100R-M-50R-M-100
Volume % Weight   ( k g / m 3 )Volume % Weight   k g / m 3 Volume % Weight   k g / m 3 Volume % Weight   k g / m 3
Cement12377.912376.616502.216502.2
Water14149.918150.620200.920200.9
20 mm RA14335.929698.614328.726612.3
10 mm RA483.97174.6482.86153.0
20 mm NA14365.3--14357.4--
10 mm NA491.3--490.0--
Crushed sand19492.017440.114383.216414.3
Dune sand19492.017440.114383.216414.3
Total1002388.31002280.61002328.51002296.9
Table 7. NA concrete mix design proportions.
ComponentsN-L-0N-M-0
Volume % Weight   k g / m 3 Volume % Weight   k g / m 3
Cement12377.916502.2
Water15149.920200.9
20 mm NA28730.527704.4
10 mm NA7182.65130.4
Crushed sand19492.016383.2
Dune sand19492.016383.2
Total1002424.91002304.3
Table 8. Concrete compressive strength of the cubes (MPa).
Age (Days)N-L-0R-L-50R-L-100N-M-0R-M-50R-M-100
321.9223.0026.0526.0030.7529.74
724.7827.9332.6438.0237.5031.53
1429.0530.9430.1043.2442.5047.23
2832.0135.5233.4555.5051.5052.20
Table 9. Modulus of rupture at 28-day age.
N-L-0R-L-50R-L-100N-M-0R-M-50R-M-100
3.303.514.274.854.00- *
* No record since the sample prematurely failed during the test.
Table 10. Characteristics and labels of the tested beams.
Serial No.Beam IDTest Setup TypeWidth, b (mm)Depth, h (mm)Span Length (mm)Bottom Long. SteelTop Long. SteelTransv. Steel (when Present)
1V-L-0Three-point loading scheme15030013002 No. 162 No. 10No. 8 @ 100 mm
2V-L-50
3V-L-100
4V-M-0
5V-M-50
6V-M-100
7F-L-0Four-point loading scheme1700
8F-L-50
9F-L-100
10F-M-0
11F-M-50
12F-M-100
Table 11. Experimental results of shear strength.
Serial No.Beam ID Target   f c (MPa)R%Cube Strength (MPa) f c Strength (MPa) Recorded   P m a x (kN)Corresponding V (kN)
1V-L-025032.0123.5077.2453.47
2V-L-505035.5225.6595.0165.78
3V-L-10010033.4520.4884.7658.68
4V-M-035055.0035.00136.5194.51
5V-M-505051.5033.20116.5980.72
6V-M-10010052.2032.88112.4977.88
Table 12. Experimental results of flexure strength.
Serial No.Beam IDTarget (MPa)R%Actual Cube Strength Actual   f c Strength Recorded   P m a x (kN) Corresponding   M e x p (kN-m)
1F-L-025032.0123.50205.5361.66
2F-L-505035.5225.65190.3357.10
3F-L-10010033.4520.48200.1260.04
4F-M-035055.0035.00193.8258.15
5F-M-505051.5033.20201.6760.50
6F-M-10010052.2032.88202.7160.81
Disclaimer/Publisher’s Note: The statements, opinions and data contained in all publications are solely those of the individual author(s) and contributor(s) and not of MDPI and/or the editor(s). MDPI and/or the editor(s) disclaim responsibility for any injury to people or property resulting from any ideas, methods, instructions or products referred to in the content.

