Article

Pseudo-Static Tests on Top Joints of Hybrid Precast Utility Tunnel

College of Civil Engineering, Tongji University, Shanghai 200092, China
*
Author to whom correspondence should be addressed.
Buildings 2023, 13(10), 2567; https://doi.org/10.3390/buildings13102567
Submission received: 29 August 2023 / Revised: 30 September 2023 / Accepted: 3 October 2023 / Published: 11 October 2023
(This article belongs to the Topic Pipeline and Underground Space Technology)

Abstract

:
This paper introduces a new type of hybrid precast MUT, consisting of precast composite top slab and double-skin sidewalls with reserved rebar. The seismic behavior of the top joints was examined through pseudo-static tests. Four full-scale specimens, including both exterior and interior precast joints, in addition to two corresponding cast-in-place (CIP) joints, were fabricated and subjected to reversed cyclic loading. The results showed that both the precast and CIP joints exhibited flexure failure, characterized by the formation of a plastic hinge at the end of the sidewall. The hysteresis curves of both precast and CIP joints exhibited comparable shapes and quantities of hysteresis loops. The load-carrying capacities for exterior precast joints and corresponding CIP joints were 141.25 kN and 143.5 kN, exhibiting a difference of less than 1.6%. The load-carrying capacities for interior precast and corresponding CIP joints were 60.5 kN and 62.75 kN, displaying a variance of less than 3.6%. The precast specimens demonstrated comparable levels of ductility, energy dissipation, and structural integrity as the CIP specimens. These findings provide validation for designing and analyzing the hybrid precast utility tunnel using identical principles and models as applied CIP structures.

1. Introduction

A utility tunnel is an underground structure that accommodates one or more utility services, allowing for the installation, renovation, maintenance, repair, or modification of these services without the need for excavation [1]. Utility tunnels address the issue of repetitive road surface excavation caused by pipeline maintenance and effectively utilize the urban underground space [2,3]. The first utility tunnel in China was built under Tiananmen Square in 1959, stretching 1076 m, and transported district heating, electric power, water, and other utilities to Beijing citizens [4]. Since then, the construction of utility tunnels in China has experienced significant growth, resulting in utility tunnels spanning nearly 6000 km being built between 2015 and 2022 [5].
The construction of utility tunnels has undergone development for over 100 years, leading to the emergence of two main construction methods: cast-in-place (CIP) concrete and prefabricated concrete [6,7,8]. While CIP utility tunnels offer high flexibility in execution, their application often necessitates extensive formwork, resulting in time-consuming processes due to concrete hardening. On the other hand, the manufacturing of prefabricated utility tunnel elements occurs under strict and controlled conditions with continuous quality control measures, guaranteeing the production of superior-quality products. Additionally, the use of prefabricated elements simplifies on-site construction, shortening the overall schedule and reducing potential construction defects. Moreover, precast utility tunnels can serve as temporary retaining walls during excavation, reducing the need for other temporary shoring systems.
Precast utility tunnels can be categorized into three types: integral precast, groove-shaped precast, and hybrid precast [9]. Integral precast utility tunnels are typically employed for small-section utility tunnels due to the limitations of segment weight. The longitudinal segments are connected by a socket or prestressed reinforcement in the vertical direction. Groove-shaped precast utility tunnels are assembled using post-tensioned prestressing tendons during construction. However, their complex section forms and cross-sectional connections may lead to compromised structural integrity and waterproof performance. Hybrid precast utility tunnels are constructed using the bottom slab, top slab, and double-skin sidewalls, all connected using CIP concrete. This construction method ensures favorable structural integrity and high water resistance, leading hybrid precast utility tunnels to be popular in recent urbanization projects in cities such as Harbin (2016) and Haikou (2017), China [10].
To demonstrate the racking deformation of the nuclear power utility tunnel, Tomoyoshi et al. (1999) carried out a reversed cyclic loading test to study the structural hysteretic response. The results exhibited that the specimen had both adequate plastic deformation capacity and load carrying capacity [11]. Nakamura et al. (2006) conducted cyclic loading tests on six bottom joints (Normal, bolts, CFRP) from a rectangular tunnel to investigate the effectiveness of seismic retrofit. The results demonstrated that the retrofit using bolts and CFRP effectively enhanced the shear capacity and ductility [12]. To simulate the racking deformation of hybrid precast utility tunnels resulting from site response during earthquake actions, several reversed cyclic loading tests were carried out. Wei et al. (2019) investigated the seismic performance of ten bottom joints from a hybrid precast utility tunnel, which included double-skin sidewalls and a precast bottom slab, by conducting a reversed cyclic loading test. Additionally, they compared the results with those obtained from the corresponding CIP utility tunnel. The study showed that employing seismic-resistant anchorage length in CIP and hybrid precast utility tunnels effectively prevented anchorage failure modes and improved their load-carrying capacity [13]. Furthermore, Yang et al. (2019) investigated the seismic performance of hybrid precast utility tunnels, which consisted of double-skin sidewalls and a precast bottom slab. A reversed cyclic loading test was conducted to investigate the impact of various soil thicknesses and haunch heights on the hysteretic performance of these utility tunnels. The study found that the precast specimen exhibited favorable seismic performance [14]. Subsequently, Xue (2020) conducted cyclic loading tests on six bottom joints from a hybrid precast utility tunnel that was composed of composite sidewalls with rebar and a cast-in-place bottom slab. The results indicated that the precast joints could achieve an emulative design philosophy (equivalent to CIP), as evidenced by the similar bearing capacity, ductility, and dissipated energy observed in the precast and CIP specimens [15].
From the literature review provided above, the key conclusions are as follows:
(a)
Hybrid precast tunnels are extensively used in urban municipal construction due to their benefits, including overall structural integrity and water resistance. However, seismic tests for hybrid precast tunnels have predominantly concentrated on the bottom joints. Despite this, the seismic performance of the top joint, a critical component for the hybrid precast tunnel’s suitability in multi-cabin applications, has not been explored thus far.
(b)
The commonly adopted top slab for hybrid MUTs are mostly solid slabs, making it challenging to accommodate the construction of multi-cabin utility tunnels.
(c)
The Japanese utility tunnel code [16], American standard ASTM C1577-17 [17], ACI 318-19 [18], and Eurocode 2 (2004) [19] did not provide any guidance on the seismic design for hybrid precast utility tunnel.
Therefore, this study proposes a hybrid precast utility tunnel system by replacing the solid top slab with a composite slab. This modification ensures the hybrid precast utility tunnel’s suitability for multi-story and multi-cabin structures while enabling formwork-free construction. Four full-scale utility tunnel top joints, including precast exterior and interior joints, as well as two corresponding CIP joints were constructed for this paper. A series of cyclic loading tests were carried out to explore the seismic performance of the precast and CIP utility tunnel top joints. Based on the experimental results, the seismic characteristics of those joints were compared and analyzed. The results would expand the application of the hybrid precast utility tunnel in urban construction and offer valuable insights for the development of codes.

2. Specimen Design and Construction

2.1. Design Basis

Four full-scale top joints (two precast joints and two corresponding CIP joints) of a prototype multi-cabin precast utility tunnel (Figure 1) were designed and constructed at a site with a sediment thickness of 10.2 m in a moderately seismic region in China. The design of these joints was carried out in accordance with the provisions outlined in Chinese codes: GB 50011-2010 [20] and GB/T 50838-2015 [21] and then checked by ACI 318-19 [18]. The joints were labeled as PE (exterior joint of hybrid precast utility tunnel), PI (interior joint of hybrid precast utility tunnel), RE (exterior joint of CIP structure), and RI (interior joint of CIP structure) for reference. The structural characteristics, detailed dimensions, and reinforcement details of the specimens are illustrated in Figure 1 and Figure 2 and the specific characteristics of the precast specimens are listed as follows:
(a)
Both PE and PI are constructed using composite concrete top slabs and double-skin sidewalls with reserved rebar. To enhance the cohesion between the CIP part and the composite concrete top slab, tie-beam connections are employed, along with a 4 mm deep roughening surface incorporated into the composite top slab.
(b)
The connection between the top slab and sidewall for PE specimen is established by overlapping the reinforcement bars, as shown in Figure 2a. The connection between the top slab and sidewall for PI specimen is established by rebar anchorage using the reserved rebars in the sidewall, as shown in Figure 2b.
(c)
During an earthquake, the top slab of the utility tunnel experiences slight stress, while the bottom slab experiences higher stress [14]. Therefore, haunches are not added to strengthen the top joints of the utility tunnel.

2.2. Construction Process

Typically, the construction process of both PE and PI joints can be categorized into two main stages: prefabrication and assembly. The specific process is described below (described in Figure 3):
(a)
Reinforcement bars are tied according to Figure 2.
(b)
The double-skin composite sidewall and composite top slab are poured in the factory.
(c)
The double-skin composite sidewall is positioned and securely fixed. Following that, the composite top slab is lifted onto the top of the double-skin composite sidewall, and temporary bracing is erected concurrently.
(d)
The rebars in the CIP part of composite top slab are bent into the CIP section of the double-skin composite sidewall. Following this, formwork is installed, and fresh concrete is poured into these areas.

2.3. Material Properties

The concrete strength grade for both CIP and precast concrete used in the study was C40. The mechanical properties of the concrete, including compressive strength and modulus of elasticity, were determined and are presented in Table 1. Longitudinal reinforcement and stirrups for the specimens were made of hot-rolled ribbed rebars with a specified yield strength of 400 MPa. The detailed mechanical properties of the rebars are listed in Table 2.

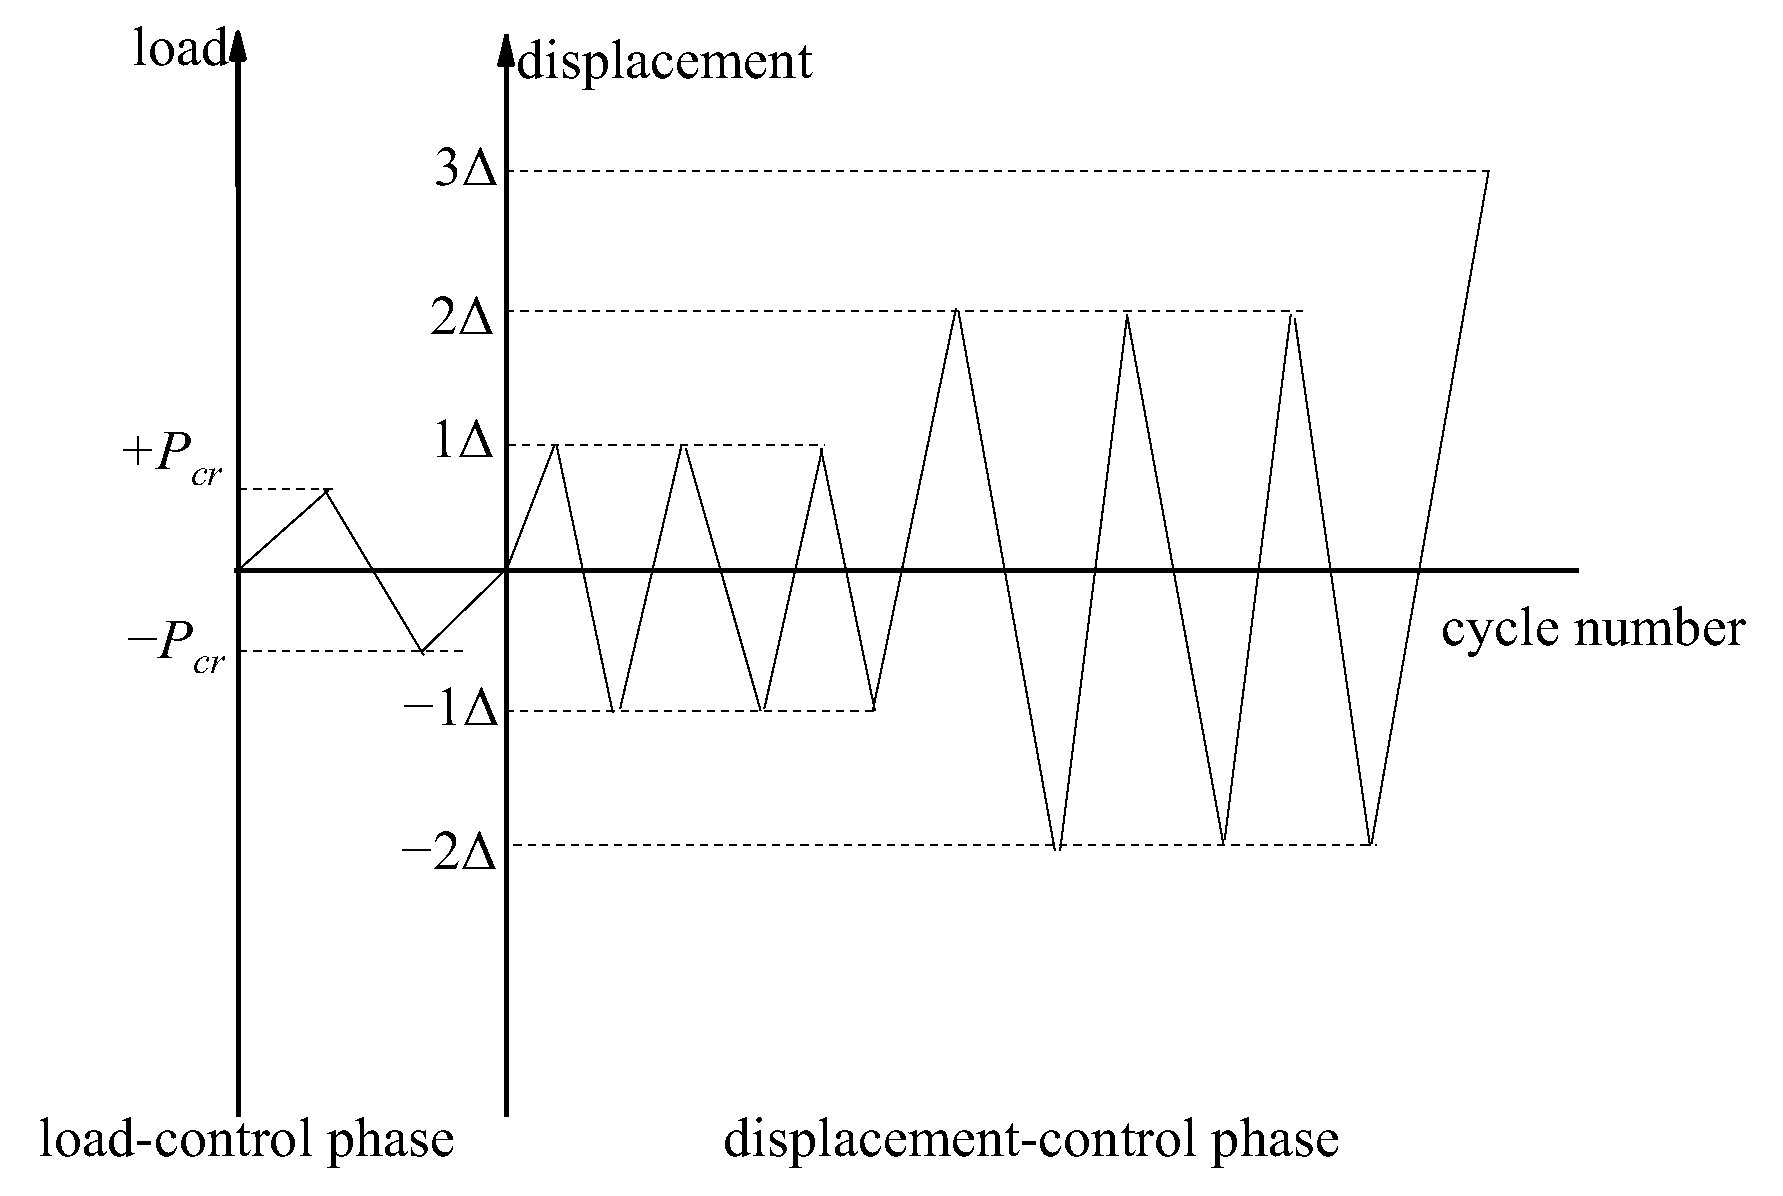
3. Experimental Method

To simulate the racking deformation of the utility tunnel caused by soil–structure interaction during the earthquake, the reversed cyclic loading was used for four specimens [22,23]. The diagram of the low-cyclic loading test is illustrated in Figure 4 with the loading point situated at the top of the sidewall.
The boundary conditions of the test specimen (shown in Figure 5) were established based on Wang’s proposed seismic analysis model for rectangular tunnels [24]. In this configuration, the connection zone was supported by a hinge, while the right side of the specimen was a horizontal roller. Considering the very small axial compression ratio of only 0.05 in the prototype of this study, the tests eliminated the vertical loads.
During the testing procedure, the specimens experienced a hybrid load-displacement control loading history (refer to Figure 6). This loading history comprised two distinct steps, namely load-controlled (before the occurrence of cracking) and displacement-controlled phases (where the drift level was incrementally increased by Δ = H/200, with H representing the height of the joints). The testing was concluded when the loads dropped below 85% of the peak load.
The applied loads and lateral displacements were monitored during the test using load cells and linear variable differential transformers (LVDTs), respectively (as described in Figure 7). The arrangement of LVDTs aimed to measure the sliding displacement between the composite layer and the cast-in-place layer, as well as the relative rotation angle between the sidewall and the bottom slab of the specimen.
Electrical resistive strain gauges were installed on the reinforcement of both the slab and sidewall to measure the strains of longitudinal rebars [25]. The chosen gauge featured a constantan 350 Ω grid covered with polyimide encapsulation for protection. Artificial markers were used to indicate crack propagation, and a specialized apparatus was employed to measure and record the corresponding crack width during observation.

4. Response of Specimens

Figure 8 shows the crack propagation diagram of the specimens. From Figure 8, it can be observed that:
(a)
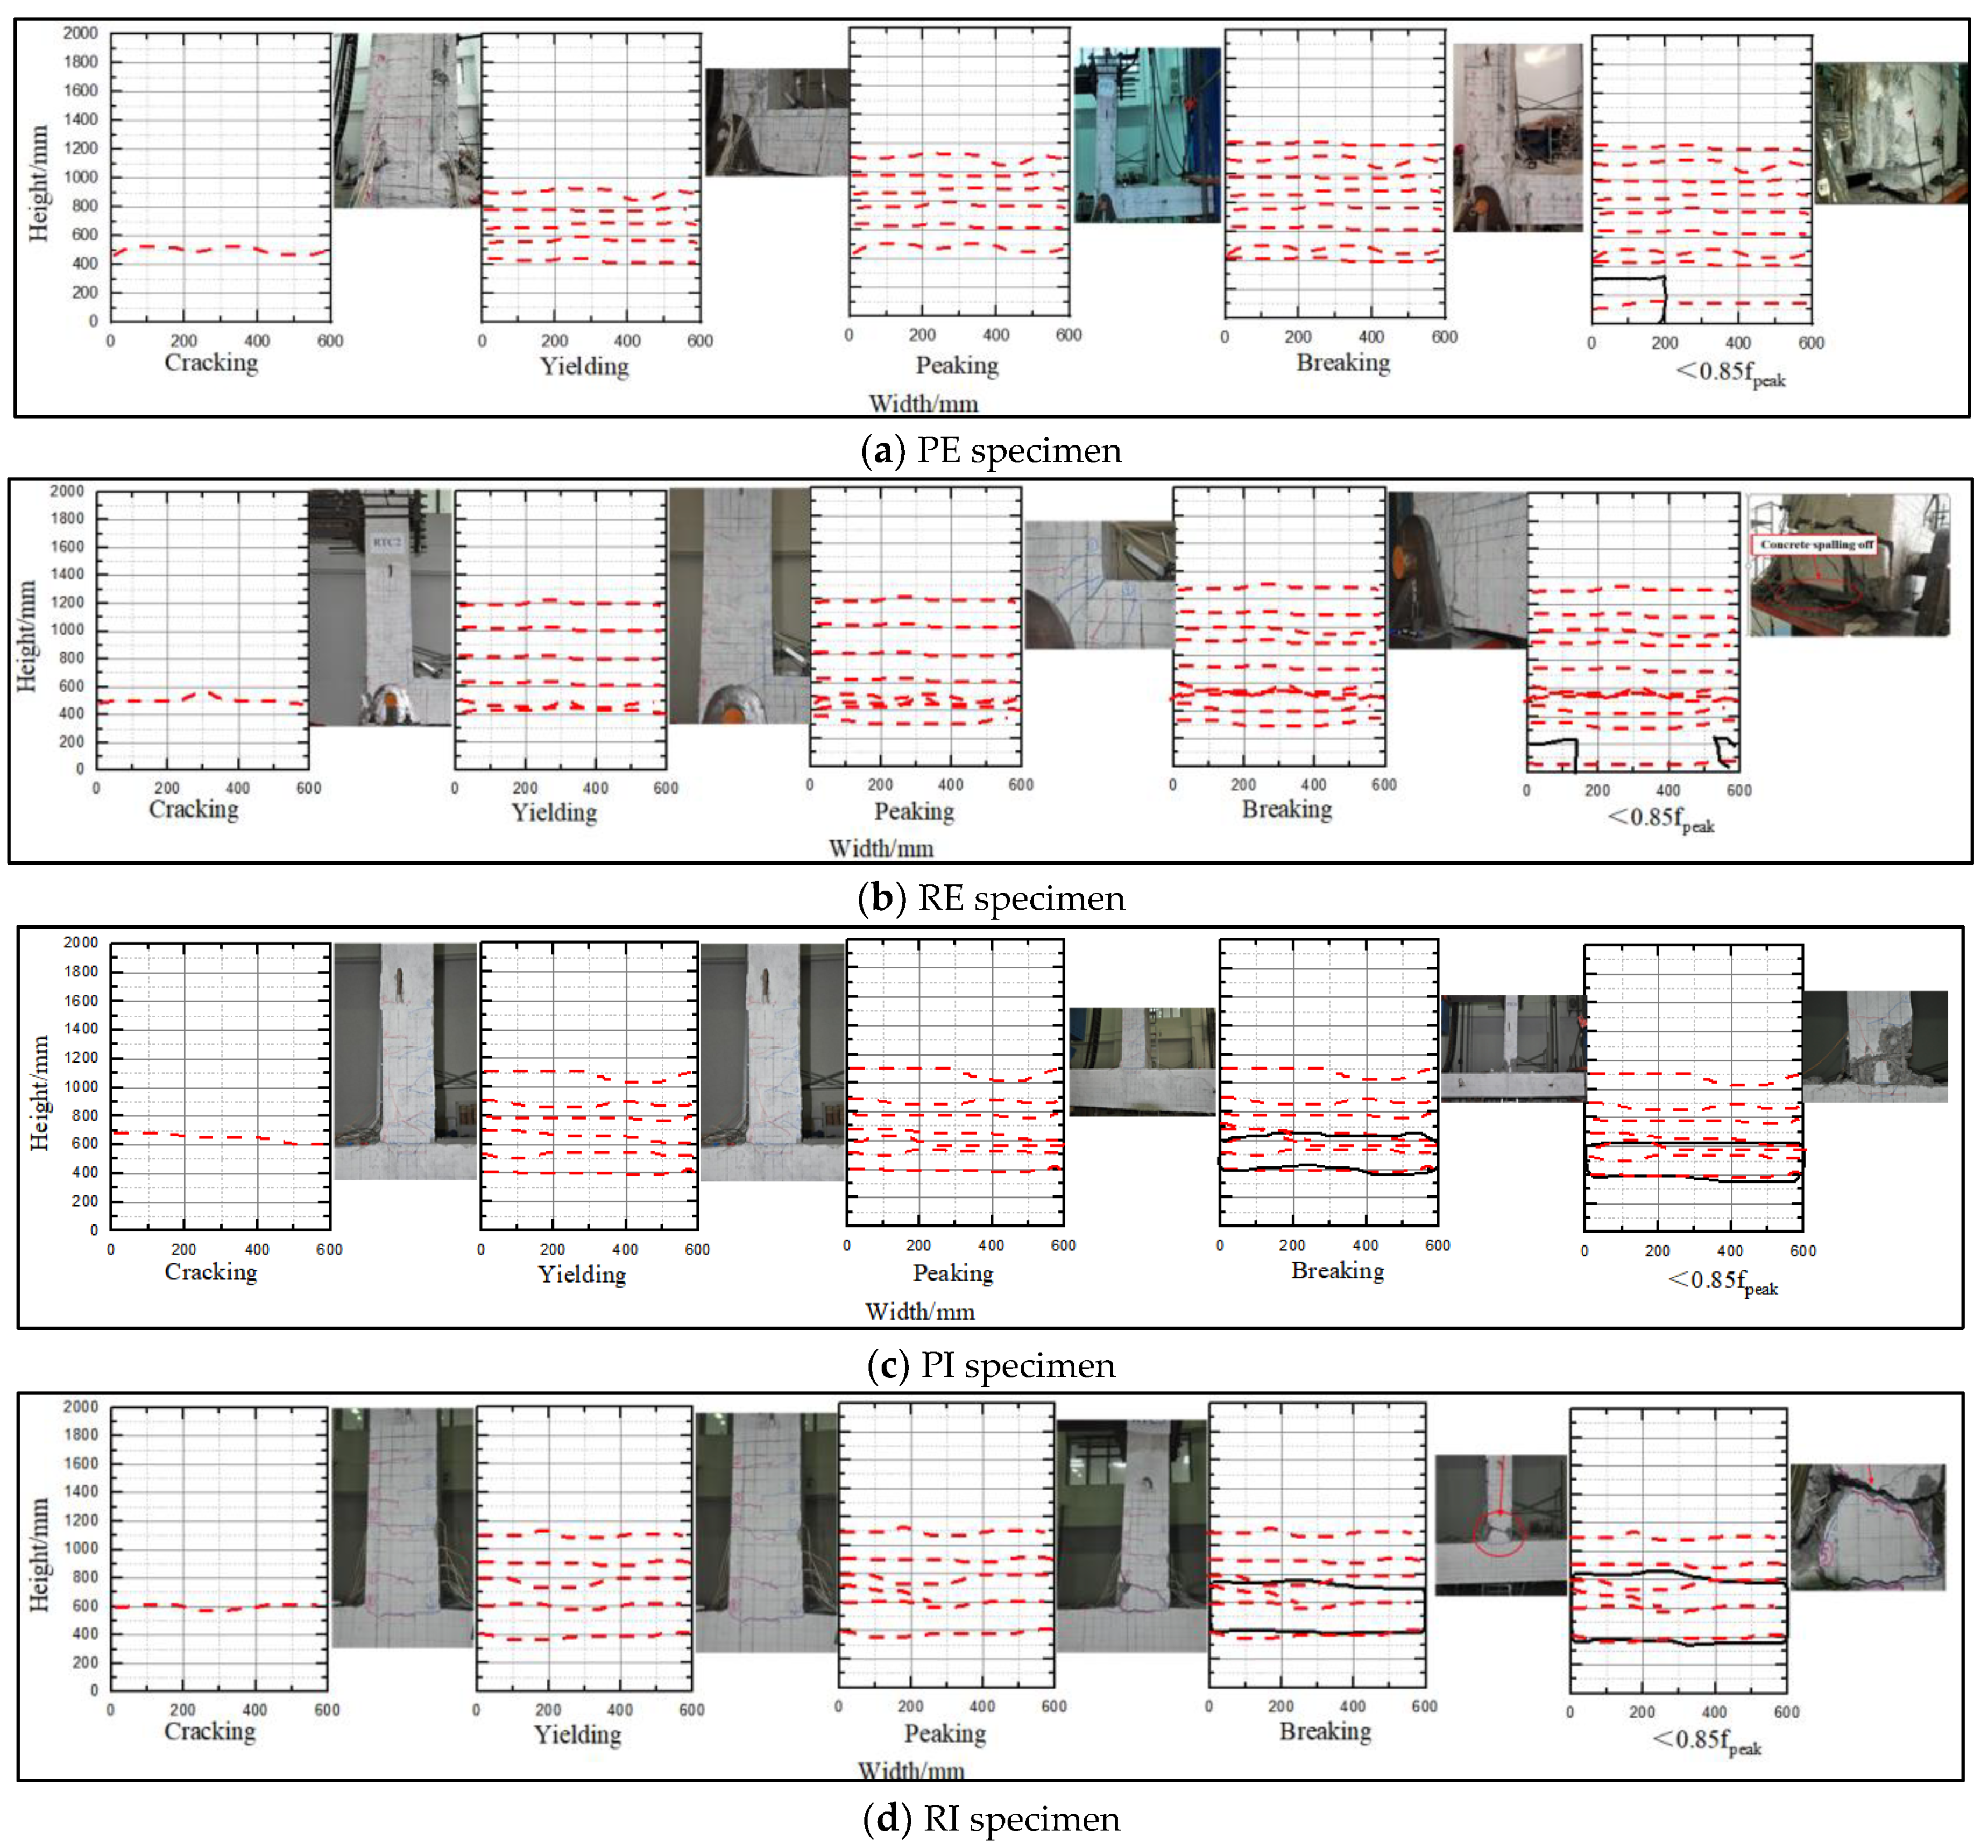
In the PE specimen, the initial crack was detected at the bottom of the double-skin composite sidewall (at a distance of 400 mm from the bottom of the slab, as shown in Figure 8a of cracking stage) under positive and negative lateral loads of +35 kN and −30 kN, respectively. As the lateral loads increased to +136.15 kN and −113.00 kN, corresponding to drifts of +1.18% and −0.99%, the PE specimen yielded using the equivalent elastoplastic energy method proposed by Park [26]. At this stage, multiple cracks had developed, extending upwards to a distance of 900 mm from the bottom of the slab (Figure 8a of yielding stage). The peak loads were +156.00 kN (+1.56%) and −130.60 kN (−1.95%). Concrete at the left of the sidewall was peeled off, and only one additional crack had appeared. Following the peak loads, the specimens experienced a decrease in load-carrying capacity, resulting in final story drifts of +2.19% and −3.20%. At this stage, a new crack had developed at a distance of 1200 mm from the bottom of the slab. Following the decrease in bearing capacity to 85%, the loading was continued until the specimen’s load-carrying capacity reached 60%. At this point, significant concrete spalling occurred on the outer side of the pivot shaft.
(b)
In the RE specimen, the first crack emerged at the bottom of the sidewall (at a distance of 500 mm from the bottom of the slab, as shown in Figure 8b of cracking stage) under a positive lateral load of +40 kN. Conversely, under a negative lateral load of −30 kN, the crack was observed at the connection zone. As loads increased to +140.13 kN (+1.20%) and −106.82 kN (−1.10%), the RE specimen yielded. At this stage, multiple cracks had developed, extending upwards to a distance of 1200 mm from the bottom of the slab (Figure 8b of yielding stage). At peak load, the values recorded were +161.30 kN (+2.00%) and −122.90 kN (−1.92%). Simultaneously, the concrete on the exterior of the sidewall slab showed signs of peeling off, and two additional cracks had appeared at the section of sidewall slab. After the peak loads, the load-carrying capacity of the specimens dropped and the final story drifts were +2.09% and −3.50%. At this stage, a new crack had developed at a distance of 600 mm from the bottom of the slab. Following the decrease in bearing capacity to 85%, the loading was continued until the specimen’s load-carrying capacity reached 60%. At this point, significant concrete spalling occurred on the outer side of the core area.
(c)
The crack propagation pattern of both PI and RI specimens was the same. In the PI specimen, the initial crack emerged (Figure 8c) at the base of the sidewall when subjected to lateral loads of +30 kN and −25 kN, while in the RI specimen, cracks were observed (Figure 8(d)) at the bottom of the sidewall under lateral loads of +35 kN and −24 kN. PI and RI were yielded after lateral loads up to +64.38 kN (+0.65%), −49.50 kN (−0.55%) and +63.30 kN (+0.69%), −57.10 kN (−0.51%), respectively. Moreover, a growing number of cracks related to flexural action PI and RI were observed as loading progressed. The peak loads for both PI and RI specimens were reached at +71.70 kN (+1.02%) and +72.90 kN (+1.14%) in the positive direction. In the negative direction, the corresponding peak loads were 49.50 kN (−1.05%) and −57.20 kN (−1.10%). During this phase, concrete peeling occurred at the sidewall, and the longitudinal reinforcement yielded in both PI and RI specimens. Following the peak loads, the load-carrying capacity of the specimens decreased, resulting in final story drifts of +3.89% and −3.30% for PI, and +2.10% and −2.23% for RI.
Figure 9 depicts the ultimate failure modes observed in the four specimens, which can be categorized as flexural failure. The specifics are as follows: for exterior joints, there was yielding of tensile reinforcement on the tension side and spalling of concrete on the compression side. In the case of the interior joint in the hybrid precast utility tunnel (PI), there was yielding of reinforcement on the tension side and extensive spalling of concrete on the compression side due to low cycle repeated loading, with exposed reinforcement visibly present. As for RI, concrete spalling occurred on the compression side, resulting in a penetrating crack.

5. Hysteretic Performance

5.1. Hysteresis Curve

The hysteresis curve, depicting the correlation between lateral load and displacement of the specimen under reversed cyclic loading, plays a crucial role in evaluating the seismic performance of structures. Additionally, it serves as the foundation for determining the restoring force model and conducting nonlinear seismic response analysis. Therefore, the hysteresis curves recorded for the four specimens are collected and plotted in Figure 10.
In the early stage, the four joints exhibited an elastic behavior. As the load increased, the specimens transitioned into an elastoplastic state, and the residual deformation expanded. Simultaneously, the hysteresis loop areas also increased. The hysteresis curves of the four specimens exhibited a distinct characteristic, that the loads during the initial cycle surpassed those in the subsequent second and third cycles despite having the same magnitude. This phenomenon primarily results from the progressive accumulation of concrete damage.
In the case of the exterior joints, the number and shape of hysteresis loops for PE and RE were similar, indicating similar hysteresis characteristics. Prior to specimen failure (load-carrying capacity greater than 0.85 fpeak), the hysteresis curves exhibited a relatively full shape. However, after failure occurred, over the course of loading, the hysteresis loop transitioned from a spindle shape to an anti-S shape, leading to a gradual reduction in energy dissipation capacity. This transformation can be primarily attributed to joint concrete spalling. After the bearing capacity dropped to 85%, the specimens exhibited significant sliding behavior, as observed in the highlighted region in Figure 10a,b. This was primarily due to extensive concrete spalling on the outer side of the sidewalls, as shown in the images in Figure 10a,b, which resulted from the insufficient anchorage length of the reinforcement.
Regarding the interior joints, both PI and RI exhibited a comparable number of hysteresis loops, as well as similar shapes for these loops. However, there were differences in the height of the hysteretic loop and the enclosed area between PI and RI. This can be attributed to the presence of reinforcement in the cast-in-place (CIP) part of the composite top slab, which increased the cross-sectional area of the sidewall reinforcement and shifted the weak section of flexure higher compared to RI. In the early stage, both specimens exhibited plump hysteresis curves. After reaching the peak load, some of the longitudinal reinforcement experienced failure, resulting in slight pinching of the hysteresis loops in both specimens.
Furthermore, the hysteresis loop of the interior joints was fuller compared to the exterior joints. This can be attributed to the larger reinforcement in the top slab of the interior joints compared to the sidewall, as well as the greater thickness of the sidewall compared to the intermediate wall. These factors contributed to the faster formation of plastic hinges in the interior joints compared to exterior joints during the loading process.

5.2. Skeleton Curve

The skeleton curves of four specimens, envelope curves of hysteresis curves, are plotted in Figure 11. Table 3 presents the load-carrying capacities of the four specimens.
Before reaching the point of cracking, both the exterior and interior joints displayed overlapping behavior in their skeleton curves. However, once the cracking loads were attained, a significant departure from linearity occurred, and the curves adopted an S-shaped pattern. As the load increased further, the growth of the load started to lag behind the growth of deformation, leading to a noticeable reduction in specimen stiffness. As the testing progressed, the curves plotted in Figure 11 displayed evident inflection points, signifying the attainment of peak loads in all four specimens. After reaching their respective peak loads, the load-carrying capacity of the specimens commenced a gradual decline.
The initial stiffness of RT and PT exhibited similarities. The maximum load-carrying capacities for PT and RT in the positive direction were 165.00 kN and 163.20 kN, respectively, while in the negative direction, they were −118.00 kN and −124.00 kN. Comparatively, PT displayed a 1.1% increase in positive load-carrying capacity and a −5.1% decrease in negative load-carrying capacity when compared to RT. This difference can be attributed to the exterior joints’ asymmetric reinforcement design scheme, which favors a higher positive-load-bearing capacity over the negative counterpart.
In the positive direction, the maximum load-carrying capacities for PI and RI were 61.00 kN and 67.50 kN, respectively. Conversely, in the negative direction, the maximum load-carrying capacities for PI and RI were 60.00 kN and 58.00 kN, respectively. The maximum load-carrying capacity of PI was −9.8% and 3.3% higher than that of RI in the positive and negative directions, respectively. The difference in the positive-load-carrying capacity between PI and RI can be attributed to the 5 cm increase in the location of the plastic hinge in PI compared to RI, which resulted in a decrease in the load-carrying capacity. However, since the plastic hinge occurred within the reasonable plastic hinge zone (within a range of 1 times the wall thickness of 300 mm), and both of their load-carrying capacities were still less than 10%, it can be considered that their load-carrying capacities are comparable.

5.3. Ductility and Deformability

Table 4 presents the displacement ductility values of the four specimens, which serve as indicators reflecting their respective deformability.
From Table 4, it can be observed that:
(a)
The two-direction displacement ductility values of PE were 2.19, and 2.81, which increased by 13.7%, and 1.8% in comparison to those of RE. The positive ductility of PE was significantly higher than that of RE. This can be attributed to the fact that the additional reinforcement in the precast structure was located within the cast-in-place layer of the composite sidewall, ensuring effective anchorage of the reinforcement throughout. In contrast, the additional reinforcement in the CIP structure may gradually become exposed as the concrete spalls. The average ductility coefficients of PE and RE were 2.50 and 2.33, respectively, with a difference of 7.75%. This indicates that the deformability of PE and RE was similar.
(b)
The PI specimen exhibited positive and negative ductility coefficients of 5.67 and 5.21, respectively. These values represent a slight increase of −2.82% and 2.11% when compared to the corresponding values for RI. This indicates that the precast joint’s plastic deformation ability was basically same as the CIP joint under reversed cyclic loading.
(c)
Another notable characteristic of the ductility coefficient among the four specimens was that the exterior joints exhibited smaller values compared to the interior joints. This can be attributed to the fact that the interior joint specimen included an additional bottom slab, which contributes to a higher level of deformation.

5.4. Stiffness Degradation and Energy Dissipation Capacity

Stiffness degradation, which refers to the reduction in structural stiffness as the number of reversed cyclic loadings increases, is commonly represented by the secant stiffness [27,28]. Figure 12 illustrates the trend of secant stiffness against displacement for the four specimens. Additionally, in order to examine the energy dissipation capacity of the structure, the cumulative energy dissipation of the four specimens is presented in Figure 13.
The stiffness of both exterior joints and interior joints decreased as the displacement increased, this was primarily due to the cumulative damage in the sidewalls and slabs resulting from the reversed cyclic loading. Figure 12 shows that the curves of stiffness degradation for the hybrid precast utility tunnel joints overlap with those of the CIP joints at similar displacement levels, indicating a similar pattern of stiffness degradation. Throughout the entire test, noticeable stiffness degradation was observed for both types of joints, particularly prior to yielding. This can be attributed to the generation and development of cracks during this stage, with few new cracks being observed after yielding.
Furthermore, it can be observed from Figure 13 that the energy dissipation capacity of interior joints is superior to that of exterior joints. This advantage is likely due to the quicker formation of plastic hinges during the loading process. At the start of the testing, with relatively minor displacements at the top of the sidewalls, the specimens were in the elastic stage, resulting in a comparably lower cumulative energy dissipation. As the lateral displacement increased, the specimens gradually entered the elastic–plastic stage, and the energy dissipation increased accordingly. However, after reaching the failure stage, the trend of increasing energy dissipation diminished. This indicates that the specimens were severely damaged at this point, and they could no longer dissipate energy through plastic deformation or damage of the material.

6. Discussion

In the initial stage, when subjected to horizontal displacement at the top of the sidewall, the precast joints maintained an elastic state, and the relative rotation angle in the connection zone remained at zero. However, as structural plastic hinges developed, the relative rotation angle in the connection zone deviated from zero, indicating a transition from an elastic to a plastic behavior. Therefore, understanding the variation pattern of the relative rotation angle becomes significantly important for studying structural integrity. Throughout the experiment, the relative rotation angles in the connection zone were carefully measured. Displacement transducers No. 17 and No. 18 were employed for the exterior joints, while displacement transducers No. 18, No. 19, No. 20, and No. 21 were used for the interior joints. The relationships between the relative rotation angles and sectional bending moments are depicted in Figure 14.
The relative rotation angle in the connection zone exhibited similar patterns for both the exterior and interior joints, corresponding to changes in the sectional bending moment. Initially, before the structure experienced cracking, the relative rotation angle was close to zero. As the sectional bending moment increased, the relative rotation angle gradually rose as well. Prior to specimen yielding, all relative rotation angles remained below 0.1°. However, after reaching the peak load-carrying capacity, the relative rotation angle increased significantly due to the formation of large plastic hinges. Additionally, the variation patterns of sectional bending moment and relative rotation angle in the connection zone were consistent for both the precast and CIP specimens. This pattern of variation indicates that the integrity behavior of the precast specimens is equivalent to that of the CIP specimens.
In Section 2, we conducted a study on the hysteretic performance of four joints under low-cycle reversed cyclic loading. The results indicated that the mechanical performance of the precast joints was equivalent to that of the CIP joints. Considering the comparable overall integrity of the precast joints with the CIP structure, we believe that when performing seismic analysis for precast structures, the same models used for CIP structures can be employed. For instance, response displacement methods or time–history analyses can be conducted using closed-frame models.
Additionally, the seismic performance of the test specimens was evaluated using the guidelines for precast concrete structural walls in NEHRP-2003 [29]. The acceptance criteria, as listed in Table 5 and plotted in Figure 15, mainly include three parameters: the peak lateral strength should be at least 0.9 times the calculated lateral resistance (Ent) and not exceed 1.2 times Ent; the relative energy dissipation ratio should be greater than or equal to 1/8; and the secant stiffness between drift ratios of −1/10 and +1/10 of the maximum applied drift should be at least 0.10 times the stiffness for the initial drift ratio. The performance criteria for the four specimens are presented in Table 5. It can be seen that the test data of all joints satisfied the seismic performance criteria. Moreover, the Relative Energy Dissipation Ratio (λ) for all four specimens was greater than 0.25, which is twice the acceptance criteria, indicating that the specimens have excellent energy dissipation capacity.
Based on the GB 50010-2010. 2010 Code for Design of Concrete Structures [30], the calculated values of the flexural capacity for the positive cross-section of four specimens were obtained using the design and measured material strength values. The comparison of these calculated capacity values with the experimental values is shown in Table 6. Analysis of the data in Table 6 indicates that for the four specimens, when the material strength is taken as the design value, the safety factor of the carrying capacity consistently exceeds one. When the material strength is based on actual measurements, the safety factor of the carrying capacity hovers around one. This suggests that the flexural capacity of the positive cross-section of the specimens meets the design requirements. When calculating the flexural capacity using measured values, the maximum difference between the experimental and calculated values is 22%, and the minimum difference is only 0.7%. This demonstrates that the relevant design calculation methods for CIP structures in GB 50010-2010 can be applied to the design calculations of hybrid precast utility tunnels.

7. Conclusions

This paper presents a novel variation of the hybrid precast utility tunnel, which includes composite top slab and double-skin sidewall with reserved rebar, and investigates the seismic performance (hysteretic curve, load-carrying capacity, ductility, stiffness degradation, and energy dissipation) of the top joints by pseudo-static tests. The following points are the main conclusions drawn from this work:
(1)
The failure modes observed in all four specimens are characterized by flexural failure, with a plastic hinge forming at the termination point of the sidewall.
(2)
The hysteresis curves of precast joints and CIP joints are similar in shape and the number of hysteresis loops. For the exterior joints, both specimens exhibited plump hysteresis curves in the early stage, followed by pinching after peak loading. For the interior joints, both specimens exhibited plump hysteresis curves in the early stage, with slight pinching after peak loading.
(3)
The load-carrying capacity of the precast joints was found to be comparable to that of the CIP joints. The average load-carrying capacities of PE and RE were 141.25 kN and 143.5 kN, respectively, exhibiting a difference of less than 1.6%. Similarly, PI and RI demonstrated load-carrying capacities of 60.5 kN and 62.75 kN, respectively, with a difference of less than 3.6%.
(4)
The precast joints exhibited greater displacement ductility compared to the CIP joints. For the exterior joints, the average ductility in the positive and negative directions of PE and RE were 2.50 and 2.33, respectively. For the interior joints, the average ductility in the positive and negative directions of PE and RE were 5.44 and 5.47, respectively.
(5)
Based on its capability to achieve comparable hysteretic performance and structure integrity to CIP structures, the precast joints, comprising composite concrete top slab and double-skin composite concrete sidewall with reserved rebar, can be designed and analyzed following the principles and models employed for CIP structures.
Additionally, this paper studied the seismic performance of precast utility tunnel joints; however, the overall structural seismic performance has not been addressed. Therefore, future research will focus on the seismic performance of the overall structure.

Author Contributions

Conceptualization, W.X. and S.C.; methodology, W.X.; software, H.B.; writing—original draft preparation, S.C.; writing—review and editing, S.C.; funding acquisition, W.X. All authors have read and agreed to the published version of the manuscript.

Funding

This research was funded by the Ministry of Housing and Urban–Rural Development (Grant No. 2016-K4-025) and the Shanghai Housing and Urban–Rural Construction Management Committee (Grant No. 2019-001-006).

Data Availability Statement

Not applicable.

Acknowledgments

This work was supported by the Ministry of Housing and Urban–Rural Development (Grant No.2016-K4-025) and the Shanghai Housing and Urban–Rural Construction Management Committee (Grant No.2019-001-006).

Conflicts of Interest

The authors declare no conflict of interest.

References

  1. Luo, Y.; Alaghbandrad, A.; Genger, T.K.; Hammond, A. History and recent development of multi-purpose utility tunnels. Tunn. Undergr. Space Technol. 2020, 103, 103511. [Google Scholar] [CrossRef]
  2. Gagnon, M.; Gaudreault, V.; Overton, D. Age of Public Infrastructure: A Provincial Perspective. Statistics Canada: Ottawa, ON, Canada, 2008; pp. 10–27. [Google Scholar]
  3. Laistner, A.; Laistner, H. Utility Tunnels–Proven Sustainability Above and Below Ground. In Proceedings of the 17th International Conference on Urban Planning and Regional Development in the Information Society, Multiversum Schwechat, Austria, 14–16 May 2012. [Google Scholar]
  4. Wang, X.; Chen, S.B. Several considerations on the planning and design of utility tunnel in China. Chin. Undergr. Space Eng. 2006, 4, 523–527. [Google Scholar]
  5. Ministry of Housing and Urban-Rural Development of the People’s Republic of China, 2021 Statistical Yearbook of Urban and Rural Development. 2022. Available online: https://www.mohurd.gov.cn/gongkai/fdzdgknr/sjfb/tjxx/jstjnj/index.html (accessed on 1 September 2022).
  6. Ramírez Chasco, F.A.; Meneses, A.S.; Cobo, E.P. Lezkairu Utilities Tunnel. Pract. Period. Struct. Des. Constr. 2011, 16, 73–81. [Google Scholar] [CrossRef]
  7. Yang, C.; Peng, F.L. Discussion on the development of underground utility tunnels in China. Procedia Eng. 2016, 165, 540–548. [Google Scholar] [CrossRef]
  8. Chen, S.; Hu, T. Research on the Influence of Haunch on the Hysteretic Performance of Hybrid Multi-purpose Utility Tunnel. In International Symposium of the International Federation for Structural Concrete; Springer Nature Switzerland: Cham, Switzerland, 2023; pp. 1207–1216. [Google Scholar]
  9. Xue, W.C.; Wang, H.D.X.H. Status and Prospect of Precast Assembly Utility Tunnel Structure System in China. Constr. Technol. 2018, 12. [Google Scholar]
  10. Heilongjiang Daily. Construction of the second phase of the underground multiutility tunnel starts in Harbin City. People’s Daily Online, 1 December 2017.
  11. Tomoyoshi, T. Study of performance evaluation around a strong earthquake of important reinfoced concrete structure at a nuclear power plant. In Proceedings of the 7th International Conference on Nuclear Engineering, Tokyo, Japan, 19–23 April 1999. [Google Scholar]
  12. Nakanura, G.; Kawashima, K.; Watanabe, G. Evaluation on seismic retrofit measures for common utility tunnels based on cyclic loading tests. Proceeding Civ. Eng. Inst. 2006, 62, 489–508. [Google Scholar]
  13. Wei, K.; Wang, Y.; Wang, Y.; Yuhang, U. Experiment study on seismic performance of joints in prefabricated sandwich structures of utility tunnels. J. Build. Struct. 2019, 40, 246–254. [Google Scholar]
  14. Yang, Y.; Tian, X.; Liu, Q.; Zhi, J.; Wang, B. Anti-seismic behavior of composite precast utility tunnels based on pseudo-static tests. Earthq. Struct. 2019, 17, 233–244. [Google Scholar]
  15. Xue, W. Test Report on Structural Performance of Prefabricated Utility Tunnels; Tongji University: Shanghai, China, 2020. [Google Scholar]
  16. Japan Road Association. Design Guidelines of Common Tunnel; Tokyo Press: Tokyo, Japan, 1991. [Google Scholar]
  17. ASTM C1577-17; Standard Specification for Precast Reinforced Concrete Box Sections for Culverts, Storm Drains, and Sowers Designed According to AASHTO LRFD. American Society for Testing and Materials: West Conshohocken, PA, USA, 2017.
  18. ACI 318–19; Building Code Requirements for Structural Concrete and Commentary. American Concrete Institute: Farmington Hills, MI, USA, 2019.
  19. EN-1992-1-1; Eurocode 2, Design of Concrete Structures—Part 1-1: General Rules and Rules for Buildings. CEN European Committee for Standardization: Brussels, Belgium, 2004.
  20. GB 50011-2010; Code for Seismic Design of Buildings. China Building Industry Press: Beijing, China, 2010.
  21. GB 50838-2015; Technical Code for Urban Utility Tunnel Engineering. China Building Industry Press: Beijing, China, 2015.
  22. Du, X.; Shen, G.Q. The seismic behaviour of precast concrete interior joints with different connection methods in assembled monolithic subway station. Eng. Struct. 2021, 232, 111799. [Google Scholar]
  23. Zhao, G.; Zhu, L.; Wu, S.; Liu, W.; Duan, S. Experimental and numerical investigation on the cross-sectional mechanical behavior of prefabricated multi-cabin RC utility tunnel. Structures 2022, 42, 466–479. [Google Scholar] [CrossRef]
  24. Wang, J.N. Seismic Design of Tunnels: A Simple State-of-Art Design Approach; Parsons Brinckerhoff Quade & Douglas Inc.: New York, NY, USA, 1993. [Google Scholar]
  25. Liu, X.; Bai, Y.; Yuan, Y.; Mang, H.A. Experimental investigation of the ultimate bearing capacity of continuously jointed segmental tunnel linings. Struct. Infrastruct. Eng. 2016, 12, 1364–1379. [Google Scholar] [CrossRef]
  26. Park, R. Evaluation of ductility of structures and structural assemblages from laboratory testing. Bull. N. Zeal. Soc. Earthq. Eng. 1989, 22, 55–166. [Google Scholar] [CrossRef]
  27. Xue, W.; Hu, X.; Ren, D.; Hu, X. Seismic behavior of precast 100 MPa grade HSC frames under reversed cyclic loading. Eng. Struct. 2021, 243, 112662. [Google Scholar] [CrossRef]
  28. Cao, X.Y.; Feng, D.C.; Wang, C.L.; Shen, D.; Wu, G. A stochastic CSM-based displacement-oriented design strategy for the novel precast SRC-UHPC composite braced-frame in the externally attached seismic retrofitting. Compos. Struct. 2023, 321, 117308. [Google Scholar] [CrossRef]
  29. Hawkins, N.M.; Ghosh, S.K. Acceptance criteria for special precast concrete structural walls based on validation testing. PCI J. 2004, 49, 78–92. [Google Scholar] [CrossRef]
  30. GB 50010-2010; Code for Design of Concrete Structures. China Building Industry Press: Beijing, China, 2010.
Figure 1. Details of hybrid precast utility tunnel.
Buildings 13 02567 g001
Figure 2. Geometry and rebar details of precast specimens.
Buildings 13 02567 g002
Figure 3. PE and PI specimens in construction.
Buildings 13 02567 g003
Figure 4. The diagram of the loading device.
Buildings 13 02567 g004
Figure 5. Boundary condition of specimens.
Buildings 13 02567 g005
Figure 6. Test loading diagram.
Buildings 13 02567 g006
Figure 7. Diagram of LVDT placement.
Buildings 13 02567 g007
Figure 8. Sketch map of four specimens at each stage. (The black box represents concrete spalling and the red dashed line represents cracks).
Buildings 13 02567 g008
Figure 9. Photographs of the specimens’ failures.
Buildings 13 02567 g009aBuildings 13 02567 g009b
Figure 10. Hysteretic curves of four specimens.
Buildings 13 02567 g010
Figure 11. Skeleton curves of the four specimens.
Buildings 13 02567 g011
Figure 12. Stiffness degradation curves of specimens.
Buildings 13 02567 g012
Figure 13. Energy dissipation capacity.
Buildings 13 02567 g013
Figure 14. The relative rotation angle of four specimens.
Buildings 13 02567 g014
Figure 15. Relative energy dissipation ratio (the curves below Pu are delete).
Buildings 13 02567 g015
Table 1. Concrete properties.
Specimen Typefcu/MPafc/MPaEc/×104 MPa
RECIP63.2548.073.56
PEOutside double-skin sidewall57.1343.423.62
Inside double-skin sidewall49.3037.473.41
Precast composite top slab63.2548.073.56
CIP part63.2948.103.47
RICIP63.2548.073.56
RIOutside double-skin sidewall57.1343.423.62
Inside double-skin sidewall49.3037.473.41
Precast composite top slab63.2548.073.56
CIP part63.2948.103.47
Notes: fcu denotes compressive strength of concrete cubes, fc denotes compressive strength of concrete cylinders, and Ec denotes elastic modulus.
Table 2. Properties of rebar material.
Diameter (mm)fy (N/mm2)fu (N/mm2)Es/×105 MPaElongation (%)
22487.1627.12.0223.34%
18494.1623.11.9821.77%
16512.2642.42.0218.89%
14529.2662.81.9618.30%
10531.1735.62.1715.91%
8537.3764.02.1417.39%
6.5464.7645.02.059.86%
Notes: fy, fu, Es and L, respectively, represent yield strength of steel reinforcement, ultimate strength of steel reinforcement, elastic modulus of steel reinforcement, and elongation of steel reinforcement.
Table 3. Notable loads.
SpecimenPc/kNPy/kNPmax/kNPu/kN
PEPos35.00146.49165.00140.25
Neg−35.00−106.90−118.00−100.3
REPos40.00145.20163.00138.72
Neg−35.00−105.60−124.00−105.4
PIPos30.0053.2361.0060.95
Neg−15.00−52.92−60.00−42.08
RIPos35.0061.2367.5057.38
Neg−20.00−57.10−58.00−49.3
Note: The abbreviation Pos and Neg in Table 3 refers to the positive and negative direction, respectively, as described in Figure 5.
Table 4. Displacement ductility values and Characteristic displacement.
SpecimenΔy/mmΔmax/mmΔu/mmμ = Δuy
Pos/NegAve
PEPos20.5826.7039.592.192.50
Neg−21.68−35.22−60.72.81
REPos21.0727.5038.081.892.33
Neg−19.9427.5155.032.76
RIPos10.0519.8856.985.675.44
Neg−10.18−18.26−53.045.21
PIPos10.8118.3863.025.835.47
Neg−11.73−19.97−59.825.10
Table 5. Test results compared with acceptance criteria in NEHRP-2003.
CategoryREPERIPIAcceptance Criteria
Pmax/EntPos.1.111.051.010.980.90~1.20
Neg.1.171.091.010.95
Relative Energy dissipation ratio λ0.250.270.370.38≥0.125
Kf/KinitialPos.0.250.240.340.35≥0.1
Neg.0.210.310.370.35
Note: Ent is the calculated lateral resistance; the symbol λ corresponds to the smallest relative energy dissipation ratio at the specific drift level, derived from Figure 15; Kf denotes the secant stiffness between drift ratios of ±1/10 of the maximum drift, while Kinitial refers to the stiffness at the initial drift ratio.
Table 6. Comparison of calculated capacity values with the experimental values.
SpecimenExperimental Value
(kN)
Calculated Values (Design Strength of Materials)Calculated Values (Actual Material Strength)
Value (kN)RatioValue (kN)Ratio
PEPos165.00126.31.30176.50.94
Neg−118.00−114.61.03−60.70.91
REPos163.00126.31.29164.20.99
Neg−124.00−114.61.08150.21.28
RIPos61.0056.11.0963.80.96
Neg−60.00−56.11.07−63.80.94
PIPos67.5045.41.4974.10.91
Neg−58.0045.41.28−74.10.78
Disclaimer/Publisher’s Note: The statements, opinions and data contained in all publications are solely those of the individual author(s) and contributor(s) and not of MDPI and/or the editor(s). MDPI and/or the editor(s) disclaim responsibility for any injury to people or property resulting from any ideas, methods, instructions or products referred to in the content.

