Article

Effective Stiffness and Seismic Response Modification Models Recommended for Cantilever Circular Columns of RC Bridges, Second Part: Collapse Prevention Limit State

by
Alejandro Vargas-Colorado
1,
José E. Barradas-Hernández
1,*,
Franco Carpio
1,*,
Sergio Márquez-Domínguez
1,
Rolando Salgado-Estrada
2 and
Armando Aguilar-Melendez
3
1
Instituto de Ingeniería, Universidad Veracruzana, S. S. Juan Pablo II, Zona Universitaria, Boca del Río 94294, Mexico
2
Facultad de Ingeniería de la Construcción y el Hábitat, Universidad Veracruzana, Adolfo Ruiz Cortines No. 455, Fracc. Costa Verde, Boca del Río 94294, Mexico
3
Facultad de Ingeniería Civil, Universidad Veracruzana, Prolongación Av. Venustiano Carranza S/N, Revolución, Poza Rica 93390, Mexico
*
Authors to whom correspondence should be addressed.
Buildings 2023, 13(10), 2423; https://doi.org/10.3390/buildings13102423
Submission received: 30 June 2023 / Revised: 28 August 2023 / Accepted: 14 September 2023 / Published: 23 September 2023

Abstract

:
This paper aims to assess the structural overstrength (R), seismic behaviour factor (Q), and effective inertia factor (keff), of which the effective elastic stiffness (Keff) is a function, i.e., Keff (keff), of reinforced concrete (RC) cantilever columns with solid circular sections in urban bridges. The R and Q factors proposed in the design codes have been based mainly on an empirical basis. However, some studies suggest that, in the case of RC bridge columns, both factors are determined by a range of geometric and structural parameters. These results indicate that equations incorporating the main geometric and structural parameters of the columns, rather than the use of fixed values, are the appropriate method for estimating the values of R, Q and keff for the columns. Therefore, the results confirm the relation between R, Q and keff with the mechanical properties of the concrete, the aspect ratio length–depth, the axial load–strength ratio of a column, as well as its longitudinal reinforcement steel ratio. Finally, the research proposes models for estimating R, Q and keff that are recommended for the collapse prevention limit state of cantilevered circular columns of RC bridges.

1. Introduction

For the seismic design of bridges, the current codes suggest using the Seismic Design Method Based on Forces (SDMBF). This method involves reducing the accelerations in the design elastic spectrum by using response modification factors (RMFs). These factors consider the total ductile capacity of the lateral deformation of the bridge. This capacity is composed of two elements: the ductility (Q) of the structure and the structural overstrength (R). Uang [1] described two RMFs, which are Q′, associated with Q, and R′, which is related to R but, in seismic bridge design codes, is directly represented by R. In Márquez-Domínguez et al. [2], in which the first part of this research is presented, the current and bi-linear load-lateral displacement response curves of a structure, such as that of reinforced concrete (RC) cantilever columns, are shown. The curves are defined by the ratio between the basal shear (Vb) and the lateral displacement at the column end (Δ). Additionally, the concepts of Q′ and R′ are presented. The purpose of Q′ is to reduce the basal shear corresponding to the elastic behaviour of the structure (Vbe) to the basal shear corresponding to a substantial global yield of the structure (Vby). Similarly, R′ is employed to reduce Vby to the design basal shear of the structure, Vbd. Once Vbd and the internal forces induced by it on the members of the structure have been defined, they are provided with the necessary strength.
Seismic design codes for bridges, such as AASHTO [3], CALTRANS [4], EUROCODE [5], and the design code of the Mexican Department of Communications and Transports (NIT-SICT [6]), use the equal displacement and equal energy approximations proposed by Newmark and Hall [7], or their variants, to establish the relation between Q′ and Q. In the medium and long-period spectral regions, the equal displacement approximation remains valid, i.e., Q′ ≅ Q. Similarly, in the short-period spectral region, the equal energy approximation expressed by Equation (1) relates Q′ and Q:
Q = 2 Q 1 .
In bridge design codes such as AASHTO [3] and EUROCODE [5], only a single RMF is established, which is determined by the product Q′R′. In Márquez-Domínguez et al. [2], the product Q′R′ was explained. If the value given for this factor is constant, the equal displacements approximation is used, resulting in the product QR, which represents the overall lateral deformation ductility of the bridge. This product is referred to as the R-factor in this paper. In contrast, NIT-SICT [6] specifies both factors R and Q.
When the SDMBF is applied, the effective elastic stiffness (Keff) of a structure remains constant [2]. Hence, Keff is independent of its strength (Vbe, Vby or Vbe). Priestley et al. [8] established that deeming the Keff of a RC member to be independent of its strength is not adequate. As the flexural or flexural–compressive strength capacity changes, it modifies the required longitudinal reinforcement ratio, causing a modification to the cracked rigidity. Additionally, to estimate Keff for RC members, it is necessary to consider the effect of cracking. Current bridge design codes, including AASTHO [3] and MDOC-CFE [9], consider this through an effective moment of inertia (Ieff), estimated as Ieff = keff·Ig, where keff is a constant less than one, called the effective inertia factor in this study, and Ig is the geometric moment of inertia of the section. As a result, when keff is implemented in bridge design codes, the relationship between the effective elastic stiffness and the strength of RC members is also neglected.
The values of Q and R as suggested by bridge design codes were based on engineering judgements [10]. The values are considered dependent on the structural system type, material and ductility as per specific design requirements. Therefore, if the bridge substructure is built using RC cantilever columns, which are expected to be ductile, the codes specify a constant value for these factors. However, Priestley et al. [8,10] mentioned that this is not adequate since Q and R and their RMFs also depend on the geometry of the columns (length and depth of the cross-section), the magnitude of the acting axial load, the compressive strength of the concrete, and the longitudinal and transverse reinforcement ratios, among other parameters.
According to Priestley et al. [8], approximations such as equal displacements and equal energies are dependent on the initial elastic period and damping of the structures. However, these do not apply when estimating the inelastic response. This is because the lateral stiffness and its distribution on structures change when the structures exhibit inelastic behaviour. On the other hand, Priestley et al. [8] asserted that inelastic behaviour leads to increased structural damping as it is associated with the dissipation of hysteretic energy.
Because of the limitations of the SDMBF, certain bridge design codes such as CALTRANS [4] and EUROCODE [5] suggest that assessing the fulfilment of performance criteria can be carried out by means of a static inelastic analysis under monotonically increasing lateral load, known as “pushover” analysis. For the case of columns that are part of the substructure of bridges, they specify to calculate a lateral load–displacement relationship of the column based on the moment–curvature analysis of the section and the concepts of equivalent length of the plastic hinge and its rotational capacity.
For assessing the seismic performance of different types of structural systems, methods based on the capacity spectrum (MBCSs) have been developed, which use the capacity curve set up by a pushover analysis and the seismic demand spectrum, reduced by a spectral reduction factor (SRF), which adequately considers the hysteretic energy dissipation capacity. In MBCSs, the capacity curve is transformed by the properties of its fundamental mode of vibration into another curve in terms of spectral displacement–acceleration. The intersection of this curve with the reduced spectrum of the seismic demand is called the “performance point” and defines the maximum spectral lateral displacement that the structure will develop under that seismic action. The SRFs can be divided into two groups: those based on damping and those based on ductility. Those in the first group are a function of equivalent viscous damping: the elastic viscous damping plus the viscous damping that considers the hysteretic energy dissipated by the structure. The SRFs of the second group are essentially the RMFs discussed above. Casarotti et al. [11] evaluated the accuracy in predicting the performance of various bridges with different configurations and support conditions that can be obtained using eleven proposed SRFs, which were based on damping and ductility, applied in the MBCS proposed by Casarotti and Pinho [12]. This evaluation was performed by comparing results obtained from nonlinear time-history analyses carried out for a sufficiently large number of ground motion records. The results showed that the MBCS application using the damping-based SRFs resulted in a better-predicted performance of the bridges than the MBCS application using the ductility-based SRFs.
SDMBF limitations have motivated the development, since the early 2000s, of alternative procedures for the seismic evaluation and design of various types of structures based on deformations and other response parameters, generally referred to as “performance-based”. Among these procedures, those based on direct displacements (BDD) stand out, whose approach has the following main differences with respect to the SDMBF (Priestley et al. [8]): (1) the maximum inelastic or design displacement, the yield displacement, and the corresponding ductility are calculated for the structure to be designed or evaluated according to its geometry, materials, and expected deformation capacities; and (2) the structure can be characterised by its secant stiffness at maximum displacement and equivalent viscous damping, which is the sum of elastic viscous damping and the viscous damping equivalent to the hysteretic energy dissipated during the structure’s inelastic response. This latter damping is, in turn, a function of the specific ductility of the structure and the type of structural system. Therefore, in the case of bridges, the use of BDD seismic design methods should ensure that the performance criteria are adequately met. [8]. Likewise, the application of seismic evaluation procedures (BDD) for bridges allows a reasonable estimation of their structural performance [13,14]. Despite the advantages offered by these procedures, they have not yet been implemented in several current bridge seismic design codes [3,4,5,6,9], so further research is needed to overcome the limitations of the SDMBF.
Regarding the structural performance criteria considered by the current international codes for the seismic design of bridges, most of them specify that bridges must be designed to comply with the Serviceability Limit State (SLS) and the Collapse Prevention Limit State (CPLS) [3,4,5,6,9]. NIT-SICT [6] and MDOC-CFE [9] are the two Mexican codes that focus on bridge design; however, they are not widely used. The NIT-SICT [6] does not contain its own technical specifications for structural design, while the MDOC-CFE [9] is only required for projects of the Federal Electricity Commission of Mexico. For this reason, AASHTO [3], a USA code, is the most widely used. It is therefore necessary to have a comprehensive bridge’ design code in Mexico. One way to meet this need is to update the NIT-SICT [6] and supplement it with the Mexican code NTC-DCC-2023 [15] as a starting point. The RMFs and keff specified by some of the current seismic bridge design codes are described below, particularly for the CPLS of RC cantilever columns of bridges of “normal” importance or equivalent. Although CALTRANS and MDOC-CFE also specify the SDMBF, they are not included in the following description because these codes use a variant of this method that does not require the use of RMFs.
The NIT-SICT [6] specifies Q = 2 and R = 2 for bridge columns, classified as “Type B” in terms of importance. This code does not indicate the keff value. Therefore, bridge designers use keff = 0.5, which is similar to keff = 0.7 given by NTC-DCC-2023 [15] for RC building columns.
AASHTO [3] specifies an R-factor equal to three for columns whose behaviour is expected to be ductile due to the confinement of their critical sections. The columns are part of bridges that are classified in terms of importance and operational classification as “others”. With this R-factor, the columns are designed for the limit state of extreme events such as earthquakes, which is equivalent to the CPLS. This code also specifies keff = 0.5.
In the EUROCODE [5], only for the spectral region where the equal displacements approximation is valid, an R-factor = 3.5λ(αs) is defined for vertical columns whose behaviour is expected to be ductile due to well-confined critical sections. α s = L s h is the shear span ratio of the column, where Ls is the distance from the plastic hinge to the point of zero moment and h is the depth of the section in the direction of bending. According to EUROCODE [5], for α s 3 ,   λ α s = 1.0 . It will then be shown that a value of   α s 3 has been used in the current study, therefore λ α s = 1.0 resulting in an R-factor = 3.5. The columns are part of bridges classified as “Class I” (less than average importance). This code also indicates that keff must be obtained from the secant stiffness at first yield of the longitudinal reinforcement, plotted on the moment–curvature diagram of the section already designed. This makes it impossible to obtain the keff for use in the initial design phase of the columns.
Sánchez et al. [16] conducted a parametric study to estimate the overstrength, R, of RC columns in simply supported straight-axis bridges located in three sites of firm soil with varying seismicity (low, medium, and high) in Mexico. The bridges consist of five spans of 30 and 50 m, supported on two types of substructures: single cantilever columns and multiple columns, both with a circular solid section, with heights of 5, 10, 15 and 20 m. The parameter combination leads to a total of 48 numerical models. For bridge analysis and design, soil–structure interaction was not considered, and estimated vehicular live loads have been considered specifically for Mexico (trucks weighing up to 72.5 tonnes), which, according to the authors of the study, is a value significantly higher than that used for bridge design in many countries around the world. The earthquake intensities at the above sites were also considered, as were the limit states of strength and extreme events specified in AASHTO-2017 [17]. The bridge’s substructure was designed for Q = 2, while its columns were designed according to NTC-DCC-2017 [18] specifications to ensure ductile behaviour during extreme events. Subsequently, to estimate the R of the columns, the 48 numerical models were subjected to a step-by-step inelastic analysis considering a set of 80 seismic records, representative of the design seismic actions for each site. From the response perpendicular to the longitudinal axis of bridges with cantilever columns at the moderate and high seismicity sites, R values ranging from 1.6 to 2.5 were obtained, with the highest values corresponding to sites with moderate seismicity. At low seismicity sites, the R ranged from 2.4 to 3.5. According to Sánchez et al. [16], at these sites, the low and moderate contribution of seismic demand to the base shear of the columns caused a significant contribution of gravity loads to the column overstrength.
Further on in this document, it will be shown that R, Q and Keff (keff) of RC cantilever bridge columns are inherently correlated, so that the assessment of these factors should be made with this correlation in mind, which is currently not accounted for in the seismic design codes for bridges. In addition, as noted above, the values of R and Q and their respective RMFs are influenced by the structural characteristics of the members, including their length (L), cross-sectional shape and size (D or diameter for circular members), the amount of applied axial load (P), the compressive strength of the concrete (f′c), and the longitudinal (ρ) and transverse (ρt) steel reinforcement ratios [10]. Therefore, the best approach to evaluating R and Q values is through functions that are dependent on these parameters. However, this approach is not currently included in seismic design codes for bridges. Additionally, since R, Q and Keff (keff) are correlated, keff should be determined from these functions. The application of these functions in the SDMBF is expected to reasonably overcome the shortcomings of this method concerning the estimation of R, Q and keff, but will not overcome those concerning the use of the equal displacements and equal energies approximations or other alternatives, based on considering the initial elastic period and damping of the structures. It is recommended to apply the MBCS proposed by Casarotti and Pinho [12], using damping-based SFRs, to the designated columns. This will ensure that the established performance criteria are met under the design seismic requirement. Alternatively, it is recommended, as well as AASHTO [3], to use a current seismic evaluation method for bridges based on direct displacements [13] to verify the expected performance of the column design.
Based on the above, the main objective of the second part of this research was to establish functions to characterise the structural overstrength factor (R), the seismic behaviour factor (Q) and the inertia effective factor (keff) of RC cantilever urban bridge columns with solid circular section in the CPLS, corresponding to the substructure of simply supported straight-axis bridges, see Figure 2 from Márquez-Domínguez et al. [2], where the first part of this research is presented. These functions can be applied to the seismic analysis and design of columns in the transversal direction of bridges because, in this direction, the columns can be idealised as independent oscillators with a single-degree-of-freedom. In order to reach the objective, parametric analyses were conducted, considering the columns’ most significant geometrical and structural properties and estimating their inelastic response. Consequently, the columns were designed according to NTC-DCC-2023 [15]. Mathematical models were developed to estimate R, Q and keff, by means of linear regression. These models considered the influence of the compressive strength of concrete (f′c), the aspect ratio (L/D), the longitudinal steel ratio (ρ) and the ratio of the axial load–strength capacity of the column.

2. R, Q and Keff Definition

Márquez-Domínguez et al. [2] mentioned that the current and bi-linear lateral load–displacement response curves of a structure, such as that of RC cantilever columns, can dissipate energy in a stable manner. These curves are given by the ratio between the basal shear (Vb) and the lateral displacement at the column end (Δ). From the idealised curve, three parameters can be derived: Keff, Q and R. These parameters, together with the reactive mass of the column and a critical fraction of the viscous damping, provide the necessary properties to characterise a single-degree-of-freedom oscillator. With this oscillator and the reduced elastic design spectrum by the product Q′(Q)·R′, the design strength of the column is determined for the CPLS.
Keff for the column is defined by the slope of the initial branch of the idealised curve [2]. This slope is a secant line that begins at the origin and intersects the current response curve at a point whose ordinate is the design basal shear (Vbd). With reference to the design bending moment (Md) of the critical section, the upper end of the lateral displacement that corresponds to Vbd is Δd. Therefore, the Keff is calculated by Equation (2).
K e f f = V b d Δ d .
The bilinear curve is typically simplified to perfect elastoplastic when the response curve remains unchanged in slope, indicating global yielding of the structure. The R and Q factors are thus determined, where Q′ is defined by Equation (3).
Q = V b e V b y ,
Vbe is the base shear required for the column to respond elastically to the design earthquake associated with the CPLS, and Vby is the base shear at which the column reaches yield on the idealised curve [2]. Equation (4) is used to calculate the R factor:
R = V b y V b d .
From Márquez-Domínguez et al. [2], the ratio Δyd = R is equivalent to Equation (4), where Δy represents the lateral displacement of the column where the yielding begins, which belongs to Vby. Δy is defined by Equation (5):
Δ y = R Δ d .
Equation (6) gives Q, which is a measure of the ductile lateral deformation capacity of the column, where Δmax represents its lateral displacement capacity:
Q = Δ m a x R Δ d .
Equations (2), (4) and (6) show the correlation between the factors R, Q and Keff.

3. Parametric Study

3.1. Geometric and Structural Column Parameters

The analysis was focused on RC cantilever columns with a solid circular cross-section. For the assessments, the columns’ geometrical and mechanical properties are as follows: aspect ratio L/D, axial load/strength ratio P/(Ag·f′c), compressive strength of the concrete (f′c), and longitudinal reinforcement steel ratio (ρ). The axial load/strength ratio is defined by three parameters: the axial load P, the gross cross-sectional area Ag, and f′c. These parameters were chosen because of their significant influence on R, Q and keff, which was statistically verified by hypothesis testing, and were considered independent variables (Table 1). This paper presents a parametric study on the inelastic basal shear–lateral displacement responses of RC cantilever columns. These columns are the substructures used for simply supported straight-axis urban bridges. The study aims to establish predictive models that could help estimate the average values of the factors R, Q and keff for their analysis and design in the CPLS. For setting the concrete parameters: elasticity modulus (Ec), bending tensile strength (ff), and ultimate compressive strain (εc = 0.004), NTC-DCC-2023 [15] recommendations were considered (Table 2). In contrast, the parameters: cross-sectional diameter (D = 1500 mm), concrete cover (r = 50 mm), and the fy (412 MPa) and elasticity modulus of the reinforcing steel (Es = 200,000 MPa) were assumed to be constant.
The cross-section dimension, ratios L/D and P/(Ag·f′c), concrete cover (r) and f′c, are those conventionally considered for RC cantilever columns of urban bridges in Mexico [6,15,16], which also fulfil the limits specified in the NTC-DCC-2023 [15]. The fy and ρ ranges are specified by NTC-DCC-2023 [15] for ductile structures (Q = 3 and Q = 4).

3.2. Design of the Columns

The design bending moment (Md) of the critical cross-section of the columns was found from the recommendations of the NTC-DCC-2023 [15] for flexo-compression. To avoid shear failure, the design shear force was calculated from the maximum nominal bending moment obtained from an inelastic analysis, considering the overstrength of the critical section. In the following section, the considerations for the inelastic analysis of the columns are described. For the shear design of the columns, the recommendations for ductile frames of the NTC-DCC-2023 [15] were considered.

3.3. Geometric and Structural Parameters of the Columns

The RC cantilever columns represent the substructure of bridges with simply supported straight axes, in which the ends of each panel or beam of the superstructure are supported by a neoprene pad at the head of a column or abutment [2]. Under these conditions, one approach to seismic analysis of transverse bridge directions is to idealise the columns as a series of independent single-degree-of-freedom oscillators. With respect to the longitudinal direction, due to the lateral stiffness of the neoprene supports, these impose some restriction on the relative lateral movement between the superstructure beams and the columns; therefore, the response of these bridges in the longitudinal direction is that of a continuous structure [19].

3.4. Numerical Model of the Columns

The inelastic analysis was performed using the finite element method using SeismoStruct v7.0 [20]. The column was modelled with frame second-order elements. These elements are three-dimensional, inelastic force-based elements. Six integration sections were used. The cross-section was discretized into 300 fibres. The stress–strain relations of plain and confined concrete are represented by the model of Mander et al. [21], which is an inelastic uniaxial constant confinement model. The stress–strain relation of the reinforcing steel is represented by the Dodd and Restrepo model [22], which is a uniaxial inelastic model. On the other hand, the column base was fully fixed, so the soil–structure interaction was not considered for the scope of this work. In Márquez-Domínguez et al., the numerical model [2] was described.
To represent the column’s behaviour, an inelastic two-stage analysis was performed. In the first stage, at the top end of the column, a vertical point load was applied, representing its self-weight and the tributary weight of the superstructure. In the second stage, at the top end of the column, a lateral displacement, representing the seismic demand, was applied and increased in steps. This analysis considers second-order effects (P-Δ).
During the inelastic response of the column, an additional rotation develops at its critical cross-section, resulting from the inelastic deformation of the column’s longitudinal reinforcement penetrating or extending linearly into the foundation. In Priestley et al. [10], this is defined as yielding penetration length (Lpy), calculated by Equation (7). Considering the above, to the original length of the column, we added the Lpy.
L p y = 0.022 f y d b l ,
where fy and dbl are the yield stress (in MPa) and the diameter of the longitudinal reinforcement (in m), respectively. For the calculation of Lpy, the yield stress of the longitudinal reinforcement was considered.

3.5. Procedure to Obtain the Design Factors (R, Q) and keff

R, Q and keff factors were obtained from the static capacity curve or ratio between the basal shear and the lateral displacement of the upper end, idealised as bilinear (Figure 1), using the procedure described in the literature [1,4,23].
In the capacity curve (CC), the CPLS is defined when the first of the following three conditions occurs:
1.
Fracture of the longitudinal reinforcement. Based on the results of Rodríguez and Botero [24], the value of 0.22 mm/mm was defined;
2.
Fracture of the transversal reinforcement (εcc). To evaluate this criterion, use is made of Equation (8), suggested by Mander et al. [21];
3.
Loss of basal shear strength (Vbmax). A reduction criterion proposed by Elnashai and Mwafy [14] limited the loss to 10%.
ε c c = 0.004 + 1.4 ρ t f y h ε s u f c c ,
where ρt, fyh and εsu are the reinforcement ratio, yield stress, and fracture strain of the transverse reinforcement, respectively, and f′cc is the compressive stress capacity of the confined concrete.
The capacity curve was simplified by a bilinear relation (Figure 1, grey line), using the equal energies criterion under both curves. From the idealised curve, the following factors were determined: R, Q, Keff and keff. To do this, a secant line was then drawn, beginning from the origin and intersecting the CC at a point whose abscissa and ordinate are the Vbd of the column and its respective Δd. This straight line is the elastic branch of the idealised bi-linear CC shown in Figure 1, and its slope defines the Keff, which is used to calculate the Ieff using Equation (9).
I e f f = K e f f L 3 3 E c = V b d L 3 3 E c Δ d ,
consequently keff was estimated through the ratio Ieff/Ig. Afterward, the equal energy dissipation criterion (equal areas under both curves) was applied, imposing the condition that the slope of the second branch of the idealised CC is approximately equal to zero, where the yielding is located. Therefore, the idealised CC can be characterised in this way. Finally, on this curve, Equations (4) and (6) were applied to calculate R and Q, respectively.

4. Mean Value Estimation of R, Q and keff

The behaviour of each variable, R, Q and keff, was analysed, as a function of the next four variables, f′c, L/D, P/(Ag·f′c) and ρ. The set of values of these variables obtained from the CC was submitted to a multi-linear regression analysis to obtain models for R, Q and keff which are first-degree polynomial functions.
Equations (10)–(12) define the models for calculating R, Q and keff as a function of the variables f′c, L/D, P/(Ag·f′c) and ρ.
R = 1.47 0.000630 f c 0.023 L D + 1.76 P A g f c + 5.27 ρ ,
Q = 11.1 0.0042 f c 0.471 L D 4.38 P A g f c 37.5 ρ ,
k e f f = 0.202 0.000005 f c + 0.00462 L D + 1.58 P A g f c + 7.05 ρ .
Table 3 shows the p-value obtained for both the constant term and the coefficients of each of the independent variables, as well as their corresponding coefficient of multiple determination (R2) for each model. These R2 values are considered acceptable only for Equations (10) and (12). On the other hand, the p-value corresponding to the constant terms and most of the coefficients of the independent variables is considerably less than 0.05, so the relation of each of the independent variables with the dependent variable is significant, and therefore all four variables should be included in both models. Additionally, it can be seen that for the model defined by Equation (12), the p-value that corresponds to the constant term and the coefficients of the independent variables L/D, P/(Ag·f′c) and ρ, is considerably less than 0.05, so the relation of each of these three variables to the dependent variable is significant and therefore should be included in the model for keff. However, because the p-value corresponding to the coefficient of the variable f′c is considerably greater than 0.05, the relation of this variable with keff is not significant and may not be included in the model, which will slightly decrease the value of the corrected R2 corresponding to it.

5. R, Q and keff Models vs. Recommended Ones

The R, Q and keff mean values obtained from proposed models (Equations (10)–(12)) were compared with those specified by NIT-SICT [6] (Q = 2 and R = 2) by using keff = 0.5, as recommended by specialised engineers. For instance, R (Figure 2), Q (Figure 3), and keff (Figure 4) values are compared for RC columns (f′c = 24.516 MPa). The values are a function of P/(Ag·f′c) and ρ given several values of L/D.
The R-values obtained from the CC have been compared with those obtained from the proposed model (Figure 2). The mean R-values are suitably adjusted to those obtained from the CC, which agrees with the R2 = 83.0% of this model. Figure 2 shows that for the combinations of values of the independent variables: L/D = 3 and L/D = 5, ρ = 4%, and P/(Ag·f′c) = 0.3. The R-values of the model and CC are similar, with differences less than −12%. For the remaining combinations, the R-values of the model are less than or equal to 35% of those given by NIT-SICT [6]. Thus, this design code, in general, overestimates the R-values of RC cantilever columns. Additionally, it is observed that R-values at high seismicity sites determined by Sanchez et al. [16] (1.6) are similar to the R-values determined in the present study, suggesting that the latter will be more appropriate for use in sites of high seismicity in Mexico.
The Q-values in the CC are compared to those in the model (Figure 3). The mean Q-values fit acceptably with those obtained from the CC. This consistency is supported by an R2 of 62.4% in this model. Figure 3 shows that the Q-values of the model are up to −35% lower than the CC values. In contrast, Q-values of the proposed model are between 150 and 400% higher than the specified value by NIT-SICT [6], so this design code underestimates the ductile capacity of lateral displacement of RC cantilever columns.
The keff-values in the CC are compared to the model (see Figure 4). The mean keff-values fit well with those obtained from the CC, and this consistency is supported by an R2 value of 89.9% for the model. Figure 4 shows that only for the combinations of the independent variables ρ = 1%, P/(Ag·f′c) = 0.1 and 0.15, and for all values of L/D, the mean values for keff are all minor (up to −20%) to the value considered by specialised engineers (keff = 0.5). For the other combinations, the mean keff-values are from 20% (ρ = 2% and P/(Ag·f′c) = 0.15) to 100% (ρ = 4% and P/(Ag·f′c) = 0.30) higher than the value considered by specialised engineers.
In Figure 2, Figure 3 and Figure 4, the trend of the values of R, Q and keff obtained from the idealised CC is well predicted by the respective models. Therefore, in this section, the influence of the independent variables, called f′c, L/D, P/(Ag·f′c) and ρ , on the variables R, Q and keff is discussed. The coefficient of ρ in Equation (10) is positive, which means that more longitudinal reinforcement in the column will increase its R, holding other variables constant. Equation (10) shows a positive coefficient of P/(Ag·f′c), indicating that increasing only the axial load on a column will increase its R. Equation (10) shows a negative coefficient of L/D, indicating that R will decrease if this column’s parameter is increased. Equation (10) shows that the coefficient of f′c is negative. Therefore, increasing the concrete’s strength will decrease its R.
On the other hand, it can be observed that the coefficient of ρ in Equation (11) is negative, indicating that if only the longitudinal reinforcement ratio in the column is increased, its Q will decrease. Further to this, the negative coefficient of P/(Ag·f′c) in Equation (11) can also be observed, which means that if only the axial load in a column is increased, its Q will decrease. Additionally, the negative coefficient of L/D in Equation (11) implies that if only this parameter of the column is increased, its Q will decrease. Moreover, the negative coefficient of f′c in Equation (11) means that if only the strength of the concrete is increased, its Q will decrease.
On the other hand, it can be seen from Equation (12) that the coefficient of ρ is positive, which means that if only the longitudinal reinforcement ratio in the column is increased, its keff will be increased. Similarly, the coefficient of P/(Ag·f′c) in Equation (12) is positive, which means that if only the axial load in a column is increased, its keff will be increased. Moreover, in Equation (12), it can be observed that the coefficient L/D is positive, indicating that if only this column parameter is increased, its keff will increase. Likewise, in Equation (12), it can be established that the coefficient of f′c is negative, indicating that if only the strength of the concrete is increased, its keff will decrease.
The R-factors of the CC, the proposed models, and those specified by AASHTO [3] and EUROCODE [5] were calculated and compared (Figure 5). The R-factor values obtained from the proposed models fit satisfactorily with those obtained from the CC. In contrast, comparing the R-factor values obtained from the proposed models with those obtained by AASHTO [3] and EUROCODE [5] shows that the former exceeds the latter by 60% to 400%. This result indicates that the ductile lateral deformation capacity of the columns is significantly underestimated by these design codes.

6. Design Method Using the Proposed Models

Here is a description of the proposed process for designing RC cantilever columns with a solid circular cross-section for seismic conditions. The process uses the proposed models to estimate R, Q and keff factors. Only the procedure for the direction transverse to the longitudinal axis of the bridge and for the Collapse Prevention Limit State (CPLS) is described since the proposed models are only valid for these conditions. Furthermore, for simplicity, only the main steps of the procedure are shown; there are no code requirements, and only two of the most important load combinations are considered:
  • To determine the dimensions of the bridge superstructure and estimate the maximum weight that each column will support, design the superstructure to carry the combination of “maximum gravity” loads (dead load plus maximum live load);
  • From the column length (L) already known and its maximum aspect ratio L/D, specified in the code used, where D is the cross-section diameter of the column, thus, calculate the minimum diameter (Dmin) or propose a larger one according to another criterion. After that, the corresponding cross-sectional area, Ag, must also be calculated;
  • Design the column bents, the width must be equal to or greater than D;
  • Calculate the axial load (P) standing on the column as the sum of the maximum weight of the superstructure acting on it plus the weight of the bent.;
  • Estimate the minimum f′c of the concrete (f′cmin) from the maximum P/Ag·f′c ratio specified in the code used or propose a higher value according to other criteria. If f′cmin is considered excessive, increase D and repeat the procedure from step 2. Once f′c has been determined, calculate the modulus of elasticity of the concrete (Ec) using the equation given in the applied code, which is frequently a function of f′c and the weight of the concrete;
  • Carry out the flexural-compression design of the column for the “maximum gravity” load combination to obtain a provisional value for the longitudinal reinforcement ratio (ρ). This ratio is called ρgrav and must be within the range given by the minimum ρ (ρmin) and the maximum ρ (ρmax) specified by the code used. If ρgrav < ρmin, ρmin must be set; if ρgrav > ρmax it is an unacceptable value, and D must be increased and the procedure repeated from step 2;
  • Assess the weight of the superstructure contributing to each column from the gravity and temporal loads involved in the combination of “gravity plus earthquake loads”;
  • Calculate the axial load acting on the column, which is given by the sum of the previously estimated weight of the contributing superstructure plus the weight of the bent. This axial load is called Ptemporal;
  • Determine the reactive mass of the column, mr, considered to be concentrated at the centre of gravity of the superstructure. mr is the sum of Ptemporal/g, where g is the acceleration of gravity plus the weight of the upper half of the column divided by g;
  • With the values of f′c, L/D, Ptemporal/Ag·f′c, and a proposed value of ρprop, similar to ρgrav, use the models to calculate the R, Q and keff values of the column for seismic analysis;
  • Using the value of keff, calculate the effective moment of inertia, Ieff, of the column cross-section as follows: Ieff = keff Ig where Ig is the moment of inertia of the cross section;
  • Develop the numerical model for the earthquake analysis using the values for mr, Ptemporal, Ieff, f′c and Ec and the geometry and support conditions of the column;
  • From the elastic spectrum of the CPLS and the specified approximations for equal displacements and energies or other applicable alternatives in accordance with the bridge design standard, determine the corresponding inelastic design spectrum. This can be achieved by inputting the previously estimated R and Q values into the functions defining the aforementioned approximations;
  • Carry out a spectral–modal seismic analysis of the column to obtain the internal design forces: the axial load, Pu, and the bending moment, Mu;
  • Determine the required longitudinal reinforcement ratio (ρreq) to resist the combined action of Pu and Mu. If ρreq < ρmin, ρmin should be placed; if ρreq > ρmax then it is an unacceptable ratio, D should be increased, and the procedure from step 2 should be repeated;
  • Once ρreq has been defined in step 15, it needs to be compared with ρprop in step 10. Therefore, ρreq is considered acceptable for the combination of “gravity plus temporal” loads if the relative difference between both is within an acceptable range, e.g., ±2%. The amount of longitudinal reinforcement finally placed in the column is the greater of ρreq and ρgrav, with a diameter for the longitudinal reinforcement bars and a bar arrangement that meets the design requirements, and the column bending design is complete. If the relative difference between ρreq and ρprop is not within ±2%, ρreq is taken as the new ρprop and the procedure is repeated from step 10 onwards;
  • Once the flexo-compressive design of the column has been completed, the minimum transverse reinforcement ratio (ρtMin) is calculated. This is specified by the design code used. This transverse reinforcement ratio is determined by proposing a diameter for the transverse reinforcement bars and a bar arrangement that meets the design requirements. The transverse reinforcement ratio required (ρtReq) is then estimated to resist the shear force associated with the bending moment assessed from ρreq and the expected longitudinal, transverse, and concrete strengths. The greater of ρtMin and ρtReq will be used. If the latter is greater, it may be necessary to propose a different diameter for the bars of the transverse reinforcement and/or a different arrangement of these bars that meets the design requirements. Therefore, the column design has been completed.

7. Conclusions

The main contribution of this research is defining mathematical models in order to demonstrate the relation between R, Q and keff with f′c, L/D, P/(Ag·f′c) and ρ. These models are recommended to design cantilever circular cross-section columns for RC bridges in the Collapse Prevention Limit State. Therefore, the following conclusions can be drawn:
  • Statistical results exhibited a significant influence of the concrete compressive strength (f′c) and length–depth ratio (L/D), axial load–strength ratio (P/(Ag·f′c)) and longitudinal reinforcement steel ratio (ρ) on the response modification factors (R, structural overstrength, and Q, seismic behaviour factor), justifying the inclusion of these four variables in the proposed models for R and Q. In the keff model, only the contribution of the variable f′c is not significant, so it may not be included in the model;
  • The fit degree (R2) for R, Q and keff estimated from models to CC data was acceptable at 83.0, 64.2 and 89.9%, respectively;
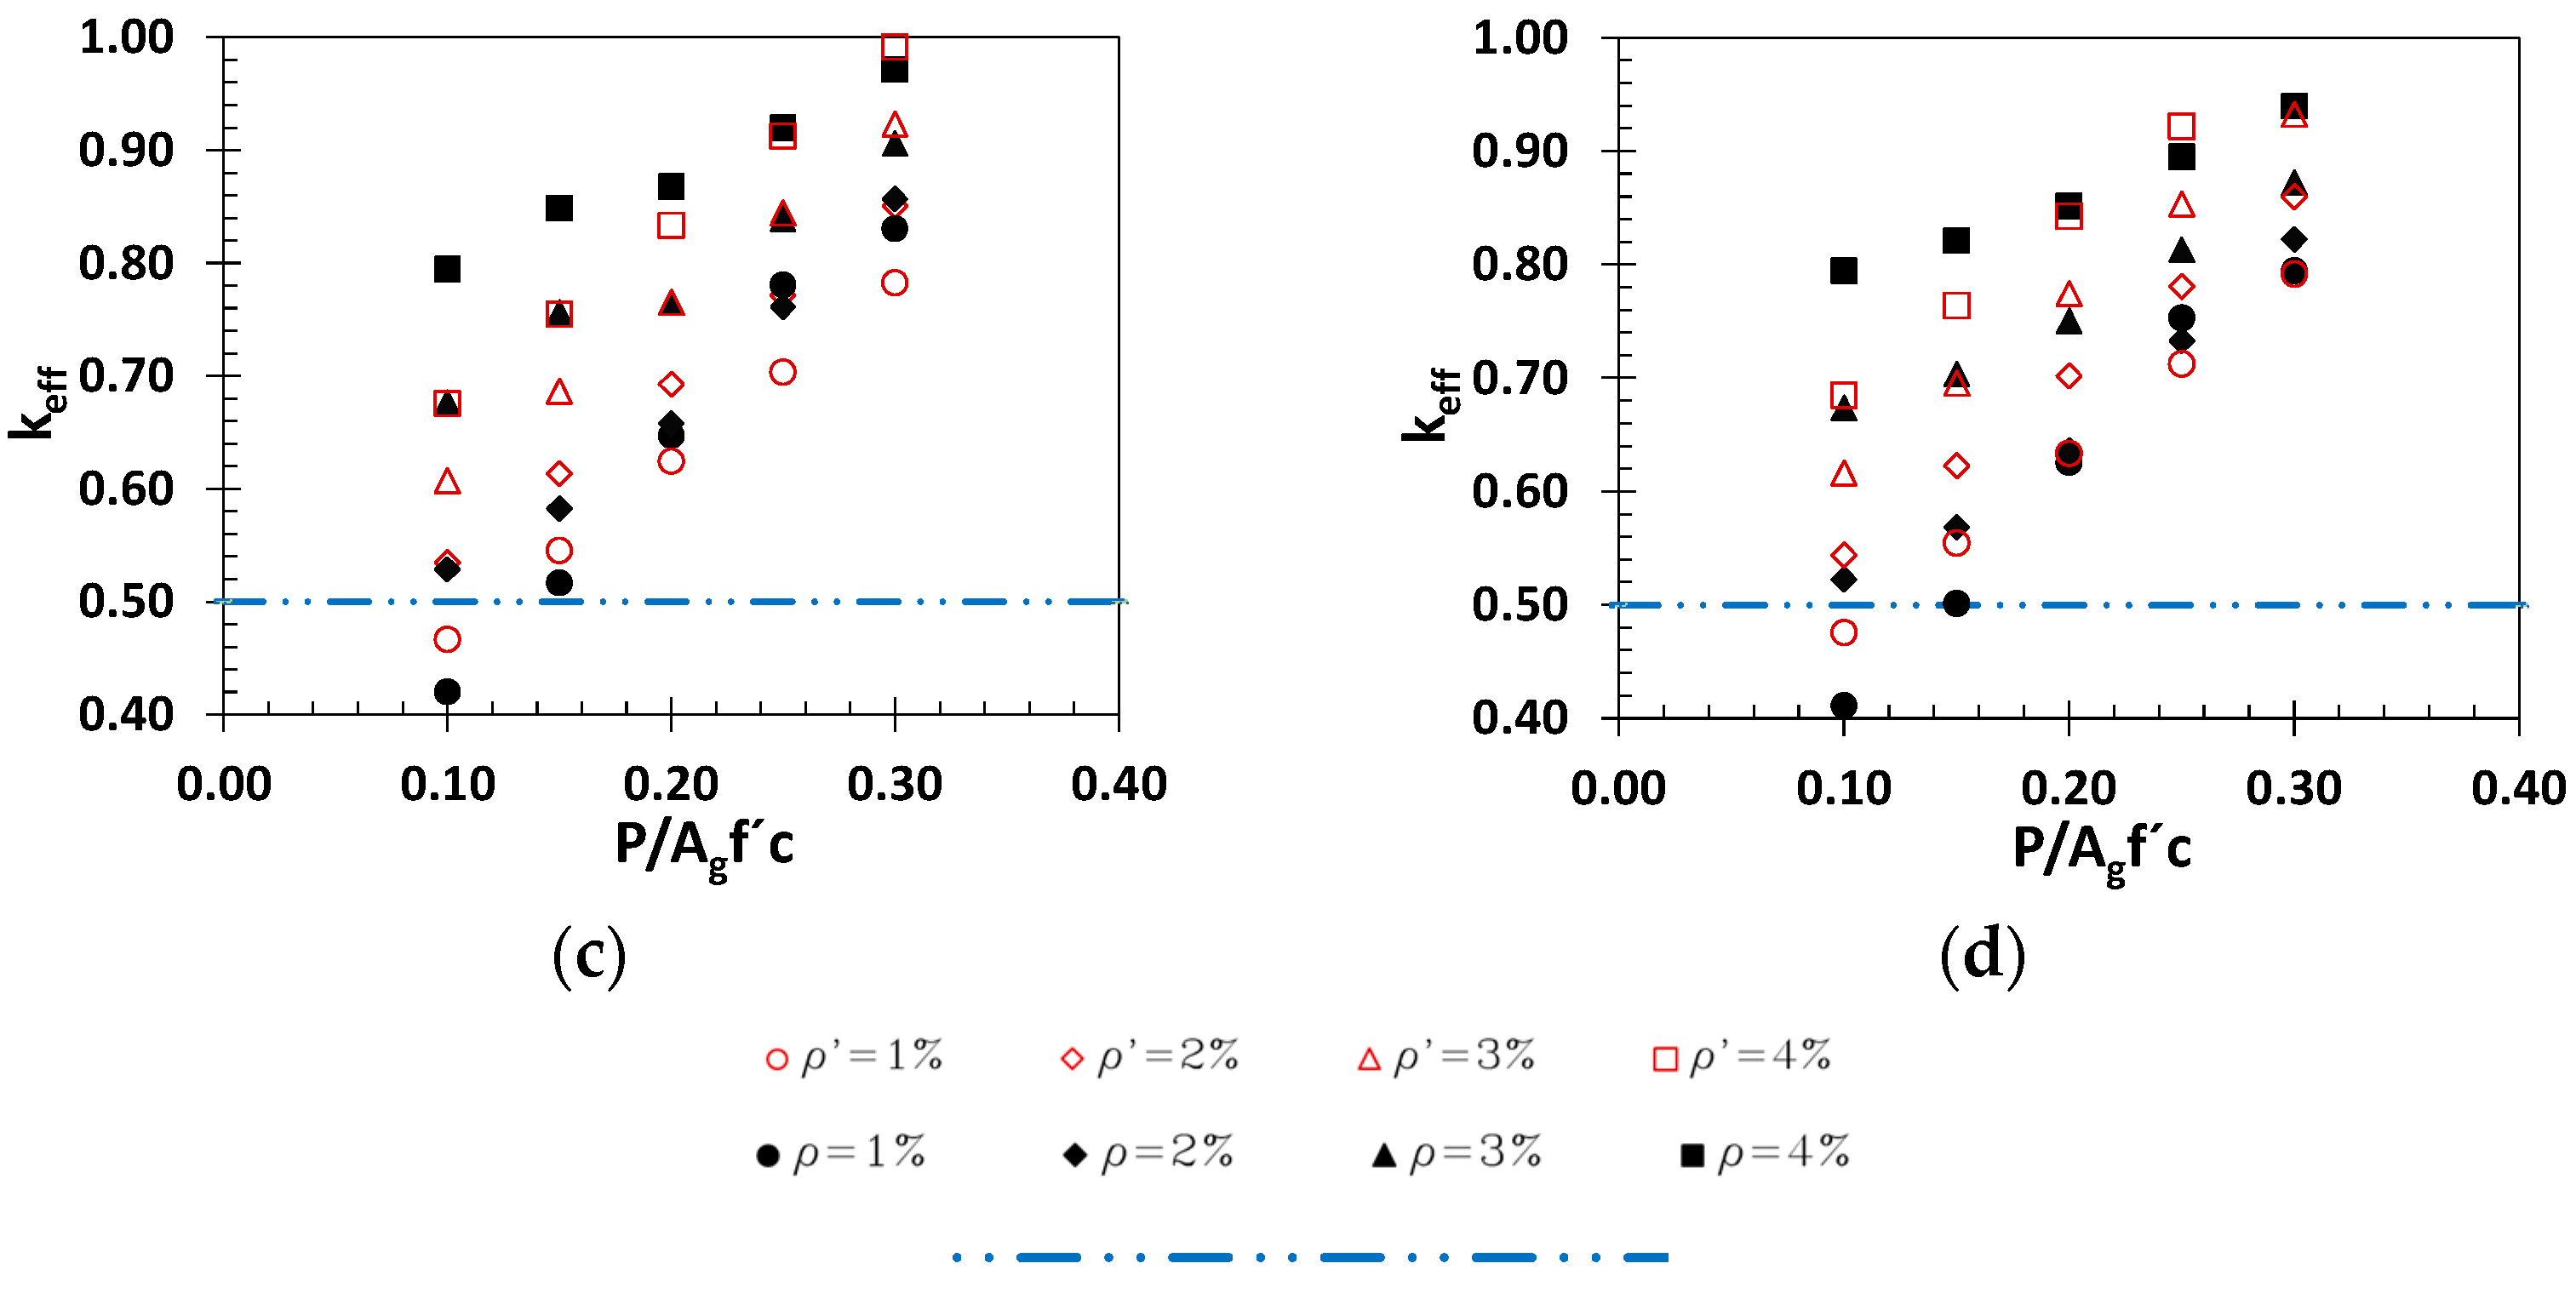
  • keff considered by specialised engineers overestimates (up to −20% when ρ = 1% and P/(Ag·f′c) = 0.1 and 0.15) and underestimates (100% when ρ = 4% and P/(Ag·f′c) = 0.30). In contrast, the proposed model estimated values similar to those obtained by CC. NIT-SICT [6] overestimates R-values up to 35% in comparison with the model proposed. NIT-SICT [6] underestimates the ductile capacity of lateral displacement of RC cantilever columns by up to 400% compared to the proposed models;
  • In this work, it has been shown that the R-factor should not be considered constant, as can be seen in Figure 5. AASHTO [3] and EUROCODE [3] significantly underestimated the total ductile lateral deformation capacity of the columns;
  • Finally, current codes are conservative, giving values of R, Q and keff; in contrast, the proposed models give more economical results with the recommended minimum safety levels.

Author Contributions

Conceptualisation, J.E.B.-H. and F.C.; methodology, J.E.B.-H. and F.C.; validation, R.S.-E. and A.A.-M.; formal analysis, A.V.-C.; investigation, A.V.-C.; data curation, S.M.-D.; writing—original draft preparation, R.S.-E.; writing—review and editing, A.A.-M.; visualisation, A.V.-C.; supervision, J.E.B.-H. All authors have read and agreed to the published version of the manuscript.

Funding

This research received no external funding.

Data Availability Statement

The data presented in this study are available on request from the corresponding author.

Acknowledgments

The authors express their appreciation to the Consejo Nacional de Humanidades Ciencias y Tecnologías (CONAHCYT) for awarding them a scholarship to conduct this research.

Conflicts of Interest

The authors declare no conflict of interest.

References

  1. Uang, C. Establishing R (or Rw) and Cd Factors for Building Seismic Provisions. J. Struct. Eng. 1991, 117, 19–28. [Google Scholar] [CrossRef]
  2. Márquez-Domínguez, S.; Barradas-Hernández, J.E.; Carpio, F.; Vargas-Colorado, A.; Aguilar-Melendez, A.; Salgado-Estrada, R. Effective Stiffness and Seismic Response Modification Models Recommended for Cantilever Circular Columns of RC Bridges, First Part: Serviceability Limit State. Buildings 2023, in press. [Google Scholar]
  3. AASHTO. AASHTO LRFD Bridge Design Specifications, 2020th ed.; American Association of State Highway and Transportation Officials: Washington, DC, USA, 2020. [Google Scholar]
  4. Caltrans. Caltrans Seismic Design Criteria, 2nd ed.; State of California Department of Transportation: Sacramento, CA, USA, 2019.
  5. EN 1998-2; Eurocode 8—Design of Structures for Earthquake Resistance—Part 2: Bridges. CEN: Brussels, Belgium, 2010; Volume 2010.
  6. NIT-SICT. N.PRY.CAR.6.01.005/1. In PRY. PROYECTO; SICT, IMT, Eds.; Instituto Mexicano del Transporte: Mexico City, Mexico, 2001; Volume Parte 6. [Google Scholar]
  7. Newmark, N.M.; Hall, W.J. Procedures and Criteria for Earthquake Resistant Design. In Proceedings of the Building Practices for Disaster Mitigation, Building Science, Series 46; Wright, R., Kramer, S., Culver, C., Eds.; US Department of Commerce: Washington, DC, USA, 1973; pp. 209–236. [Google Scholar]
  8. Priestley, M.J.N.; Calvi, G.M.; Kowalsky, M.J. Displacement-Based Seismic Design of Structures, 2nd ed.; Eucentre: Pavia, Italy, 2007; Volume 2007, ISBN 978-88-85701-05-2. [Google Scholar]
  9. CFE MDOC C.1.3. Manual de Diseño de Obras Civiles, Diseño Por Sismo, 2015th ed.; CFE, IIE, Eds.; CFE: Ciudad de Mexico, Mexico, 2015; ISBN 9786079703608. [Google Scholar]
  10. Priestley, M.J.N.; Seible, F.; Calvi, G.M. Seismic Design and Retrofit of Bridges; John Wiley & Sons, Inc.: Hoboken, NJ, USA, 1996; ISBN 9780470172858. [Google Scholar]
  11. Casarotti, C.; Monteiro, R.; Pinho, R. Verification of Spectral Reduction Factors for Seismic Assessment of Bridges. Bull. N. Z. Soc. Earthq. Eng. 2009, 42, 111–121. [Google Scholar] [CrossRef]
  12. Casarotti, C.; Pinho, R. An Adaptive Capacity Spectrum Method for Assessment of Bridges Subjected to Earthquake Action. Bull. Earthq. Eng. 2007, 5, 377–390. [Google Scholar] [CrossRef]
  13. Şadan, O.B.; Petrini, L.; Calvi, G.M. Direct Displacement-Based Seismic Assessment Procedure for Multi-Span Reinforced Concrete Bridges with Single-Column Piers. Earthq. Eng. Struct. Dyn. 2013, 42, 1031–1051. [Google Scholar] [CrossRef]
  14. Gentile, R.; Nettis, A.; Raffaele, D. Effectiveness of the Displacement-Based Seismic Performance Assessment for Continuous RC Bridges and Proposed Extensions. Eng. Struct. 2020, 221, 110910. [Google Scholar] [CrossRef]
  15. NTC-DCEC. Norma Técnica Complementaria Para Diseño y Construcción de Estructuras de Concreto; Gaceta del Gobierno de la Ciudad de México: Mexico City, Mexico, 2023.
  16. Sánchez, A.R.; Arêde, A.; Jara, J.M.; Delgado, P. Overstrength Factors of RC Bridges Supported on Single and Multi-column RC Piers in Mexico. Earthq. Eng. Struct. Dyn. 2021, 50, 3695–3712. [Google Scholar] [CrossRef]
  17. AASHTO. AASHTO LRFD Bridge Design Specifications, 8th ed.; American Association of State Highway and Transportation Officials: Washington, DC, USA, 2017; ISBN 9781560516545. [Google Scholar]
  18. NTC-DCEC. Normas Técnicas Complementarias Para Diseño y Construcción de Estructuras de Concreto, 2017th ed.; Gaceta del Gobierno de la Ciudad de México: Mexico City, Mexico, 2017.
  19. Rivera, D. Diseño Sísmico de Columnas de Puentes Urbanos de Concreto Reforzado En La Ciudad de México. Ph.D. Thesis, Universidad Nacional Autónoma de México, Mexico City, Mexico, 2005. [Google Scholar]
  20. Seismosoft 2018. SeismoStruct 2018—A Computer Program for Static and Dynamic Nonlinear Analysis of Framed Structures. Available online: http://www.seismosoft.com (accessed on 29 June 2023).
  21. Mander, J.B.; Priestley, M.J.N.; Park, R. Theoretical Stress-Strain Model for Confined Concrete. J. Struct. Eng. 1988, 114, 1804–1826. [Google Scholar] [CrossRef]
  22. Dodd, L.L.; Restrepo-Posada, J.I. Model for Predicting Cyclic Behavior of Reinforcing Steel. J. Struct. Eng. 1995, 121, 433–445. [Google Scholar] [CrossRef]
  23. Elnashai, A.S.; Mwafy, A.M. Overstrength and Force Reduction Factors of Multistorey Reinforced-Concrete Buildings. Struct. Des. Tall Build. 2002, 11, 329–351. [Google Scholar] [CrossRef]
  24. Rodríguez, M.; Botero, C. Aspectos Del Comportamiento Sísmico de Estructuras de Concreto Reforzado Considerando Las Propiedades Mecánicas de Aceros de Refuerzo Producidos En México; II-UNAM: Mexico City, Mexico, 1996; Volume 1. [Google Scholar]
Figure 1. Column capacity curve and its idealisation.
Buildings 13 02423 g001
Figure 2. R-values comparison: (a) L/D = 3; (b) L/D = 5; (c) L/D = 7; and (d) L/D = 9. [R-values specified by NIT-SICT [5] are shown by a blue dotted line, ρ   as estimated by Equation (10) in red tags, and ρ is determined by CC in black labels].
Buildings 13 02423 g002aBuildings 13 02423 g002b
Figure 3. Q-values comparison: (a) L/D = 3; (b) L/D = 5; (c) L/D = 7; and (d) L/D = 9. [Q-values specified by NIT-SICT [6] are shown by a blue dotted line, ρ   as estimated by Equation (11) in red tags, and ρ is determined by CC in black labels].
Buildings 13 02423 g003aBuildings 13 02423 g003b
Figure 4. keff-values comparison: (a) L/D = 3; (b) L/D = 5; (c) L/D = 7; and (d) L/D = 9. [keff-values used by specialist engineers are shown by a blue dotted line; ρ   is estimated by Equation (12) in red tags, and ρ is determined by CC in black labels].
Buildings 13 02423 g004aBuildings 13 02423 g004b
Figure 5. R-factors value comparison: (a) L/D = 3; (b) L/D = 5; (c) L/D = 7; and (d) L/D = 9. [R-factors specified by AASHTO [3] are shown by a red dotted line; R-factors specified by EUROCODE [5] are shown by a blue dotted line; ρ   is estimated by Equations (11) and (12) in red tags; and ρ is determined by CC in black labels].
Buildings 13 02423 g005aBuildings 13 02423 g005b
Table 1. Properties of the columns in terms of their geometry and mechanics.
ParameterValue
f′c (MPa)24.51, 29.42, 34.32
fy nominal (MPa)412
r (mm)50
L/D (dimensionless)3, 5, 7, 9
P/(Ag·f′c) (dimensionless)0.10, 0.15, 0.20, 0.25, 0.30
ρ (%)1, 2, 3, 4
Table 2. Concrete parameters.
f′c (MPa)ff (MPa)Ec (MPa)
24.513.1221,783.34
29.423.4223,865.70
34.323.6925,776.64
Table 3. p-value and R2 fitted to the models estimated.
VariableR (Equation (10))Q (Equation (11))keff (Equation (12))
p-Value Coefficient of the Variable
Constant values1.2 × 10−55.6 × 10−63.7 × 10−5
f′c4.5 × 10−63.0 × 10−39.5 × 10−1
L/D3.6 × 10−66.1 × 10−51.0 × 10−3
P/(Ag·f′c)7.4 × 10−53.9 × 10−51.5 × 10⁻⁵
R2 fitted
83.0%64.2%89.9%
Disclaimer/Publisher’s Note: The statements, opinions and data contained in all publications are solely those of the individual author(s) and contributor(s) and not of MDPI and/or the editor(s). MDPI and/or the editor(s) disclaim responsibility for any injury to people or property resulting from any ideas, methods, instructions or products referred to in the content.

