1. Introduction
The environmental advantage of adopting new building technologies and services in a smart and cost-effective manner is critical, as buildings account for roughly 40% of total energy consumption and 36% of total CO2 emissions in the European Union [
1,
2,
3]. A large portion of the energy consumed is needed to meet the needs of buildings for heating, cooling, ventilation, and lighting. The actual performance of systems and services is regularly monitored and managed by advanced systems in both new and retrofitted energy-efficient buildings, giving a solid foundation for understanding both energy and information flows [
2]. The building management system (BMS), also known as the building automation and control system (BACS), is a platform that allows for system control, optimization, and continuous monitoring [
2,
3,
4]. The new version of the European Union’s Energy Performance of Buildings Directive (EPBD) requires the installation or retrofitting of such systems in non-residential buildings of a specified size and system capacity [
5], hence BACS implementation is likely to increase by 2025. Overall, the effort has the potential to cut the EU service building block’s total energy usage by up to 20% [
5].
However, major questions arise in relation to the transposition and implementation, such as what constitutes an acceptable and satisfactory BACS design when functionalities are distinguished, what are the major features required for an energy-efficient building with the optimal operation, and how to assess and evaluate the BACS in a building when various specifications and impacts are considered. Overall, building performance audits and commissioning has been a hot topic in recent decades, with theoretical assessments and evaluations, as well as experimental implementations and actual applications [
6,
7]. The majority of these investigations focused on overall building performance auditing and commissioning, including both initial and continuous commissioning, in order to close the energy performance gap between design and actual performance and ensure proper building operation from the start and throughout its life cycle. Furthermore, a large number of studies have focused on auditing and evaluating building constructions and materials [
8], as well as building components such as heating, ventilation, and air conditioning (HVAC) units [
9], devices, and various services [
10], with the goal of improving the design and optimizing the operation. Although building performance audits and commissioning is not a new topic, few studies have focused on the auditing and commissioning of building automation and control systems, examining their structure and operation patterns.
In this study, we propose an Automated Step Response Testing Tool for Building Automation and Control Systems (AUSTRET). The solution provides parallel processing capabilities, allowing the execution of step response tests in batches. This is beneficial when heterogeneous tests from different subsystems of a building need to be performed or more than one building is considered. The automated tests also reduce human-prone errors, while saving resources and time. An easy-to-configure interface is provided based on web technologies, allowing remote access.
1.1. Background
One of the major challenges facing the smart buildings sector is the assumption made during the design stage that the building management system will perform as expected and claimed in the design documents [
11]. However, a huge body of research has lately revealed that assumptions and assertions that aren’t backed up by testing and proper commissioning have resulted in large energy performance gaps and buildings that aren’t performing at their best [
12,
13]. Poor BACS system design and testing, as well as failures on many levels of control of various building components, including HVAC units and services [
14,
15], are some of the key drivers of these performance discrepancies. Manual performance testing and initial commissioning are required in the majority of industrialized countries’ building codes prior to the building’s handover [
16]. However, the vast majority of these tests are conducted at the level of the entire structure, with no attention paid to the BACS, the building’s brain. Furthermore, such audits and performance testing operations are primarily carried out manually [
17], leaving the owner with no assurance that they are carried out correctly or to the requisite standard. This manual auditing and the commissioning procedure takes a long time and requires a lot of resources, making it both expensive and prone to errors. The bulk of these errors and failures will spread throughout the operating phase, resulting in inefficient operations at all levels as well as high maintenance and repair costs. This pattern is not unique to newly constructed buildings; it is also frequent in retrofitted buildings and facilities, and it may be even more costly and inefficient. Buildings that exhibit service upgrades, new automation, control device installations, management strategy alterations, and BACS software and hardware component upgrades are all potential candidates for errors and malfunctions arising after the modifications. In any of these scenarios, automating BACS performance testing at various levels is critical to assure proper BACS operation and well-connected and managed energy systems.
1.2. BACS Auditing Schemes
The majority of studies and investigations in the literature are focused on improving the design of building automation and control systems as well as their functionality and services. As previously stated, a well-designed building automation system with a high level of control functions during the building design phase does not ensure effective building operation and successful control and management strategies throughout the building operational phase. As a result, testing the operation of the automation system and the reaction of the integrated HVAC systems requires a systematic automated initial and retro-commissioning process. This will result in not just an improved and properly installed BACS, but also a seamless integration and interaction with all of the building’s energy systems.
While many national and international schemes for whole-building certification have been established and presented in recent decades, such as LEED [
18], DGNB [
19], and BREEAM [
20], there are few schemes for auditing and evaluating building automation systems. The ‘eu.bac System’ technique [
21] is one of the well-defined and commonly used BACS auditing and evaluation methodologies in Europe. The European Building Automation and Controls Association (eu.bac), which represents a wide number of prominent producers of building automation and control systems in Europe [
22], devised the basis for this auditing system. The eu.bac uses the European standard EN 15232 “Energy performance of buildings—Impact of Building Automation, Controls and Building Management” [
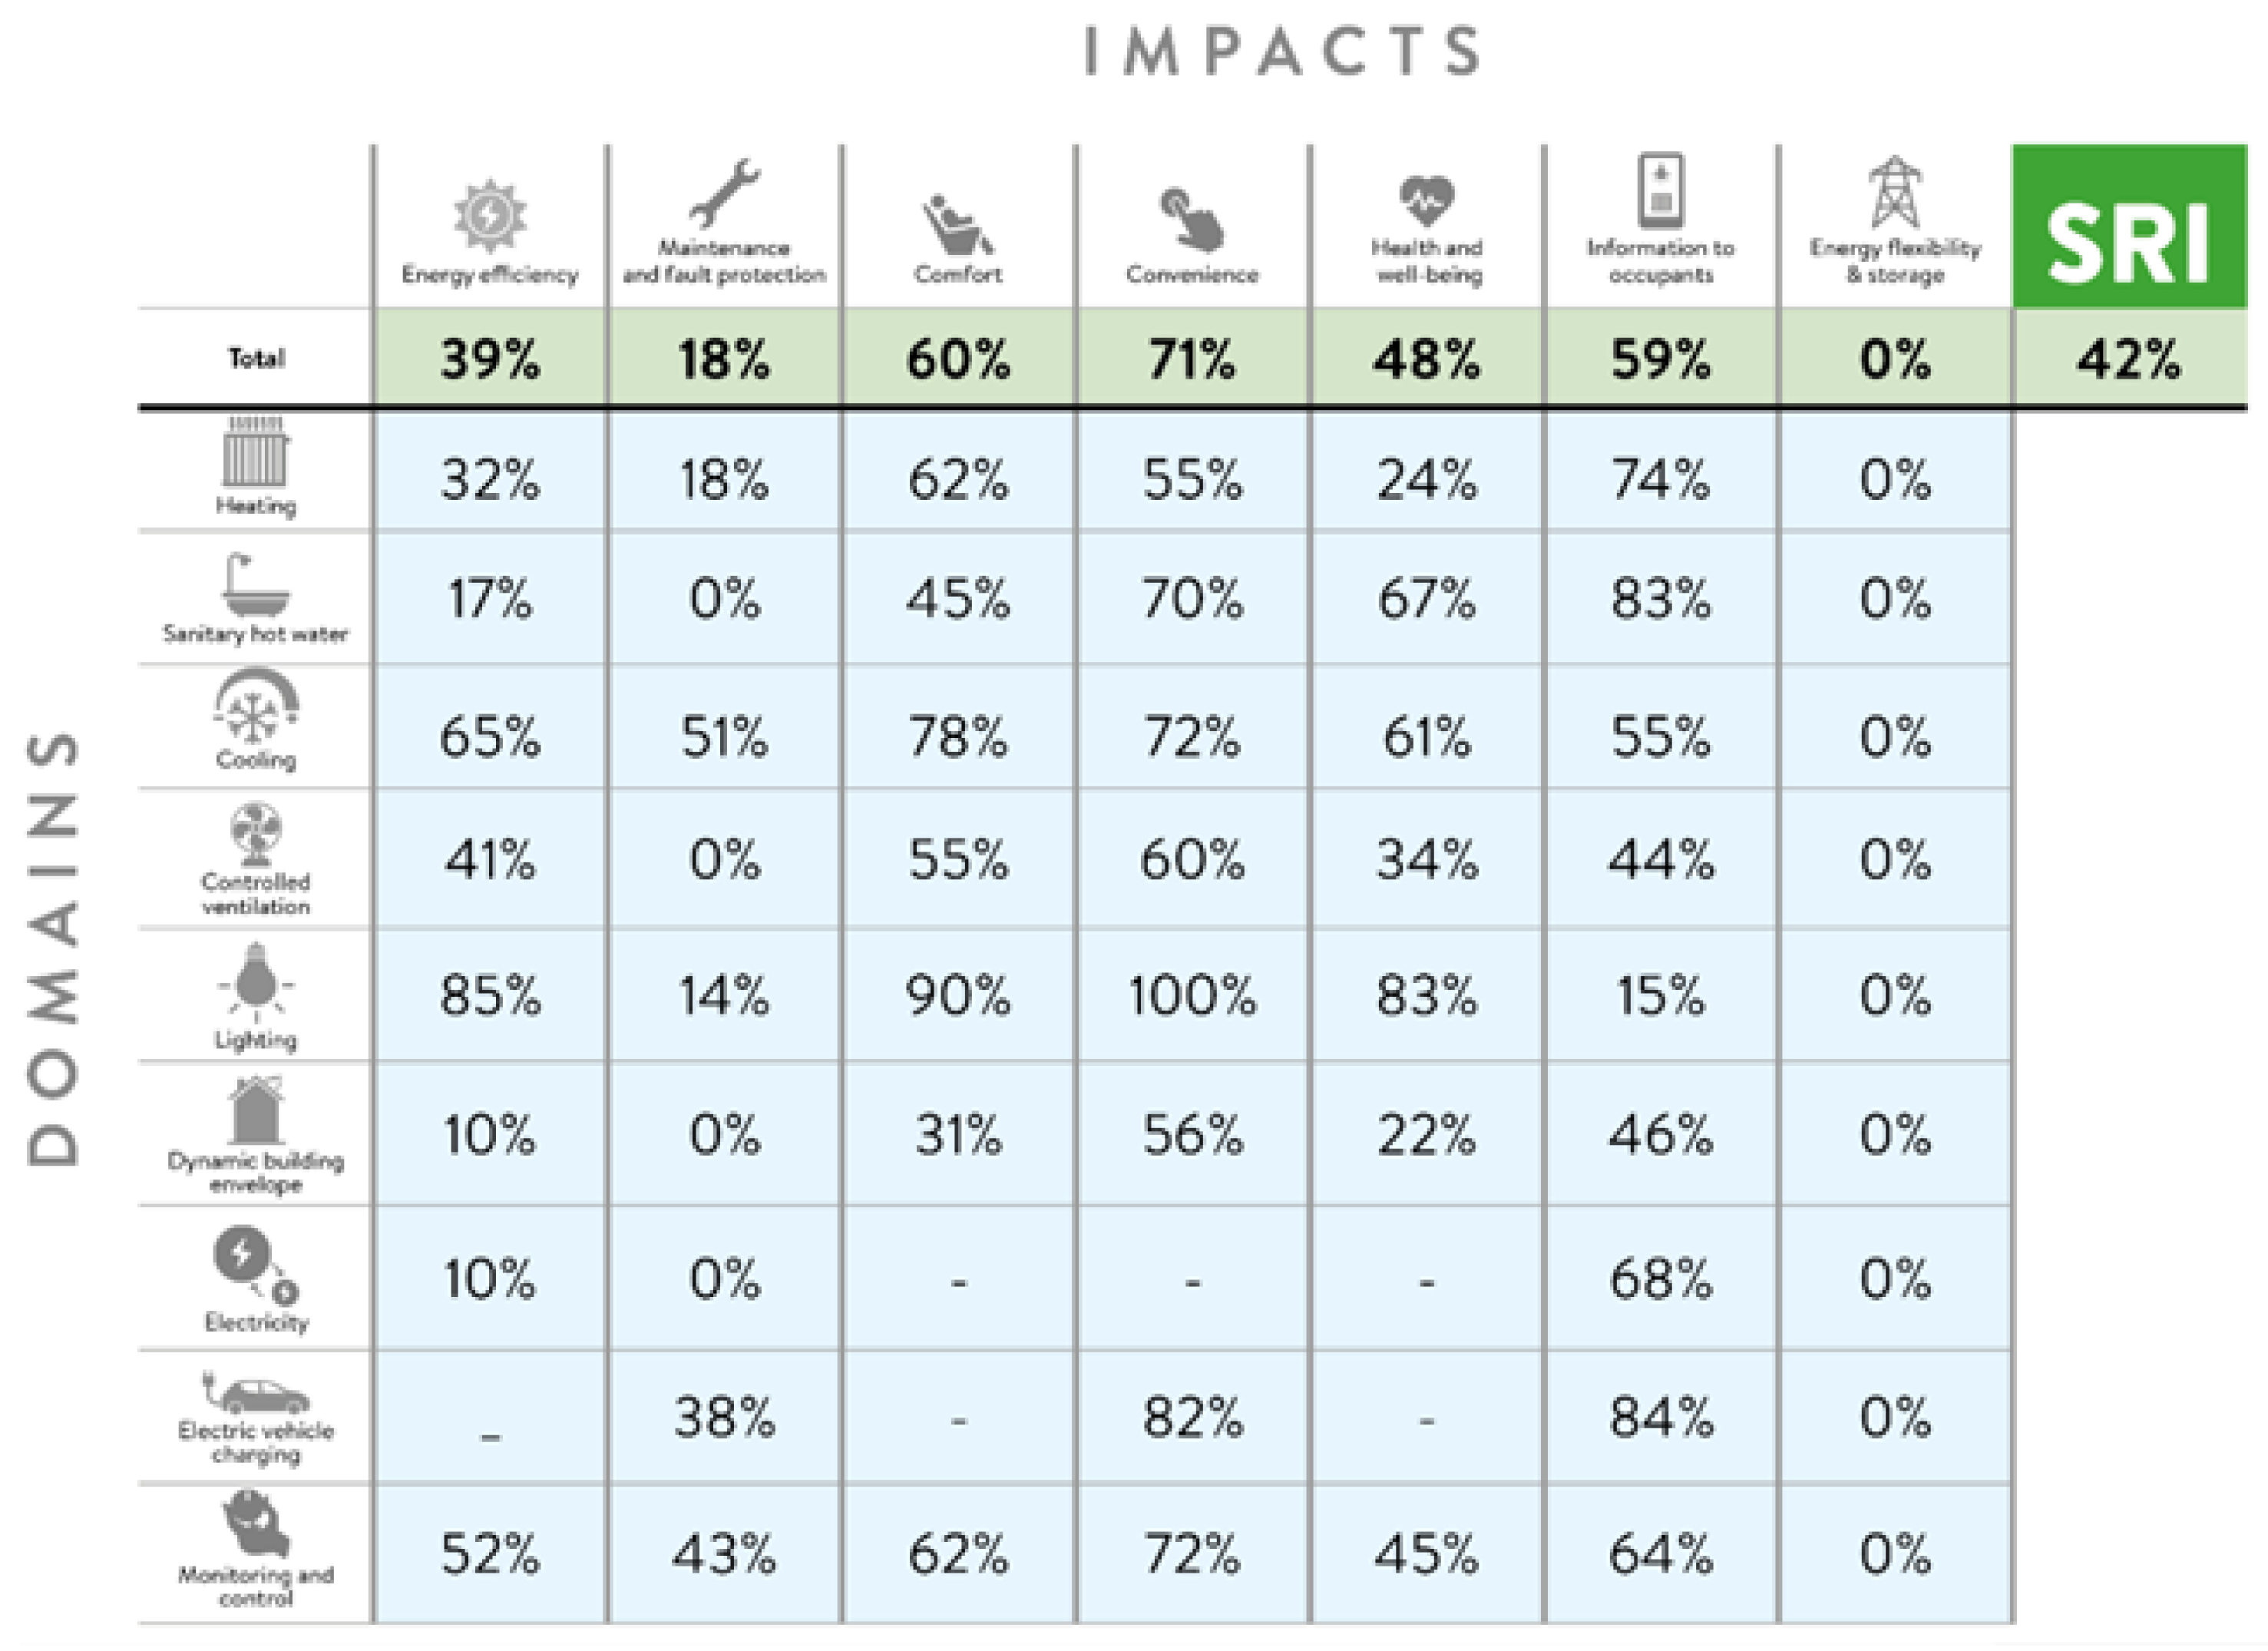
23] as its auditing approach. While the eu.bac system framework focuses on evaluating and auditing the design of BACSs using energy efficiency as the sole criterion, the European Commission recently introduced another BACS auditing scheme, the Smart Readiness Indicator (SRI) [
24], which allows for a much broader assessment and auditing of BACSs depicting the larger picture. The SRI methodology, which similarly uses a point grading system, seeks to evaluate the BACS using numerous criteria. It encompasses maintenance and defect prediction, comfort, convenience, health and wellbeing, energy flexibility and storage, and information to the occupants, in addition to energy efficiency [
25]. In
Figure 1 [
25], the technical fields, impact criteria, and explicit weightings of the EU SRI framework are displayed.
An interactive tool for building automation and control systems auditing and smartness evaluation (IBACSA) was recently developed and presented [
26], based on the two aforementioned schemes, the eu.bac system and the SRI framework. IBACSA is designed to serve as a comprehensive, yet user-friendly and simple-to-use tool for BACS auditing and evaluation, as well as a tool for initial and retro-commissioning of buildings. It uses a hybrid qualitative-quantitative multi-criteria holistic approach for auditing and evaluation, focusing on eight important building domains: heating, hot water, cooling, ventilation, lighting, dynamic envelope, electricity, and monitoring and control [
26]. A total of 60 services are included, each of which is linked to multiple control capabilities and levels. The EN15232 standard for building automation system performance and expert knowledge from the SRI framework is used to score each capability level in relation to each impact criterion. (1) Energy efficiency, (2) Maintenance and fault prediction, (3) Energy flexibility, (4) Comfort, and (5) Information to occupants are the evaluation impact criteria underlined in IBACSA.
Figure 2 shows the IBACSA ‘Results Summary’ tab’s caption, which highlights the best and worst performing domains, as well as the most and least satisfied criteria [
26].
1.3. BACS Design and Implementation
In addition to the auditing schemes for building automation and control systems described above, a large body of research has been published in recent years that focuses on improving the design and implementation of BACS in buildings, as well as investigating and evaluating BACS design and the corresponding specifications for optimal operation. A number of studies have looked at the European Standard EN 15,232 and its methodology, evaluating and analyzing the compliance of case study buildings with the standard as well as the level of functions employed as a control and automation base [
27]. Mancini et al. [
28] conducted a large-scale study that included 412 structures in Italy. Data on energy use was acquired, and an assessment of energy savings was made when BACS was installed in the buildings. Three major techniques of control and automation were highlighted as ideal under the examined specific boundaries and conditions based on the analysis and evaluation performed. Furthermore, the findings revealed that a properly designed BACS can provide enormous potential for demand response applications and building flexibility upgrades, which is a prerequisite for future smart grid interactions. In a related study, Oadowicz et al. [
29] investigated several demand-side management scenarios and concluded that well-designed and effective BACS with improved functions will unlock enormous amounts of flexibility in buildings as well as active demand-side management potential.
Ippolito et al. [
30] stated in their study that proper BACS design is a critical step toward energy efficient and smart building operation. They used the BAC factor technique to examine the effects of the automation and control system implementation on the overall building performance using a case study in Italy. On the technical side, they reported an improvement in building operating patterns as well as an upgrade in the EPC class when a well-designed BACS is deployed. However, a major challenge identified is the high cost of implementation and the variability in the economic savings realized as a result of BACS implementation, which was attributed to various factors such as the country of application, the building in use, climatic conditions, and the HVAC systems installed. The design and execution of a BACS in a case study university building in Poland is investigated by Oadowicz et al. [
31]. The BACS design and implementation were evaluated using the European standard EN15232, and the results revealed a proportional relationship between the BACS functions and energy efficiency levels, and hence a reduction in energy consumption. However, substantial concerns were expressed about the results’ scalability and generalizability. Furthermore, problems in BACS operation, incorrect controls and management procedures, and a lack of automation in operation have all been identified as important drivers of building energy performance gaps, resulting in a decline in total building energy efficiency [
32,
33]. As a result, it was stressed that special attention should be paid not only to the design of BACS, but also to the operation, which should be recognized as a major component in the initial and retro-commissioning procedures of buildings. In this regard, Motamed et al. [
34] developed and implemented a self-commissioning strategy based on a rule-based control logic to increase shading and lighting system automation. The use of the self-commissioning strategy has resulted in a number of significant benefits, including improved visual comfort, lower energy use, and a more fluid control style.
The extensive review of some of the major schemes for auditing and evaluating building automation and control systems, as well as the block of studies focusing on various aspects of the BACS, shows that a large number of theoretical and practical investigations have aimed to ensure an optimal design of the BACS, auditing its features and functionalities, and ensuring that the design complies with national or international automation and control standards. Given the importance of BACS functioning and real integration with various building components and HVAC systems, this work will present an original investigation aiming to design and develop an innovative automated step response testing application tool for building automation systems: AUSTRET. First, the step response testing methodology is presented along with the design of the algorithms and the functionalities. Then, the application design and development are presented with the associated hardware and software components. Then, the step response testing tool implementation in a lab testing environment is conducted and the results are assessed and reported. Finally, the full-scale demonstration of the tool in a real case study building is presented, testing major BACS functionalities along with HVAC systems components’ response. Results are presented and tool implementation and demonstration are evaluated and discussed. This study is carried out under the ‘Automated Auditing and Continuous Commissioning of Next Generation Building Management Systems’ (BuildCOM) research project aims to develop and demonstrate a set of tools for automated building automation systems auditing and continuous building commissioning [
35], along with aiding the development of a systematic auditing and evaluation process for the design and operation of next-generation building automation and control systems.
2. Methodology
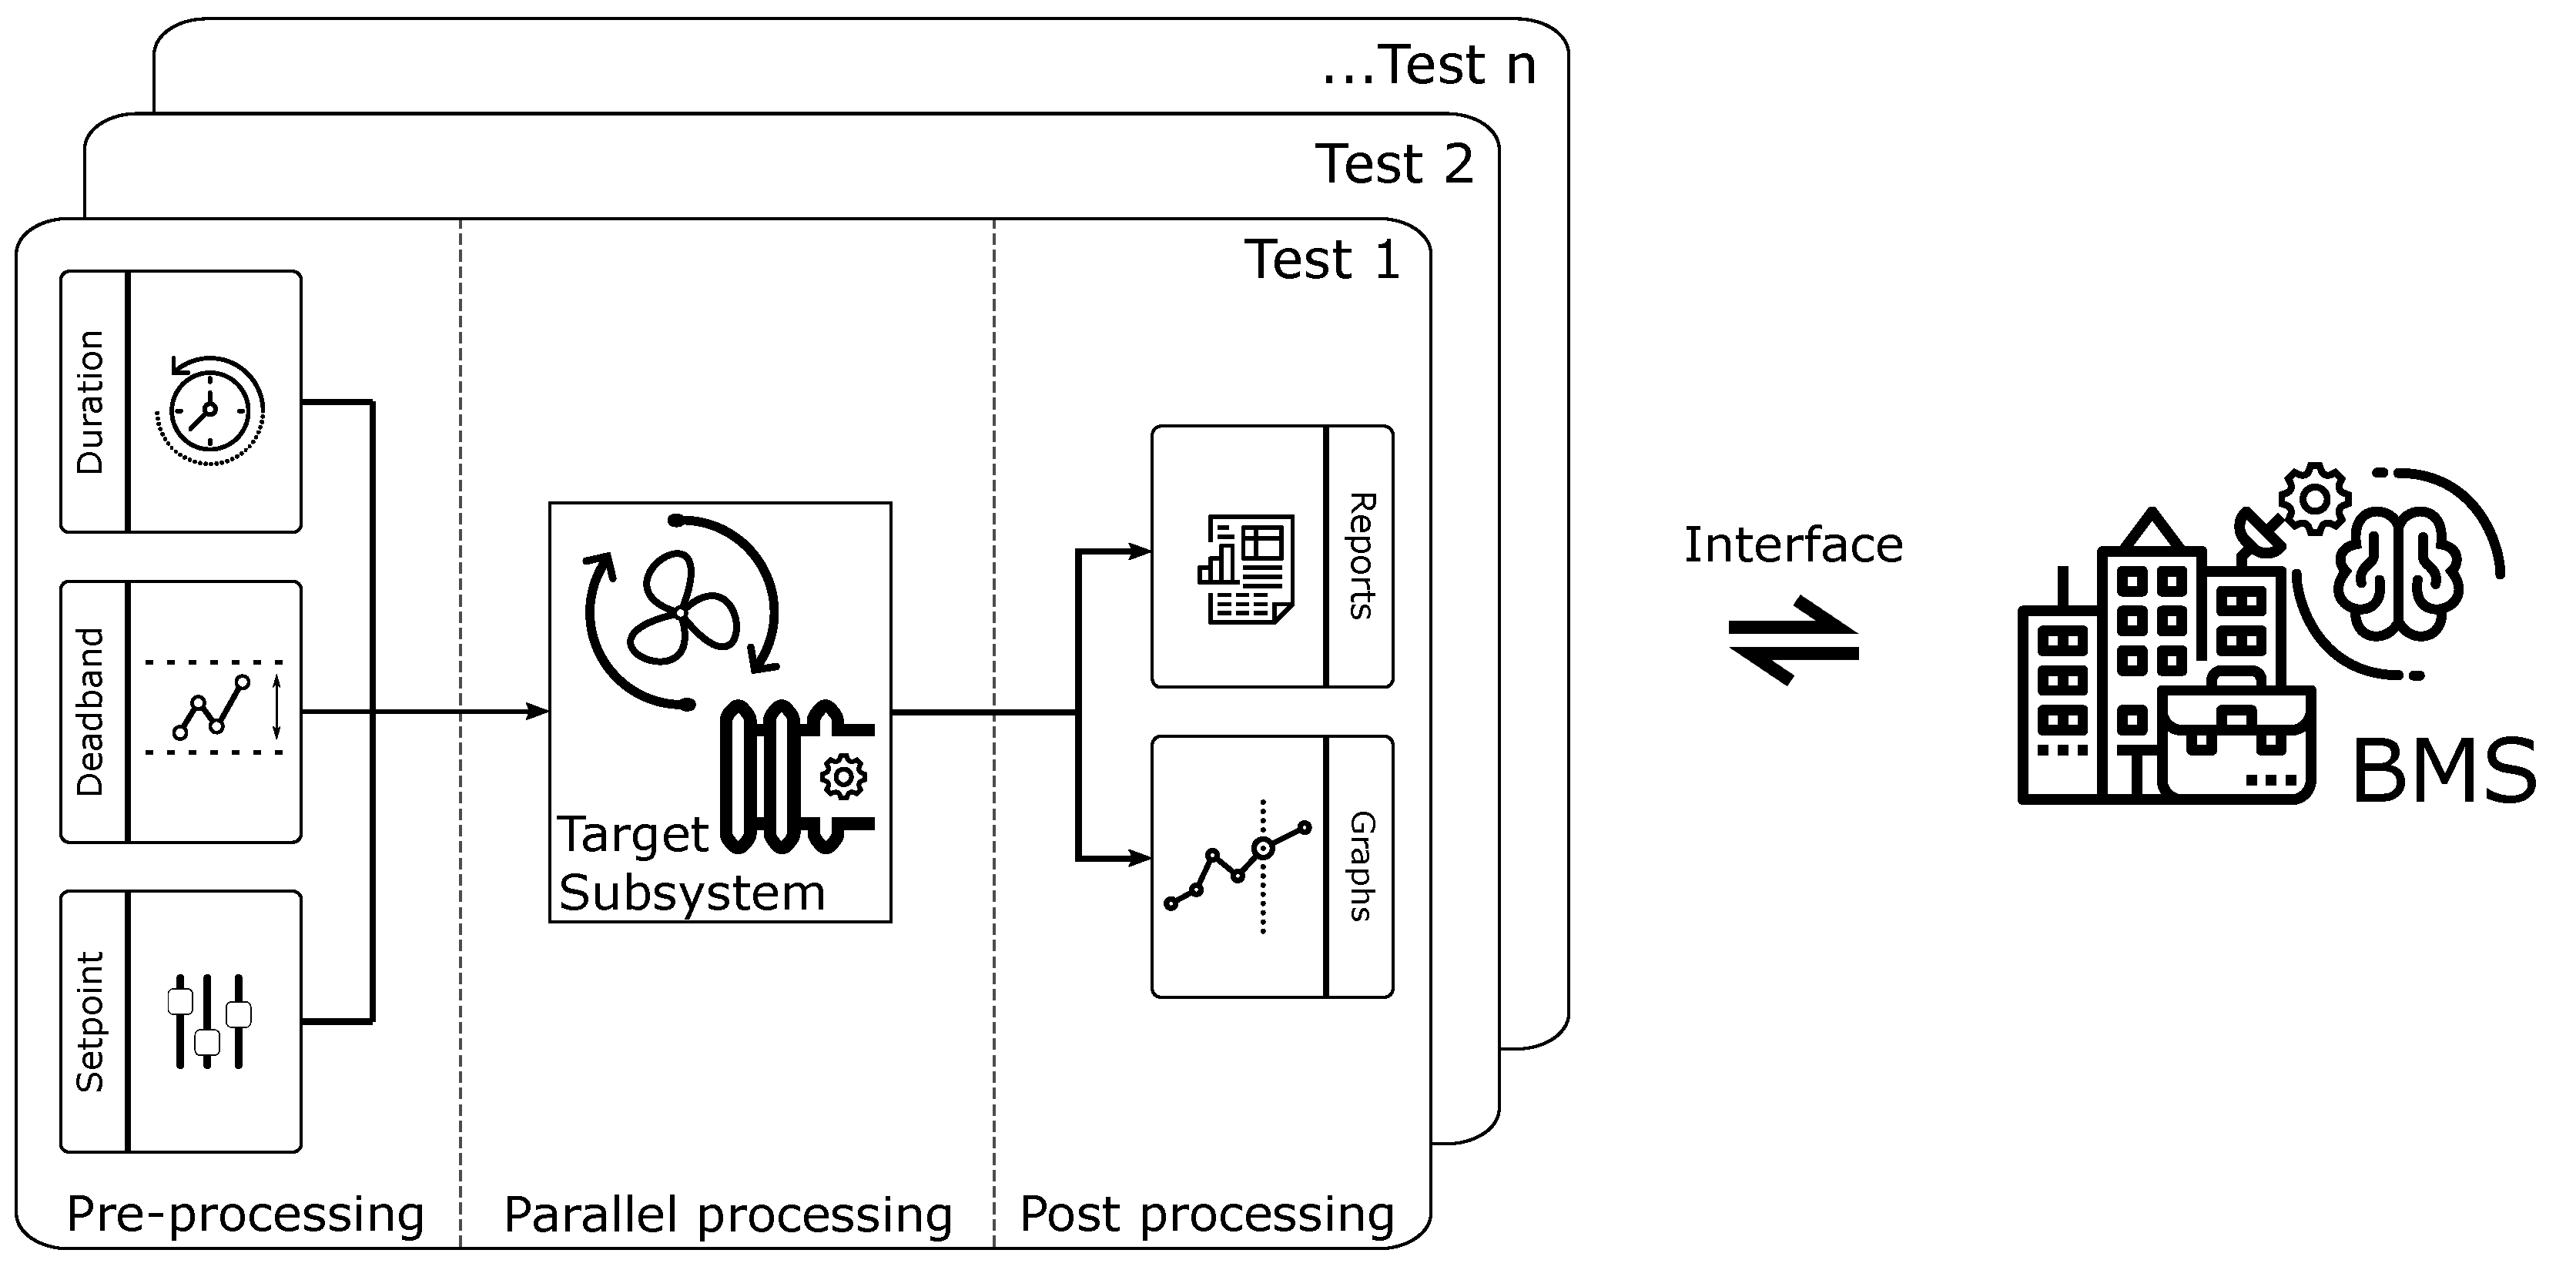
Figure 3 represents the architecture of AUSTRET [
36]. The tool was designed to provide automation functionalities for step response tests applied in building applications. The main focus is to provide automation and control over dynamic building systems, such as HVAC, battery charging, etc. In this context, AUSTRET is not developed to replace the BMS. Instead, it requires an interface with a BMS in order to execute common step response tests, actuating on controllers and collecting the necessary data output to determine the behavior of the system.
The BMS system needs to expose its endpoints in order to provide integration to third-party applications. A plethora of protocols can be used for this purpose. The current version of AUSTRET communicates with a commercial BMS using a RESTful interface. The security concert is one of the core elements of the proposed solution. There is a need for constant evaluation of security risk assessment. Malicious access is detrimental to private data from the buildings, where personal and corporative consumption data can be used to track behavioral patterns. Besides, if actuation is available, non-intentional access can provide full control access and mislead the operation of the building. AUSTRET uses credential-signed access throughout communication sessions. The network link can also be configured to not allow external access, avoiding remote access.
AUSTRET design is divided into three modules: (1) Pre-processing configuration; (2) Parallel test processing; and (3) Post-processing results. This configuration allows a modular approach, aiding the maintenance and scalability of the proposed solution.
2.1. Pre-Processing Configuration
The pre-processing configuration is responsible for defining all the input parameters of the step response test. It is a combination of different variables that will affect directly the performance and evaluation of each proposed test.
The ideal configuration is to automate the configuration parameters as much as possible. However, some of the set variables can affect considerably the final step response result, sometimes even invalidating the stability of the final response, as shown in
Section 5. Therefore, it is the task of the test designer to provide appropriate values for the system that is being tested and to check the correctness of the results.
Common parameters in this module are the time duration of the test, the setpoint of the controlled variable, and the deadband or neutral zone. The description of each input parameter is detailed in
Table 1.
2.2. Parallel Test Processing
One of the main features of AUSTRET is the parallel processing capabilities provided by the test executed engine. The tool allows several tests to run in parallel without affecting the test performance. Each test will have its own specific parameters. The challenge is to design the necessary parameters for different systems with different dynamics. Usually, the longest test will define the total time to accomplish the final compound result. Because AUSTRET uses a web interface, there are two methods to perform the step response tests. In the first approach, the user provides for each system, the input parameters and the target system where the test will be performed. In this case, the final result will have all graphs and reports merged in only one screen. The second option is to open an individual web browser tab for each planned test. The system will execute each test independently without comparing the final results. It is up to the test designer to decide what is the best approach in this case.
2.3. Post-Processing Results
The post-processing module is responsible for reporting the results of the step response test. This module needs to be guided by the test designed for verification. The output is summarized using graphical information. Several information can be extracted from the curves produced by the output. Two types of curves are used. Step changes are used when configuring setpoints. They are represented as horizontal and vertical lines. They are very special in the sense of identifying three different moments of the step response test: the conditions of the system before the test, the response transition of the system right after the execution of the step response test; and the behaviour of the system when the step response test is back to the previous setpoint value.
In the graph, it is also possible to identify the configured deadband area. This area is responsible for defining the stability region of the response test. Over time it is expected to have the controlled variable inside this interval without substantially breaking the defined limits. Usually the tests are completed after the system achieves a previous stability point, otherwise previous disturbances can affect considerably the whole efficacy of the test. The period followed by the change of setpoint is crucial to determine if the test is successful or not. Successful tests are the ones where the controlled variable is inside the deadband after a first disturbance period. Finally, if the test set the controlled variable back to its previous value, it is possible to see the system returning to the previous state.
Collected environment data is represented as a continuous line. Each of those have a different color to help identifying their original source and presented in the graph legend. It is possible to represent up to two different units separated on the left or right side of the graph. This allows the system to show not only the collected environment data, but also the actuation signal that allows the change in the system. For radiator heating tests, the environment variable is air temperature, while the actuation signal represents how much hot water flow passes through radiators. For ventilation tests, the environment variable is air pressure, while the actuation signal represents how much airflow passes through the ventilation duct.
3. Tool Development
3.1. Design
Based on the proposed methodology, AUSTRET is designed and developed. AUSTRET aims to establish communication with BMS to search, manipulate and log values. To achieve the communication, a RESTful BMS Gateway is involved and serves as a bridge between the AUSTRET and BMS. The infrastructure involved in the RESTful BMS Gateway provides the ability to configure RESTful endpoints against the target BMS. So AUSTRET can access resources by HTTP methods and use JSON in data transfers.
Besides, AUSTRET is also powerful in data manipulation. An asynchronous way is developed to log the BMS values involved in the step response test. All the logged data archives on users’ file systems can be used for drawing the overall report for users.
Moreover, AUSTRET is designed to handle parallel step response tests. Multiple tests can run simultaneously by opening multiple browsers with their customized configurations. The number of step response tests that AUSTRET can handle depends on the computing resources of the host machine and the configurations of the web server.
3.2. Development
AUSTRET is developed as a web application with the aim to provide users with an easy-to-use platform to guide users in running customized step response tests. In AUSTRET, an executable step response test includes inputs, outputs, and several parameters. Inputs are BMS values that can be changed, returned, and logged during the step response tests. Outputs are BMS values that can be logged during the step response test.
Table 2 explains all AUSTRET configurable options with their corresponding uses.
AUSTRET provides three functionalities to guide users in terms of step response test customization.
Figure 4 shows the “Authentication” section where users complete the BMS authentication before any performance can be attempted via AUSTRET. The information required for getting the authentication is the username and password of a user who has been created on the BMS. The address where the resources are configured by the RESTful BMS Gateway is also required. A successful authentication obtains a time-limited access token from the BMS, allowing the user to perform operations against BMS. AUSRET provides the user with different feedback messages if the authentication is successful or has failed.
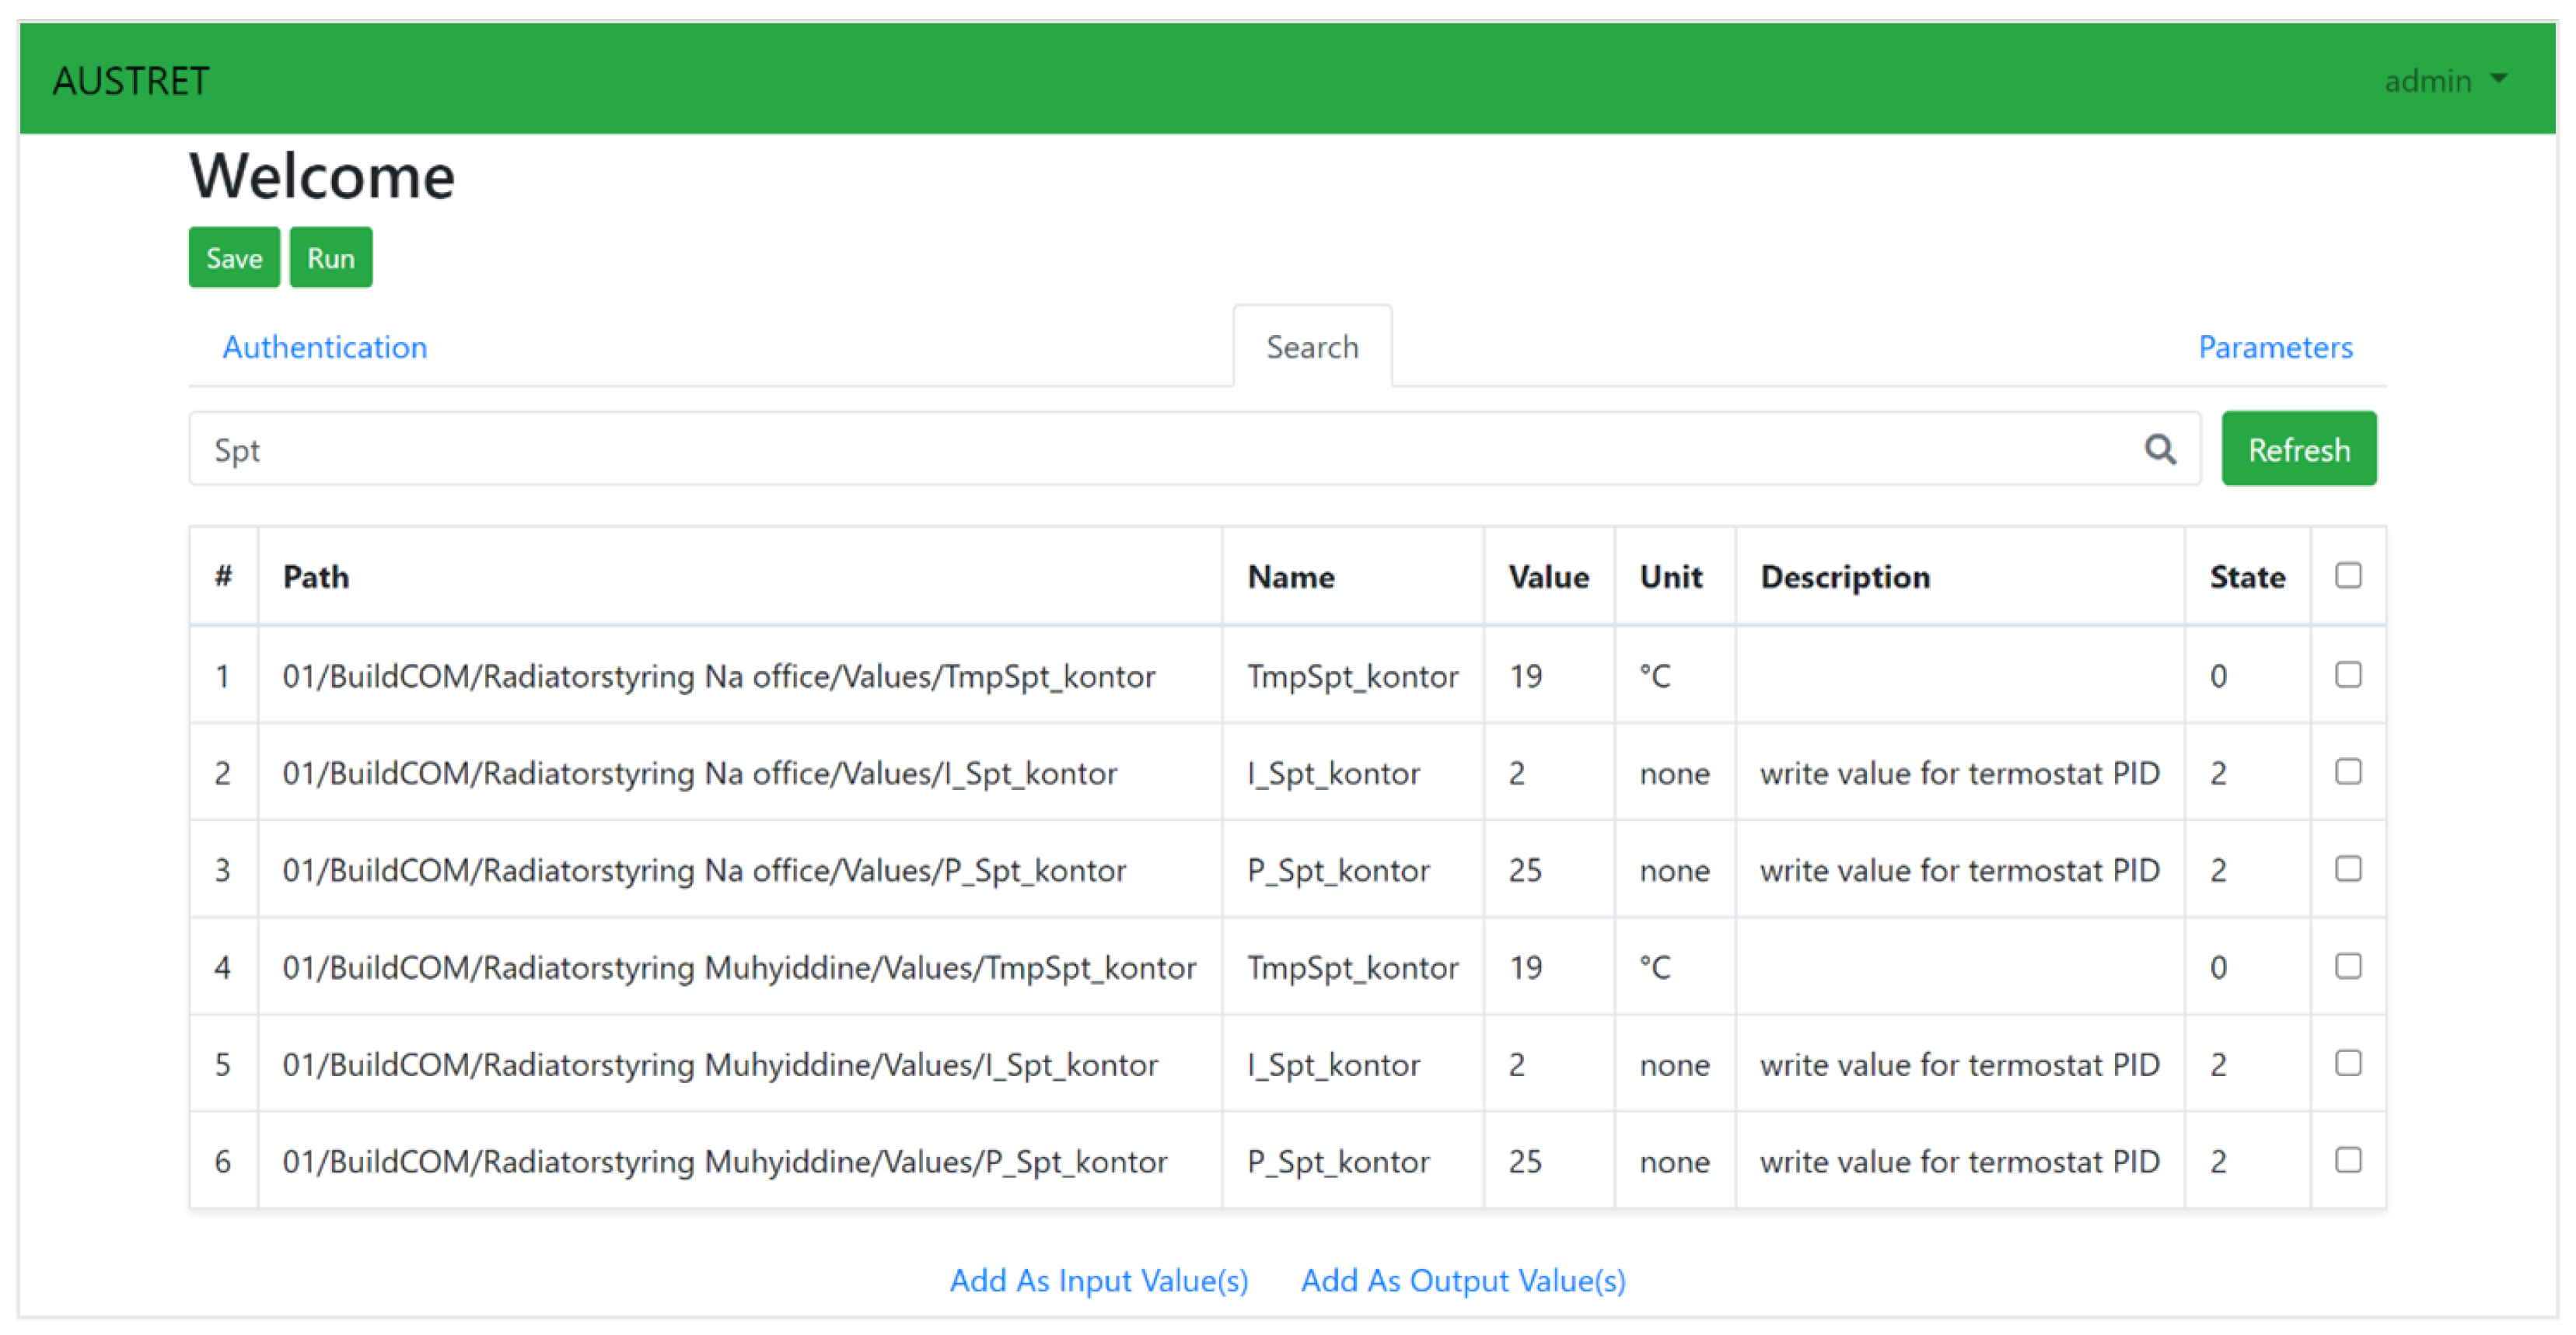
Once an access token is issued successfully from the BMS, users can customize a step response test. AUSTERT provides a keyword-based branch-by-branch search functionality against BMS. Users can search out BMS values by keyword they desire and select inputs and outputs for the step response test.
Figure 5 shows the “Search” interface in AUSTRET, where the searched values are listed and well aligned. The example in the figure, for instance, obtained all values from a BMS whose name contains “Spt”.
The customization is not limited to inputs and outputs as various parameters can be customized with AUSTRET.
Figure 6 shows the “Parameter” definition interface. For different types of step response tests, AUSTERT sets up different parameters’ values based on previous experience, with the probability that the user can customize the parameters’ values based on the application in place. Before running the step response test, the user can overview the inputs and outputs values that have been added to the step response test. Deleting values is also possible in case of any error or typo fault. Additionally, saving and re-using users’ desired parameters is also supported. Most importantly, all the customized parameters can be validated before running the step response test to check for errors such as repeated names, empty inputs, inappropriate execution time, etc.
Furthermore, AUSTRET has the capability of plotting the changes to the Inputs and Outputs during a step response test. That is due to the asynchronous way where the main thread handles the tasks related to Inputs while another thread manages to log the changes of Inputs and Outputs in addition to saving it. For drawing the plots that illustrate the changes of Inputs and Outputs during the step response test, AUSTRET dynamically retrieves the data for the related step response test from file systems, then the retrieved data are deserialized and processed for plotting in a customized plotting dashboard.
4. Lab Tests
In order to evaluate the design and performance of AUSTRET when executing parallel code step response tests, a lab setup was built. The setup controls two office rooms in the same building, the MMMI office building at the University of Southern Denmark. The MMMI building was built in 1995 with an energy class C based on the Danish building standards [
35]. Both offices have similar characteristics and are located on the same north facade. The heating is provided by an indirect district heating loop used to feed the radiators in each room, together with the domestic hot water supply.
Figure 7a,b show two parallel step response tests performed on the space heating radiators in the two considered rooms simultaneously. The configuration input parameters are the same for both tests. The test consists of a change in the temperature setpoint from 19
C to 20
C. The dashed horizontal lines represent the deadband interval, which was selected as 3%.
Each time series curve represents a different input or output signal that is associated with one of the selected rooms. The signal TmpSpt-kontor is the input signal responsible to change the setpoint temperature from 19 C to 20 C. The change occurs a couple of minutes after 12 pm. The test lasts for several hours before the setpoint value is changed back to the original value (19 C).
The signal RoomTmp-kontor represents the measured temperature in the room. This value provides a loopback reference to the temperature controller. This signal indicates the stability of the step response test. If the measured value stays inside the deadband interval, the system achieved the so-called stability, otherwise, the system will hunt the setpoint over time.
The signal ValPos-kontor is associated with the thermostatic valve of the radiator that controls the flow of hot water. The value of 0% represents a fully closed radiator, where no heat can be provided to the indoor environment. A value of 100% represents a fully open valve that provides the maximum amount of heating by the associated radiator to the room.
In both concurrent tests, the indoor temperature reached the deadband interval without oscillating over its limits. Therefore, both tests were considered successful. Both temperatures do not stay constant though. Over time, there is a reduction in the rate of change, showing a potential tunning of the final temperature value. However, several factors need to be taken into consideration. First, the conditions of the environment are not constant and the overall change is dynamic. The external temperature, for example, is changing with time, imposing a direct impact on the room heat transfer and energy dynamics. This occurs especially because the time span of the test is relatively long (twelve hours). Second, the building envelope is categorized as a C level with poor insulation, leading to considerable heat losses over time which are also proportional to the temperature difference between the indoor and outdoor environment.
The radiator valve position is locked at 100% almost all the time in both tests, showing how hard is to keep the temperature inside the deadband zone in these specific rooms and under these conditions. It should also be mentioned that the tests are carried out in January under cold Danish weather conditions. This of course contributes to the challenge faced by the radiator to overcome the major heat losses. On the other hand, when the setpoint temperature is changed back to 19 C, the valve is fully closed after a period, to allow the decay of temperature.
5. Field Tests at Schneider Electric Building
After testing and validating AUSTRET design and implementation as well as the associated capabilities and operation framework in the MMMI living lab testing setup, the tool was implemented for full-scale demonstration in a real case study building. The considered building is the Schneider Electric Greenhouse building situated in Ballerup, Denmark. The building is an office building used majorly by staff and employees on a daily basis with an advanced building management system equipped with up-to-date control and operation functionalities and services.
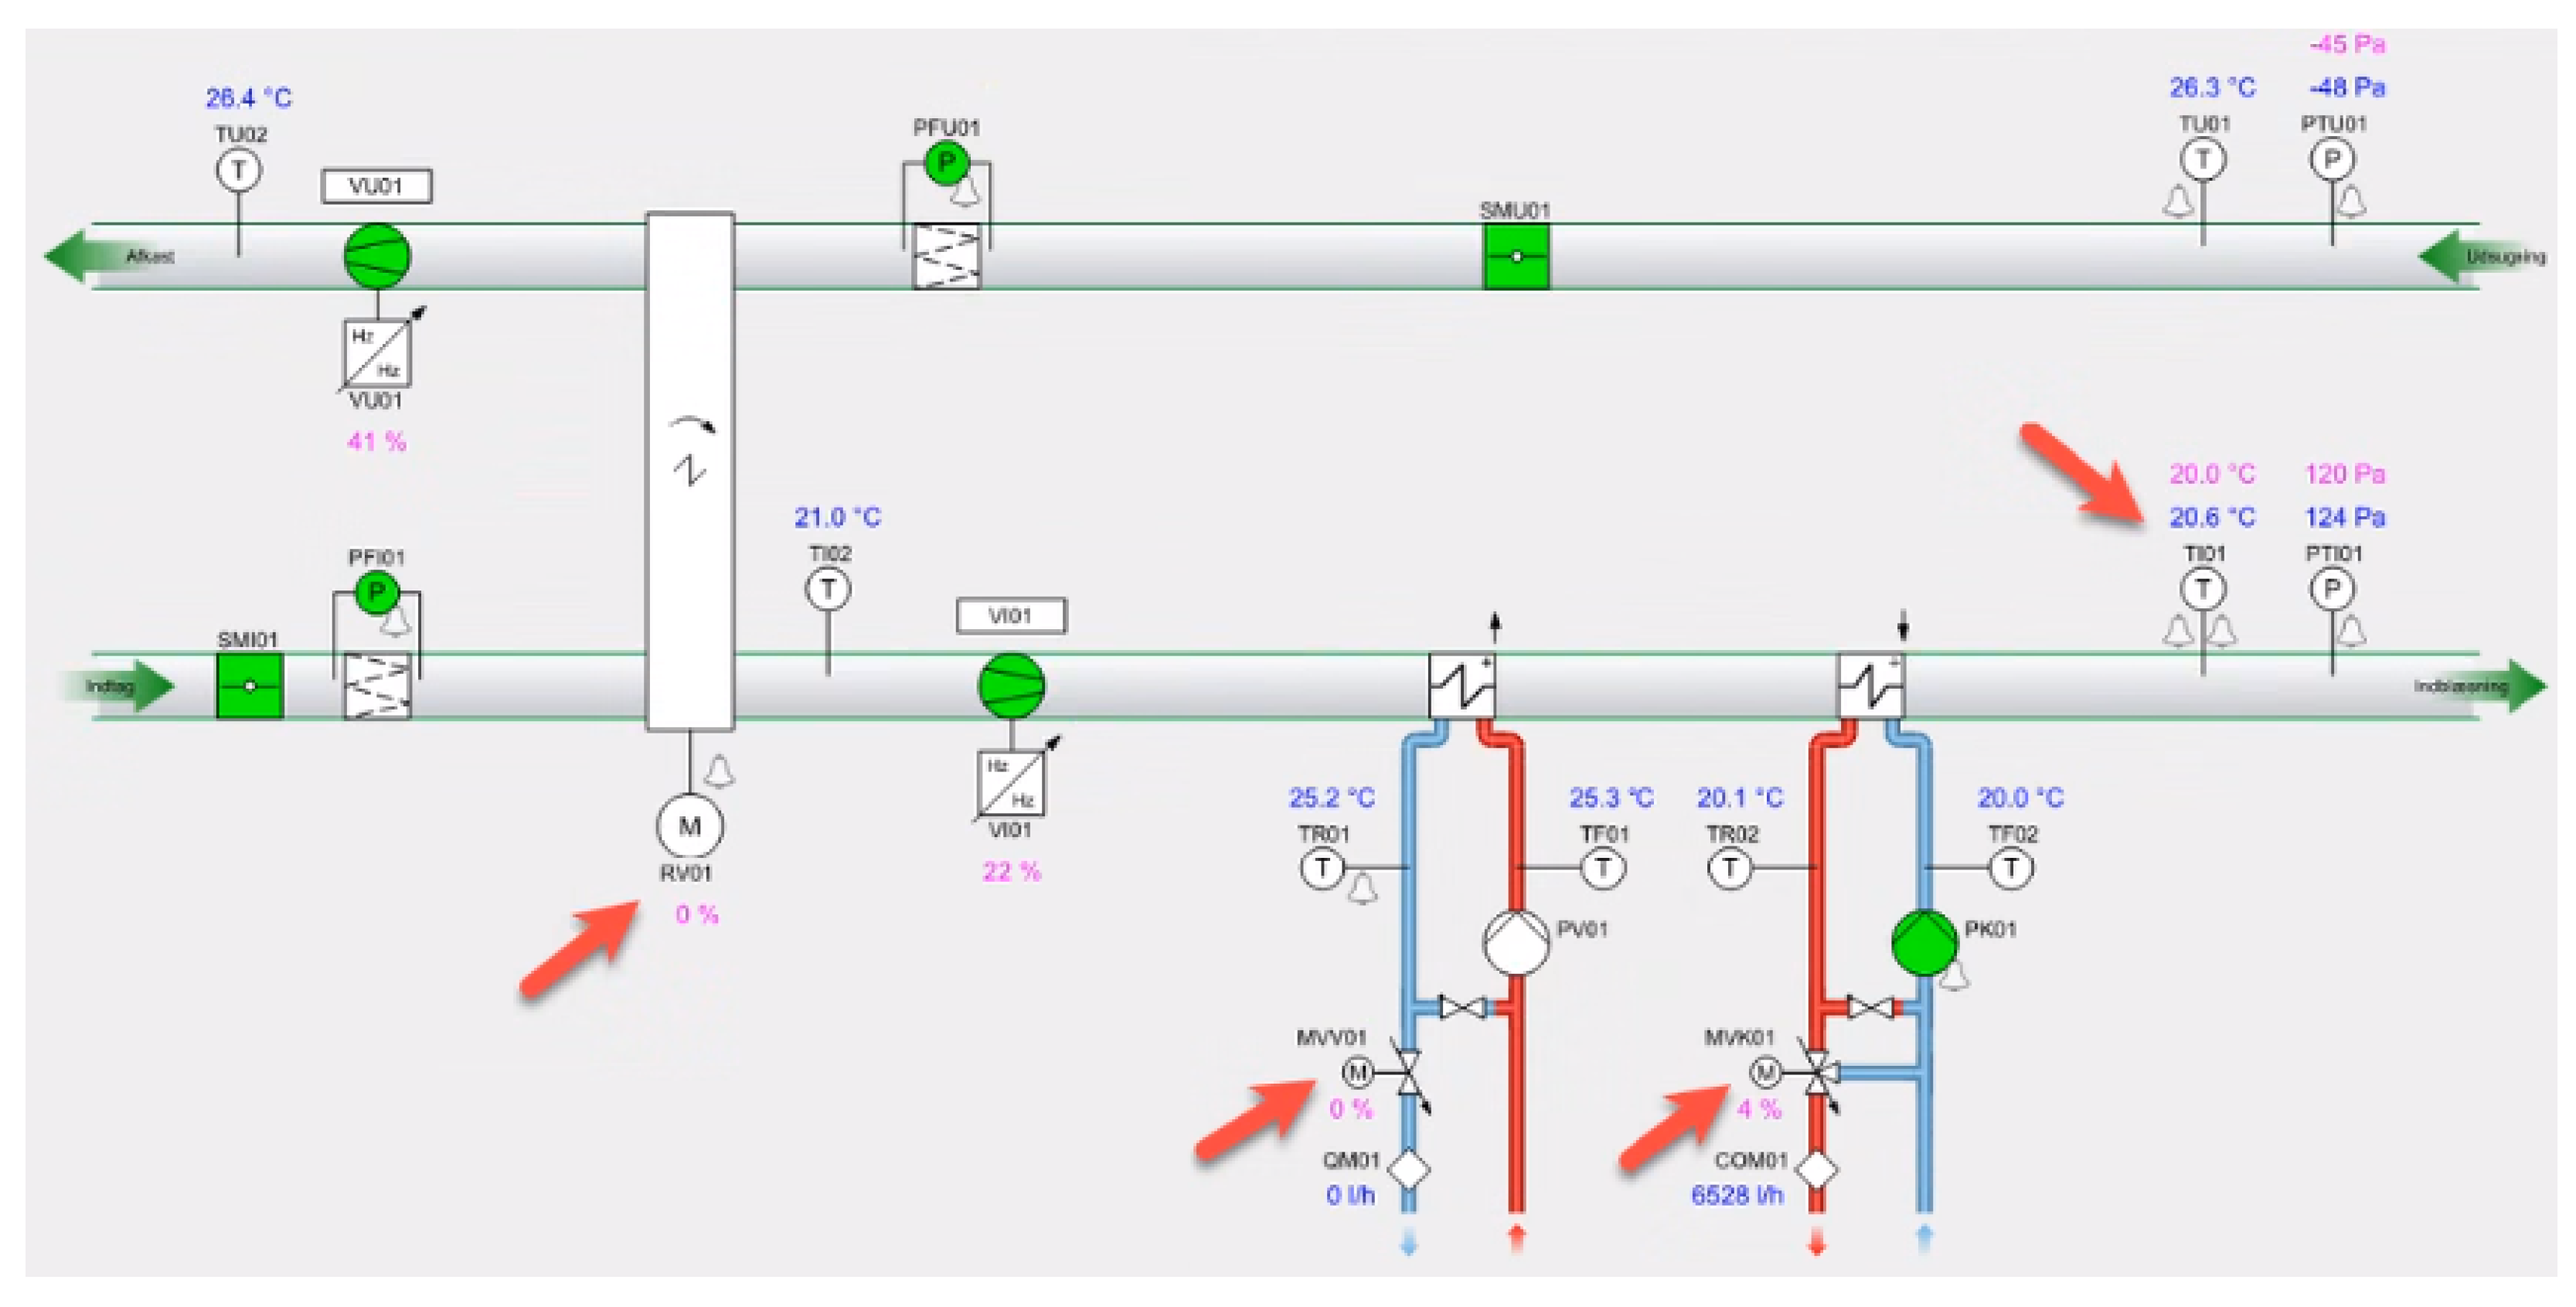
Figure 8 illustrates the ventilation layout and the different valves and air flows of the Schneider Electric Greenhouse building. The measured temperature is represented by the TI01 variable. the signal RV01-S represents the valve openness that allows the flow of internal hot air to be exchanged in the system. In addition, the active heating system is controlled by a valve coupled with the ventilation by accessing the MVV01 variable.
In the sections below, some of the step response tests carried out at the Greenhouse building will be presented and the results will be provided and assessed.
5.1. Increasing Temperature Step Response Test
Figure 9 represents a typical ventilation system heating loop step response test with an increasing temperature set point of the supply air. The graph shows two measurement units: the percentage of openness of the radiator flow and the temperature in degrees Celsius. The units are represented on the left and right vertical axis of the graph, respectively. The signal TI01-KALK-MIN-SV represents the actuation signal. The temperature setpoint was changed from 17
C to 19
C, i.e., an increase of 2
C. This is a logical change that represents the desired behavior of the controller. The deadband is defined as 3% or inside the interval [18.43; 19.57]
C.
The system reacts with a delay that can be seen on the TI01 signal that represents the real temperature measurement from a particular sensor installed in the controlled zone. In
Figure 9, it is possible to see that, although the temperature setpoint (TI01-KALK-MIN-SV) changes almost instantaneously, the real temperature (TI01) in the room will take around 10 minutes to reach the deadband zone for the first time. The transition is smooth enough to not generate substantial overshooting. The system achieves stability after a few minutes with an actual value close to 19
C. The control point is inside the deadband area until the controlled setpoint is changed back to the previous value (17
C), where a new stability dynamic needs to be established.
Figure 9 also shows the signal RV01-S that represents the valve openness that allows the flow of internal hot air to be exchanged in the system. The valve RV01-S is not associated with a radiator. Instead, it is an internal valve that can exchange inlet and outlet air from the internal building environment. To heat the environment the valve is open from a position that represents 44% and achieves values close to 60% during an overshooting behavior until it stabilizes close to the 50% value.
Figure 9 represents a successful increasing step response test for an airflow heating system. The response is very smooth without considerable temperature overshooting. The delay is inside of the expected time frame from environment heating and the duct valve position is enough to provide the necessary airflow. The test finishes with a new setpoint change, returning back to the previous temperature setpoint of 17
C. It is not possible to evaluate the stability after this point. But the same parameters can be used to evaluate the new configuration value.
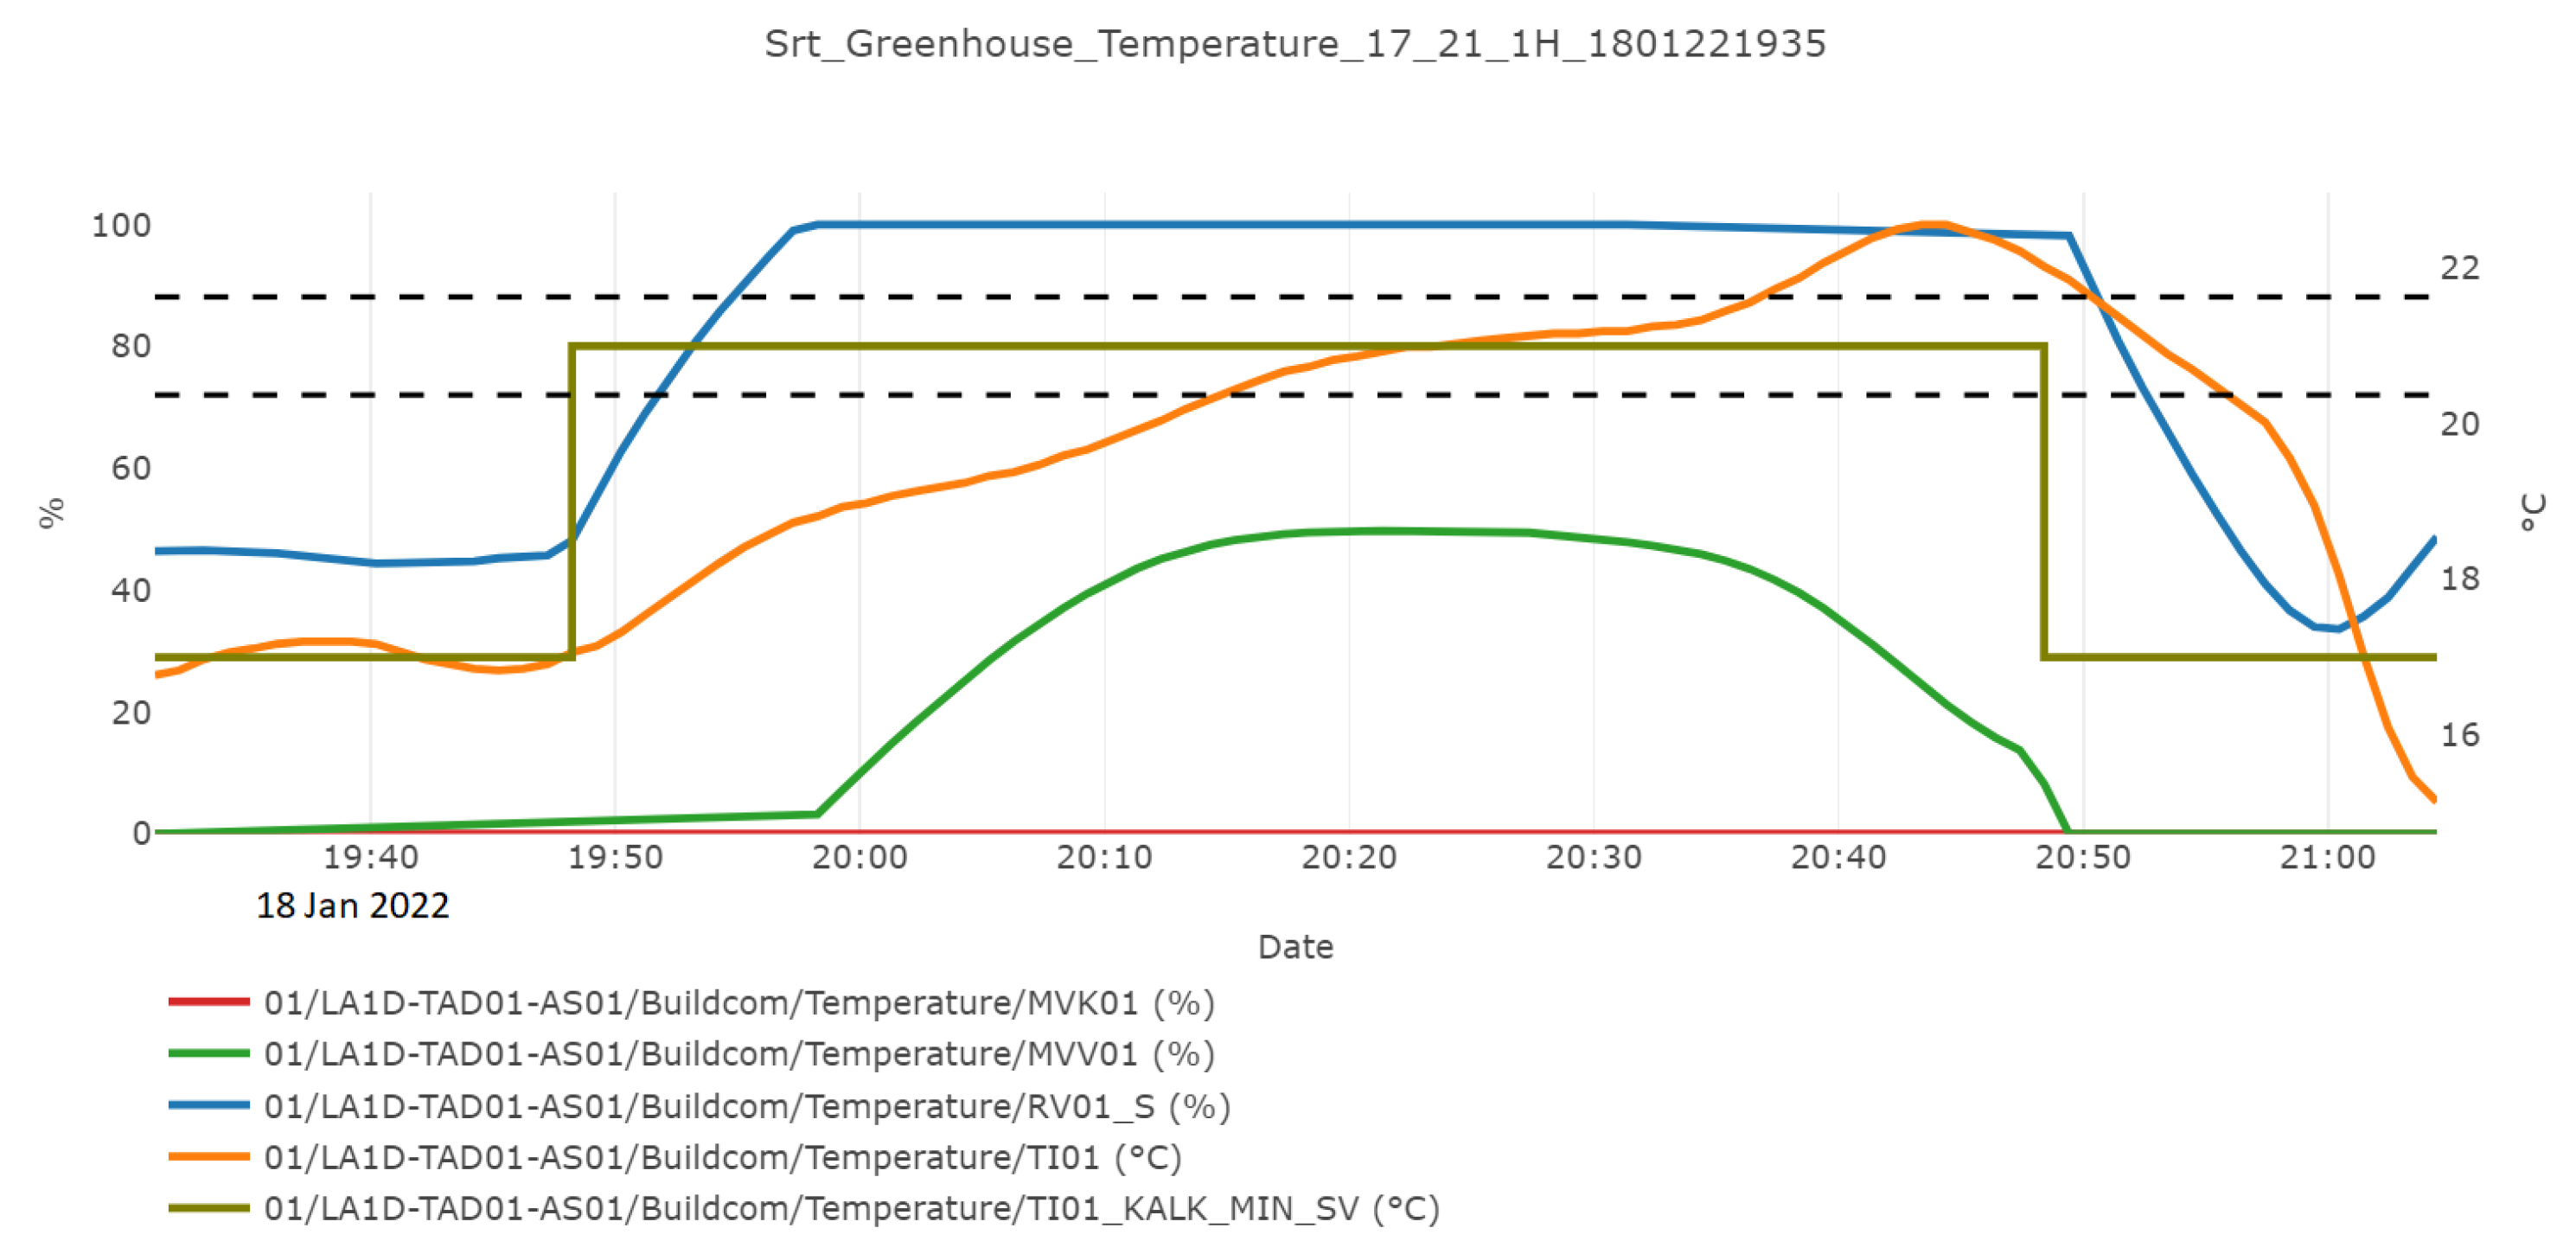
In addition,
Figure 10 represents the results of another step response test implemented for the ventilation system heating loop case in the building with an increasing temperature set point of the supply air. The temperature setpoint was increased in this case from 17
C to 21
C (signal TI01-KALK-MIN-SV). Compared to the increase in the setpoint in the previous test shown in
Figure 9, the air supply temperature setpoint increase in this test is double with 4
C. A new system of operational dynamics is presented in this case. During the analyzed period, the step response test did not achieve stability. This is shown by the environment temperature TI01. Although the deadband zone is reached, the temperature does not stabilize around a new value. Actually, the deadband is broken on the upper limit. Before the system can achieve a new steady-state level, there is a change in the setpoint value back to the previous value of 17
C.
The behavior is explained when we look at the signal RV01-S which represents the valve openness for the airflow. After the first setpoint change, the valve is fully open (100%) during most of the test. Because the offset error between the current temperature value and the new setpoint level is large, the controller tries to force a quick response from the heating system. As a result, the temperature increases breaking the upper limit of the defined deadband zone. Before the controller can adapt to the new configuration, the step response test changes the temperature setpoint back to the previous value.
A new change can be seen on the signal MVV01. This signal represents the active heating system of the building. It is the valve associated with the heating system coupled with the ventilation of the building. Different from the case represented in
Figure 9, the effect of the integrated heat recovery unit is not enough to provide the necessary heat to the zone. Therefore, the active heating system is activated, helping to provide the necessary energy. After the temperature achieves the deadband zone, the increase of heat provision ceases, keeping a constant provision level. When the deadband upper limit is broken, the preheating loop closes the valve (0%) in order to reduce the high temperature, but the inlet heat airflow is still at full capacity.
The stability condition is not achieved in
Figure 10. The control system can’t avoid the upper limit break of the deadband interval. As a result, the temperature is never stable inside the deadband zone. A couple of minutes later, the setpoint is changed back to the previous value. The next consideration should be regarding the input time duration of the step response test. The major question to be asked here is whether the test of
Figure 10 could achieve stability if more time was allocated in the step response test configuration.
The test was then repeated and the new results are represented in
Figure 11. The time duration was configured as two times the previous test (2 h). In this case, the step response test profits from the longer duration by achieving stability after the first hour. The signal TI01 shows that the initial overshoot needs to be balanced by a longer control action to reduce temperature response oscillation. It is also possible to see that the final result is a combination of the impact of the ventilation heat recovery unit (RV01-S: 100%) and the active air preheating loop connected to the system (MVV01: 20%).
The comparison between
Figure 10 and
Figure 11 shows the importance of well-designed step response tests and how the configuration parameters can affect the overall performance and assertiveness of the proposed tests. Shorter test duration can mislead unstable assumptions while very long tests occupy time slots that could instead be used by other tests in the system. It is the test designer that needs to specify the right parameters based on the knowledge and expertise in order to provide a balanced and correct final result. This test also shows that some of the tests could be better analyzed and revised after the first screening.
5.2. Decreasing Temperature Step Response Test
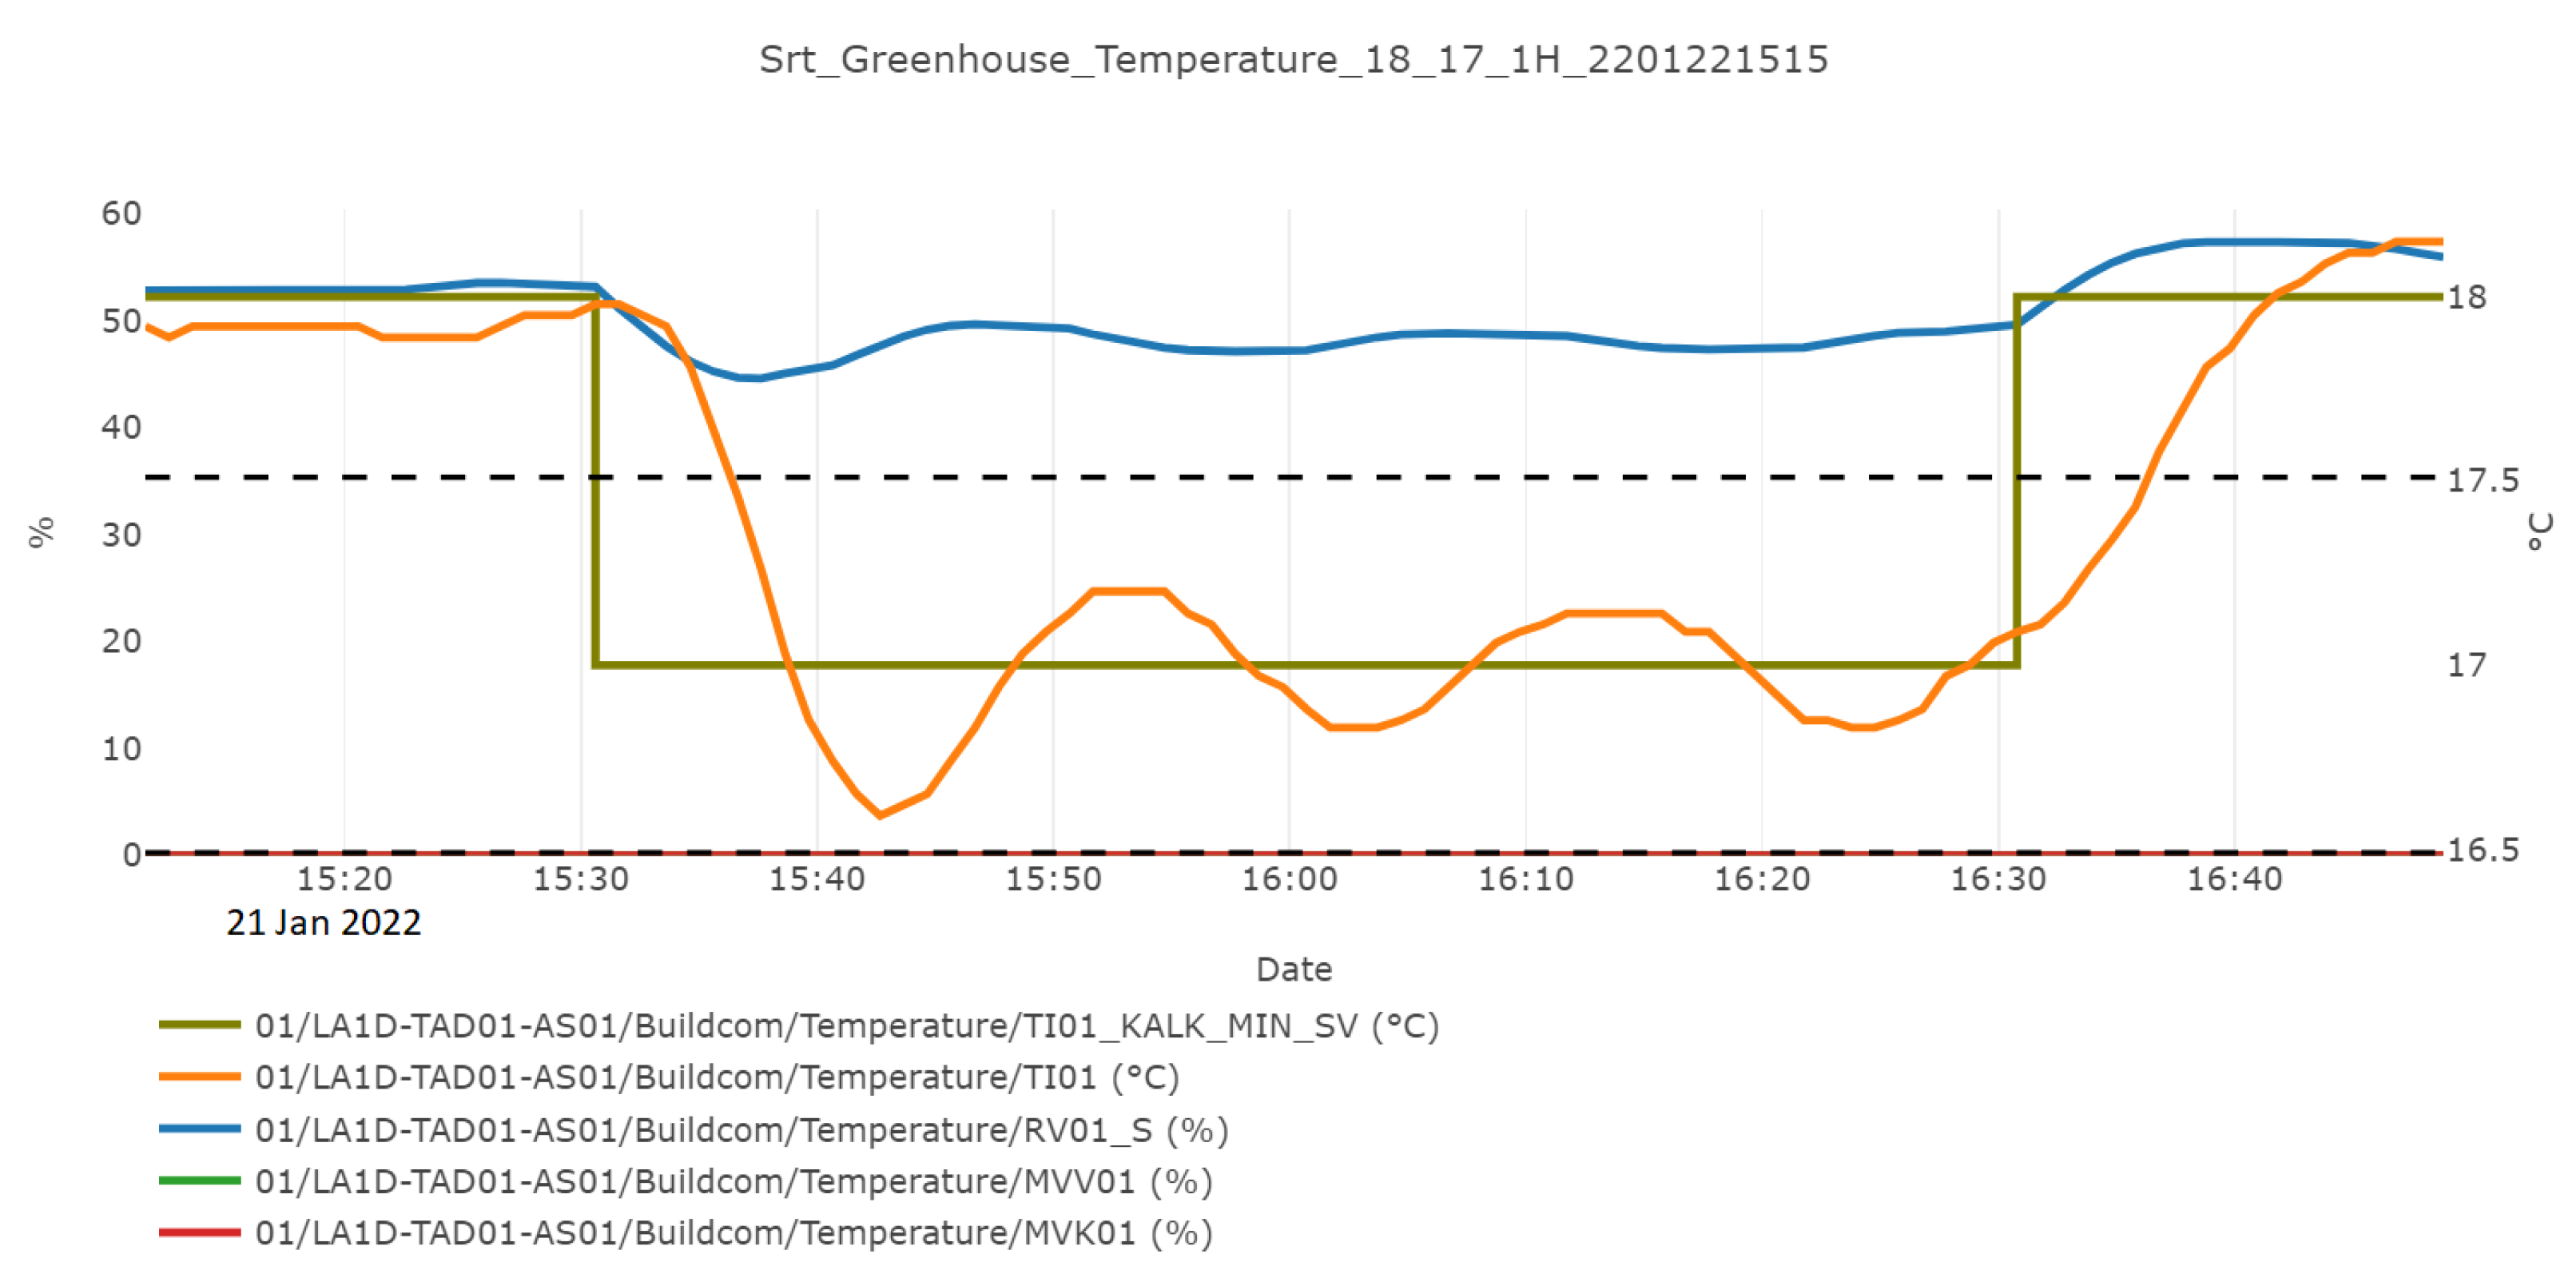
Figure 12 depicts the results of a ventilation system heating loop step response test with the decreasing temperature set point of the supply air. The temperature is changed from 18
C to 17
C. The difference is only 1
C, but an interesting behavior is presented. The controlled temperature is represented by the curve TI01 and the deadband was configured as 3% of the setpoint temperature. The temperature stays inside the deadband interval for most of the test duration. This response is considered stable by AUSTRET. However, this is a special stability response called marginal. When this occurs, there is a need to decide if the test duration should be extended or if the oscillations are considered fine by the test designer. This occurs because most of the time the controlled variable, such as temperature, cannot be differentiated when small oscillations occur. Besides, if the changes are very small, probably they are inside the sensor measurement tolerance. This means that it is not possible to affirm if the changes are real oscillations from the environment or if they are affected by errors or uncertainties associated with the specific sensor.
Figure 13 shows an example of another temperature decreasing step response test applied to the ventilation system under investigation. The temperature is changed from 20
C to 15
C (represented by the signal TI01-KALK-MIN-SV). The controlled temperature variable is represented by the signal TI01. An important assumption about any step response test is to make sure that previous modifications don’t interfere with the current test setup. The temperature value before the first setpoint configuration is not stable. This will affect the whole system’s performance. This occurs because the controlling actuation and the system response have an innate delay that can’t be completely eliminated. Therefore, when the setpoint changes, the delayed response of the control system together with the previous stability synchronization will interfere with the overall system performance.
In
Figure 13, there is a delay of approximately 35 min before the temperature reaches the headband zone. It is also possible to notice that the system did not achieve stability during the one-hour test duration. The signal TI01 cannot stay long enough inside the headband interval to have a satisfactory result. There is a small reduction in the fluctuation magnitude of the temperature, but before any conclusions can be made, the temperature is configured to the previous value (20
C).
It looks like the system needs a longer period of test in order to accommodate a stable behavior. During the whole setup, the signal MVV01 which represents the active pre-heating loop supply is not activated. The reason is that the temperature needs to be reduced and no heating is needed. On top of that, the building turns off the cooling system during wintertime.
Figure 14 shows the results of a similar step response test, where the temperature setpoint of the ventilation air supply was decreased from 20
C to 15
C. However, the test duration is doubled this time (2 h). As shown in the figure, the test was started with stable air temperature conditions to eliminate the issues faced in the previous test. In this case, because the initial condition is favorable for the test, there is a shorter delay response. On top of that, the oscillatory decay is slow, but the oscillation magnitude reduces over time until all minor changes stay bounded by the deadband upper and lower limits. When the temperature setpoint is changed back to the previous value, the system has already achieved stability.
In the same way, the signal MVV01 is zero during the decreasing operation of the test. There is no need for heating if we need to reduce the environmental temperature. At the end of the test, when the temperature is increased back to the previous value, it is possible to note the activation of the heating system.
Figure 13 and
Figure 14 show the importance of the test duration input variable and how it affects the final conclusion of the step response test. It also highlights the importance of disturbance states of the system and how previous tests or changes in the control system can affect new tests. The test designer needs to be attentive to the configurable parameters of the tests and the conditions established in the environment between the transitions of the tests.
Figure 15 shows the results of another ventilation system heating loop step response test with the decreasing temperature set point of the supply air. The temperature setpoint is changed from 20
C to 14
C. The deadband is configured to 3% of the setpoint temperature and the test duration was changed from one hour to two hours. Even with the longer test duration, no stability is achieved. The zone temperature can’t be limited inside the deadband interval. Because no cooling system is provided, only the passive heat recovery unit integrated with the ventilation system is in operation (RV01-S). However, it is obvious that the impact of the heat recovery unit alone is not sufficient for the temperature to be reduced to attain the new desired value of (14
C). This shows the impact of the lower boundary of the step response test. The lower and upper boundary values depend on several factors, such as the kind of the controlled system, the environmental conditions on the exact time of the test, the time duration of the test, etc.
6. Discussion
The presented results in this work demonstrate the added value and the large potential in implementing AUSTRET for step response testing of building automation systems, saving time and resources. This includes automated evaluation; accurate testing processes and less human prone errors; less specialized personnel that can configure several parallelized tests on different subsystems and/or different buildings at the same time; easy to configure interface that allows batch execution and scheduling of automated tests; web interface that can be accessed remotely; and less extra working time outside normal hours or weekend work. On the other hand, a few discussion points are to be presented and communicated in this section.
Implementing generic and automated step response tests poses significant methodological challenges. BACS covers a magnitude of heterogeneous subsystems ranging from HVAC applications to flexible demand loads. In this context, the definition of input parameters that work for any context is impossible to obtain. Despite such a limitation, AUSTRET focuses on HVAC modules applied to medium to large-size buildings. In particular, the tool demonstration as part of testing and assessing the response of heating and ventilation systems was presented in this study. Such systems are the major active modules employed in most of the Danish buildings and controlled by BACS. On the other hand, cooling system testing is also possible with AUSTRET, and would otherwise be similar to the heating system testing, with minor modifications in terms of parameter and input definition.
The results obtained in the lab testing and validation case as well as the full-sale demonstration case are promising. However, a strong emphasis was highlighted on some misleading interpretation that arises when domain-specific configurations are not done correctly. Two input parameters are very sensitive to the environment and the dynamics of the analyzed system: the duration of the test and the deadband that defines the stability zone. Both need to be configured based on previous knowledge of the analyzed system.
Although AUSTRET automates most of the step response tests, providing parallel processing of multiple tests, in practice experts still need to validate the final results by analyzing the stability of the response and how the input configuration interferes with the success of the test. This should not be a problem for field-specialized operators that already know the dynamics and properties of the studied systems. In practice, even when environmental and human disturbances occur, there are boundaries and normal values accepted for most of the building’s components. Saying that, it is evident that AUSTRET allows automating the majority of the process and thus leads to avoiding errors due to manual intervention as well as saving time and resources.
Security is still a big concern when developing digital solutions. The current version of AUSTRET relies the most on the security of the local network and the access of the local firewall. In addition, a simple authentication process was developed based on the commercial BMS used in the case studies. In practice, there is a need for more development to ensure quality security methods. The use of cryptography allows the employment of public and private keys emitted by certificated and trustful institutes. The certification process can be used between the server (BMS system) and client (AUSTRET) to guarantee a trustful handshake link between these two endpoints. The robust authentication process uniquely identifies applications and users that are reading or modifying any endpoint of the BACS.
7. Conclusions
The automation of step response tests can help engineers and BACS operators to achieve better performance when delivering new buildings or retro-commissioning existent ones. Additionally, a friendly interface and the provision of parallel multi-processing capability allow the distribution of several tests concomitantly, increasing drastically the effectiveness, reducing costs and the overall system evaluation time and allocated resources. This is highlighted in the work where an overall step response testing of a real case ventilation system preheating test is carried out in a span of minutes. In terms of resources, the implementation of the tool didn’t need an allocation of staff to manually carry out the job. Instead, in a short time, the staff responsible will provide the required test inputs, and leave the process to be completed. Furthermore, step response tests can be deployed on several subsystems in a building, not exclusively related to HVAC applications. Therefore, it is necessary to develop a general-purpose software, capable of abstracting several compositions and allowing the tunning of generic parameters that are unique for application-specific fields.
AUSTRET is a first-of-its-kind tool proposed to provide an automated solution to the laborious task of step response tests. The tool has a user-friendly interface and allows parallel multi-processing capabilities. In addition, AUSTRET allows parallel execution of tests of different subsystems in a building. For example, it is possible to perform a radiator heating step response test together with humidity control in a ventilation setup. It is also possible to perform similar or aggregate tests on different zones in a building. Because operational data is extracted and actuation signals are sent through a BACS, security measurements need to be taken into consideration, such as authentication, credentials, encryption, certificates, firewall configuration, etc.
In this work, the design, development, and implementation of AUSTRET were presented and analyzed. The tool was demonstrated first in a living lab university building to test the step response testing framework and the tool interface and functionalities. After successful validation, the tool was then demonstrated in a full-scale implementation in a real case study commercial building, with a ventilation system being the basis for investigation. The two case studies confirm the feasibility of AUSTRET. The concomitant tests show how to perform step response tests that are not directly correlated and with different temporal dynamics. The results of parallel tests are also independent. However, it is still necessary that the test results are evaluated by an expert to validate the test conducted and confirm the attained system behavior as well as relate the results to the physical system under investigation. With concrete examples, it was shown that the intrinsic dependency of several environmental and user interaction factors can drastically interfere with the final result. In addition, the input parameters can invalidate a step response test if not configured properly.
AUSTRET presents the first initiative towards establishing an automated and generic application for step response testing of BACS. In future work, the aim is to upgrade AUSTRET to increase the level of automation in carrying out the step response testing, guiding the final user to better results and consolidating the evaluation by providing a recommendation score for the test. In such a scenario, the integration of intelligent algorithms would allow providing a more independent software solution that could operate most of the time without manual intervention and with very minimal supervision. In addition, one of the lines of development would be to establish smooth integration of AUSTRET with a wide variety of building automation systems with various functionalities and services. This will ensure a holistic tool design that is capable to be implemented in different buildings with various control and automation units with minimal modifications.


