Article

Study on Shrinkage Cracking Morphology of Cement Mortar with Different Nanoclay Particles under Restraint

1
School of Civil and Architectural Engineering, Chuzhou University, Chuzhou 239000, China
2
School of Civil Engineering and Architecture, Shandong University of Technology, Zibo 255000, China
3
Institute of Road and Bridge Engineering, Dalian Maritime University, Dalian 116026, China
4
Department of Civil and Environmental Engineering, Northwestern University, Evanston, IL 60208, USA
5
Department of Civil Engineering, University of Texas at Arlington, Arlington, TX 76010, USA
*
Authors to whom correspondence should be addressed.
Buildings 2022, 12(9), 1459; https://doi.org/10.3390/buildings12091459
Submission received: 26 July 2022 / Revised: 26 August 2022 / Accepted: 7 September 2022 / Published: 15 September 2022

Abstract

:
In this paper, different types and particle sizes of nanoclay (nano-metakaolin—NMK—and nano-attapulgite—NMA—clay) were selected to study the effect of nanoclay on the properties of cement-based cementitious materials. The stability of different nanoclay dispersions was analyzed. The effects of nanoclay on the mechanical properties and cracking behavior of cement mortar were discussed. The crack propagation behavior of nanoclay cement mortar was analyzed by flat knife-edge induced constraint and ring constraint experiments. The research shows that the degree of aggregation of NMA particles is lower than that of NMK. The larger the particle size of NMA, the lower the degree of particle aggregation. The larger the particle size of NMK, the lower the degree of particle aggregation in water. NMK has the best improvement effect on cement mortar. The smaller the particle size, the more pronounced the improvement effect. The flexural strength ratio, compressive strength ratio, and elastic modulus ratio of 7 d and 28 d are 76.7%, 67.4%, and 61.2%, respectively. In the flat plate cracking experiment, the maximum crack width of NMK-3 and NMA-2 was reduced by 33.3% and 25.0%, respectively, compared with ordinary cement mortar. The maximum crack length was reduced by 55.1% and 33.1% compared with cement mortar. In the ring constraint experiment, the total cracked area of NMK-1, NMA-1, NMK-3, and NMA-2 rings increased by 64.3%, 45.0%, 92.7%, and 49.7%, respectively, compared with ordinary cement mortar rings after 60 days. NMK can advance the cracking time of cement mortar, but it can inhibit the generation and development of cracks and refine the crack width.

1. Introduction

As one of the most popular building materials in the world, cement concrete has been widely used in building construction, water conservancy, bridges, roads, and other infrastructure constructions [1,2]. However, during the service life of reinforced concrete structures, corrosion of steel bars will be caused by the erosion of chloride salts, leading to rust expansion and cracking of the concrete. Due to temperature changes, the pore water will freeze-thaw in the cold environment, and the comprehensive effect of other environmental factors will lead to concrete cracking [3,4,5]. To improve the performance of reinforced concrete structures, it is necessary to start from the material level to explore high-performance concrete materials suitable for harsh environments. At present, adding mineral admixtures is one of the critical technical methods used to improve the durability of cementitious materials. Nano-SiO2 [6,7], nano-CaCO3 [8], nanoclay [9], and carbon nanotubes [10] are the significant nano-scale admixtures used in cement-based materials. This study found that different nanoparticles used to modify cement-based materials have good toughness, enhanced compactness, improved crack resistance, and impermeability. However, these nanomaterials are challenging to prepare, expensive, and difficult to promote and apply in practical engineering.
In China, clay minerals are abundant resources and are easily obtainable at a low cost. NMK, NMA, nano-montmorillonite, and other nanomaterials make up the majority of these clay minerals [11]. These have been found to improve the mechanical properties [12,13] and shrinkage cracking behavior [14,15] of modified cement-based materials. However, due to the small particle size and considerable surface activity of nano clay, it is easy to agglomerate, which reduces the improvement effect of nanoclay on the performance of cement-based materials [16]. Many scholars have carried out a large number of experimental studies on the dispersion of nanoclay. Dry mixing [17], surfactant formation [18], and ultrasonic dispersion [19] are adopted to improve the distribution of nanoclay in cement and promote the application of nano clay in cement concrete. As a nanomaterial, the effectiveness of NC is highly dependent on the dosage and method of dispersion. Typical contents used in the literature range from 0.01–3 wt% [17]. Quanji et al. studied the effects of NC dosage. They showed that a higher content of NC results in higher static yield stress and a degree of thixotropy up to 3.0 wt% [20], but that increasing the dosage of NC beyond 1.3 wt% resulted in a decreased rate of thixotropy. Dejaeghere et al. [21] illustrated that most mixes containing 2.5% attapulgite NC displayed a lower heat of hydration at 1 and 3 days than those containing 0.5%, indicating a reduced degree of cement hydration in the former. Depending upon the size and amount, NC agglomerates could serve as weak points in the cement matrix, thus increasing porosity and reducing strength.
The strength improvements can partially be attributed to accelerated cement hydration by the nanoparticles. Moreover, the nanoparticles are well dispersed in the cementitious system. C-S-H nucleation and production can occur in the voids between cement grains, making the cementitious matrix more homogeneous and dense. Hakam et al. found that the physical, mechanical, and thermal properties of cement nanocomposites reinforced with calcined nanoclay (CNC) were enhanced due to the addition of CNC into the cement matrix, and the optimum content of CNC was 1 wt% [22]. Ishida et al. determined that cement mortar mixtures with various replacement ratios—0.5%, 1%, and 2% of nanoclay by weight of cement—could improve the mechanical strengths of cement mortar; cement mortar reinforced with 2 wt% nanoclay, showed an 11%, 5%, and 9% improvement in the compressive strength, flexural strength, and tensile strength, respectively [23]. Adding nanoclay into cement mortar also increases the amount of water needed to reach the normal consistency, elongates its setting time, and increases its water absorption, but reduces its capillary water absorption coefficient and lowers the flowability of the pastes. If NC particles are agglomerated in cement-based materials, it leads to an increase in shrinkage and the generation of more coarse voids. Nevertheless, if NC particles are well dispersed, the degree of shrinkage will depend upon the surface water absorption of the NC particles and the availability of free water in the cement-based material. The generation of coarse voids will be minimal. Wang et al. reported that nanomaterials increased the rate of chemical shrinkage associated with C3S and C2S reactions. However, different types of nanomaterials had other effects on the rate of chemical shrinkage [24]. Lomboy et al. studied the shrinkage and fracture behavior of self-consolidating mixes similar to those of Gao et al., but with only a 0.5% attapulgite NC addition [25,26]. In contrast, they found that attapulgite NC slightly reduced free drying shrinkage at this lower addition level and consequently postponed the cracking time of the concrete under restrained, unsealed conditions. Similarly, Lee et al. studied the plastic shrinkage behavior of concrete containing 0.25% organomodified montmorillonite NC and found that it exhibited significantly reduced plastic shrinkage compared to the control [14]. The existing literature indicates that lower additions of NC (<0.5%) can have minimal effects on concrete shrinkage and cracking potential. However, they can have adverse effects at higher addition levels (>2%), likely due to dispersion issues. Therefore, more investigation is needed to evaluate shrinkage and shrinkage cracking before higher contents of NC are used in field concrete [15]. NC has been found to be effective in facilitating casting in a number of different applications; these case studies utilize formwork casting and slip form paving, as well as facilitate new ones, e.g., extrusion and 3Dconcrete printing. Although NCs have been used and studied in concretes incorporating different admixtures, e.g., SCC and SFCC, detailed studies on NC–admixture interaction are still scarce, and further investigation could lead to improved compatibility [15].
In this study, the initial shrinkage behavior and strength performance of cement composites were evaluated through the application of nanomaterials. Two kinds of nanoclay raw materials (NMK and NMA) were used to quantitatively describe the gray value change of nanoclay suspensions (NMK and NMA) through ultrasonic dispersion at different time points. The flexural strength, compressive strength, and elastic modulus was evaluated by measuring the strength after various curing days. The influence of nanoclay on the shrinkage cracking characteristics of cement mortar under constraint conditions is clarified, and the influence law of NCM shrinkage cracking is revealed. The development of NCM shrinkage cracking under constraint conditions was analyzed using the ring constraint and flat-blade constraint test methods.

2. Materials and Methods

2.1. Raw Materials

Materials

For dispersion testing, we used tap water and two types of nanoclay: NMA(NMA-1, NMA-2) and NMK(NMK-1, NMK-2, NMK-3, NMK-4, NMK-5). Similar materials have the same chemical composition, but different particle sizes; for the chemical compositions of NMA and NMK, see Table 1. The physical properties of each sample are shown in Table 2. The XRD patterns of NMA and NMK are shown in Figure 1. There are mullite crystals(3Al2O3·2SiO2) inside the NMA, and its diffraction peak intensity is significantly higher than the dispersion peak; the crystal form is stable, and the pozzolanic activity is slightly lower. Mullite crystals(3Al2O3·2SiO2)are located inside the NMK and its diffraction peaks. The intensity is lower than the dispersion peak, the crystal form is unstable, and it shows potential pozzolanic activity.

2.2. Preparation of Specimens

Nanoclay was dispersed in water using the ultrasonic method. The content of nanoclay was 3% of the mass of dispersed water, and the dispersion times were 5 min, 10 min, and 15 min. The test vessel was a 17 mm × 17 mm × 150 mm square tube made of quartz glass with 63 samples.
Previous studies have shown that the cracking performance of cement-based materials is improved when the nanomaterial content is 3% [26,27,28]. Therefore, the nanoclay content of cracking performance specimens is 3%. We chose four nanoclays: NMA-1, NMA-2, NMK-1, and NMK-3. Using the method of manual stirring, we first mixed the dry materials evenly, and then added them to the nanoclay suspension by ultrasonic dispersion for 15 min, mixing evenly. The plated blade constraint specimen size was 800 mm × 600 mm × 100 mm, with a total of five groups, three specimens in each group. The specimen numbers wereA0, A1, A2, A3, and A4; the inner diameter of the steel ring constraint test was 254 mm, the outer diameter was 305 mm, and the specimen height was 140 mm. There were five groups, with three specimens in each group, and the specimen numbers were C0, C1, C2, C3, and C4. At the same time, five groups of NCM specimens of 40 mm × 40 mm × 160 mm size, with three specimens in each group, were created. The NCM mix ratio is shown in Table 3.

2.3. Test Methods and Processes

2.3.1. Dispersion Evaluation

First, the pre-test carry-out and the ultrasonically dispersed nanoclay suspension were poured into a square quartz glass test tube. Then, the suspension was photographed every 1 h, with a total photographing time of48 h. Then, the settlement results of the suspension were observed and analyzed, and the reasonable photographing time that fully reflected the settlement of the suspension was obtained. The settlement results at 0 h, 1 h, 5 h, 15 h, 24 h, and 48 h were determined as the analysis objects to characterize the settlement state of the suspension. Finally, Matlab software was used to analyze the gray level of the suspension images at six static moments.

2.3.2. Plate Constraint Experiment

According to the Standard for Long-Term Performance and Durability of Ordinary Concrete (GB/T50082-2009), the cracking performance of NCM was tested based on the flat-blade constraint method, and the HC-CK102 crack width measuring instrument (measurement accuracy was 0.01 mm) was used. The crack width and length of the specimens were measured after3 days, 5 days, 7 days, 14 days, and 28 days of curing. This method can improve the cracking sensitivity and effectiveness of cement-based materials. Quantitatively comparing the cracking performance of cement-based materials improves the accuracy and repeatability of the results. According to the Guide to Durability Design and Construction of Concrete Structures (CCES 01-2004), the evaluation index of the surface cracking performance of NCM specimens is calculated using the following variables: the average cracking area of each crack a, the number of cracks per unit area b, the crack area c on the unit area, and the crack reduction coefficient n.
The average crack area a of each crack is calculated according to Formula (1):
a = 1 2 N i = 1 N ( W i × L i )
The number of cracks per unit area b is calculated according to Formula (2):
b = N A
The cracking area per unit area c is calculated according to Formula (3):
c = a × b
In Formulas (1)–(3), Wi is the maximum width of the crack, (mm); Li is the length of the crack, (mm); N is the number of longitudinal cracks; A is the plate area (m2).

2.3.3. Ring Constraint Experiment

Testing the early cracking performance of NCM was conducted according to the test method for early cracking and stress characteristics of cement mortar under ring constraint (ASTMC-1581-04)and the test procedures for cement and cement concrete for highway engineering (JTG E30-2005). The crack width was measured by the HC-CK102 crack width measuring instrument (the measurement accuracy was 0.01 mm). The time when the specimen first cracked, showing visible cracks, was taken as the test start time (0 days). The crack width and length were recorded at 0 days, 5 days, 10 days, 20 days, 30 days, 40 days, and 60 days. The maximum width and average width of each crack (the average value of the sum of widths at the 1/4 height, 1/2 height, and 3/4 height of the ringside) were recorded. The cracking time, 60 d crack width, average cracking area of each crack, and total cracking area per unit area were used as the evaluation indexes of mortar ring cracking performance. Figure 2 and Figure 3 show the schematic diagram of the ring constraint experimental device.

3. Results and Discussion

3.1. Evaluation and Analysis of Nanoclay Dispersion in Water

It is assumed that the nanoclay mixture sample in a square tube after ultrasonic dispersion is an entirely uniformly dispersed suspension at 0 h. When the settlement begins, the aggregation of clay particles begins to sink, and the water starts to flow upward. The sedimentation process of nanoclay suspension is divided into four different stages: the sedimentation zone, the homogeneous zone, the concentration variable zone, and the sedimentation zone. It is assumed that the solid volume fraction in the supernatant area is zero (a small number of clay particles in the supernatant appear turbid). In the second stage, due to the different sedimentation rates of different particles, the homogeneous zone disappears, and the suspension is divided into a supernatant zone, a variable concentration zone, and a sedimentation zone. In the third stage, the particles are ultimately precipitated, and the suspension is divided into the supernatant zone and precipitation zone. In the fourth stage, the precipitation reaches equilibrium and stability, the precipitation zone continues to compress, and the supernatant continues to increase until the accumulation and compression of the precipitate reaches maximum levels. In this paper, seven kinds of nanoclay materials experienced these four stages of the settlement process. The area division of the NMK-2 suspension settlement map is shown in Figure 4.
The sedimentation diagrams of the NMA-2 and NMK-1 suspensions are shown in Table 4. Table 4 shows the first and second stages of suspension settlement completed by NMA and NMK; the third and fourth stages will be completed after 48 h. When the NMA suspension was ultrasonically dispersed for 5 min, there was a prominent supernatant area, and after standing for 5 h, and the uniform area disappeared. The boundaries between the supernatant area and the concentration-variable area were clearly identifiable, and the boundaries between the concentration-variable area and the precipitation area were fuzzy and difficult to distinguish. With the increase in sedimentation time, the supernatant area increased, the concentration-variable area decreased, and the precipitation area increased, but this was difficult to observe with the naked eye. When the NMK suspension was ultrasonically dispersed for 5 min, a prominent supernatant area appeared after standing for 1 h, and the uniform area disappeared. The boundaries of each area were identifiable. With the increase in settling time, the supernatant area increased, the concentration-variable area decreased, and the precipitation area increased, and these changes could be observed visually.
When ultrasonic dispersion was conducted for 10 and 15 min, the supernatant area of the NMA suspension appeared at 5 h, but it was turbid, the uniform area disappeared, and the boundaries of each region were blurred and difficult to determine. With the increase in settlement time, the boundaries of each region were still blurred and difficult to distinguish. When the NMK suspension was ultrasonically dispersed for 10 and 15 min, the supernatant area appeared at 1 h, but was turbid, and the boundaries of each area were fuzzy and difficult to distinguish. When the NMK suspension sat for 5 h, the uniform area disappeared, the edges of the supernatant area and the concentration variable area were fuzzy and difficult to distinguish, and the boundaries of the concentration-variable area and the precipitation area were identifiable. With the increase in settlement time, the boundaries of each area were identifiable.
The TEM morphology of the nanoclay (NMA-2, NMK-5) suspensions dispersed by ultrasound is shown in Figure 5. The dispersion effect of nanoclay suspensions dispersed by ultrasound for 15 min is better than that of nanoclay suspensions dispersed by ultrasound for 5 min and 10 min. Although the clay particles of nanoclay suspensions are dispersed, there are still some particles in the form of agglomerated particles, which are in the dynamic state of dispersion and agglomeration. This is mainly due to the high surface effect of nanoparticles, so the settlement rate varies with the particle size of the clay particles and does not settle at a stable rate. According to the Stokes formula:
V = [ 2 ( ρ ρ 0 ) r 2 / 9 η ] g
In the formula, V is the particle sedimentation rate, m/s; ρ, ρ0 are the particle density and medium density, respectively, g/cm3; r is the particle radius, m; η is the medium viscosity, Ns/m2; g is the acceleration of gravity, m/s2. The sedimentation rate is proportional to the square of the particle radius. The larger the particle diameter, the greater the sedimentation rate.
The nanoclay (NMA-2, NMK-3) suspension gray histogram is shown in Table 5. When the initial dispersion is completed (0 h), the range of gray values in the gray histogram of NMA and NMK suspensions is small, showing a single peak and peak concentration, indicating that the nanoclay suspension after ultrasonic dispersion is more uniform. With the increase in settlement time, the NMA and NMK suspensions gradually settle. The range of gray values in the gray histogram increases, the probability of gray value decreases, and the gray value increases slightly, indicating that the gray histogram of nanoclay suspension can reflect the settlement process of the suspensions. The supernatant area increases with settlement time, which characterizes the settlement law of nanoclay suspensions. Therefore, the sedimentation rate of nanoclay suspensions is determined by the particle size of the clay particles after the dispersion of the nanoclay suspension, rather than the initial particle size of the nanoclay particles.
The analysis of the NMA and NMK suspension gray histogram found that the NMA and NMK suspension gray histogram function obeys normal distribution. The suspension gray histogram function is:
y = A + B e ( x k ) 2 2 f 2
In the formula, A and B are coefficients; k is expectation; f is variance.
The relationship between the expected k, variance f, gray value change rate, and settlement time of the nanoclay suspension gray histogram is shown in Figure 6. Figure 6a,b shows that the smaller the standard deviation of the gray histogram k of the nanoclay suspension, the slower the changing trend of f. It indicates that the nanoclay suspension has a low degree of aggregation, and the suspension is more uniform and stable—the slower the coagulation settlement, the better the dispersion. The standard deviation of the gray histogram k of the NMA suspension is smaller than that of the NMK, and the changing trend of f is slow. Therefore, the dispersion of the NMA suspension is better than that of the NMK, and the agglomeration degree is low. From Figure 6c, it can be seen that the change rate of NMA and NMK suspension gray histogram gray value decreases in relationship with the settlement time, which characterizes the settlement rate of nanoclay suspension at each settlement time. After 15 h, the change rate of the NMA gray value decreased to zero, and the primary settlement was complete, while the change rate of the NMK gray value was still significant, and the settlement continued. With the increase in settlement time, the slope of the change rate of gray value decreased gradually, indicating that the settlement rate of the NMA suspension was lower than that of NMK, and the particle size of the agglomerated particles after dispersion was smaller than that of NMK. The change rate of gray value can be used to predict the settlement rate of nanoclay suspensions at each settlement time and then to judge the particle size of the clay after dispersion.
When the nanoclays are ultrasonically dispersed for 15 min, the expected k value is smaller and more stable than when ultrasonically dispersed for 5 and 10 min. This indicates that after 15 min of ultrasonic dispersion, the nanoclay particles are more uniform (Shown in Figure 6a). After ultrasonic dispersion for 15 min, the changing trend in the relationship between the variance f of the grayscale histogram and the sedimentation time is slower than that after ultrasonic dispersion for 5 and 10 min. This indicates that the nanoclay suspension has good dispersibility after ultrasonic dispersion for 15 min. (Shown in Figure 6b). The change rates and curve slopes of the gray value of the nanoclay suspension after ultrasonic dispersion for 15 min are smaller than those for ultrasonic dispersion after 5 and 10 min. The slopes are the same. The change rate of the total gray value of the NMK suspension after ultrasonic dispersion for 10 and 15 min is 7.9% and 6.0% (NMK-3), and 80.7% and 64.2% (NMK-5) for ultrasonic dispersion for 5 min, respectively. The sedimentation rate of the nanoclay suspension was lower than that after ultrasonic dispersion for 5 and 10 min. The degree of aggregation of the NMA and NMK clay particles was small, which inhibited the premature and rapid sedimentation of the nanoclay suspension. The dispersibility was better (Shown in Figure 6c).
The standard deviation of k is expected to be smaller in the grayscale histogram of the NMA suspension than that of the NMK, and the standard deviation of k is expected to be smaller in the grayscale histogram of NMA (larger particle size) than that of the NMA (smaller particle size) and NMK (smaller particle size). The standard deviation of k is expected to be smaller than that of NMK (smaller particle size) in the grayscale histogram of the suspension, indicating that the larger the particle size of the clay particles in the NMA suspension, the more thorough the dispersion and exfoliation (shown in Figure 6a). The change trend of the variance f of the liquid gray histogram is slower than that of NMK, and the changing trend of the variance f of the suspension gray histogram of NMA (larger particle size) is slower than that of NMA (smaller particle size) and the NMK (larger particle size) suspension. The changing trend of the variance f of the liquid gray histogram is slower than that of NMK (smaller particle size), indicating that the larger particle size of the clay particles in the NMA suspension liquid is not easily agglomerated and settled; thus, the suspension is better (shown in Figure 6b). The change rate of the gray value of the NMA suspension is smaller than that of NMK, and the change rates of the total gray value of the NMA suspension are94.5%, 80.9%, and 35.6% lower than those of NMK-1, NMK-3, and NMK-5, respectively, for NMA-1, and 93.5%, 77.4%, 23.6% for NMA-2. From 0–5 h, the change rate of the gray value of NMA (smaller particle size) is larger than that in NMA (larger particle size), and the smaller the particle size of NMK, the greater the change rate of the value; the smaller the particle size in NMA, the greater the sedimentation rate, and the larger the particle size in NMK, the lower the sedimentation rate (Shown in Figure 6c). This shows that the degree of agglomeration of NMA particles is lower than that of NMK, and the larger the particle size of NMA, the smaller the particle agglomeration. The larger the NMK particle size, the lower the degree of particle aggregation and the better the dispersibility in water.

3.2. Effect of Nanoclayon Mechanical Properties of Cement Mortar

The mechanical properties of NCM are shown in Table 6. The addition of NMK improves the flexural strength (Rf), compressive strength (Rc), and elastic modulus (Ecu) of cement mortar, The improvement effect of NMA on the mechanical properties of cement mortar is not obvious or even reduced. Compared with ordinary cement mortar specimens, the flexural strength of NMK-1 specimens is increased by 10.0% and 12.0% (7 d), the compressive strength is increased by 3.3% (14 d) and 3.8% (7 d), the elastic modulus is increased by 27.0% and 42.6% (7 d). Compared with ordinary cement mortar specimens, the flexural strength of the NMK-3 specimens was increased by 2.7% and 12.0% (60 d), the compressive strength was increased by 3.8% and6.7% (60 d), the elastic modulus was increased by 12.1% and 17.2% (60 d). The flexural strength, compressive strength, and elastic modulus of the NMA specimens were lower than those of ordinary cement mortar specimens. The compressive strength of the NMA-2 specimens was increased by 1.2% (3 days) and 1.5% (60 days) compared with ordinary cement mortar specimens. The flexural strength of the NMK-3 specimens was 1.8%, 27.3%,14.3% (7 days) and 9.1%, 25.4%, 16.7% (60 days) higher than that of NMK-1, NMA-1, and NMA-2 specimens, respectively. The compressive strength of the NMK-3 specimens was 6.3%, 47.0%, 5.3% (7 days) and 2.2%, 19.2%, and 5.2% (60 days) higher than that of the NMK-1, NMA-1, and NMA-2 specimens, respectively. The elastic modulus of the NMK-3 specimen was 12.3%, 73.1%, 15.7% (7 days) and 4.6%, 36.0%, 19.0% (60 days) higher than that of the NMK-1, NMA-1, and NMA-2 specimens, respectively.
The relationship between the NCM flexural strength, the 28 d flexural strength ratio Z and the curing age, and the relationship between flexural strength and age are shown in Figure 7. From Figure 7a, it can be seen that the flexural strength of NCM in each group is similar to the increase in age, and the strong growth rate is faster before 7 days. The flexural strength growth rate of each group at 7 days is 70.4%, 76.4%, 72.1%, 76.7%, and 73.1% higher compared with that at 28 days, respectively. This figure shows that the aggregation of nanoclay promotes the hydration reaction and improves the early flexural strength growth rate of cement mortar. Figure 7b shows that the flexural strength of NCM increases exponentially with age. With the increase in age, the growth rate of the flexural strength of NCM decreases gradually. The growth rate of the early flexural strength of NCM is NMK > NMA >ordinary cement mortar. After 14 days, the growth rate is the same.
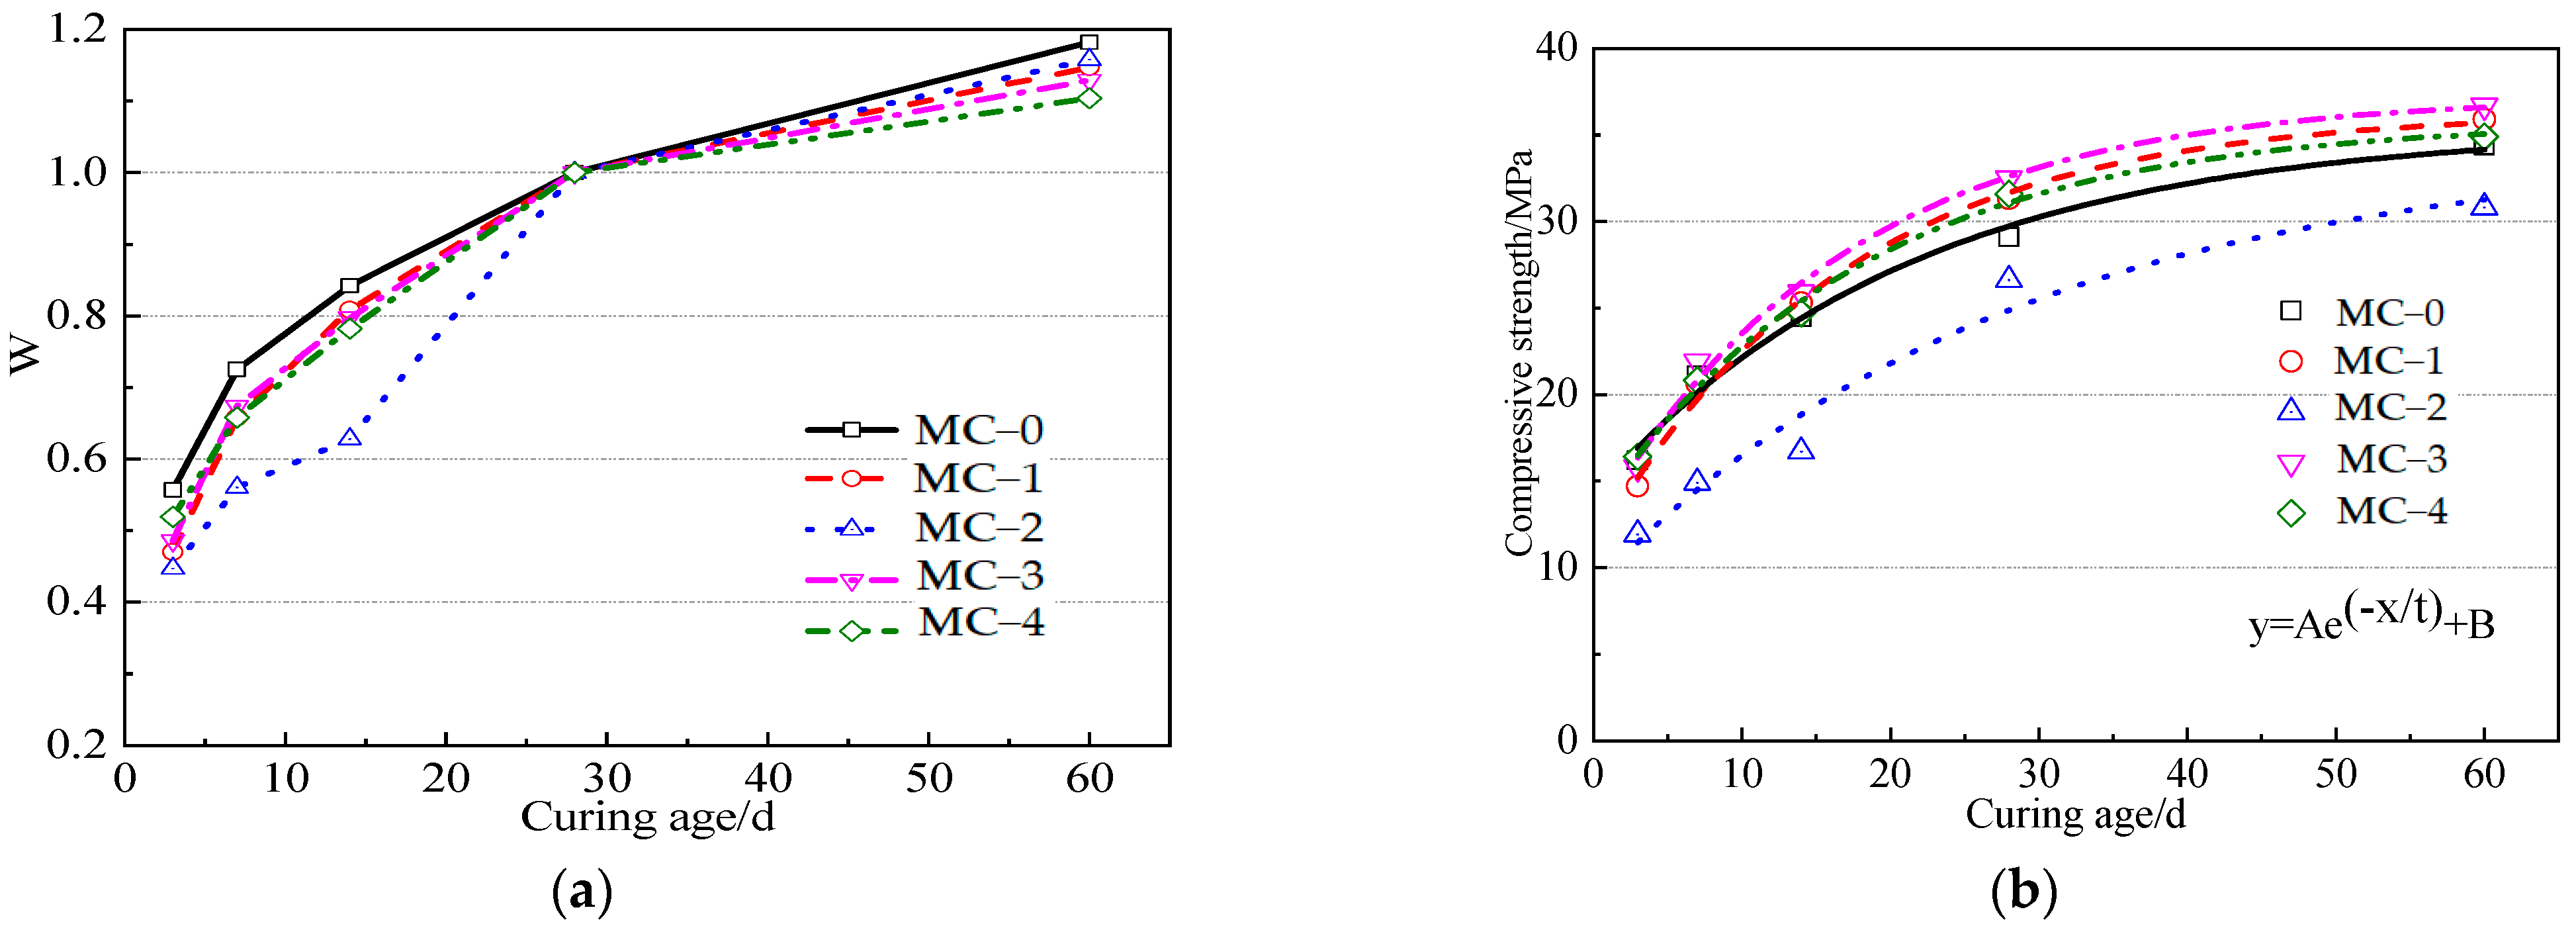
The relationship between NCM compressive strength, the28 days compressive strength ratio W and the curing age, and the relationship between compressive strength and age are shown in Figure 8. Figure 8a shows that the compressive strength of NCM in each group increases with age, and the strength increases rapidly before 7 days. The increase in strength ratiosfrom7 days to 28 days are 72.5%, 65.8%, 56.0%, 67.4%, and 65.8%, respectively. Figure 8b shows that the compressive strength of NCM increases exponentially with age, and the growth rate of NCM compressive strength decreases with the increase in age. The growth rate of early compressive strength of NCM is NMK > ordinary cement mortar ≥ NMA. After 14 days, the growth rate is the same. Therefore, the most substantial growth rate of the compressive strength of NCM gradually slows down after 7 days. In the early days,(especially in the first 7 days), the hydration reaction of NCM is rapid, and NMK clay particles significantly affect the improvement in the performance of cement mortar. This is a crucial stage for the development of the compressive strength of NCM; therefore, sufficient attention should be paid to engineering this stage.
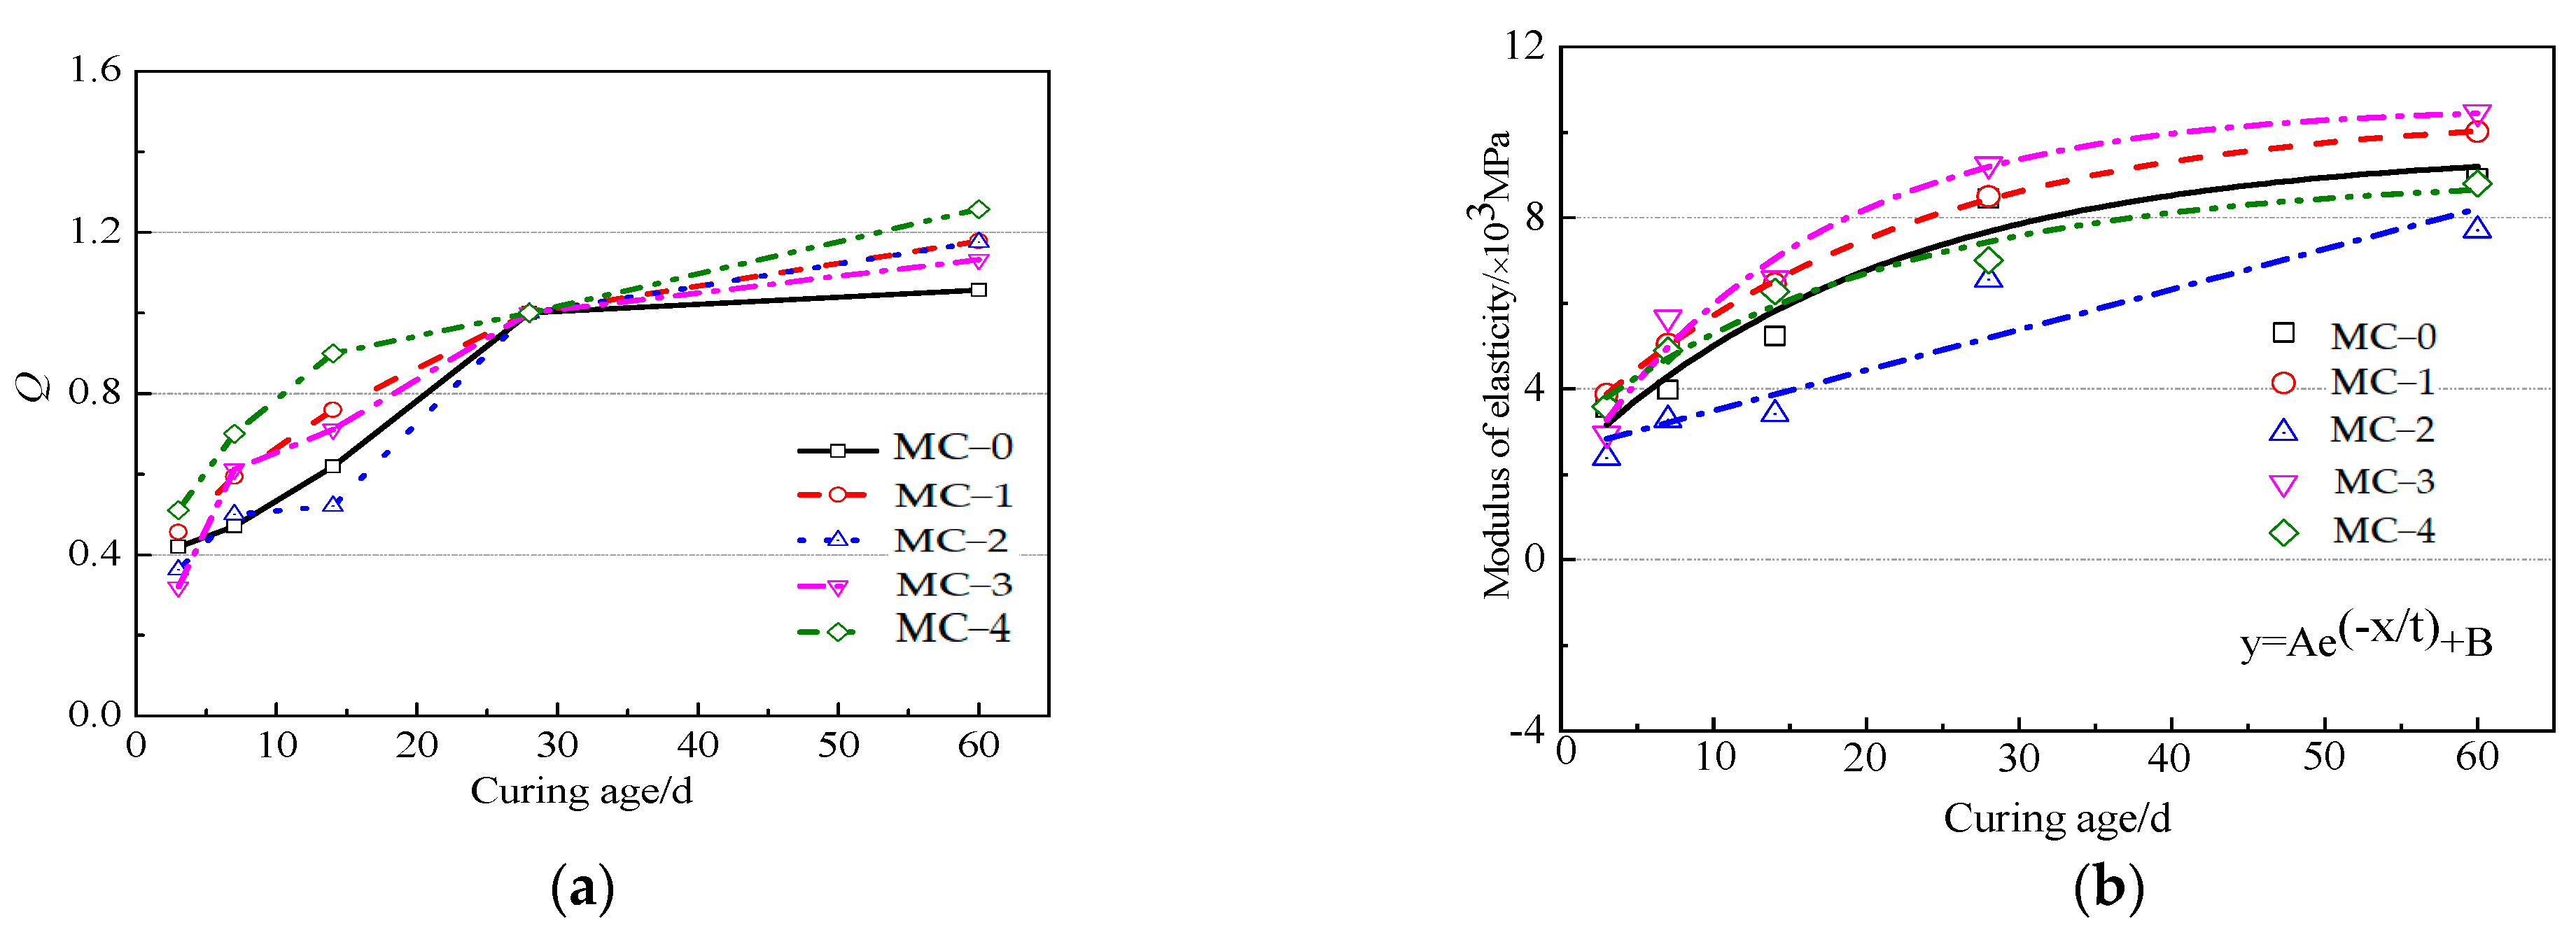
The relationship between the NCM elastic modulus, and the 28-day elastic modulus ratio Q and the curing age, and the relationship between the elastic modulus and age are shown in Figure 9. From Figure 9a, it can be seen that the elastic modulus of NCM in each group increases according to age, and the strength increases rapidly before 7 days. This is attributed to the fact that a large number of hydration products are generated before the 7-day curing age. With the generation of hydration products, the hardened cement paste forms a dense solid, which accelerates the improvement of the strength of the cement mortar [26,27]. The elastic modulus ratio of cement mortar under 7 days and at 28 days curing is 47.0%, 59.4%, 50.0%, 61.2%, and 70.0%, respectively. This indicates that the dispersion of nanoclay particles increases the elastic modulus growth rate of cement mortar and improves its early toughness. Figure 9b shows that the elastic modulus of NCM increases exponentially with age, and the growth rate of elastic modulus of NCM decreases with the increase in age. The growth rate of the early elastic modulus of NCM is NMK > ordinary cement mortar > NMA. After 14 days, the growth rate is the same. The strong growth rate of the elastic modulus in NCM gradually slows down after 7 days, and the growth law is the same as that for compressive strength, but the growth rate is low.
According to the above results, NMK with stable dispersion improves the flexural strength, compressive strength, and elastic modulus of cement mortar. Because it is easy to re-agglomerate, the mechanical properties of the cement mortar are reduced. After NMK is dispersed, the clay particles can effectively fill the pores generated during the cement hydration process, making the internal structure of the cement mortar specimen more compact. Nanoclay particles with smaller particle sizes can effectively fill the larger pores of the cement mortar matrix, promoting the hydration reaction process of the cement mortar, increasing the hydration products, and causing the cement mortar to form a dense and hardened slurry, thereby improving the mechanical properties of the cement mortar.

3.3. Experimental Study on Cracking Performance of Nanoclay Cement Mortar

3.3.1. Shrinkage and Cracking Characteristics of Mortar Plate

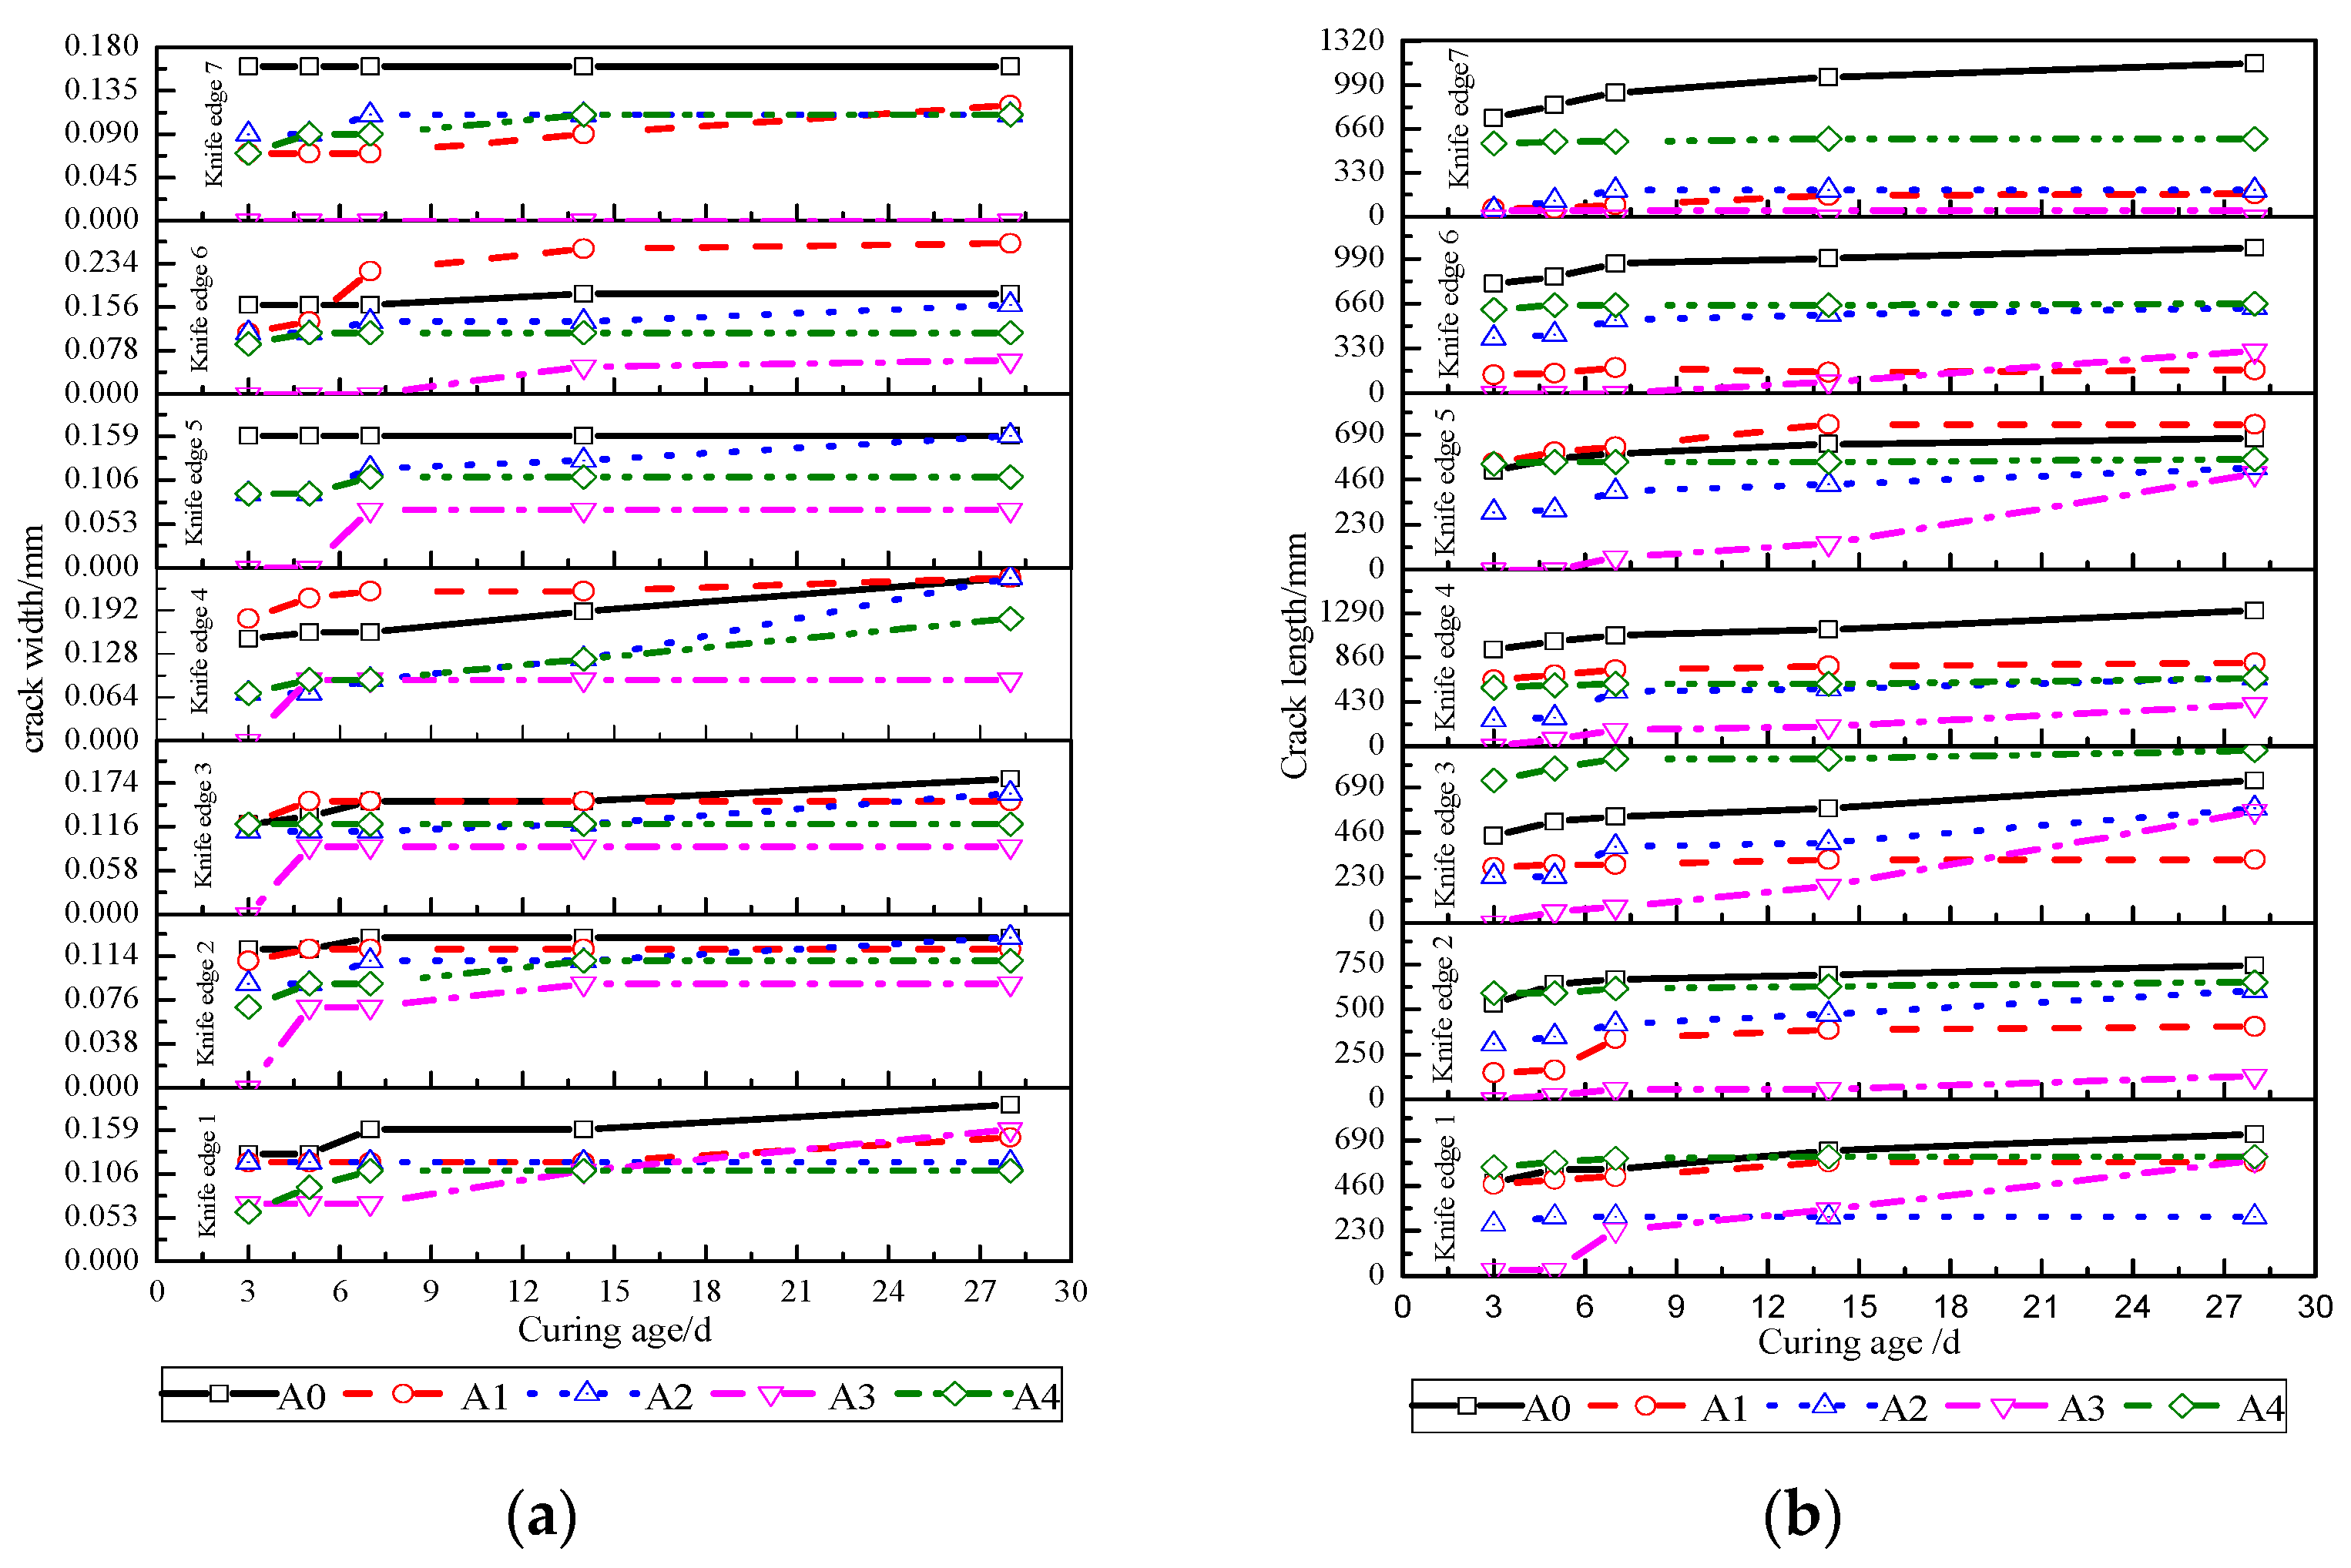
The relationship between crack width, crack length, and curing age is shown in Figure 10. After adding nanoclay into cement mortar, the number of cracks, crack width, crack length, average cracking area, and unit cracking area of each crack is significantly reduced, and the anti-cracking effect of NMK is better than that of NMA.
The maximum crack widths of NMK-1, NMA-1, NMK-3, and NMA-2 are 0.30 mm, 0.24 mm, 0.16 mm, and 0.18 mm, respectively. The maximum crack widths of NMK-3 and NMA-2 are 33.3% and 25.0% lower(0.24 mm, on average), respectively, than those of ordinary cement mortar. The initial crack widths of ordinary cement mortar, NMK-1, NMA-1, NMK-3, and NMA-2 are 0.15 mm, 0.27 mm, 0.24 mm, 0.07 mm, and 0.07 mm, respectively. The initial crack width of NMK-3 and NMA-2 is 53.3% lower than that of ordinary cement mortar. The initial minimum crack width of ordinary cement mortar, NMK-1, NMA-1, NMK-3, and NMA-2 is 0.12 mm, 0.07 mm, 0.07 mm, 0.07 mm, and 0.06 mm, respectively. The initial minimum crack width of NMK-1, NMA-1, and NMK-3 is41.7% lower than that of ordinary cement mortar, and that for NMA-2 is 50.0% lower than that of ordinary cement mortar, indicating that NMK and NMA have little effect on reducing the crack width of cement mortar.
The maximum crack lengths of NMK-1, NMA-1, NMK-3, and NMA-2 were 38.5%, 49.6%, 55.1%, and 33.1% lower than those of 1315 mm for ordinary cement mortar, respectively. The initial crack lengths of NMK-1, NMA-1, NMK-3, and NMA-2 were 646 mm, 256 mm, 30 mm, and 725 mm, respectively, which were 31.1%, 72.7%, 96.8%, and 22.7% lower, respectively, than those of 938 mm for ordinary cement mortar. The initial minimum crack length of ordinary cement mortar, NMK-1, NMA-1, NMK-3, and NMA-2 is 444 mm, 63 mm, 55 mm, 30 mm, and 541 mm, respectively. Among these, the initial minimum crack length of NMK-1, NMA-1, and NMK-3 are 85.8%, 87.6%, and 93.2% lower than that of ordinary cement mortar, respectively, indicating that NMK is more effective than NMA in reducing the crack length of cement mortar.
When ordinary cement mortar, NMK-1, NMA-1, NMK-3, NMA-2 crack, and NMK-3 produce only one crack, ordinary cement mortar, NMK-1, NMA-1, NMA-2 have cracks in each blade, and the initial crack width of NMA-1, NMK-3, NMA-2 is significantly smaller than the initial crack width of ordinary cement mortar. Among these, the number of cracks, crack width, and crack length of NMK-3 are the smallest, indicating that nanoclay can effectively improve the cracking performance of cement mortar and inhibit crack propagation.
The evaluation index of the flat knife-edge constraint method is shown in Figure 11. When different nanoclays are added, the crack reduction coefficients show different trends with age. Among them, the crack reduction coefficients of NMA-1 and NMK-3 decrease slowly with age, and the crack reduction coefficients of NMK-1 and NMA-2 decrease slowly at first, and then increase slowly with age. Under the same experimental conditions, nanoclay can inhibit the generation and development of cracks, refine the crack width, and significantly improve the crack resistance of cement-based materials. At 3–14 days, each crack’s average cracking area and unit cracking area are as follows: ordinary cement mortar > NMK-1 > NMA-2 > NMA-1 > NMK-3. At 28 days, each crack’s average and unit cracking area are as follows: ordinary cement mortar > NMK-1 > NMA-1 > NMA-2 > NMK-3. The cracking area and unit area of NMK cement mortar are smaller than those of NMA cement mortar, and NMK-3 shows the best crack resistance.
Under the same water–binder ratio, compared with NMK, NMA significantly increased the viscosity of cement mortar, bound the flow of water in the suspension, and was not easily dispersible in cement-based materials. As a result, the distribution of hydration products was significantly uneven, and the overlap between gels was not close enough to form a dense network structure. Therefore, the crack resistance of NMK was better than that of NMA.

3.3.2. Ring Shrinkage Cracking Characteristics

The relationship between crack width, crack length, and age of the NCM ring is shown in Figure 12. The relationship between crack width and crack length is: ordinary cement mortar > NMK-3 > NMK-1 > NMA-2 > NMA-1, ordinary cement mortar > NMK-3 > NMA-1 > NMA-2 > NMK-1. The crack length and crack width increase with the increase in age. The crack length penetrates the side of the ring 10 days after cracking, and the maximum crack width increases rapidly, and then slows with the increase in age. There are some differences in the specific growth law.
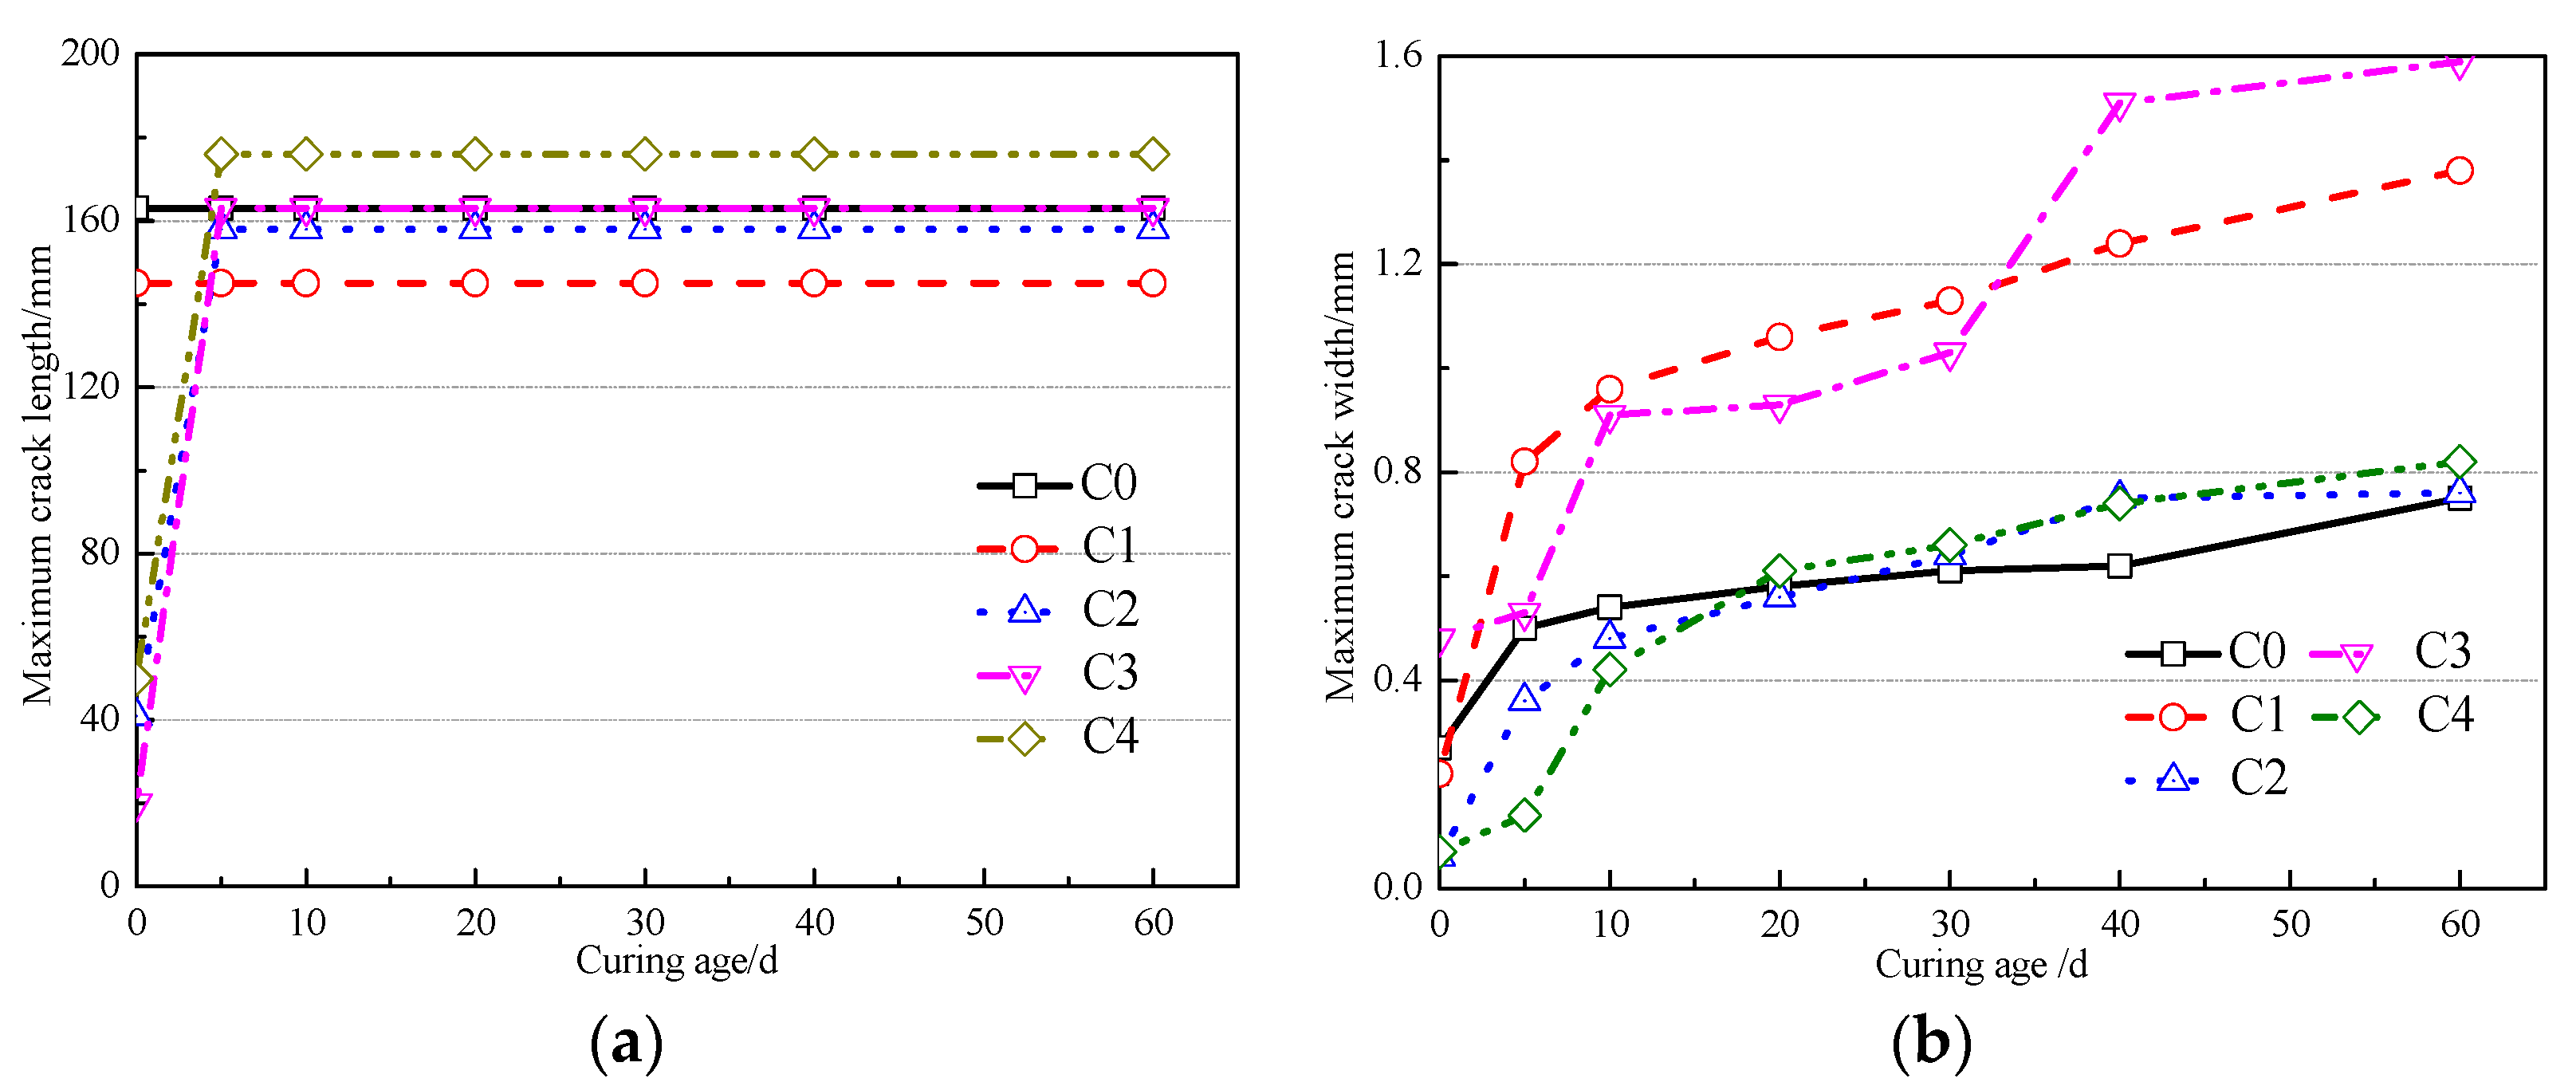
From the observation of the NCM rings in each group, we see the relationship between the maximum crack width, the maximum crack length, and the post-cracking age, as shown in Figure 13. Between 0–10 days, the maximum crack width of each group of specimens increases rapidly. After 10–60 days, the growth rates of the ordinary cement mortar, NMA-1, and NMA-2 rings decrease significantly, while the growth rates of NMK-1 and NMK-3 decrease slightly, but the growth rates are still significant.
The maximum crack widths of NMK-1 and NMK-3 are more significant than those of ordinary cement mortar, NMA-1, and NMA-2. After 10 days, the maximum crack widths of ordinary cement mortar, NMA-1, and NMA-2 show little variation. After 60 days, the maximum crack widths of ordinary cement mortar, NMK-1, NMA-1, NMK-3, and NMA-2 are 0.75 mm, 1.38 mm, 0.76 mm, 1.59 mm, and 0.82 mm, respectively. The maximum crack widths of the NMK-1, NMA-1, NMK-3, and NMA-2 rings increased by 84.0%, 1.3%, 112.0%, and 9.3%, respectively, compared with the ordinary cement mortar rings. The maximum crack lengths of ordinary cement mortar, NMK-1, NMA-1, NMK-3, and NMA-2 developed after 5 days of cracking. The maximum crack lengths of NMK-1, NMA-1, and NMK-3 were 11.0%, 3.1%, and 0% lower, respectively, than those of ordinary cement mortar rings.
The relationship between the total cracking area of the NCM ring and age is shown in Figure 14. A powerful function of age increased the total cracking area of the NCM ring. The total cracking area of the NMK-1, NMA-1, NMK-3, and NMA-2 rings was more significant than that of the ordinary cement mortar rings. The total cracking area of the NMK-1, NMA-1, NMK-3, and NMA-2 rings was increased by 64.3%, 45.0%, 92.7%, and 49.7% (60 days), respectively. The growth rate of the total cracking area of the NMK-1, NMA-1, NMK-3, and NMA-2 rings is more significant than that of the ordinary cement mortar rings. After 5 days of cracking, the growth rate of the total cracking area of the NCM rings wasNMK-3 > NMA-2 > NMA-1 > NMK-1 > ordinary cement mortar.
The NCM ring cracking trend is the same as for the NCM plate, but the cracking time is later. The cracking time of the nanoclay ring is earlier than that for the ordinary cement mortar ring, and the cracking degree of the NCM ring is larger than that of ordinary cement mortar ring due to premature cracking and severe shrinkage. The cracking degree of the NMK ring is larger than that of NMA, the clay particle size after dispersion is smaller, and the cracking degree is larger. The addition of nanoclay causes the cracking time of the cement mortar to occur earlier. However, it can still inhibit the generation and development of cracks, refine the crack width, and significantly improve the crack resistance of cement-based materials. The NMK specimen has better crack resistance than the NMA specimen. The anti-cracking effect of the NMK particles with smaller particle sizes is better, and the anti-cracking impact of the NMA particles with larger particle sizes is more significant than that with the smaller particle sizes. This may be partially attributed to the following: (1) The smaller the particle size of the nanoclay particles and the more uniform the dispersion in the cement mortar, the faster the hydration reaction in the cement. The consumption of a large amount of free water generates more hydration products; the microstructure of the mortar is dense, and considerable shrinkage stress is generated under the action of restraint, which makes the shrinkage trend of the cement mortar intensify, so the cracking time is advanced. (2) Under the same water-binder ratio, NMA makes the cement mortar denser and requires a large amount of water. The NMA particles are not easy to disperse uniformly in the cement mortar, and the hydration products are unevenly distributed. In addition, the hydration reaction is rapid, and the shrinkage is more severe, so the cracking time of the NMA specimen is earlier than that of the NMK specimen. (3) Nanoclay particles can be effectively filled with the microporous structure inside the cement matrix, making the cement mortar’s microstructure uniform and dense. (4) The dispersed nanoclay particles can promote the formation of C-S-H gel, and the fibrous gel formed by the pores between the cement particles is closely overlapped, forming a network structure that strengthens the bonding force of the aggregate interface.

4. Conclusions

(1)
The degree of aggregation of the NMA particles is lower than that of the NMK particles. The larger the particle size of NMA, the lower the degree of particle aggregation. The larger the particle size of NMK, the better the dispersibility in water.
(2)
NMK with a smaller particle size has the best improvement effect on cement mortar. The flexural strength ratio, compressive strength ratio, and elastic modulus ratio of 7 d and 28 d are 76.7%, 67.4%, and 61.2%, respectively. The improvement effect of NMK on the mechanical properties of cement mortar is due to NMA.
(3)
In the flat plate cracking test, NMK-3 and NMA-2 are respectively 33.3% and 25.0% lower than the maximum crack width of ordinary cement mortar; the full crack length is 55.1% and 33.1% lower than that of cement mortar, effectively improve the cracking performance of cement mortar and inhibiting crack propagation.
(4)
In the ring constraint test, the total cracked area of the cement mortar with NMK-1, NMA-1, NMK-3, and NMA-2 increased by 64.3%, 45.0%, 92.7%, and 49.7%, respectively, compared with ordinary cement mortar rings after 60 days of observation. NMK advances the early cracking time of cement mortar, but it can inhibit the generation and development of cracks and refine the crack width.

Author Contributions

Formal analysis and writing—review and editing, G.L.; writing—original draft preparation, writing—review and editing, and funding acquisition, S.Z.; resources, formal analysis, and investigation, Y.F.; methodology, S.P.S. All authors have read and agreed to the published version of the manuscript.

Funding

This research was financially supported by the National Natural Science Foundation of China (Grant No. 51908342), and by the Natural Science Foundation of Shandong Province (Grant No. ZR2018PEE021), for which the authors are very grateful.

Data Availability Statement

Not applicable.

Acknowledgments

The authors gratefully acknowledge the support received from National Natural Science Foundation of China (Grant No. 51908342) and the Natural Science Foundation of Shandong Province (Grant No. ZR2018PEE021).

Conflicts of Interest

The authors declare no conflict of interest.

References

  1. Xin, J.; Zhang, G.; Liu, Y.; Wang, Z.; Wu, Z. Effect of temperature history and restraint degree on crackingbehavior of early-age concrete. Constr. Build. Mater. 2018, 192, 381–390. [Google Scholar] [CrossRef]
  2. Ren, J.; Zhao, H.; Zhang, L.; Zhao, Z.; Xu, Y.; Cheng, Y.; Wang, M.; Chen, J.; Wang, J. Design optimization of cement grouting material based on adaptive boosting algorithm and simplicial homology global optimization. J. Build. Eng. 2022, 49, 104049. [Google Scholar] [CrossRef]
  3. Simeon, W.; Thomas, D. Design and durability of early 20th century concrete bridges in Scotland: A review of historic test data. Int. J. Arch. Herit. 2022, 16, 1131–1151. [Google Scholar]
  4. Ren, J.; Zhang, L.; Zhao, H.; Zhao, Z.; Wang, S. Determination of the fatigue equation for the cement-stabilized cold recycled mixtures with road construction waste materials based on data-driven. Int. J. Fatigue 2022, 158, 106765. [Google Scholar] [CrossRef]
  5. Ren, J.; Xu, Y.; Zhao, Z.; Chen, J.; Cheng, Y.; Huang, J.; Yang, C.; Wang, J. Fatigue prediction of semi-flexible composite mixture based on damage evolution. Constr. Build. Mater. 2022, 318, 126004. [Google Scholar] [CrossRef]
  6. Rong, Z.; Zhao, M.; Wang, Y. Effects of Modified Nano-SiO2 Particles on Properties of High-Performance Cement-Based Composites. Materials 2020, 13, 646. [Google Scholar] [CrossRef]
  7. Liu, X.; Feng, P.; Shu, X.; Ran, Q. Effects of highly dispersed nano-SiO2 on the microstructure development of cement pastes. Mater. Struct. 2020, 53, 4. [Google Scholar] [CrossRef]
  8. Luan, C.; Zhou, Y.; Liu, Y.; Ren, Z.; Wang, J.; Yuan, L.; Du, S.; Zhou, Z.; Huang, Y. Effects of nano-SiO2, nano-CaCO3 and nano-TiO2 on properties and microstructure of the high content calcium silicate phase cement (HCSC). Constr. Build. Mater. 2022, 314, 125377. [Google Scholar] [CrossRef]
  9. Cui, K.; Lau, D.; Zhang, Y.; Chang, J. Mechanical properties and mechanism of nano-CaCO3 enhanced sulphoaluminate cement-based reactive powder concrete. Constr. Build. Mater. 2021, 309, 125099. [Google Scholar] [CrossRef]
  10. Divya, S.; Praveenkumar, S.; Tayeh, B.A. Performance of modified nano carbon blended with supplementary materials in cement composite—An interpretive review. Constr. Build. Mater. 2022, 346, 128452. [Google Scholar] [CrossRef]
  11. Varela, H.; Barluenga, G.; Palomar, I. Influence of nanoclays on flowability and rheology of SCC pastes. Constr. Build. Mater. 2020, 243, 118285. [Google Scholar] [CrossRef]
  12. Hakamy, A.; Shaikh, F.; Low, I.M. Effect of calcined nanoclay on the durability of NaOH treated hemp fabric-reinforced cement nanocomposites. Mater. Des. 2016, 92, 659–666. [Google Scholar] [CrossRef]
  13. Mohammed, A.; Rafiq, S.; Mahmood, W.; Al-Darkazalir, H.; Noaman, R.; Qadir, W.; Ghafor, K. Artificial neural network and NLR techniques to predict the rheological properties and compression strength of cement past modified with nanoclay. Ain Shams Eng. J. 2021, 12, 1313–1328. [Google Scholar] [CrossRef]
  14. Lee, S.-J.; Kawashima, S.; Kim, K.-J.; Woo, S.-K.; Won, J.-P. Shrinkage characteristics and strength recovery of nanomaterials-cement composites. Compos. Struct. 2018, 202, 559–565. [Google Scholar] [CrossRef]
  15. Kawashima, S.; Wang, K.; Ferron, R.D.; Kim, J.H.; Tregger, N.; Shah, S. A review of the effect of nanoclays on the fresh and hardened properties of cement-based materials. Cem. Concr. Res. 2021, 147, 106502. [Google Scholar] [CrossRef]
  16. Hamed, N.; El-Feky, M.; Kohail, M.; Nasr, E.-S.A. Effect of nano-clay deagglomeration on mechanical properties of concrete. Constr. Build. Mater. 2019, 205, 245–256. [Google Scholar] [CrossRef]
  17. Douba, A.E.; Ma, S.; Kawashima, S. Rheology of fresh cement pastes modified with nanoclay-coated cements. Cem. Concr. Compos. 2022, 125, 104301. [Google Scholar] [CrossRef]
  18. Reales, O.A.M.; Carisio, P.A.; dos Santos, T.C.; Pearl, W.C., Jr.; Toledo Filho, R.D. Effect of pozzolanic micro and nanoparticles as secondary fillers in carbon nanotubes/cement composites. Constr. Build. Mater. 2021, 281, 122603. [Google Scholar] [CrossRef]
  19. Pradhan, S.; Hedberg, J.; Blomberg, E.; Wold, S.; Wallinder, I.O. Effect of sonication on particle dispersion, administered dose and metal release of non-functionalized, non-inert metal nanoparticles. J. Nanoparticle Res. 2016, 18, 285. [Google Scholar] [CrossRef]
  20. Quanji, Z.; Lomboy, G.R.; Wang, K. Influence of nano-sized highly purified magnesium alumino silicate clay on thixotropic behavior of fresh cement pastes. Constr. Build. Mater. 2014, 69, 295–300. [Google Scholar] [CrossRef]
  21. Dejaeghere, I.; Sonebi, M.; De Schutter, G. Influence of nano-clay on rheology, fresh properties, heat of hydration and strength of cement-based mortars. Constr. Build. Mater. 2019, 222, 73–85. [Google Scholar] [CrossRef]
  22. Hakamy, A.; Shaikh, F.; Low, I.M. Thermal and mechanical properties of NaOH treated hemp fabric and calcined nanoclay-reinforced cement nanocomposites. Mater. Des. 2015, 80, 70–81. [Google Scholar] [CrossRef]
  23. Irshidat, M.R.; Al-Saleh, M.H. Influence of nanoclay on the properties and morphology of cement mortar. KSCE J. Civ. Eng. 2018, 22, 4056–4063. [Google Scholar] [CrossRef]
  24. Wang, X.; Wang, K. Hydration and strength of cement pastes containing different nanoparticles. Am. Concr. Inst. ACI Spec. Publ. 2019, 335, 83–96. [Google Scholar]
  25. Lomboy, G.; Wang, K.; Ouyang, C. Shrinkage and fracture properties of semiflowable self-consolidating concrete. J. Mater. Civ. Eng. 2011, 23, 1514–1524. [Google Scholar] [CrossRef]
  26. Zhang, S.; Fan, Y.; Huang, J.; Shah, S.P. Effect of nano-metakaolinite clay on the performance of cement-based materials at early curing age. Constr. Build. Mater. 2021, 291, 123107. [Google Scholar] [CrossRef]
  27. Fan, Y.; Zhang, S.; Kawashima, S.; Shah, S.P. Influence of kaolinite clay on the chloride diffusion property of cement-based materials. Cem. Concr. Compos. 2014, 45, 117–124. [Google Scholar] [CrossRef]
  28. Fan, Y.; Zhang, S.; Wang, Q.; Shah, S.P. The effects of nano-calcined kaolinite clay on cement mortar exposed to acid deposits. Constr. Build. Mater. 2016, 102, 486–495. [Google Scholar] [CrossRef]
Figure 1. XRD spectra of nanoclay: (a) NMA; (b) NMK.
Buildings 12 01459 g001
Figure 2. Schematic view of a ring specimen (unit: mm).
Buildings 12 01459 g002
Figure 3. Ring test device and surface crack of test piece.
Buildings 12 01459 g003
Figure 4. The regional divisions of nanoclay suspensions.
Buildings 12 01459 g004
Figure 5. TEM micrograph of ultrasonically dispersed nanoclay. (a) NMA-2; (b) NMK-5.
Buildings 12 01459 g005
Figure 6. Relationship between the gray histogram k, f, gray change rate, and sedimentation time of nanoclay suspensions. (a) k and settlement time; (b) f and settlement time; (c) gray change rate and settlement time.
Buildings 12 01459 g006
Figure 7. Relationship between the flexural strength of NCM and age. (a) Z; (b) Rf.
Buildings 12 01459 g007
Figure 8. Relationship between compressive strength and curing age. (a) W; (b) Rc.
Buildings 12 01459 g008
Figure 9. The relationship between the elastic modulus and curing age.(a) Q; (b) Ecu.
Buildings 12 01459 g009
Figure 10. The relationship between crack width and length of cracks at each flat knife-edge and age. (a) Crack width; (b) Crack length.
Buildings 12 01459 g010
Figure 11. The evaluating indicator of the flatknife-edge test.
Buildings 12 01459 g011
Figure 12. Relationship between crack width, crack length, and curing age of the NCM ring. (a) Crack width; (b) crack length.
Buildings 12 01459 g012
Figure 13. Relationship between maximum crack length, crack width, and curing age of NCM ring. (a) Maximum crack length; (b) maximum crack width.
Buildings 12 01459 g013
Figure 14. Relationship between total cracking area and curing age.
Buildings 12 01459 g014
Table 1. Chemical composition of nanoclay (mass fraction, %).
Chemical CompositionSiO2CaOAl2O3Fe2O3MgOK2ONa2OLol
NMK47.80.341.80.30.10.60.19.0
NMA50.4–61.31.8–2.59.4–9.54.0–5.09.3–10.50.2–0.60.5–1.011.9–13.5
Table 2. Physical performance index.
NanoclayAttapulgite ClaysNano-Metakaolin
NumberingNMA-1NMA-2NMK-1NMK-2NMK-3NMK-4NMK-5
Average lamellar diameter/nm20–10020–100300–50025001000300–500100
Average slice thickness/nm-18–2520–50---80
Table 3. Mix proportion of cement mortar.
Specimen NumberCement/gSand/gWater/gNMK-1/gNMA-1/gNMK-3/gNMA-2/g
MC0450067502250----
MC1436567502250135---
MC2436567502250-135--
MC3436567502250--135-
MC4436567502250---135
Table 4. The settlement diagram of nanoclay suspension.
Specimen NumberOriginal DrawingGrayscale Image
0 h1 h5 h15 h24 h48 h0 h1 h5 h15 h24 h48 h
NMA-2-5 (1) Buildings 12 01459 i001 Buildings 12 01459 i002 Buildings 12 01459 i003 Buildings 12 01459 i004 Buildings 12 01459 i005 Buildings 12 01459 i006 Buildings 12 01459 i007 Buildings 12 01459 i008 Buildings 12 01459 i009 Buildings 12 01459 i010 Buildings 12 01459 i011 Buildings 12 01459 i012
NMK-1-5 Buildings 12 01459 i013 Buildings 12 01459 i014 Buildings 12 01459 i015 Buildings 12 01459 i016 Buildings 12 01459 i017 Buildings 12 01459 i018 Buildings 12 01459 i019 Buildings 12 01459 i020 Buildings 12 01459 i021 Buildings 12 01459 i022 Buildings 12 01459 i023 Buildings 12 01459 i024
Note (1): “NMA-2-5” and “NMK-1-5” represent NMA-2 and NMK-1, respectively, after ultrasonic dispersion for 5 min.
Table 5. The gray histogram of the nanoclay suspension.
Specimen NumberDispersion Time/minSettling Time/h
0548
NMA-25 Buildings 12 01459 i025 Buildings 12 01459 i026 Buildings 12 01459 i027
15 Buildings 12 01459 i028 Buildings 12 01459 i029 Buildings 12 01459 i030
NMK-35 Buildings 12 01459 i031 Buildings 12 01459 i032 Buildings 12 01459 i033
15 Buildings 12 01459 i034 Buildings 12 01459 i035 Buildings 12 01459 i036
Table 6. Mechanical properties of NCM.
Specimen NumberCategoryCuring Age/Day
37142860
MC0Flexural strength/MPa4.45.06.07.17.5
MC13.95.56.17.27.7
MC23.54.45.36.16.7
MC34.65.66.67.38.4
MC44.04.95.86.77.2
MC0Compressive strength/MPa16.221.124.529.134.4
MC114.720.625.331.335.9
MC211.914.916.726.630.8
MC315.821.925.932.536.7
MC416.420.824.731.634.9
MC0Elastic modulus/×103 MPa3.553.975.238.458.93
MC13.875.046.458.4910.01
MC22.383.273.416.557.70
MC32.955.666.589.2510.47
MC43.584.896.277.008.80
Publisher’s Note: MDPI stays neutral with regard to jurisdictional claims in published maps and institutional affiliations.

