Article

On the Seismic Evaluation of Steel Frames Laterally Braced with Perforated Steel Plate Shear Walls Considering Semi-Rigid Connections

1
Department of Civil and Environmental Engineering, University of Texas at San Antonio, San Antonio, TX 78249, USA
2
School of Civil Engineering, University of Tehran, Tehran 1417466191, Iran
3
Department of Civil Engineering, Faculty of Engineering, Ferdowsi University of Mashhad, Mashhad 9177948974, Iran
*
Authors to whom correspondence should be addressed.
Buildings 2022, 12(9), 1427; https://doi.org/10.3390/buildings12091427
Submission received: 16 August 2022 / Revised: 1 September 2022 / Accepted: 7 September 2022 / Published: 11 September 2022
(This article belongs to the Special Issue Advances in the Behaviour of Steel Structures)

Abstract

:
Steel plate shear walls usually do not satisfy the strong-column weak-beam design criteria, leading to larger column sections. On the other hand, rigid frame structures are typically constructed in low-rise to mid-rise buildings built in locations prone to strong earthquakes due to their high flexibility and cost-effective solutions. Overcoming these restrictions to the SPSW system, this paper is dedicated to employing a semi-rigid connection that dissipates energy well and reduces the forces applied to the structure. By using a semi-rigid connection in an adjacent span to the SPSW, the actual flexural capacity of the beam end decreases and, subsequently, improves the performance of the structure in terms of the of the strong-column weak-beam criteria. Thereupon, the impact of the semi-rigid connections on steel frames with SPSWs as a sideway resisting system can be assessed by implementing a numerical study. In this paper, a new methodology for modelling semi-rigid joints is used considering five connections with different moment capacities. Moreover, the influence of three different circular diameters on the behavior of the perforated SPSWs was investigated. To fulfil these purposes, nonlinear dynamic analysis was conducted to assess the reliability of 5-, 10-, and 15-story frames resisted with SPSWs and semi-rigid connections subjected to actual ground motion records. A total of 45 frames were modelled and the obtained results were compared with reference benchmarks. The outcomes of the studies show good agreement with design building code requirements. In addition, the reliable performance of the structure under seismic loads is evaluated. According to the results of the parametric study, the presumed allowable drift leads to obtaining the optimum moment capacity of connection for each model and illustrates the applicability of a new structural system consisting of SPSWs and semi-rigid connections simultaneously.

1. Introduction

The menacing Kobe and Northridge earthquakes caused severe damage to fully welded connections and initiated the steps to find alternatives [1]. As shown in Figure 1, a typical SPSW has three main components: (i) an unstiffened thin infill plate; (ii) a vertical boundary element (VBE); and (iii) a horizontal boundary element (HBE). If SPSWs are implemented and designed correctly in the frames, they have a good capacity and can dissipate energy effectively [2,3,4,5,6,7,8]. One of the issues that SPSWs have is that they regulate the strong-column weak-beam design requirement. By using a combination of SPSWs and semi-rigid connections in frames located in high seismic zones, it is possible to control the strong-column weak-beam issue and at the same time dissipate energy effectively.
There are four semi-rigid connection types which are: the extended end plate, the top and seat T-stub, the end plate, and the top and seat angle [9]. End-plate connections are the most used type of connection in previous studies because it was mistakenly thought that they exhibit large stiffness and strength compared to other types of connections [10]. This misconception was partially because of the joint categorization suggested by Kishi and Chen [11], suggesting that top and seat angle joints have a relatively smaller capacity and stiffness compared to other types of semi-rigid connections. Even though this assumption could be true, it is wrong to generalize because the compared connections had different beam and column dimensions. In order to investigate semi-rigid frames, three methods are typically used: the experimental method, numerical analysis and the hybrid method. In the numerical analysis, linear and nonlinear rotational springs can be modeled as well as detailed FE models.
Experiments conducted on a one bay one story frame indicated that the base shear increased by making the connections more robust, whereas the drift of the story did not change with the same ratio of the base shear [12]. The cyclic inelastic responses of connection elements (T-stub, end plate, angle, panel zone, column flange, etc.) were experimentally investigated by Bernuzzi et al. [13] and Shi et al. [14]. It was shown in both of these two studies that the extended end-plate connections had high rotational capacity and a stable hysteretic behavior if the other failure modes were prevented. A series of experiments were conducted by Abidelah et al. [15] to investigate the effect of stiffeners on the behavior of extended end-plate connections.
A one-bay, two-story setup was modeled using the rotational spring method presented by Kim and Choi [16]. After comparing the computational results with the experimental models, it was exhibited that the rotational spring method had great accuracy. Aksoylar et al. [17] analyzed three-story with three-bay frames designed in high seismic zones using high-energy dissipative semi-rigid connections. In the design process of these structures, the strong column-weak beam concept was maintained which resulted in the nonlinear behavior of the connections. By using semi-rigid connections in these frames, the column sections significantly reduced. Moreover, the overdesigning problem in structures with low stories was eliminated. The seismic performance of frames with semi-rigid connections under far- and near-field ground motion records were evaluated by Aksoylar et al. [18]. Four connections with different moment capacities were employed in frames and their behavior was characterized by two different hysteresis models. The seismic performance of the rigid and semi-rigid frames was compared and the results showed that most of the frames satisfied the acceptance criteria.
Mahmoud et al. [10] worked on both an experimental and numerical model that predicted the performance of semi-rigid connections using the hybrid method. Their results showed that by decreasing the connection capacity, the acceleration and rotation increased. Bayat and Zahrai [19] implemented both rigid and semi-rigid connections on 10-, 15- and 20-story frames and found the most effective way to implement semi-rigid connections throughout different stories.
A various number of numerical, analytical and experimental models have been developed to further understand the elastic to post-buckling behavior of SPSWs [20,21,22,23,24]. The first breakthrough for unstiffened SPSWs was the “strip model” proposed by Thorburn et al. [25]. In this method, the infill panel was replaced by a series of pin-ended tension strips (truss members) with the equal angle of inclination in the direction of loading. By considering real structural conditions, Driver et al. [26] tested a robust four-story frame infilled with SPSWs. A strip model with plastic hinges implemented in the trusses was also considered for this specimen. The results showed that changing the angle of the strips did not have a significant effect on the global behavior of the frame as long as the angle was between 42 to 50 degrees. Implementing an SPSW on a shake table was first initiated by Rezai [27]. The test model included a four-story frame with an infill panel thickness of 1.5 mm. The experiment showed that the first-floor shear panel mainly dissipated all the incoming energy and the panels in other stories acted as a rigid body. In order to overcome the complexity of the model, Rezai [27] proposed a multi-angle strip model which was made of simple trusses. The multi-angle strip model was relatively accurate except from the fact that it underestimated the ultimate strength. A detailed FE model was also established by using an orthotropic material property for the infill plate. The orthotropic FE model accurately replicated the behavior of the SPSW assessed by Rezai. Elgaaly et al. [28] studied the post-buckling behavior of an unstiffened SPSW frame. They also conducted a strip model to predict the ultimate strength of the specimen.
Timler and Kulak [29] conducted an experiment on a one-story, one-bay specimen to find the more exact equation for predicting the angle of the tension field created in the SPSW. Perforated SPSW was first introduced by Roberts and Sabouri-Ghomi [30]. They came up with an equation that shows the reduction in the strength of SPSWs. Later on, researchers expanded their horizon for different types of unstiffened SPSW systems such as the perforated model. Lubell et al. [31] performed extensive experimental research on thin steel plate (1.5 mm) shear walls. The focus of this experiment was the applicability of thin SPSWs to mid-high-rise structures, since the load demands on SPSWs in higher stories are very low. The results of the cyclic test showed well-defined hysteretic force-displacement behavior, but the energy dissipation was not close to what was expected. Vian et al. [32] investigated methods that were capable of designing special perforated ductile SPSWs.
Kharrazi et al. [33] suggested a numerical model to evaluate the shear and bending behavior of ductile steel plate walls by considering the plate–frame interaction. They assumed the behavior of a ductile SPSW consists of three stages: elastic buckling, post-buckling and yielding. The finite element analysis of SPSWs considering geometric nonlinearity and strain rate effects on a series of perforated panels developed by Bhowmick et al. [34] enabled engineers to better predict the yielding force of SPSWs. Under lateral loading, the SPSW undergoes out-of-plane and in-plane displacements. The infill plate folds in the out-of-plane direction, causing the generation of a tension field parallel to the principle tensile stresses, which eventually leads to the post-buckling resistance capacity [35]. Ghassemieh and Bamshad [36] studied and compared the energy dissipation of one-story SPSWs using finite element modelling. Maddahi et al. [37] studied the reliability index of rehabilitated structures with SPSWs and the obtained results showed that the rehabilitation of the damaged walls using steel web plates could improve their structural performance.
An analytical approach on predicting the behavior of SPSWs was performed by Berman and Bruneau [38]. The main goal of their study was to develop a practical design procedure for SPSWs that are not stiffened. The results showed that connecting the infill plate of an SPSW only to the beams causes it to have a lesser structural lateral load resisting capacity compared to the case where the infill plate is only connected to the columns. Vatansever and Berman [39] performed an analytical investigation on SPSWs with screwed infill plates. The implemented strip model in these cases accurately predicted the experimental model. The flexural behavior of beams in SPSWs was investigated by Qin et al. [40]. Bamshad and Ghassemieh [41] proposed a new analytical method for predicting the behavior of one-story SPSWs using the modified Ibarra–Krawinkler deterioration model.
Researchers have shown in the past that both semi-rigid connections and SPSWs individually have high energy dissipation capacity. Never has there been any work on whether implementing these two systems in a structure simultaneously would improve the behavior of the structure or not. One of the main issues of using SPSWs, as shown in Figure 2, is the strong-column weak-beam theory which results in designing large columns.
By implementing semi-rigid connections adjacent to the SPSW, which results in decreasing the actual flexural capacity of the beam end, it has been suggested that the strong-column weak-beam issue could be resolved. This paper focuses on a new structural system that has both SPSWs and semi-rigid connections and the best connection capacities that satisfy all the requirements for a designed structure.

2. Method of Study

The main objective of this study was to compare the seismic performances of steel frames including SPSWs and semi-rigid connections simultaneously. For this purpose, three rigid frames (5, 10 and 15 stories) with SPSWs included in their middle bay were designed. The height to width ratios for these frames were 0.46, 0.92 and 1.4. Figure 3 shows the top view and stories of the analyzed frames and Table 1 shows the thickness of the SPSWs and the sections of the columns and girders implemented in the frames. Standard sections made of steel grade S275 were used for the design of the elements and all of the frames had seven bays with 5.7 m spans and 3.2 m story height. The SPSWs were implemented in the middle span, and the semi-rigid connections were incorporated in the adjacent spans, as shown in Figure 3. The other spans had simple connections, which means that they did not resist any lateral loading.
OpenSees software was used for the modeling and nonlinear dynamic analysis of the frames. AISC360 [42] was used for the design of all rigid frames in this study. The dead and live loads were applied as linear and the static equivalent method was implemented by considering the base shear coefficient according to ASCE 7-16 [43] for considering the seismic loading. Three structures were assumed to be located on a Site Class B with a peak ground acceleration of 0.35 g. The columns, beams and SPSWs were designed. In other words, the demand/capacity ratio [42,44] for all of the members were either one or very close to one.
These frames were analyzed after the rigid connections were turned into semi-rigid connections and the same sections of the rigid frames were used. The sections were not designed again, since the goal of the study was to perform a comparison between the maximum demands on structures with the same basic elements (beams and columns), different ductility levels and connection capacity. In this study, semi-rigid connections with different levels of rigidities (100%, 80%, 60%, 30% and 0% rigidities) were considered for the connection of beams to columns in the two bays that were adjacent to the middle bay that had the SPSWs included (Figure 3). It is worth mentioning that the rigid connections were based on FEMA356. The modeling parameters and acceptance criteria for the nonlinear procedures of the connections (including fully restrained moment connections such as reduced beam section (RBS) connection, which was used in this study [45]) and the nonlinear behavior of the semi-rigid connections were based on the experimental data gained by Stelmack et al. [46]. Zero-length elements were implemented for the modeling of rigid and semi-rigid connections. The seismic performance of these frames was analyzed in relation to five earthquake records, as presented in Table 2. The maximum story drift, story acceleration and base shear of the frames were compared to each other to find the best seismic performance of the frames.
The hinges defined in FEMA 356 were used for the modelling of rigid connections. In order to simulate the semi-rigid connection behavior, a two-state linear curve (Figure 4), as suggested by Bayat and Zahrai [19], was considered for the modelling of frames. This method did not consider the fracture mechanism of the semi-rigid connections and the connection capacity was defined as the ratio of the connection’s plastic moment capacity to the beam’s plastic moment capacity. The yielding of the semi-rigid connection occurred at 0.003 radian (60% of the beam’s plastic moment capacity) and the ultimate rotation was considered to be 0.05 radian. The connections between a steel beam and floor slab provide further energy dissipation [47]; however, for the sake of simplicity, this was not considered in the present study.
The Rayleigh damping was implemented by considering 5 percent damping for the first mode and the modes that had a 90% modal mass participation. FEMA356 [45] was used for the nonlinear analysis and the frames were designed based on the design criteria of AISC341 [48] and AISC360 [42]. The dead load was 5 kN/m2 and the live load was 2 kN/m2 for all of the stories except from the roof. Moreover, the roof was assumed to have a dead load of 4 kN/m2 and a live load of 1.5 kN/m2.
Since the beam-to-column connection was assumed to be rigid in the suggested dual system with special moment frame and the steel plate shear wall, the authors conducted the preliminary design with rigid beam-to-column connection assumption. It is worth mentioning that the effect of semi-rigid/partial strength connection was considered in the nonlinear dynamic analysis in this study. To capture the behavior of the SPSWs, multiple-tension left- and right-leaning strips with the same inclination angle were added to the frame in a way that accounted for the reorientation of the tension field as the loading direction changed. In order to consider the perforated holes in the SPSW, the strip area for each truss was defined in a way so that the width was from center to center from the opening. The following equation was used for determining the angle of the strips, and α was found according to Equation 17-2 in AISC 341 [48]:
tan 4 α = 1 + t w L 2 A c 1 + t w h 1 A b + h 3 360 I c L
where h is the distance between HBE centerlines; Ab is the cross-sectional area of an HBE; Ac is the cross-sectional area of a VBE; Ic is the moment of inertia of a VBE; and L is the distance between VBE centerlines. Based on Equation (1), the design strength of the infill web plates could be determined according to AISC 341 [48]:
V n = 0.42 F y t L c f sin 2 α
where L c f is the panel width between column flanges. The effective panel stiffness reduction factor ( K p e r f o r a t e d K p a n e l ) was determined using the following equation [32,48]:
K p e r f o r a t e d K p a n e l = 1 π 4 D S d i a g 1 π 4 D S d i a g 1 N r D sin α H p a n e l
where H p a n e l is the panel height, D is the diameter, N r is the number of rows; and S d i a g is the spacing of the perforations.

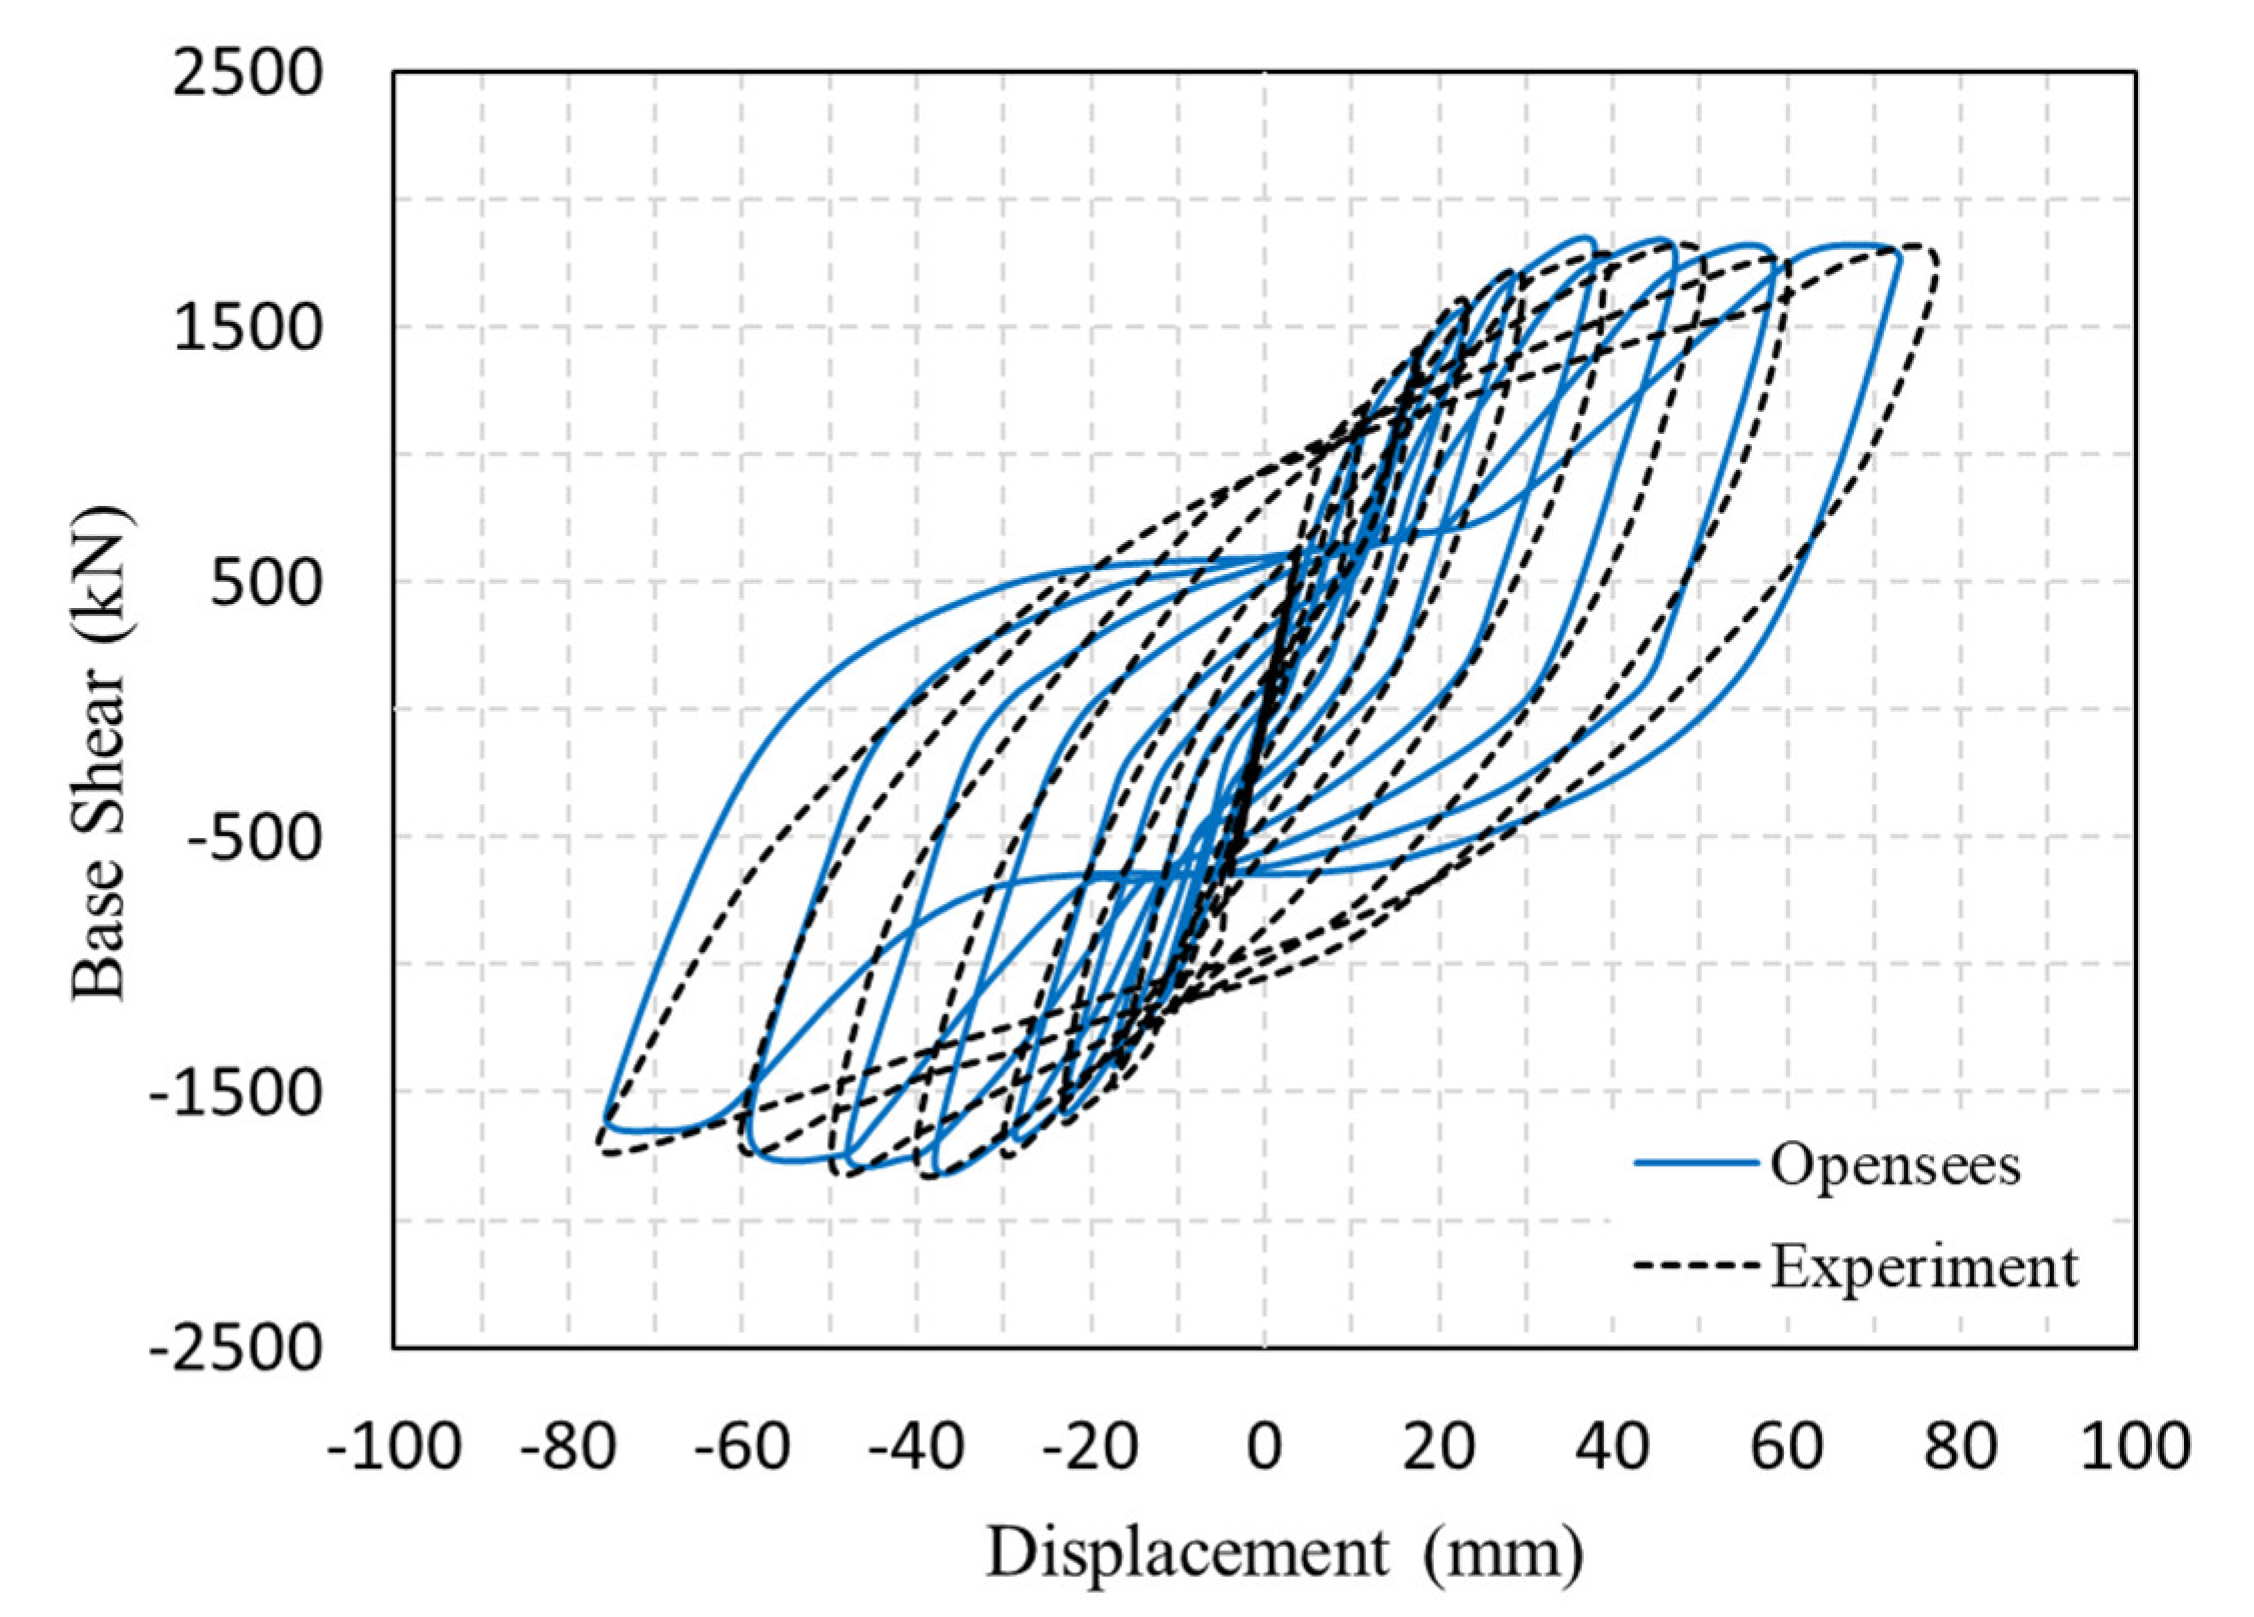
3. Numerical Model Verification

The frames that were modelled in OpenSees consisted of semi-rigid connections and SPSWs. In order to have assurance of the behavior of these elements, the numerical verification of the experimental models consisting of semi-rigid connections and SPSWs was performed separately.

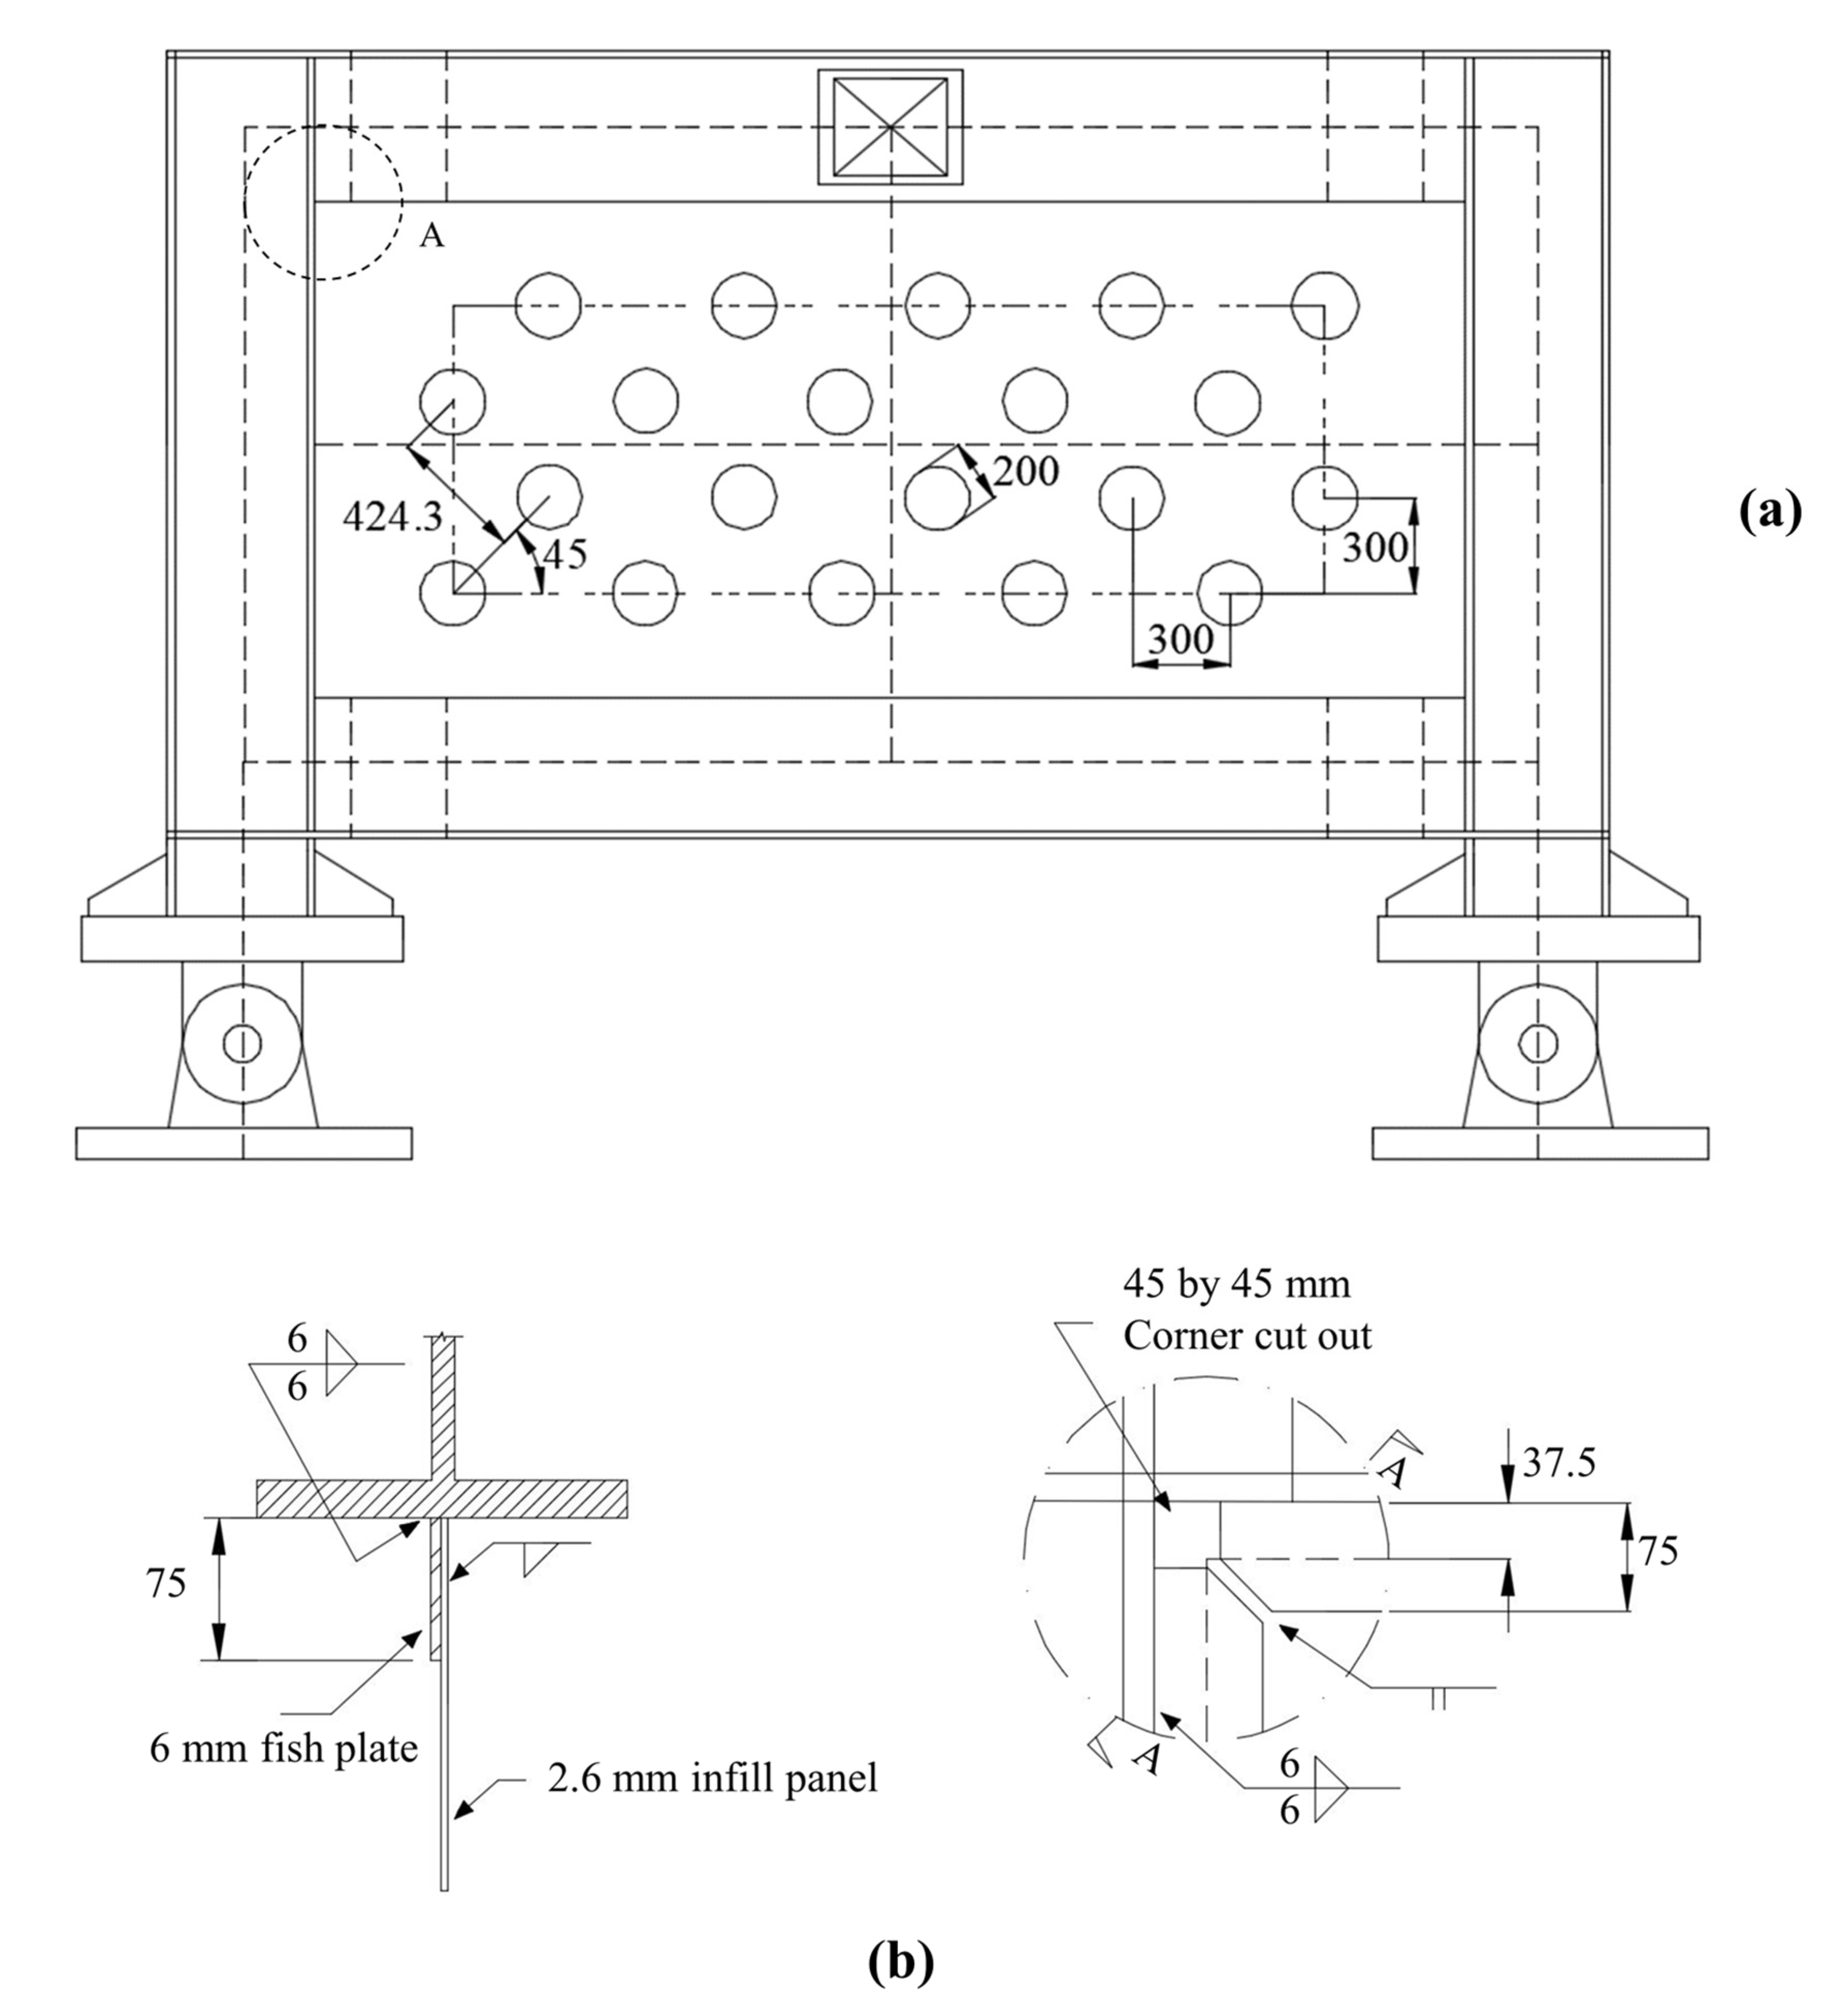
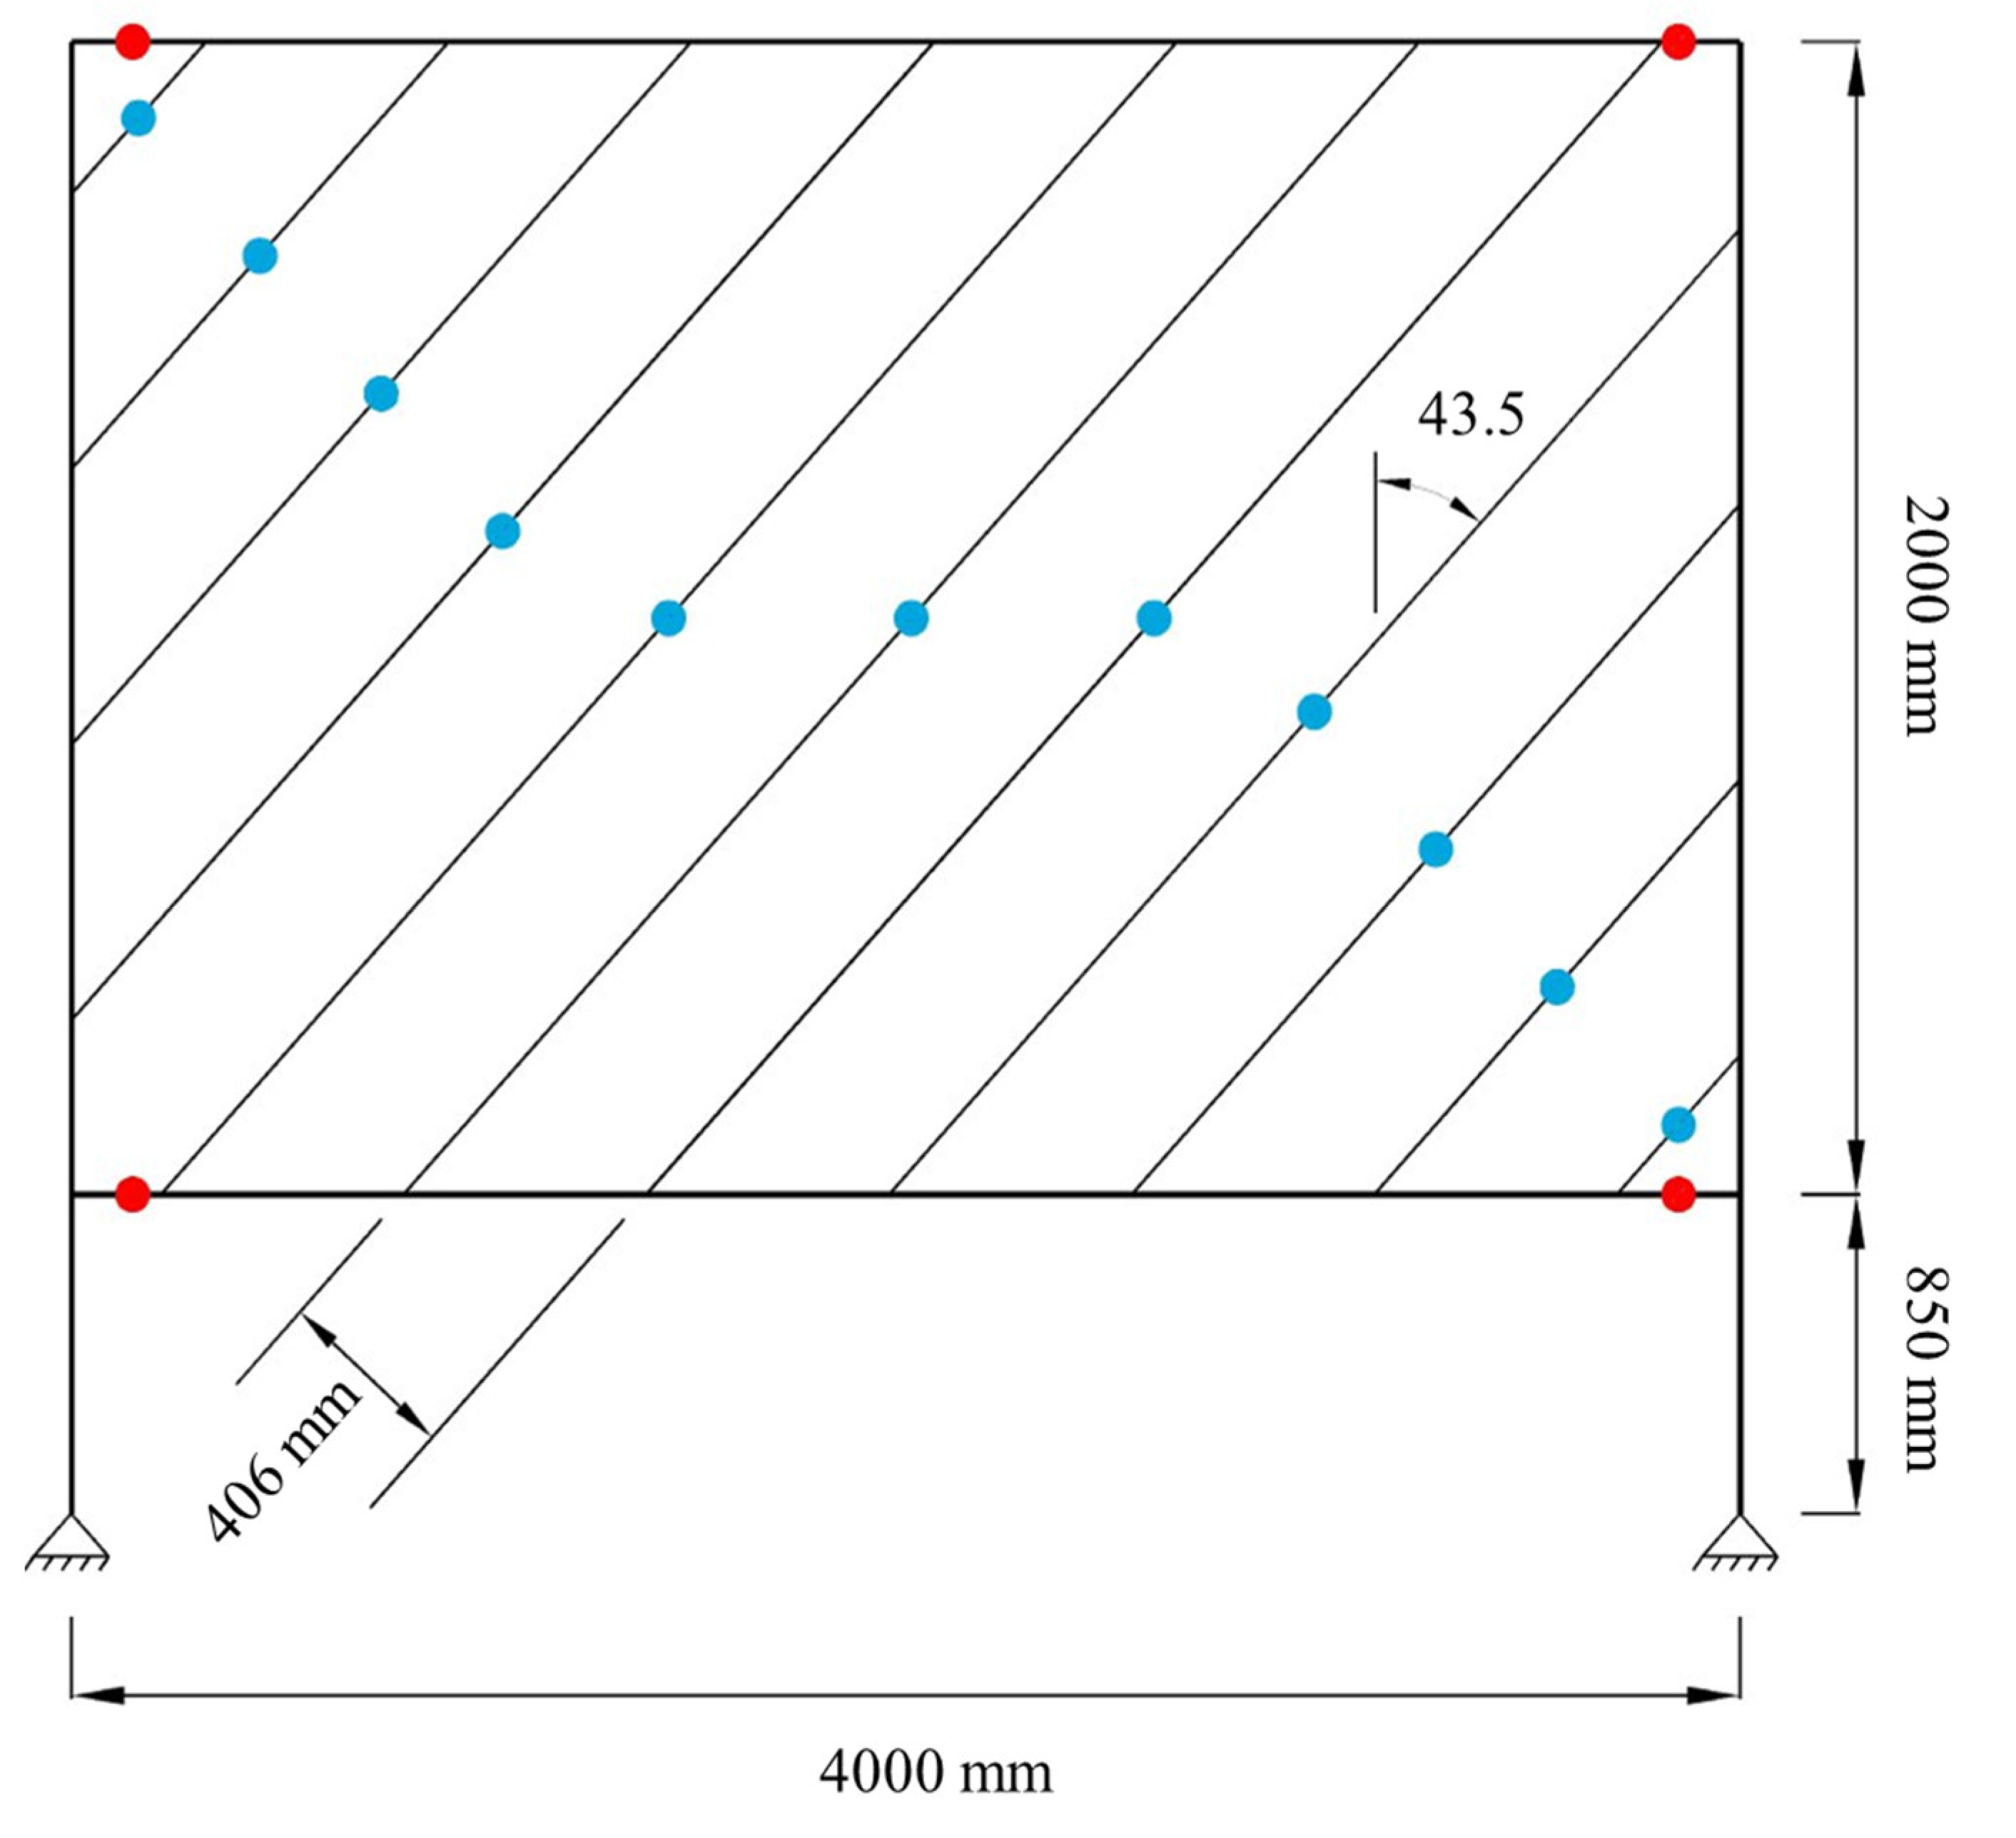
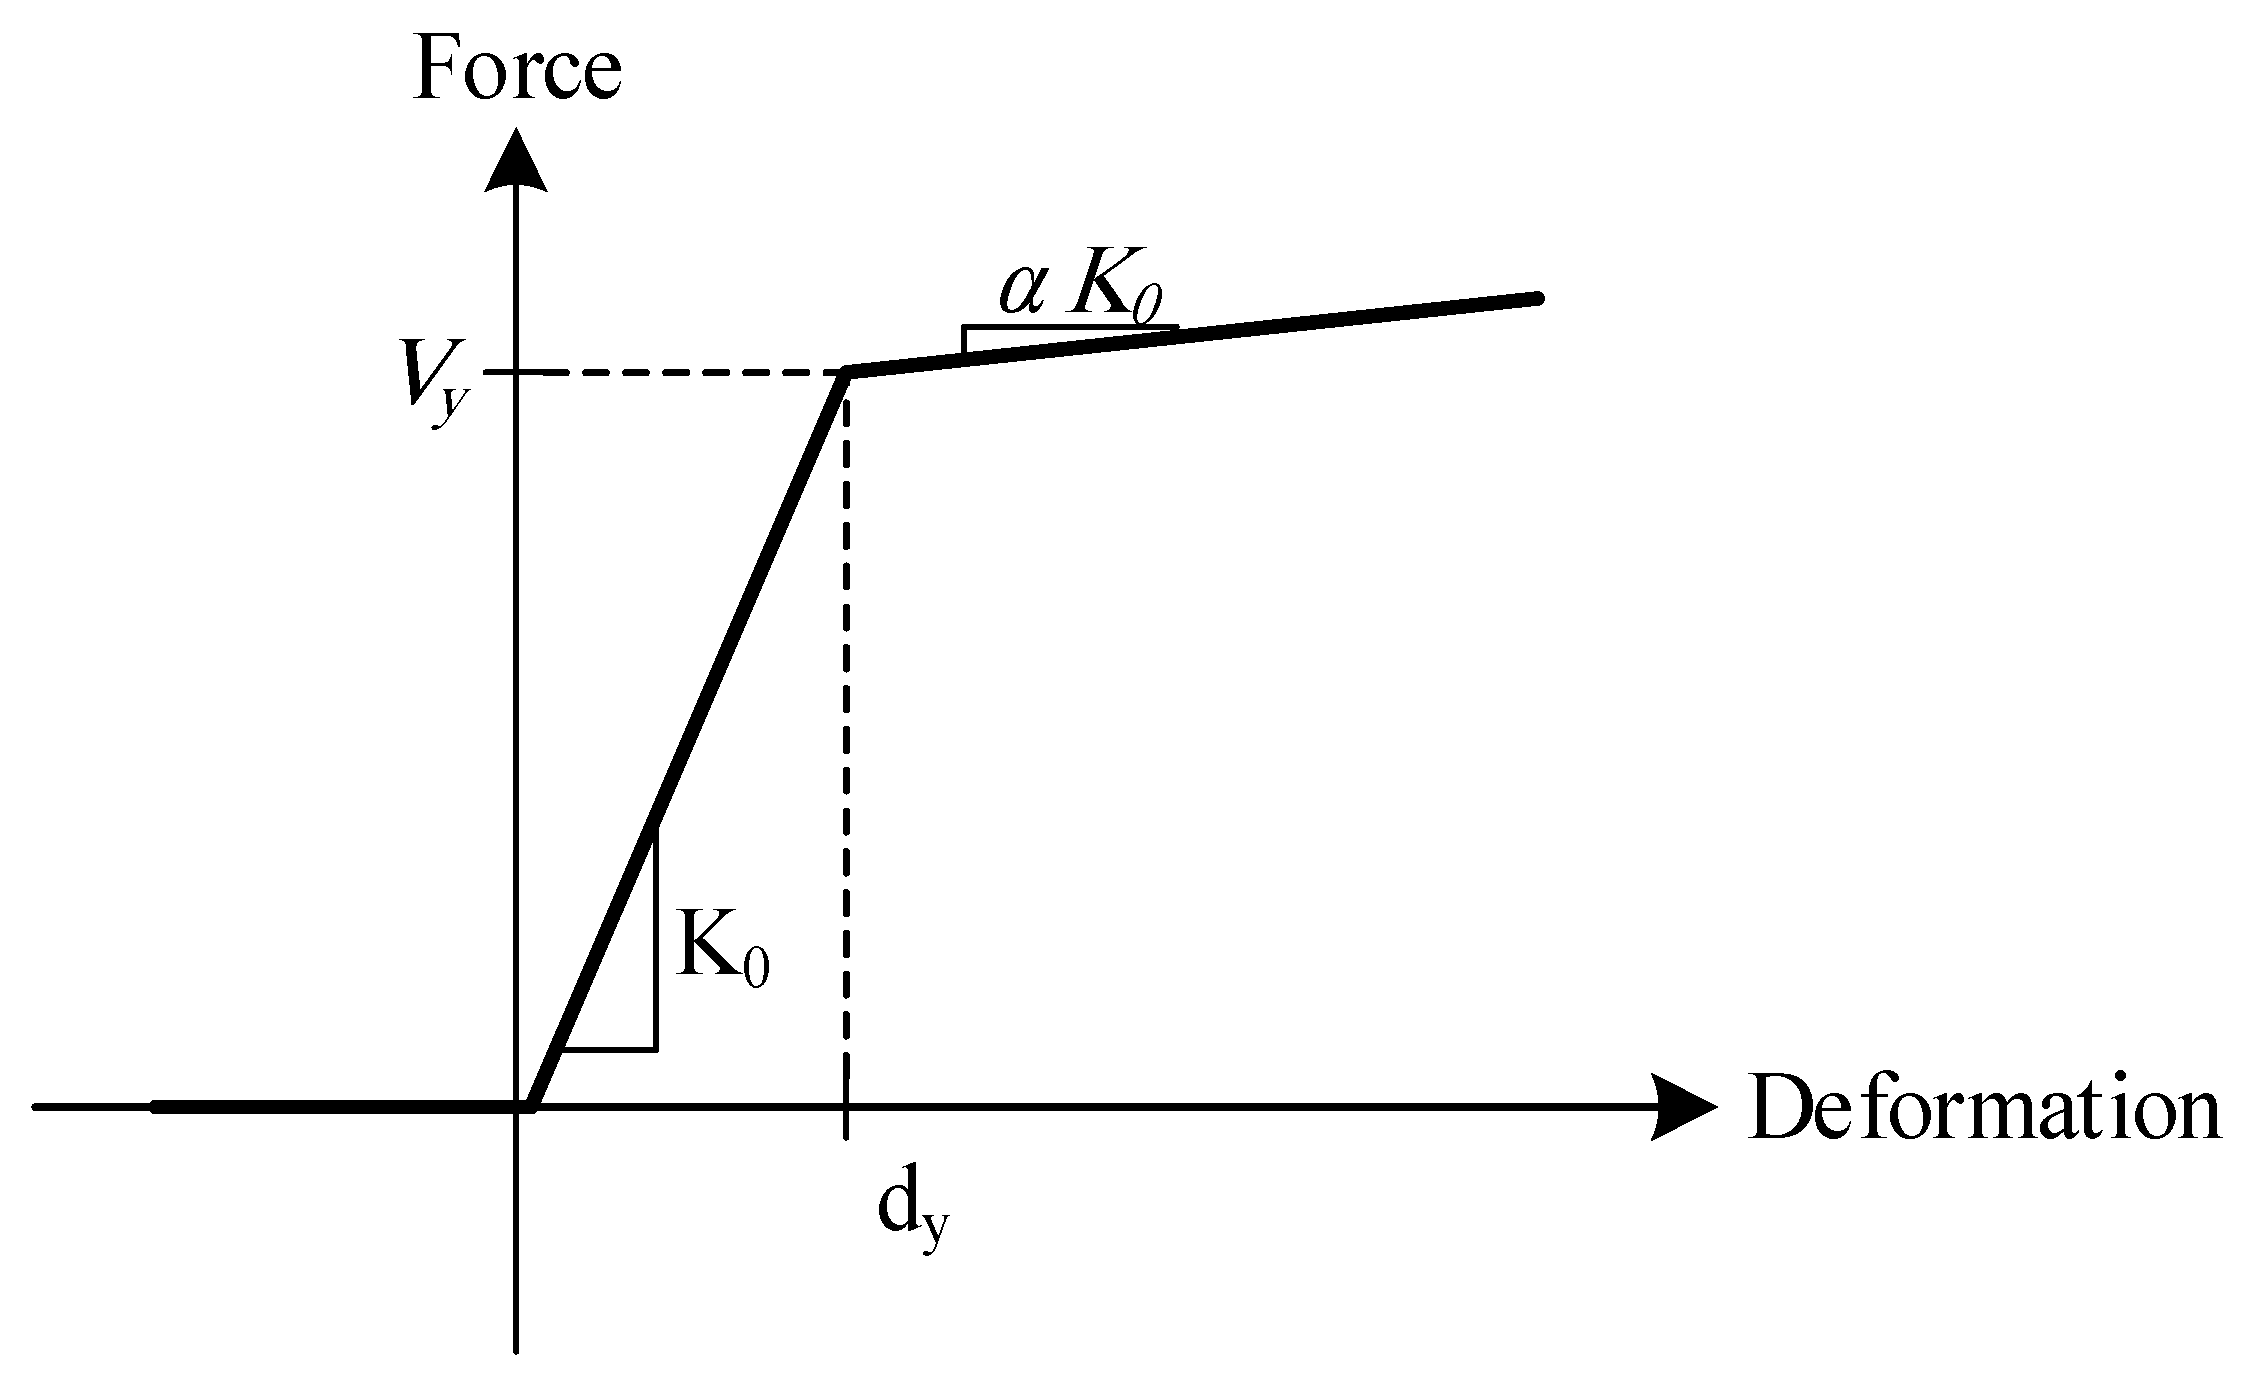
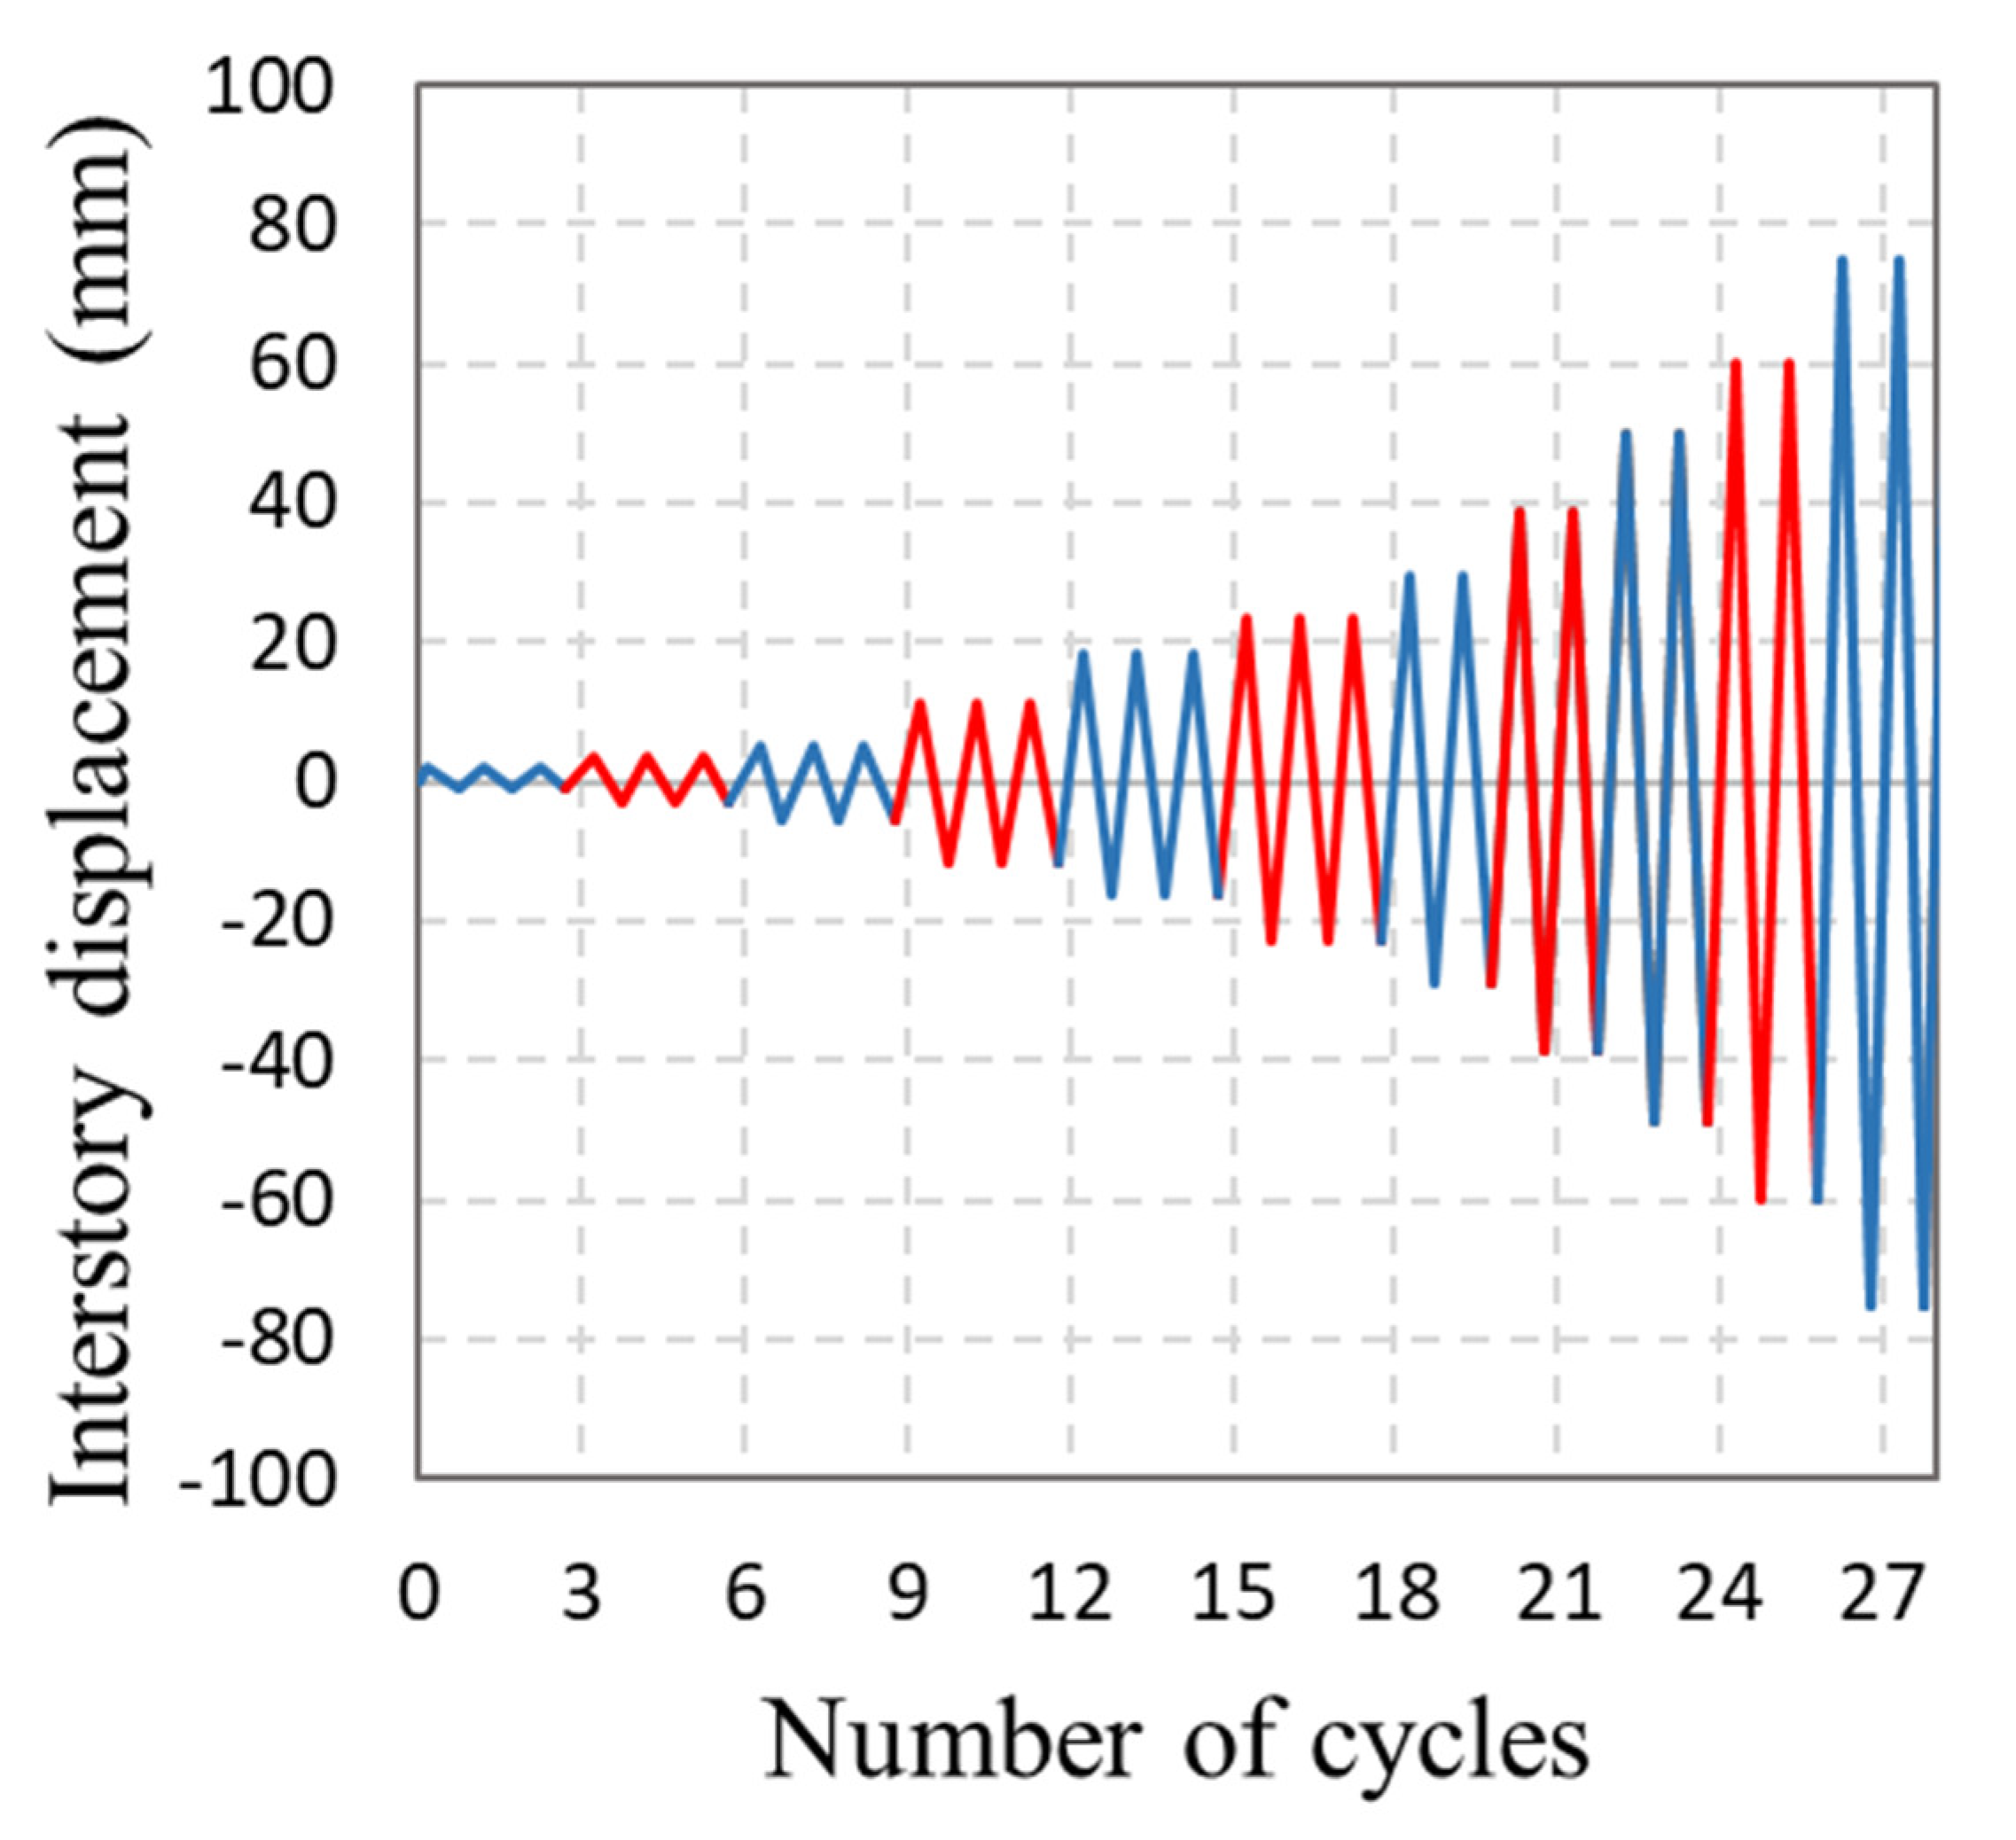
3.1. Single-Story SPSW

A calibration was conducted on a one-story SPSW model experimented by Vian et al. [32], as shown in Figure 5, to prove the validity of the method used for modelling SPSWs. The infilling plate had a thickness of 2.6 mm, and the length of the VBE and HBE were 2000 mm and 4000 mm, respectively. In the experimental model, W18 × 65 and W18 × 71 sections were used for the HBE and VBE, respectively. The experimental SPSW and its connections are shown in Figure 5. ASTM A572 Grade 50 steel [49] was used for the construction of the HBE and VBE members. The connection type of the single-story SPSW was rigid. Reduced beam section (RBS) connection was used in this section. The SPSW specimen showed ductile behavior and the main plate between the boundary conditions developed substantial plastic deformations. Strength reduction was observed because of the fractures occurring in the connecting welds between the fish plates and the main infill plate. Moreover, no failure was observed in the HBE or VBE elements. As reported by Vian et al. [32], the yielded base shear, initial stiffness and maximum inter-story drift of the SPSW specimen (specimen P) were 850 kN, 115 kN/mm and 0.3%, respectively.
OpenSees was used to model the assembly shown in Figure 5. According to the test configuration, all the connections used between the beams and columns were fixed and welded. As discussed previously, the hinges defined in FEMA 356 [45] were used for the modelling of rigid connections. Lateral force was applied to the top-middle of the SPSW specimen by a hydraulic jack. Moreover, lateral supports were used on both sides of the SPSW to stop out-of-plane displacements. The frame in Figure 6 is a strip numerical model which was developed to capture the behavior of the shear wall. An elasto-plastic material model was individually assigned to the infill plate, VBEs, and HBEs to correctly capture the behavior of the SPSW. The determination of the angle of the strips, α, was found according to Equation (1).
According to Shishkin et al. [50], multi-linear plastic hinges have a small effect on capturing the nonlinear behavior of an unstiffened SPSW. Therefore, bi-linear plastic hinges were considered to simulate the nonlinear behavior of the strips. The axial hinges did not have any compression strength. The properties of the axial hinges for the tension strips are shown in Figure 7 and Table 3. In accordance with the experimental model, the ATC-24 [51] loading guideline was used, as presented in Figure 8.
The resulting force-displacement hysteresis of the experimental and numerical model is shown in Figure 9. In this figure, the pinching effect can be more clearly observed for the numerical model than the experimental results. According to the steel material used for the SPSW in software, this effect is understandable. In general, the numerical and experimental model agreed well with each other and captured the degradation backbone very well. The numerical validation of the SPSW in terms of maximum base shear, energy dissipation and unloading stiffness for each loading cycle is shown in Table 4.

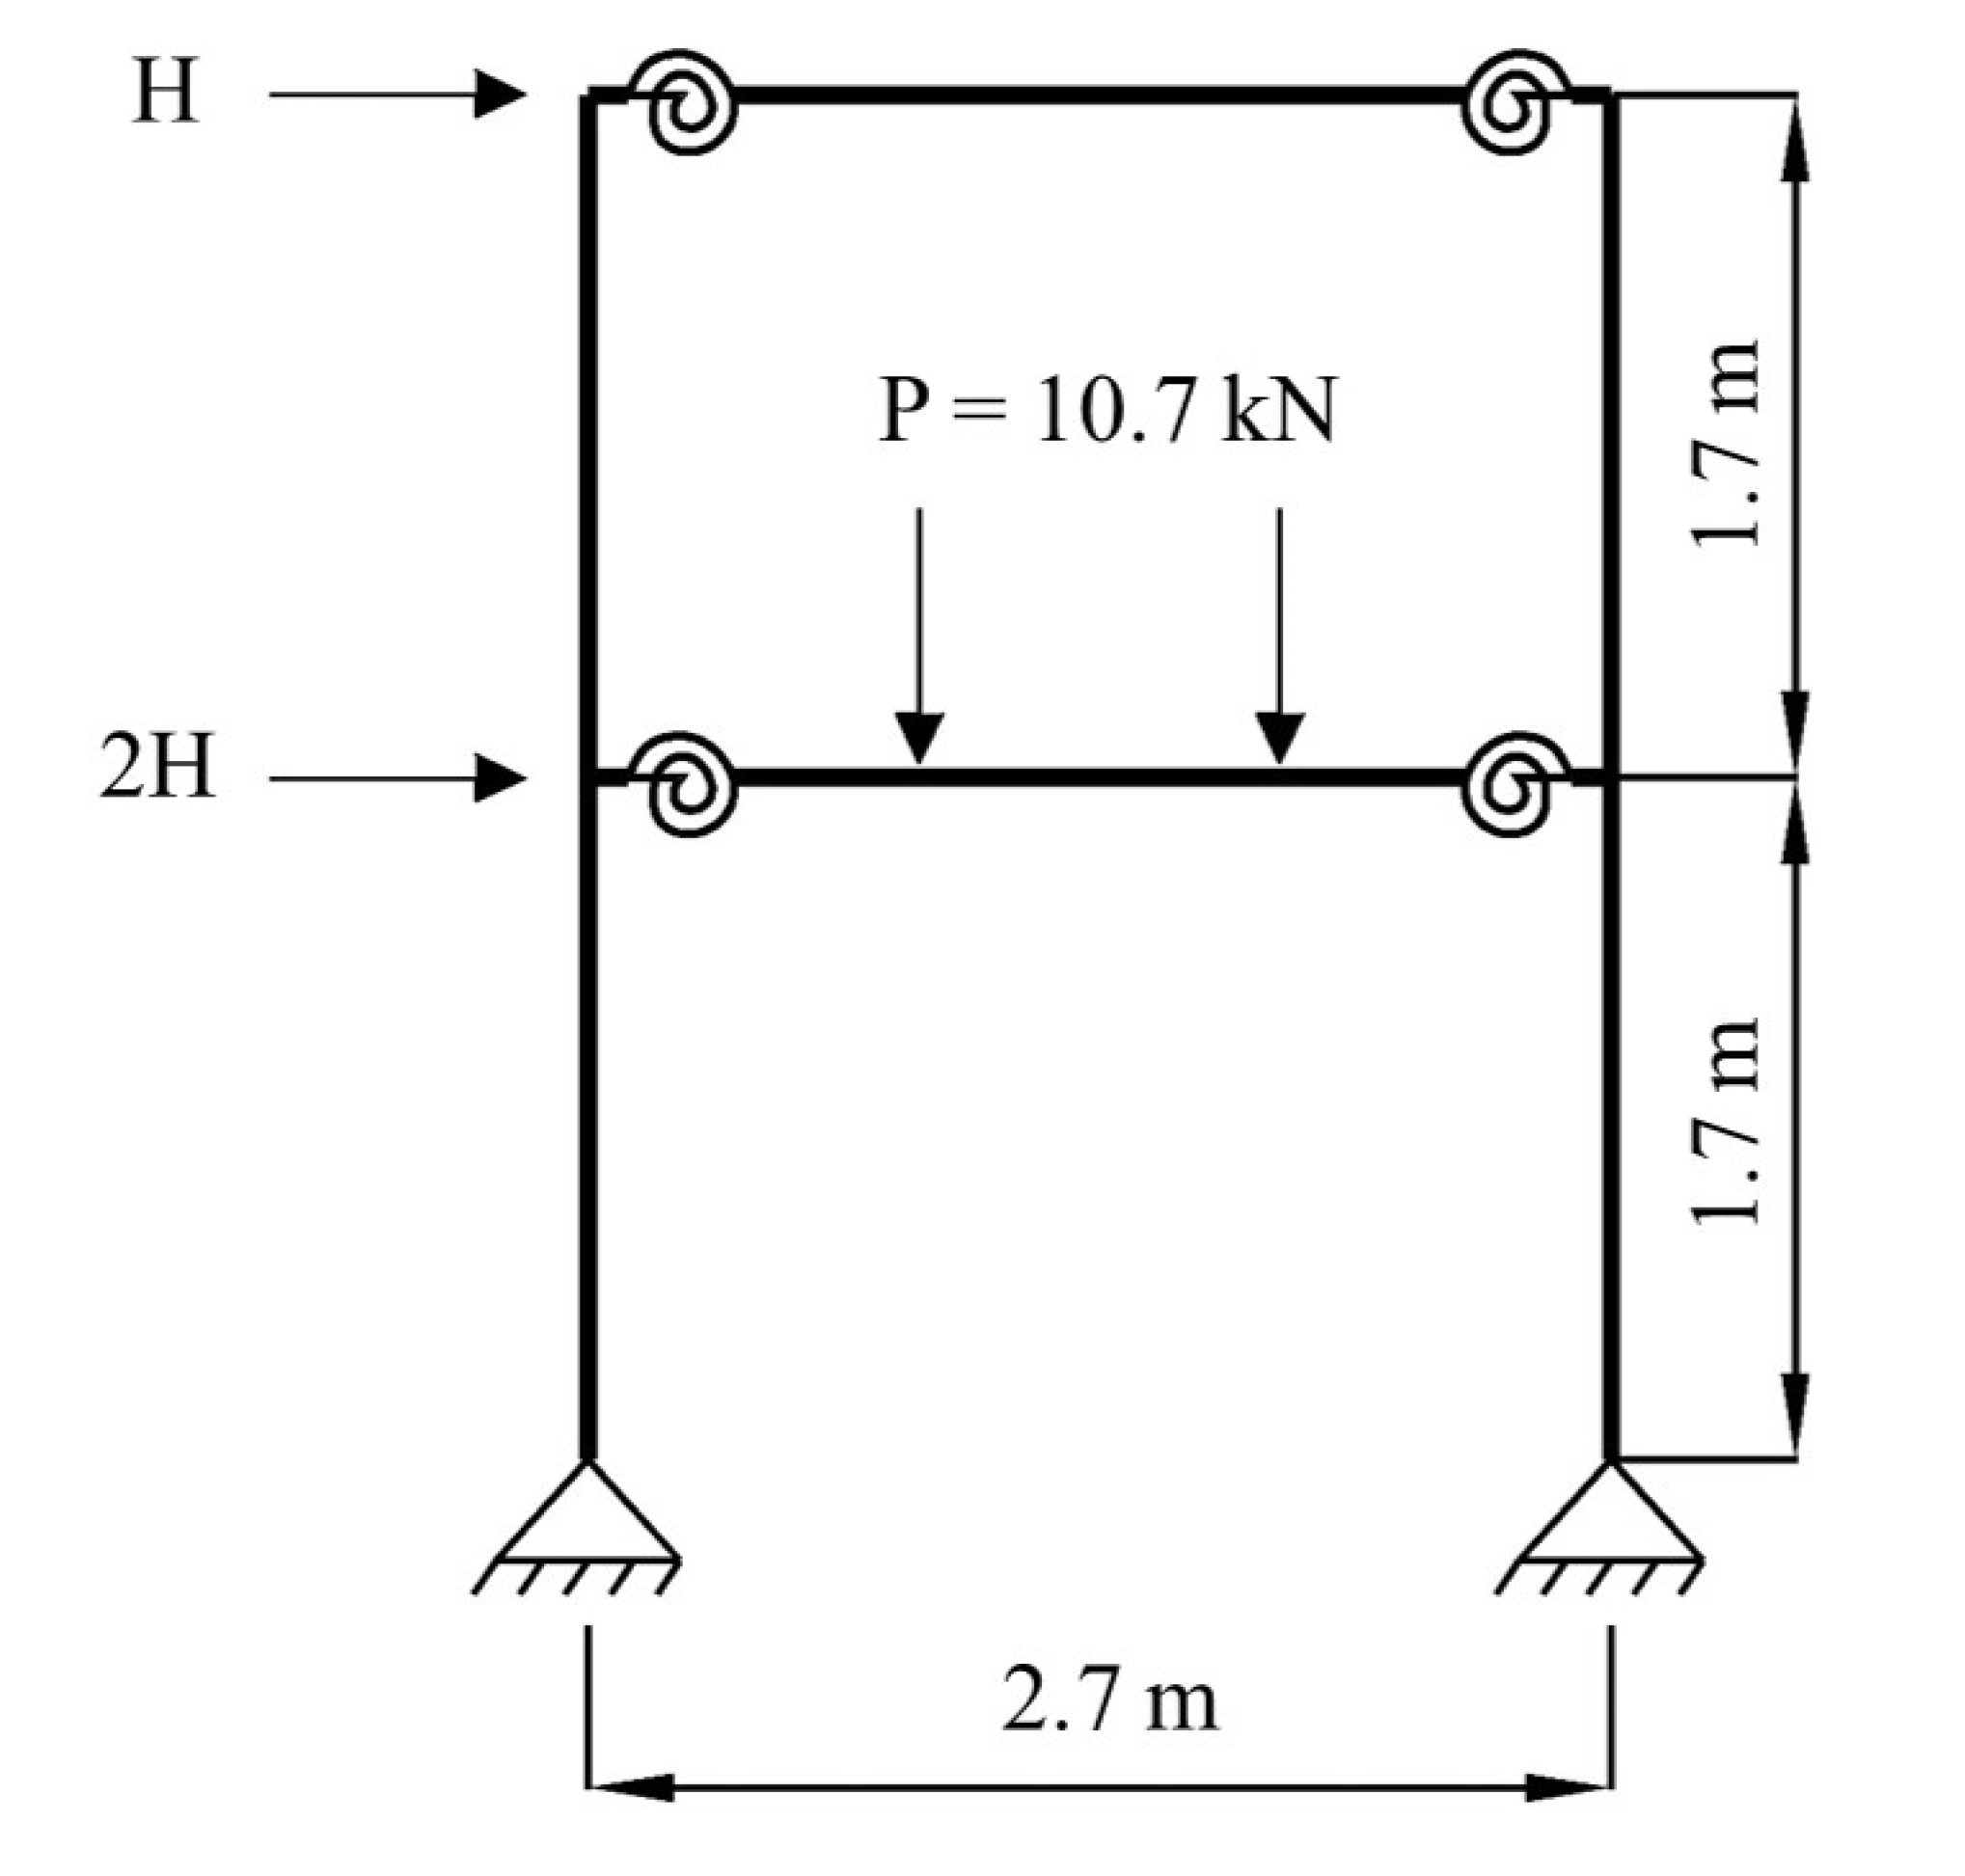
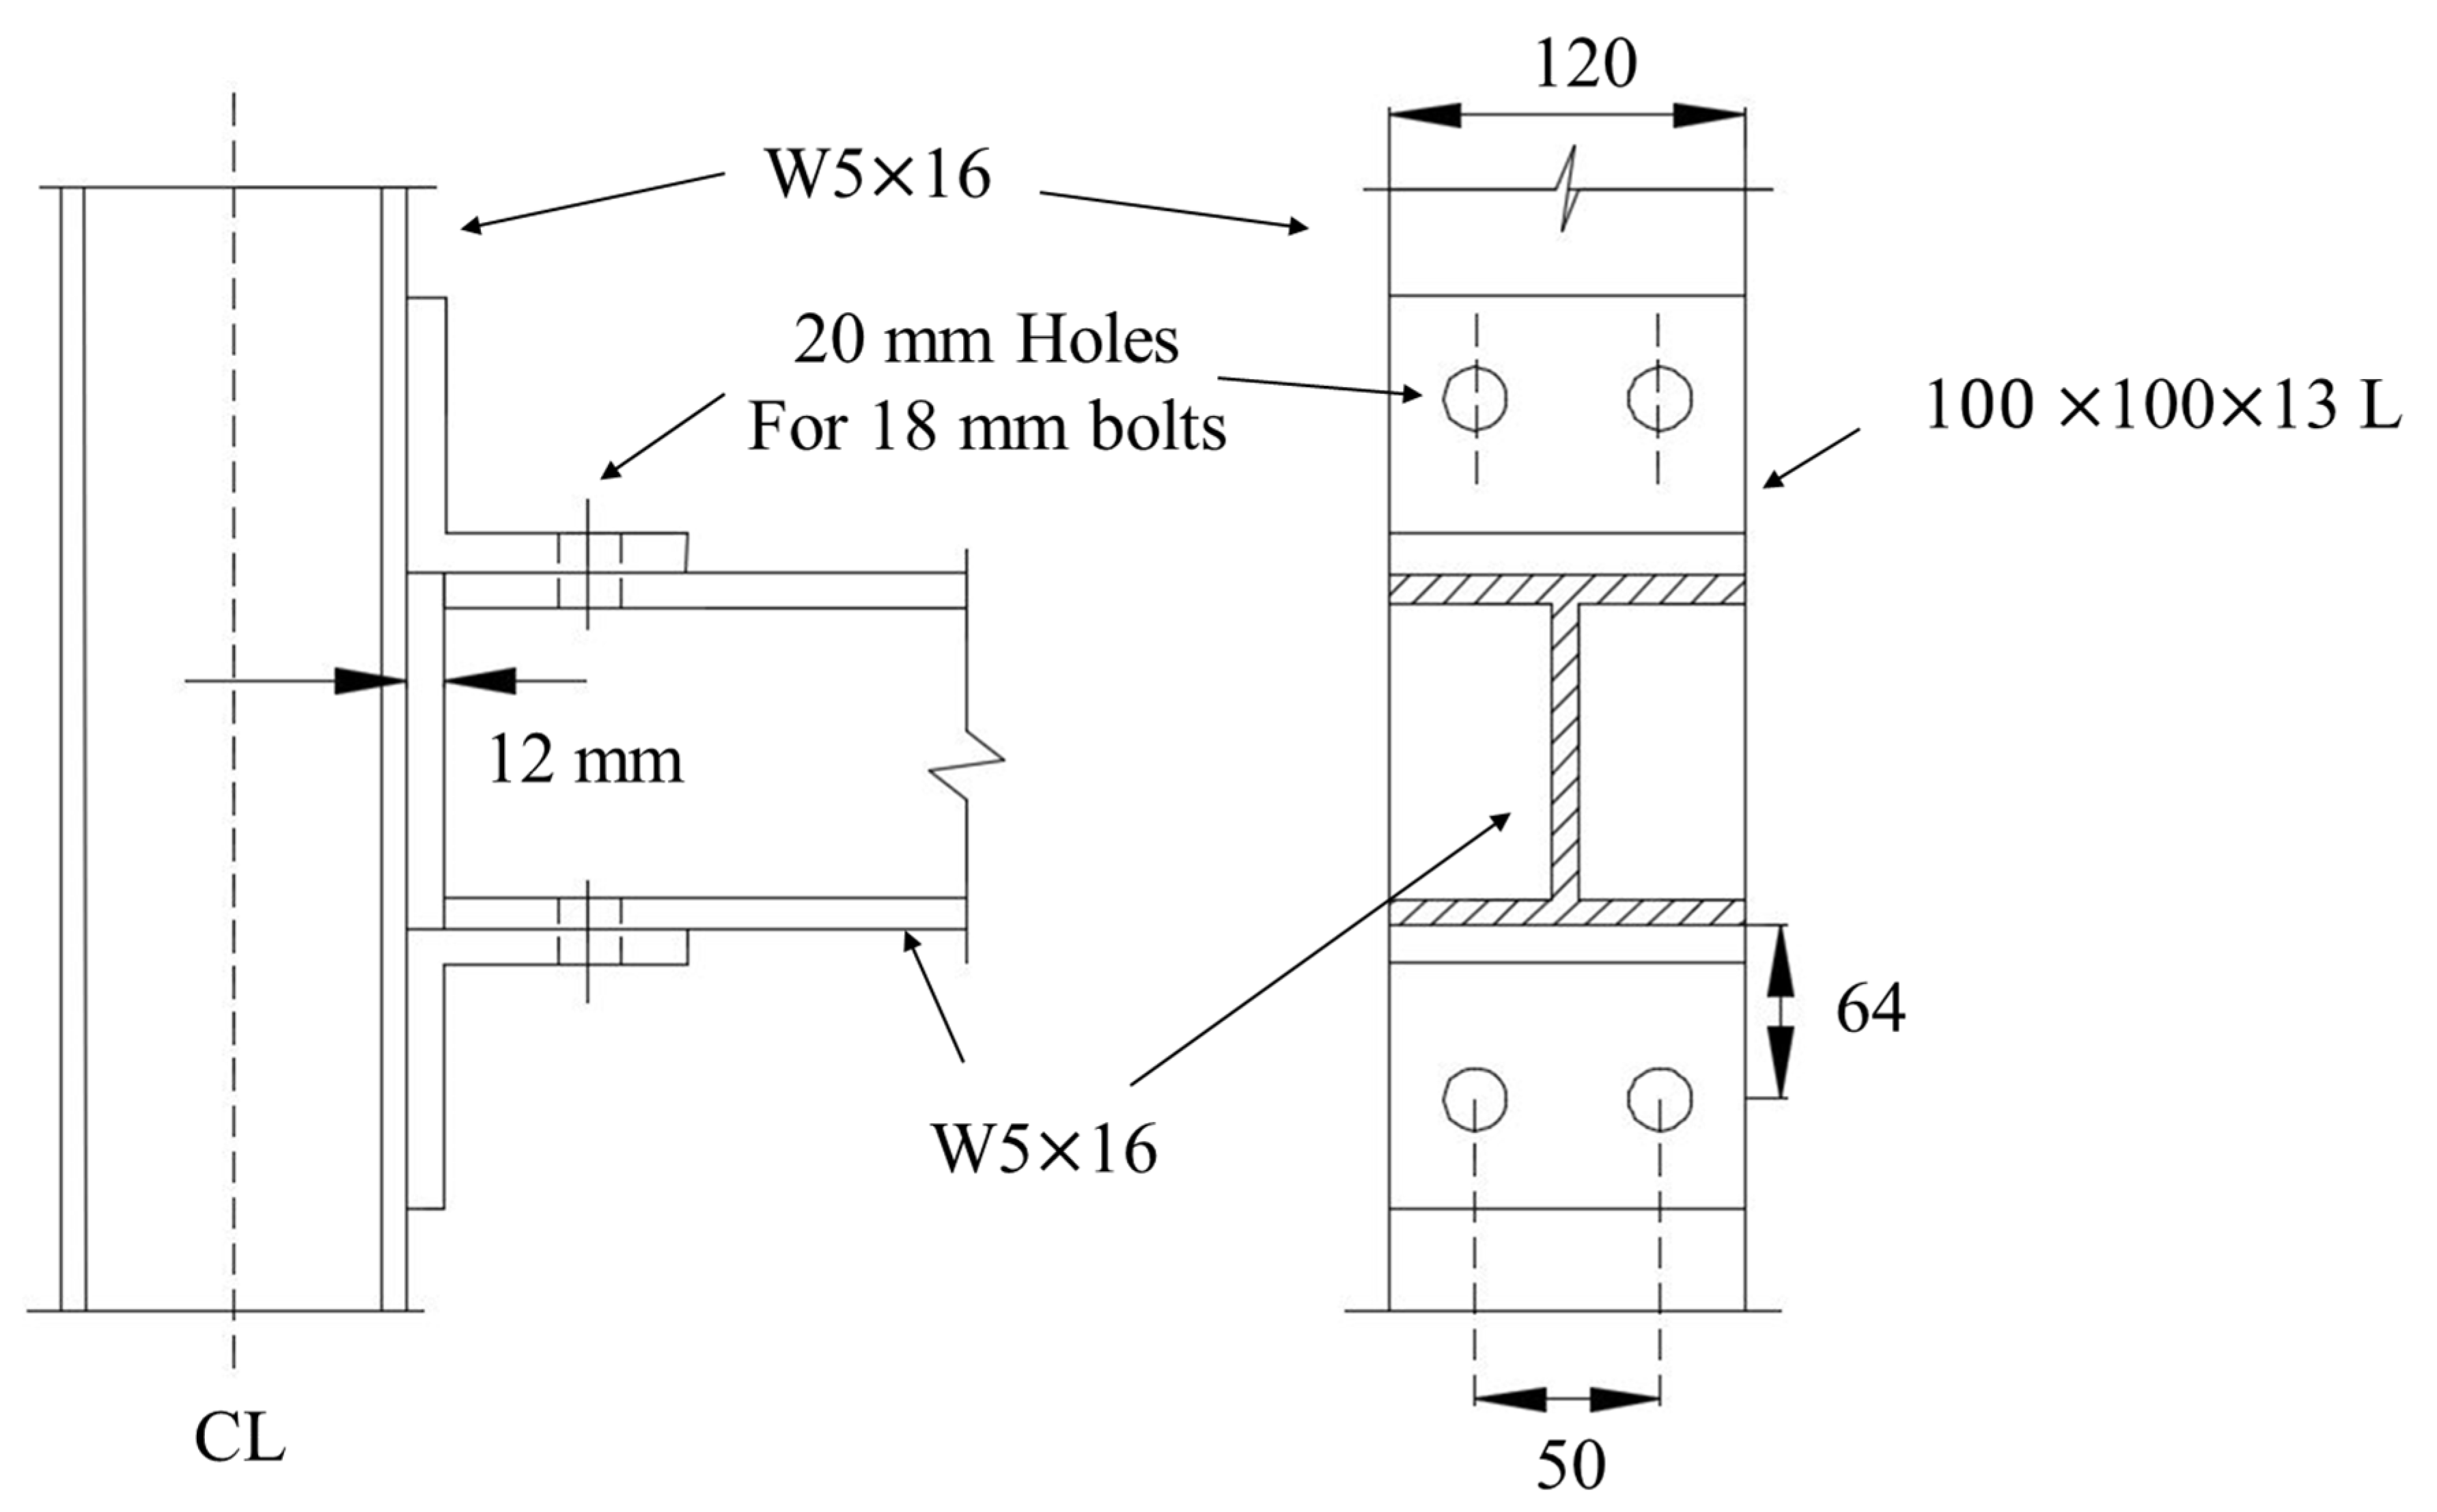
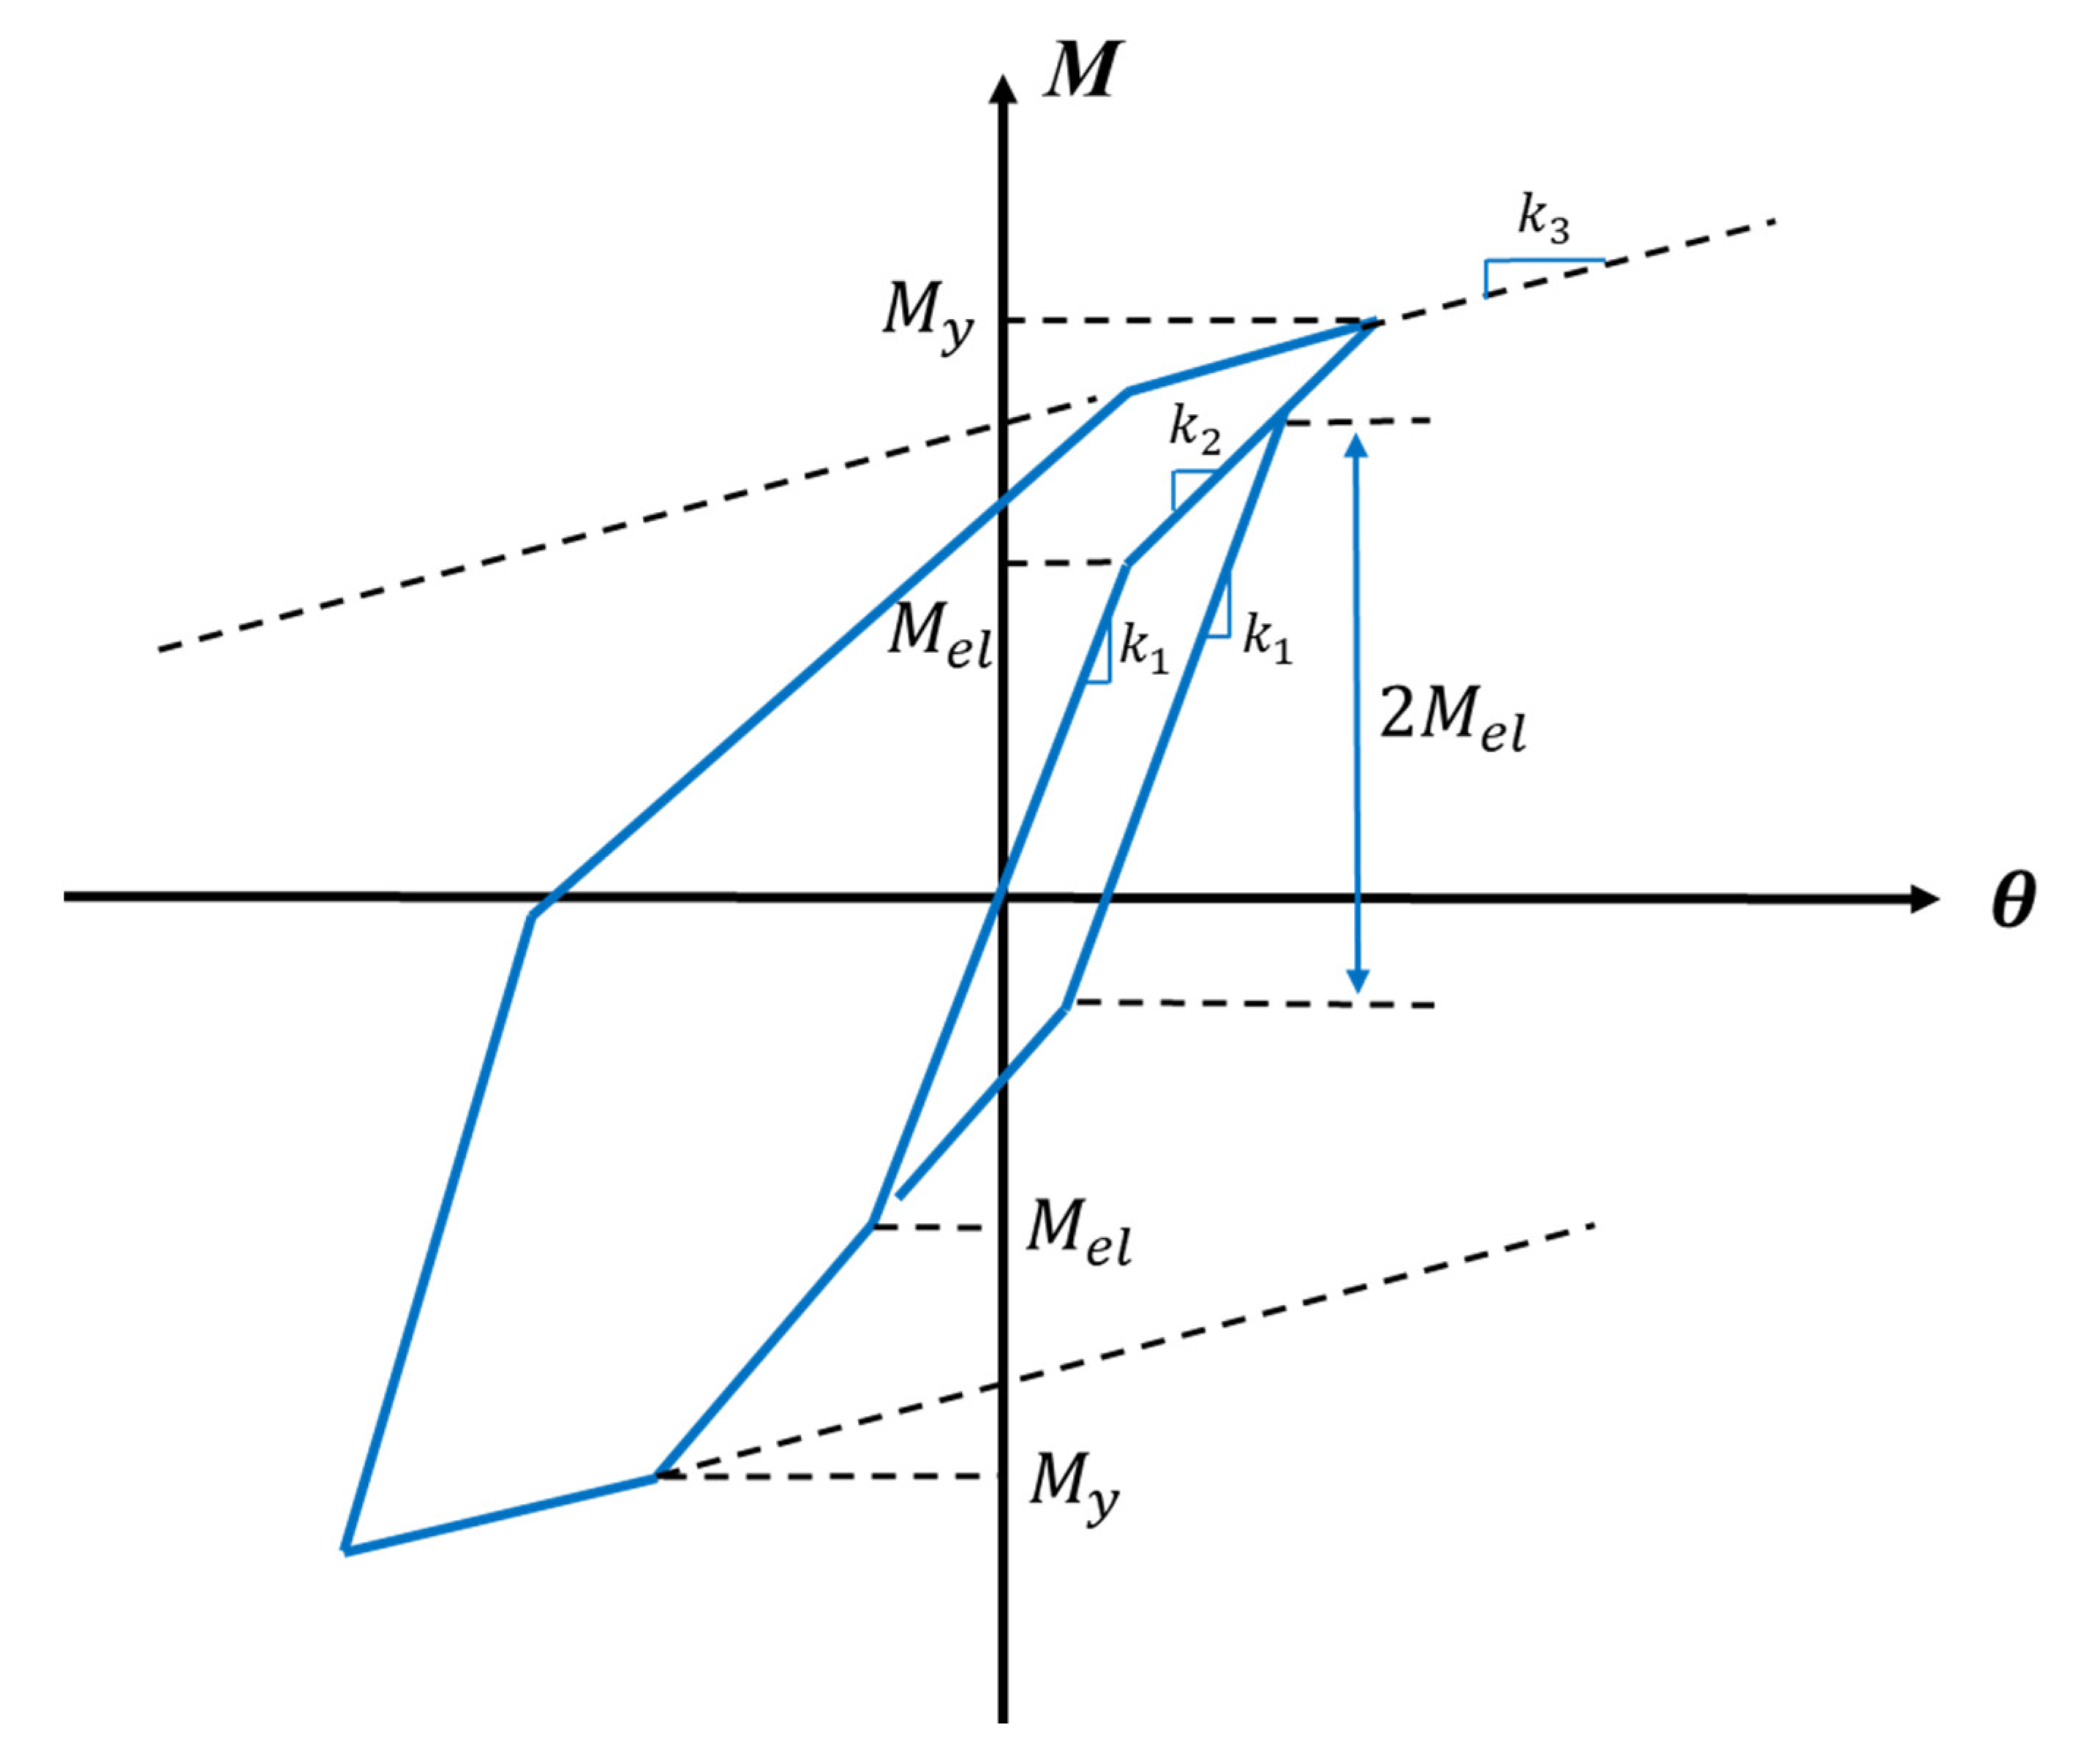
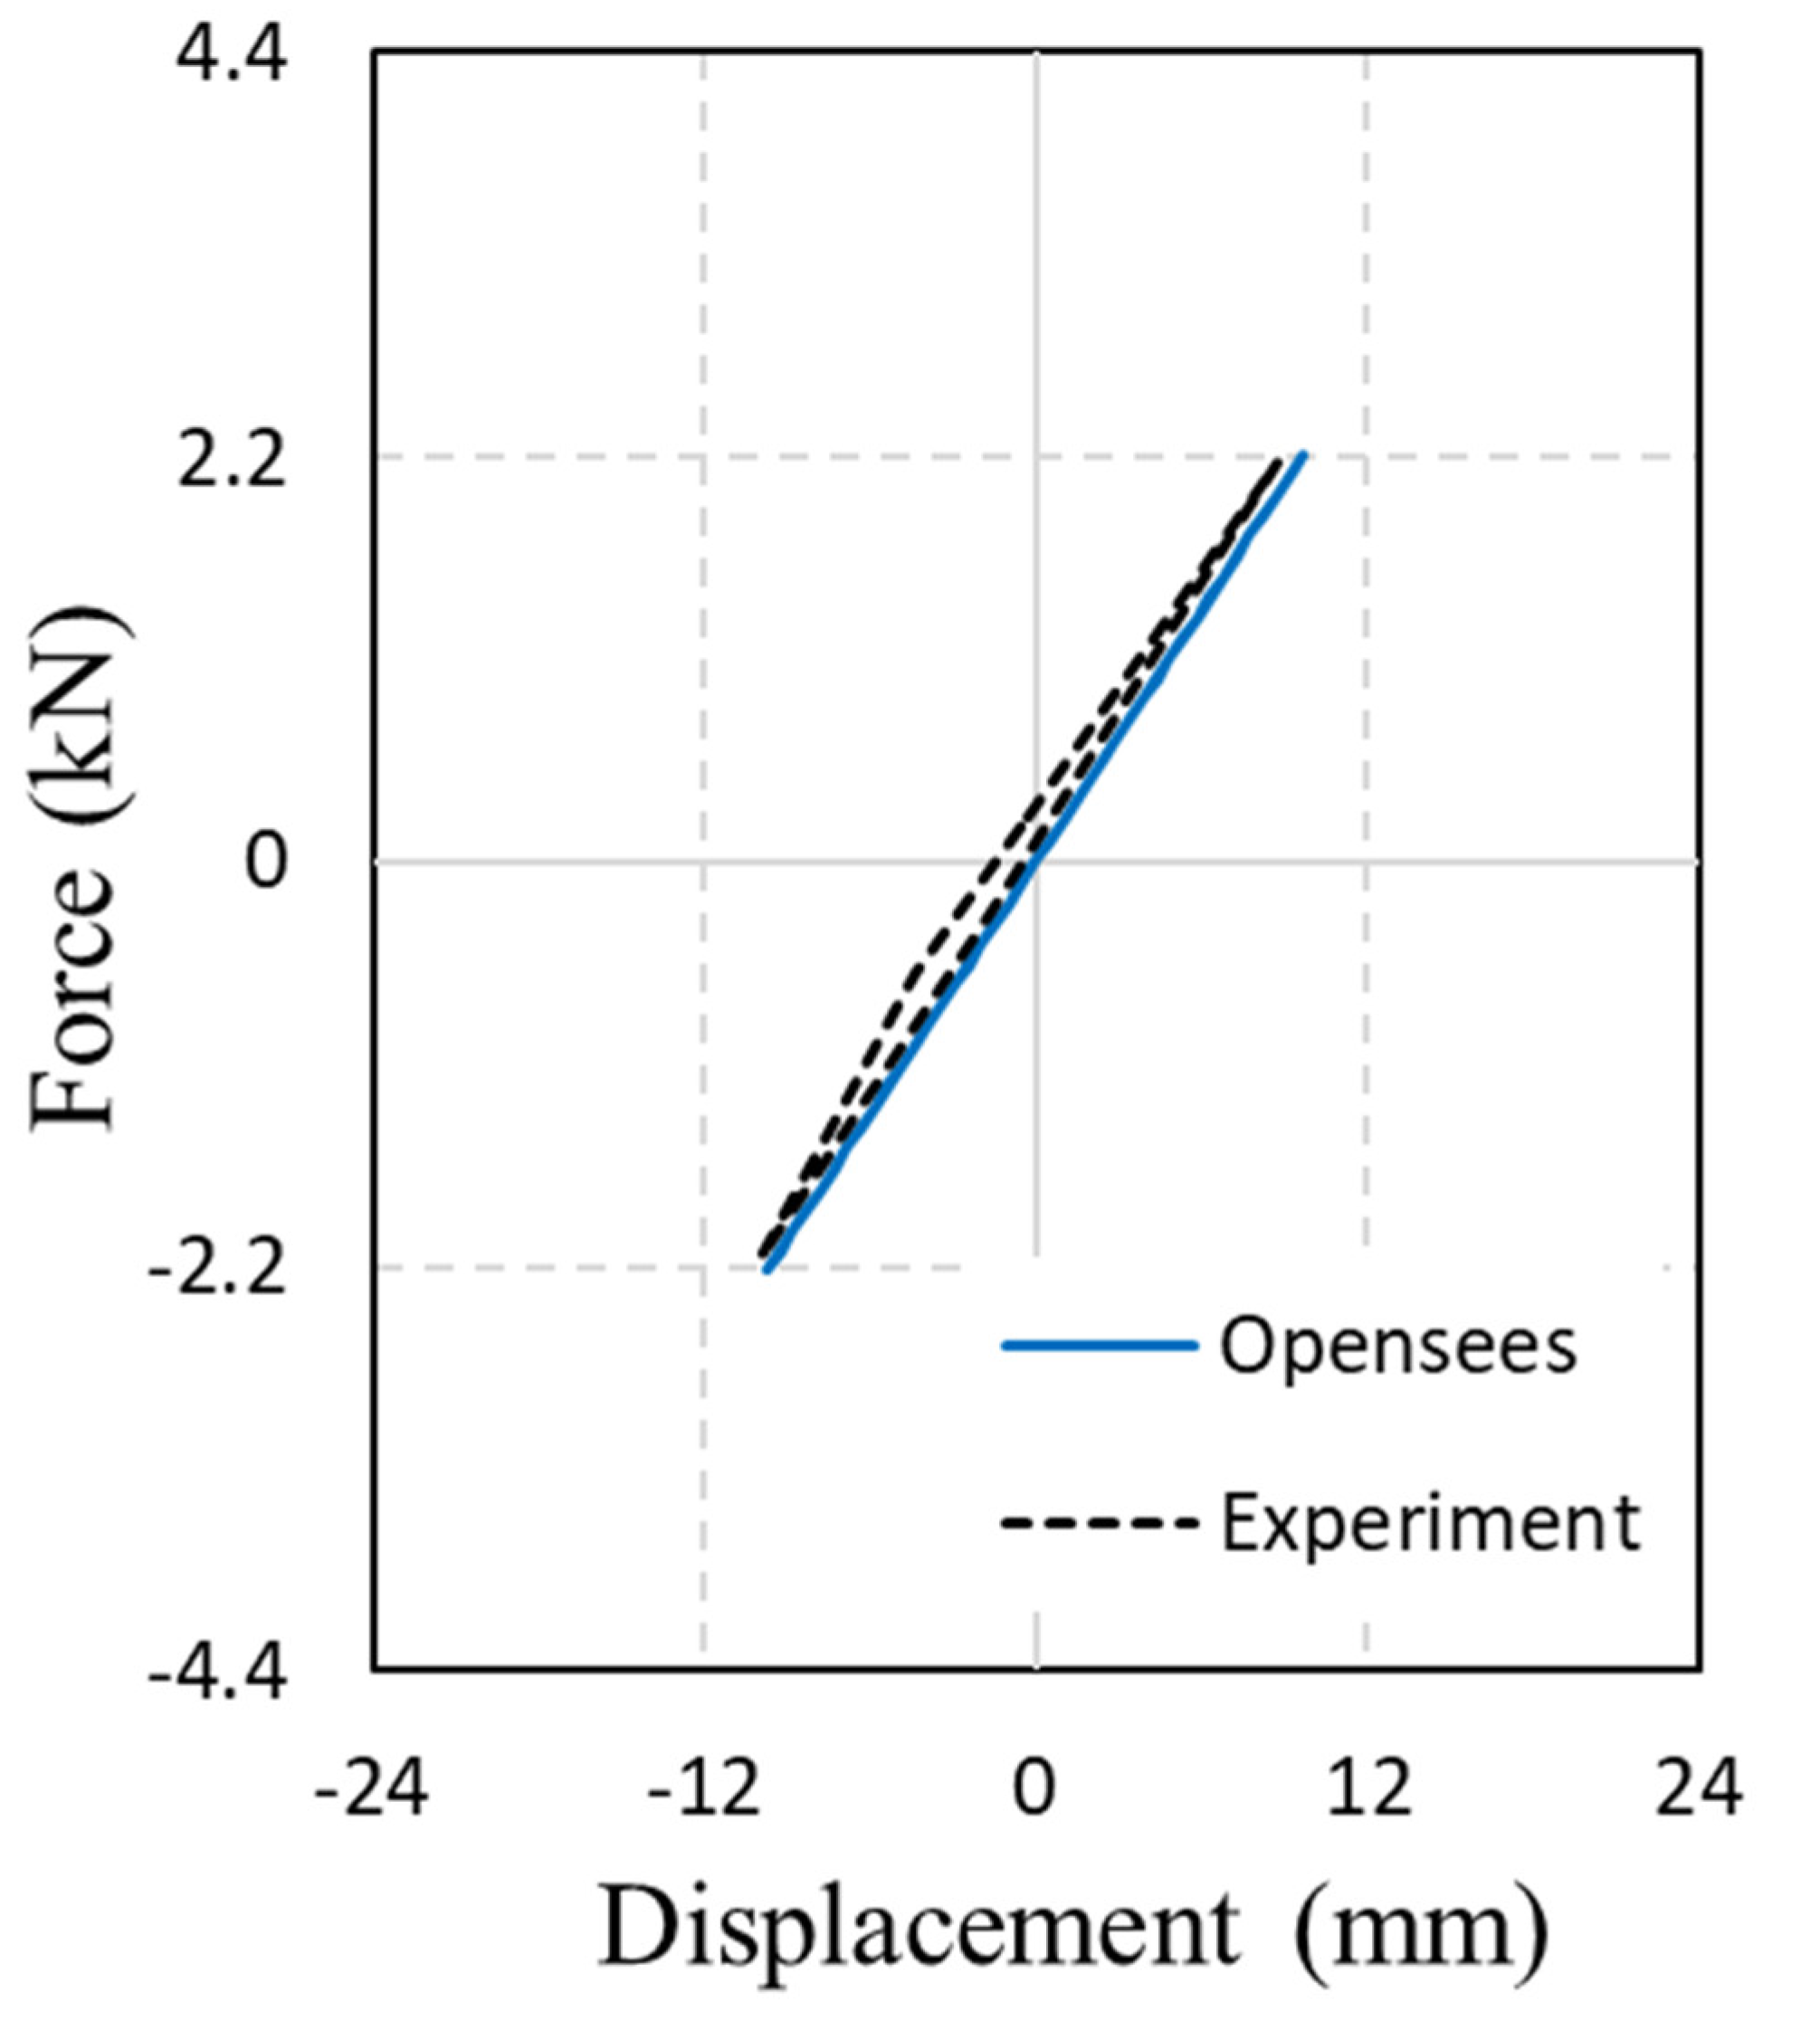
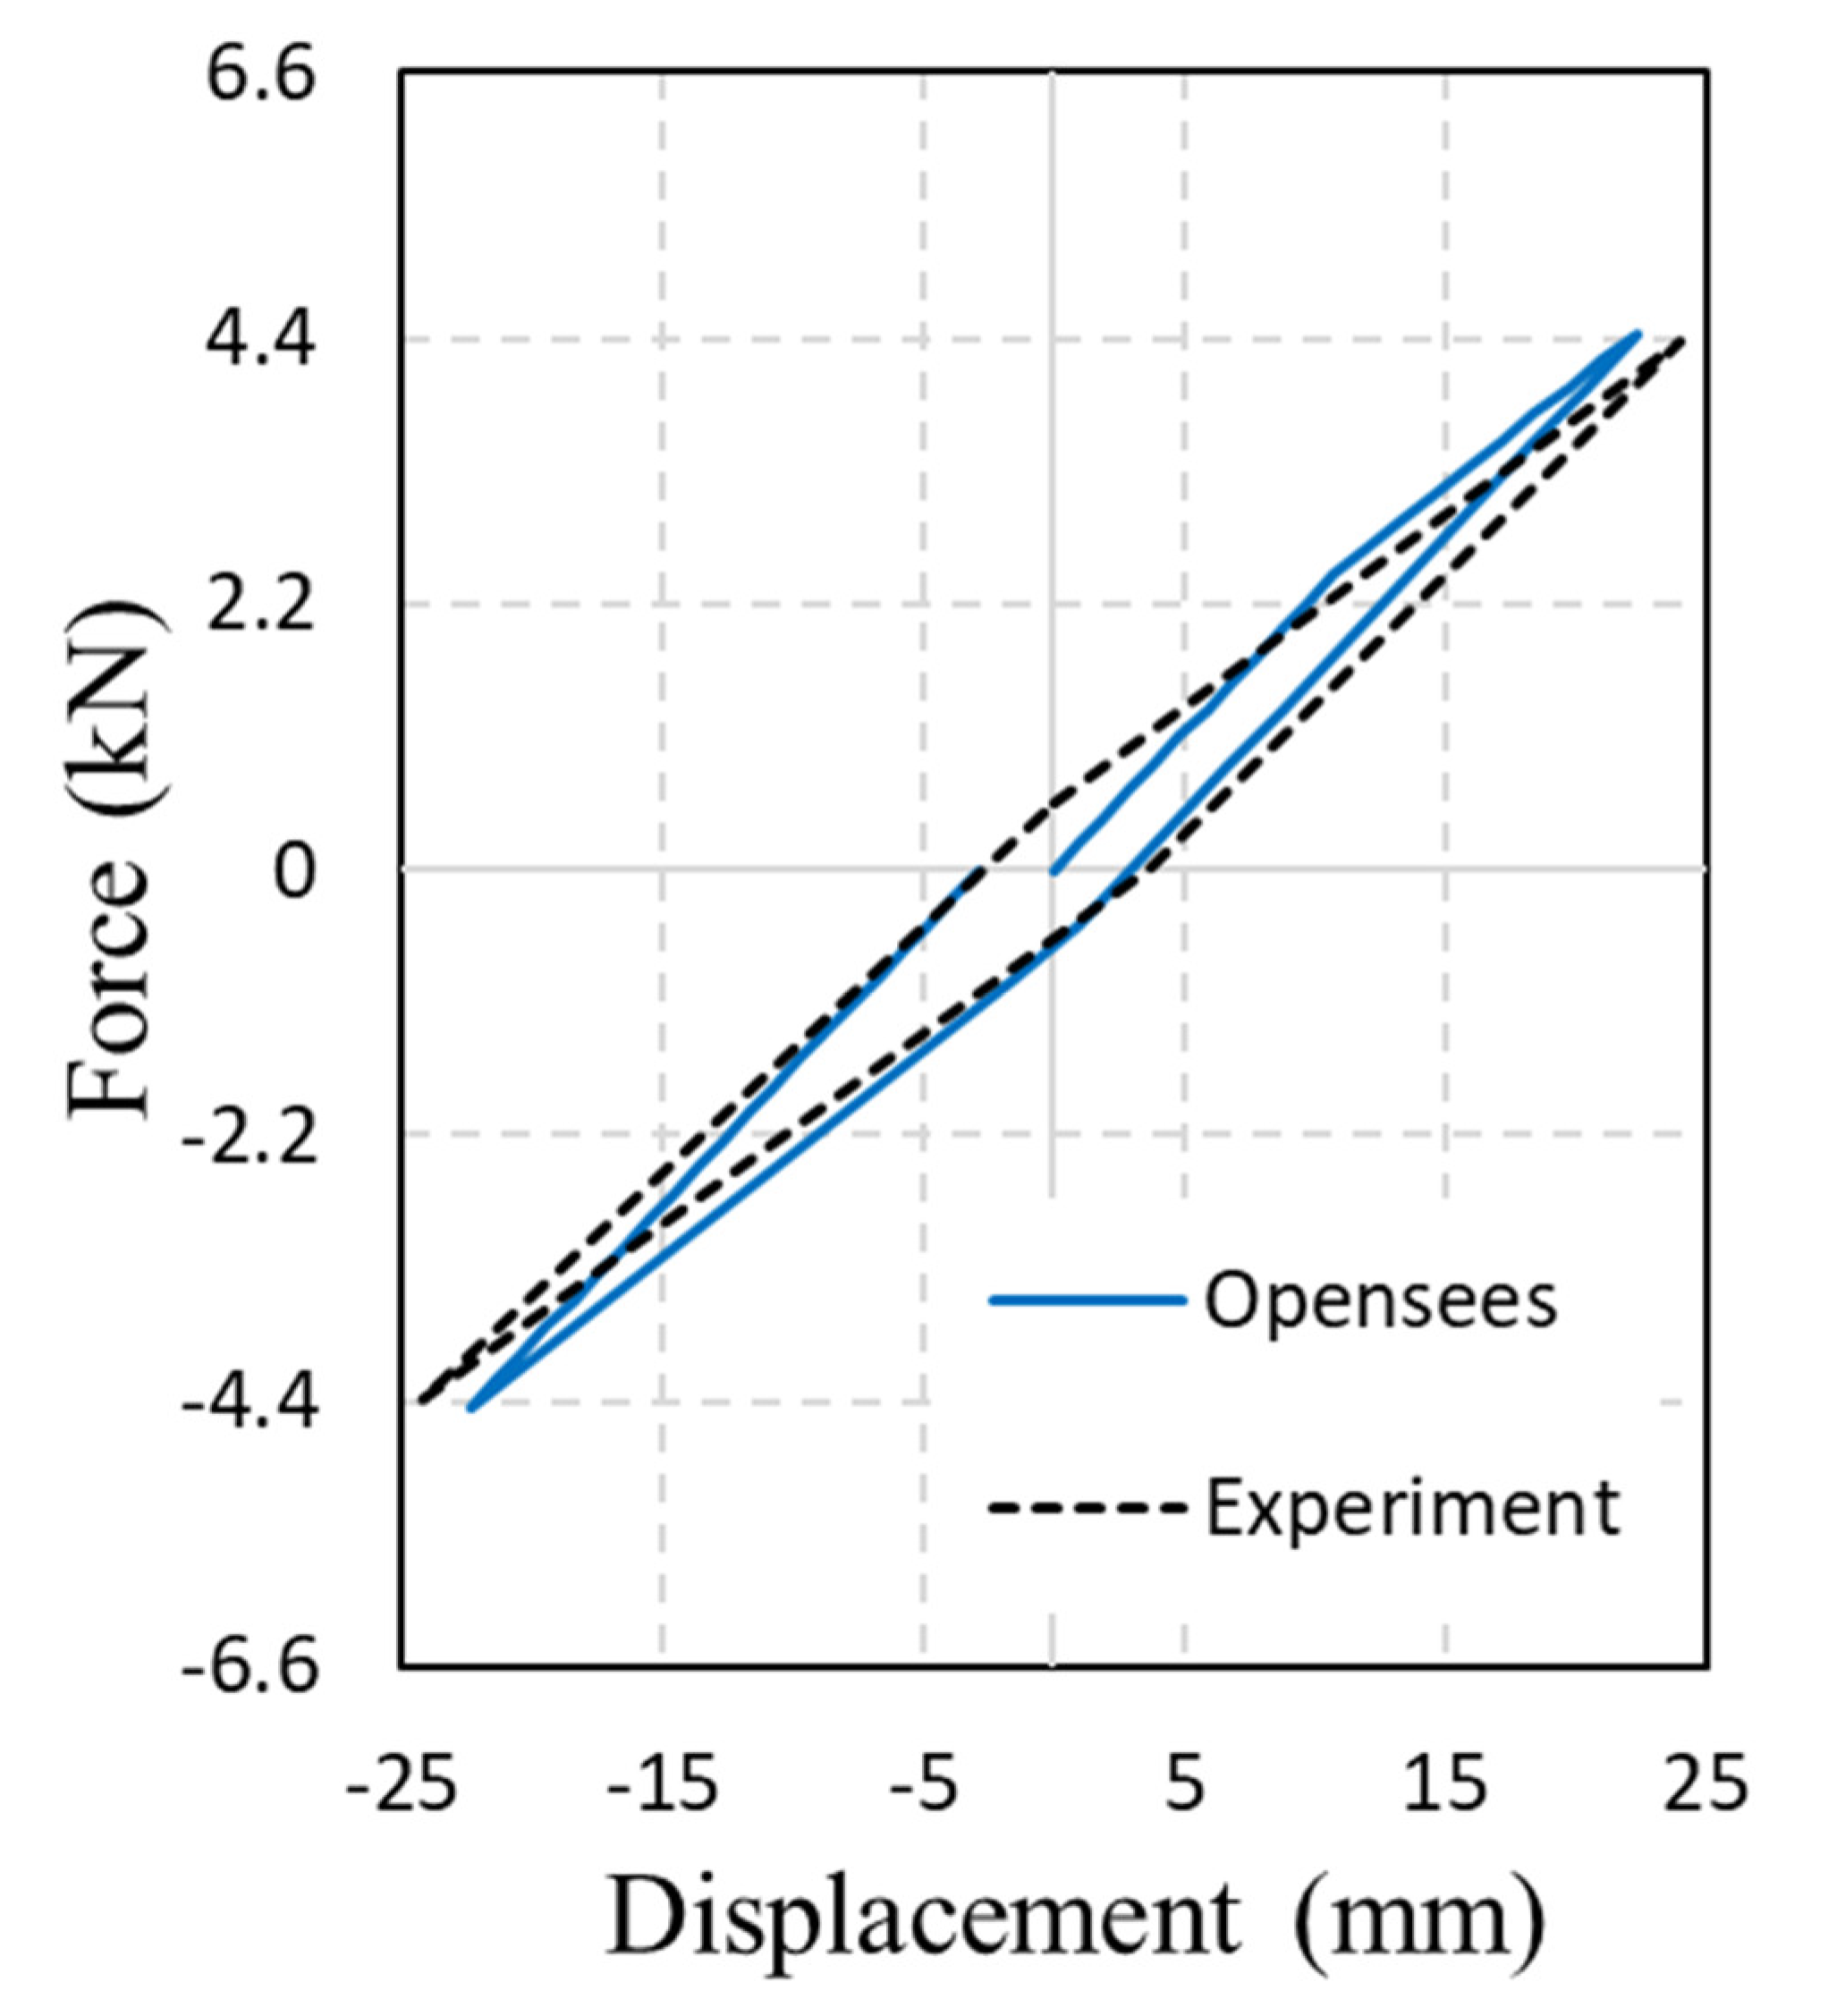
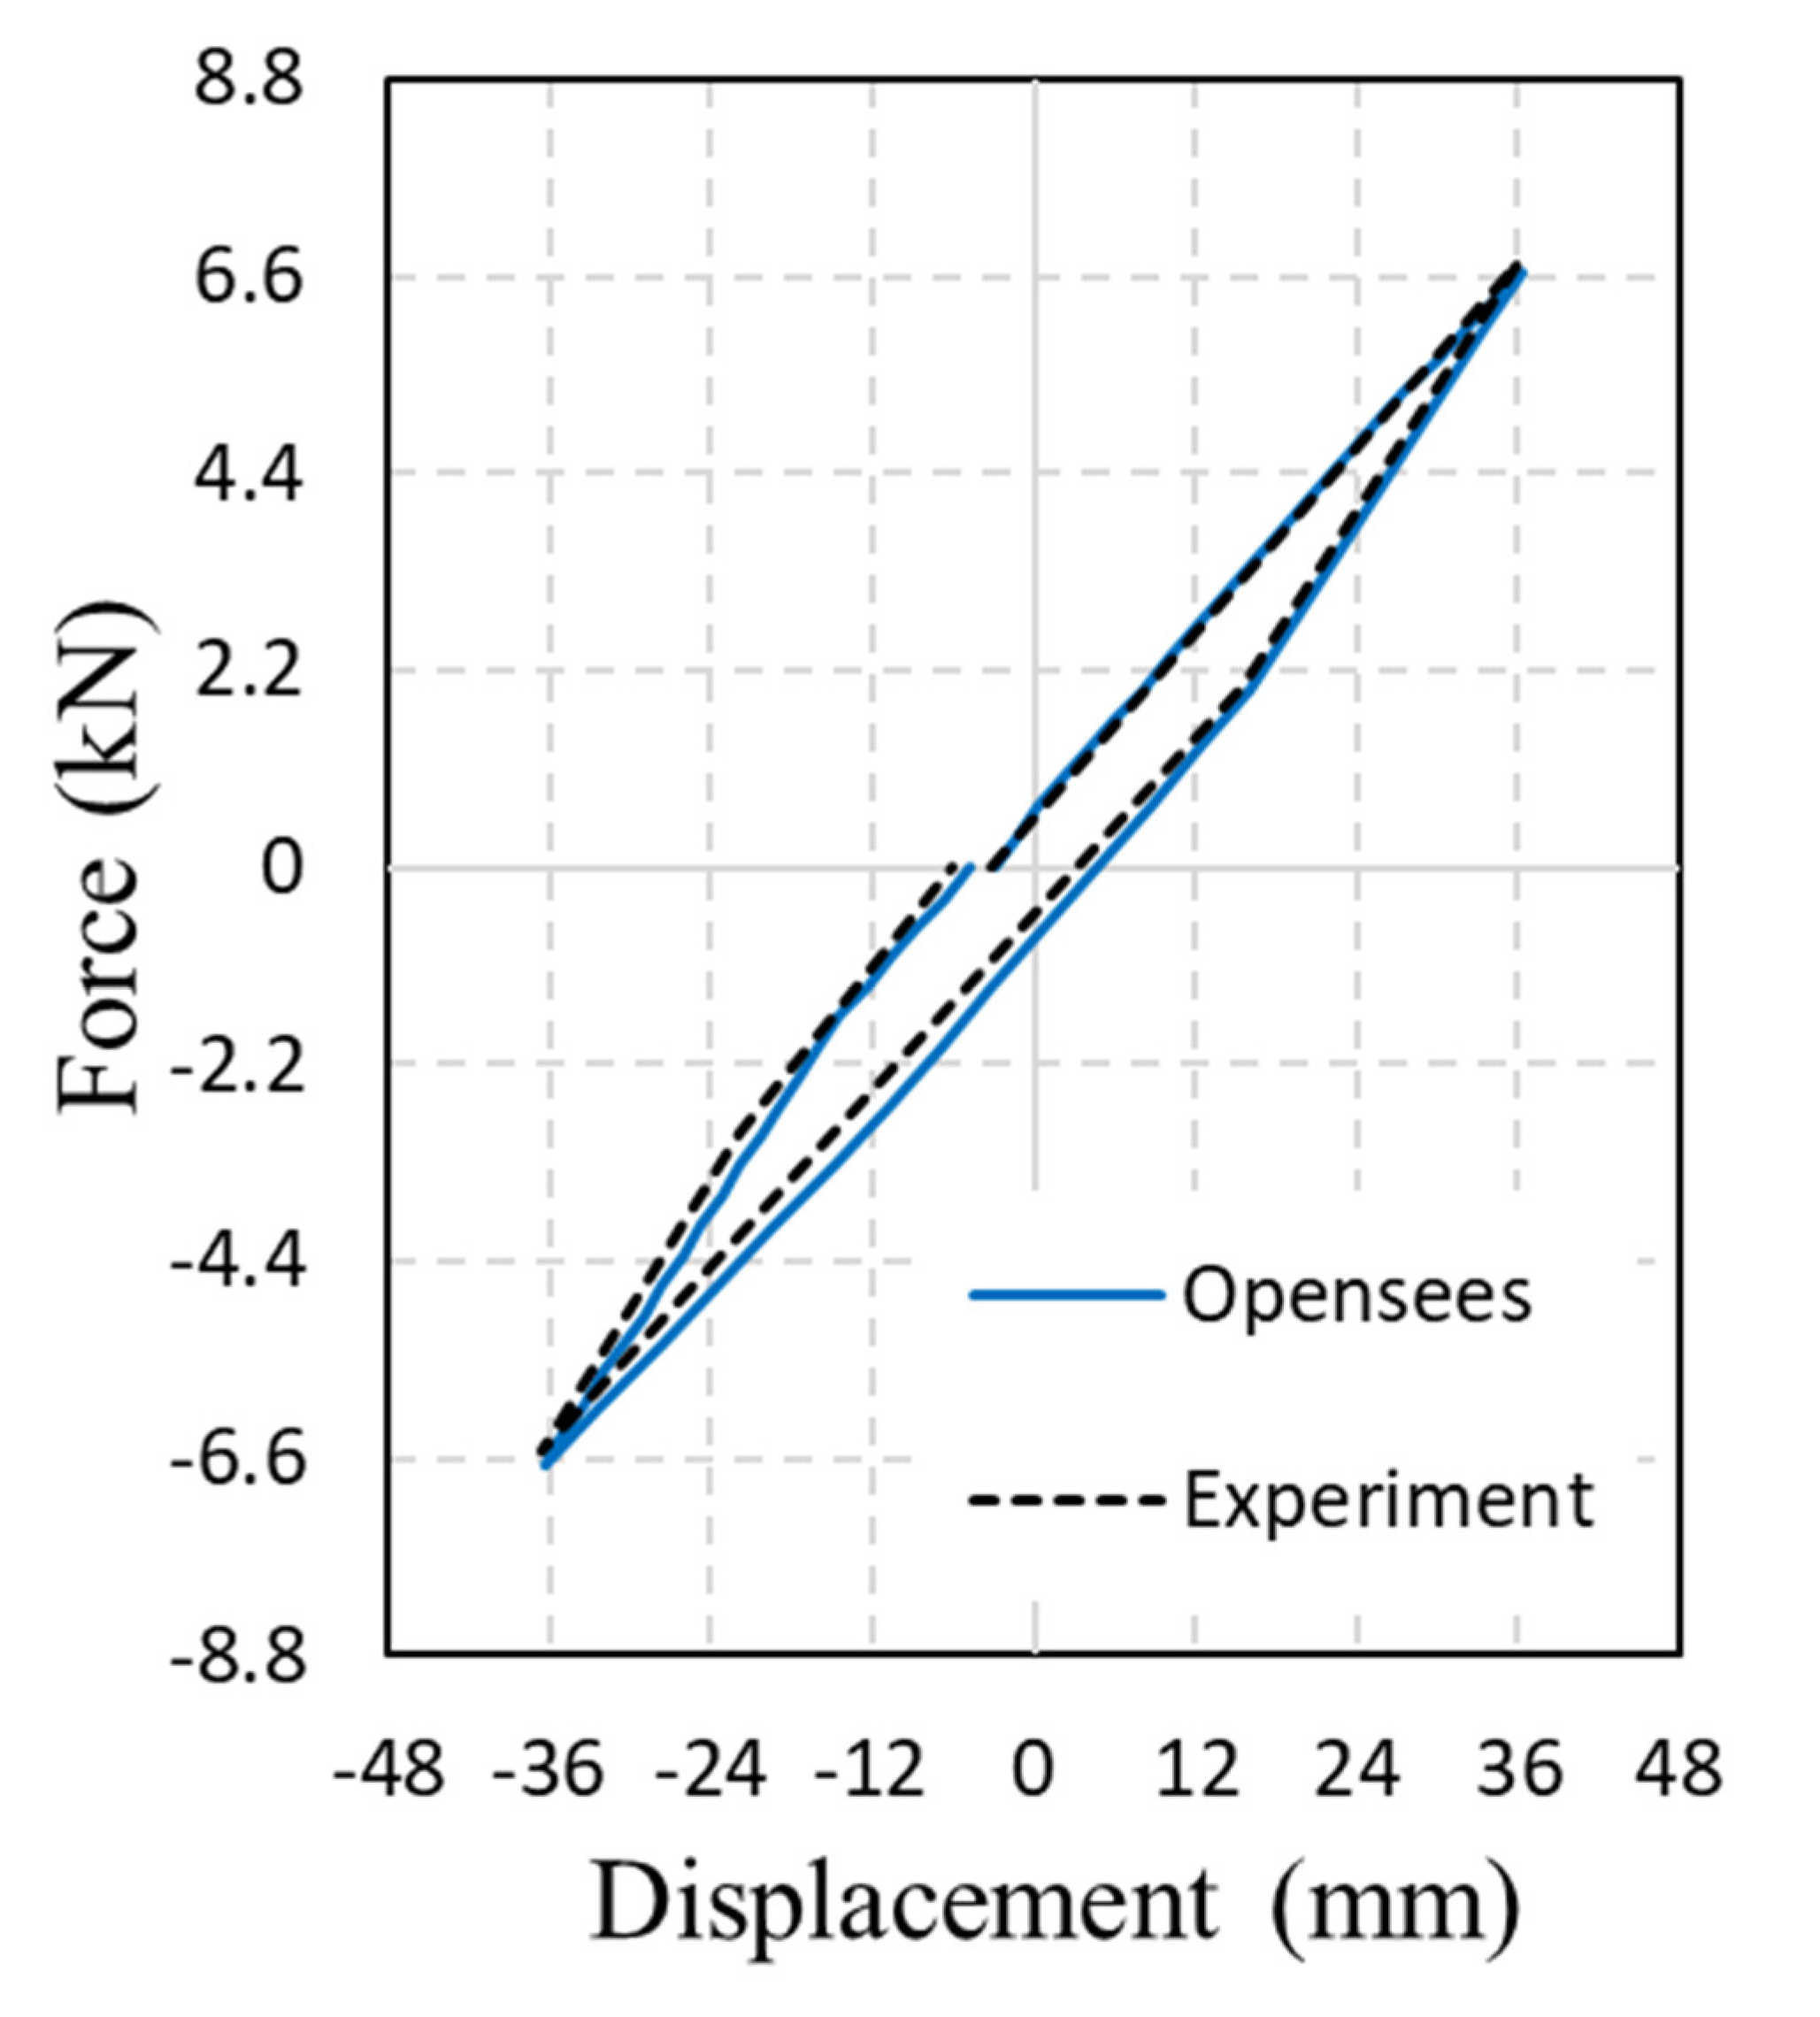
3.2. Semi-Rigid Connection

An experimental frame with semi-rigid connections consisting of one bay and two stories was created and analyzed by Stelmack et al. [46]. The actual model used in the experiment is illustrated in Figure 10. Top and seat angles, as shown in Figure 11, were used to replicate the flexibility of the beam–column connection. Since this type of connection is common practice in Iran, the authors decided to choose this type of connection. Moreover, the type of connection which was used in the reference article was top and seat angle connection. Therefore, in order to perform the verification study, choosing this type of connection was necessary. High-strength, friction-type, A-325 bolts of 2 cm diameter in standard holes were used throughout the semi-rigid connections. Additionally, W5 × 16 sections were used for both the beams and columns. Using hydraulic jacks, two concentrated loads were applied to the first and second story. Moreover, lateral supports were used on both sides of the frame to stop out-of-plane displacements.
In order to obtain a better prediction of the semi-rigid connection behavior resulting from the experimental model, Stelmack et al. used the hysteretic moment–rotation behavior shown in Figure 12. The connection response can be described by five constants: k1, k2, k3, and two limit moments, Mel and My, defined in Figure 12. As reported by Stelmack et al., these fives constants were as: k1 = 4520.4 kN.m/rad, k2 = 1694.7 kN.m/rad, k3 = 225.4 kN.m/rad, Mel = 6.0 kN.m and My = 15.5 kN.m. OpenSees was employed to model the experimental model mentioned above.
Using the proposed configurations, the analytical moment–rotation model reproduced the experimental model accurately, as shown in Figure 13, Figure 14 and Figure 15. The quasi-static loading consisted of three cycles and in each cycle the numerical and experimental models agreed well with each other. In general, the numerical and experimental models agreed well with each other and the degradation backbone was captured very well.

4. Results

The main periods and the modal participation ratio of the first vibration mode for all the frames are presented in Table 5 and Table 6, respectively. It is clear that the periods of the frames increased with the number of stories. Moreover, the main periods of these frames decreased once the semi-rigid connections had higher capacities or the steel plate shear walls had smaller perforated circular diameters. In the following sections, the maximum inter-story drift, residual displacement, roof displacement, moment–rotation of semi-rigid connections, story acceleration and base shear of the five earthquake records applied to the frames are discussed.

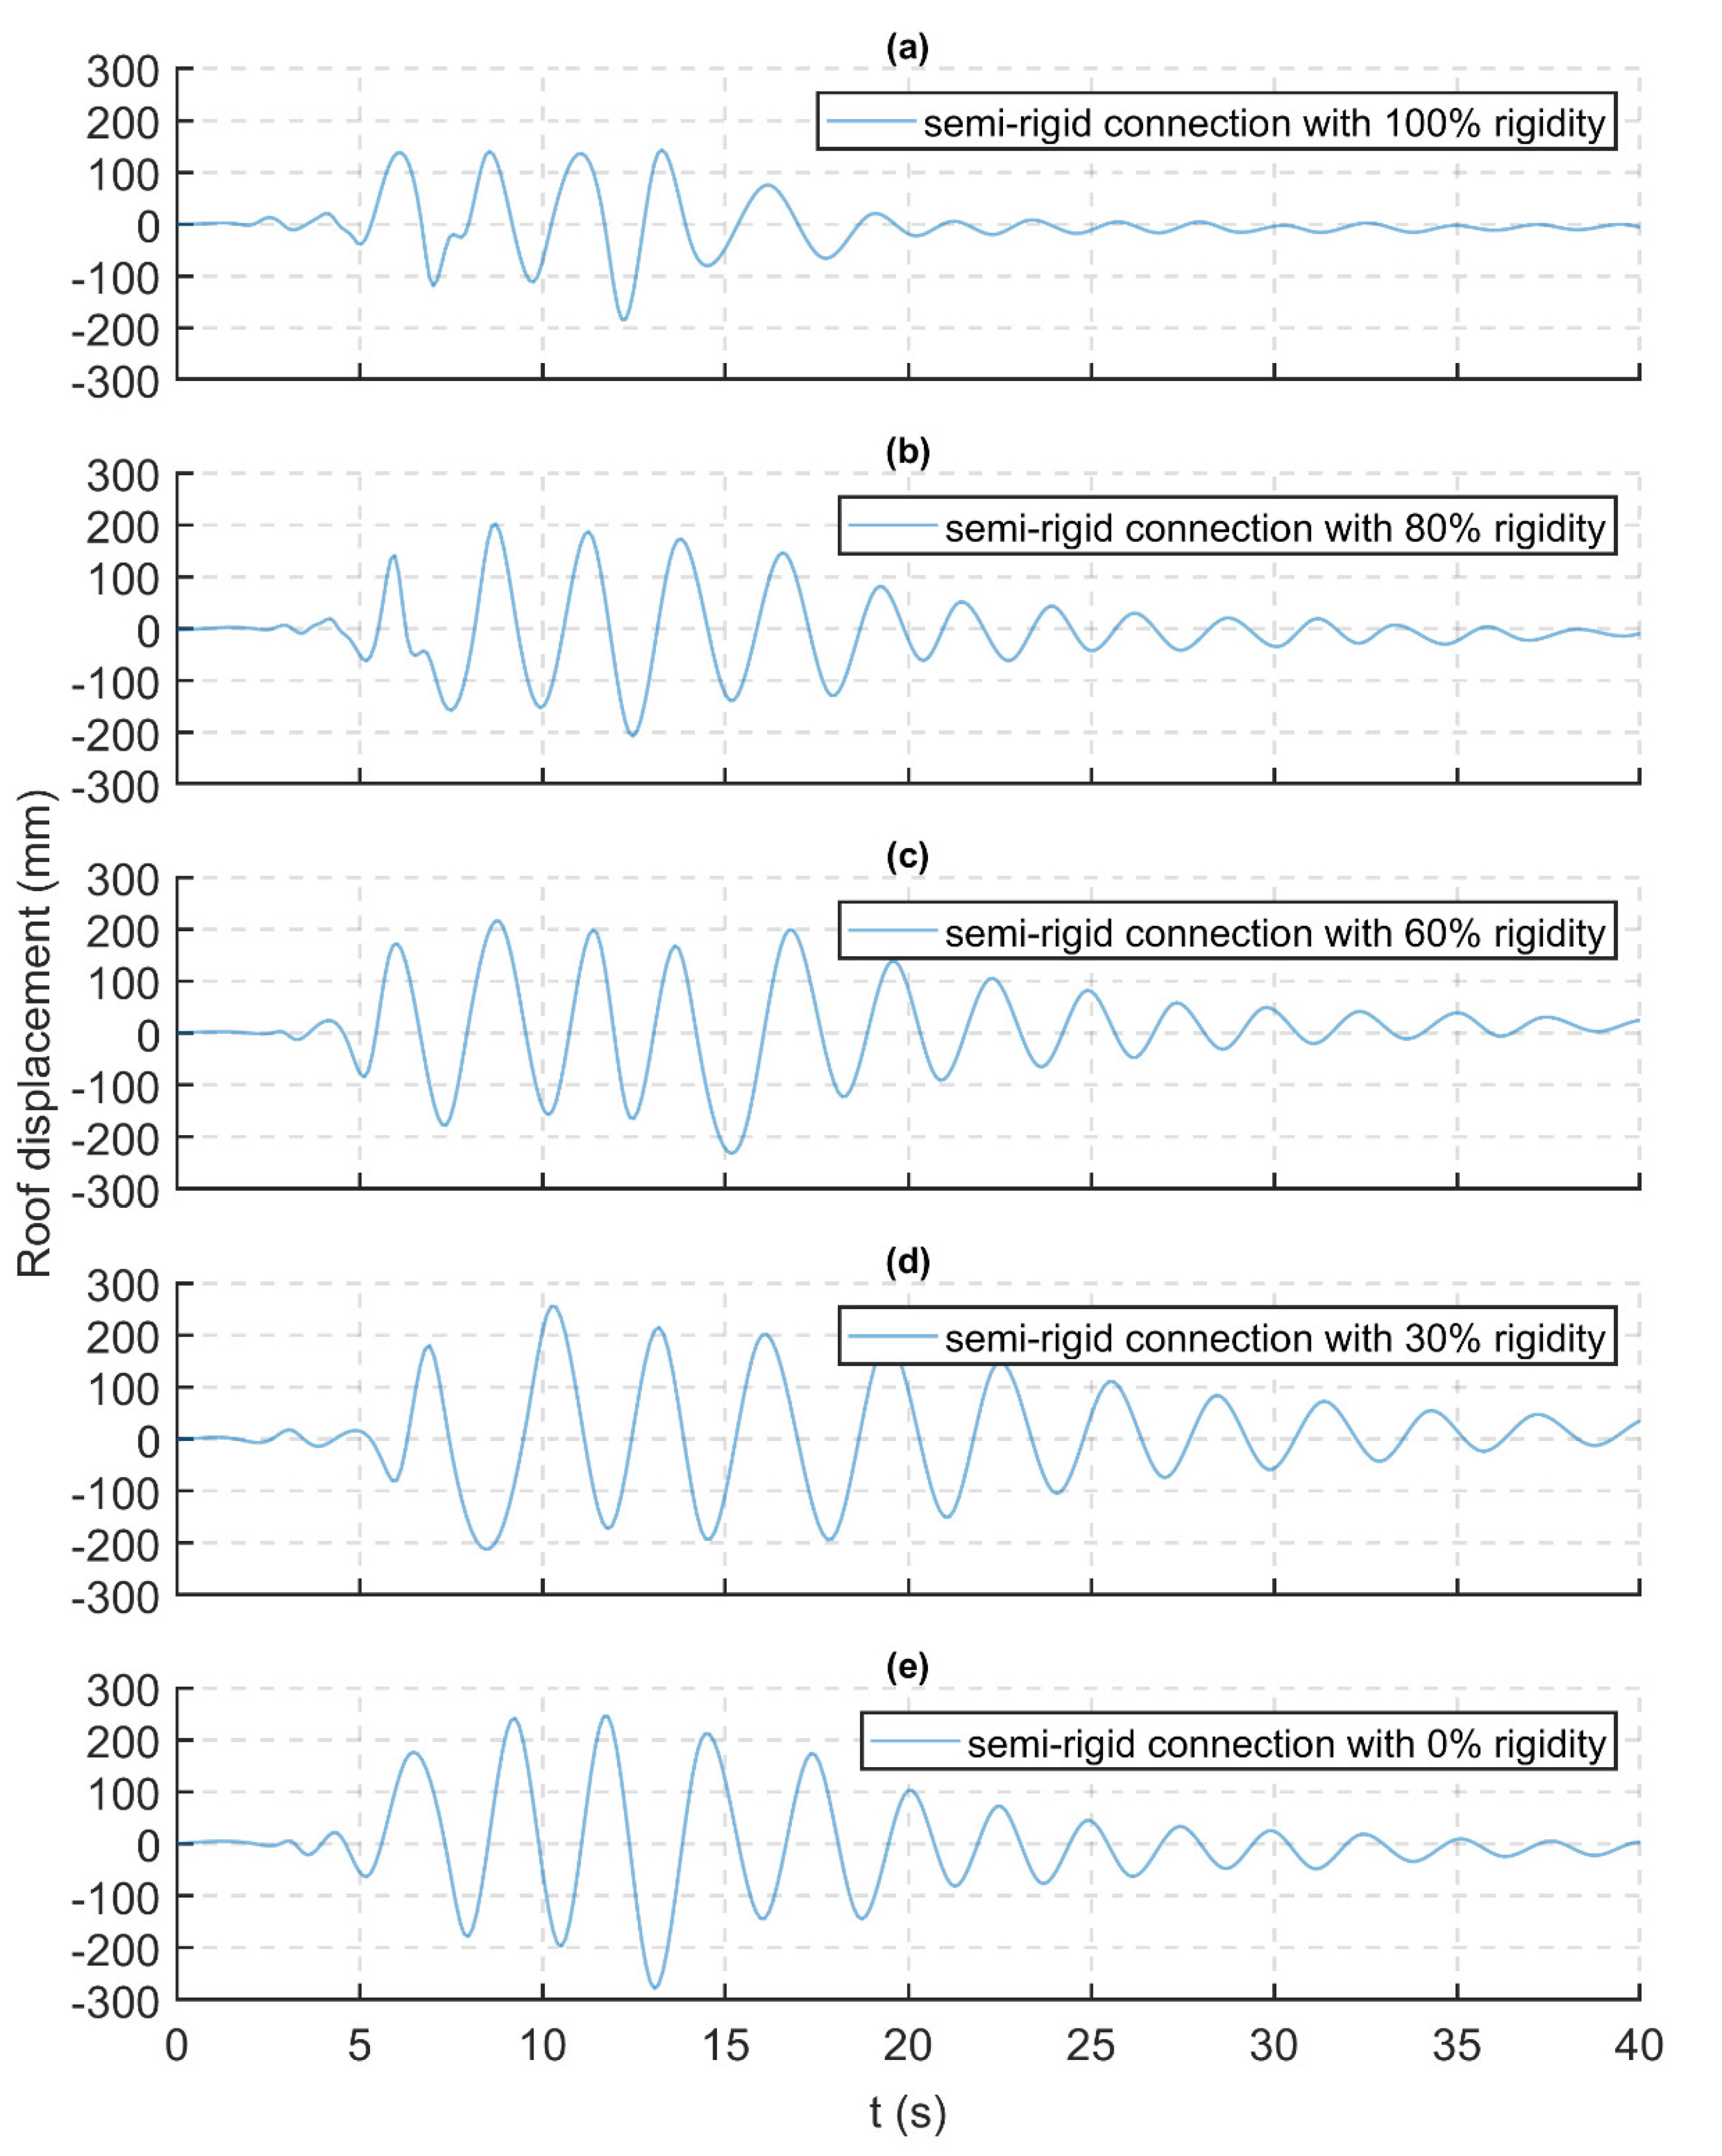
4.1. Time–History of Roof Displacement

The time–history data of roof displacement for the 15-story frames with 200 mm holes in their SPSWs with different connection capacities exposed to the Northridge earthquake are shown in Figure 16. The semi-rigid frames experienced a higher maximum roof displacement than those of the rigid frames, and this increased with the reduction in connection rigidity; however, the frames with connections with more rigidity experienced fewer cycles of peak roof displacements. The roof displacement response of frames with rigid connections was damped faster than those with ductile connections. As shown in Figure 16d,e, the frames with 0% and 30% rigidity experienced relatively similar maximum roof displacement.

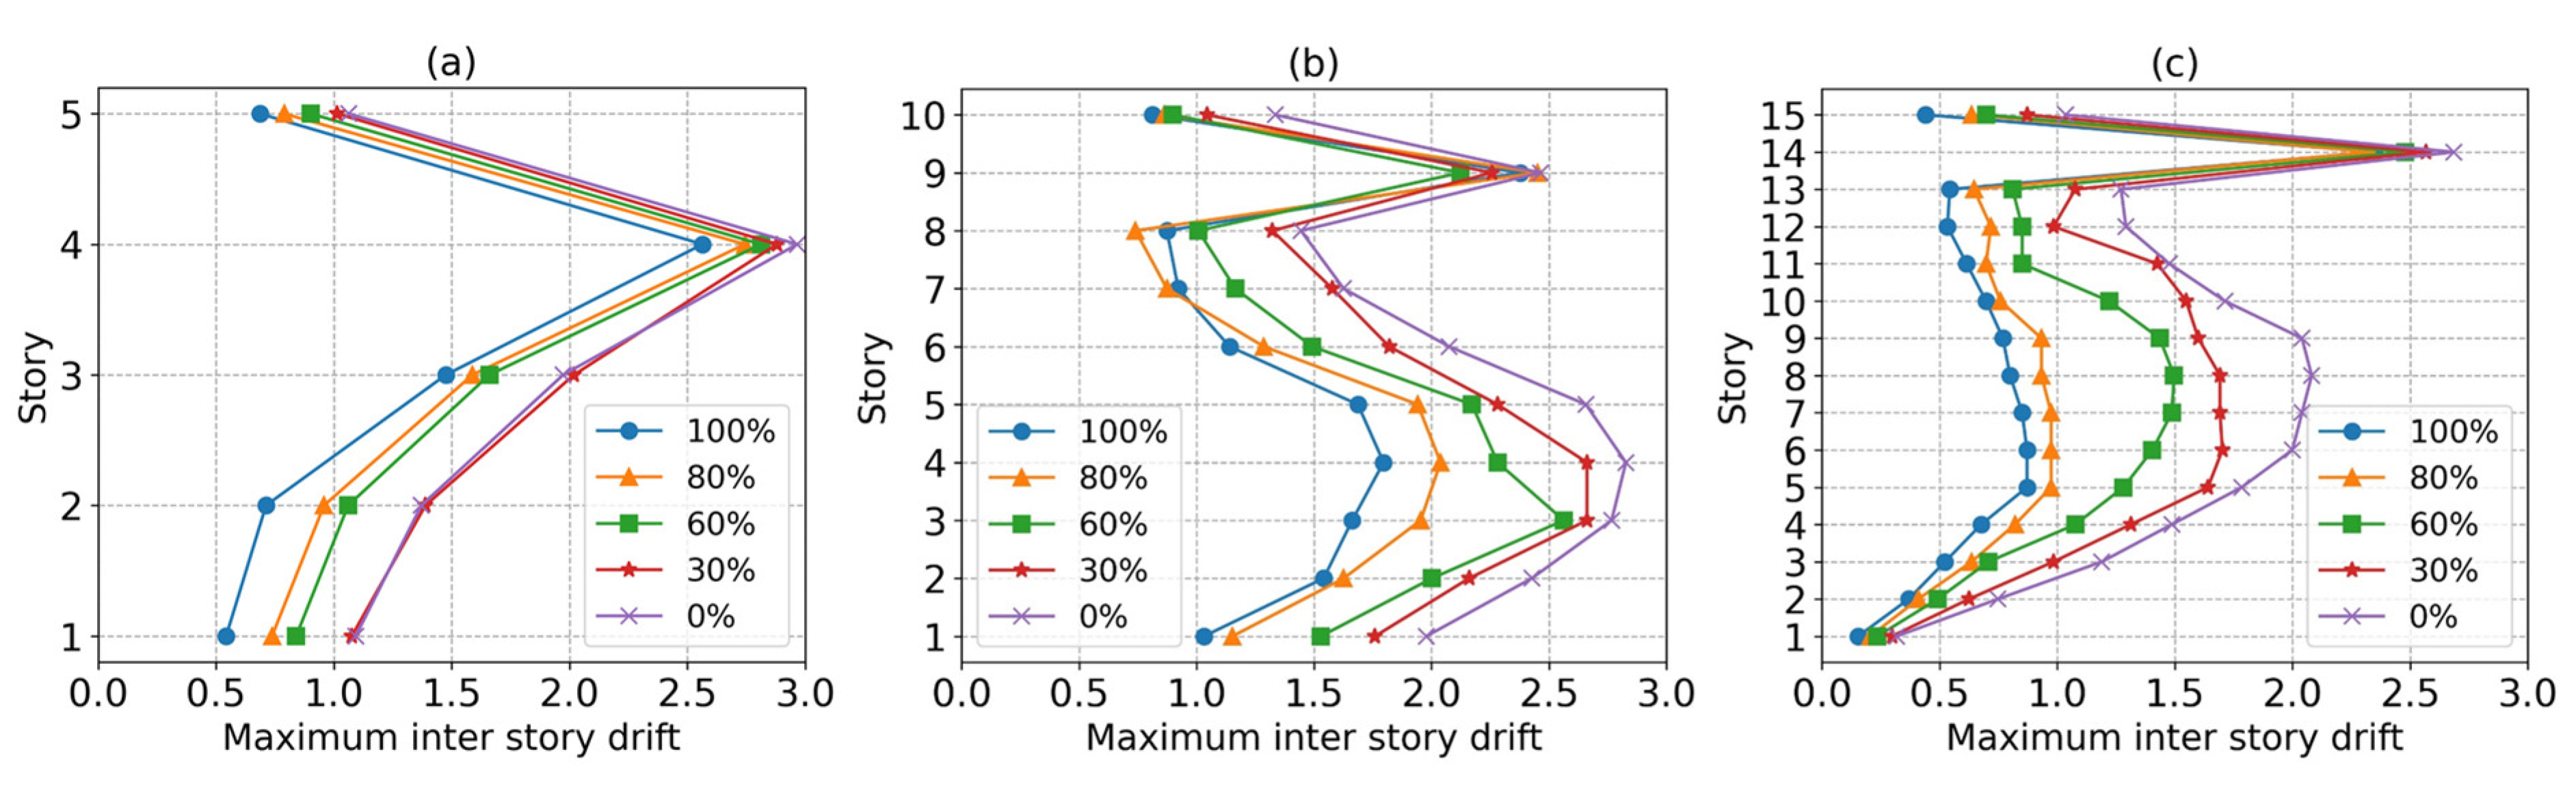
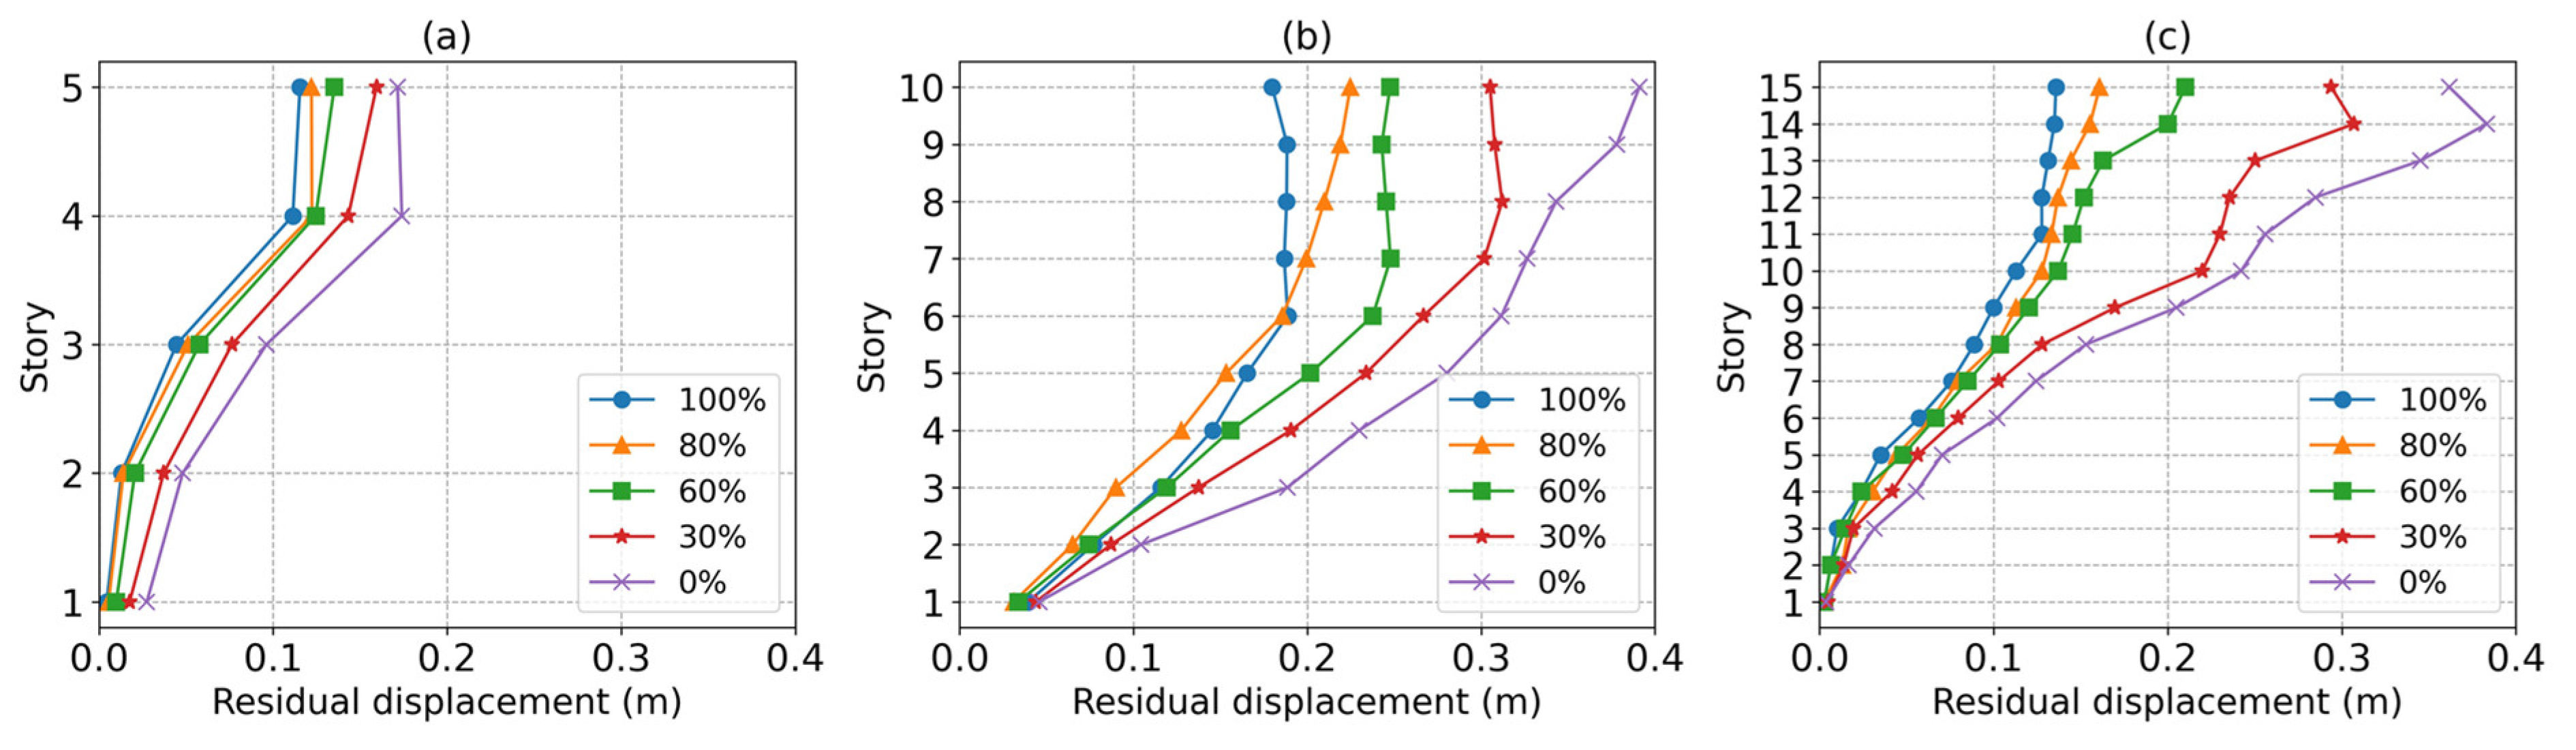
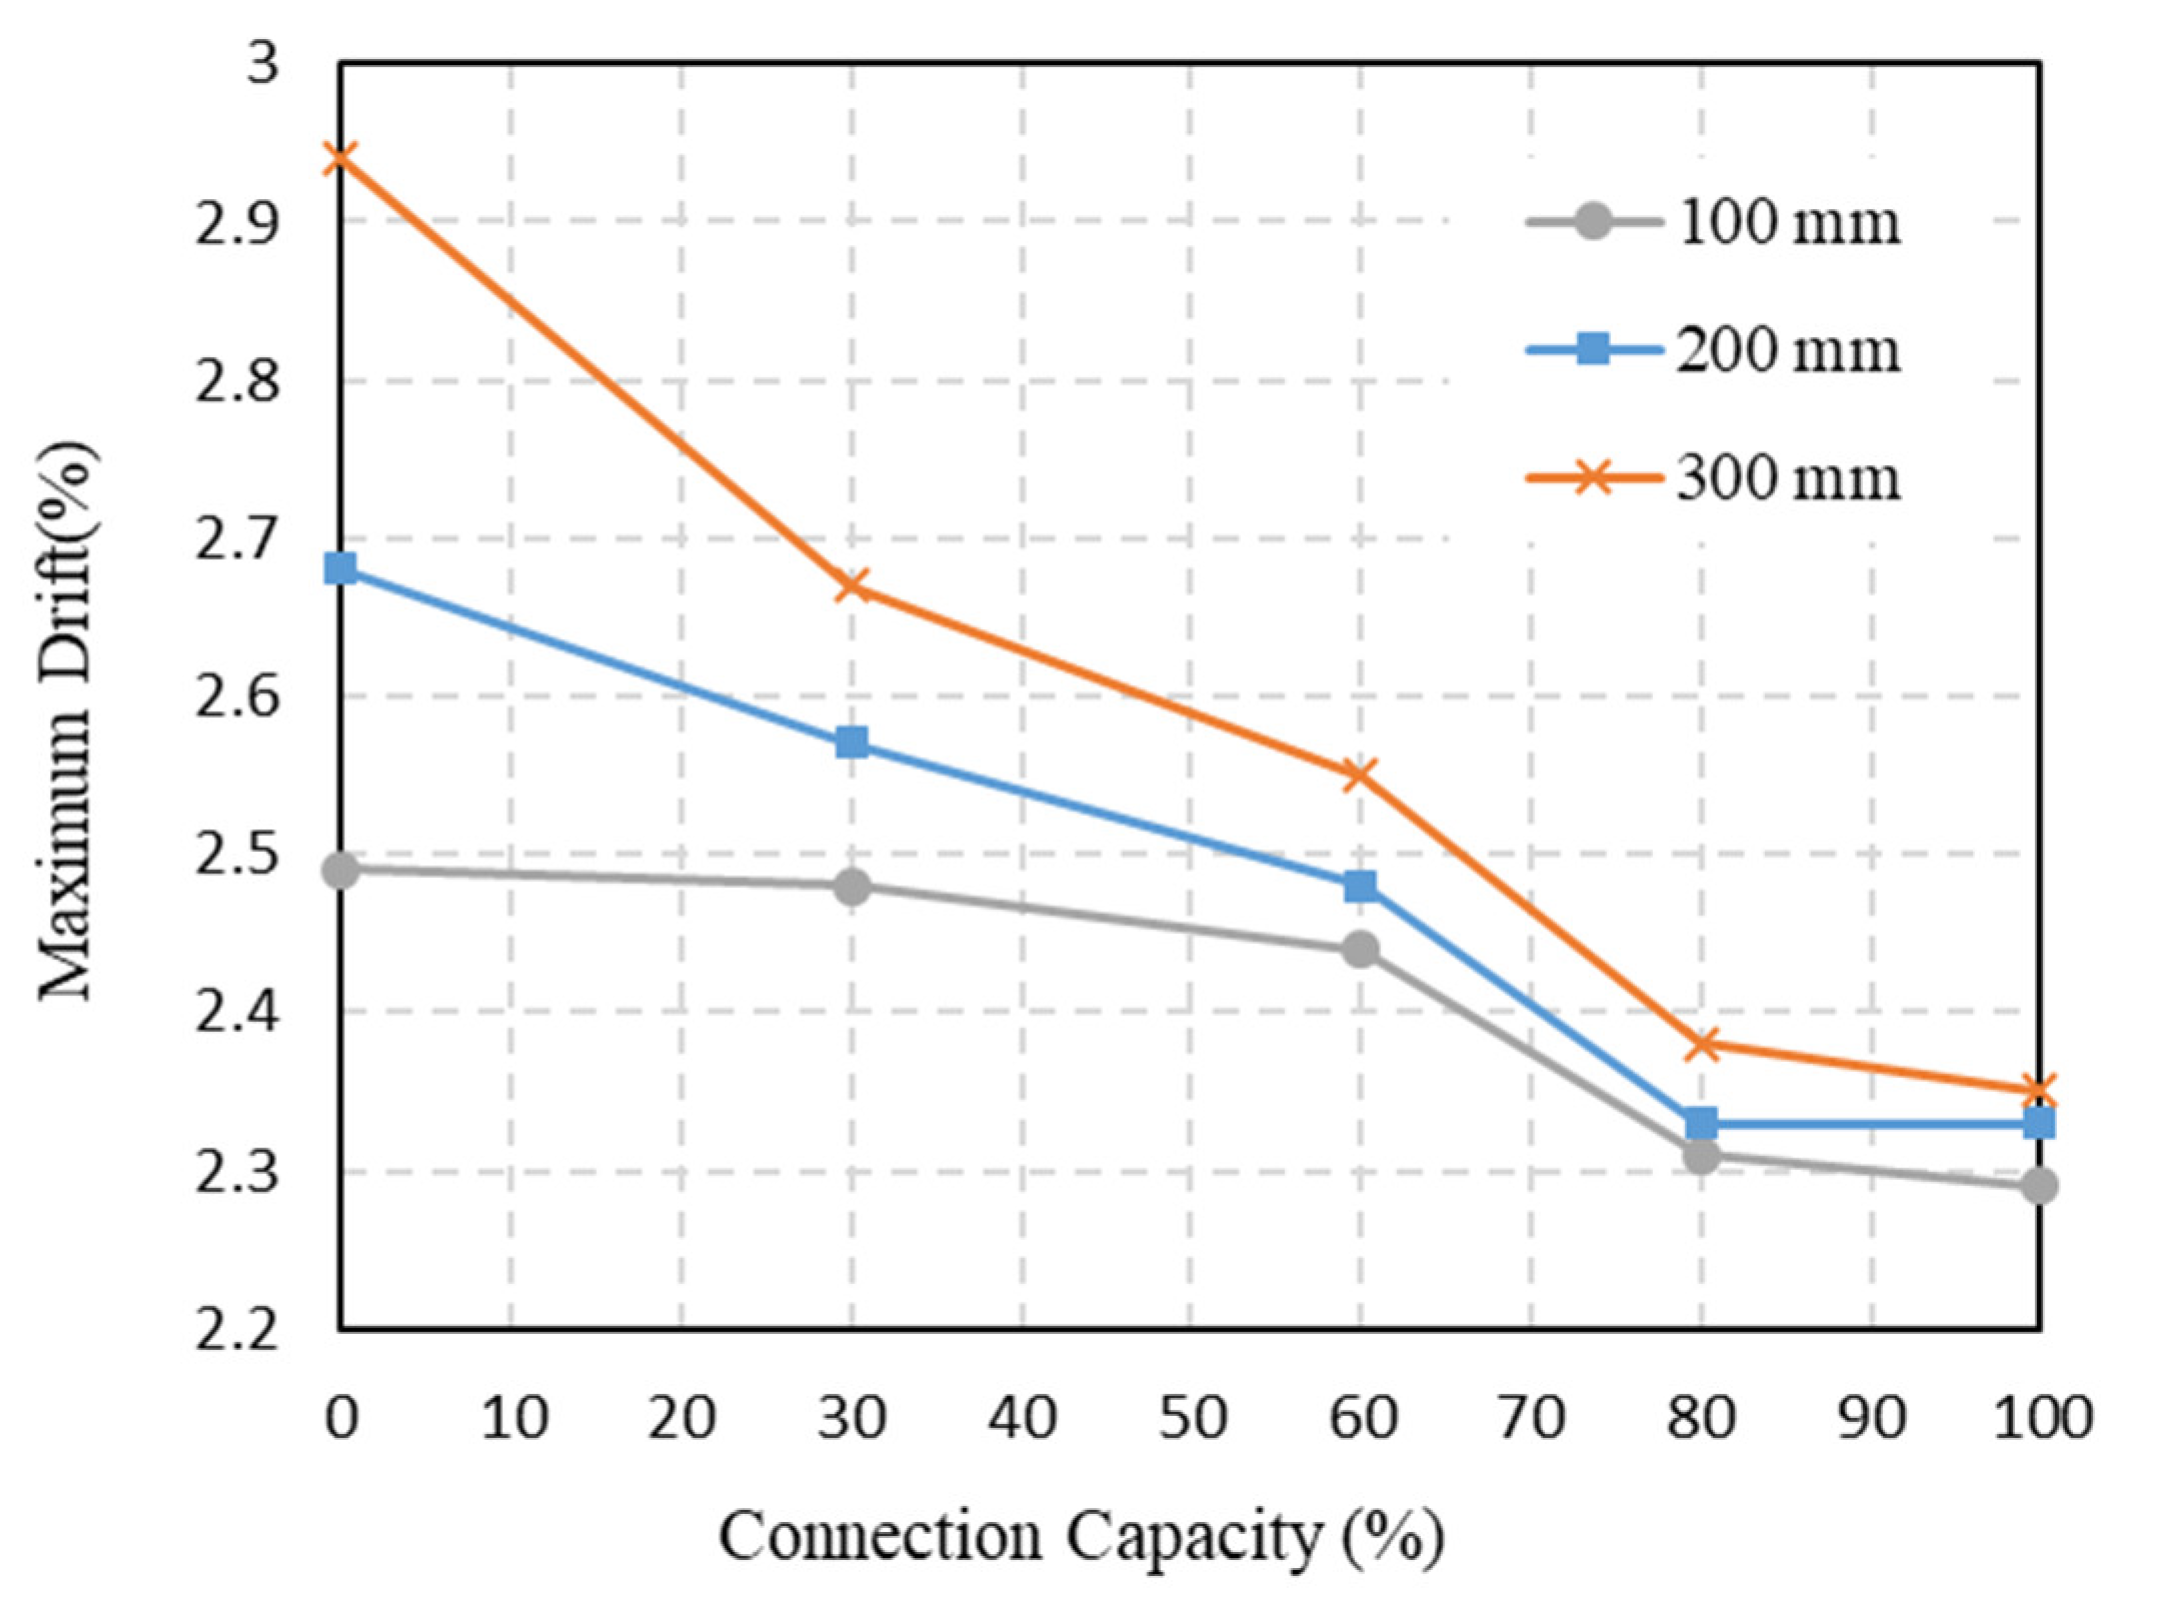
4.2. Maximum Inter-Story Drift and Residual Displacement

To understand the damage to structural components, the maximum drift and residual displacements are crucial outputs that must be drawn out from the numerical results. In addition, the displacement during each seismic loading for all stories was extracted from the dynamic results. Subsequently, the displacement resulting from the last time increment of the time–history data was reported as the residual story displacement.
Semi-rigid frames, in some cases, had increased drift in the upper elevations [52]. It can be seen in Figure 17a that as the connection capacity of the 5-story frames with 200 mm holes in their SPSWs decreased, their maximum relative drift increased. The maximum story drift errors relate to the assumption that for the semi-rigid connection to become fully rigid, the estimation of maximum (fourth) story drift story must be 10.67%, 5.12% and 3.06%, for 30%, 60% and 80% rigidities, respectively. Figure 17b proves that in the 10-story frames with 30%, 60% and 80% rigidities, the maximum relative drifts were observed in story 4, 3 and 9, respectively. In this case, the maximum drift in the ninth story of the frame with rigid connections was higher than the frames with 30% and 60% rigidities in the same story. In the 15-story frames (Figure 17c), the maximum story drift increased as the connection capacity of the 15-story structure was reduced. Additionally, the weak story in the 15-story frames most likely occurred at the 14th story, since this had the highest maximum relative story drift compared to the other stories.
By decreasing the rigidity of the five-story frames including SPSWs with 200 mm circular holes implemented in them, the residual displacement of different frames was enhanced (Figure 18a). In addition, the variation between the results comes from the presumption that the connections had full capacity; instead, the 80%, 60% and 30% rigidities were 4.21%, 4.17% and 9.23%, respectively. Figure 18b shows that for the 10-story structure, when the rigidity of the frame was varied to 80%, the maximum residual displacement increased from the first floor until the roof floor; however, in the frames with 30%, 60% and 100% rigidities, the residual story displacement did not vary much from story 6 to the final story. Figure 18b also depicts that until story 6, the frame with 80% rigidity had a lower residual displacement than the fully rigid frame, whereas from story 7 to 10, the latter had a lower residual displacement. In general, it was clear that with the reduction in rigidity in the 10-story frames, the stories’ residual displacement was enhanced. As shown in Figure 18c, the 15-story frames experienced higher residual displacement in each story with the reduction in connection rigidity. Moreover, the frames with 100%, 80% and 60% rigidity experienced maximum residual displacement in story 15, whereas the frame with 30% rigidity had the highest residual displacement at the 14th floor.
The maximum story drifts of all the 5-, 10- and 15-story frames responding to the earthquakes mentioned earlier in Table 2 are shown in Figure 19, Figure 20 and Figure 21. The resulting relative drifts from each of the earthquakes for the 5-, 10- and 15-story frames are also shown in Table 7, Table 8 and Table 9. Adding perforations to a SPSW helps to take advantage of the post-buckling resistance capacity of the SPSW [32]. This provides an advanced SPSW system that has higher ductility than a regular unperforated SPSW [30]. Hence, by increasing the connection capacity and decreasing the hole diameters in the SPSWs, the ductility of the frames reduced and, therefore, smaller drifts were resulted. It is shown in Figure 19, Figure 20 and Figure 21 that the drifts were reduced by increasing the stiffness. A drift limit of 2% is required based on the life safety performance level for linear dynamic analysis. In a nonlinear analysis, this limit is extended to 3% for a 5-story frame and 2.4% for frames with 10 and 15 stories [43].
As shown in Figure 19, except from the five-story frames with 0% and 30% rigidity that had 300 mm SPSW holes, a combination of SPSWs and semi-rigid connections in the five-story frames resulted in drifts below the limit required, which was 3%. The maximum story drift for the frames with five stories was 3.18%, and belonged to the frame that had SPSWs with 300 mm holes and simple moment-free connections implemented in them. On the other hand, the minimum story drift for the frames with five stories was 2.54% and belonged to the frame that had SPSWs with 100 mm holes and rigid connections implemented in them.
A combination of SPSWs and semi-rigid connections in the 10-story frames resulted in multiple cases which were not below the required 2.4% mentioned before. According to Figure 20, these cases must be designed more cautiously by choosing the right capacity for semi-rigid connections and the dimensions of the holes in the SPSWs. Implementing SPSWs that had 300 mm holes with semi-rigid connections that had any kind of rigidity resulted in an undesirable increase in the relative drift that exceeded the limit required. In case of the SPSWs that had 100 mm and 200 mm circular holes, only the frames that implemented fully rigid connections qualified, since the other frames exceeded the 2.4% defined by the standards considered in this paper.
Implementing SPSWs and semi-rigid connections in the 15-story frames resulted in nine cases which were not below the 2.4% required. According to Figure 21, the frames with semi-rigid connections that had a capacity of 60% or lower should have been designed more cautiously, since their relative displacement was higher than 2.4%.

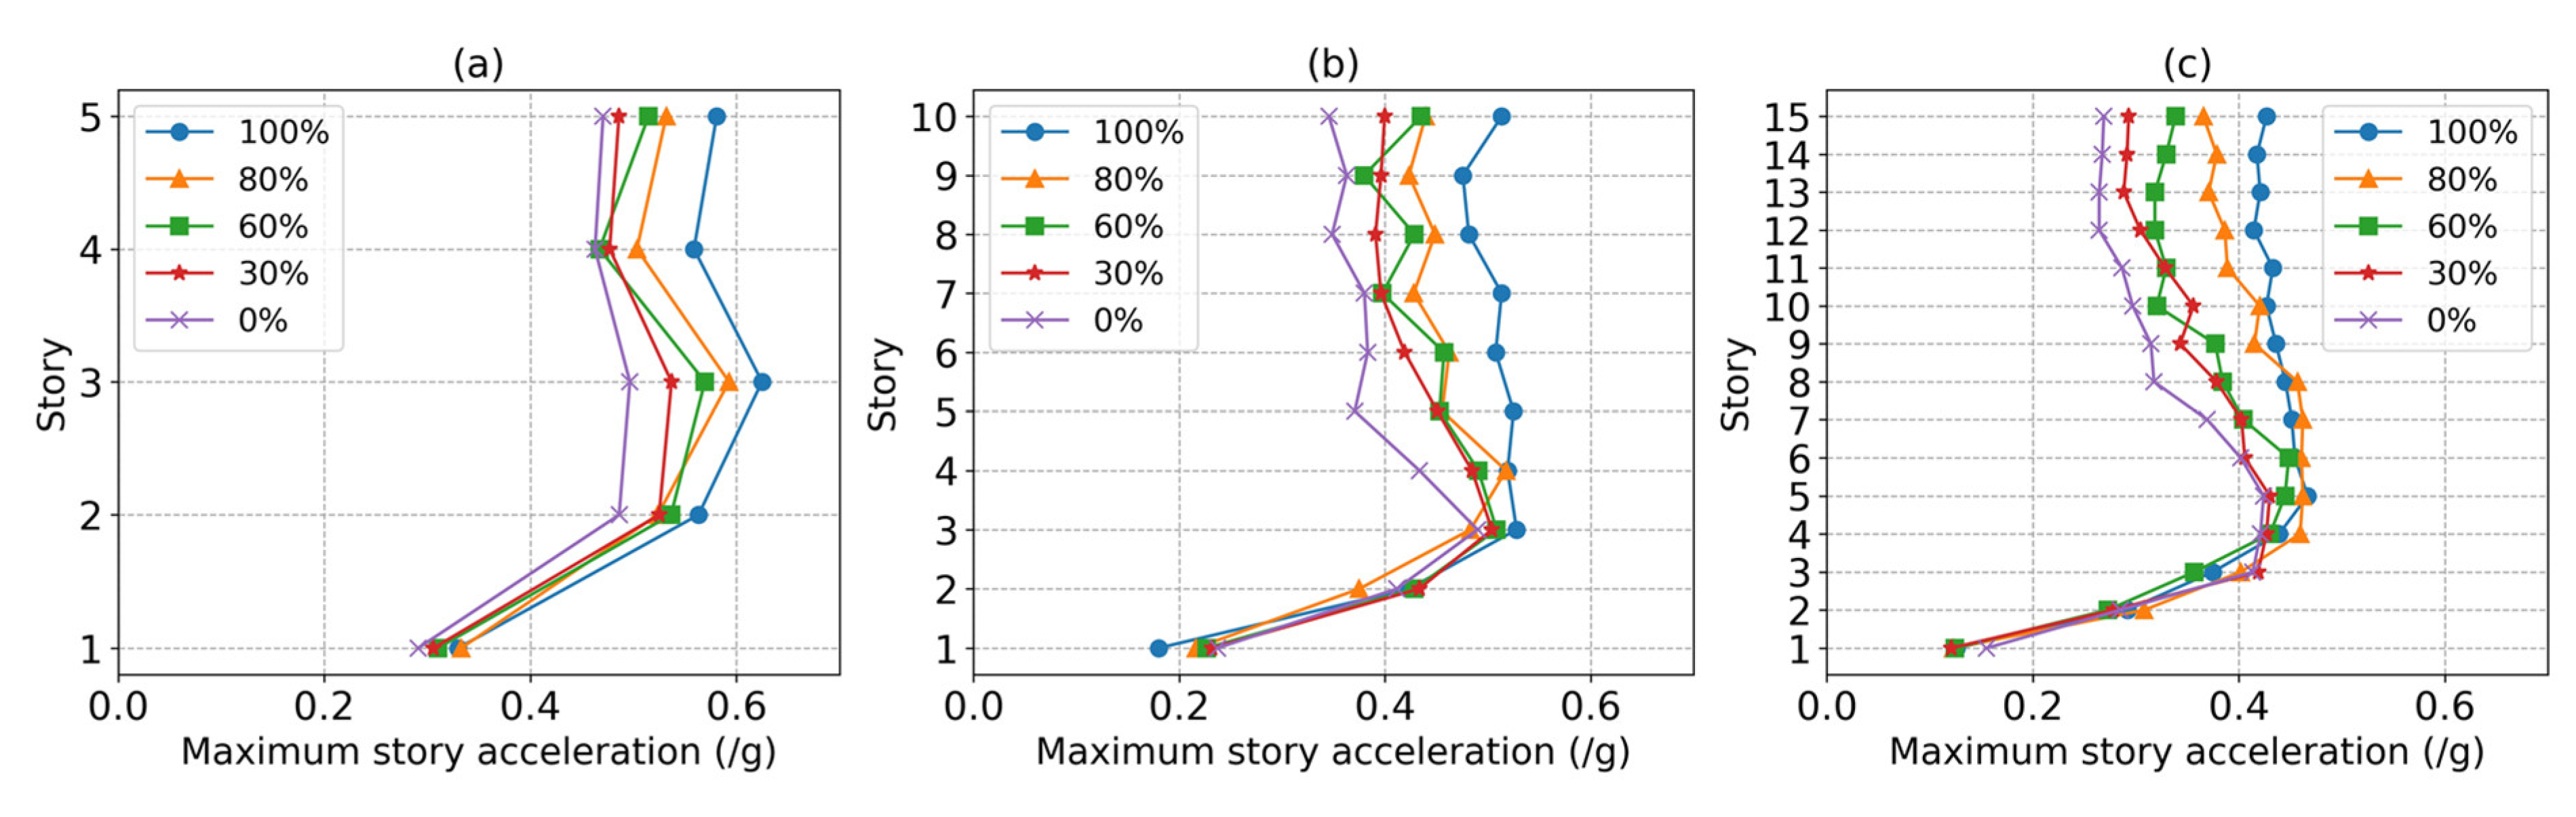
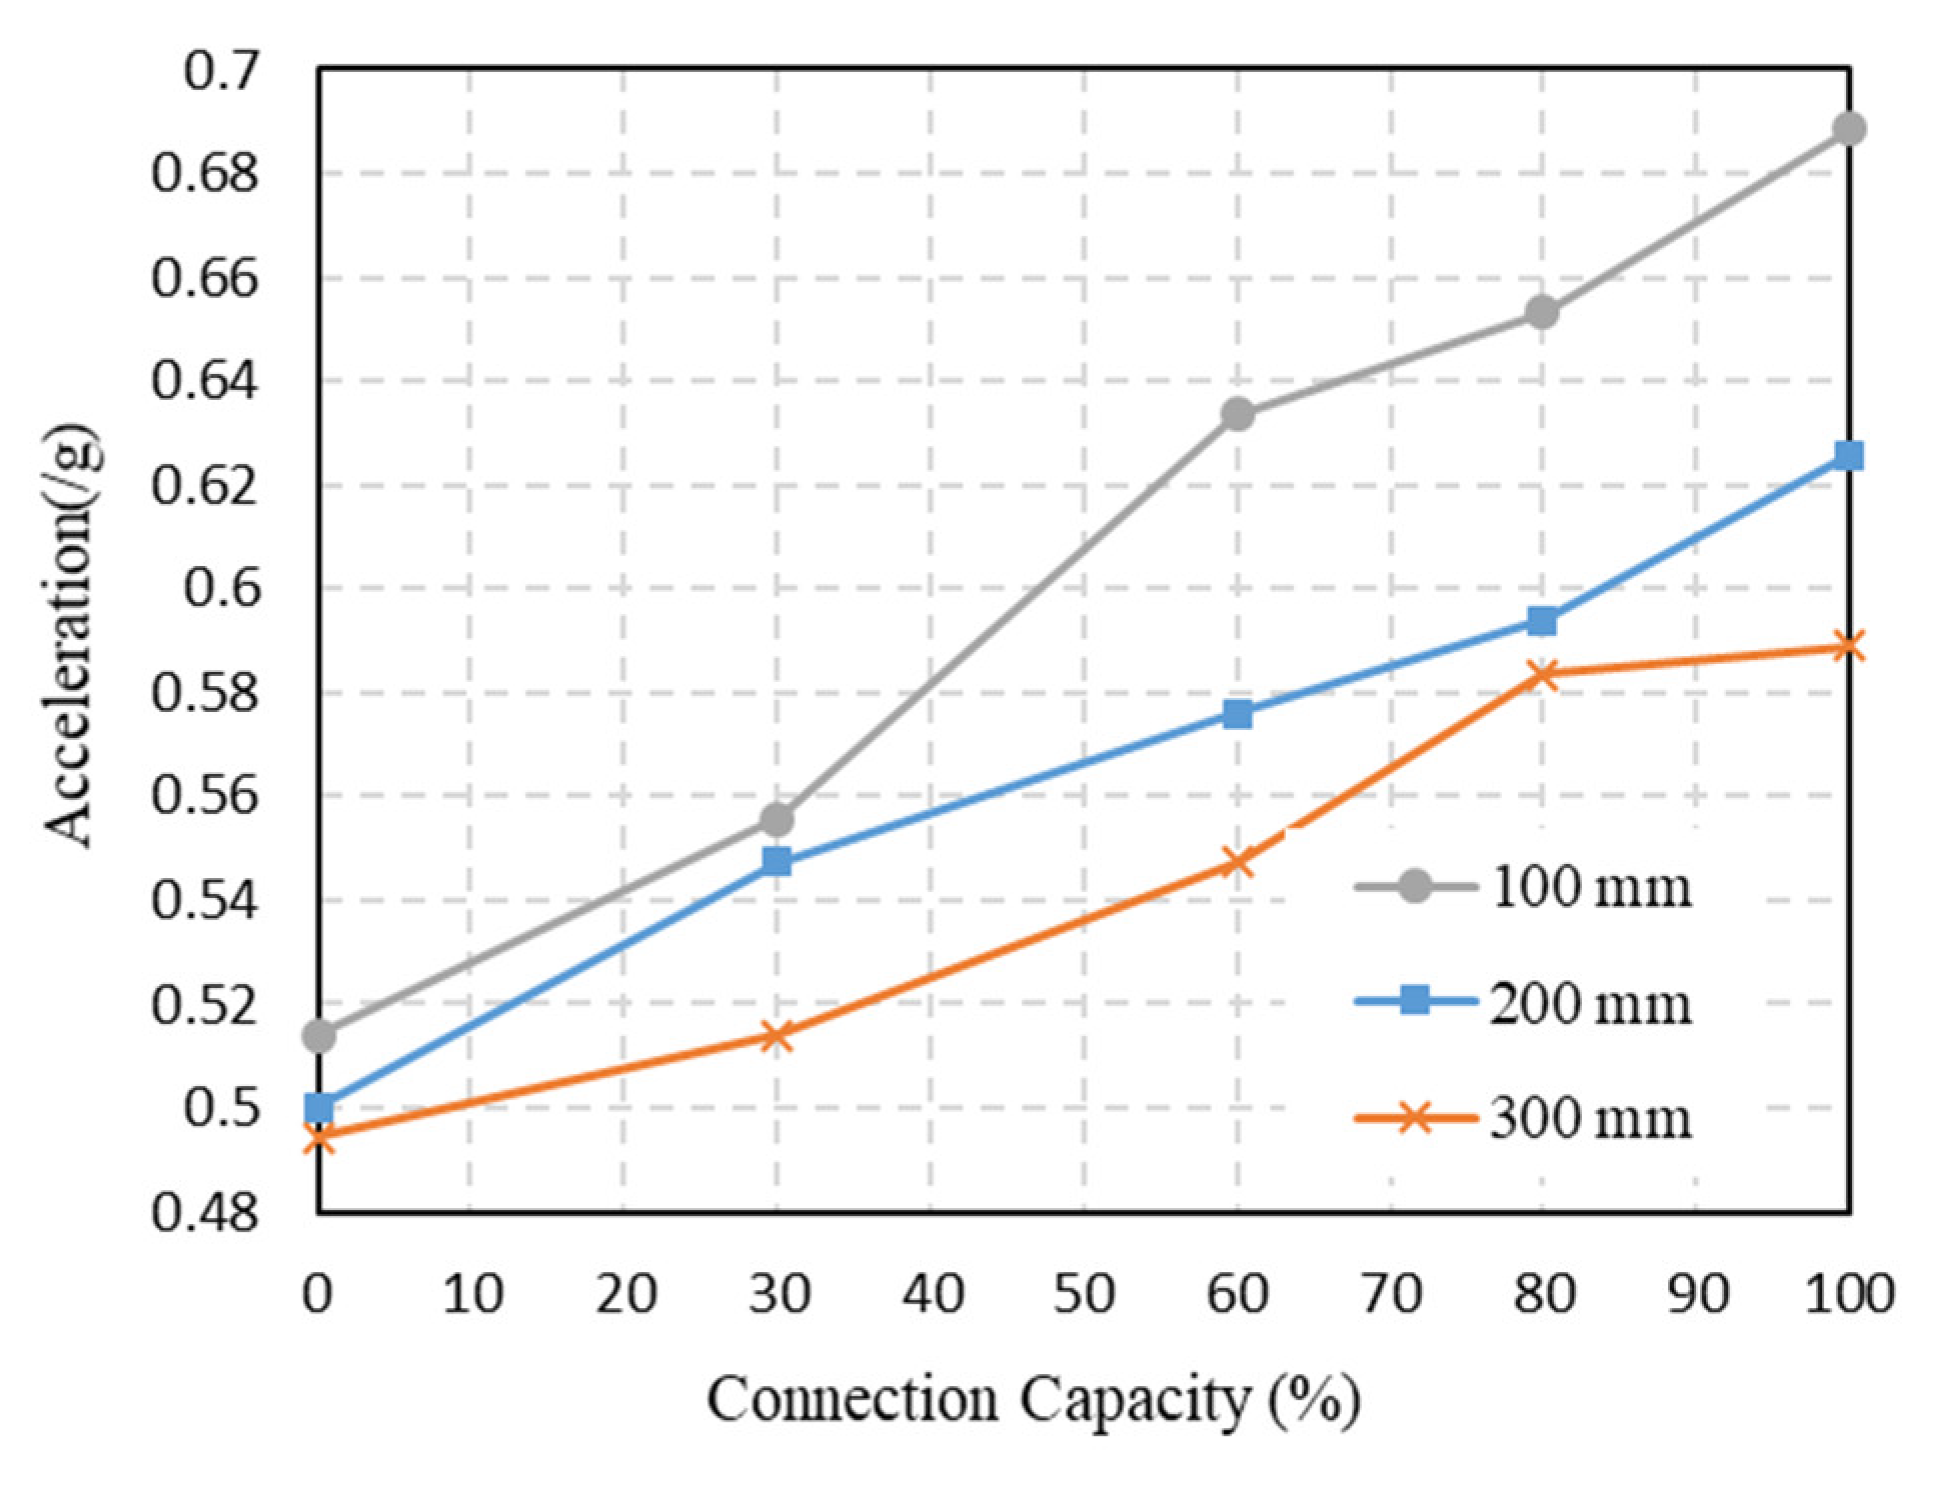
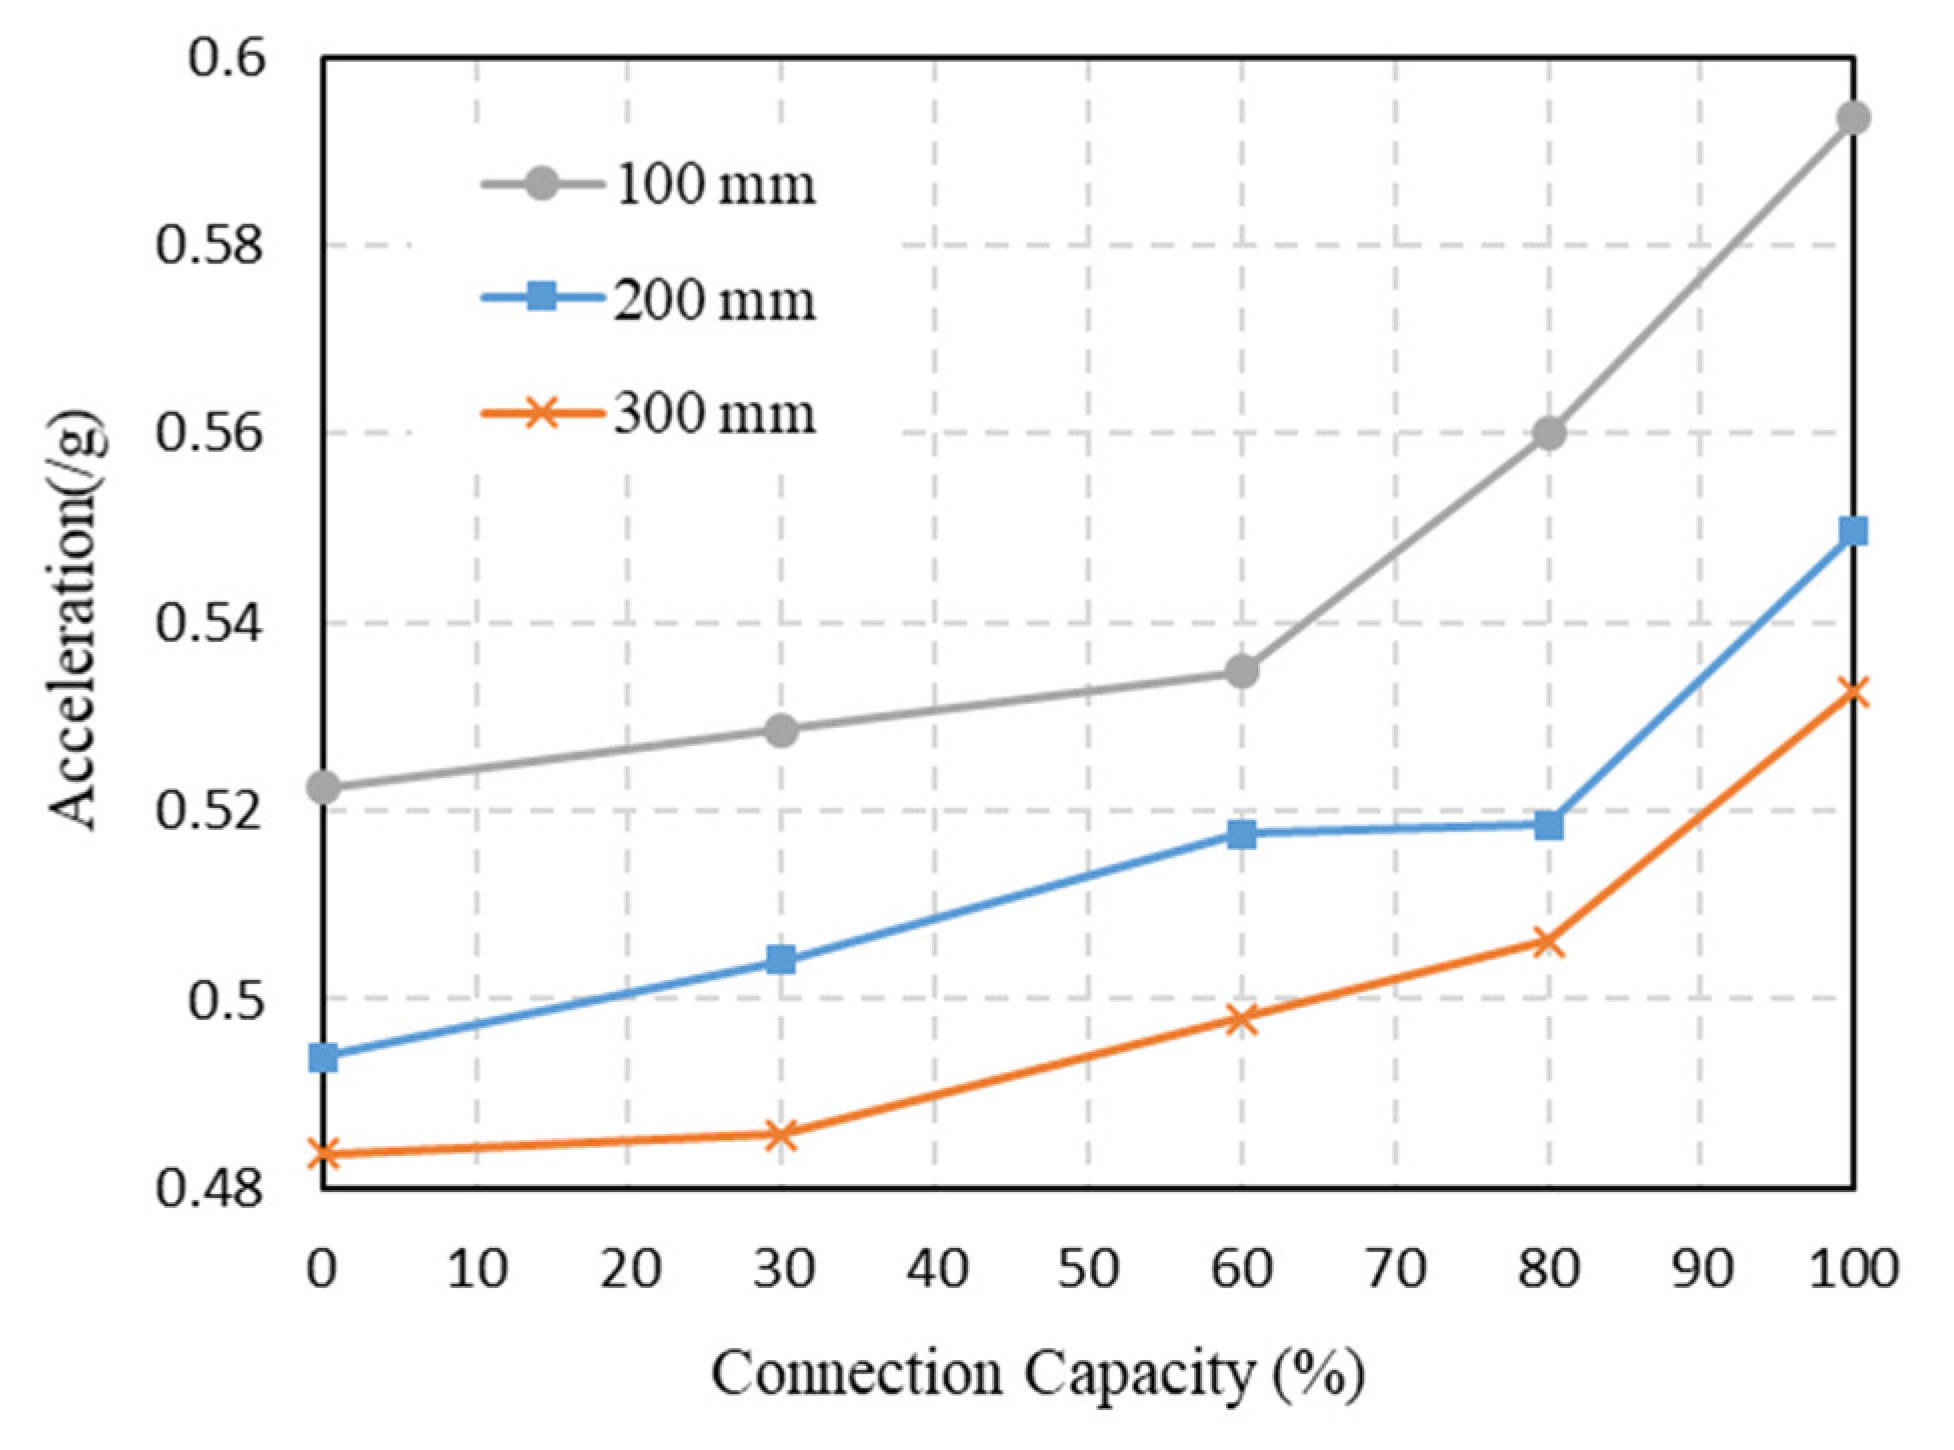
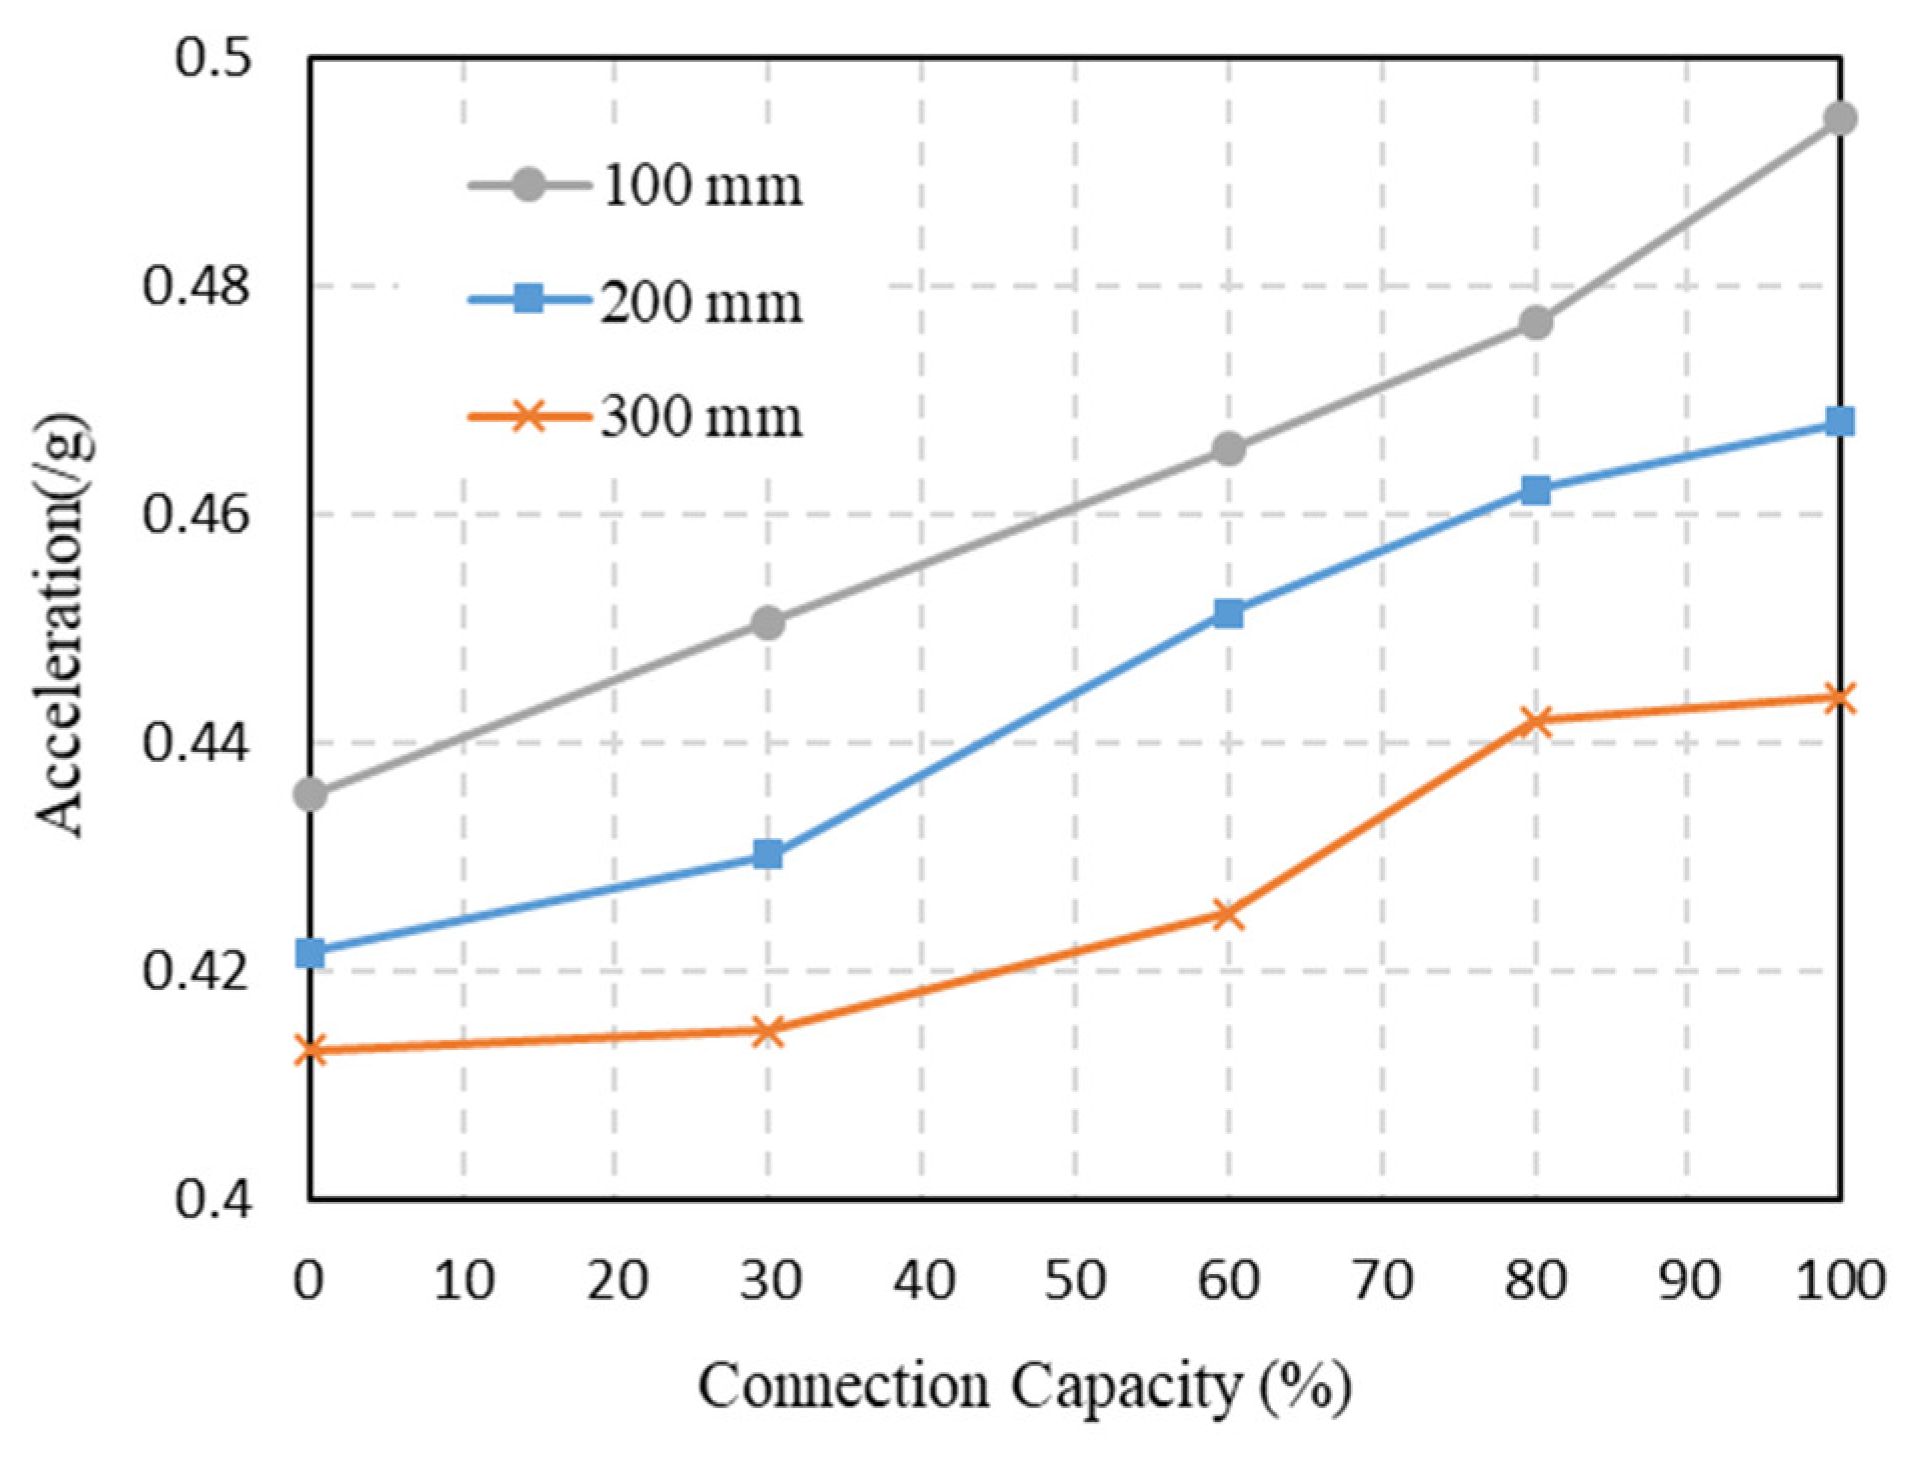
4.3. Maximum Acceleration

When considering the serviceability of structures after seismic loading, it is key to find the peak acceleration of different stories. In order to understand the influence of connection flexibility on maximum story acceleration, Figure 22 is presented. Figure 22 illustrates the maximum story acceleration in each story of the frames presented in Figure 3 with different connection rigidities and SPSWs with 200 mm holes implemented in them.
Higher ductility structures embody a damping mechanism that is able to dissipate high-acceleration ground motions [53]. It is further proven in Figure 22a that by using ductile (non-rigid) connections, the peak story acceleration decreased. In the case of observing the non-structural members’ forces, not paying attention to the semi-rigid connections’ behavior may lead to miscalculated engineering judgements. Frames in these circumstances will not show an accurate behavior at distinct levels of performance. The third story in the five-story frames experienced the peak story acceleration, and by assuming the connections to be fully rigid, resulted in 7.12%, 15.78% and 21.63% errors for the 80%, 60% and 30% rigid frames, respectively.
As shown in Figure 22b, all of the selected 10-story frames, except the one with 80% capacity in its semi-rigid connection, experienced maximum acceleration at their third story; however, in the 60% and 30% rigid frames, the story accelerations were relatively close to the fully rigid frame. As the semi-rigid capacity decreased to 0%, maximum story acceleration in the third story decreased by 9.87%.
Figure 22c shows that by enhancing the rigidity of the connections in the 15-story frames, peak story accelerations were reduced by 12.16%. Maximum story accelerations were observed at the fifth story and as the structure’s story level increased from 6 to 15, the maximum story acceleration decreased. The attributed errors of the 15-story frames were 2.96%, 7.95% and 11.32% for 80%, 60% and 30% rigidity, respectively.
In Figure 23, Figure 24 and Figure 25, the maximum acceleration of the 5-, 10- and 15-story frames responding to the earthquakes mentioned earlier are shown. As observed in these figures, the frames with rigid connections had the highest story acceleration. As mentioned earlier, by decreasing connection rigidity and perforating the SPSWs, the ductility of the frames reduces [30,32]; therefore, frames with smaller holes and higher rigidity experience higher accelerations during seismic events [53]. In order to obtain a better understanding of how much it is possible to reduce the maximum story acceleration, the figures related to the maximum story drifts must be controlled simultaneously. It emerged that some of the frames exceeded the maximum story drift recommended by ASCE 7-16 [43] and because of that, the maximum story acceleration of frames that had a maximum drift within the limit specified by ASCE 7-16 must be considered.
As clarified previously, a combination of SPSWs and semi-rigid connections in the five-story frames resulted in drifts that were all below the limit required, which was 3%. This means that implementing moment-free connections with SPSWs that have 300 mm holes and 0% rigidity is not allowed. On the other hand, according to Figure 23, SPSWs that have 100 mm holes and rigid connections resulted in maximum acceleration. Therefore, frames that had SPSWs with 200 mm holes and moment frame connections resulted in a maximum story acceleration 27.7% lower than what was expected in frames that had SPSWs with 100 mm holes and rigid connections in the adjacent spans.
Figure 24 shows the maximum acceleration for a combination of SPSWs and semi-rigid connections in the 10-story frames. The maximum allowable story drift for the frames with 10 stories was 2.38% and belonged to the frame that had SPSWs with 100 mm holes and moment-free connections implemented in them. According to Figure 24, the allowable frames had the same maximum story acceleration. Therefore, 10-story frames that had semi-rigid connections implemented in them did not experience a significant reduction in their maximum acceleration.
The maximum acceleration for the combination of SPSWs and semi-rigid connections in the 15-story frames are shown in Figure 25. The maximum allowable story drift for the 15-story frames that had SPSWs with 300 mm holes comprised semi-rigid connections with a capacity of 80% implemented in them. On the other hand, the lowest story drift for the 15-story frames was the one that had SPSWs with 100 mm holes and rigid connections. This means that, comparing these two frames, the maximum story acceleration decreased by 10.6%.

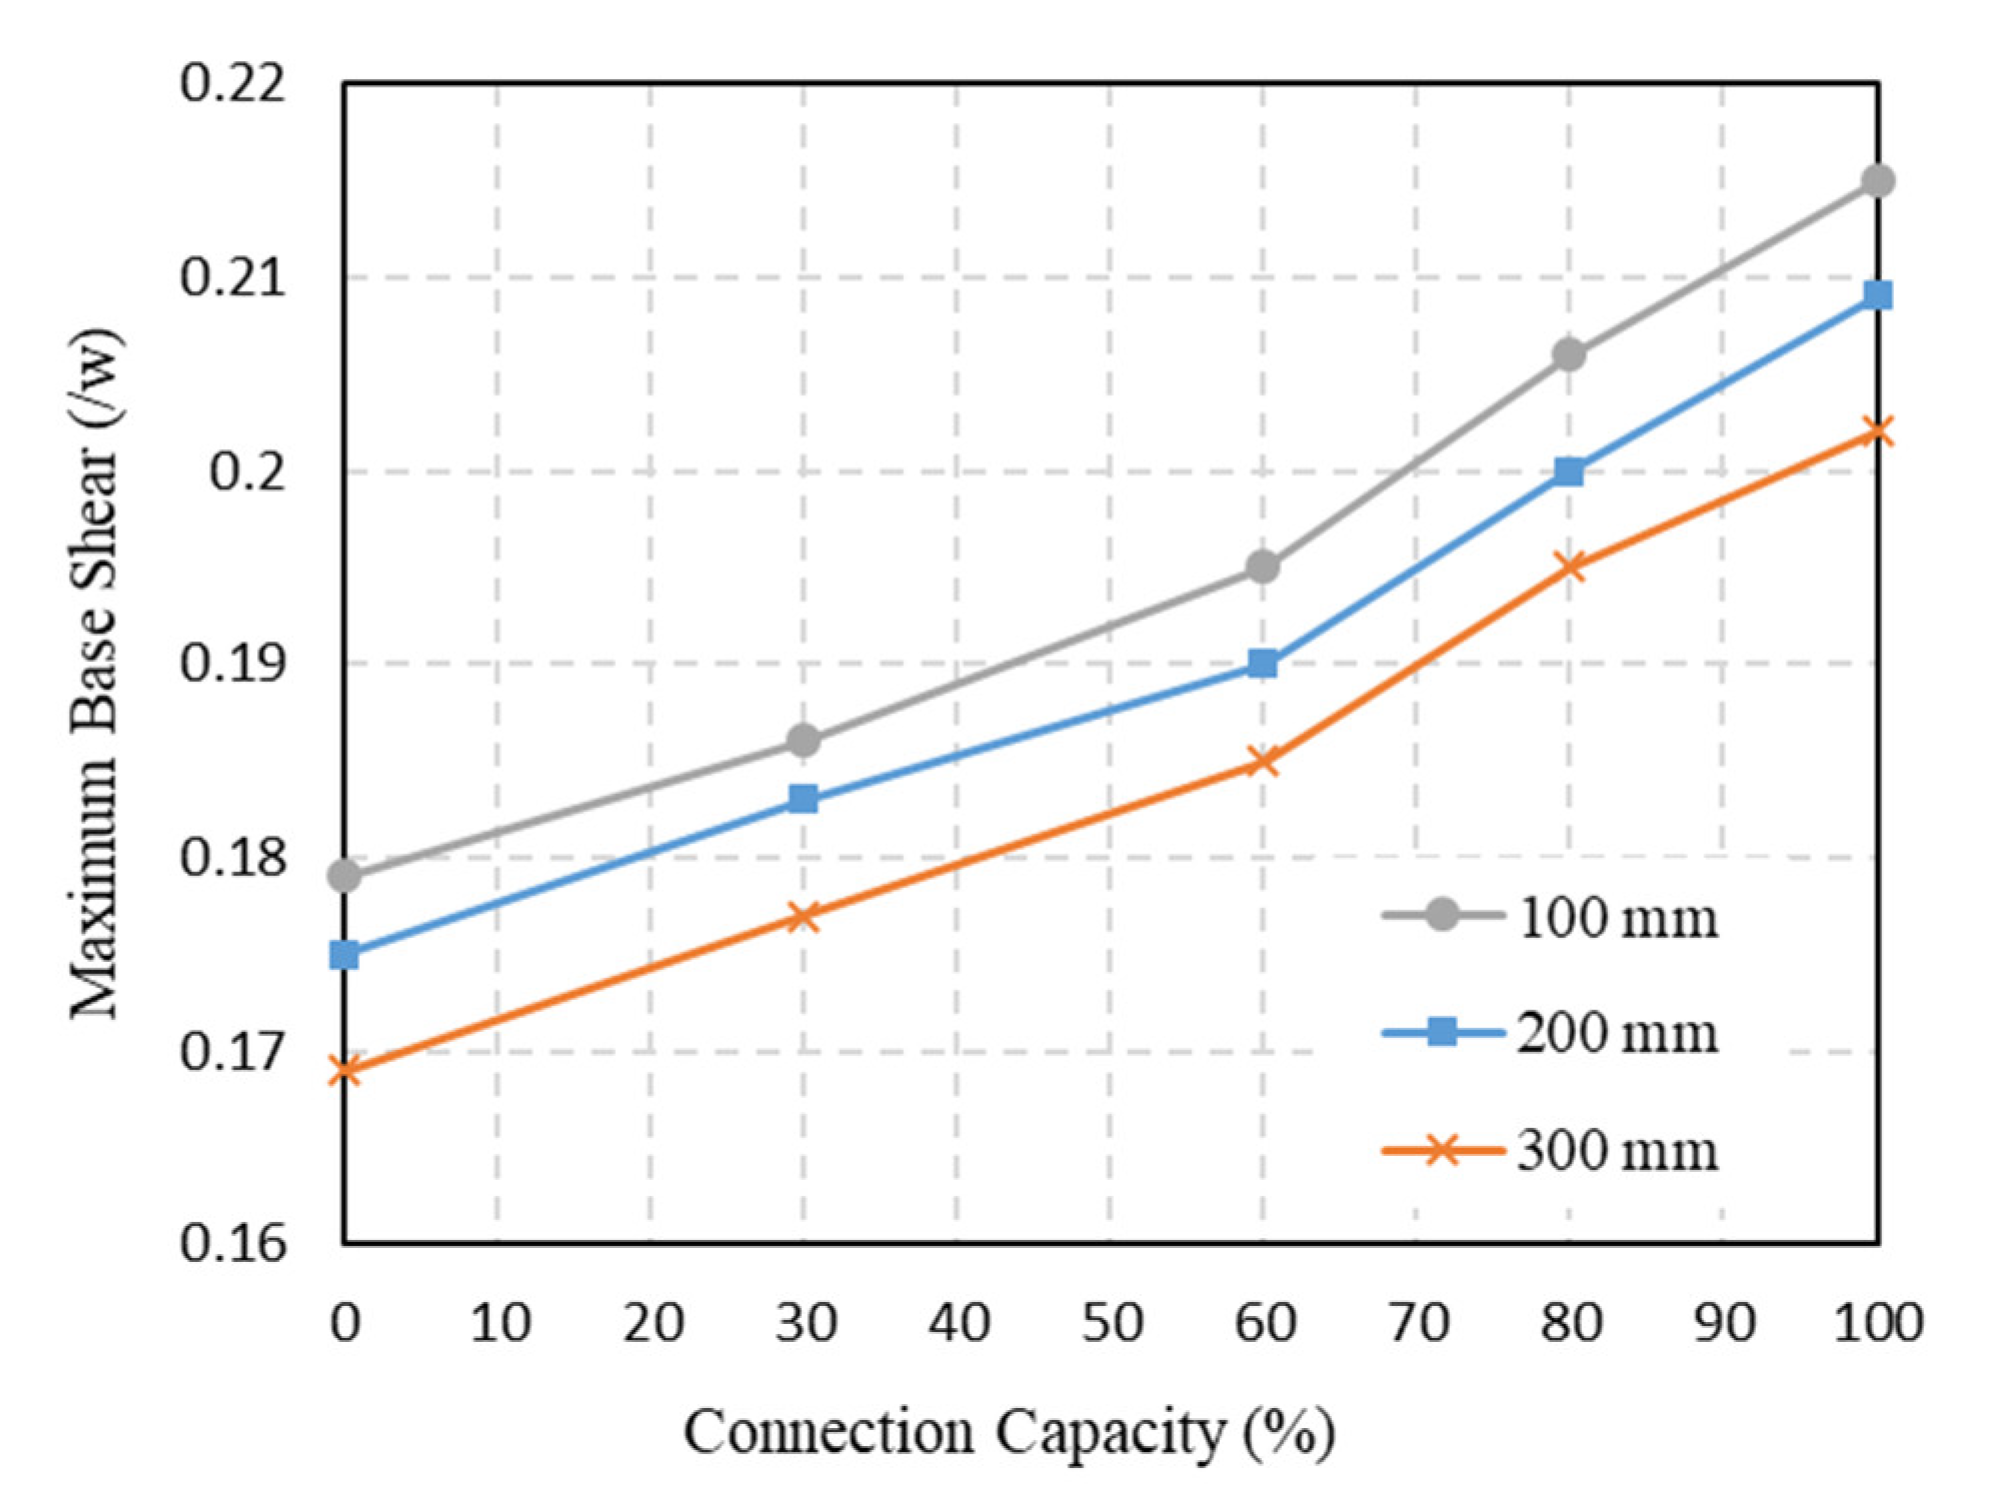
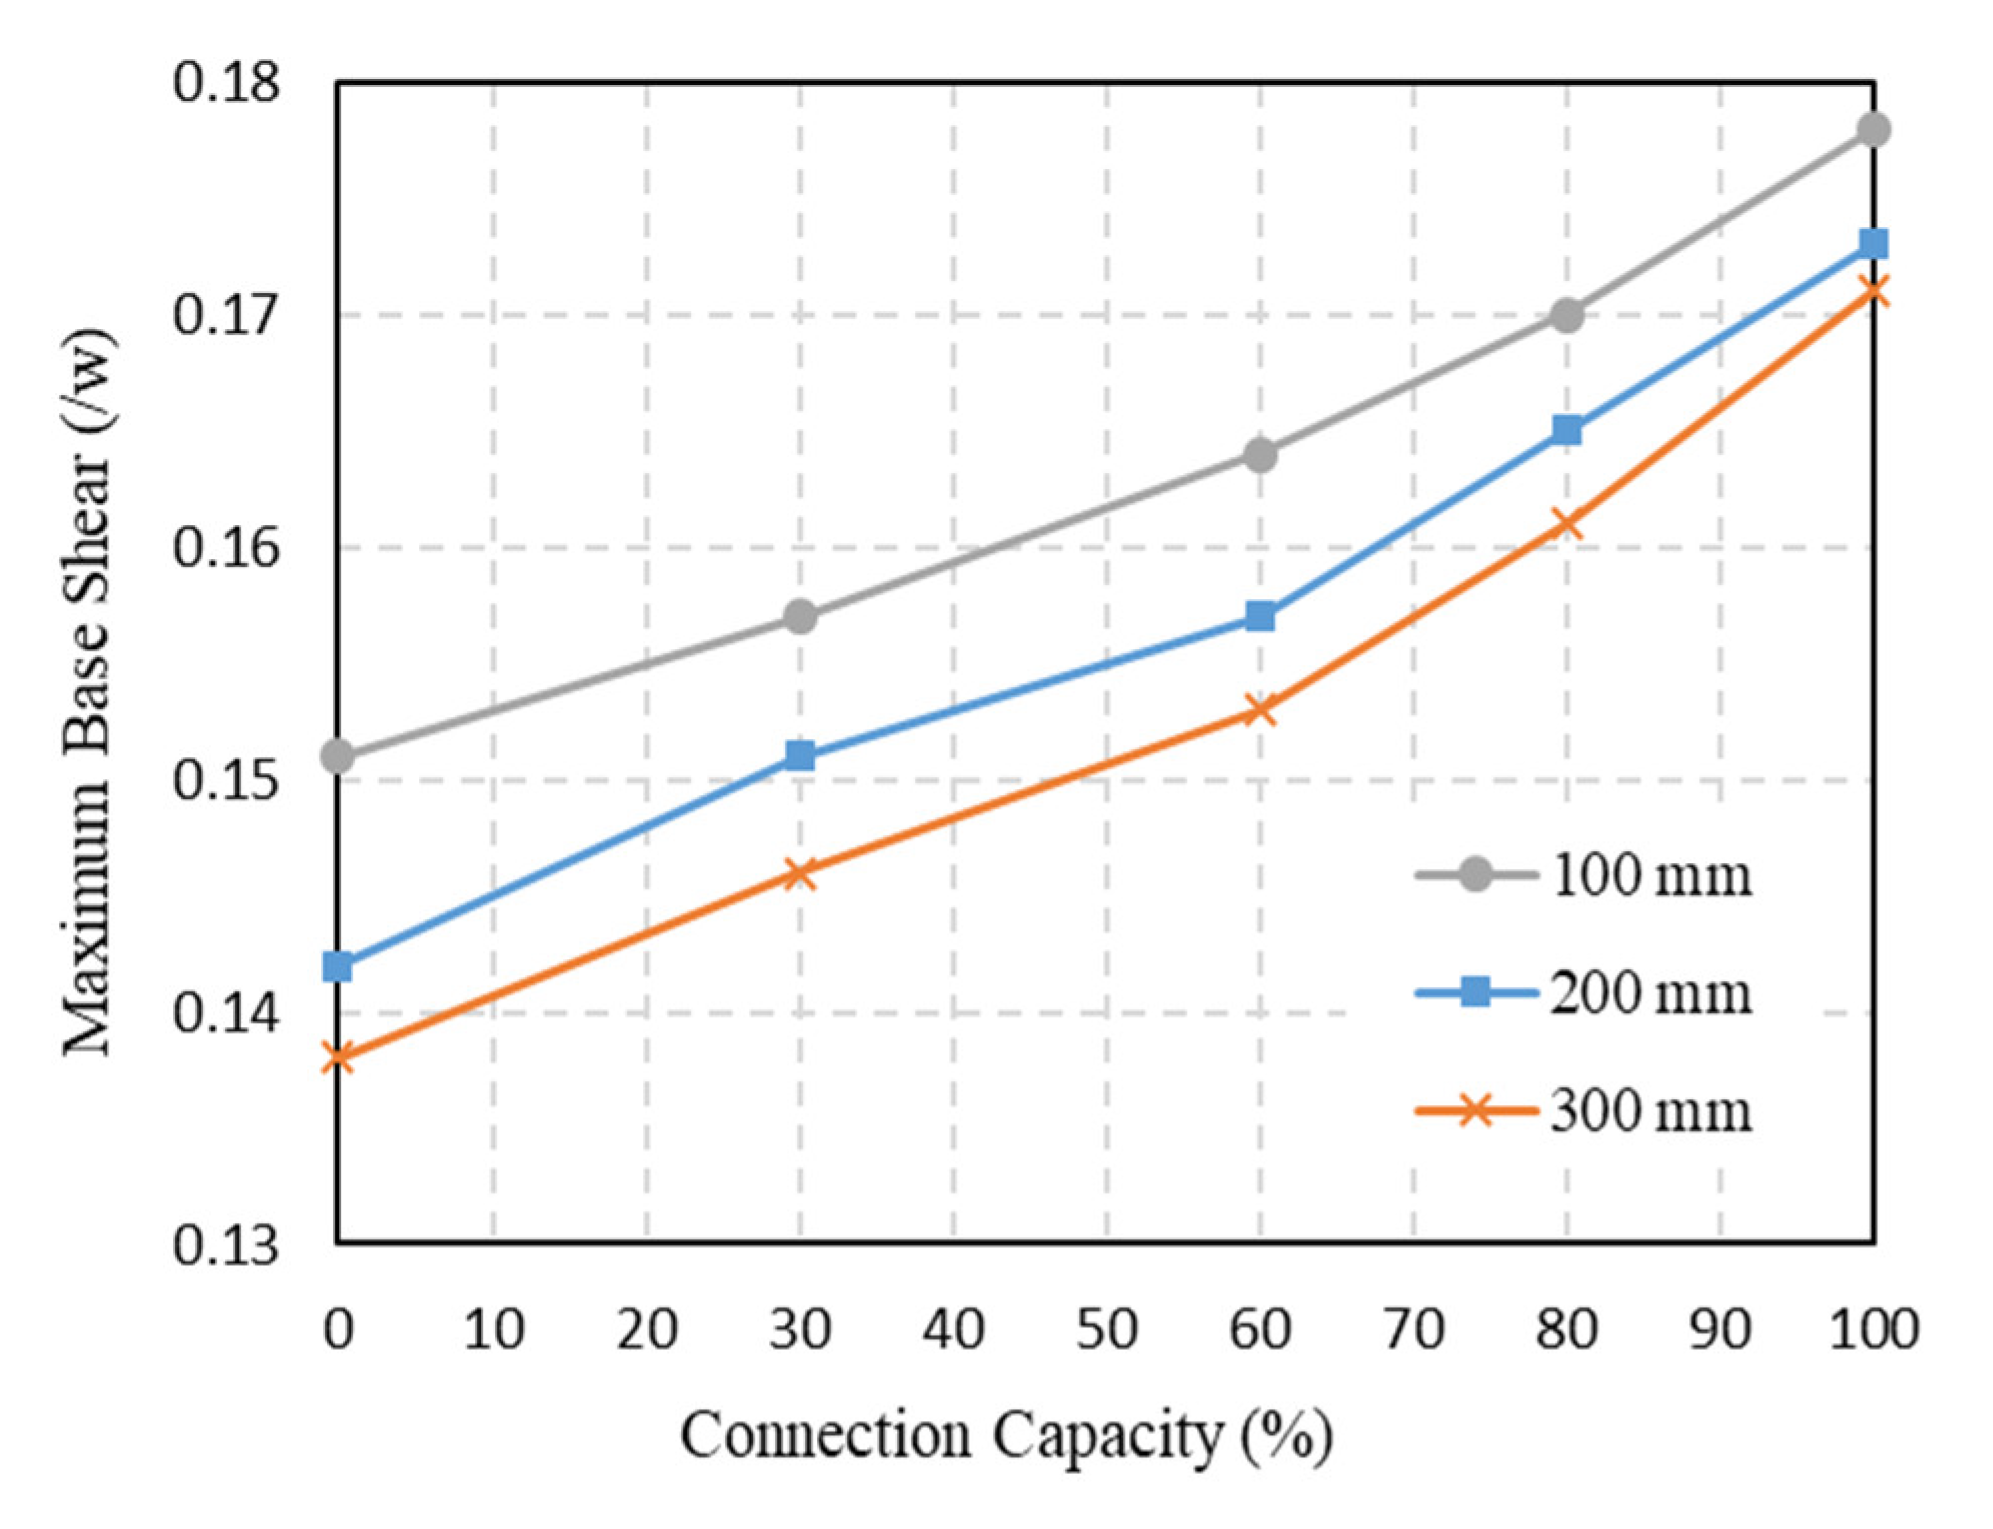
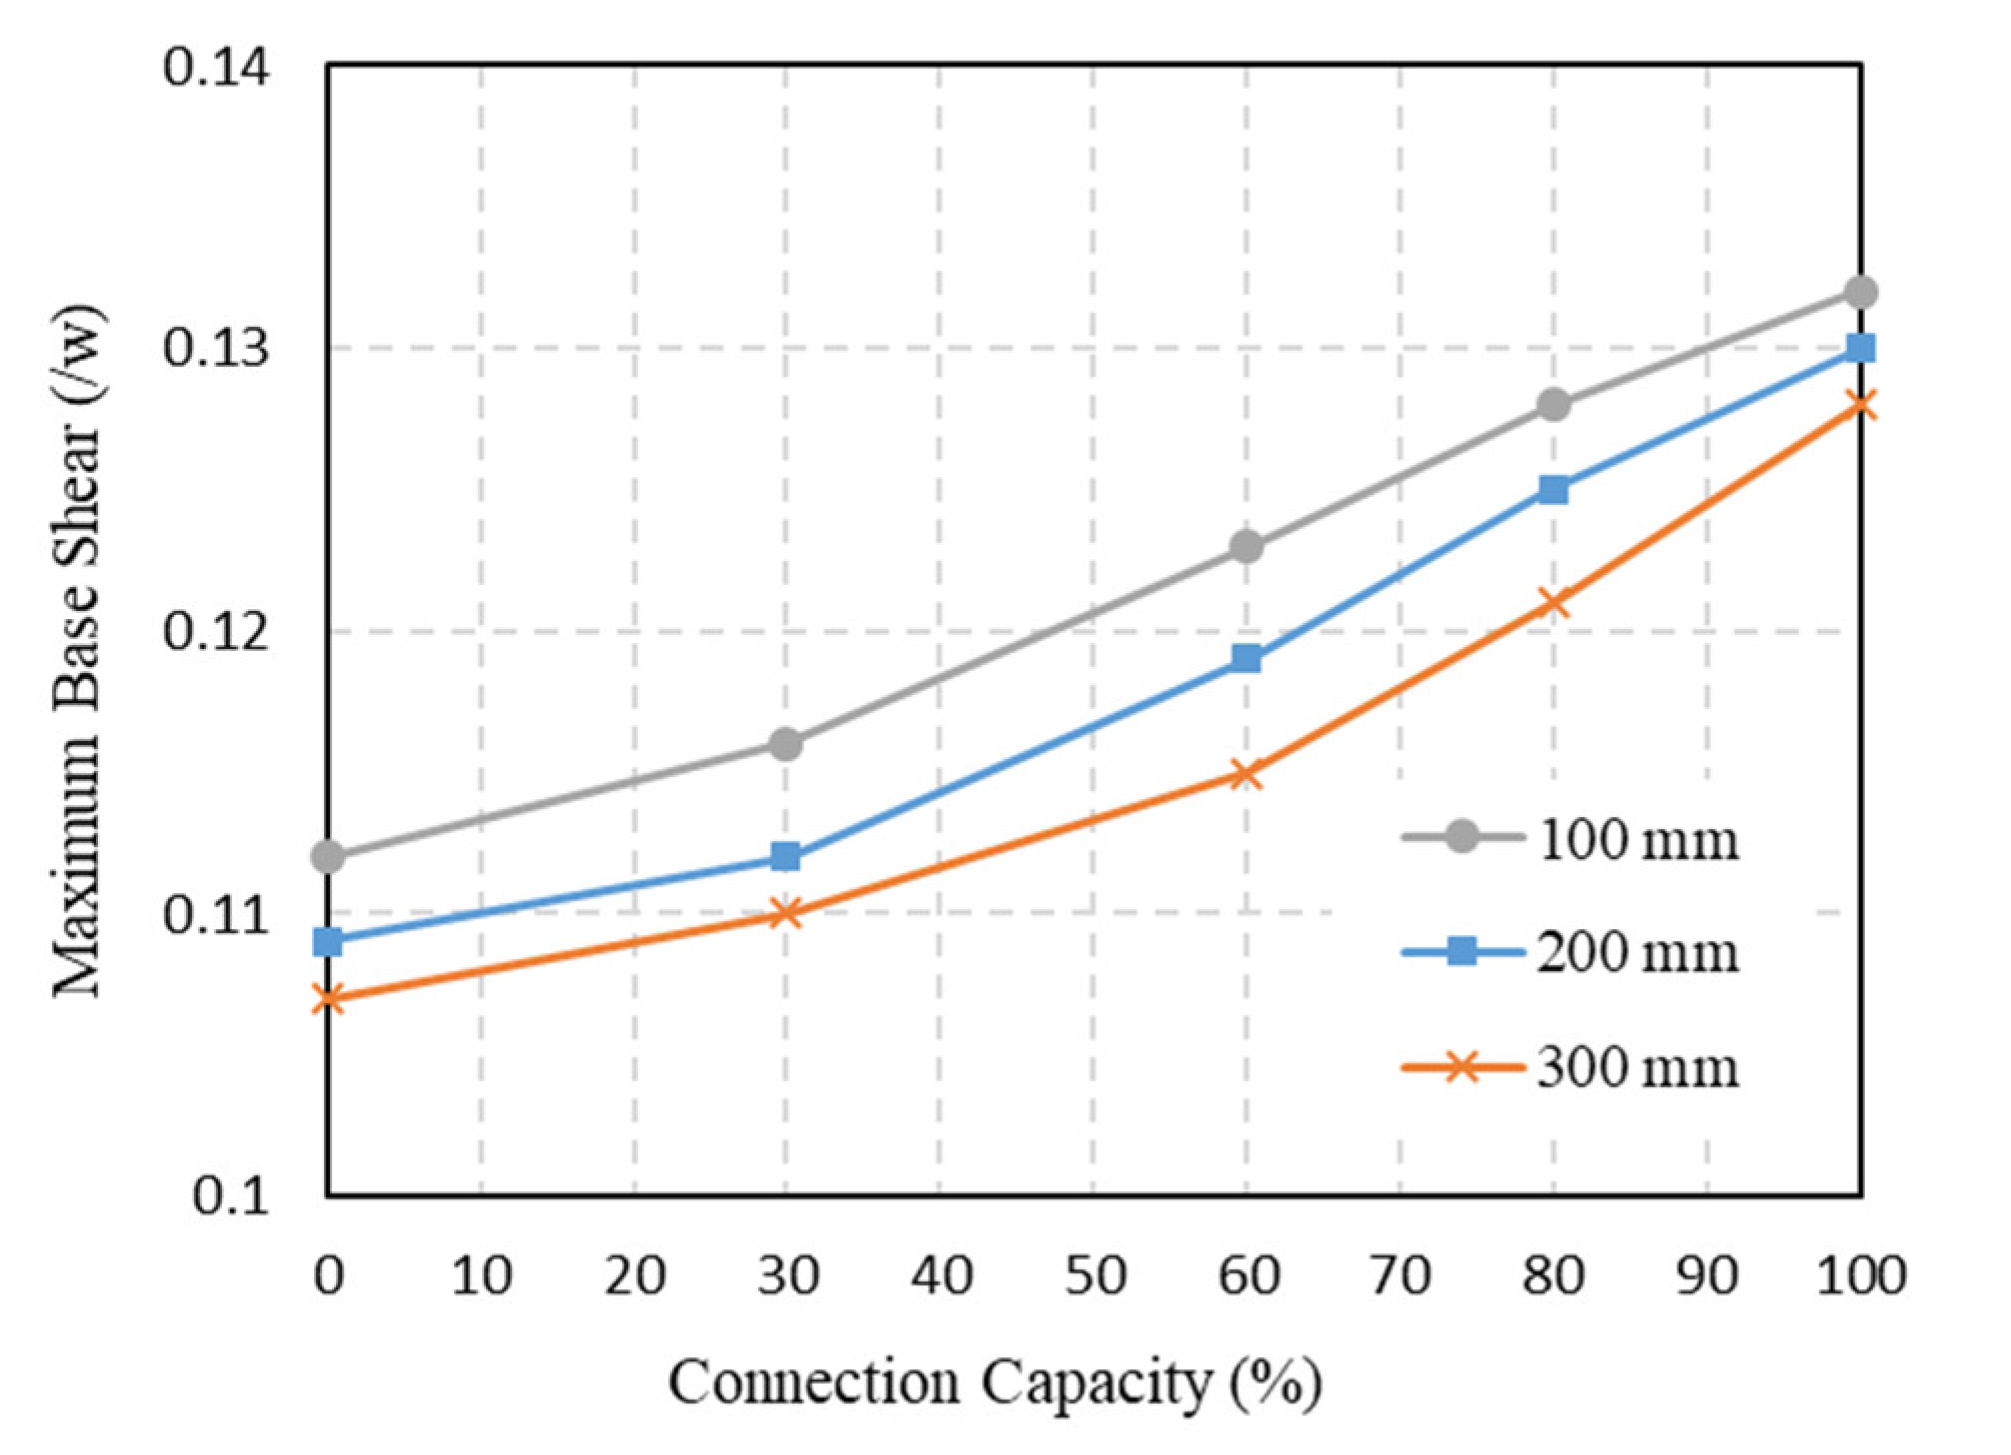
4.4. Maximum Base Shear

The maximum base shear of the 5-, 10- and 15-story frames responding to the earthquakes are shown in Figure 26, Figure 27 and Figure 28. Higher accelerations result in higher forces applied to a structure [54]. Moreover, frames with a higher ductility that face less story accelerations, as shown in the previous section (Figure 23, Figure 24 and Figure 25), will most likely experience higher force magnitudes applied to them. In other words, increasing the connection capacity and decreasing the hole diameters in the SPSWs creates higher base shear applied to the frames. As expected, the base shear rose by increasing the rigidity of the frames (Figure 26, Figure 27 and Figure 28). To understand how much it is possible to reduce the maximum base shear, the maximum story drift must be taken into consideration. It was mentioned earlier that some of the frames had exceeded the maximum story drift recommended by ASCE 7-16 [43]; hence, only the base shear of frames that have a maximum drift within the limit specified by ASCE 7-16 must be considered.
As mentioned earlier, in the five-story frames, except for one case, without neglecting any performance criteria, it was possible to implement moment-free connections with SPSWs that had 300 mm holes. On the other hand, according to Figure 26, SPSWs that had 100 mm holes and rigid connections resulted in the maximum base shear. Therefore, frames that had SPSWs with 200 mm holes and moment-free connections resulted in a base shear 18.8% lower than what was expected in frames that had SPSWs with 100 mm holes and rigid connections in the adjacent spans.
Figure 27 shows the maximum base shear for a combination of SPSWs and semi-rigid connections in the 10-story frames. As mentioned earlier, the maximum allowable story drift for the frames with 10 stories was 2.38% and belonged to the frame that had SPSWs with 200 mm holes and semi-rigid connections with full rigidity implemented in them. On the other hand, according to Figure 27, SPSWs that had 100 mm holes and rigid connections resulted in the maximum base shear. Therefore, frames that had SPSWs with 200 mm holes and rigid connections resulted in a base shear 2.8% lower than what was expected in frames that had SPSWs with 100 mm holes and rigid connections in the adjacent spans.
The maximum base shear values for a combination of SPSWs and semi-rigid connections in the 15-story frames are shown in Figure 28. The maximum allowable story drift for the 15-story frames was the one that had SPSWs with 300 mm holes and semi-rigid connections with a capacity of 80% implemented in them. Additionally, the second-highest allowable story drift for the 15-story frames was the one that had SPSWs with 200 mm holes and semi-rigid connections with a capacity of 80%. This means that the base shear in these two cases decreased by 9.1% and 6.3%, respectively, when compared to the frames that had SPSWs with 100 mm holes and rigid connections.

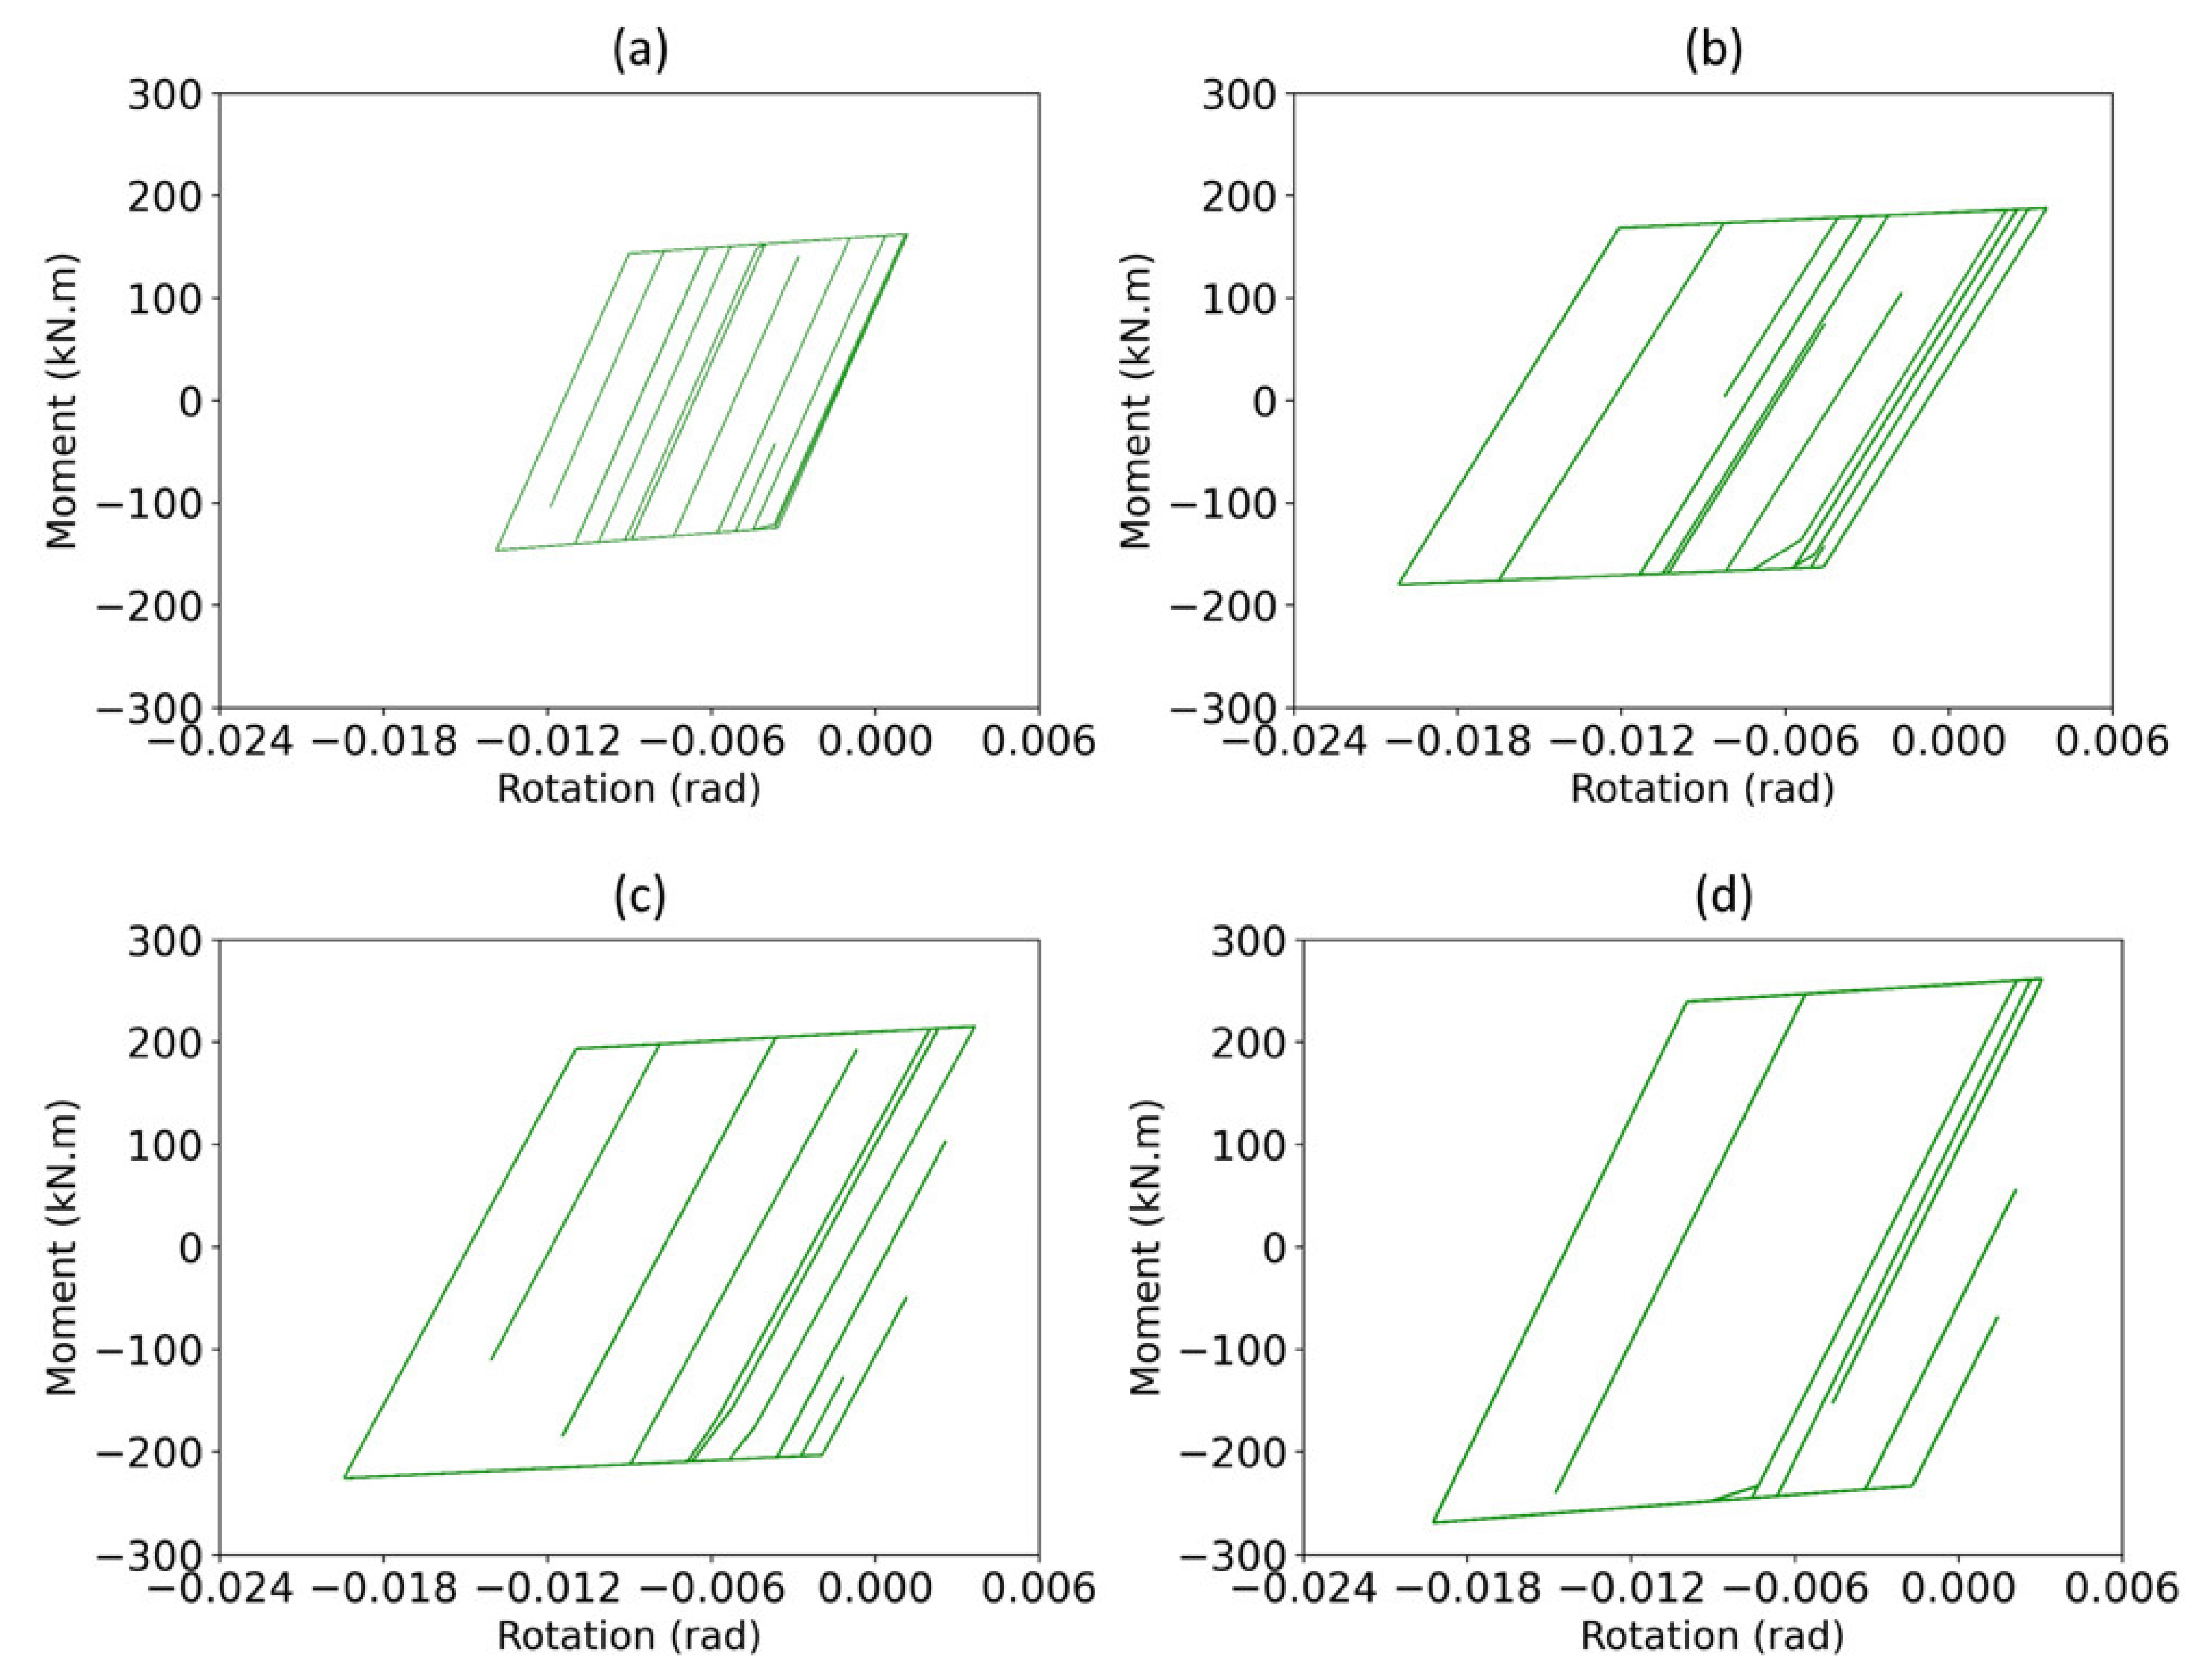
4.5. Moment–Rotation of Semi-Rigid Connections

The moment–rotation hysteresis curves of semi-rigid connections with different rigidities for 15-story frames at point A (Figure 3) impacted by the Northridge earthquake are shown in Figure 29. In order to exhibit the nonlinear behavior of the semi-rigid connections more easily, the floor with the highest relative drift, which was the 14th floor, is chosen. Connections with lower rigidities yielded earlier than connections with high rigidities and, hence, experienced more cycles and lower moment values. Figure 29 proves that the maximum rotation in frames with 60%, 80% and 100% rigidities were almost identical, but the maximum moment increased by enhancing the connection rigidity. Moreover, the number of hysteresis cycles reduced by enhancing the connection rigidity.

5. Conclusions

The primary aim of this research was related to investigating the seismic behavior SPSWs in steel frames with semi-rigid connections. Using SPSWs in frames led to the appearance of the strong-column weak-beam phenomena. Therefore, three rigid moment frames with 5, 10 and 15 stories laterally braced with SPSWs were designed. The semi-rigid connections with five different stiffnesses and lateral bracing systems of SPSWs considering three different values for the diameter of the holes were inspected as well. Considering all these cases, a total of 45 frames were analyzed. All models were subjected to five selected earthquake records from which the maximum story drift, acceleration and base shear were highlighted. Moreover, the following conclusions were made:
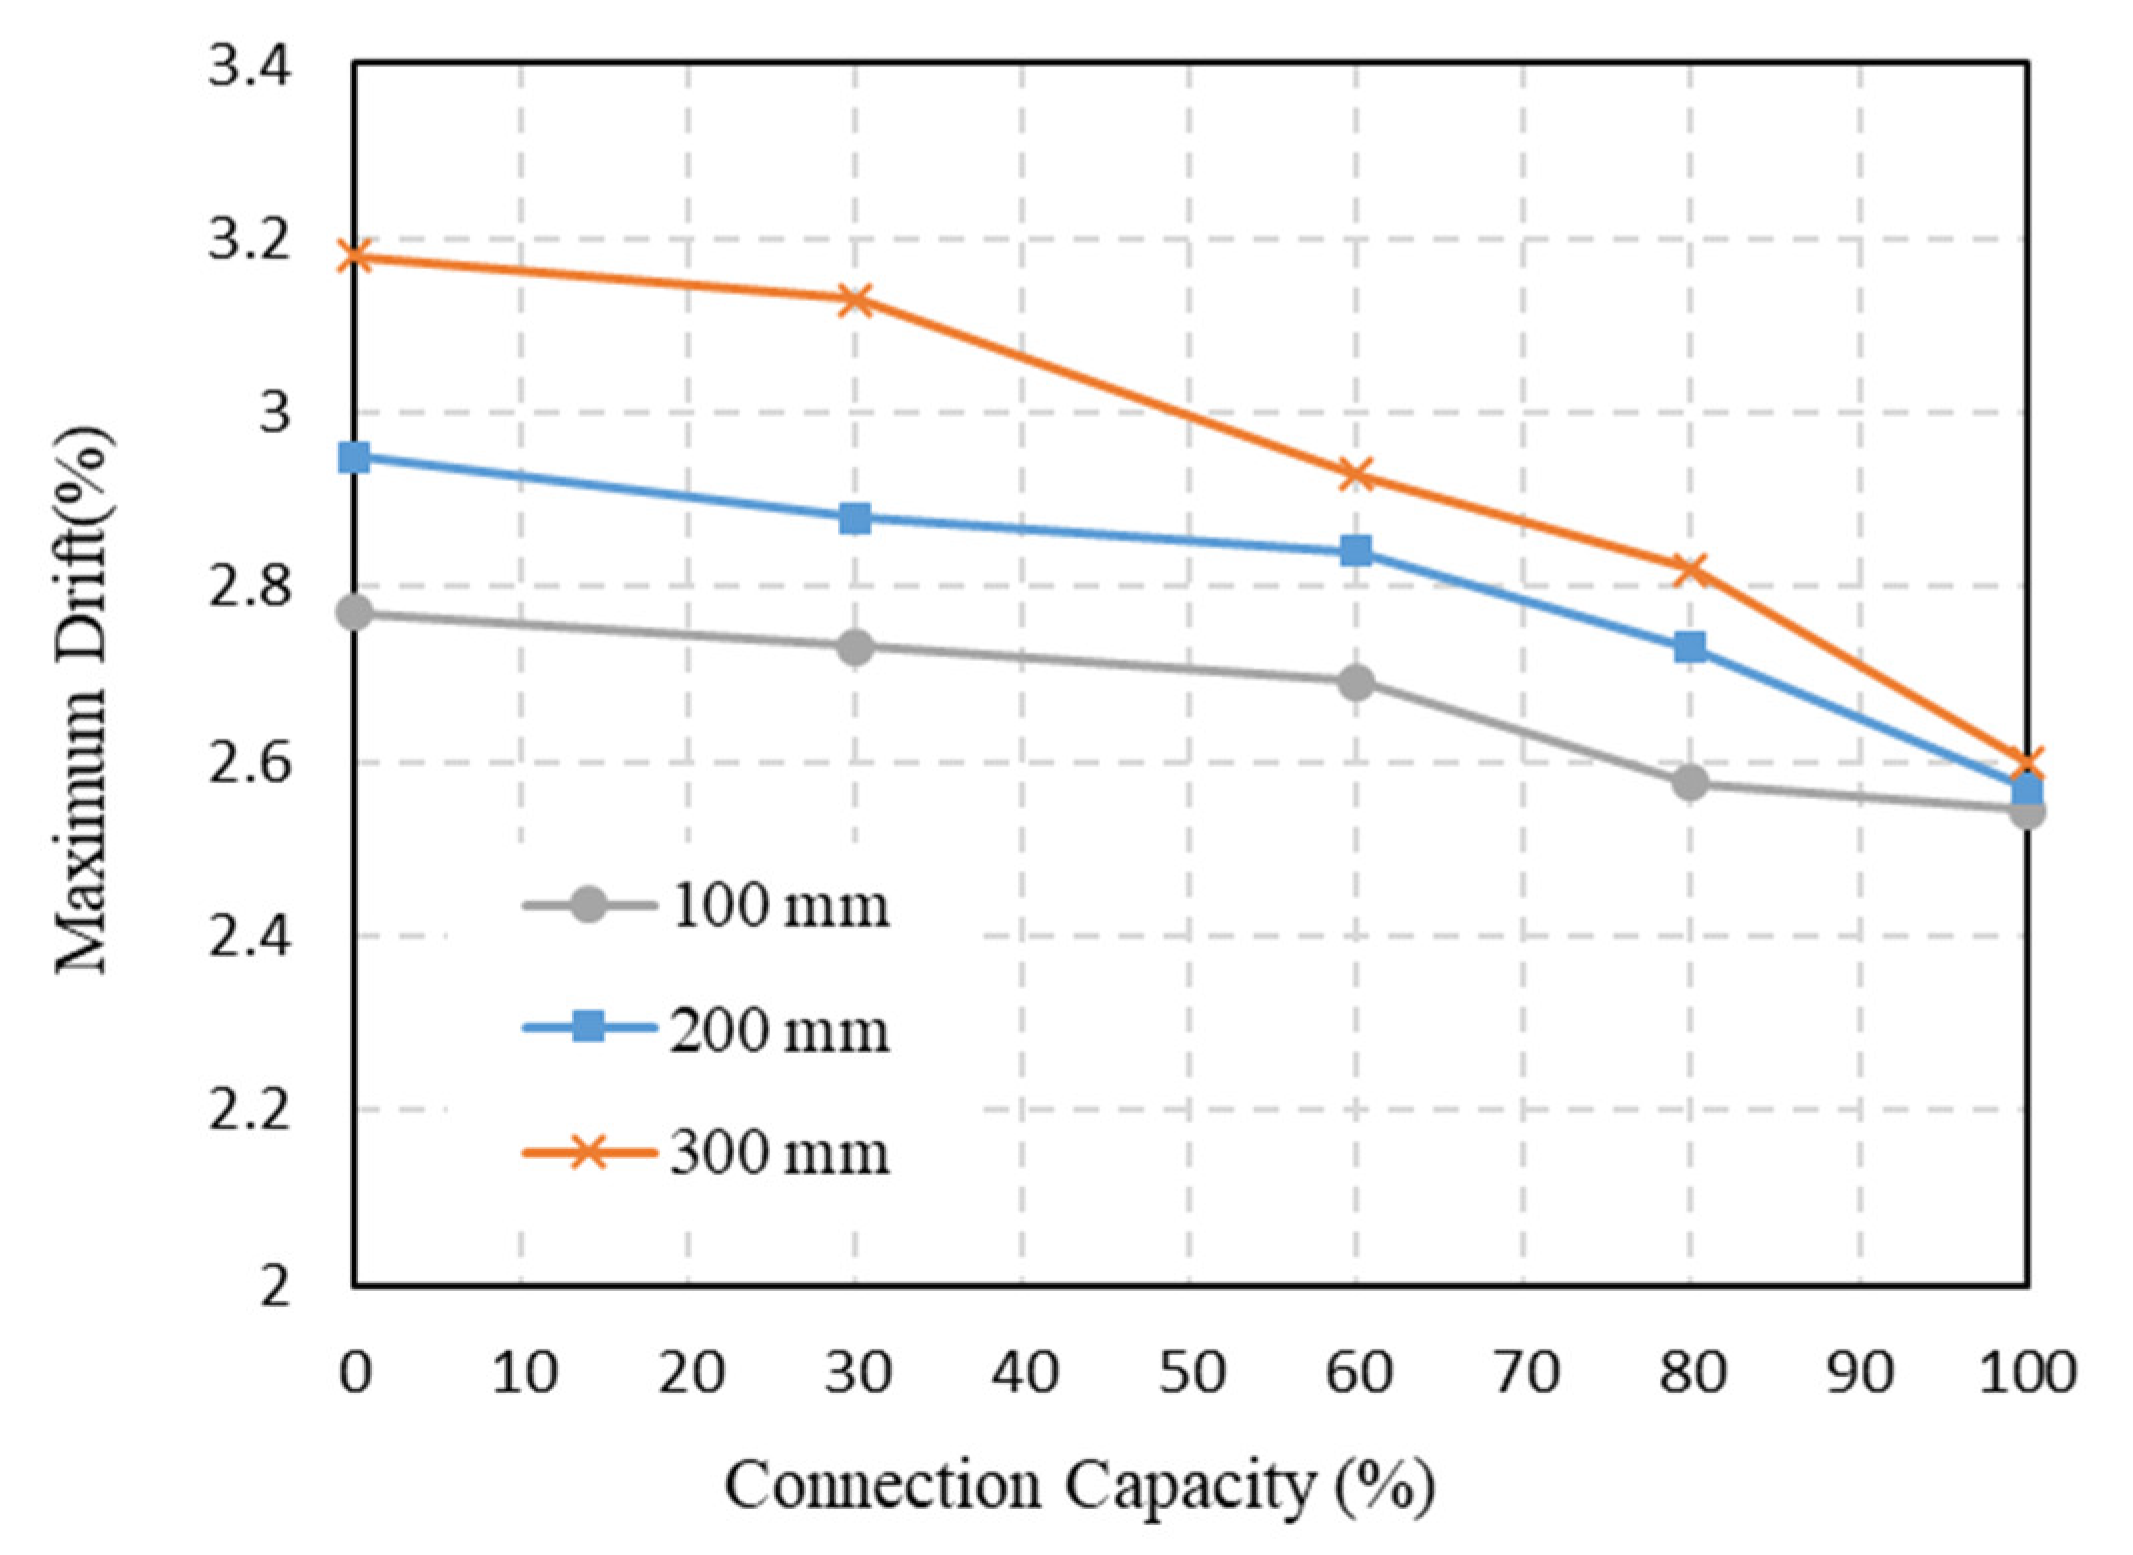
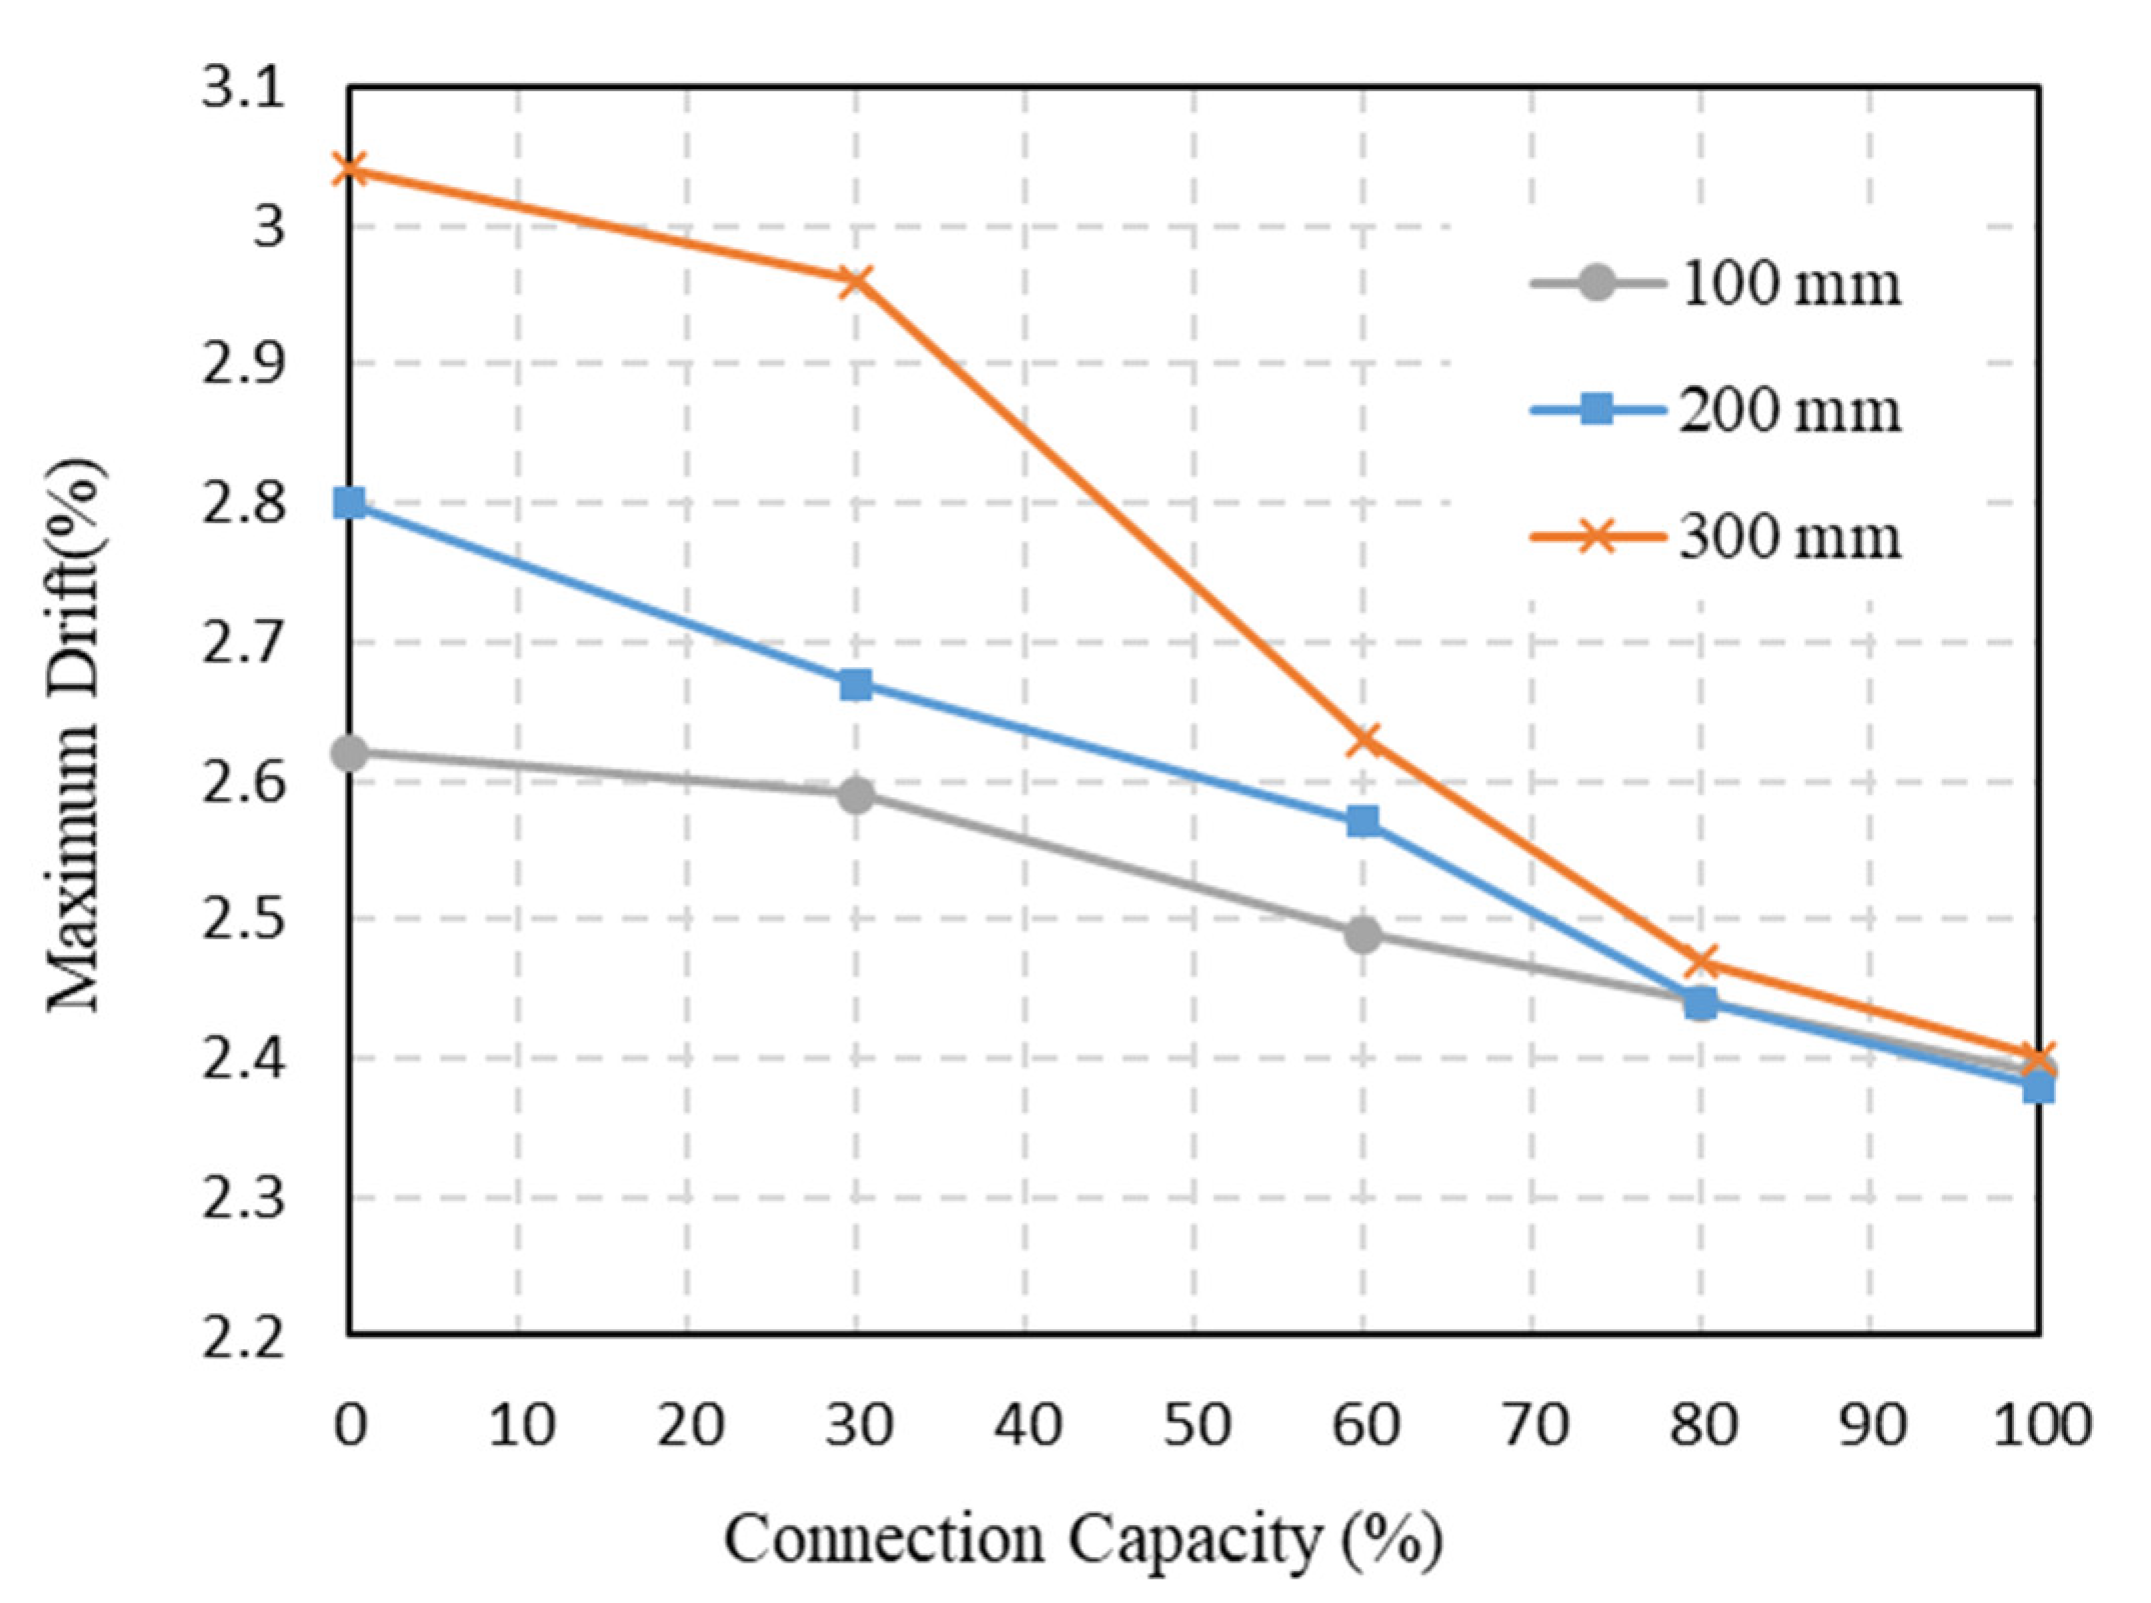
  • Maximum story acceleration, story drift and the base shear significantly decrease by reducing the capacity of semi-rigid connections and increasing the perforation diameter in the SPSWs.
  • When the connection flexibility is considered in the structural behavior of frames, the stiffness and strength of structure decreased, while the flexibility, energy dissipation and tolerance against large deformations increased. By assuming a fully rigid connection, the notable ratio of the flexibility and hysteresis behavior that is able to dissipate energy is overseen. This issue leads to overdesigning the frames and unrealistically predicting the structure’s response.
  • The results illustrate that the inter-story drifts of the low-rise, mid-rise and high-rise frames play an important role in the design process of frames with semi-rigid connections and SPSW lateral bracing systems. Moreover, the limiting criteria for inter-story drift cause a number of frames with lower connection rigidities and SPSWs with larger-diameter holes to be unacceptable.
  • In the low-rise steel frames, as the rigidity of connections decreased and the diameter of holes in the SPSW lateral bracing systems increased, the stories’ residual displacement enhanced considerably. Therefore, by using the most optimal design in terms of connection capacity and the diameter of holes in the SPSW, the maximum story acceleration and base shear reduced by the amounts of 27.7% and 18.8%, respectively.
  • The mid-rise frames experienced the highest story acceleration at the third floor. Moreover, by paying attention to the 2.4% inter-story drift limit as one of the most important controlling criteria, the mid-rise steel frames did not experience a significant reduction in terms of maximum story acceleration and base shear.
  • For the high-rise steel frames, the highest inter-story drift was observed at the 14th floor. Additionally, by considering the 2.4% inter-story drift limit, the high-rise steel frames could have a maximum story acceleration and base shear reduction of 10.6% and 9.1%, respectively.
  • It was understood from the results that the best combination of SPSW lateral systems and semi-rigid connections should be obtained by performing further analysis in order to reach the best design of an SPSW system.
  • Once base shear decreases by using semi-rigid connections and SPSWs with higher flexibility, designers will be able to use smaller sections for beams and columns resulting in lighter frames and cost reduction. Moreover, a structural system that has a combination of semi-rigid connections and SPSWs helps to limit the inter-story drift and satisfy the strong-column weak-beam criteria.
  • The present study provides engineers with a new efficient structural system that could be used for the design of low-rise, mid-rise and high-rise structures.
  • Scholars and engineers are encouraged to further investigate the applicability of such a system that implements both SPSWs and semi-rigid connections. This includes providing designers with a simple method rather than complex nonlinear dynamic models to find the best configuration for a structure that is aiming to implement SPSWs.
  • Further study is required to understand the performance of such a dual system (with a combination of SPSWs and semi-rigid connections) with different types of openings implemented in the SPSWs.
A regular floor plan was used in this study to understand the performance of a structure using both SPSWs and semi-rigid connections. However, the applicability of such a system must be further analyzed in structures with irregular floor plans.

Author Contributions

Conceptualization, A.M. and M.G.; methodology, A.M. and H.A.-G.; software, A.M. and H.A.-G.; validation, A.M., H.A.-G. and O.B.; formal analysis, A.M. and H.A.-G.; investigation, A.M., H.A.-G., R.A. and M.G.; resources, A.M. and H.A.-G.; data curation, A.M. and H.A.-G.; writing—original draft preparation, A.M. and H.A.-G.; writing—review and editing, H.A.-G. and A.R.M.; visualization, A.M., H.A.-G. and O.B.; supervision, M.G., R.A. and A.R.M.; project administration, M.G. and R.A. All authors have read and agreed to the published version of the manuscript.

Funding

This research received no external funding.

Conflicts of Interest

Authors declare no conflict of interest.

References

  1. Valente, M.; Castiglioni, C.A.; Kanyilmaz, A. Welded fuses for dissipative beam-to-column connections of composite steel frames: Numerical analyses. J. Constr. Steel Res. 2017, 128, 498–511. [Google Scholar] [CrossRef]
  2. Ozcelik, Y.; Clayton, P.M. Seismic design and performance of SPSWs with beam-connected web plates. J. Constr. Steel Res. 2018, 142, 55–67. [Google Scholar] [CrossRef]
  3. Jin, S.; Du, H.; Bai, J. Seismic performance assessment of steel frame structures equipped with buckling-restrained slotted steel plate shear walls. J. Constr. Steel Res. 2021, 182, 106699. [Google Scholar] [CrossRef]
  4. Azandariani, A.G.; Gholhaki, M.; Azandariani, M.G. Assessment of damage index and seismic performance of steel plate shear wall (SPSW) system. J. Constr. Steel Res. 2022, 191, 107157. [Google Scholar] [CrossRef]
  5. Paslar, N.; Farzampour, A.; Hatami, F. Investigation of the infill plate boundary condition effects on the overall performance of the steel plate shear walls with circular openings. In Structures; Elsevier: Amsterdam, The Netherlands, 2020; pp. 824–836. [Google Scholar]
  6. Bai, J.; Huang, J.; Chen, H.; Xu, L.; Wang, Y.-H.; Jin, S. Loading protocols for seismic qualification of steel plate shear walls. In Structures; Elsevier: Amsterdam, The Netherlands, 2022; pp. 848–860. [Google Scholar]
  7. Tan, J.-K.; Su, M.-N.; Wang, Y.-H.; Wang, K.; Cao, Y.-Q.; Li, P. Experimental study on cyclic shear performance of steel plate shear wall with different buckling restraints. In Structures; Elsevier: Amsterdam, The Netherlands, 2022; pp. 469–482. [Google Scholar]
  8. Jin, S.; Yang, C.; Bai, J. Experimental and numerical investigation of a novel PBL connection between the RC frame and corrugated steel plate shear wall. In Structures; Elsevier: Amsterdam, The Netherlands, 2022; pp. 1235–1246. [Google Scholar]
  9. Jones, S.W.; Kirby, P.A.; Nethercort, D.A. The analysis of frames with semi-rigid connections—a state-of-the-art report. J. Constr. Steel Res. 1983, 3, 2–13. [Google Scholar] [CrossRef]
  10. Mahmoud, H.N.; Elnashai, A.S.; Spencer, B.F., Jr.; Kwon, O.-S.; Bennier, D.J. Hybrid simulation for earthquake response of semirigid partial-strength steel frames. J. Struct. Eng. 2013, 139, 1134–1148. [Google Scholar] [CrossRef]
  11. Kishi, N.; Chen, W.F. Steel Construction Data Bank Program. Struct. Eng. Rep. No. CE-STR 1986, 86, 18. [Google Scholar]
  12. Nader, M.N.; Astaneh, A. Dynamic behavior of flexible, semirigid and rigid steel frames. J. Constr. Steel Res. 1991, 18, 179–192. [Google Scholar] [CrossRef]
  13. Bernuzzi, C.; Zandonini, R.; Zanon, P. Experimental analysis and modelling of semi-rigid steel joints under cyclic reversal loading. J. Constr. Steel Res. 1996, 38, 95–123. [Google Scholar] [CrossRef]
  14. Shi, Y.; Shi, G.; Wang, Y. Experimental and theoretical analysis of the moment–rotation behaviour of stiffened extended end-plate connections. J. Constr. Steel Res. 2007, 63, 1279–1293. [Google Scholar] [CrossRef]
  15. Abidelah, A.; Bouchaïr, A.; Kerdal, D.E. Experimental and analytical behavior of bolted end-plate connections with or without stiffeners. J. Constr. Steel Res. 2012, 76, 13–27. [Google Scholar] [CrossRef]
  16. Kim, S.-E.; Choi, S.-H. Practical advanced analysis for semi-rigid space frames. Int. J. Solids Struct. 2001, 38, 9111–9131. [Google Scholar] [CrossRef]
  17. Aksoylar, N.D.; Elnashai, A.S.; Mahmoud, H. The design and seismic performance of low-rise long-span frames with semi-rigid connections. J. Constr. Steel Res. 2011, 67, 114–126. [Google Scholar] [CrossRef]
  18. Aksoylar, N.D.; Elnashai, A.S.; Mahmoud, H. Seismic performance of semirigid moment-resisting frames under far and near field records. J. Struct. Eng. 2012, 138, 157–169. [Google Scholar] [CrossRef]
  19. Bayat, M.; Zahrai, S.M. Seismic performance of mid-rise steel frames with semi-rigid connections having different moment capacity. Steel Compos. Struct. 2017, 25, 1–17. [Google Scholar]
  20. Munesi, A.; Gholhaki, M.; Sharbatdar, M. Numerical study on seismic behaviour of buckling-restrained steel plate shear walls. Proc. Inst. Civ. Eng. Build. 2020, 175, 537–550. [Google Scholar]
  21. Shahi, N.; Adibrad, M.H. Finite-element analysis of steel shear walls with low-yield-point steel web plates. Proc. Inst. Civ. Eng. Build. 2018, 171, 326–337. [Google Scholar] [CrossRef]
  22. Tan, J.-K.; Wang, Y.-H.; Nie, X.; Wang, K.; Tian, Z. Numerical modelling and equivalent brace model of cold-formed steel buckling-restrained steel plate shear walls. J. Constr. Steel Res. 2022, 193, 107289. [Google Scholar] [CrossRef]
  23. Shahzad, M.M.; Wang, X.; Abdulhadi, M. Comparative response assessment of different steel plate shear walls (SPSWs) under near-field ground motion. J. Constr. Steel Res. 2022, 190, 107147. [Google Scholar] [CrossRef]
  24. Jalali, S.A.; Darvishan, E. Seismic demand assessment of self-centering steel plate shear walls. J. Constr. Steel Res. 2019, 162, 105738. [Google Scholar] [CrossRef]
  25. Thorburn, L.J.; Montgomery, C.J.; Kulak, G.L. Analysis of Steel Plate Shear Walls; Structural Engineering Report No. 107; Department of Civil Engineering: Ota City, Tokyo, Japan; University of Alberta: Edmonton, AB, Canada, 1983. [Google Scholar]
  26. Driver, R.G.; Kulak, G.L.; Kennedy, D.J.L.; Elwi, A.E. Cyclic test of four-story steel plate shear wall. J. Struct. Eng. 1998, 124, 112–120. [Google Scholar] [CrossRef]
  27. Rezai, M. Seismic Behaviour of Steel Plate Shear Walls by Shake Table Testing. Ph.D. Thesis, University of British Columbia, Vancouver, Canada, 1999. [Google Scholar]
  28. Elgaaly, M.; Caccese, V.; Du, C. Postbuckling behavior of steel-plate shear walls under cyclic loads. J. Struct. Eng. 1993, 119, 588–605. [Google Scholar] [CrossRef]
  29. Timler, P.A.; Kulak, G.L. Experimental Study of Steel Plate Shear Walls; Structural Engineering Report No. 114; Department of Civil Engineering: Ota City, Tokyo, Japan; University of Alberta: Edmonton, AB, Canada, 1983. [Google Scholar]
  30. Roberts, T.M.; Sabouri-Ghomi, S. Hysteretic characteristics of unstiffened perforated steel plate shear panels. Thin-Walled Struct. 1992, 14, 139–151. [Google Scholar] [CrossRef]
  31. Lubell, A.S.; Prion, H.G.L.; Ventura, C.E.; Rezai, M. Unstiffened steel plate shear wall performance under cyclic loading. J. Struct. Eng. 2000, 126, 453–460. [Google Scholar] [CrossRef]
  32. Vian, D.; Bruneau, M.; Tsai, K.-C.; Lin, Y.-C. Special perforated steel plate shear walls with reduced beam section anchor beams. I: Experimental investigation. J. Struct. Eng. 2009, 135, 211–220. [Google Scholar] [CrossRef]
  33. Kharrazi, M.H.K.; Ventura, C.E.; Prion, H.G.L.; Sabouri-Ghomi, S. Bending and shear analysis and design of ductile steel plate walls. In Proceedings of the 13th World Conference on Earthquake Engineering, Vancouver, BC, Canada, 1–6 August 2004. [Google Scholar]
  34. Bhowmick, A.K.; Driver, R.G.; Grondin, G.Y. Seismic analysis of steel plate shear walls considering strain rate and P–delta effects. J. Constr. Steel Res. 2009, 65, 1149–1159. [Google Scholar] [CrossRef]
  35. Jadhav, M.B.; Patil, G.R. Review on steel plate shear wall for tall buildings. Int. J. Sci. Res. 2014, 3. [Google Scholar]
  36. Ghassemieh, M.; Bamshad, O. Deterioration hystersis model for steel plated shear wall system. Modares Civ. Eng. J. 2019, 19, 15–28. [Google Scholar]
  37. Maddahi, M.; Gerami, M.; Naderpour, H. Numerical study of reliability index of structure rehabilitated with steel shear wall. Proc. Inst. Civ. Eng. Build. 2021, 1–16. [Google Scholar] [CrossRef]
  38. Berman, J.; Bruneau, M. Plastic analysis and design of steel plate shear walls. J. Struct. Eng. 2003, 129, 1448–1456. [Google Scholar] [CrossRef]
  39. Vatansever, C.; Berman, J.W. Analytical investigation of thin steel plate shear walls with screwed infill plate. Steel Compos. Struct. 2015, 19, 1145–1165. [Google Scholar] [CrossRef]
  40. Qin, Y.; Lu, J.-Y.; Huang, L.-C.-X.; Cao, S. Flexural behavior of beams in steel plate shear walls. Steel Compos. Struct. 2017, 23, 473–481. [Google Scholar] [CrossRef]
  41. Bamshad, O.; Ghassemieh, M. Development of modified Ibarra–Krawinkler deterioration model for one-story steel plate shear wall. Int. J. Steel Struct. 2020, 20, 1730–1754. [Google Scholar] [CrossRef]
  42. ANSI/AISC 360–10; AISC. Specification for Structural Steel Buildings. American Institute of Steel Construction: Chicago, IL, USA, 2010.
  43. ASCE 7. Minimum Design Loads for Buildings and Other Structures; American Society of Civil Engineers: Reston, VA, USA; Structural Engineering Institute: Weston, FL, USA, 2016. [Google Scholar]
  44. Epstein, H.I.; D’Aiuto, C. Using moment and axial interaction equations to account for moment and shear lag effects in tension members. Eng. J. 2002, 39, 91–99. [Google Scholar]
  45. FEMA. FEMA 356: Prestandard and Commentary for the Seismic Rehabilitation of Buildings; Federal Emergency Management Agency: Washington, DC, USA, 2000. [Google Scholar]
  46. Stelmack, T.W.; Marley, M.J.; Gerstle, K.H. Analysis and tests of flexibly connected steel frames. J. Struct. Eng. 1986, 112, 1573–1588. [Google Scholar] [CrossRef]
  47. Vasdravellis, G.; Valente, M.; Castiglioni, C.A. Dynamic response of composite frames with different shear connection degree. J. Constr. Steel Res. 2009, 65, 2050–2061. [Google Scholar] [CrossRef]
  48. ANSI/AISC 341–10; AISC. Seismic Provisions for Structural Steel Buildings. American Institute of Steel Construction: Chicago, IL, USA, 2010.
  49. A572-15; ASTM. Standard Specification for High-Strength Low-Alloy Columbium-Vanadium Structural Steel. ASTM: West Conshohocken, PA, USA, 2015.
  50. Shishkin, J.J.; Driver, R.G.; Grondin, G.Y. Analysis of steel plate shear walls using the modified strip model. J. Struct. Eng. 2009, 135, 1357–1366. [Google Scholar] [CrossRef]
  51. Krawinkler, H. Guidelines for Cyclic Seismic Testing of Components of Steel Structures; Applied Technology Council: Redwood City, CA, USA, 1992. [Google Scholar]
  52. Dubina, D.; Ciutina, A.; Stratan, A.; Dinu, F. Ductility demand for semi-rigid joint frames. Moment Resist. Connect. Steel Fram. Seism. Areas. 2000, 371–408. [Google Scholar]
  53. Cheikh, B.; Moussa, L.; Zerzour, A.; Mehani, Y. Inelastic Response and Ductility Demand of Structures. In Proceedings of the 15th World Conference of Earthquake Engineering, Lisbon, Portugal, 24–28 September 2012. [Google Scholar]
  54. Lopez, O.A.; Cruz, M. Number of modes for the seismic design of buildings. Earthq. Eng. Struct. Dyn. 1996, 25, 837–855. [Google Scholar] [CrossRef]
Figure 1. Typical steel plate shear wall.
Buildings 12 01427 g001
Figure 2. Load distribution in a typical SPSW system.
Buildings 12 01427 g002
Figure 3. The modeled structures: (a) 5 stories; (b) 10 stories; (c) 15 stories; (d) plan.
Buildings 12 01427 g003
Figure 4. Moment–rotation behavior of the semi-rigid connection.
Buildings 12 01427 g004
Figure 5. (a) Testing model; (b) details of the SPSW connection [32].
Buildings 12 01427 g005
Figure 6. Tension strip layout for the modeling of the SPSW developed by Vian et al. [32].
Buildings 12 01427 g006
Figure 7. Bi-linear model for the strips.
Buildings 12 01427 g007
Figure 8. Cyclic lateral loading used by Vian et al. [32].
Buildings 12 01427 g008
Figure 9. Hysteresis curves of the test specimen and OpenSees model.
Buildings 12 01427 g009
Figure 10. Experimental model by Stelmack et al. [46].
Buildings 12 01427 g010
Figure 11. Top and seat angle connection [46].
Buildings 12 01427 g011
Figure 12. Simplified behavior of the semi-rigid connection behavior by Stelmack et al. [46].
Buildings 12 01427 g012
Figure 13. Numerical and experimental results (first cycle).
Buildings 12 01427 g013
Figure 14. Numerical and experimental results (second cycle).
Buildings 12 01427 g014
Figure 15. Numerical and experimental results (third cycle).
Buildings 12 01427 g015
Figure 16. Time–history of roof displacement for 15-story frames with 200 mm SPSW holes exposed to the Northridge earthquake: (a) 100% rigidity; (b) 80% rigidity; (c) 60% rigidity; (d) 30% rigidity; and (e) 0% rigidity.
Buildings 12 01427 g016
Figure 17. Maximum inter-story drift: (a) 5 stories; (b) 10 stories; and (c) 15 stories.
Buildings 12 01427 g017
Figure 18. Residual displacement: (a) 5-story frames; (b) 10-story frames; and (c) 15-story frames.
Buildings 12 01427 g018
Figure 19. Maximum story drifts of 5-story frame subjected to 5 earthquake records.
Buildings 12 01427 g019
Figure 20. Maximum story drifts of 10-story frame subjected to 5 earthquake records.
Buildings 12 01427 g020
Figure 21. Maximum story drifts of 15-story frame subjected to 5 earthquake records.
Buildings 12 01427 g021
Figure 22. Peak story acceleration; (a) 5 stories; (b) 10 stories; and (c) 15 stories.
Buildings 12 01427 g022
Figure 23. Peak acceleration of 5-story frames.
Buildings 12 01427 g023
Figure 24. Peak acceleration of 10-story frames.
Buildings 12 01427 g024
Figure 25. Peak acceleration of 15-story frames.
Buildings 12 01427 g025
Figure 26. Maximum base shear of 5-story frame subjected to 5 earthquake records.
Buildings 12 01427 g026
Figure 27. Maximum base shear of 10-story frame subjected to 5 earthquake records.
Buildings 12 01427 g027
Figure 28. Maximum base shear of 15-story frame subjected to 5 earthquake records.
Buildings 12 01427 g028
Figure 29. Moment–rotation hysteresis behavior of point A on the 14th floor of 15-story frames with 200 mm SPSW holes exposed to the Northridge earthquake: (a) 30% rigidity; (b) 60% rigidity; (c) 80% rigidity; and (d) 100% rigidity.
Buildings 12 01427 g029
Table 1. Beam, column and steel plate sections at different stories.
Number of StoriesStoriesBeam
Sections
(AB–BC–FG–GH)
Column
Sections
(A–B–G–H)
Beam
Sections
(CD–EF)
Column
Sections
(C–F)
HBEVBEShear Wall Thickness (mm)
51–2W16 × 26W14 × 43W18 × 46W14 × 74W24 × 76W14 × 3705
3–4W16 × 26W14 × 30W18 × 40W14 × 74W24 × 76W14 × 3704
5W16 × 26W14 × 30W18 × 40W14 × 74W30 × 116W14 × 3423
101–3W16 × 26W14 × 43W18 × 46W14 × 132W30 × 116W14 × 4556
4–6W16 × 26W14 × 43W18 × 40W14 × 132W30 × 108W14 × 3985
7–9W16 × 26W14 × 30W18 × 35W14 × 74W30 × 108W14 × 3424
10W16 × 26W14 × 30W18 × 35W14 × 74W30 × 116W14 × 3423
151–3W16 × 26W14 × 48W18 × 46W14 × 132W30 × 116W14 × 5007
4–6W16 × 26W14 × 48W18 × 40W14 × 132W30 × 116W14 × 4556
7–9W16 × 26W14 × 43W18 × 40W14 × 132W30 × 108W14 × 3985
10–12W16 × 26W14 × 30W18 × 35W14 × 74W30 × 99W14 × 3424
13–14W16 × 26W14 × 30W18 × 35W14 × 74W30 × 99W14 × 3113
15W16 × 26W14 × 30W18 × 35W14 × 74W30 × 116W14 × 3113
Table 2. Characteristics of earthquake records used for numerical analysis.
Earthquake
Name
PGA
(/g)
Intensity
(Richter)
Distance to Fault (km)D5–75
(s)
D5–95
(s)
Bam0.296.64711.519.4
Chi-Chi0.416.2259.318.6
Imperial Valley0.356.5258.921.6
Kobe0.316.9218.213.2
Northridge0.426.7319.420.1
Table 3. Bi-linear axial hinge properties.
HingeTension StripCompression Strip
P/PyΔ/ΔyP/PyΔ/Δy
A0000
B1.01.00−1.0
C1.050.0−1.0−20.0
Table 4. Hysteresis comparison of the numerical and experimental models.
Cycle Drift
(%)
Base Shear
(kN)
Energy Absorption
(kN/mm2)
Reloading Rigidity
(kN/mm)
Unloading Rigidity (kN/mm)
NumExpNumExpNumExpNumExpNumExp
20.1010.10134832300140.05135.3140.05135.3
2−0.103−0.103−355−325140.05135.3140.05135.3
50.2020.20271068600140.05135.3140.05135.3
5−0.204−0.204−721−692140.05135.3140.05135.3
80.3020.295982100252690122.52135.3128.65135.3
8−0.311−0.300−976−1015121.84135.3127.93135.3
100.6150.6101306125523,58924,76899.92107.91109.92113.77
10−0.619−0.608−1286−124598.59106.48108.45112.24
140.9220.9181530147072,25475,86678.3582.27103.09106.70
14−0.928−0.905−1523−147677.2781.13101.67105.23
161.12341.22416951629101,351105,40555.0359.7899.05102.52
16−1.290−1.228−1701−164354.2757.9897.68103.1
181.4851.49517551698135,227142,58944.5248.7597.96103.39
18−1.470−1.476−1750−168544.0748.2796.95102.34
201.9952.0318111736169,901162,96843.647.3495.93101.28
20−2.015−2.02−1810−173043.0046.7294.6199.92
222.482.5018131736170,001186,80131.5135.4694.71100.02
22−2.50−2.53−1812−173031.1334.6593.4098.67
242.872.8617761735203,125193,45230.8434.6992.5195.44
24−2.92−2.89−1773−173830.4133.9391.2394.14
263.833.8617751731256,985224,74728.4631.8885.3987.82
26−3.80−3.78−1777−172928.0731.4784.2187.05
284.614.6517661720333,279294,41426.229.2578.5979.81
28−4.43−4.41−1763−172225.8328.8677.578.73
Table 5. Main periods of the frames(s).
Number of StoriesConnection Capacity (%)Steel Plate Shear Wall Hole Diameter (mm)
100200300
500.860.910.98
300.820.870.93
600.790.830.89
800.770.810.86
1000.750.790.83
1001.531.641.72
301.451.591.66
601.391.561.62
801.341.531.59
1001.321.511.57
1502.762.893.01
302.652.822.94
602.582.792.90
802.532.762.87
1002.512.742.84
Table 6. Modal participation ratio of the first vibration mode (%).
Number of StoriesConnection Capacity (%)Steel Plate Shear Wall Hole Diameter (mm)
100200300
5094.794.293.6
3095.194.694.0
6095.495.094.4
8095.695.294.7
10095.795.495.0
10088.487.386.6
3089.187.887.1
6089.788.187.5
8090.288.487.8
10090.388.688.0
15076.775.574.4
3077.876.275.0
6078.476.475.4
8078.976.775.7
10079.176.976.0
Table 7. Maximum story drift of 5-story frames.
EarthquakeConnection Capacity (%)Steel Plate Shear Wall Hole Diameter (mm)
100200300
Bam02.372.582.85
302.342.482.72
602.342.412.48
802.242.312.36
1002.192.222.25
Chi-Chi02.772.953.18
302.732.863.13
602.692.782.86
802.582.652.70
1002.542.572.60
Imperial02.442.652.80
302.402.502.74
602.372.452.48
802.222.352.40
1002.202.252.27
Kobe02.312.472.82
302.282.392.62
602.242.342.43
802.152.222.27
1002.132.152.17
Northridge02.712.943.11
302.722.883.05
602.602.842.93
802.502.732.82
1002.482.562.60
Table 8. Maximum story drift of 10-story frames.
EarthquakeConnection Capacity (%)Steel Plate Shear Wall Hole Diameter (mm)
100200300
Bam02.302.432.70
302.272.412.57
602.172.232.29
802.122.122.14
1002.072.082.11
Chi-Chi02.622.803.04
302.592.672.96
602.492.572.63
802.442.442.47
1002.392.382.40
Imperial02.322.482.65
302.272.372.54
602.222.332.36
802.082.162.19
1002.062.122.12
Kobe02.222.332.50
302.172.232.48
602.102.152.20
802.032.052.07
1001.951.981.99
Northridge02.382.642.85
302.312.392.72
602.252.382.42
802.222.242.32
1002.172.212.28
Table 9. Maximum story drift of 15-story frames.
EarthquakeConnection Capacity (%)Steel Plate Shear Wall Hole Diameter (mm)
100200300
Bam02.152.322.58
302.122.222.37
602.122.132.20
802.012.022.06
1001.952.002.03
Chi-Chi02.102.222.40
302.062.142.28
602.032.072.12
801.931.951.98
1001.921.941.97
Imperial02.222.392.54
302.172.242.40
602.142.172.20
801.992.052.10
1001.972.032.06
Kobe02.482.652.92
302.472.552.65
602.432.472.53
802.302.322.37
1002.282.322.34
Northridge02.272.492.67
302.262.352.51
602.172.292.33
802.122.142.17
1002.102.122.15
Publisher’s Note: MDPI stays neutral with regard to jurisdictional claims in published maps and institutional affiliations.

