1. Introduction
In building structures, the role of columns in the overall performance of the structure is very important. The failure of this element can lead to a great reduction in the strength and even collapse of the whole structure. Therefore, determining the capacity of the columns is one of the most important parameters considered in the design process. Reinforced Concrete (RC) columns, as an axial member, should be able to perform optimally against axial pressures and meet the designer’s expectations. Researchers have conducted various laboratory and analytical investigations to understand the behavior of columns better and improve their performance. Dujmović et al. [
1] studied the composite columns subjected to axial compressive and bending loads. They found that the design of such columns should be based on the combination of loads. The behavior of RC columns under axial compression loads was investigated by Jain et al. [
2]. The proposed effective strengthening methods for the damaged columns concluded that the most efficient technique combines near-surface mounting and external bonding. Miao and Zheng [
3] experimentally studied the effects of bond stress on the compressive behavior of RC columns and developed a formulation to estimate the bearing capacity [
4,
5,
6].
Concrete core has a significant role in the compressive behavior of RC columns. Therefore, some researchers studied this part of columns and its improvements to increase the compressive capacity. Sunayana and Barai [
7] studied the performance of RC columns under compression incorporated by recycled coarse aggregates and fly ash. Their results indicated that the load capacity of the columns with recycled aggregates was higher than those made by natural aggregates. Tian et al. [
8] tested some RC columns made of ultra-high performance concrete and investigated their axial behavior. The results showed that these columns provided more axial capacity. Moreover, a model was proposed to predict the axial capacity of composite columns. The compressive capacity of columns containing precast ultra-high performance concrete jackets has been evaluated by Zhang et al. [
9]. They showed that sufficient confinement could improve the load bearing of the column. A prediction model was also provided to estimate the ultimate capacity. Zhang et al. [
10] investigated the behavior of RC column transfer structures subjected to different axial loads. The results indicated that the load capacity of the columns is increased by the high value of the axial force ratio. Da et al. [
11] studied the effect of corrosion on the axial compression behavior of RC columns made by coral aggregates under eccentric loads. Their results showed that the capacity of columns decreases as the eccentricity increases. They also developed a model to estimate the behavior of the considered types of columns. Vijaya et al. [
12] experimentally evaluated the compressive behavior of RC columns having manufactured sands and found that the axial capacity of these types of columns was better than elements with only normal sands. Dong et al. [
13] experimentally studied the effect of impact loads on the residual axial compression capacity of RC columns and proposed models to determine the capacity.
Due to the complex and non-linear behavior of concrete structural members, the use of more efficient methods than classical statistical techniques is expected. One such method is models based on machine learning (e.g., neural networks and neuro-fuzzy systems). The use of such techniques in determining the behavior of structural elements has been investigated in various studies. Mirrashid and Naderpour [
14] have reviewed the applications of machine learning models to estimate the capacity of structural RC members like columns. Using the datasets, Chang and Zheng [
15] developed a neural network model to determine the compressive strength of RC circular columns confined with stirrups. They found that their model could estimate the considered goal with an acceptable error. Naderpour and Mirrashid [
16] proposed new formulations based on machine learning techniques to assess the moment capacity of RC columns. They used some experimental databases to prepare and evaluate the models. It was found that the machine learning approach is an efficient framework that can be successfully considered for estimating the structural columns. New models based on machine learning methods have been previously provided to predict the ultimate capacity of structural RC members [
17]. For this purpose, the moment capacity has been used as a target for RC columns. Five techniques were considered using neural networks and fuzzy systems, and finally, the mathematical frameworks have been extracted from the proposed models. The provided computational formulations also were validated using an experimental database. Failure modes of RC columns are an important issue that can be predicted based on the machine learning approach [
18] using the properties of the columns. The prediction of the moment capacity of spirally RC columns was another goal that machine learning techniques were used for in literature [
19]. Li et al. [
20] proposed a neural network model to predict RC columns’ compression behavior with stirrups. They have validated their model and extracted a mathematical formulation from the model to make it more user-friendly.
2. Research Significance
Due to the importance of determining the compressive behavior in RC columns, several analytical and laboratory studies have been conducted on these elements. Most of the mentioned studies are based on providing calculation methods in the framework of statistical and regression techniques. When the system has complex behavior, using classical approaches cannot be a suitable solution. The reason for this is the presence of many influential parameters and non-linear behavior, which practically challenges the effectiveness of such methods. The use of machine learning methods is an alternative and suitable technique with acceptable accuracy, which has also been used to determine the performance of structural elements. Nevertheless, due to the structural complexities of the machine learning models proposed in the references, presenting the computational relations derived from such models has been omitted in many cases. This reduces the capabilities of predictive models and their uses. Considering the ability of machine learning-based systems, this article used a neuro-fuzzy technique to estimate the compressive behavior of RC stirrups-confined columns. Moreover, to resolve the computational challenge of the model, a mathematical framework from the model was extracted, and relationships were provided. This increases the efficiency of the proposed model and makes it user-friendly.
3. Methodology
One of the most widely used models based on machine learning is Artificial Neural Networks (ANN). The performance of these methods has been evaluated in different sciences. Meanwhile, due to the complexity of the computational structure of such models, especially in cases where the number of nodes is large, extracting relationships from the network structure is not easily possible. However, its various branches and algorithms are still being improved due to the suitable performance of these methods. Today, ANN has a very special place in machine learning-based sciences. Fuzzy Systems (FS) are another approach to Soft Computing (SC), which are widely used in literature because of their ability to consider the uncertainties of the problem and the possibility of applying empirical rules to the problem. In a fuzzy system, each input variable is placed in some categories representing a linguistic expression. Each above type is called a fuzzy Membership Function (MF). For example, if three membership functions are considered for variable number one, each can represent a low, medium, and high value. In addition to the membership function, such systems have a set of fuzzy rules based on model reasoning and output determination. Both characteristics (membership functions and fuzzy rules) must be accurately specified when modeling a fuzzy system. Considering that determining these items is not easily possible and in cases where the model has a lot of complexity, including a large number of input variables, practically determining things such as the number of MF, the type and values of the parameters of each function, and system rules, is a challenge. To solve this problem, the learning ability of neural networks is used, and the determination of the above cases is left to the neural network.
The combination of ANN and FS as Neuro-Fuzzy systems may create a model with the advantages of the above two methods. In fact, in a neuro-fuzzy model, a fuzzy system is the implementation in the layered structure of the neural network. Here, using a set of data, the unknown parameters of the fuzzy model are estimated and verified by the neural network. One of the most famous techniques is Adaptive Neuro-Fuzzy Inference System (ANFIS), introduced by Jang [
21]. The use of the ANFIS technique has been previously evaluated in order to determine the behavior of structures, and they have provided acceptable results [
22,
23]. Due to the advantages of neuro-fuzzy systems, in this article, the ANFIS is used to estimate the compressive behavior of stirrups in confined concrete columns. The details of the proposed ANFIS model and its relationships are presented in the following sections. An example of ANFIS can be seen in
Figure 1 for a model with four inputs and three MF for each input.
4. Database
In machine learning techniques, a set of data is needed. Based on this information, the model’s unknown parameters are optimized and determined by learning algorithms. Considering that the approach used in this article is also a machine learning model, a set of laboratory results related to 180 column tests with different details (
Figure 2) has been collected from literature [
20,
24,
25,
26,
27,
28,
29]. Then, it is necessary to specify the input variables based on which the value of the target parameter is predicted. This work has been done with a trial and error approach. In total, six input parameters (
Table 1), including the compressive strength of concrete, the ratio of the gross supporting area to the bearing plate area, the ratio of the area confined by stirrups to the bearing plate area, the ratio of the duct diameter to the section width, the yield strength of stirrups, and the volumetric ratio of stirrups, are used to determine the output parameter, which is the ratio of axial compressive capacity to the net area of bearing plate minus the duct area, in this article.
From the set of 180 collected data, 85% of the datasets (153 data) were randomly selected and used for the model training process. The remaining 15 percent (including 27 data) has been used to evaluate the accuracy of the model.
Table 2 and
Figure 3,
Figure 4 and
Figure 5 show the details of training and testing data. Another one of the most important pre-processing tasks performed on the data is normalization. By doing this, the range of data is kept in a fixed and small range, which increases the accuracy of the model in prediction. In this article, the range of 0.1 to 0.9 is used to normalize the data using Equation (1).
5. The Proposed ANFIS Model
Using the considered experimental database, the training process of the ANFIS model was done. In order to create the proposed system, a fuzzy c-means algorithm has been used. Based on this, it was determined that the model with eight rules had shown the best performance (
Figure 6). The details of the rules are shown in
Table 3. In this table, for example, MF
3,4 means the third membership function of the X
4.
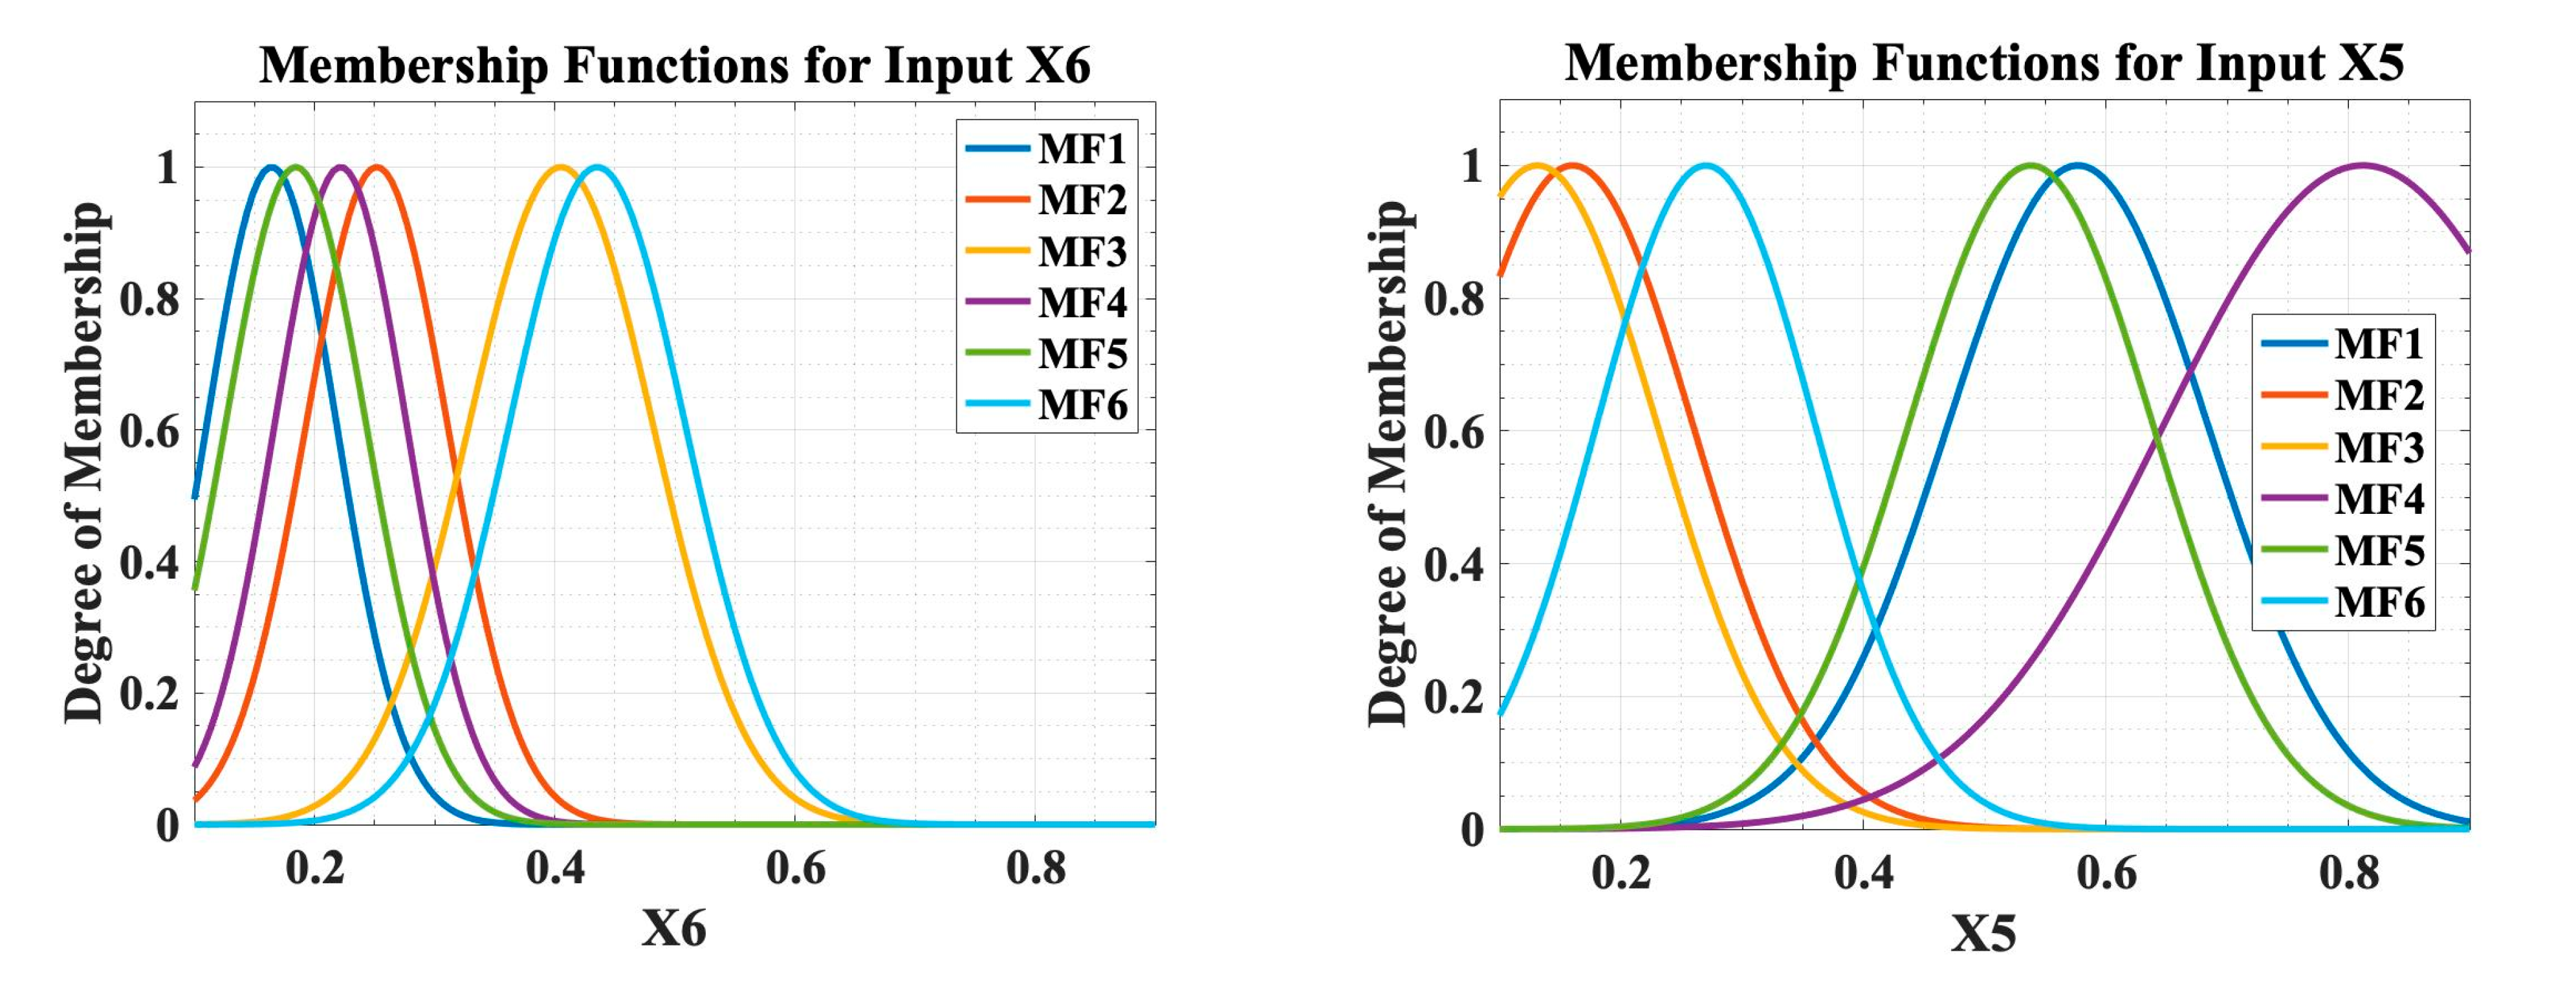
The proposed model uses the sigmoid membership function for each input variable. Additionally, for each of the inputs X
1 to X
6, a number of 8, 6, 8, 4, 6, and 6 Gaussian membership functions have been used, respectively. These functions can be found in
Figure 7. The details of the parameters (mean and variance) of these functions determined from the learning process of the ANFIS model based on 153 datasets are also shown in
Table 4.
The first step in determining the target variable by the proposed model is to calculate the weight of each rule using Equation (2). The parameters
nMF,i,
m,
v,
Wr in this equation represents the number of membership functions for the
ith input, mean, and variance of the membership function, and the weight of the
rth rule.
Based on the mentioned equation, the weights of each rule can be found by Equations (3)–(10) for rules 1 to 8, respectively.
After calculating the weight of each of the eight fuzzy rules of the ANFIS model, it is necessary to determine the amount of linear functions in the ANFIS structure. In the model presented in this article, for the output part of each rule, there is a linear polynomial (
Yr) in the form of Equation (11). In addition to the mean and variance of the membership functions, the coefficients of linear polynomials are also determined in the training process of the ANFIS. These coefficients are presented in
Table 5.
Using the values obtained for the weights and polynomials, the final output value of ANFIS,
Yn, is determined by Equation (12).
Since the data values are normalized before modeling, the obtained output value is also normalized (between 0.1 and 0.9). Therefore, it is necessary to calculate the final value of the ANFIS model by inverting Equation (1). This is done by Equation (13).
6. Performance of the Model
In this section, the performance of the obtained model is evaluated. As mentioned earlier, the first data series is used in the training phase of the model. In the training phase, these data, which are the results related to 153 column laboratory tests, have been used to estimate the error in each iteration and improve the performance in the subsequent iterations. The results of the training phase can be seen in
Figure 8 for the whole training dataset. As seen in
Figure 8, the training phase was done well, and the final model had a very high accuracy in estimating the output values, so there is a very small difference between the values predicted by ANFIS and the laboratory. The Root Mean Squared Error (RMSE) value for the results of this part of modeling for the normalized training dataset is reported to equal 0.0143.
Despite the success of the training process, it is necessary to evaluate the model’s performance for new data that have not been used in training and to validate the model’s accuracy. This task has been done using the test data sets (27 data). By applying this data series to the trained model, the model’s calculated error values and ability to estimate the target output value have been checked. The results are depicted in
Figure 9.
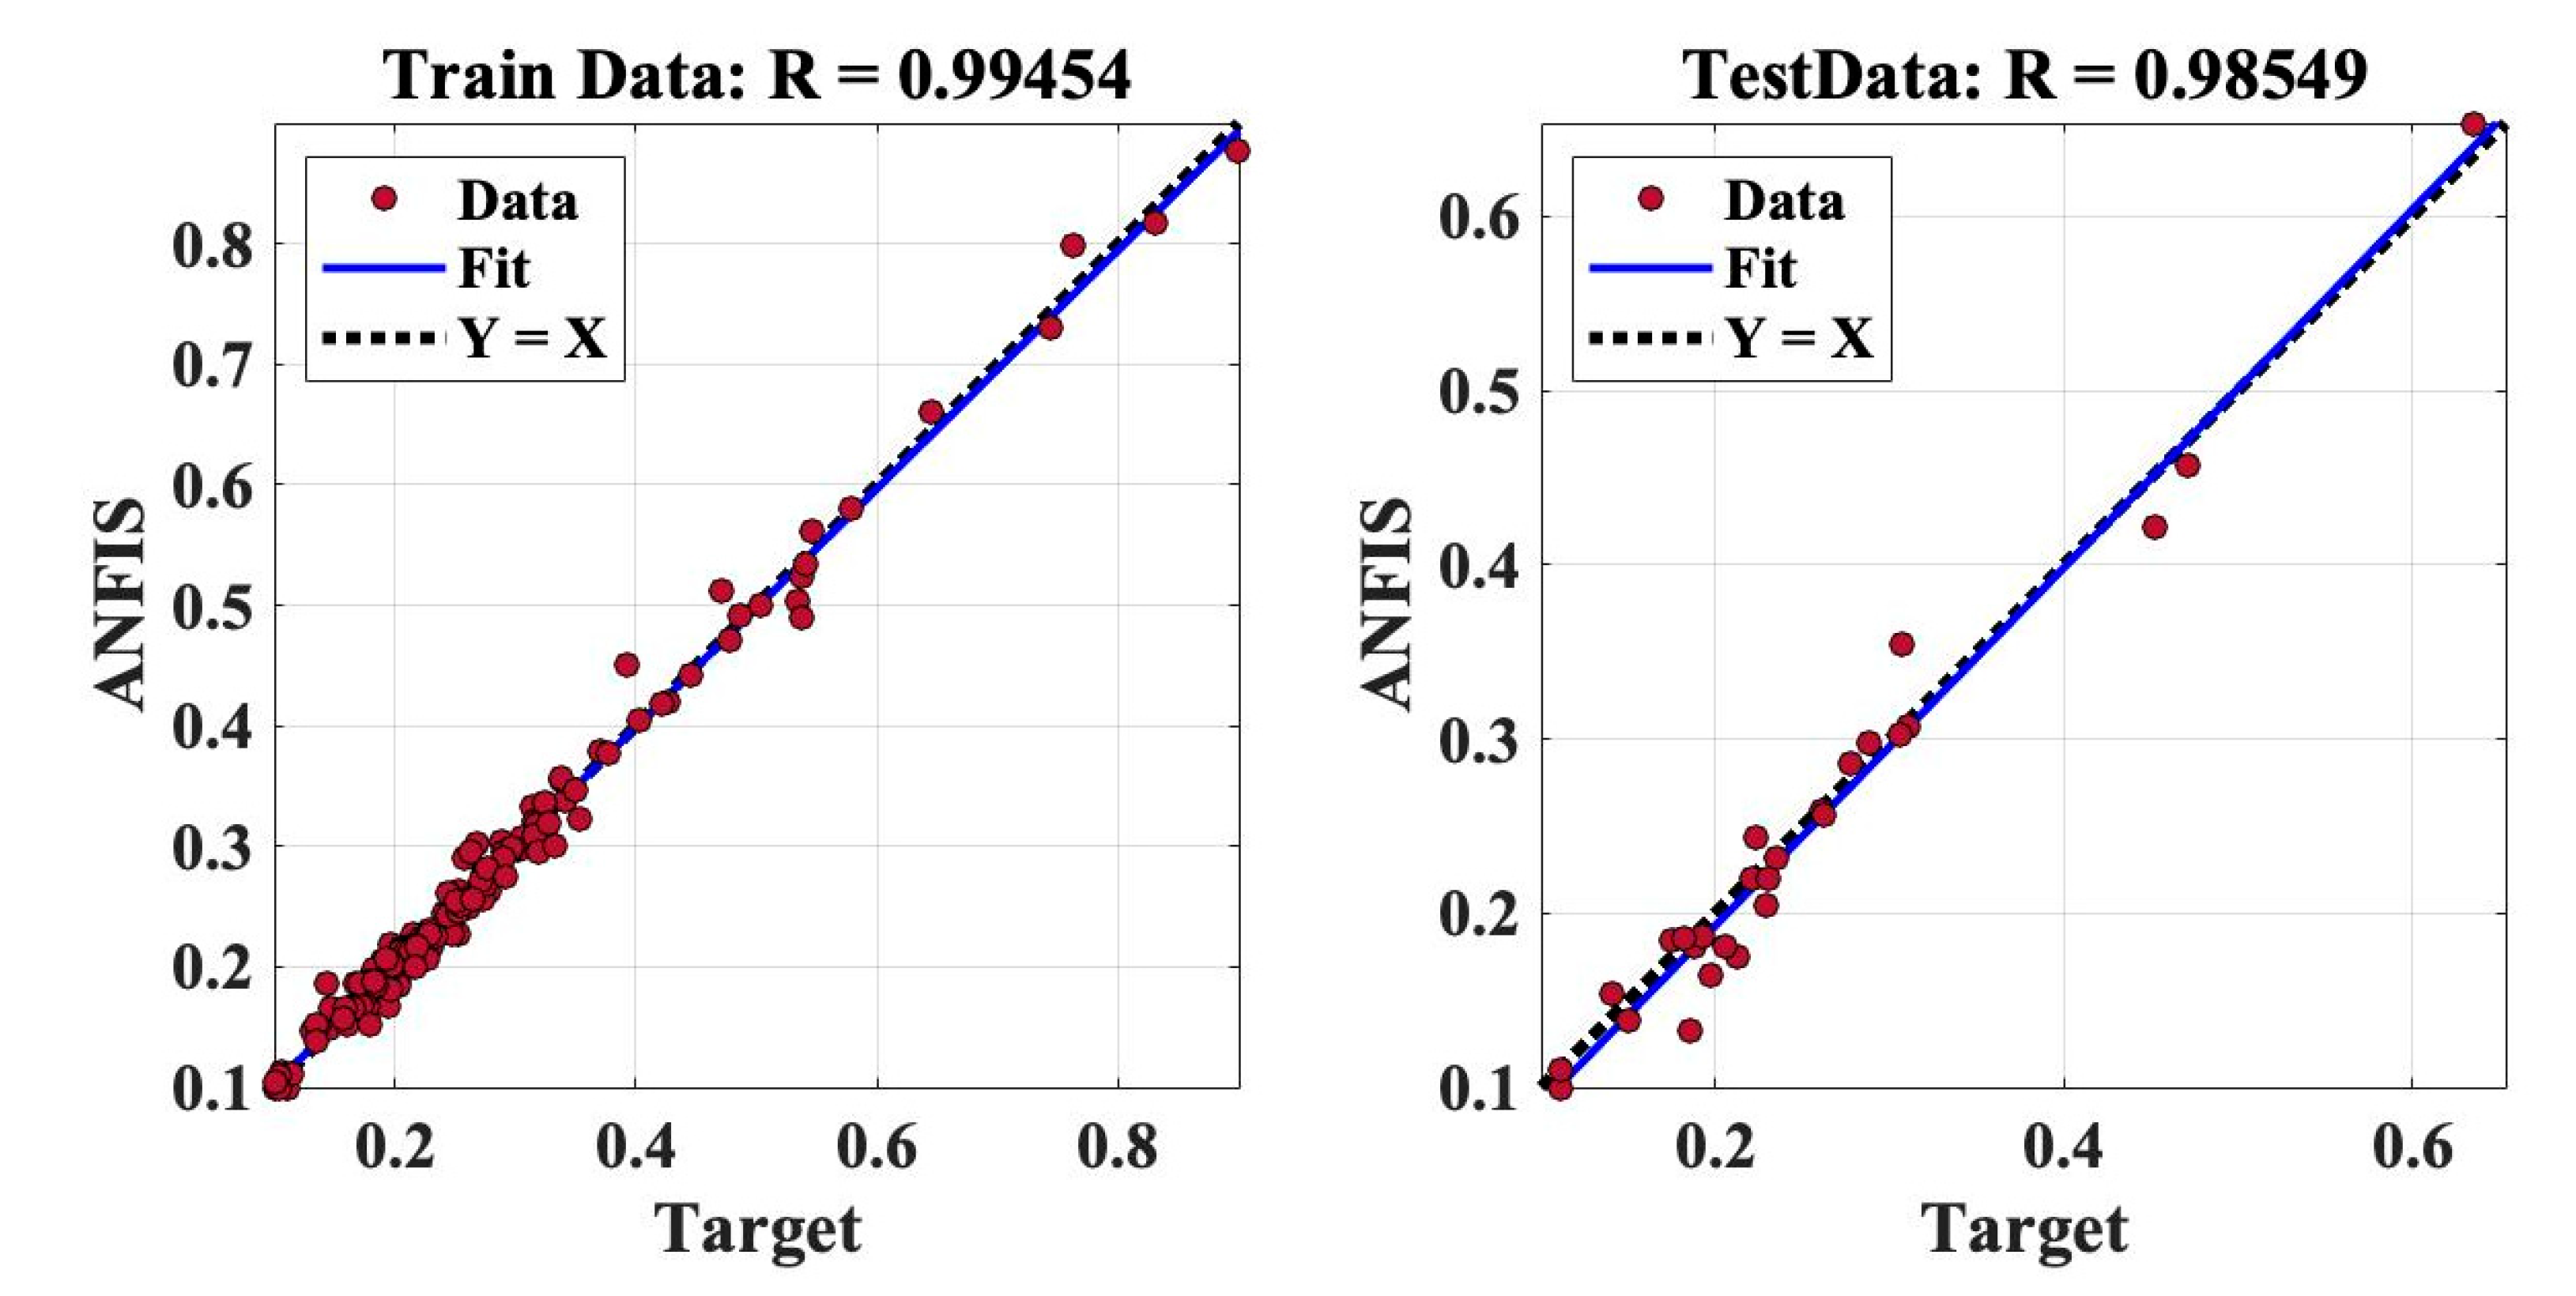
The RMSE value for the normalized test data sets at this stage was 0.021, which is acceptable. Additionally, compared to the results obtained from the laboratory, the values determined by ANFIS have very little difference. Therefore, it can be concluded that the proposed model and the formulation extracted from it have sufficient reliability and accuracy. The regression plots for the two mentioned phases (train and test) can be seen in
Figure 10 for the normalized database. It is clear from the figure that the ANFIS has good agreement with the experimental tests.
As stated in the previous section, the values obtained from ANFIS are normalized (between 0.1 and 0.9), and converting them into real values is necessary. To this end, Equation (13) was presented. Using this equation, the values obtained from the extracted formulation of the ANFIS model were converted into real values, the results of which are depicted in
Figure 11. Based on this figure, the average error of the model is equal to 0.283. To determine this value, the difference between the amounts of the laboratory and the ANFIS has been determined and used as an error. The RMSE value of the model for the entire database is 6.834. The histogram of errors also indicates that in most of the data, the errors are close to zero. According to the findings of this section, it can be concluded that the proposed model has a high ability to estimate the target parameter (the ratio of axial compressive capacity to the net area of the bearing plate minus the duct area).
7. Sensitivity Analysis
In this section, the sensitivity of the proposed model to the changes in each of the six input variables is examined and evaluated. To do this, six databases containing 20 data were created. In each of the six databases, five input variables have a fixed value (the median value presented in
Table 2), and only one of the variables is changed between its minimum and maximum (see
Table 2). The output value has been calculated by applying these data to the ANFIS model. The results can be seen in
Figure 12.
In
Figure 12, the output of the model is shown vs. the variable whose value has been changed. According to the results obtained from the above analysis, it is clear that by increasing the X
1 (the compressive strength of concrete), X
3 (the ratio of the area confined by stirrups to the bearing plate area), and X
6 (the volumetric ratio of stirrups), the output parameter of the model also increases so that there is an almost linear and direct relationship between the input and output variables. In the case of the variable X
4 (the ratio of the duct diameter to the section width), the situation is different, so its increase leads to a decrease in the ANFIS results. Regarding the two variables, X
5 (the yield strength of stirrups) and X
2 (the ratio of the gross supporting area to the bearing plate area), the results show that their changes can decrease or increase the output (the ratio of axial compressive capacity to the net area of bearing plate minus the duct area) of the model, depends on the amount of the input. For example, when the compressive strength of the column increases, the ratio of axial compressive capacity to the net area of the bearing plate minus the duct area also increases. The same results can be seen for the ratio of the area confined by stirrups to the bearing plate area and the volumetric ratio of stirrups, in most cases. The results of the sensitivity analysis also indicated that when the ratio of the duct diameter to the section width increases, the output of the model decreases.
8. Comparison Study
In this section, the performance of the relationships proposed in this research, which is also shown for the entire data in
Figure 13, is compared with the existing models GB/T 50010-2010 [
30], Breen et al. [
25], Bonetti [
27], and Li et al. [
20]. For this purpose, three statistics parameters, including Error mean (Er), determination coefficient (R
2), and RMSE, have been used. The results are presented in
Table 6.
The minimum of the average error value Er for the other models is equal to 0.866. However, the ANFIS average error was obtained as 0.283, much lower than the error of the other models. For the ANFIS value of 0.99331 for the correlation coefficient (R), the determination coefficient (R2) is 0.987, which shows the closeness of the laboratory values to the predicted results; the highest value was related to the formulation of this article, which is very close to 1. Regarding the RMSE error, the best value is observed in the ANFIS model. According to the results obtained in this section, it can be seen that the best performance among all models is for ANFIS. Therefore, it can be used as a suitable tool to estimate the target variable, which is the axial compressive capacity ratio to the bearing plate’s net area minus the duct area.
9. Conclusions
Most of the analytical and laboratory studies have been conducted based on calculation methods in the literature framework of statistical and regression techniques. However, when the system has non-linear behavior and many influential parameters, using classical approaches cannot be a suitable solution. Although the use of machine learning methods has been previously used to determine the performance of structural elements as an alternative method, presenting the computational relations derived from such models has been neglected in many cases. The main reason for this is the structural complexities of the machine learning models. This article presented a neuro-fuzzy model, namely ANFIS, to predict the target variable. The proposed model has been adjusted and evaluated based on laboratory data. The results showed that the model has a high accuracy for estimating the target parameter. To increase the efficiency of the ANFIS, its formulation was also extracted from the computational structure of the model. The results obtained from the sensitivity analysis show that as the compressive strength of the column increases, the output value also increases. Increasing the ratio of the area confined by stirrups to the bearing plate area and the volumetric ratio of stirrups can also increase the output parameter. In contrast, with the increase in the value of the ratio of the duct diameter to the section width, a decreasing trend is observed in the target variable. Based on the sensitivity analysis results, the yield strength of stirrups and the ratio of the gross supporting area to the bearing plate area do not constantly affect the changes in the output, and it can increase or decrease depending on the input variable value. In the end, the accuracy of the extracted equations of the ANFIS and the existing techniques was compared, and the errors were examined. The results indicated that the proposed model has the least error among all equations and has the most accuracy. Therefore, it can be used as a predictive model to determine the target variable, which is the axial compressive capacity ratio to the bearing plate’s net area minus the duct area.
Author Contributions
Conceptualization, H.N., M.M. and D.-P.N.K.; methodology, M.M.; software, M.M.; validation, H.N., M.A. and M.M.; formal analysis, M.M.; investigation, H.N. and M.A.; resources, H.N.; data curation, M.M.; writing—original draft preparation, H.N., M.A., M.M. and D.-P.N.K.; writing—review and editing, H.N., M.M. and D.-P.N.K.; visualization, M.M.; supervision, H.N. and D.-P.N.K.; project administration, H.N. and D.-P.N.K. All authors have read and agreed to the published version of the manuscript.
Funding
This research received no external funding.
Institutional Review Board Statement
Not applicable.
Informed Consent Statement
Not applicable.
Data Availability Statement
The data presented in this study are available on request from the corresponding author. The data are not publicly available due to ongoing research work.
Conflicts of Interest
The authors declare no conflict of interest.
References
- Dujmović, D.; Androić, B.; Lukačević, I. Composite Column with Partially Concrete-Encased H-Section Subject to Axial Compression and Uniaxial Bending. In Composite Structures According to Eurocode 4; Dujmović, D., Androić, B., Lukačević, I., Eds.; W. Ernst & Sohn: Berlin, Germany, 2014; pp. 545–613. [Google Scholar] [CrossRef]
- Jain, S.; Chellapandian, M.; Prakash, S.S. Emergency repair of severely damaged reinforced concrete column elements under axial compression: An experimental study. Constr. Build. Mater. 2017, 155, 751–761. [Google Scholar] [CrossRef]
- Miao, T.; Zheng, W. Local bearing capacity of concrete under the combined action of pressure force and bond stress. Constr. Build. Mater. 2019, 226, 152–161. [Google Scholar] [CrossRef]
- Adebar, P.; Lorzadeh, A. Compression failure of thin concrete walls. In Proceedings of the 15th World Conference on Earthquake Engineering, Lisbon, Portugal, 24–28 September 2012. [Google Scholar]
- Gao, D.; Li, W.; Pang, Y.; Huang, Y. Behavior analysis and strength prediction of steel fiber reinforced recycled aggregate concrete column under axial compression. Constr. Build. Mater. 2021, 290, 123278. [Google Scholar] [CrossRef]
- Radnic, J.; Markic, R.; Harapin, A.; Matesan, D.; Baloevic, G. Stirrup effects on compressive strength and ductility of confined concrete columns. World J. Eng. 2014, 10, 497–506. [Google Scholar] [CrossRef]
- Sunayana, S.; Barai, S.V. Performance of fly ash incorporated recycled aggregates concrete column under axial compression: Experimental and numerical study. Eng. Struct. 2019, 196, 109258. [Google Scholar] [CrossRef]
- Tian, H.; Zhou, Z.; Zhang, Y.; Wei, Y. Axial behavior of reinforced concrete column with ultra-high performance concrete stay-in-place formwork. Eng. Struct. 2020, 210, 110403. [Google Scholar] [CrossRef]
- Zhang, X.; Wu, X.; Zhang, D.; Huang, Q.; Chen, B. Axial compressive behaviors of reinforced concrete composite column with precast ultra-high performance concrete (UHPC) jacket. J. Build. Eng. 2022, 48, 103956. [Google Scholar] [CrossRef]
- Zhang, J.; Fan, Y.; Zhou, S.; Shen, B.; Ma, K.; Wu, H.; Liu, B. Seismic behaviour of a steel-reinforced concrete inclined column transfer structure under different axial force ratios. Arab. J. Geosci. 2021, 14, 1–18. [Google Scholar] [CrossRef]
- Da, B.; Chen, Y.; Yu, H.; Ma, H.; Yu, B.; Chen, D.; Chen, X.; Wu, Z.; Guo, J. Influence of steel corrosion on axial and eccentric compression behavior of coral aggregate concrete column. Front. Struct. Civ. Eng. 2021, 15, 1415–1425. [Google Scholar] [CrossRef]
- Vijaya, B.; Selvan, S.S.; Vasanthi, P. Experimental investigation on the behaviour of reinforced concrete column containing manufactured sand under axial compression. Mater. Today Proc. 2021, 39, 446–453. [Google Scholar] [CrossRef]
- Dong, G.; Wu, J.; Zhao, X. Effect of Salt-Frost Cycles and Impact Loads on Residual Axial Capacity of Reinforced Concrete Column. ACI Struct. J. 2022, 119, 181–194. [Google Scholar] [CrossRef]
- Mirrashid, M.; Naderpour, H. Recent trends in prediction of concrete elements behavior using soft computing (2010–2020). Arch. Comput. Methods Eng. 2021, 28, 3307–3327. [Google Scholar] [CrossRef]
- Chang, W.; Zheng, W. Estimation of compressive strength of stirrup-confined circular columns using artificial neural networks. Struct. Concr. 2019, 20, 1328–1339. [Google Scholar] [CrossRef]
- Naderpour, H.; Mirrashid, M. Proposed soft computing models for moment capacity prediction of reinforced concrete columns. Soft Comput. 2020, 24, 11715–11729. [Google Scholar] [CrossRef]
- Naderpour, H.; Mirrashid, M. Innovative models for capacity estimation of reinforced concrete elements in terms of soft computing techniques. Pract. Period. Struct. Des. Constr. 2021, 26, 04021038. [Google Scholar] [CrossRef]
- Naderpour, H.; Mirrashid, M.; Parsa, P. Failure mode prediction of reinforced concrete columns using machine learning methods. Eng. Struct. 2021, 248, 113263. [Google Scholar] [CrossRef]
- Naderpour, H.; Parsa, P.; Mirrashid, M. Innovative approach for moment capacity estimation of spirally reinforced concrete columns using swarm intelligence–based algorithms and neural network. Pract. Period. Struct. Des. Constr. 2021, 26, 04021043. [Google Scholar] [CrossRef]
- Li, S.; Zheng, W.; Xu, T.; Wang, Y. Artificial neural network model for predicting the local compression capacity of stirrups-confined concrete. Structures 2022, 41, 943–956. [Google Scholar] [CrossRef]
- Jang, R. ANFIS: Adaptive Neuro Fuzzy Inference System. IEEE Trans. Syst. Man Cybern. 1993, 23, 665–685. [Google Scholar] [CrossRef]
- Mirrashid, M.; Naderpour, H. Innovative computational intelligence-based model for vulnerability assessment of RC frames subject to seismic sequence. J. Struct. Eng. 2021, 147, 04020350. [Google Scholar] [CrossRef]
- Mirrashid, M.; Naderpour, H. Computational intelligence-based models for estimating the fundamental period of infilled reinforced concrete frames. J. Build. Eng. 2022, 46, 103456. [Google Scholar] [CrossRef]
- Cai, S.; Wei, S.; Jiao, Z. Bearing strength of confined concrete with transverse net reinforcement. J. China Civ. Eng. 1986, 19, 19–27. [Google Scholar]
- Breen, J.; Burdet, O.; Roberts, C.; Sanders, D.; Wollmann, G. Anchorage Zone Reinforcement for Post-Tensioned Concrete Girders; NCHRP Report 356; Transportation Research Board and National Research Council: Washington, DC, USA, 1994. [Google Scholar]
- Cai, S.-H.; Xue, L. Local bearing strength of high-strength concrete. J. China Civ. Eng. 1994, 27, 52–61. [Google Scholar]
- Bonetti, R.A. Ultimate Strength of the Local Zone in Load Transfer Tests; Virginia Tech: Blacksburg, VA, USA, 2005. [Google Scholar]
- Zhao, J. Experimental Research on Fundamental Problems of Local Compression of Concrete under Anchorages; Harbin Institute of Technology: Harbin, China, 2008. [Google Scholar]
- Marchão, C.; Lúcio, V.; Ganz, H.R. Efficiency of the confinement reinforcement in anchorage zones of posttensioning tendons. Struct. Concr. 2019, 20, 1182–1198. [Google Scholar] [CrossRef]
- GB/T 50010-2010; Design Code for Concrete Structure. Architecture & Building Press: Beijing, China, 2010.
| Publisher’s Note: MDPI stays neutral with regard to jurisdictional claims in published maps and institutional affiliations. |
© 2022 by the authors. Licensee MDPI, Basel, Switzerland. This article is an open access article distributed under the terms and conditions of the Creative Commons Attribution (CC BY) license (https://creativecommons.org/licenses/by/4.0/).


