1. Introduction
Research on innovative materials for improving the building performance is of great interest in relation to the targets of energy saving and environmental impact reduction planned by the European strategy. On 14 July 2021, the European Commission adopted several important measures for achieving climate neutrality in the EU by 2050, including the intermediate target of 55% net reduction in greenhouse gas emissions by 2030 [
1]. Construction material technologies are the driving force for enhancing and improving building energy efficiency and infrastructure functionality [
2]. Among the most interesting materials, there are the geopolymeric concretes and the phase change materials (PCMs).
Using recycled materials as substitution for natural aggregate to produce geopolymer concrete is becoming a possible alternative for reusing construction and demolition waste with interesting eco-friendly benefits [
3] and for supporting the sustainable development of the construction sector [
4]. Several types of applications were proposed, such as the development of rubberized brick by utilizing crumb rubber as the sole fine aggregate in the production of geopolymer interlocking bricks [
5]. Instead, Gerges et al. [
6] underlined that the rubberized concrete mixture generally has a reduced compressive strength but also lower density, higher toughness, and higher impact resistance compared to conventional concrete. Cui et al. [
7] introduced two new types of geopolymer composite lightweight sandwich panels; one with fiber-reinforced geopolymer composite skin layers and polyurethane foam core, and another one with basalt-fiber-reinforced polymer sheet. Longo et al. [
8] worked on rheological behavior, as well as mechanical and thermal properties, of a geopolymer mortar incorporating fly ash and expanded glass aggregate.
Several papers have investigated the thermal characteristics of different compositions, and few papers give the indications on the reliable energy savings during the building use. Colangelo et al. [
9] proposed to substitute part of the aggregates with plastic waste and to use a fly-ash-based geopolymeric binder for the production of low conductivity concrete. Wu et al. [
10] used the basic oxygen furnace slag as a radiative cooling material in geopolymeric coating by reaching an emissivity of 0.95 within the range of 8–13 µm, and it also has high conductivity.
Foamed fly ash geopolymer was synthesized by Su et al. [
11] to produce geopolymeric lightweight concrete. For densities from 1200 to 600 kg/m
3, the thermal conductivity diminished from 0.70 to 0.22 W/mK, which is much better than that the ordinary Portland cement. Parcesepe et al. [
12] found that an alkali-activated concrete can achieve mechanical characteristics higher than those of ordinary Portland concrete but also an improvement of the thermal insulation capacity. Dhasindrakrishna et al. [
13] underlined the interest for geopolymer foam concrete, thanks to their porous structure which brings the inherent merits of lightweight, acoustic, and thermal insulation, and fire resistance. For instance, Zang et al., found that the thermal conductivity is in a range of 0.15–0.48 W/m K [
14]. Wang et al. [
15] found that for the fly ash-based lightweight geopolymer concrete, the adoption of 0–1% of polypropylene fibers can increase the thermal conductivity by varying the moisture absorption. According to Henon et al. [
16], by varying the pore volume fraction in a geopolymer foam between 65 and 85%, the thermal conductivity changes between 0.35 and 0.12 W/m K.
The heat capacity performance of geopolymer concretes can be also improved by means of microencapsulated phase change materials (PCMs). A review of the latest research results related to the use of PCMs in geopolymer materials was presented by Lach et al. [
17]. The latent heat and melting temperature of investigated products are usually in the range 96.1–230 J/g and 21.9–33.8 °C, respectively [
18].
There are several studies about the in-lab characterization of new composites and products; for instance, Hassan et al. [
19] investigate the thermal and structural performance of geopolymer-coated polyurethane foam–phase change material capsules/geopolymer concrete composites with interesting results. Ramakrishnan et al. [
20] modified an aerated/foamed geopolymer concrete with a paraffin/hydrophobic expanded perlite, and they found that the incorporation of 15% and 30% of PCM can reduce the peak indoor temperature by 1.85 °C and 3.76 °C, respectively, while enhancing the thermal storage capacity by 105% and 181%. Hassan et al. [
21] tested novel geopolymer-coated expanded clay–phase change material macrocapsules added to geopolymer concrete. They observed a decrement of maximum surface temperatures of 8.0 °C compared to a mixture without PCM, and the thermal transmittance passed from 2.0 to 0.9 W/m
2 K. by means of a numerical model. Cao et al. [
22] utilized multilayer walls integrating microencapsulated phase change materials into geopolymer concrete, and found annual energy reduction of 28–30%. Pilehvar et al. [
23] underlined that the addition of PCM slows down the reaction rate of both geopolymer and Portland cement paste. The setting times were faster when the temperature was increased. However, the major disadvantage of adding microencapsulated phase change materials is the significant decrease in compressive strength [
24,
25].
As reported in the previous analysis, the recent literature is mainly focused on the characterization of the thermal and structural properties of the mixture for improving the thermal properties of geopolymer concrete with phase change materials. Instead, the proposed paper analyzes the behavior of the combination between macro-encapsulated PCM and geopolymer concrete block with the material mounted in series as two different layers. This solution could solve the problem of deterioration of structural performance.
Moreover, the estimation of the potential energy saving and the improving of the thermal comport is usually performed with a simplified model on short periods and there are few indications about the global energetic behavior. Regarding this, the paper proposes a complete approach for the evaluation of heating and energy need as well as for the yearly primary energy, because in some climates it can happen that the PCM improves the building only on one season, for instance, the summer, but the reduction of solar gains could worsen the winter performance. This is an optimization problem that requires the consideration of the main variables, such as the melting point, the thickness, and the position, and the paper suggests this approach to researchers with a discussion of a real case study that will be supported by experimental data in next months.
More in detail, a numerical investigation is proposed for selecting the optimal configuration of an innovative multilayered package to be installed in Mediterranean climates. This work was financially supported by Horizon 2020 with the project Green INSTRUCT (Green Integrated Structural Elements for Retrofitting and New Construction of Buildings). This project is focused on the development of a prefabricated modular structural building block that is superior to conventional precast reinforced concrete panels by virtue of its reduced weight, improved acoustic and thermal performance, and multiple functionalities. This study describes the design approach and the evaluations carried out for selecting the types and thickness of materials with the aim to improve energy performance and indoor microclimate of living space in a typical climate of South Italy. The obtained indications and the introduced methodological approach can be useful for designers and for researchers for identifying the best overall layout of innovative experimental installations under real external conditions.
Moreover, the discussed results will be used in the following months for comparing the expected performance with the experimental one. Indeed, a monitoring campaign is ongoing for the described wall package.
2. Research Method and Case Study
A detailed research method is proposed for the optimized design of a new passive solution considering both energy and indoor comfort aspects. The approach is based on two main steps: a preliminary parametric investigation followed by a constrained multi-objective optimization process, in order to provide the best compromise of configurations.
A case study is also developed because the results can be useful for other research in the field of innovative solution or when designers must select the optimal values for the design variables of a wall package with PCM materials to be installed in the Mediterranean areas.
2.1. Method for the Optimal Design of a Multilayered Sustainable Wall
The first step is a parametric study with which the influence of the main designing variables is investigated. In detail, we varied the insulation thickness, the air cavity type (ventilated or not) and its thickness, and the PCM type, also considering different integration methods and the position (internal side, external side, and both sides). The comparison of the possible design configurations is based on the evaluation of the cooling (
EC) and heating (
EH) energy need, the annual primary energy request (
EPyearly), and the number of discomfort hours (
dH).
EC and
EH are the energy required to assure the comfort operative temperature, respectively, during the summer and winter. The comfort conditions are expressed according to the standard ASHRAE 55-2004 [
26]. For the cooling and heating seasons, the resistance of clothing has to be set to 0.5 Clo and 1.0 Clo, respectively. The effectiveness of designed configurations was assessed throughout the evaluation of the percentage annual primary energy savings (Δ
EP) and the percentage reduction of discomfort hours (Δ
dH).
The multi-objective optimization is the second step for evaluating the best compromise design configuration between the most interesting solutions founded with the parametric analysis. The optimization tool has been usefully applied by the authors also in other study for selecting a living wall configuration in the Mediterranean climate [
27]. The optimization problem needs the definition of the objective functions that in this case are the minimization of the heating and cooling energy needs; indeed, the adoption of passive solutions can vary the heat gains and losses throughout the building envelope and, thus, an appropriate choice can reduce the primary energy demand.
Often, the optimization problems for the building envelope are organized without considering the aspect of the thermal comfort [
28]. Instead, in this study, the hours of discomfort are considered as a limiting constraint for determining the Pareto front solutions. For the optimization problem, the most interesting configurations obtained in the parametric analysis are evaluated by varying the exposure of the installation. The final outcome is the Pareto front [
29], which is the set of the non-dominated solutions.
2.2. Presentation of the Case Study
The test room MATRIX (Multi Activity Test-Room for InnovatingX) of the Department of Engineering of University of Sannio is used as the case study because it is the site of installation for the experimental campaign. MATRIX is located in Benevento (130 m above sea level), a city of Campania in the south Italy.
MATRIX (
Figure 1a) is a large-scale test room (36 m
2) with gross sizes of 6.00 × 6.00 × 5.50 m. Wooden basement and roofs and a vertical steel frame comprise the building structure. Plywood panels, without interruption, enclose all edges of the cube, in order to avoid the thermal bridges. MATRIX allows to test facades or components up to 3.0 m height and 5.0 m width because there is a mechanical system that allows to change three of the four vertical walls. Aerated cellular concrete and vacuum insulation panels are the basic elements of the existing configuration with thickness of 14 cm and an overall thermal transmittance (U) of 0.40 W/(m
2 K). There is one window with wood frame, double layer of elettrotropic glass; U is 2.2 W/(m
2 K).
A detailed description of the test room was already presented by Ascione et al. [
30], who also built a numerical model of MATRIX by means of EnergyPlus [
31], through an interface program, i.e., DesignBuilder [
32]. The numerical model was simulated under real conditions, both internal and external, and it was calibrated according to the ASHRAE Guideline [
33].
In the present study, the calibrated simulation model was modified to be an office with one occupant. The air-conditioning system consists of a hydraulic plant with in-room fan coils supplied by an air-cooled chiller (nominal energy efficiency ratio of 3.5 WTH/WEL) and a gas boiler (nominal efficiency of 92%). The adopted boundary conditions are as follows:
The design set-point air temperature is 20 °C in winter and 26 °C in summer according to comfort requirements [
34] and conditions imposed by technical standard [
35].
The heating period runs from 15 November to 31 March and the cooling period from 15 May to 30 September, and in both cases only during weekdays, from 8:00 a.m. to 8:00 p.m.
The air change rate is equal to 0.3 h−1.
For the simulations, the hourly weather file was created with data monitored from April 2014 to December 2021 by means of the climatic station on the roof of the laboratory. According to monitored values, Benevento has a typical Mediterranean climate and it is inside the Csa zone according to Köppen classification [
36].
2.3. Description of Investigated Configurations
The analyzed multilayered system was designed in the frame of the Green INSTRUCT project. It is made of three main elements: internal panel, middle foam insulating layer, and the external panel. These panels are held together by an aluminum frame made of construction and demolition waste (CDW) for extrusion. The internal panel consists of an aluminum encasing with a magnesium-based concrete layer (MOC) followed by a geopolymer layer, a recycled polyurethane foam layer, an air gap, another PU foam layer, and a final geopolymer layer. The results of experiments on mechanical property, such as the compressive strength of the geopolymer synthesis, are described in the technical report [
37]. The middle layer consists of 10 cm of insulation and it is connected to the internal panel by means of threaded bars that allow the creation of another air gap.
Table 1 shows the characteristics of all materials involved in the base design configuration: thickness (s), thermal conductivity (λ) or thermal resistance (R), density (ρ), and specific heat (cp).
The conductivity and the density are furnished by producers during the project; the not-available properties are taken from international standard [
38,
39,
40].
The thermal transmittance of this configuration is 0.13 W/m
2 K, the thermal capacity is 66.8 kJ/m
2 K, and the surface mass is 65.0 kg/m
2. According to this value, it can be stated that the insulation level is very high compared to the building stock in the Mediterranean zone but also with threshold values considered by the Italian Ministerial Decree [
41]. Instead, the summer performance could be not good because the package is characterized by low thermal mass (<230 kg/m
2). In the following analysis, this configuration is considered the basic design configuration. The external layer is a green box for which a sensitivity analysis regarding the green layer was already presented by the authors [
27].
Starting from this design proposal, the study is focused on the selection of the PCM to be coupled with the geopolymer blocks by varying the thicknesses of the main layers of the base design configuration. More in detail, the alternative configurations are defined by varying:
Thickness of the polyurethane layers and of the air gap for the internal panel;
Thickness and type of ventilation of air gap in the middle layer;
The position and the type of PCM.
The variation of the air-gap thickness is also length to a variation of the thickness of the external polyurethane because the total thickness is kept constant (30 cm) as well as the dimension for the internal module (18 cm). The insertion of the layer with PCM was evaluated on the internal side of the described wall package (
Figure 2a), on the external side (
Figure 2b), and on both sides. The wallboards or plasters with microencapsulated PCMs were considered for the internal application in place of the MOC.
Macro-encapsulated PCMs were considered for external side insertions, and in this case, the MOC was the internal layer. To facilitate the solidification process, the PCM was inserted between the air gap and the external polyurethane. Consequently, with the objective to always have the same total thickness, in the external side applications the thickness of the air gap was lower than the internal side. Two thicknesses were evaluated for the external application of PCMs, namely, 1.0 cm and 1.5 cm. These are the most common commercial values and are also the available size for the selected product.
Finally, 210 configurations with PCM on the internal side, 504 configurations with PCM on the external side, and 60 configurations with PCM on both sides were evaluated. For the simulation, the proposed multilayered wall is applied on the south exposure because the most interesting researchers [
42,
43] indicate that the experimental assessment of PCMs is usually performed for this side, which is considered the best one.
It must be underlined that the adopted simulation model was validated with experimental data for the present configuration with vacuum insulation panel. Instead, the proposed configurations in
Figure 2 were not verified by means of experimental data. Indeed, this study was performed with the aim to select the type of PCM for the experimental campaign to be conducted in the frame of the HORIZON project. In future months, with the data recorded, a comparison will be made between simulated and monitored variables for discussing the problem of the deviation of the in-field performance of the phase change materials.
Moreover, the discussed results will be used in the following months for comparing the expected performance with the experimental one. Indeed, a monitoring campaign is ongoing for the described wall package.
In the proposed analysis the reference nomenclature is
where
PI is the inner panel, “x” stands for the thickness (cm) of polyurethane, and “y” stands for the thickness (cm) of the air gap of the PI;
A is the air gap of middle panel with “z” that indicates its thickness (cm), “v” means ventilated cavity (slightly) and alternatively “nv” not ventilated;
“t” is the thickness (cm) of the polyurethane of the middle layer (PU).
All the solutions with phase change material on the internal side were identified by the name of the material before the described nomenclature. Instead, macro-encapsulated PCM were identified with the name and thickness of the phase change material between the term Azv and the term PUt. Finally, the solutions with PCMs on both sides were connoted by placing “in + out” before the previously described identification criteria.
2.4. Characteristics of Selected PCMs
PCMs were selected among available commercial products for which the melting and solidification curve is available. With regard to building materials containing microencapsulated PCMs, the following products were considered:
Comfortboard® (wallboard);
Weber.mur clima® (internal plaster);
Dry Clay Plaster Trocken-Lehmputz-PCM® (internal plaster);
SmartBoardTM (plasterboard);
ENERCIEL® (finishing material).
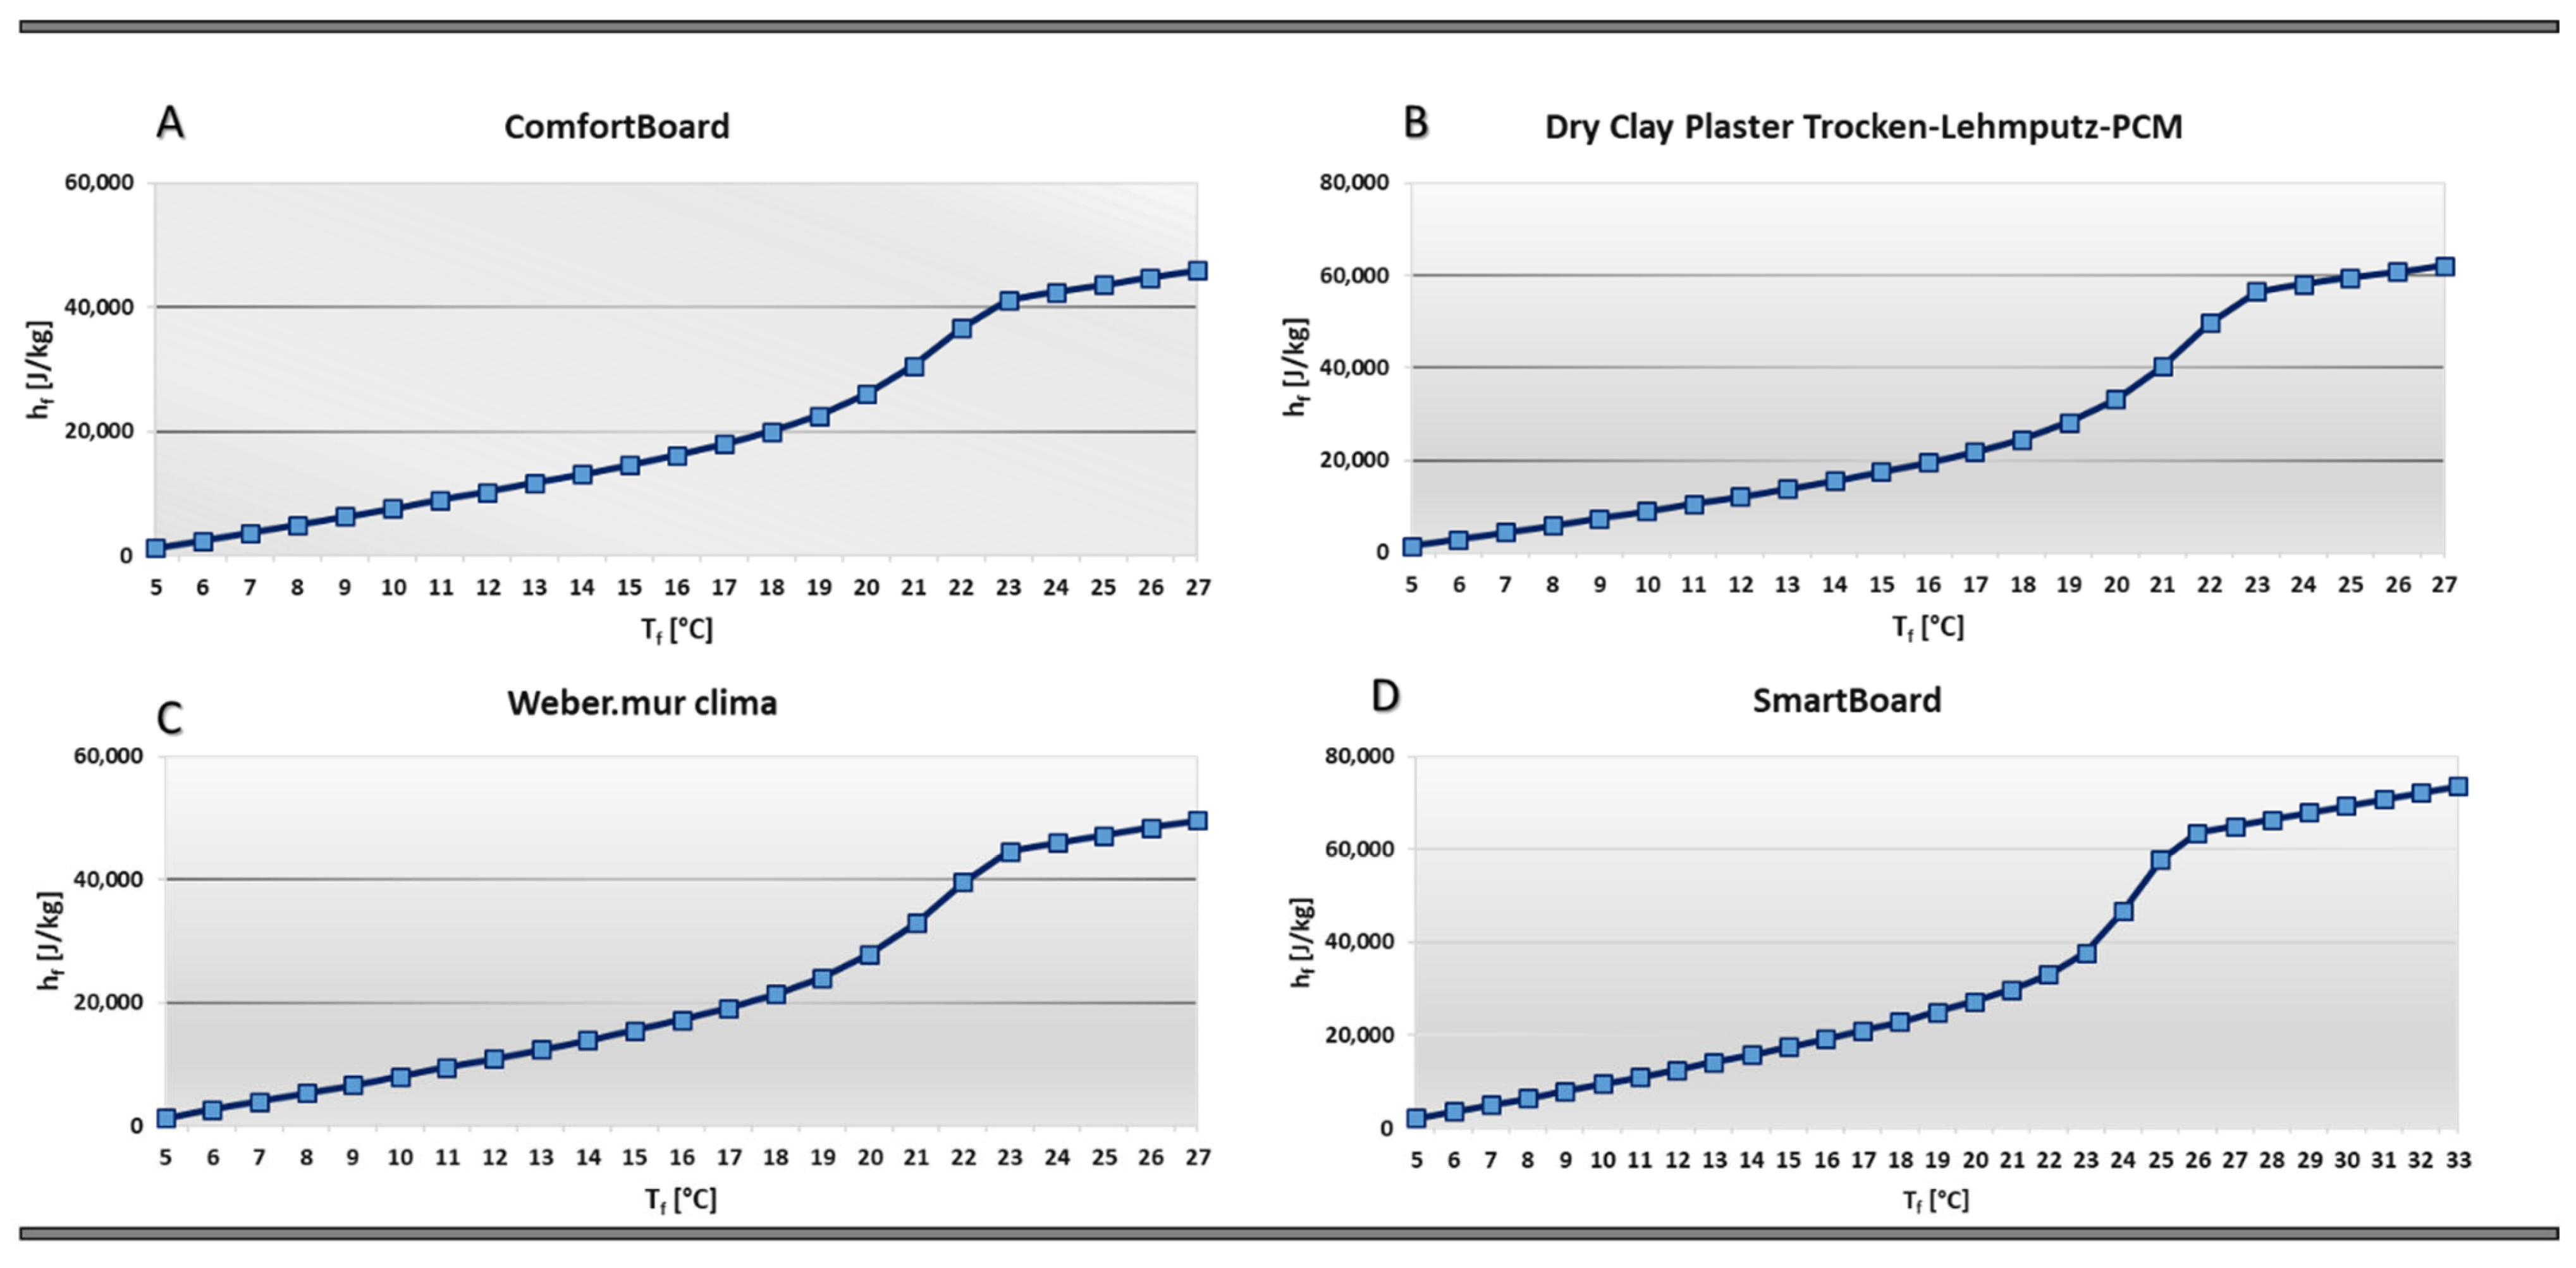
The first three materials contain the same microencapsulated PCM (Micronal
®), with a melting temperature (T
f) of 23 °C [
44]. It can be integrated with different systems into building materials. The first examined wallboard is the Knauf Comfortboard
® product that contains 80% gypsum and 20% paraffin. It has a thickness of 12.5 mm, melting point equal to 23 °C, and a heat storage capacity (LHS) of 207 kJ/m
2. Weber.mur clima and Dry Clay Plaster Trocken-Lehmputz-PCM
® are two plasters for indoor applications, manufactured by Weber Saint-Gobain and Pro Lehm Frauwallner KG, respectively. In particular, the first one is a dry mineral mortar based on gypsum, in which Micronal
® microcapsules are added with light mineral additives for better processing and to strengthen the bond. For the purposes of this study, a plaster thickness of 15 mm was considered, and thus the PCM is 20 wt%. The second product is a clay-based dry plaster with 30 wt% of Micronal
® PCM; a thickness of 10 mm was considered in the following analysis. Briefly, all the information necessary for modeling the PCM in EnergyPlus was obtained from the web app made available by the manufacturer [
45]. Thanks to this application, it is possible to evaluate the density, the thermal conductivity, the latent heat capacity (h
f), the thermal capacity (Q
f), and the melting curve reported in
Figure 3.
The SmartBoard
TM has thickness of 15 mm and contains 26% mass fraction of Micronal
® PCM with a melting point of 26 °C. The heat storage capacity of the SmartBoard ™ is 330 kJ/m
2. In this case, the cumulative mean temperature–enthalpy curve (
Figure 3d) was obtained thanks to the study of Ozdenefe et al. [
46].
Finally, ENERCIEL® is a surface coating with biological microencapsulated PCM (INERTEK 23 in slurry form), 50 wt%, gypsum (10–15 wt%), and a titanium binder. The melting point can range from 23 °C to 26 °C. The product can have a maximum thickness of 3.0 mm and it is suitable for interior applications on walls and ceilings. In this study, a melting temperature of 26 °C and a latent storage capacity of 186.3 kJ/m2 are considered. The cumulative mean enthalpy–temperature curve is already available in the EnergyPlus library.
Table 2 summarizes main characteristics of the construction materials with microencapsulated PCM.
The materials selected for external application are CSMs (compact storage modules) filled with macroencapsulated PCM [
47]. The filling materials can be organic, indicated as RT
®, or inorganic materials, indicated as SP
®, and these assure a wide range of temperatures depending on the applications. The CSMs are available in the dimensions of 450 × 300 mm
2, and for different thicknesses.
Table 3 summarizes the main characteristics of selected products and
Figure 4 shows the melting curves; herein, the range of curves is different because these were built with the data available from manufacturers.
In the configuration with the MOC layer containing microencapsulated PCM, the melting curve was obtained by means of Microtek app [
41] and, therefore, assuming the integration of Micronal PCM with a melting temperature of 23 °C. The MOC has cementitious matrix with aggregates such as wood chips recycled from CDW and reinforced by wood fibers and thermoplastic polymers. On the basis of this information, the percentage composition reported in [
48] was considered suitable for the case under examination, with 60% by weight of cementitious compounds and 40% by weight of aggregates. Finally, a PCM integration percentage of 9% was calculated by making a weighted average of the microencapsulated PCM integration percentages recommended by the Microtek tool for cementitious materials and medium-density fiberboard derived from wood. The calculated properties are shown in
Table 4 and the cumulative enthalpy–temperature curve is shown in
Figure 5.
2.5. Numerical Model
EnergyPlus through the interface DesignBuilder is the tool used for the simulations. A one-dimensional conduction finite difference algorithm (CondFD) can be used for the simulation of PCM [
49]. The CondFD algorithm is based on the implicit finite difference scheme, and it is possible to choose between Crank–Nicholson or fully implicit. The equation on which the calculation method is based for the fully implicit scheme within a homogeneous material is
where
T = temperature;
i = node being modeled, i + 1 = adjacent node to interior of construction, i − 1 = adjacent node to exterior of construction;
j + 1= new time step, j = previous time step;
Δt = time step;
Δx = finite difference layer thickness;
cp = specific heat of material;
ρ = density of material;
λW and λE are the thermal conductivity for interface between i node and i + 1 node, and between i node and i − 1 node.
If thermal conductivity is variable, it can be defined according to
In the CondFD algorithm, all elements are divided or discretized automatically using Equation (4), which depends on a space discretization constant (
c), the thermal diffusivity of the material (
α), and the time step. The default space discretization value of 3 (equivalent to a Fourier number (
Fo) of 1/3) or input other values can be selected.
The CondFD method is coupled with an enthalpy–temperature function that must be defined for updating an equivalent specific heat at each time step. EnergyPlus offers two modeling methods, to associate the enthalpy–temperature curve:
For the simulation of the case study, the basic method is used. The enthalpy–temperature function was defined through a set by means of a tabular form starting from the previous proposed figures. The tabular function usually considers the entire temperature range, from −20 °C to 60 °C. The limit to consider commercial material is the unavailability of data for defining the hysteresis phenomenon. The adopted model requires also a “temperature coefficient for thermal conductivity”. This is used in order to introduce the temperature-dependent coefficient for thermal conductivity of the material. More in detail, this is the thermal conductivity change per unit of temperature excursion from 20 °C. Moreover, the time steps per hour equal to 12 are used, and the space discretization constant is set to 3.
More than 1000 simulations were carried out. Among the capabilities of the program, there is the use of a non-dominated sorting genetic algorithm based on the NSGA-II method [
50], which is widely used as a “fast and elitist multi-objective” method providing a suitable trade-off between a well-converged and a well-distributed solution set. This tool was used for solving the optimization problem. For our scope, the maximum number of generations was set to 200 and it was typically in the range of 50–500. This value reflects the complexity of the analysis. The computational domain is the whole year; thus, simulations run for all months and both daily or monthly results are available; moreover, the time interval between two consecutive energy balances was fixed equal to 6 per hour.
3. Analysis of Simulation Results
The results of the parametric analysis and the multi-objective optimization are provided in the following sections.
3.1. Parametric Analysis with PCM on the Inner Side
3.1.1. Analysis of Heating and Cooling Energy Needs
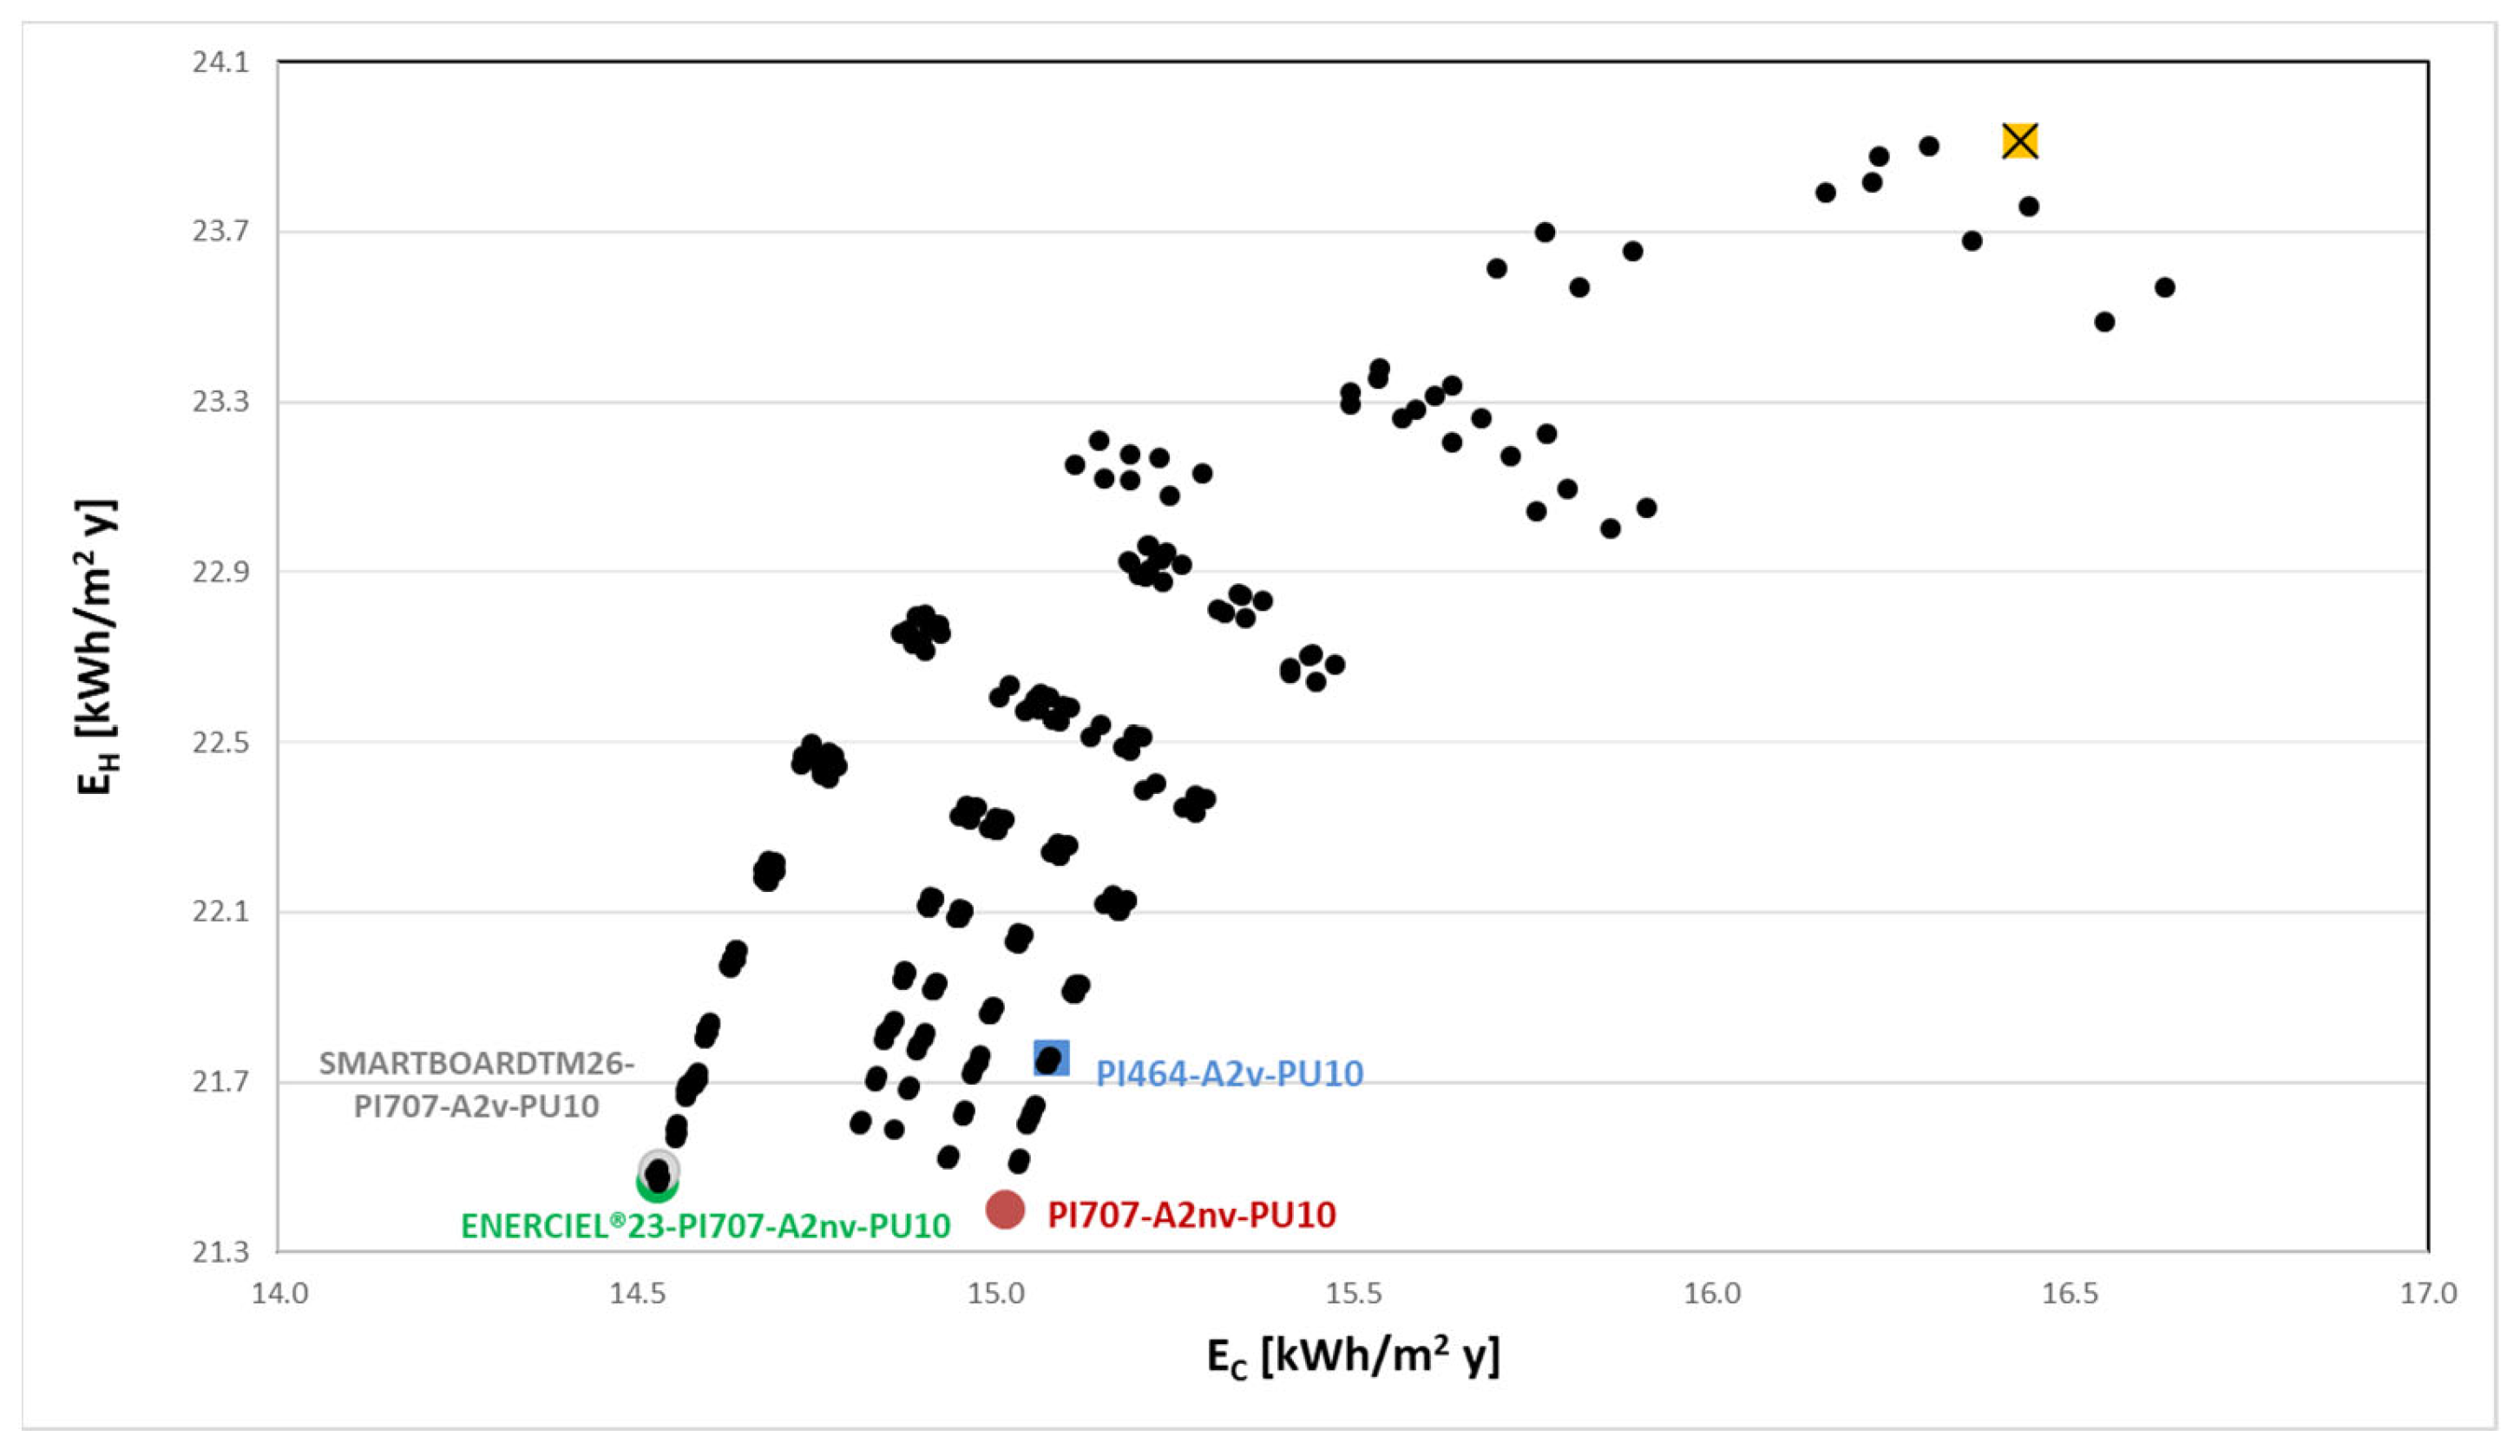
Figure 6 shows the results in terms of heating and cooling energy needs for the configurations with the application of selected PCMs on the inner side. The yellow point is representative of the present configuration of MATRIX with vacuum insulation panels, and it was named base case (BC) The other point for the comparison is named
PI464A2vPU10; it is represented by a blue square and it is the configuration described in
Table 1 with the default thickness and without PCM.
Considering the BC, all proposed solutions, also if applied only on one wall, allow a reduction of both heating and cooling energy demand without significant differences when the air-gap ventilation is compared with the same solution but with closed gap. Indeed, in the figure it can be noted that there are always two quite coincident points for each solution. The last branch of the graph where PI464A2vPU10 is located collects all simulation results of the configurations without the PCM. The solution that minimizes the heating request is highlighted; it is PI707A2nvPU10 for which EC is 15.0 kWh/m2 y and EH is 21.4 kWh/m2 y. This wall package, compared with the base design solution (PI464A2vPU10), allows a slight improving of the performance because the cooling energy saving (ΔEC) is −0.43% and the heating saving (ΔEH) is −1.63%. The worst solutions, the highest points in the curve, are PI0140A6nvPU6 and PI0140A6vPU6, for which EC is, respectively, 16.5 and 16.6 kWh/m2 y, and EH is, respectively, 23.5 and 23.6 kWh/m2 y.
Instead, starting from the left, there is a first sequence of points starting from the solution ENERCIEL®23-PI707A2nvPU10, which is characterized by the minimum of the cooling demand (14.5 kWh/m2 y) and by a heating load of 21.5 kWh/m2 y. This wall package, compared with BC, allows ΔEC of −11.6% and ΔEH of −10.2% and it can be considered a profitable solution for improving the performance achievable with an insulated system with low thermal mass. Considering the contribute of the phase change material, the evaluation of the heating and cooling loads reduction compared with the PI464A2vPU10 indicates that the selected melting temperature contributes to slightly improving the thermal performance with ΔEC equal to −3.6%. However, during the winter, the panel allows to increase the utilization of solar gains because it accumulates the energy and release during the day, allowing ΔEH of −1.4%. The other points are representative of the same solution but with lower level of insulation until the extreme point ENERCIEL®23-PI0140A6vPU6, for which EC is 15.9 kWh/m2 y and EH is 23.7 kWh/m2 y. This solution is not better than PI464A2vPU10 because in both seasons the required energy increases; meanwhile, compared with BC, ΔEC is −3.3% and ΔEH is −1.1%. Thus, it can be concluded that the lower insulation level is not suitable for the considered climate and the PCM is not effective when included in this configuration. Along the same line, there are also the solutions with SmartBoardTM. In this case, the package that minimizes the cooling energy demand is SMARTBOARDTM26-PI707A2vPU10; EC is 14.5 kWh/m2 y and EH is 21.5 kWh/m2 y. With higher melting temperature, the same energy saving compared with BC is achievable (ΔEC −11.6%, ΔEH −10.1%) for ENERCIEL®23-PI707A2nvPU10. This happens because the ENERCIEL® product has the highest hf of all the products examined (73.56 kJ/kg), thanks to the higher percentage of PCM; meanwhile, SmartBoardTM has the higher melting point, 26 °C, which is particularly suitable for combating indoor overheating during the summer months. The other products provide less benefit, and the simulation results occupy the other branches of the graph. For instance, with the same insulation level, the solution WEBER.MUR CLIMA®23-PI707A2nvPU10 is characterized by EC of 15.0 kWh/m2 y and EH of 21.5 kWh/m2 y.
3.1.2. Analysis of Primary Energy Need and Discomfort Hours
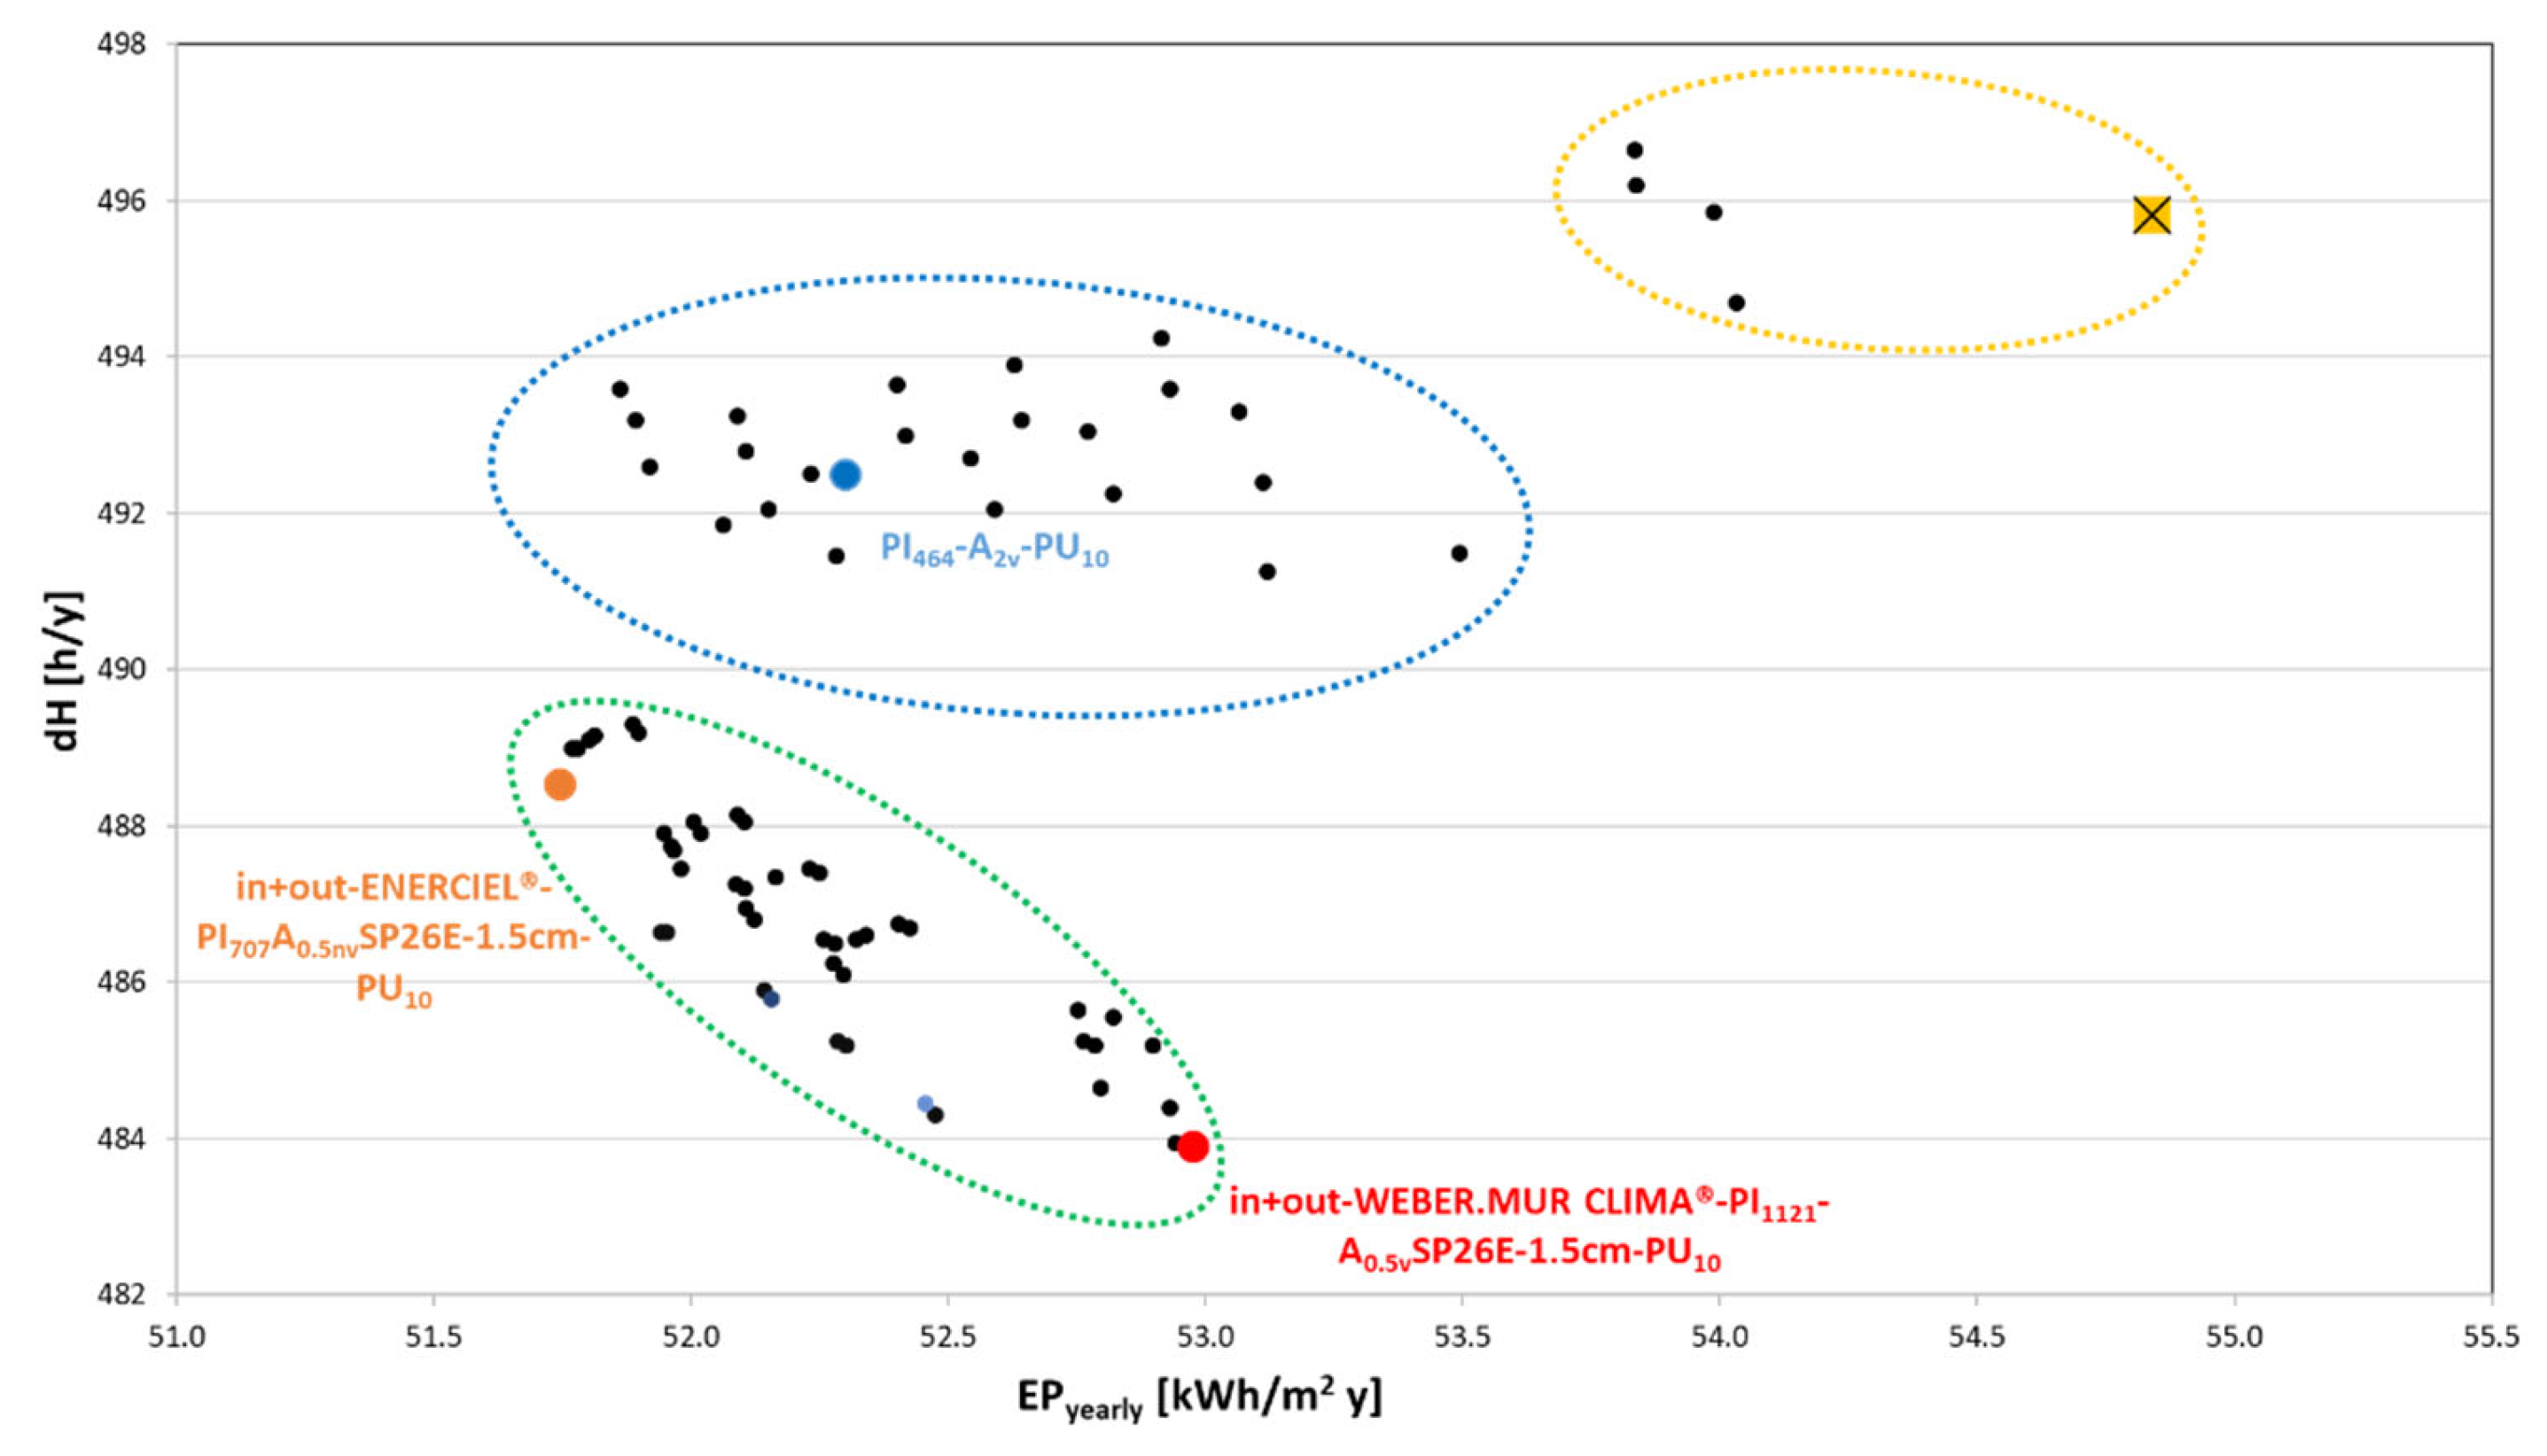
Figure 7 shows the distribution of the simulation results considering the annual primary energy request (
EPyearly) and the number of discomfort hours (
dH).
Additionally in this case there is no appreciable influence of the ventilation regime of the air gap. For the basic design configuration (PI464A2vPU10), EPyearly is 52.3 kWh/(m2 y) and dH is equal to 492.5 h/y, and it is a good solution if compared with BC since ΔEP is −4.6% and the percentage reduction of discomfort hours is −0.7%.
The configuration that minimizes the number discomfort hours is SMARTBOARDTM26-PI0140A2vPU10 (dH = 491.2 h/y), but a very close result is obtained with WEBER.MUR CLIMA®-PI1121A2nvPU10 (dH = 491.3 h/y). At the same time, these configurations do not coincide with the one with the lowest primary energy requirement; in both cases the lower level of insulation, on the internal side, negatively affects the heating energy needs. Compared to the basic design, ΔEP is, respectively, +2.0% and +1.6%; instead, compared with BC, the achievable energy saving is, respectively, −2.8% and −3.2%.
In
Figure 7, the points inside the red circle are characterized by the adoption of Weber.mur clima
® plaster or the Comfortboard
® panel on the internal side. Among these points, the
WEBER.MUR CLIMA®-PI707A2nvPU10 solution has the lowest total primary energy need (
EPyearly = 1524.3 kWh/m
2 y), with Δ
EP equal to −5.4% compared with BC. In the center of the figure (black points), the solutions without PCM are distributed; herein, the solution
PI464A2vPU10 is highlighted. In this area, the outermost points are related to the configurations with a maximum thickness of the external and internal polyurethane (therefore with a lower energy requirement for heating). Finally, the solutions with Dry Clay Plaster, the SmartBoard
TM panel, and the ENERCIEL
® finish with the maximum level of thermal insulation are collected in the blue area. The case with minimum value of total primary energy need is
ENERCIEL®23-PI707A2nvPU10, with Δ
EP equal to −5.4% compared with BC, but only −0.8% compared with
PI464A2vPU10. This solution benefits from the high insulation level, meanwhile the PCM allows to reduce the cooling request compared with BC; however, considering the reduced difference with
PI464A2vPU10, it can be stated that for the considered climate and selected melting temperature, the PCM is not highly effective in reducing the whole energy demand.
In terms of EPyearly, the worst cases with PCM are characterized by the lower insulation thickness on internal and external sides, and these are COMFORTBOARD®23-PI0140A6vPU6, WEBER.MUR CLIMA®23-PI0140A6vPU6, and DRY CLAY PLASTER PCM®23-PI0140A6vPU6; these have the same energy need of BC (around 54.8 kWh/m2 y) but lower discomfort hours thanks to the effect of PCM in the hottest period. Instead, considering the basic design solution, ΔEP is +4.6%.
3.2. Parametric Analysis with PCM on the External Side
3.2.1. Analysis of Heating and Cooling Energy Needs
With regard to the application of the CSMs on the external side,
Figure 8 shows the distribution of the results in terms of energy need for heating and cooling. Herein, with different markers, the solutions without PCMs are represented, as well as the panels with different thickness of phase change material; it must be remarked that among these, six different macroencapsulated materials are considered (six different melting points). For the simulations, the PCMs are positioned in the external air gap for favoring the discharge process during the night. However, negligible differences are observed considering the ventilation type of the air gap. The points with the lower E
H are characterized by the maximum value (14 cm) of the thermal insulation on the internal side.
As expected, the cases with PCM thickness of 1.5 cm offer the greatest reductions in cooling requirements. For any configuration, the best phase change material to be placed on the external side is the one indicated by SP and a melting temperature of 26 °C with a thickness of 1.5 cm. Probably, for the considered climate, higher melting temperatures, if also useful to front extreme weather conditions, are not able to ensure a continued charge and discharge cycle of the material, and the transition is activated fewer times.
By adding to the aforementioned characteristics the maximum level of thermal insulation provided inside and outside, the best case is reached both in terms of
EC and
EH. In
Figure 8 this is indicated with
PI707A0.5nvSP26E-1.5cm-PU10, with
EC = 14.8 kWh/(m
2 y) and
EH = 21.3 kWh/(m
2 y). Compared to the base case, Δ
EC is –9.95% while Δ
EH is −10.8%. Furthermore, differently from what was expected, the best configuration is characterized by an unventilated air cavity with the minimum thickness; this probably happens because the high value of insulation on the external side induced a delay in the phase transition, and the ventilation of the air cavity does not provide significant variations compared to the non-ventilated case. However, it can be observed that for the proposed wall package, when two PCMs have the same melting temperature and latent heat capacity also with a different thermal capacity, the performances are comparable. Indeed, in the proposed case study,
PI707A0.5nvRT26E-1.5cm-PU10,
EC = 14.9 kWh/(m
2 y) and
EH = 21.4 kWh/(m
2 y), and, thus, compared to the base case, Δ
EC is –9.4% while Δ
EH is −10.6%.
Considering the same configuration, with the same PCM, the increment of melting temperature does not guarantee higher energy saving. For instance, in the cases of PI707A0.5nvSP26E-1cm-PU6 and PI707A0.5nvSP31-1cm-PU6, with reference to the base case, ΔEC is, respectively, –8.68% and −8.28%; with PI707A0.5nvRT26E-1cm-PU6 and PI707A0.5nvRT31-1cm-PU6, ΔEC is, respectively, –8.49% and −8.18%. Comparable differences are obtained in all other cases. It can be also remarked that the products with higher melting temperature are also characterized by higher latent heat capacity; however, this characteristic seems to not improve the energy performance for the proposed wall package. Probably, the choice of an activation temperature of 26 °C is more advantageous given the external forcing of the considered location. The higher level of insulation does not allow the complete melting of the material, or the choice of air-gap thickness is not enough to assure a regular evacuation of the accumulated heat.
3.2.2. Analysis of Primary Energy Need and Discomfort Hours
For the application of the CSMs on the external side,
Figure 9 shows the comparison between
EPyearly and
dH.
The solutions are organized in several vertical distributions; each one is characterized by the same level of insulation but the configurations with the higher thickness of PCM are usually on the bottom of these lines. For instance, the first distribution on the right, where the base case is also highlighted, is composed of all solutions with the lower insulation level on the internal and external side. Herein, there is PI0140-A5nv-RT26-1cm-PU6 characterized by the lower energy demand (EPyearly = 54.5 kWh/m2 y) and dH = 490.8 h/y and PI0140-A4.5nv-SP26E-1.5cm-PU6 with the lower discomfort hours (dH = 489.5 h/y) and EPyearly = 54.6 kWh/m2 y. In both cases, when the melting temperature increases, the discomfort hours increase and dH becomes, respectively, 496.5 h/y and 495.8 h/y. This confirms that the most suitable melting point for the configuration under evaluation is 26 °C.
In the first line on the left, there are the solutions with the high levels of insulation (both on inner and outer sides) and the lowest energy needs. Different PCMs are coupled with the considered package: in the case of 1 cm there is an air gap of 1 cm, and the best solutions are RT26, RT28HC, and SP29Eu; with 1.5 cm and an air gap of 0.5 cm, the best solutions are RT26, SP26E, and SP29Eu. Among these, the minimum of EPyearly is obtained with the PI707A0.5nvSP26E-1.5cm-PU10 configuration, with a decreasing of ΔEP equal to −5.54% compared to the base case. Instead, if PI464-A2v-PU10 is considered as reference, ΔEP is −0.95%. For the same configuration but adopting RT26, ΔEP is −5.44% and with SP31 it is −5.42%; more in general, there is a very slight difference with the other considered phase change materials and this confirms that the increment of melting temperature does not guarantee better performance.
At the bottom of the figure, there are the configurations with the lower number of discomfort hours. In this region it is possible to identify the configuration with the lowest number of hours of discomfort, namely, the one identified as PI1121A0.5vSP26E-1.5cmPU10 is characterized by ΔdH% equal to −2.18% and ΔEP% of −3.62% compared to the base case. It has a thermal capacity equal to 102.2 kJ/m2 K, i.e., increased by 78.6% compared to the same case without PCM and by 53% compared to PI464-A2v-PU10. Compared with this basic design configuration, ΔEP is + 1.06% due to the low level of thermal insulation on the internal side of the wall.
3.3. Application of PCM Materials on Both Sides
3.3.1. Analysis of Heating and Cooling Energy Needs
The better configurations described in the previous section were combined for a further analysis.
Table 5 summarizes the characteristics of these configurations and
Figure 10 shows the simulation results, considering both the BC and the basic design configuration.
Since fewer cases were evaluated, there is a clearer distinction between the results obtained for the examined configurations. Starting from the left, the first branch (red area) includes configurations with the SmartBoardTM or ENERCIEL® combined with 1.5 cm SP26E and 10 cm of external polyurethane. In this area, there is the configuration that minimizes EC, that is, the one identified as in + out-SMARTBOARDTM-PI707-A0.5nv-SP26E-1.5cm-PU10. Compared to the base case, ΔEC is −13% and it is −5.2% compared to PI464-A2v-PU10. Its thermal capacity is equal to 124.26 kJ/m2 and the heating energy need is reduced by −10.4% compared to the base case. Negligible differences are observed between this solution and the ones identified as in + out-ENERCIEL®-PI707A0.5vSP26E-1.5cm-PU10 and in + out-ENERCIEL®-PI707A0.5nvSP26E-1.5cm-PU10 that are included in the same branch. The solution that minimizes EH is PI707A0.5nvSP26E-1.5cm-PU10 (−10.8% compared to the base case), but in this case the cooling energy need is higher, by +3.4% compared with in + out-SMARTBOARDTM-PI707-A0.5nv-SP26E-1.5cm-PU10; meanwhile, the heating demand is lower only by 0.4%.
In the second branch (gray area), the points with the lowest energy need for heating are characterized by SmartBoardTM or ENERCIEL® and the maximum thickness of the external polyurethane. In the upper part, there are the configurations with Weber.mur clima® combined with 1.5 cm SP26E and 10 cm external polyurethane. In the third branch (green area), there is the best solution with MOC + Micronal PCM, indicated with in + out + MOC + MICRONAL-PI707A5vSP26E-1.5cm-PU10. Compared to the base case, ΔEC = −10.5% and ΔEH = −10.3%.
Finally, in the fifth branch (blue area), there are the basic design configuration and configurations with 1 cm of RT31 combined with 6 cm external polyurethane on the external side and MOC + MICRONAL or Weber.mur clima® on the internal side.
More in general, it can be observed that the MOC with microencapsulated PCM performs worse in the cooling season than the other components evaluated for the internal application of phase change materials. This is mainly due to the low latent heat of fusion (9.2 kJ/kg). However, the other characteristics and the melting temperature make the performance of the MOC with PCM comparable to the plaster with Weber.mur clima®. For instance, considering the combinations in + out + MOC + MICRONAL-PI545-A5v-RT31-1cm-PU6 and in + out + WEBER.MUR CLIMA®-PI545-A5v-RT31-1cm-PU6, the heating demand is, respectively, 15.1 kWh/(m2 ye) and 15.0 kWh/(m2 year), and EC is 22.0 kWh/(m2 year) and 22.1 kWh/(m2 year).
Furthermore, this analysis also confirms that the combination of SmartBoardTM and SP26 allows minimizing the energy need for cooling.
3.3.2. Analysis of Primary Energy Need and Discomfort Hours
The comparison in terms of the primary energy need and the hours of indoor discomfort is reported in
Figure 11.
Three groups of points were identified. The yellow one includes the base case and the solutions with the higher request of primary energy. Among these, the in + out-ENERCIEL®-PI1121A5v-RT31-1cm-PU6 solution has the highest number of hours of discomfort (dH ≈ 497 h/y), while the solution indicated by in + out-MOC + MICRONAL-PI1121A5vRT31-1cm-PU6 implies the highest EPyearly, equal to 54 kWh/(m2 year).
In the central region there is the basic design configuration case (blue area). All other configurations are characterized by adoption of 1 cm of RT31 and 6 cm of insulation on the external side. The most interesting combinations, with ΔEP of 5.0%, are characterized on the internal side by the adoption of MOC + MICRONAL or Weber.mur clima® with a small variation of discomfort hours (−0.7%).
The most interesting region is evidenced with a green circle. Herein, there are solutions with SP26E and the maximum thickness of the external polyurethane, and in most cases with Weber.mur clima® plaster on the inner side.
However, the in + out-ENERCIEL®-PI707A0.5nvSP26E-1.5cm-PU10 solution is the one that minimizes the total primary energy requirement. For this solution, ΔEP ≈ −5.6% and dH is 488 h/year. The solution with the lower number of discomfort hours (dH ≈ 484 h/year) is in + out-WEBER.MUR CLIMA®-PI1121A0.5vSP26E-1.5cm-PU10. In this case, the thermal transmittance is 0.188 W/m2 K and thermal capacity is equal to 112 kJ/m2 K. The energy consumption increases and ΔEP is +3.4% due to the low level of thermal insulation on the internal side.
3.4. Solution of the Multi-Objective Optimization
The second step of the proposed approach consists of the solution of a multi-objective optimization problem in order to minimize the energy need for heating and cooling by varying the orientation of the wall on which the wall package is installed. Based on the results obtained in the previous sections, the best solutions to be considered are
in + out-ENERCIEL®-PI707A0.5nvSP26E-1.5cm-PU10,
PI707A0.5nvSP26E-1.5cm-PU10, and
in + out-SMARTBOARDTM-PI707A0.5nvSP26E-1.5cm-PU10. The base case and the basic configuration were also added to these solutions. The constraint is dH, equal to 491.3 h/year (minimum value according to the parametric analysis). The results are shown in
Figure 12; here, the red dots represent the Pareto solutions. In detail, three optimal solutions were observed, as shown in
Table 6, where it is clear that there are negligible differences both in term of heating and cooling request.
The three cases are characterized by the maximum thermal insulation on the external and internal side of the wall, which allows minimizing the heating losses but it can cause an increment of the summer overheating; for this reason, the best orientation was sought. All configurations on the south exposure are characterized by the higher heating demand and the lower cooling load. This happens because the PCM reduces the utilization of solar gains during the wintertime.
Among the simulated ones, the configurations with internal and external application have the greatest potential mainly when the products ENERCIEL® and SmartBoardTM are applied on the internal side. These allow increasing the thermal capacity of the wall package, mitigating internal thermal fluctuations, reducing overheating, and ensuring greater microclimatic comfort. On the outside, the module with SP26E and thickness of 1.5 cm allows better results. Indeed, the nature of the incorporated PCMs (inorganic compounds with higher latent heat of fusion compared to organic compounds) and the melting point compatible with the average external temperature help to counteract the incoming heat flow in the cooling season. This effect limits indoor temperature peaks and provides greater microclimatic comfort. The northeast orientation is the best, probably because it requires greater isolation; meanwhile, in summer months, the sun’s rays strike the wall perpendicularly in the morning and in the afternoon and the wall requires a material with a higher latent accumulation capacity. Indeed, for this exposure, the glass component of the test room is oriented to the southwest and is therefore exposed to intense solar radiation which would increase the solar gains. For this reason, it is required to contain the overheating in the environment with the material able to accumulate more latent heat.
Another interesting conclusion is that when the north exposure is selected, the adoption of one PCM as SP26E on the external side is enough to reach the proposed objectives.
In particular, the solution PI707A0.5nvSP26E-1.5cm-PU10 provides the lowest number of discomfort hours compared to the other solutions. This happens because the northern exposure in the cooling season is the side with the lowest surface temperature on the wall.
In all three cases, the heating and cooling loads are comparable; in particular, ΔEc is around −57% and ΔEH is near −29%, compared to the base case, and these indices are, respectively, −22% and −53% compared to the basic design configuration.
4. Conclusions
In order to establish a wall package made of geopolymer concrete and phase change material that can provide sustainable solutions for building performance in Mediterranean climates, and to find the main outcomes of the overall design, a double step analysis is proposed for determining an optimal configuration of a real case study.
A numerical analysis is proposed by means of a dynamic simulation tool (EnergyPlus) for a simple building consisting of a large-scale test room (36 m2), available at the Department of Engineering of University of Sannio. This was selected as the case study because in these next months, some experimental activities will be performed in the frame of the European project “Green Integrated Structural Elements for Retrofitting and New Construction of Buildings”. The proposed dissertation is the starting point for investigating the effects of types and thickness of insulation, air gap, and PCM types for a base package under evaluation in the project. More in detail, the base wall of the test room with vacuum insulation panels and the base configuration of the project with internal panel with 4 cm polyurethane and 6 cm air gap (not ventilated), 2 cm of non-ventilated external air gap, and 10 cm of polyurethane on external side were compared with other packages in term of minimization of heating and cooling loads, minimization of discomfort hours, and yearly primary energy need.
Tree solutions were placed on the Pareto front; the one with north exposure requires the application only on the internal side of a PCM with melting temperature of 26 °C, and compared with the base case, ∆EH is −57% and ∆EC is −22%. This solution also minimizes the discomfort hours (−17%). Comparable energy saving can be reached with the application of two phase change materials (on the inner and outer sides) with melting temperature of 26 °C. All three solutions require the maximum insulation on internal and external sides, a not-ventilated air gap, and 1.5 cm of PCM thickness.

 ,
, 


