Article

Experimental Study on the Bond-Slip Behavior of Steel-Steel Fiber Recycled Aggregate Concrete

1
School of Civil Engineering, Xi’an University of Architecture & Technology, Xi’an 710064, China
2
Institute for Interdisciplinary and Innovate Research, Xi’an University of Architecture & Technology, Xi’an 710064, China
3
School of Science, Xi’an University of Architecture & Technology, Xi’an 710064, China
*
Author to whom correspondence should be addressed.
Buildings 2022, 12(6), 823; https://doi.org/10.3390/buildings12060823
Submission received: 30 May 2022 / Revised: 9 June 2022 / Accepted: 10 June 2022 / Published: 14 June 2022

Abstract

:
To study the bond–slip behavior of steel–steel fiber recycled aggregate concrete, push-out tests of 16 specimens were carried out using steel fiber volume ratio, steel fiber aspect ratio, steel protective layer thickness and steel embedded length as the design parameters. In addition, the crack patterns, steel strain distribution, and load–slip curves were studied, in addition to the bond strengths of the interface between the steel–steel fiber and recycled aggregate concrete. The results showed that the fracture cracks of the specimens mainly included bond cracks and expansion cracks. For the load increase stage, the maximum strain of the steel flange was near the loading end of the steel and decreased toward the free end, while the strain changed linearly for the load descending stage. The bond–slip process between the steel–steel fiber and recycled aggregate concrete included five stages, which consisted of slight-slip, slow-slip, accelerated-slip, the sharp-slip and load-steep-drop stage, and gentle-slip stage. Additionally, the influencing factors of bond strength were analyzed, where the bond strength increased first and then decreased with increasing steel fiber volume and steel fiber aspect ratios, and the bond strength increased with increasing steel protective layer thickness. The ultimate bond strength decreased slightly with increasing steel embedded length. Finally, the equation for calculating the characteristic bond strength of the steel–steel fiber recycled aggregate concrete was established, which showed that the calculation results were in good agreement with the test results.

1. Introduction

The proposition of using recycled concrete could realize the recycling and utilization of construction waste, meeting the requirements of green energy and sustainable development [1,2,3]. However, recycled concrete [4] has not been widely used due to its disadvantages of low strength and easy cracking [5,6,7]. Studies have shown that the addition of steel fibers can significantly improve the performance of recycled concrete, effectively enhancing the strength, toughness, and crack resistance of recycled concrete [8,9,10,11].
As a new type of composite structure, steel–steel fiber recycled concrete structures not only have characteristics of a high bearing capacity and good seismic performance of ordinary steel–concrete structures [12,13], but can also reduce the exploitation of natural aggregate, offering good prospects for development and applications. Currently, some studies have been conducted on steel–steel fiber recycled concrete structures worldwide [14,15]. Wu et al. [16] studied the flexural performance of steel fiber–concrete composite beams by completely or partially replacing the steel cages in the beams with steel fibers. Wang [17] studied the seismic performance of steel fiber–steel concrete beam–column composites under low cyclic loads, and Xiao [18] studied the seismic performance of steel fiber–steel ultra-high-strength concrete short columns. In summary, current studies on steel–steel fiber recycled concrete structures have mainly focused on the flexural performance of beams and the seismic performance of beam–column composites; however, few studies have been conducted on the bond–slip performance between the interfaces [19,20,21].
Existing studies [22,23,24] have shown that the bonds between the interface of the section steel and concrete were the basis for the synergistic action of the section steel and concrete, directly affecting the bearing capacity and failure status of steel-reinforced concrete structures [25,26]. Therefore, research on the bond–slip behavior of the interface between the steel and steel fiber recycled concrete has been the premise of structural theoretical research and engineering applications of steel fiber recycled concrete. Thus, in this work, we designed 16 one-way push-out specimens and investigated the bond–slip performance of the steel and steel fiber recycled concrete interface, and assessed different steel fiber volume ratios, steel fiber aspect ratios, and steel protective layer thicknesses and embedded lengths, to provide a reference for future applications and development.

2. Experimental Program
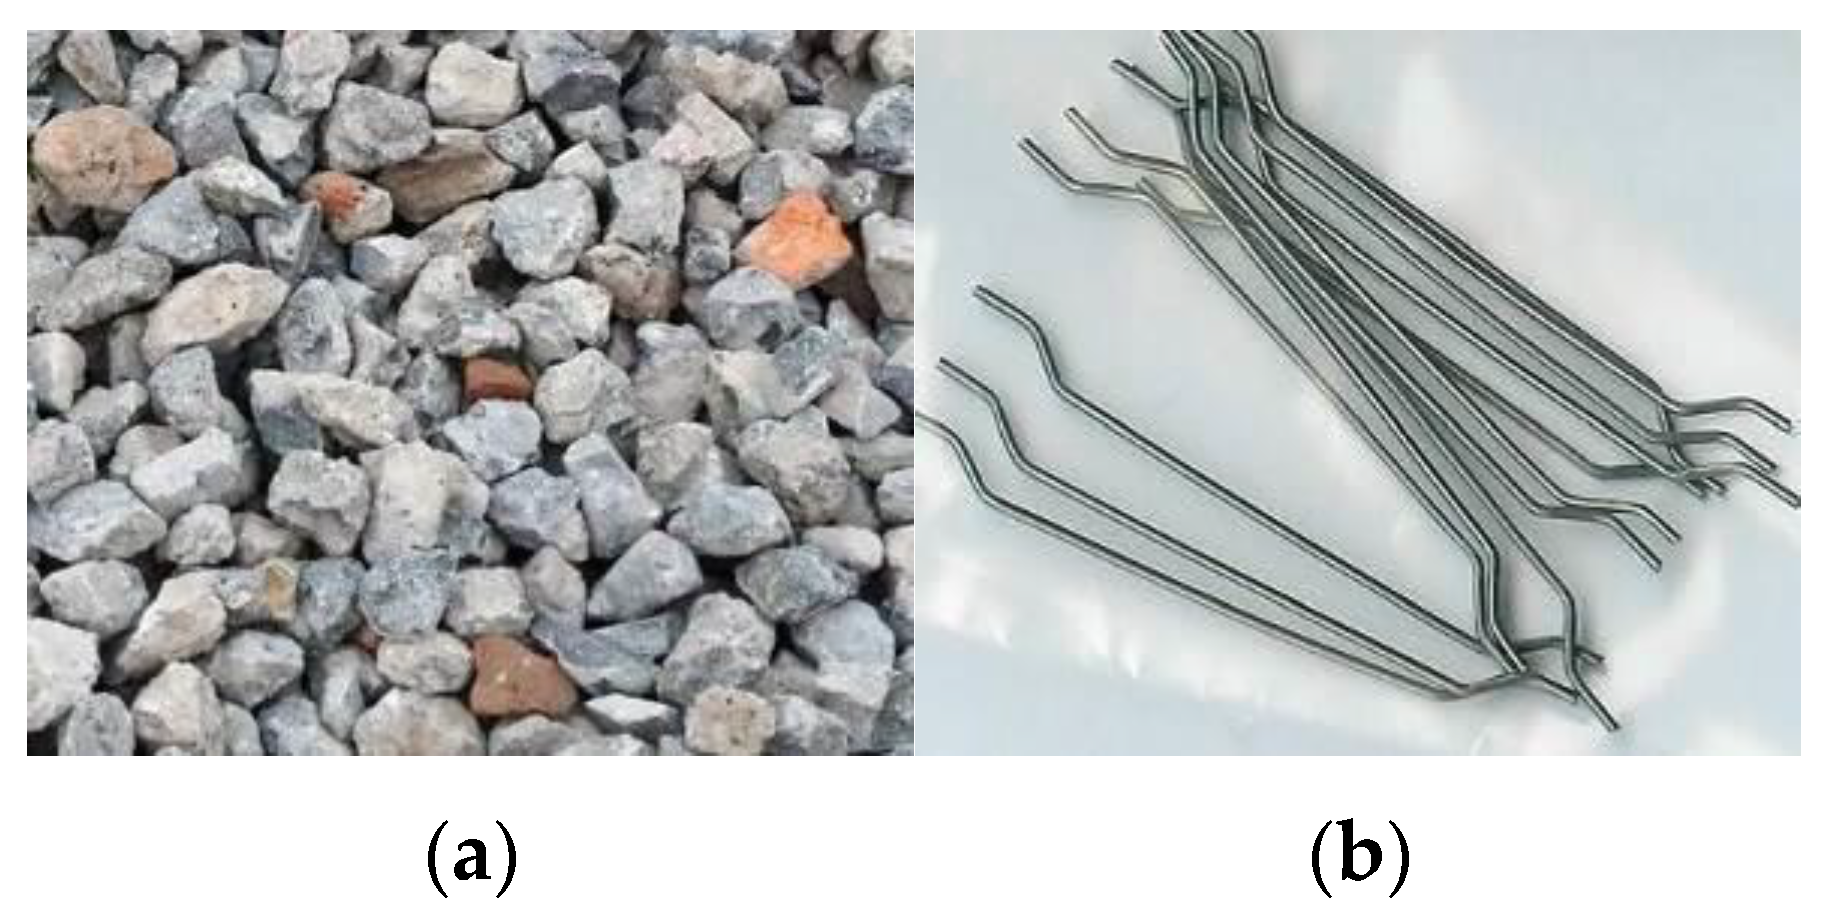
2.1. Test Materials

The cement used in this work adopts Qinling brand PC42.5R ordinary Portland cement; the river sand is medium sand with a fineness modulus of 2.8. The particle size, apparent density, and crushing index of the recycled coarse aggregate were 5–25 mm, 2500 kg/m3, and 13.2%, respectively. The composite I-steel consisted of two 18-channel steel and two 6 mm thick steel plates bonded with epoxy resin. The longitudinal and hooped reinforcements consisted of 16 ribbed steel bars and 6 smooth round steel bars. The mixture designs of the recycled concrete and steel fiber parameters are shown in Table 1 and Table 2, and the recycled aggregate and steel fibers are shown in Figure 1. The average compressive strength of the recycled concrete was fcu = 39.2 MPa at 28 days, and the mechanical properties of the recycled aggregate and steel are shown in Table 3 and Table 4.

2.2. Specimen Design

In this experiment, 14 steel–steel fiber recycled concrete push-out specimens and 2 contrast push-out specimens without steel fibers were designed. The detailed designs of the specimens are shown in Table 5, and the detailed sizes of the specimens are shown in Figure 2.

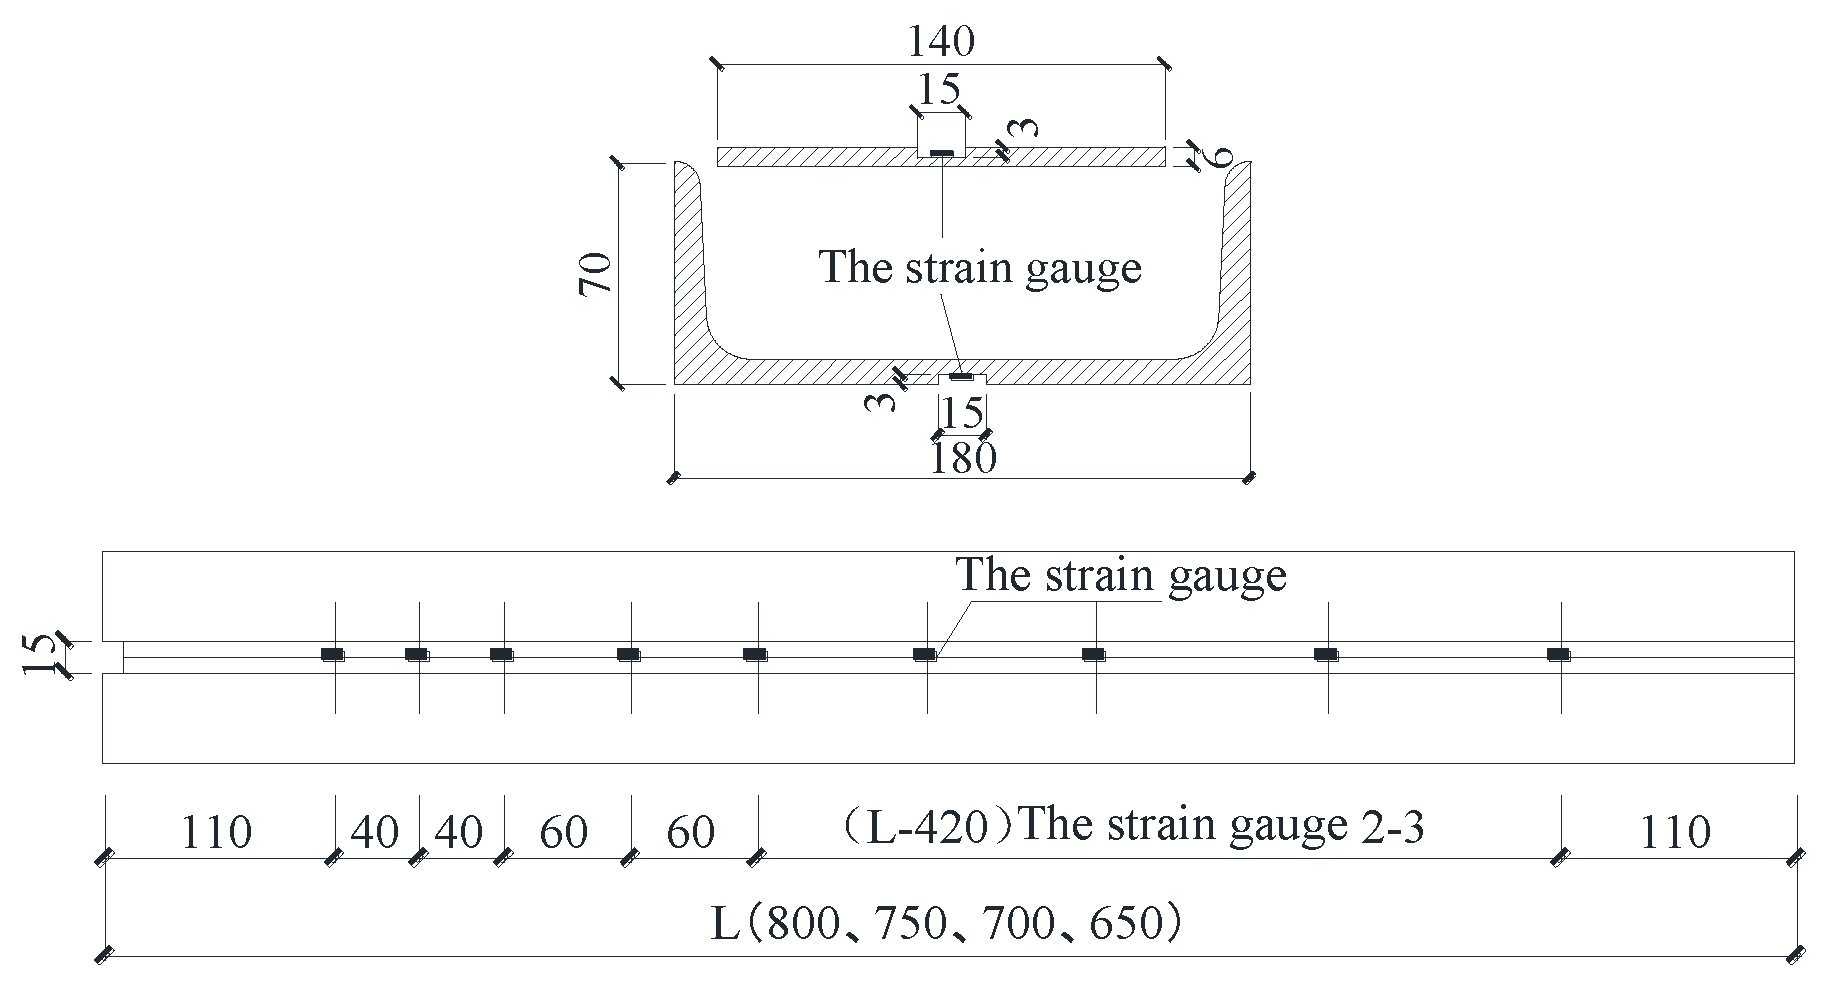
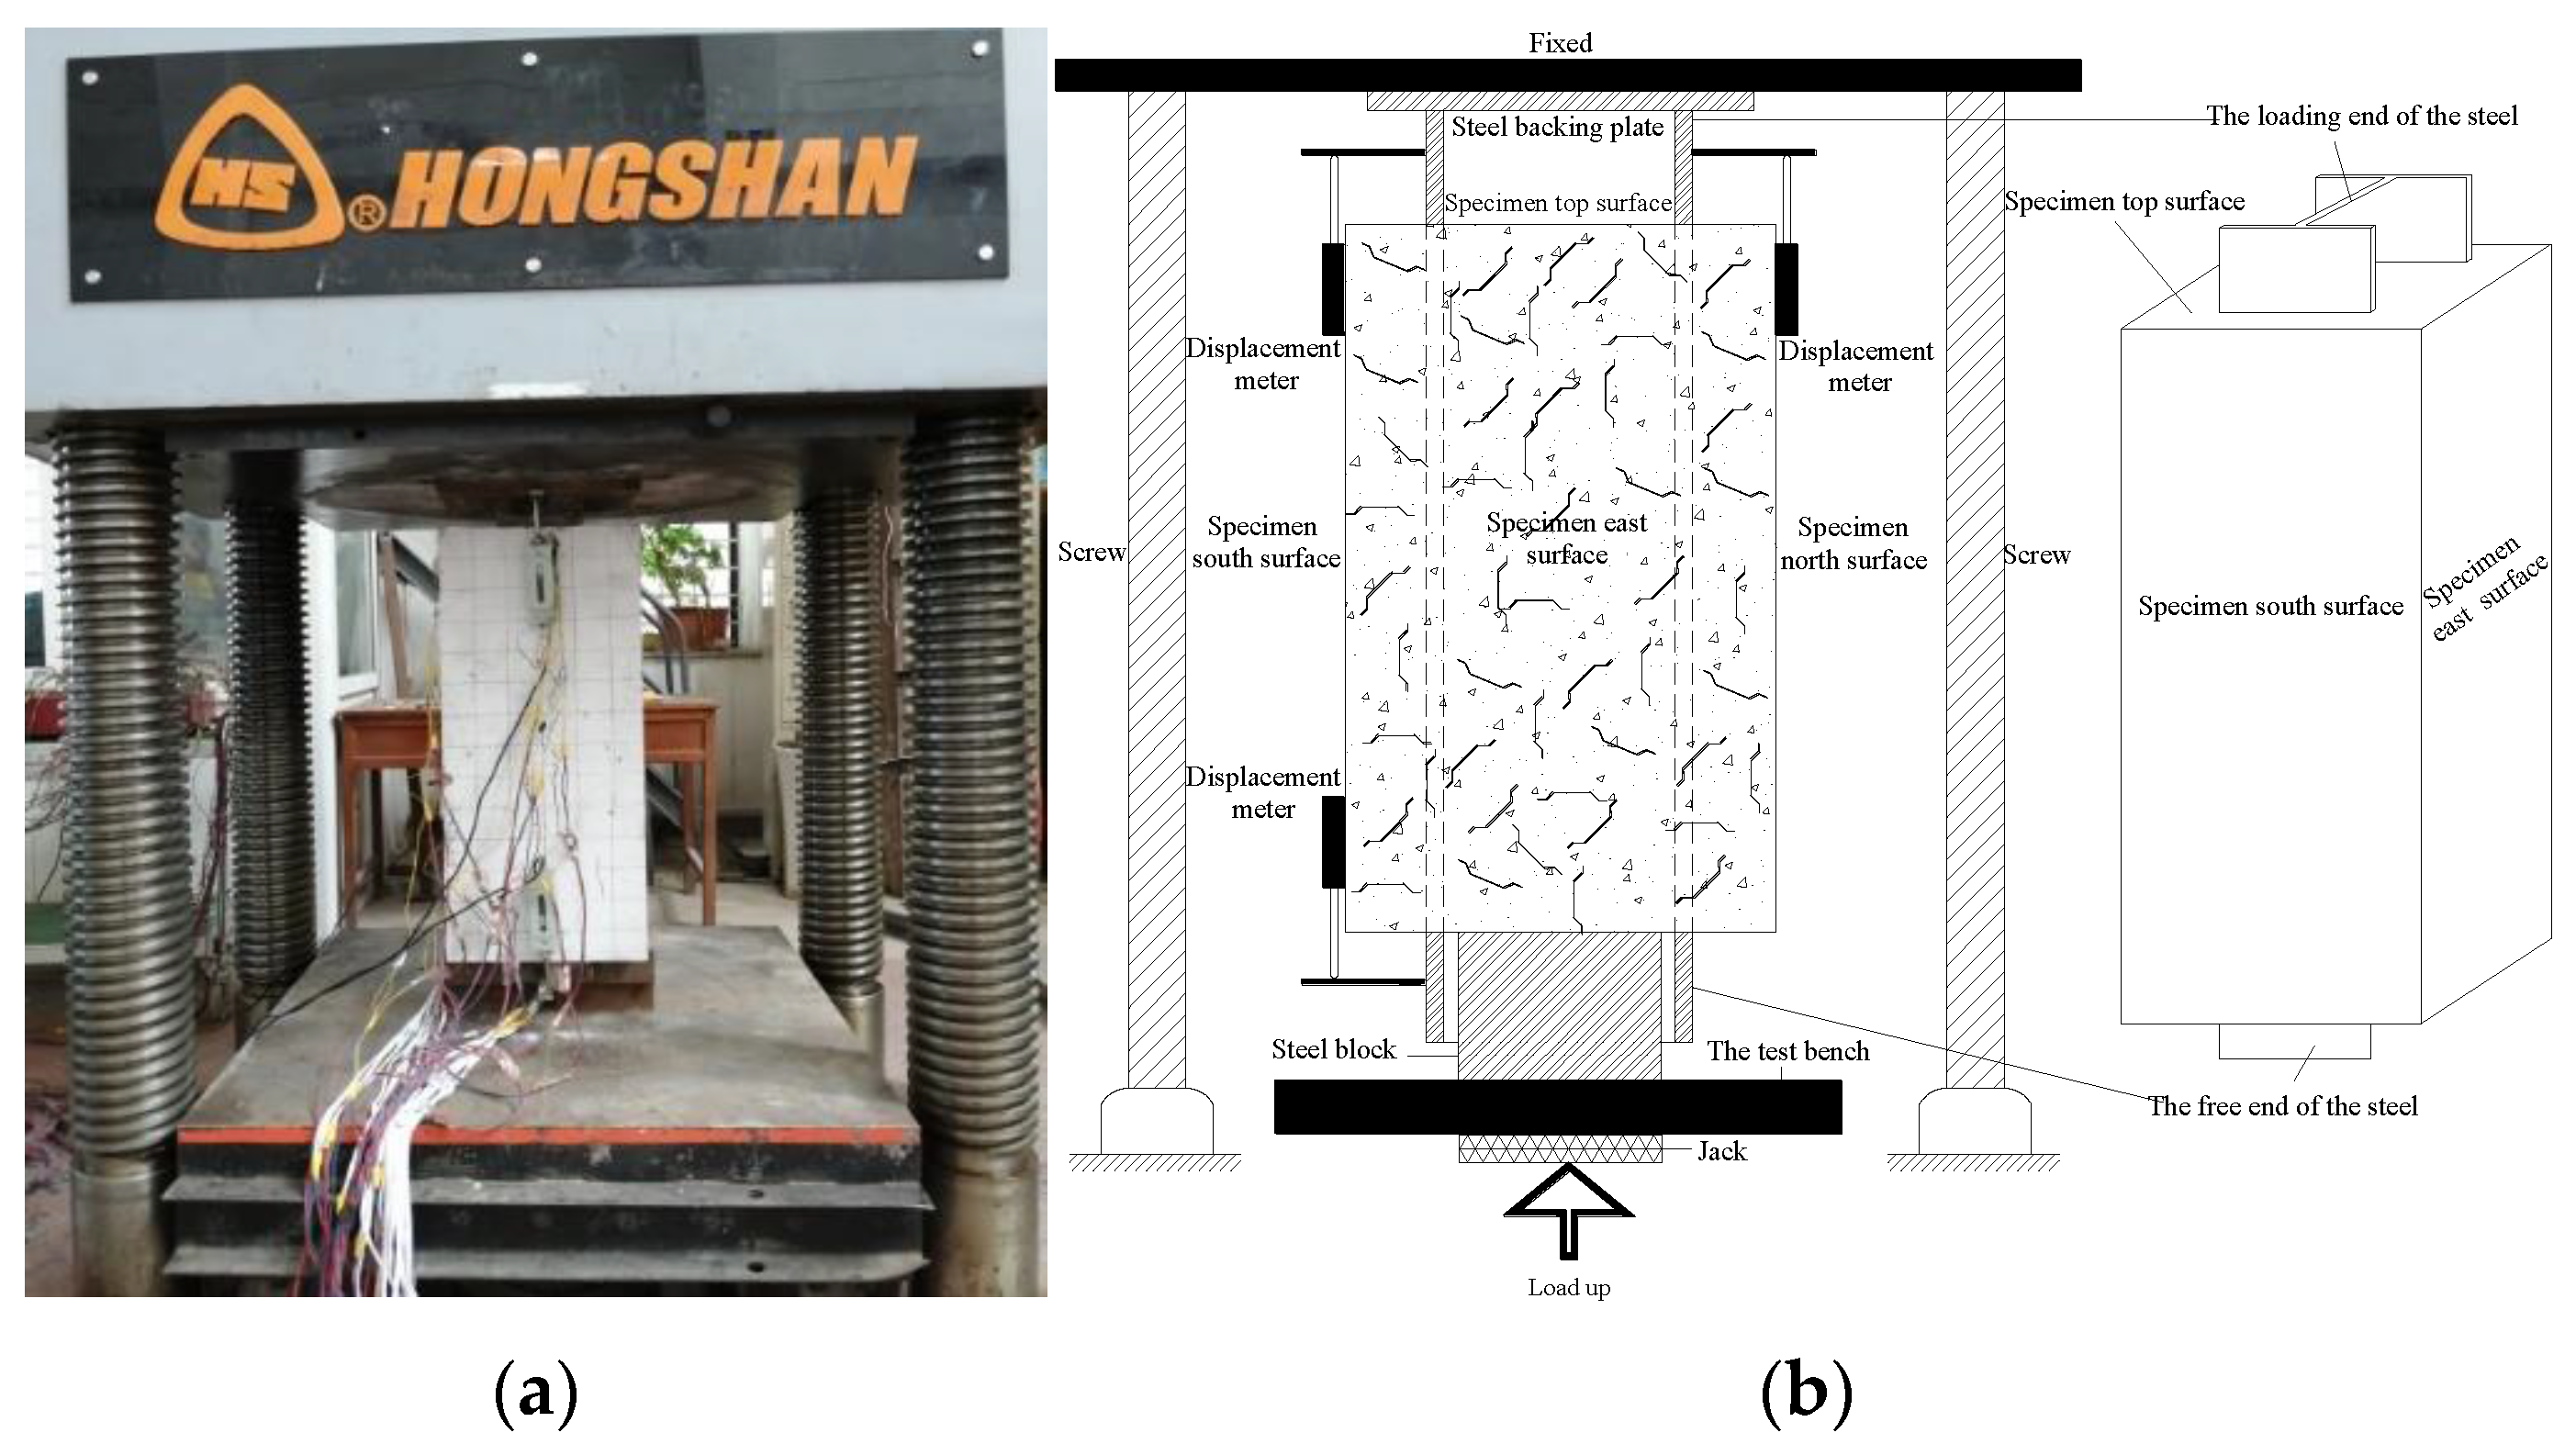
2.3. Instrumentation

In the experiment, grooves were milled on the steel plate and channel steel, and strain gauges were arranged in the grooves at a certain distance, in order to measure the surface strain of the section steel, obtain the surface strain distribution of the section steel, and further obtain the bond stress distribution of the interface between the section steel and steel fiber recycled concrete. The position of the strain gauge is shown in Figure 3 (unit: mm).

2.4. Loading Scheme

The push-out test for the section steel–steel fiber recycled concrete specimens was carried out on a 5000 kN pressure test machine located at the Key Laboratory of Structural Engineering and Seismic Engineering of the Ministry of Education, Xi’an University of Architecture and Technology. The loading device is shown in Figure 4. A displacement-controlled monotonic loading scheme was applied with a loading rate of 0.2 mm/min. The lower end of the specimen was in contact with the test bench through the steel pad block, and the upper end of the section was fixed with the pressure testing machine. When loading, the upper end of the section consisted of the loading end of the section while the lower end was the free end. Loading was stopped when there was obvious slippage between the steel and the steel fiber recycled concrete or obvious spalling and local failure of the steel fiber recycled concrete occurred during the loading process.

3. Results of Push-Out Tests

3.1. Crack Morphology of the Specimens

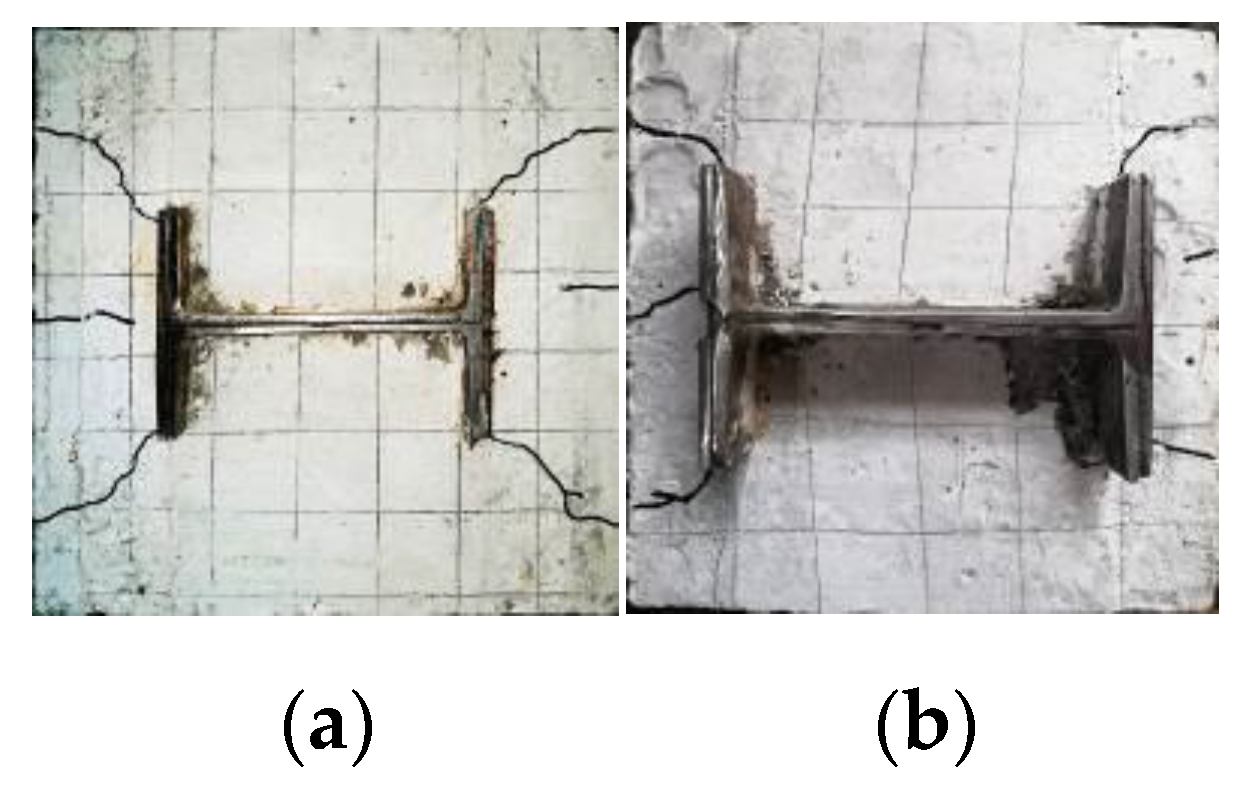
3.1.1. Crack Morphology at the Loading End of the Section Steel

The crack morphology at the loading end of steel specimens is shown in Figure 5, Figure 6 and Figure 7. The main crack types could be divided into expansion and bonding cracks, which were described as follows.
(1)
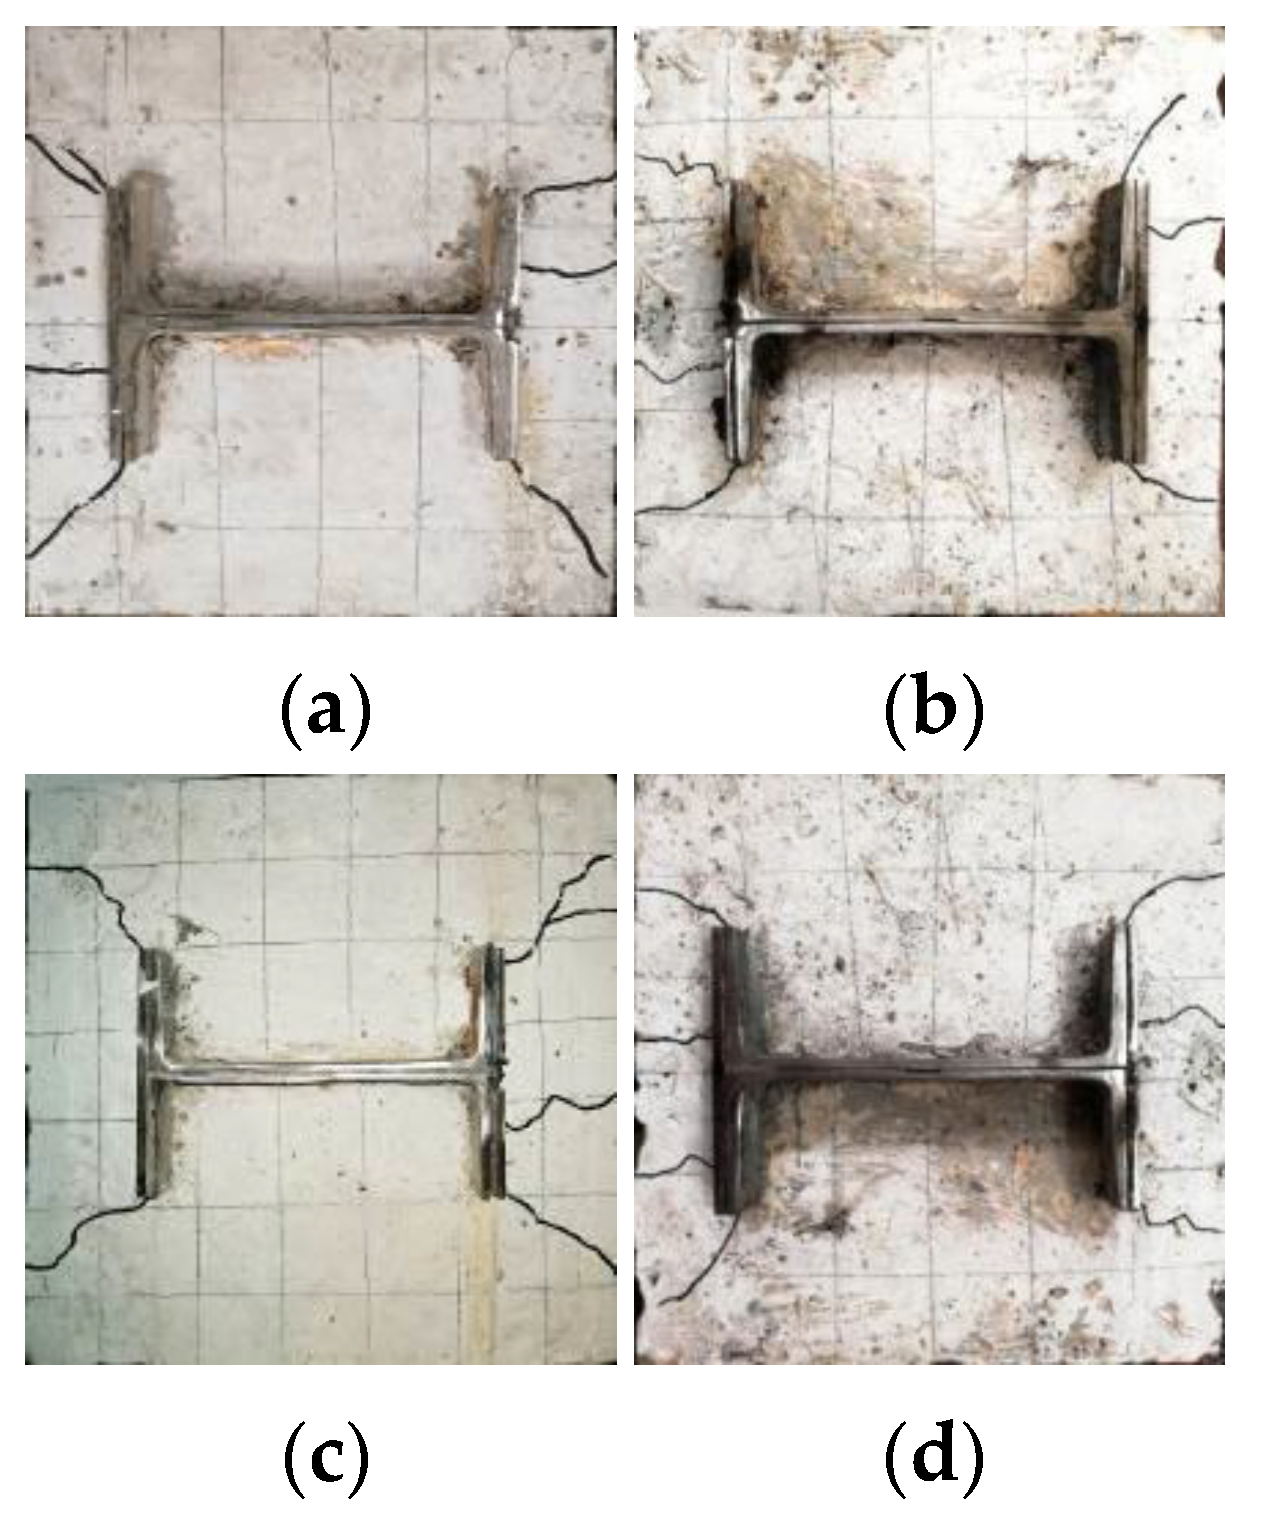
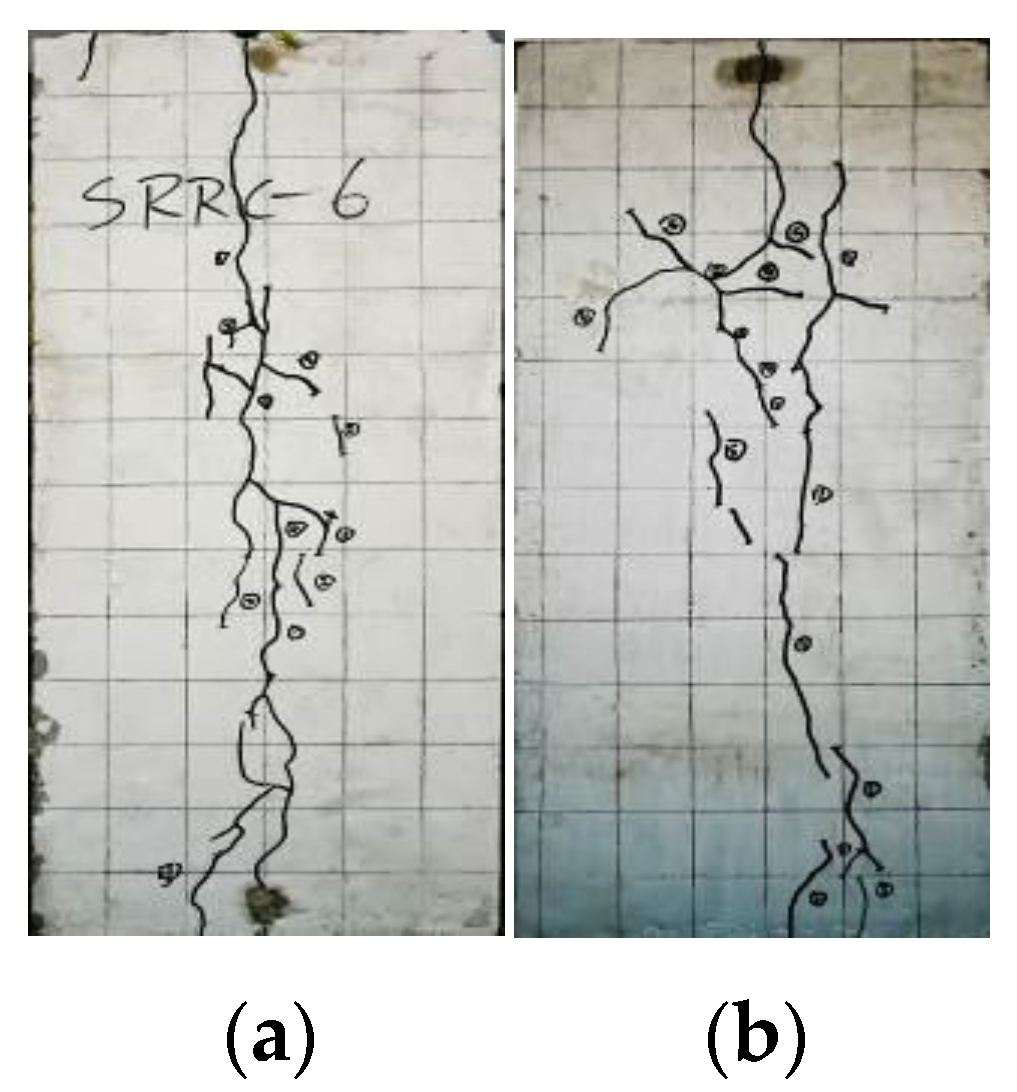
We observed cracks along the plane direction of the steel web at the flanges of all specimens; however, the locations of the cracks were different, and for most of the specimens they appeared in the middle of the steel flange. These cracks were connected with the cracks on the sides of the specimens, forming main failure cracks on the specimen sides. As shown in Figure 5, the cracks in specimens S-SFRAC12 and S-Sfrac14 did not reach the flanges of the steel sections when loading was stopped. Thus, we determined that these cracks were expansion cracks, which developed from the edges of the specimen to the internal steel section.
(2)
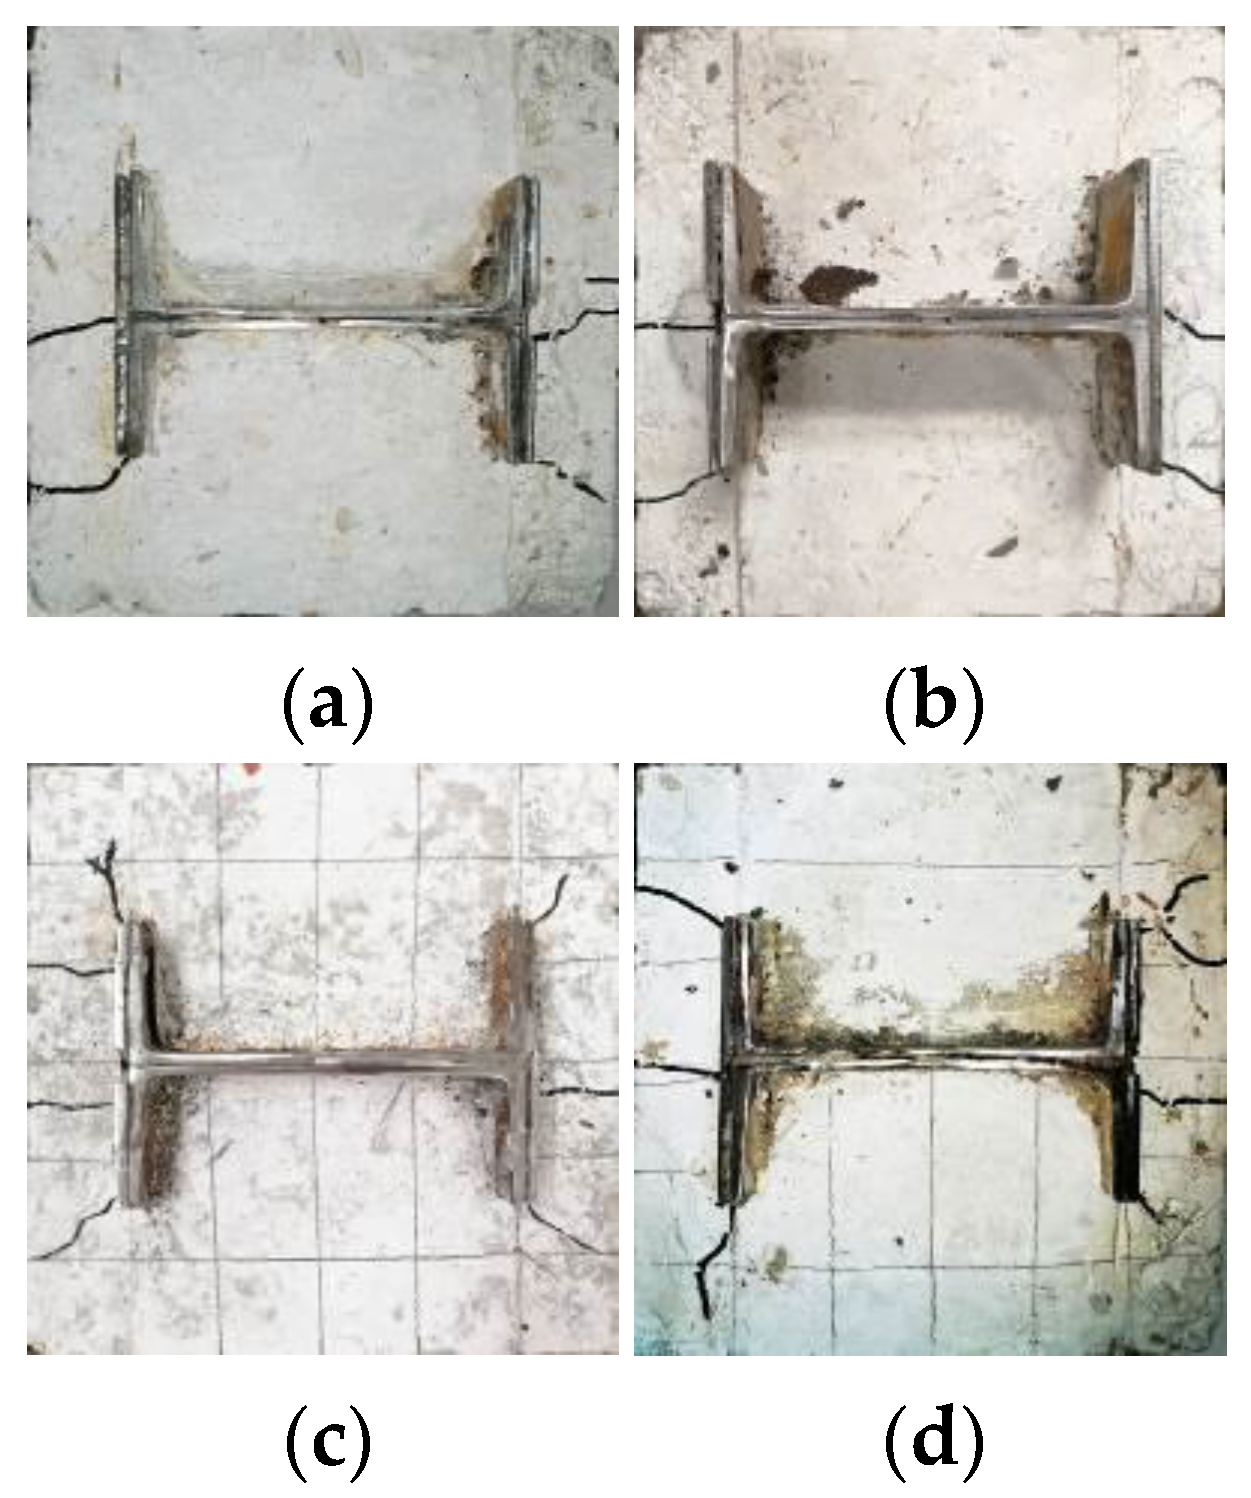
In all specimens, we observed cracks at the limb tip on both sides of the steel flanges, extending roughly to the edges of the specimen at a 45-degree angle, as shown in Figure 6. When these cracks reached the edges of the specimens, they were almost vertical to the specimen edge. During the later stages of loading, most of these cracks extended to the sides of the specimens, and some cracks did not extend to the edges of the specimens at the end of loading in SRRC02, S-SFRAC04, 08, 09, 11, and 15. This type of cracking was produced by the bonding between the steel and steel fiber recycled concrete interface under loading, which developed from the inside of the specimen to the surface and consisted of a bonding crack.
(3)
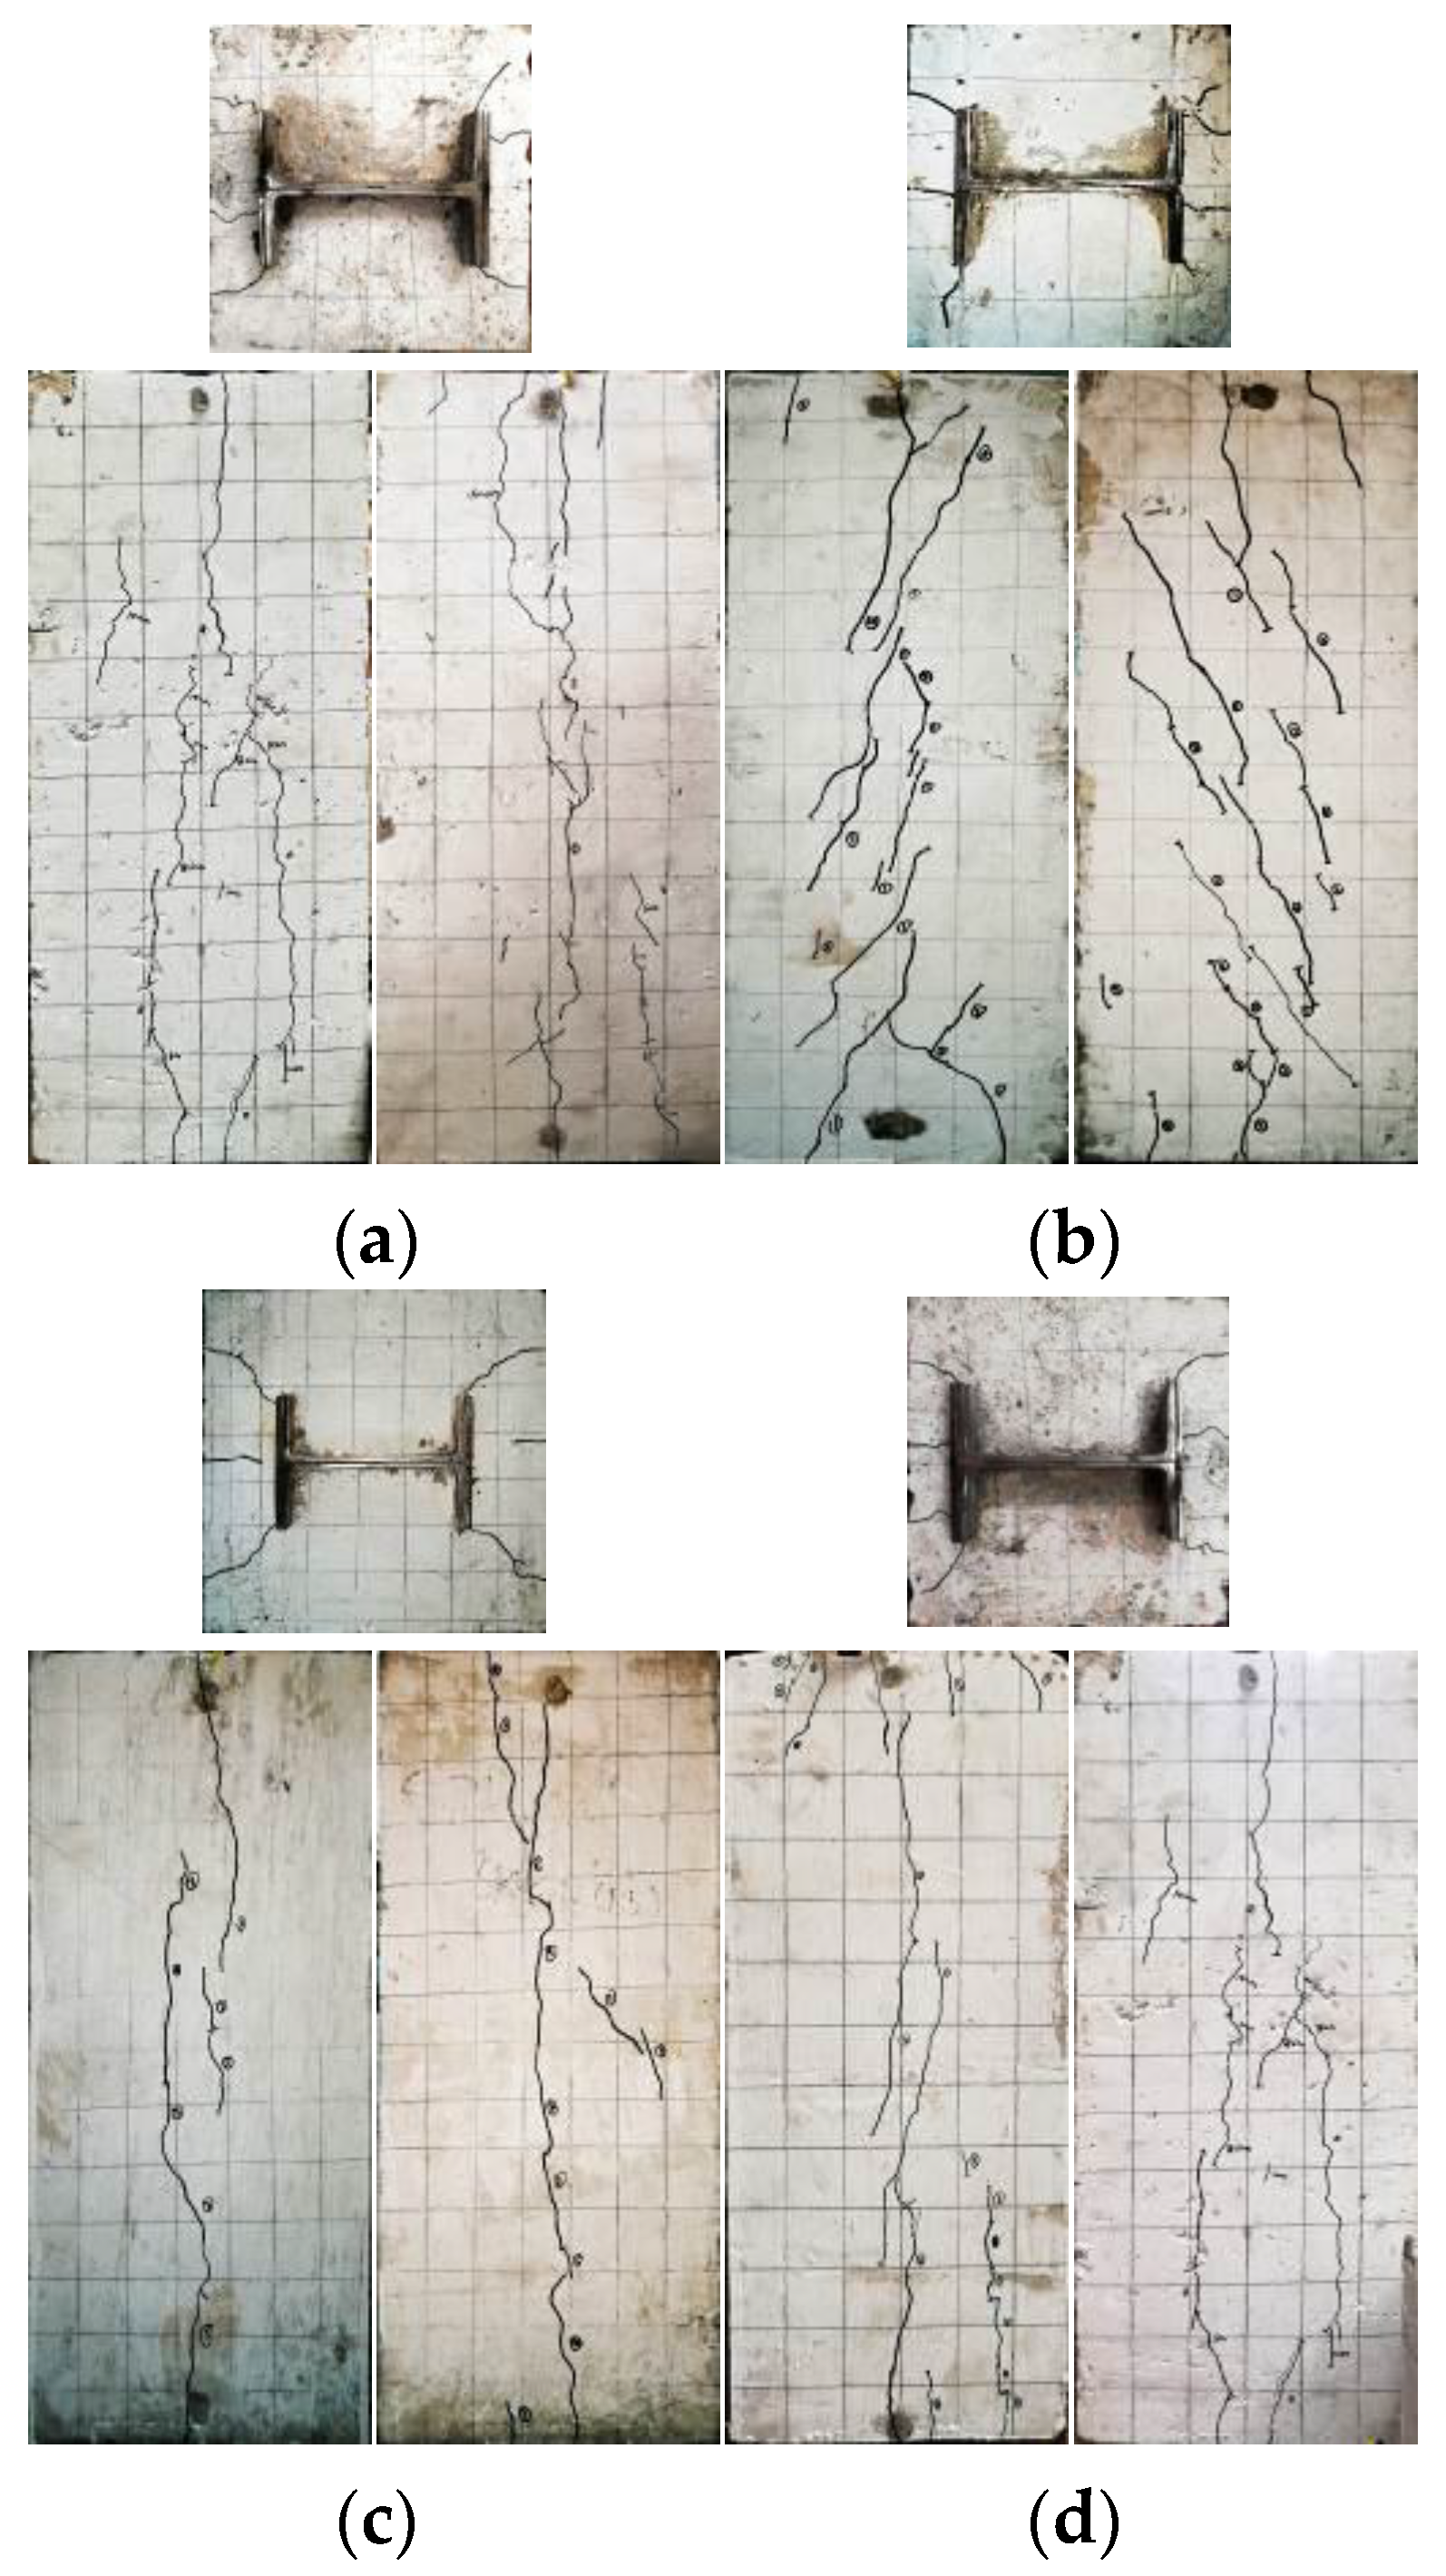
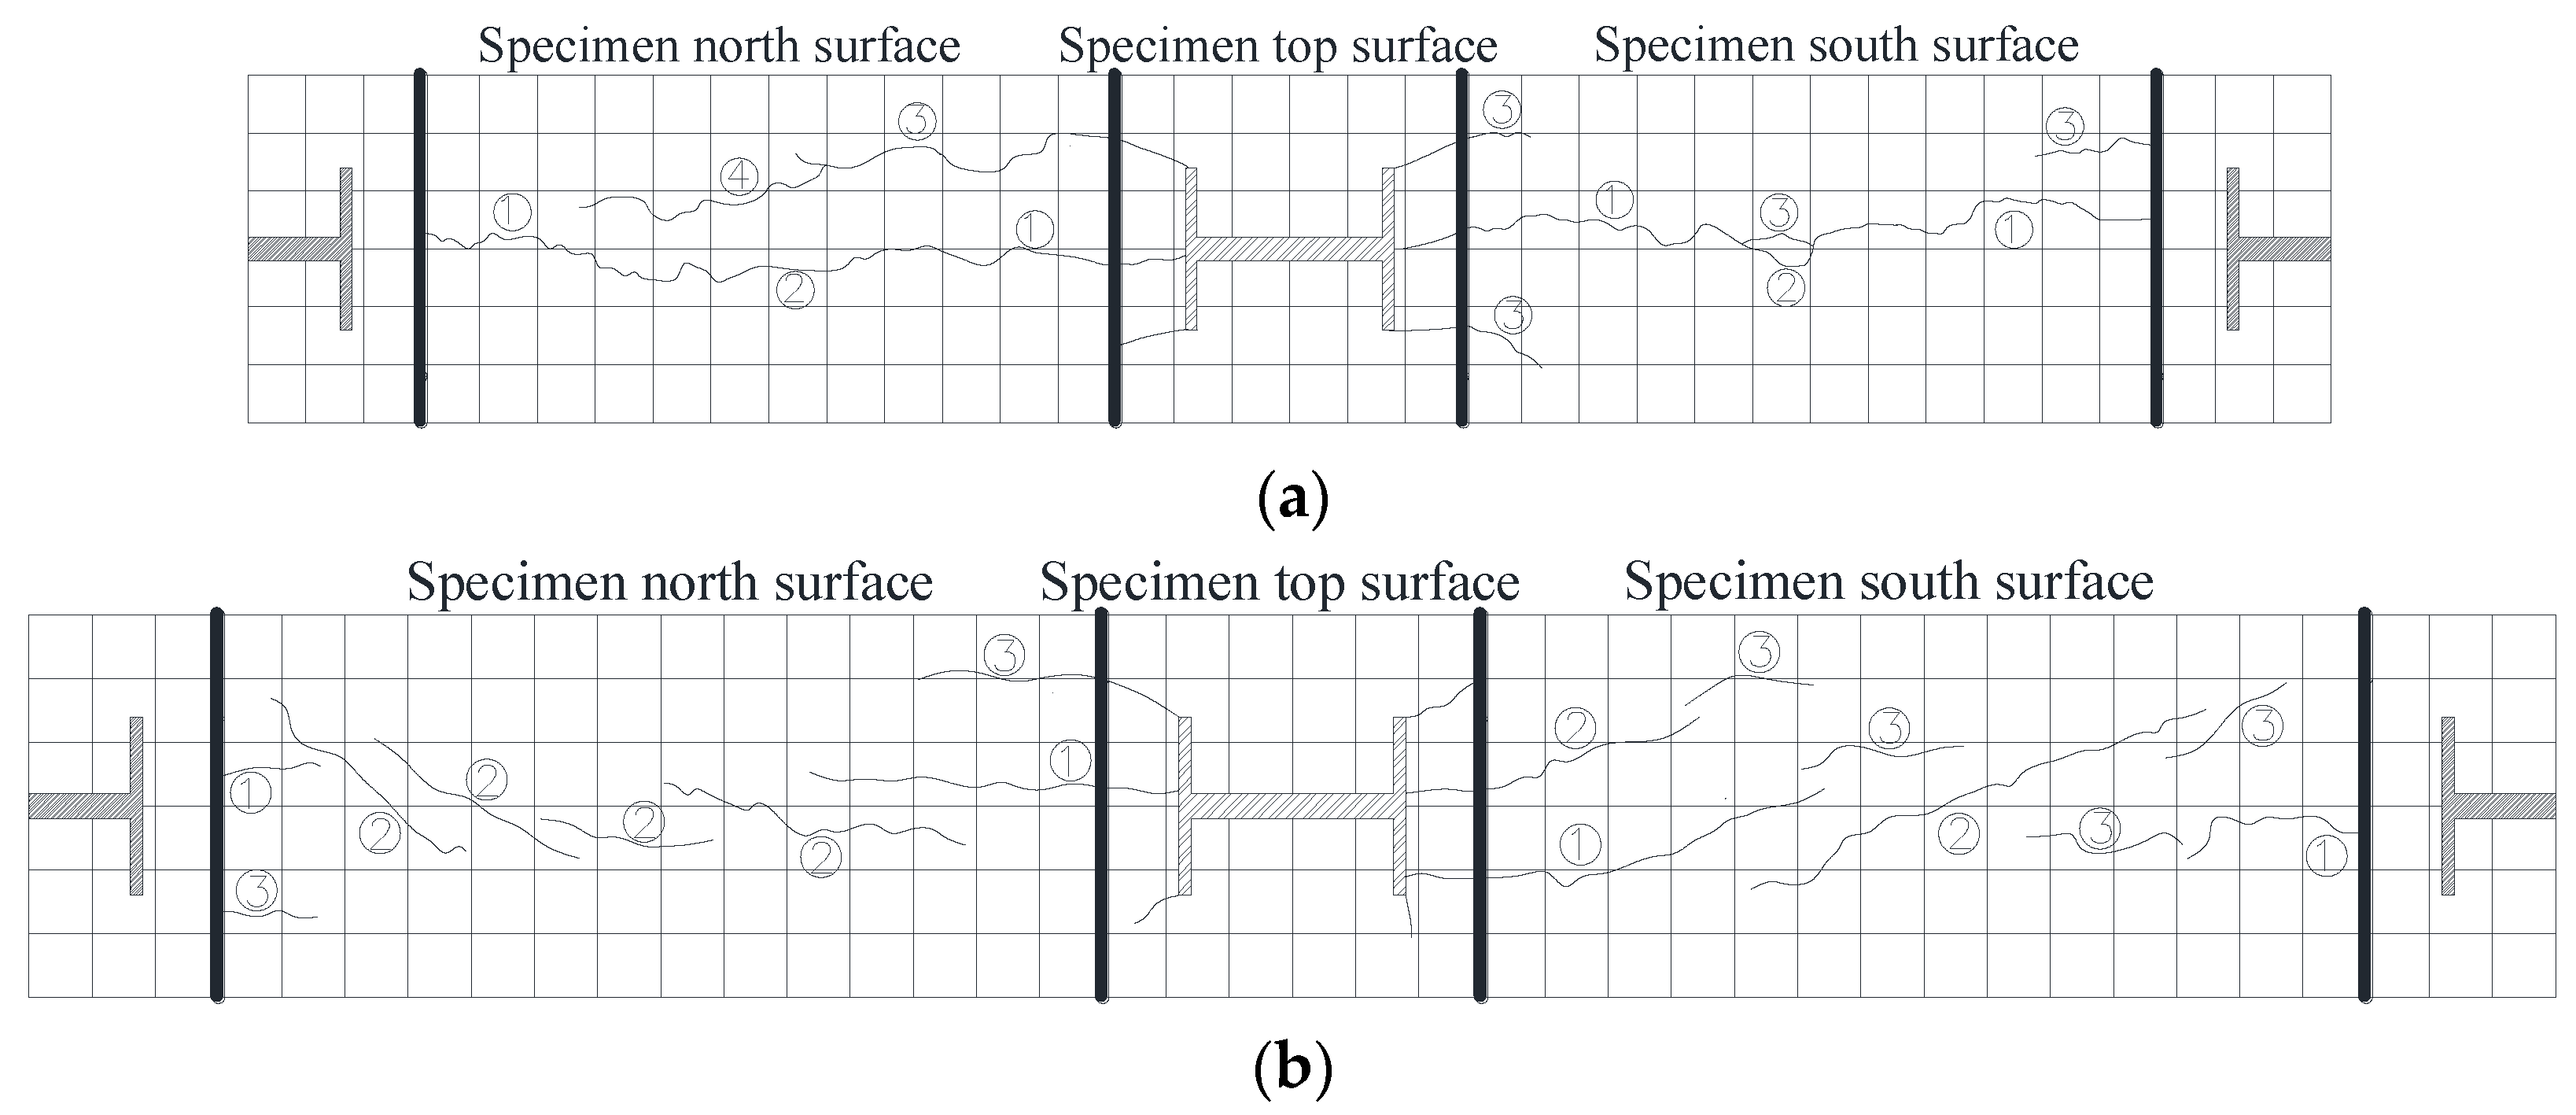
For S-SFRAC05 and S-SFRAC13, cracks only appeared on one side; however, for S-SFRAC08 and S-SFRAC09, cracks were found at the flanged extremity tips along the flat sides of the flanges, but they did not extend to the edges of the specimens. The two cracks that formed are shown in Figure 7.

3.1.2. Side Crack Morphology

Figure 8 shows the side cracks of the four specimens. Specimens S-SFRAC04, 09, 12, and 16 were one of the specimens whose design parameters are steel fiber volume ratio, steel fiber aspect ratio, section steel protective layer thickness, and section steel embedded length. We found that the cracks were focused near the central axis of the steel flange side. In addition, a through-crack and a few longer cracks extended to both ends of the specimens. The cracks that were located in the middle of the steel flange connected into a main crack at the loading end and side; however, the cracks on both the steel flange tips did not extend to the side, or only extended a short distance. Considering the crack phenomena at the loading end of the section steel, these longitudinal main cracks on the sides of the specimens were mostly caused by expansion cracking of the steel fiber recycled concrete.
Figure 9 shows two typical lateral crack patterns, Figure 9a shows a single long-pass crack, and Figure 9b shows multiple oblique cracks. The development of these two types of typical lateral cracks at different times occurred as follows.
As shown in Figure 9a, the ultimate load of the S-SFRAC15 specimen was 793.27 kN, where numbers ①, ②, ③, and ④ represent the crack states of Pu (S = 0.45 mm), 47%Pu (S = 4.5 mm), 44%Pu (S = 8.5 mm), and 43%Pu (S = 13 mm), respectively. Under loading, the specimen formed long cracks (represented by no ①) primarily at the upper and lower ends of the sides. Before crack connection, the cracks continued to expand under loading, and finally the cracks at the upper and lower ends connected at crack ②. When loading continued, new cracks ③ and ④ appeared on the sides. These cracks slowly developed until the end of loading but did not connect.
As shown in Figure 9b, the ultimate load of S-SFRAC08 was 770.96 kN. When the load reached 70%Pu (S = 0.22 mm), crack ① appeared at both ends of the specimen sides, developing roughly along the central axis of the side. When the load reached the ultimate load value Pu (S = 0.48 mm), many oblique cracks ② formed. These oblique cracks did not connect; however, their ends were close to each other and were distributed near the central axis of the side. After continued loading, the cracks showed slow downward development, but did not connect until the end of loading. When loading reached 62%Pu (S = 5.1 mm) and 60%Pu (S = 10.1 mm) kN, new cracks ③ and ④ appeared at the other positions on the sides, respectively.
As shown in Figure 10, there were many branch cracks near the main cracks in specimens S-SFRAC06 and S-SFRAC10. In addition, crack development of the specimens with steel fibers was slightly slower than the specimens without steel fibers, mainly because the deformation energy released after the occurrence of microcracks was first used for steel fiber debonding, instead of supporting continued crack growth, thus delaying the cracking process.

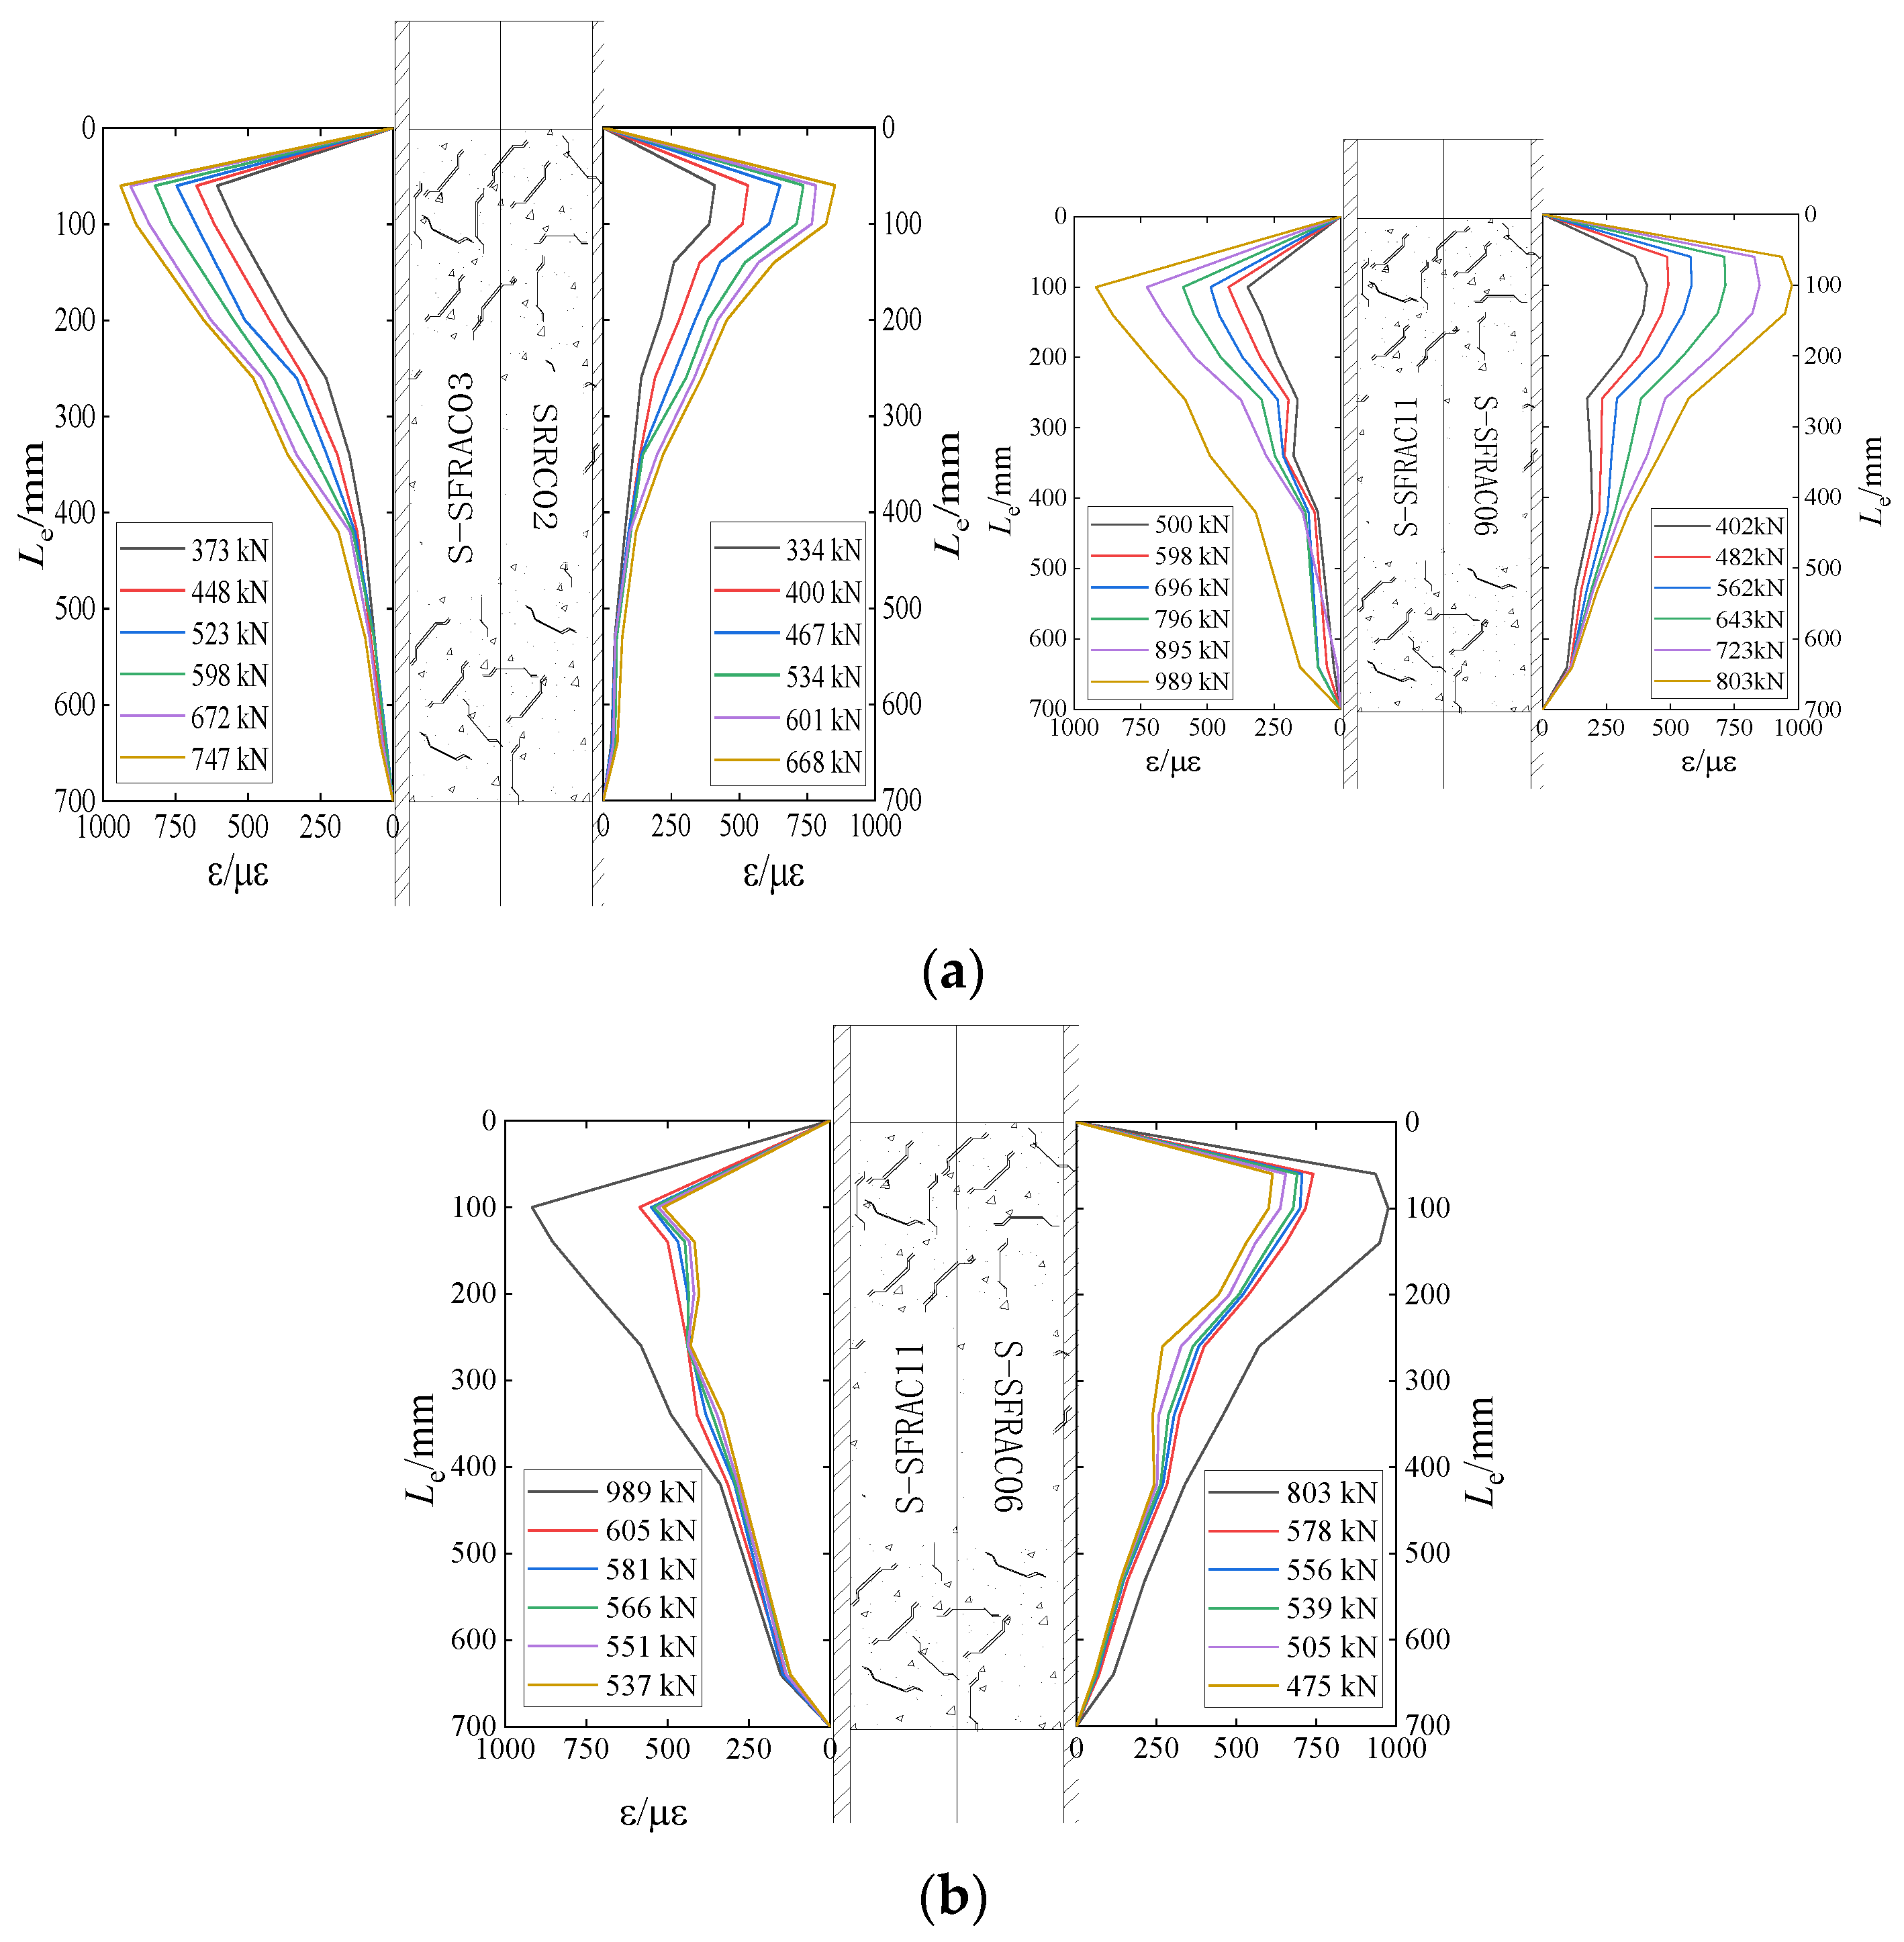
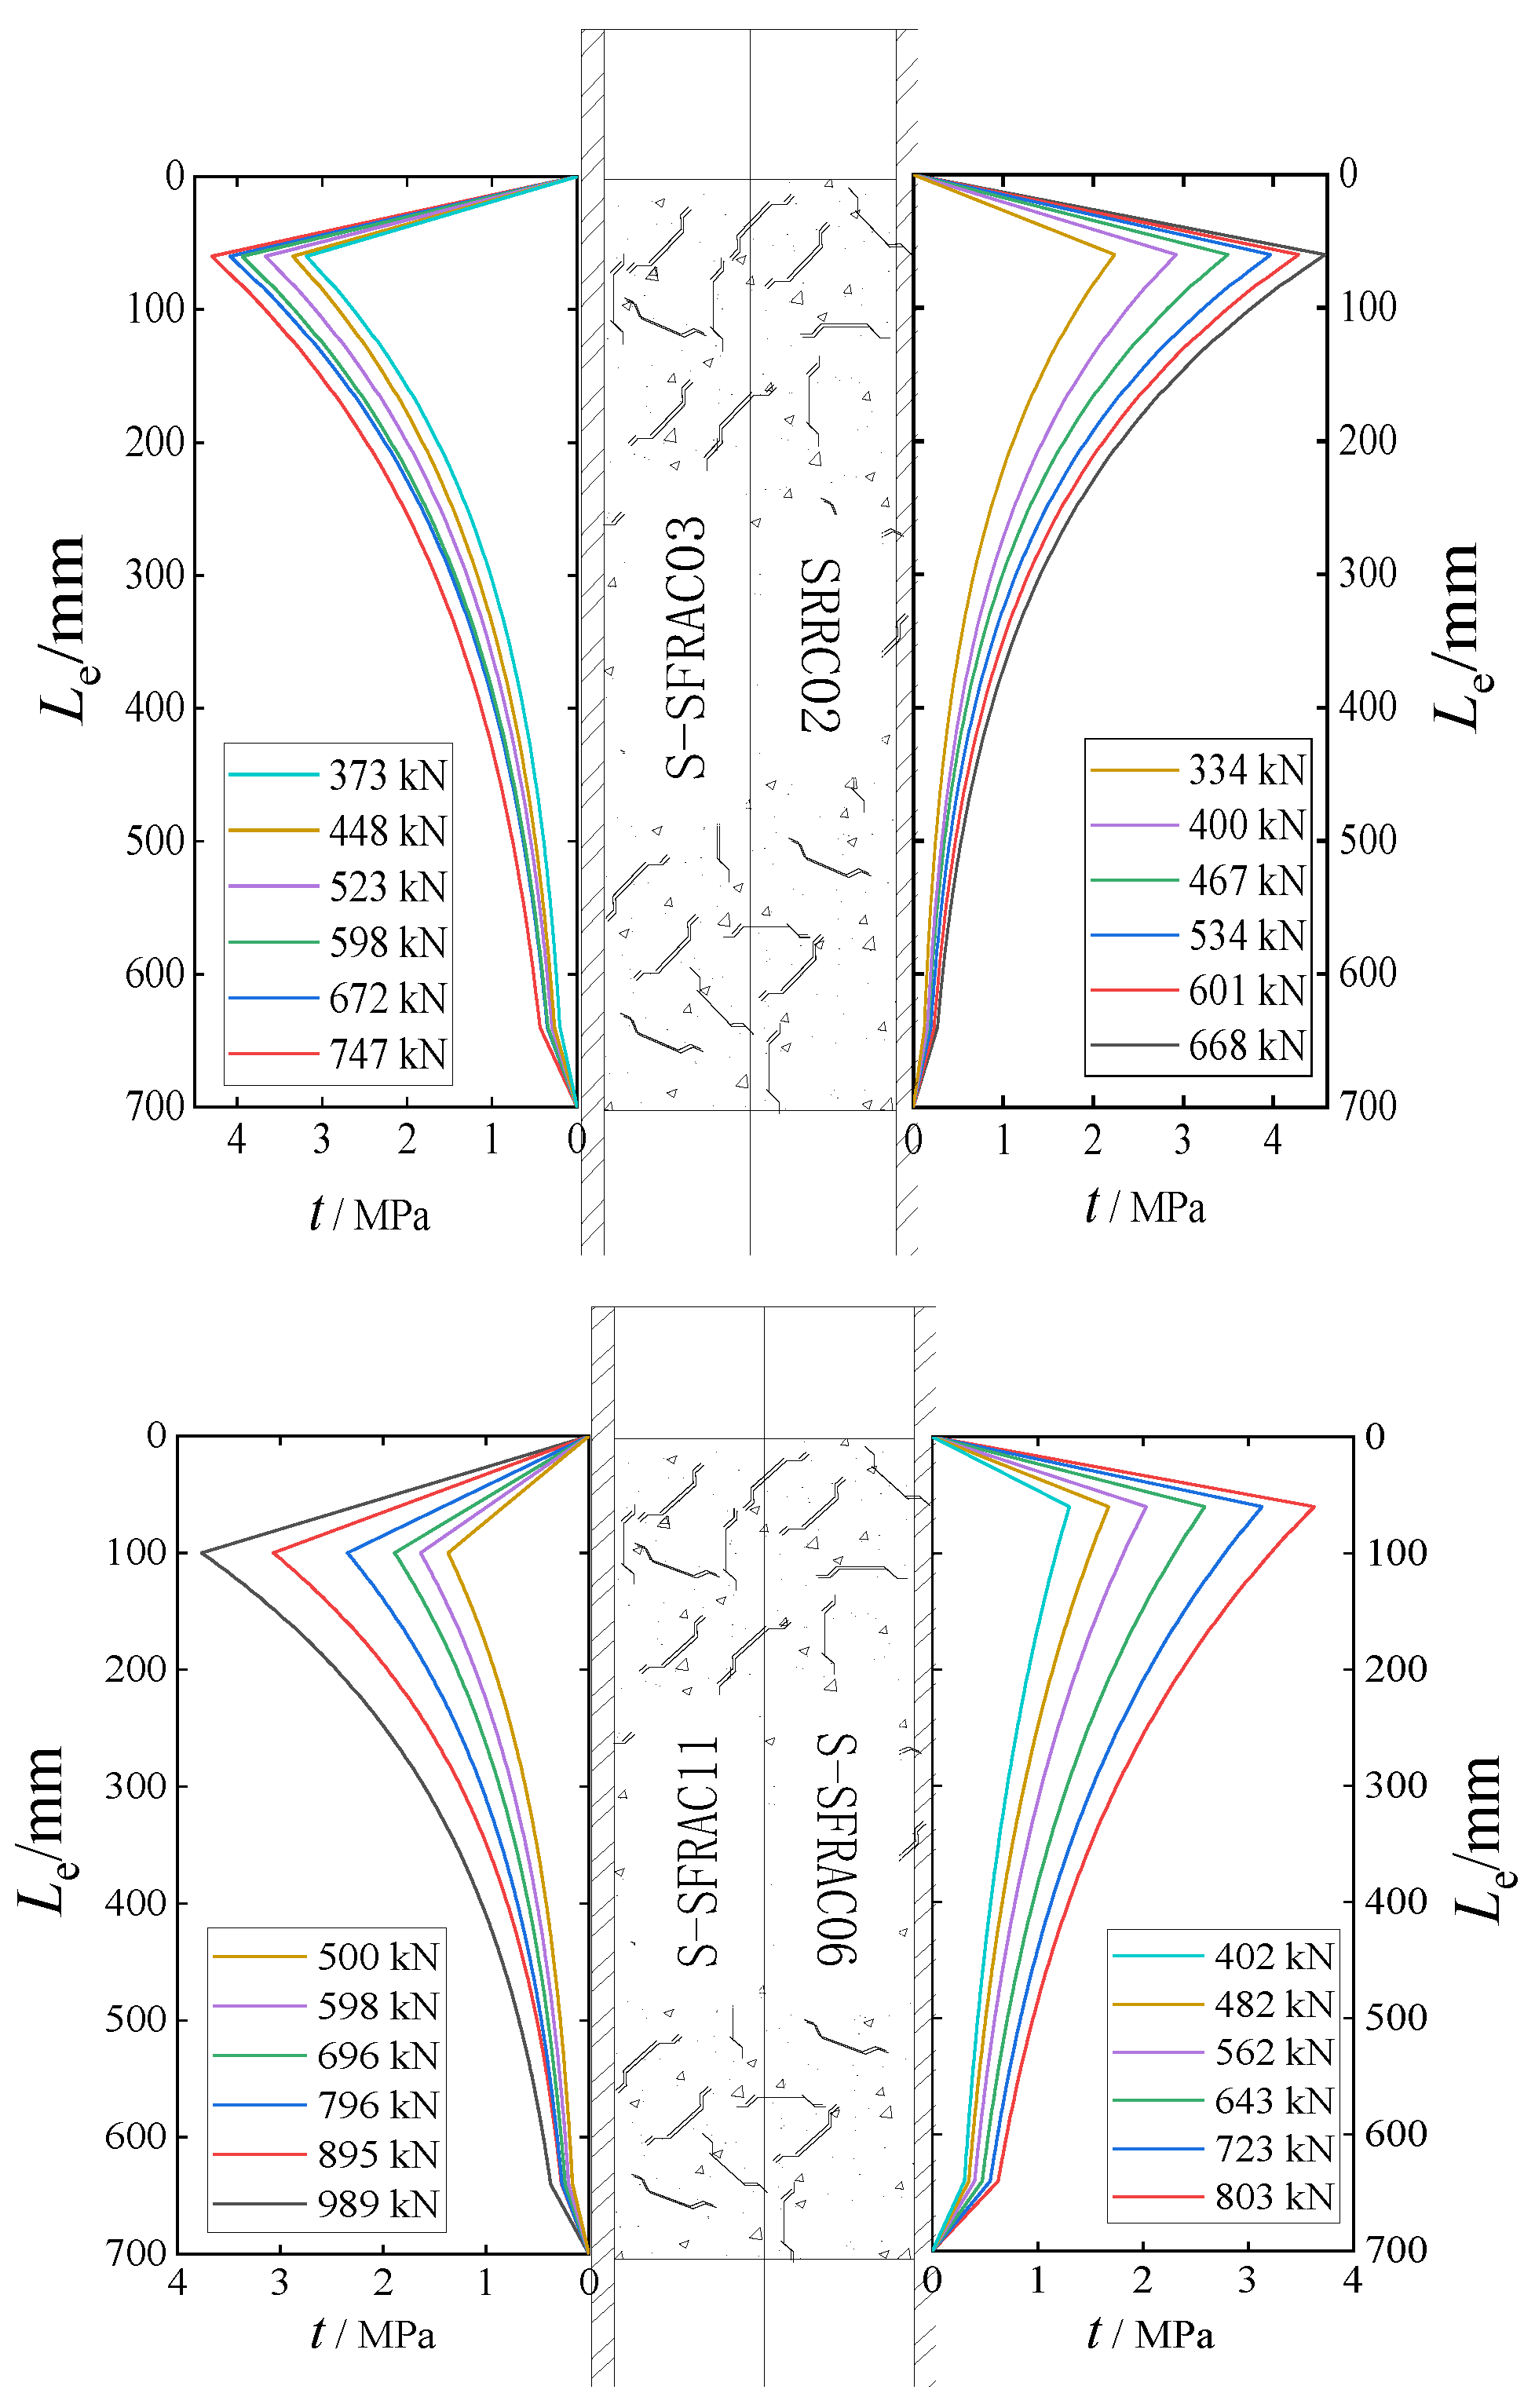
3.2. Distributions of Strain and Bond Stress in the Steel Sections

Figure 11 shows the strain distributions in the flanges of the four specimens, indicating that the strain distributions at the flanges of the sections under increasing load were consistent with the changes in load, where the strain reached its maximum near the loading end of the section, and gradually decreased from there to the free end, while the slope of the strain distribution curve decreased gradually. The strain distributions of the section steel flanges in the loading drop section changed in an oblique straight line.
According to the variations in the steel flange strain curves in the loading rising section, the negative exponential function could be used to fit the strain distributions of each specimen steel flange under the various loading values, and the fitting equation was as follows:
ε ( x ) = γ ε max e k 1 x ,
where ε(x) is the strain value at any point along the embedded length of the section steel, γ is the strain correction coefficient, εmax is the local maximum strain value at the loading end of the specimen, and k1 is the characteristic value of the strain index of the section steel in the load increase section, which could be obtained by fitting the strain distribution curve of the section steel.
According to mechanical theory, the bonding stress on the surface of the section steel could be deduced by
τ ( x ) = A s u d σ x d x = A s u E s d ε x d x ,
where Es is the elastic modulus of the steel, x and dεx denote the increase in stress and strain on the cross-section of the section along the embedded length range, respectively, and σx, As, and u denote the average stress, cross-sectional area, and perimeter of the contact part between the cross-section and concrete, respectively.
For the load increase stage, the strain distribution of the section steel flange under the various loading values in Figure 11a was fitted with Equation (1), and then substituted into Equation (2) to obtain the bond stress distribution of the section steel flange for each specimen; the results are shown in Figure 12. As shown in the figure, the distribution of bond stresses at the flanges of the four specimens was similar to the strain, in which the peak bond stress values were 4.57 MPa (SRRC02) and 3.63 MPa (S-Sfrac06). Although the peak value of SRRC02 was large, the bond stress curve decreased more rapidly, and the distribution of bond stress was more uneven along the embedded length of the section steel. For the load decrease stage, because the strain distribution of the section steel flange was basically linear, the bond stress obtained by linear fitting had a certain value inserted into Equation (2); thus, the bond stress was evenly distributed along the section steel flange.

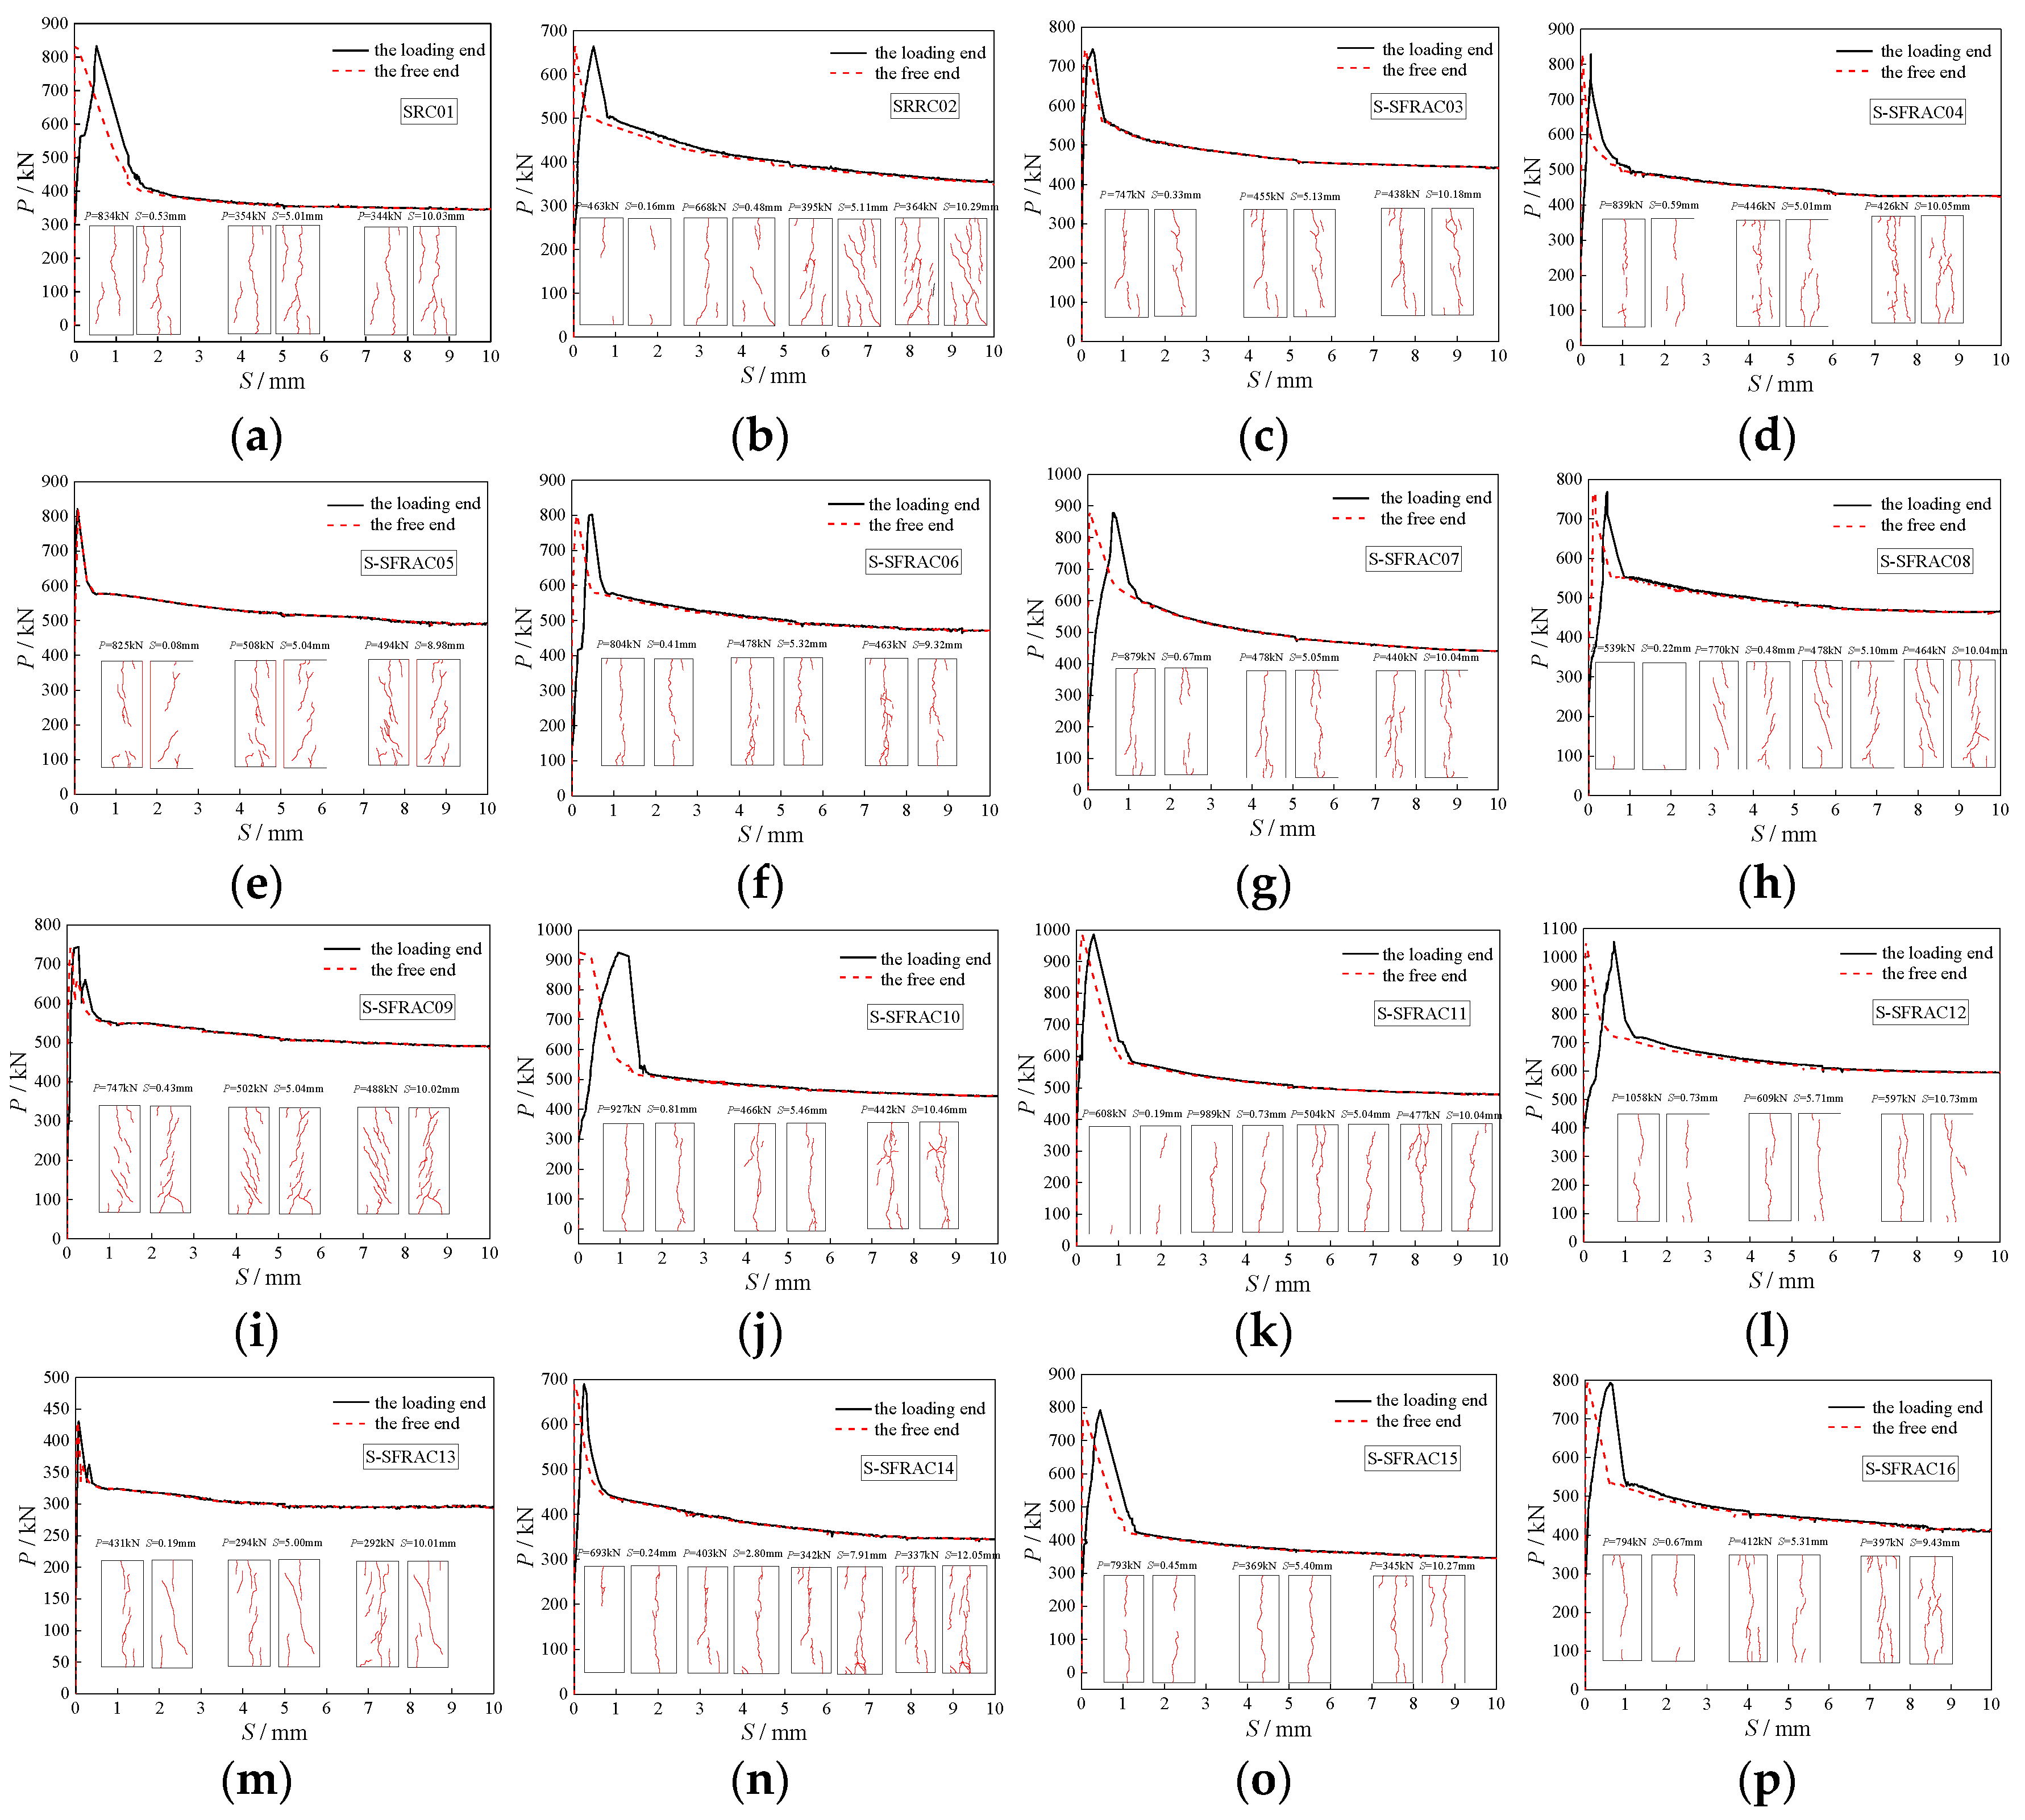
3.3. Load–Slip Curves of the Specimens

Figure 13 shows the P-S curves for the load value and slip of the loading and free ends of each specimen, depicting the development of side cracks in the specimens at different loading times. We found that the variation rules of all curves were basically the same, and the load–slip curves of loading and free ends could be divided into ascending, descending, and smoothing stages. Relative slip was observed at the loading end before it occurred at the free end. For the loading end, the load value at initial slip was smaller than at the smoothing stage, and the increasing stage of the load–slip curve for the free end was very short. When the ultimate load was reached, a slip difference ΔS was found between the loading end and the free end. Both the loading and free ends of the descending stage of the curve showed a stage of rapid load decline, and the decline rate gradually slowed down, while the slip difference ΔS between them gradually decreased. After a certain amount of time in the smooth stage of the curve, the two basically slipped synchronously, and ΔS was constant. For specimens S-SFRAC09 and S-SFRAC13, large overall slip occurred again after the load increased during the descending stage.

4. Comparative Analysis of the Push-out Test Results

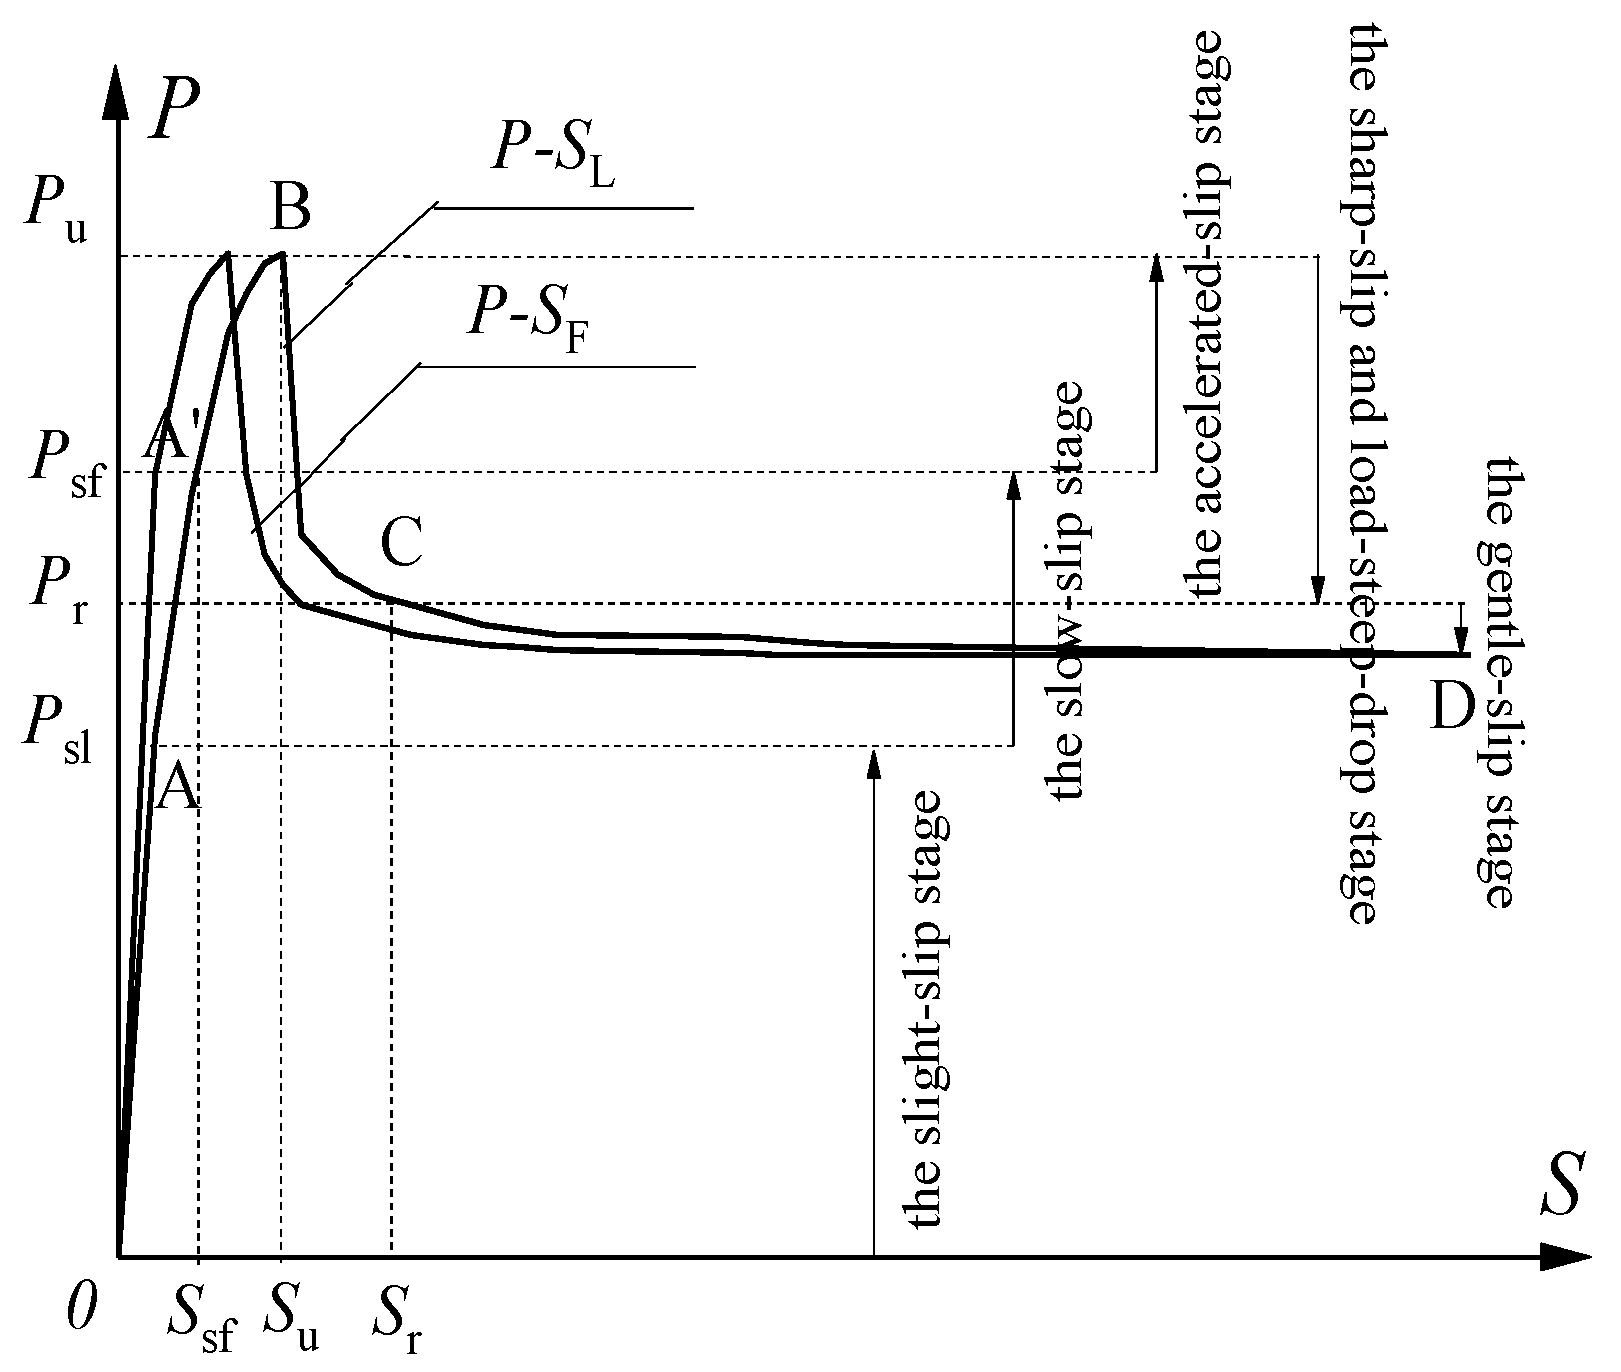
4.1. Load–Slip Curve Analysis

According to the characteristics of the load–slip curves at the loading and free ends, the entire process of bond slip could be divided into five slip stages, namely, the slight-slip stage, slow-slip stage, accelerated-slip stage, steep-slip and load-drop stage, and gentle-slip stage. The four characteristic loads were defined as the initial slip load at the loading end, initial slip load at the free end, ultimate load, and residual load, as described by the model shown in Figure 14.
(1)
For the slight-slip stage (OA section), during the initial stage of loading, the load was very small, and elastic deformation of the loading end, free-end steel, and steel fiber recycled concrete was not compatible, resulting in minimal relative slip. At this stage, the chemical cementing force of the contact interface between the steel and steel fiber recycled concrete at the loading end gradually increased until the displacement meter at the loading end showed a non-zero reading (0.01 mm), and the load at this time was defined as the initial sliding load Psl at the loading end.
(2)
For the slow-slip stage (AA’ section), when the initial slip occurred at the loading end, within a certain load range, the slip increment of the loading end was the same as the load. The added value was almost proportional, indicating the performance of slow infiltration and the accumulation of bonding. When the load increased to initial slip at the free end, the load could be defined as the initial slip load Psf at the free end.
(3)
For the accelerated-slip stage (A’B section), when the load reached the initial slip load of the free end, most of the chemical bonding force within the embedded length of the section steel was lost, and the ends and sides of the specimen contained tiny cracks. Then, as the load increased, the crack width increased, and the constraint effect of the steel fiber recycled concrete on the steel was weakened, and the slip of the loading end was accelerated until the load reached the ultimate load Pu. During this process, although the frictional resistance and mechanical bite force increased, the increase rate was less than the decrease rate of the chemical bonding force, and the load–slip curve presented an obvious convex shape.
(4)
For the sharp-slip and load-steep-drop stage (BC section), the chemical cementing force that provided bonding failed as a whole, resulting in reduced bonding, the load dropped rapidly, and the loading and free ends slipped sharply. Afterward, the friction resistance and mechanical bite force of the contact interface were mainly provided by the bonding effect. The cracking of the steel fiber recycled concrete continued to be affected by the bonding effect, and cracks developed slowly. When slip developed to a certain extent, the steel fiber recycled concrete surface layer that was in contact with the section steel formed a stable failure mode due to sliding wear. At this time, the mechanical bite force quitted, and the load at this time was defined as the residual load Pr.
(5)
For the gentle-slip stage (CD section), when the load reached the residual load Pr, the load was essentially stable, and the loading and free ends slipped synchronously. Then, cracks in the steel fiber recycled concrete slowly developed, and bonding between the steel and steel fiber recycled concrete interface was only provided by friction resistance, with a stable development stage of bond slip.

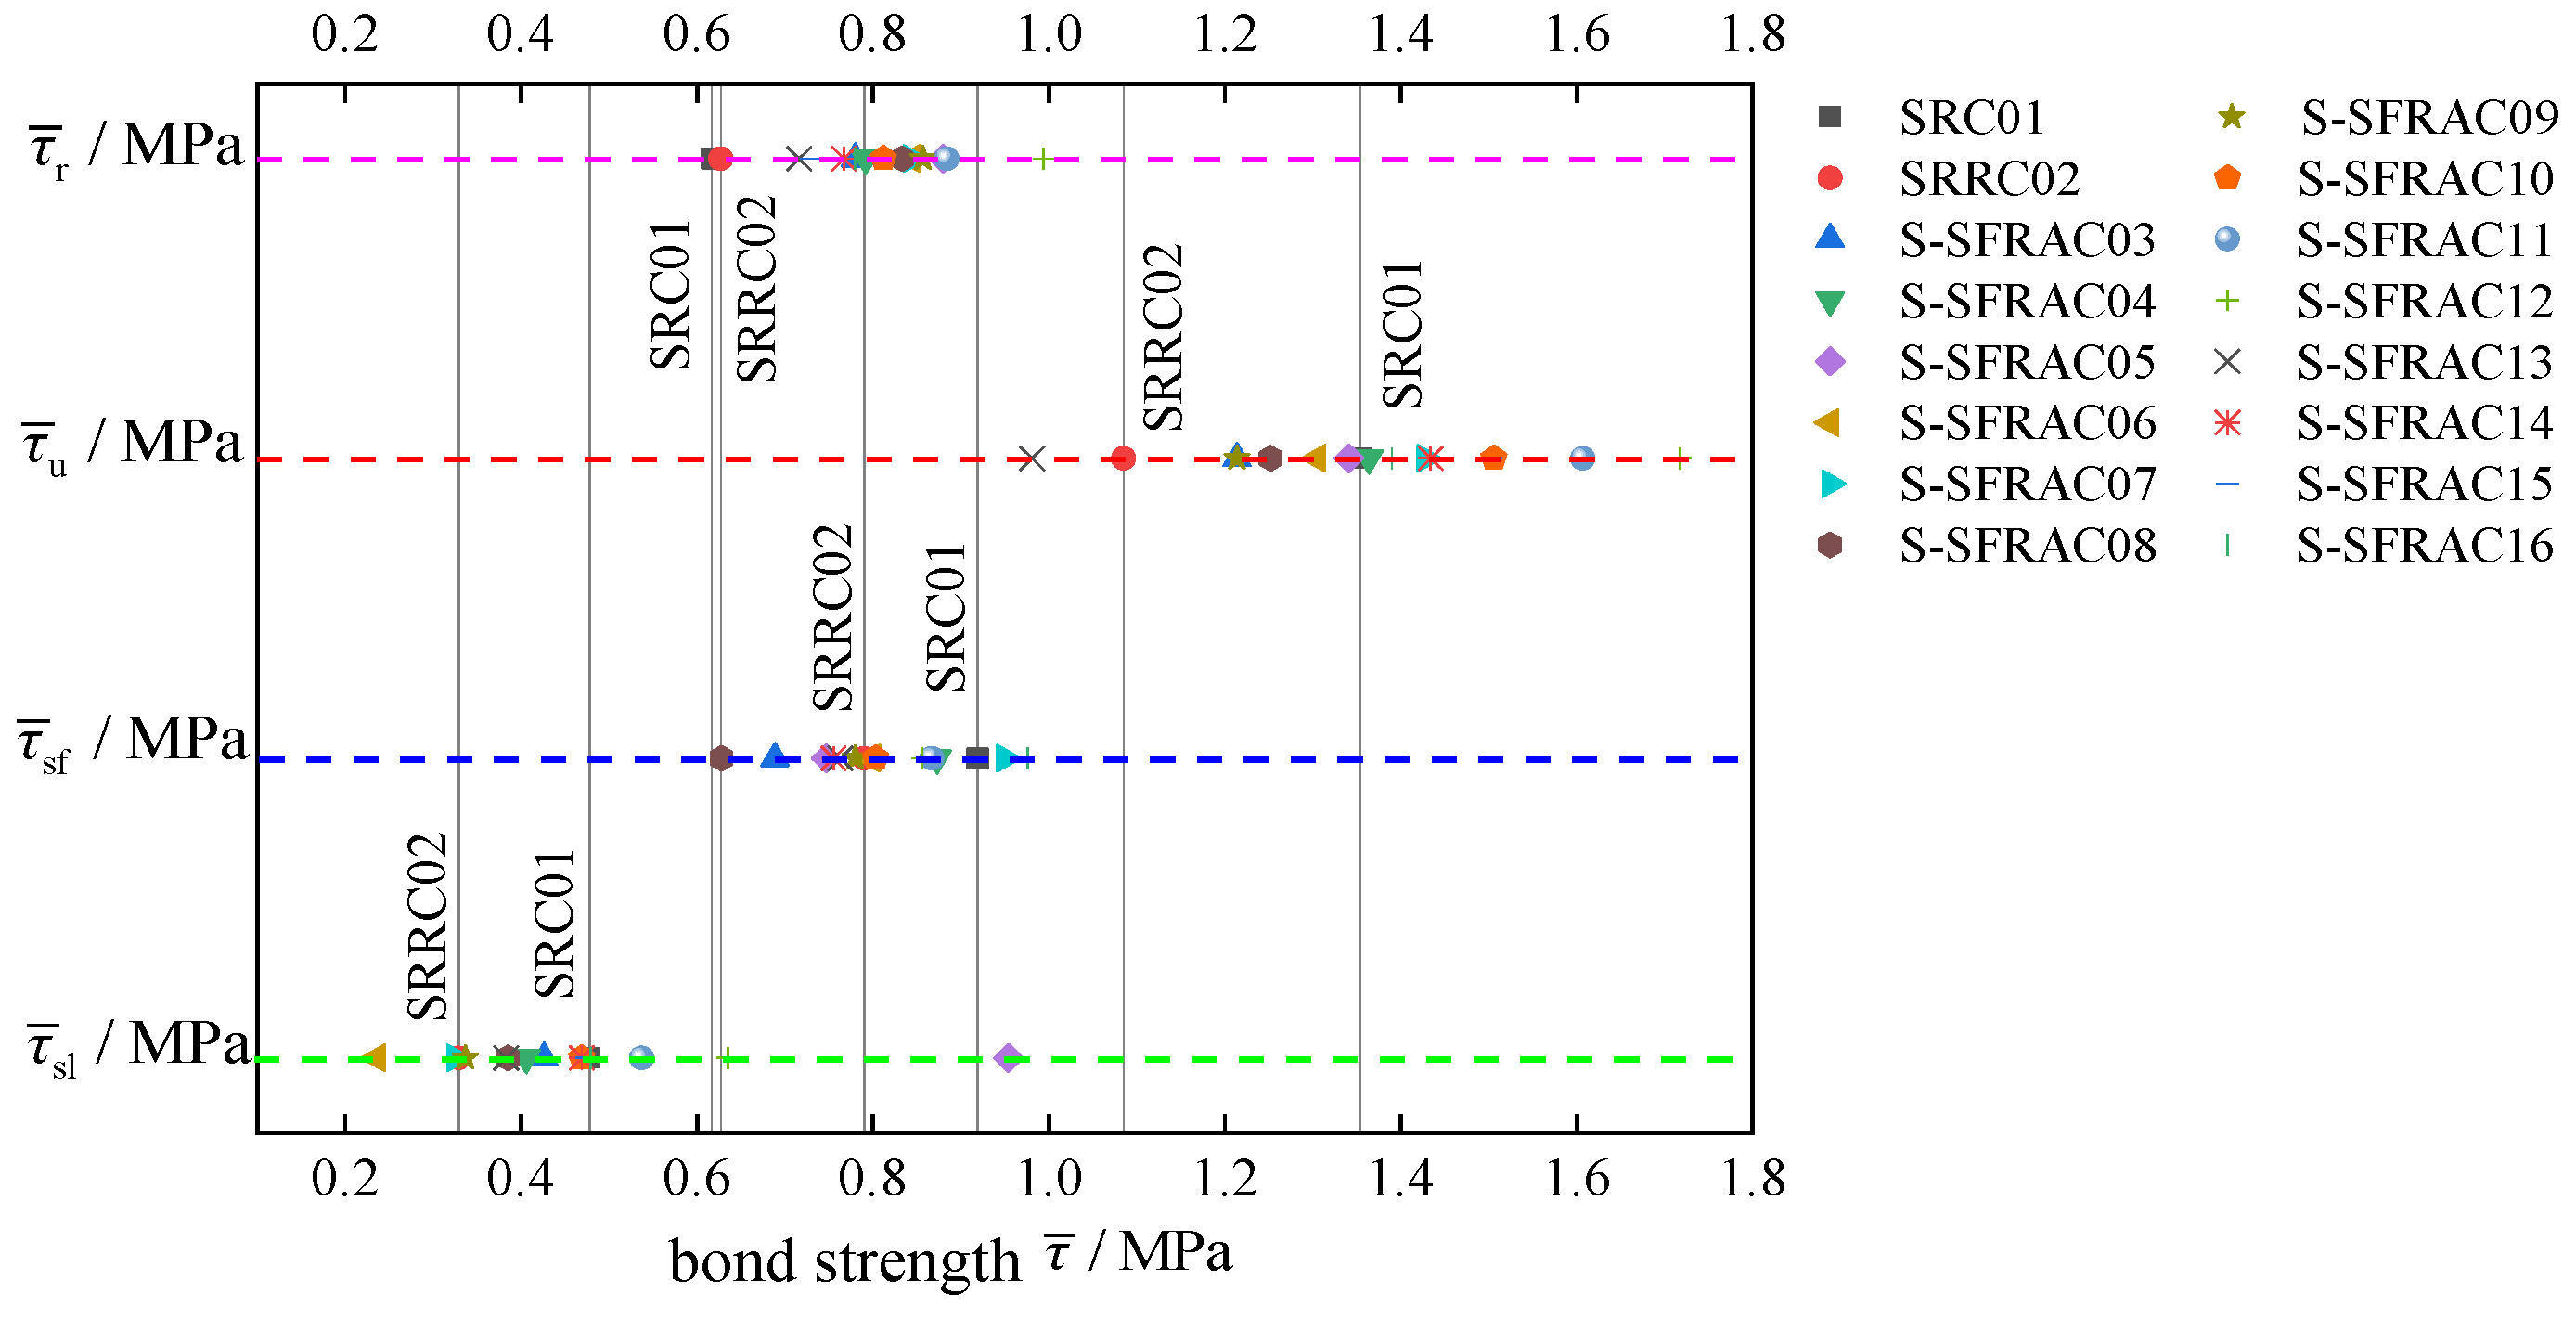
4.2. Definition of Characteristic Bond Strength

The average bond stress could be defined as the average value of the load on the contact interface area of the steel–steel fiber recycled concrete, namely,
τ ¯ = P C L e ,
where τ ¯ is the average bonding stress, P is the load value, Le is the embedded length of the steel section, and C is the perimeter of the steel section.
In addition, the average bonding stress corresponding to load P could be defined as the bonding strength of the steel–steel fiber recycled concrete; thus, the characteristic bonding strengths of Psl, Psf, Pu, and Pr could be obtained, including the loading end initial bond strength τ ¯ s l , free end slip sliding bond strength τ ¯ s f , ultimate bond strength τ ¯ u , and residual strength τ ¯ r . The test results of characteristic load and corresponding characteristic bond strength are shown in Table 6.
Figure 15 shows the distribution of characteristic bond strengths of each specimen. According to the figure, the ultimate bond strength and residual bond strength of each specimen (except specimen S-Sfrac13) were all greater than the SRRC02 specimen after steel fibers were added to the recycled steel concrete. This showed that the ultimate bond strength and residual bond strength of the steel fibers obviously increased. However, the effects of steel fibers on the initial slip bond strength were difficult to observe and thus call for further discussion. Meanwhile, as shown by the distribution of the ultimate bond strength and residual bond strength, the ultimate bond strength of certain specimens and the residual bond strengths of all specimens exceeded SRC01, indicating that the bond strength of the interface between the steel and steel fiber recycled concrete could reach the bond strength of ordinary steel concrete.

4.3. Analysis of the Influencing Factors of Bond Strength

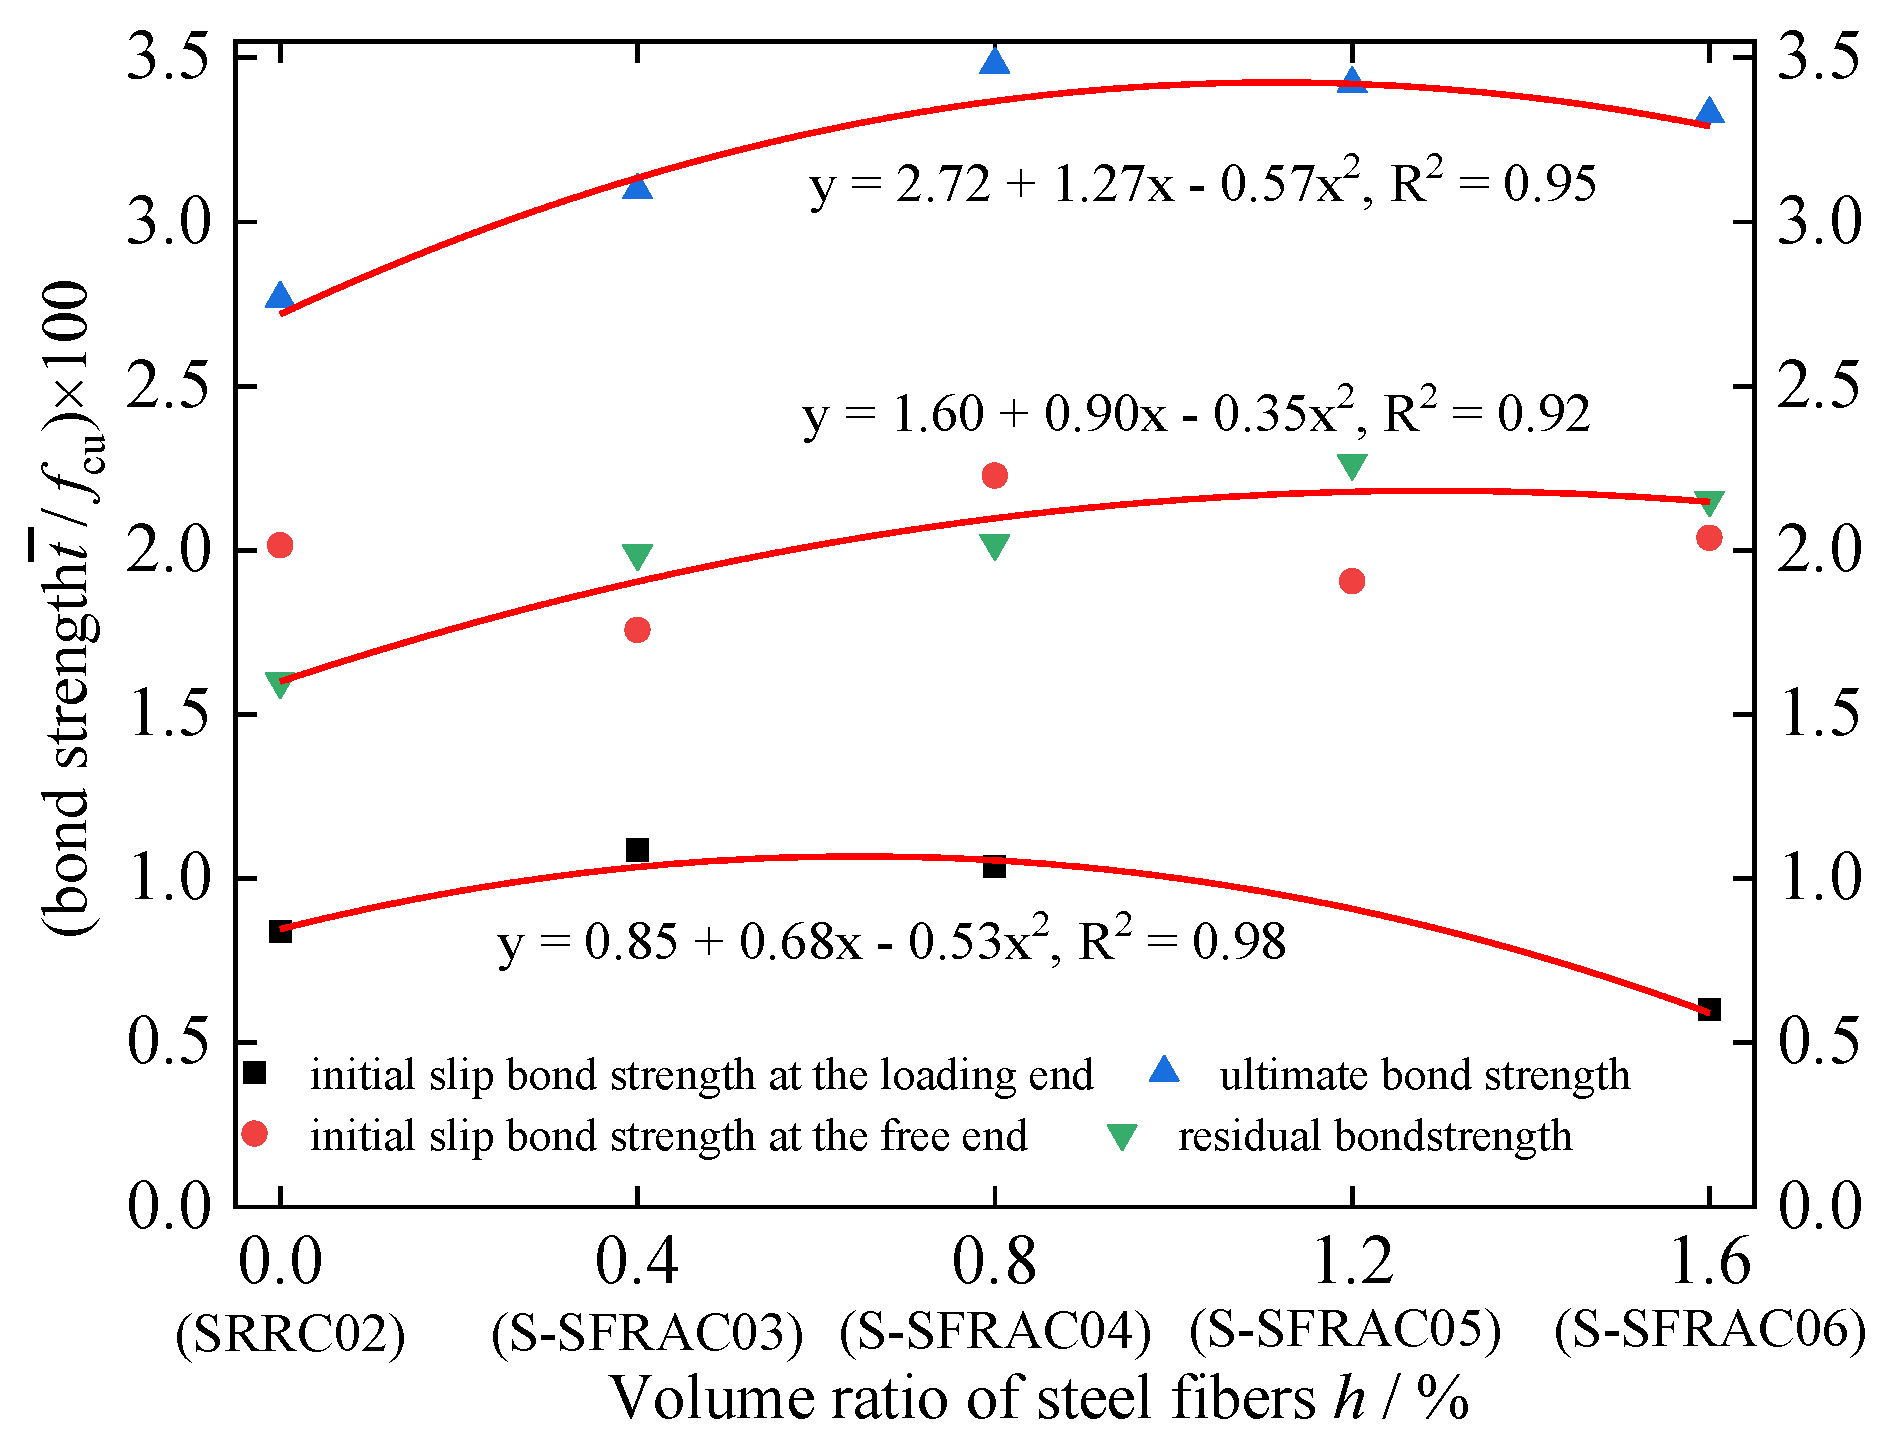
4.3.1. Volume Ratio of Steel Fibers

As shown in Figure 16, with increasing volume ratio of steel fiber, the initial slip bond strength, ultimate bond strength, and residual bond strength at the loading end increased first and then decreased, while the initial slip bonds in the recycled concrete matrix played a bridging role among the various components. These could effectively hinder the expansion of microcracks in the recycled concrete and delay the formation of macrocracks, playing a role in strengthening the recycled concrete, as well as cracking resistance and toughening. However, when the volume ratio of the steel fibers was too large, full contact between the cement mortar and aggregate was blocked; thus, the binding force between the two was reduced, and the strengthening effect of the steel fibers was reduced. According to the experimental results, the enhancement effect of the steel fibers was better in the range of 0.8–1.2% volume ratio.

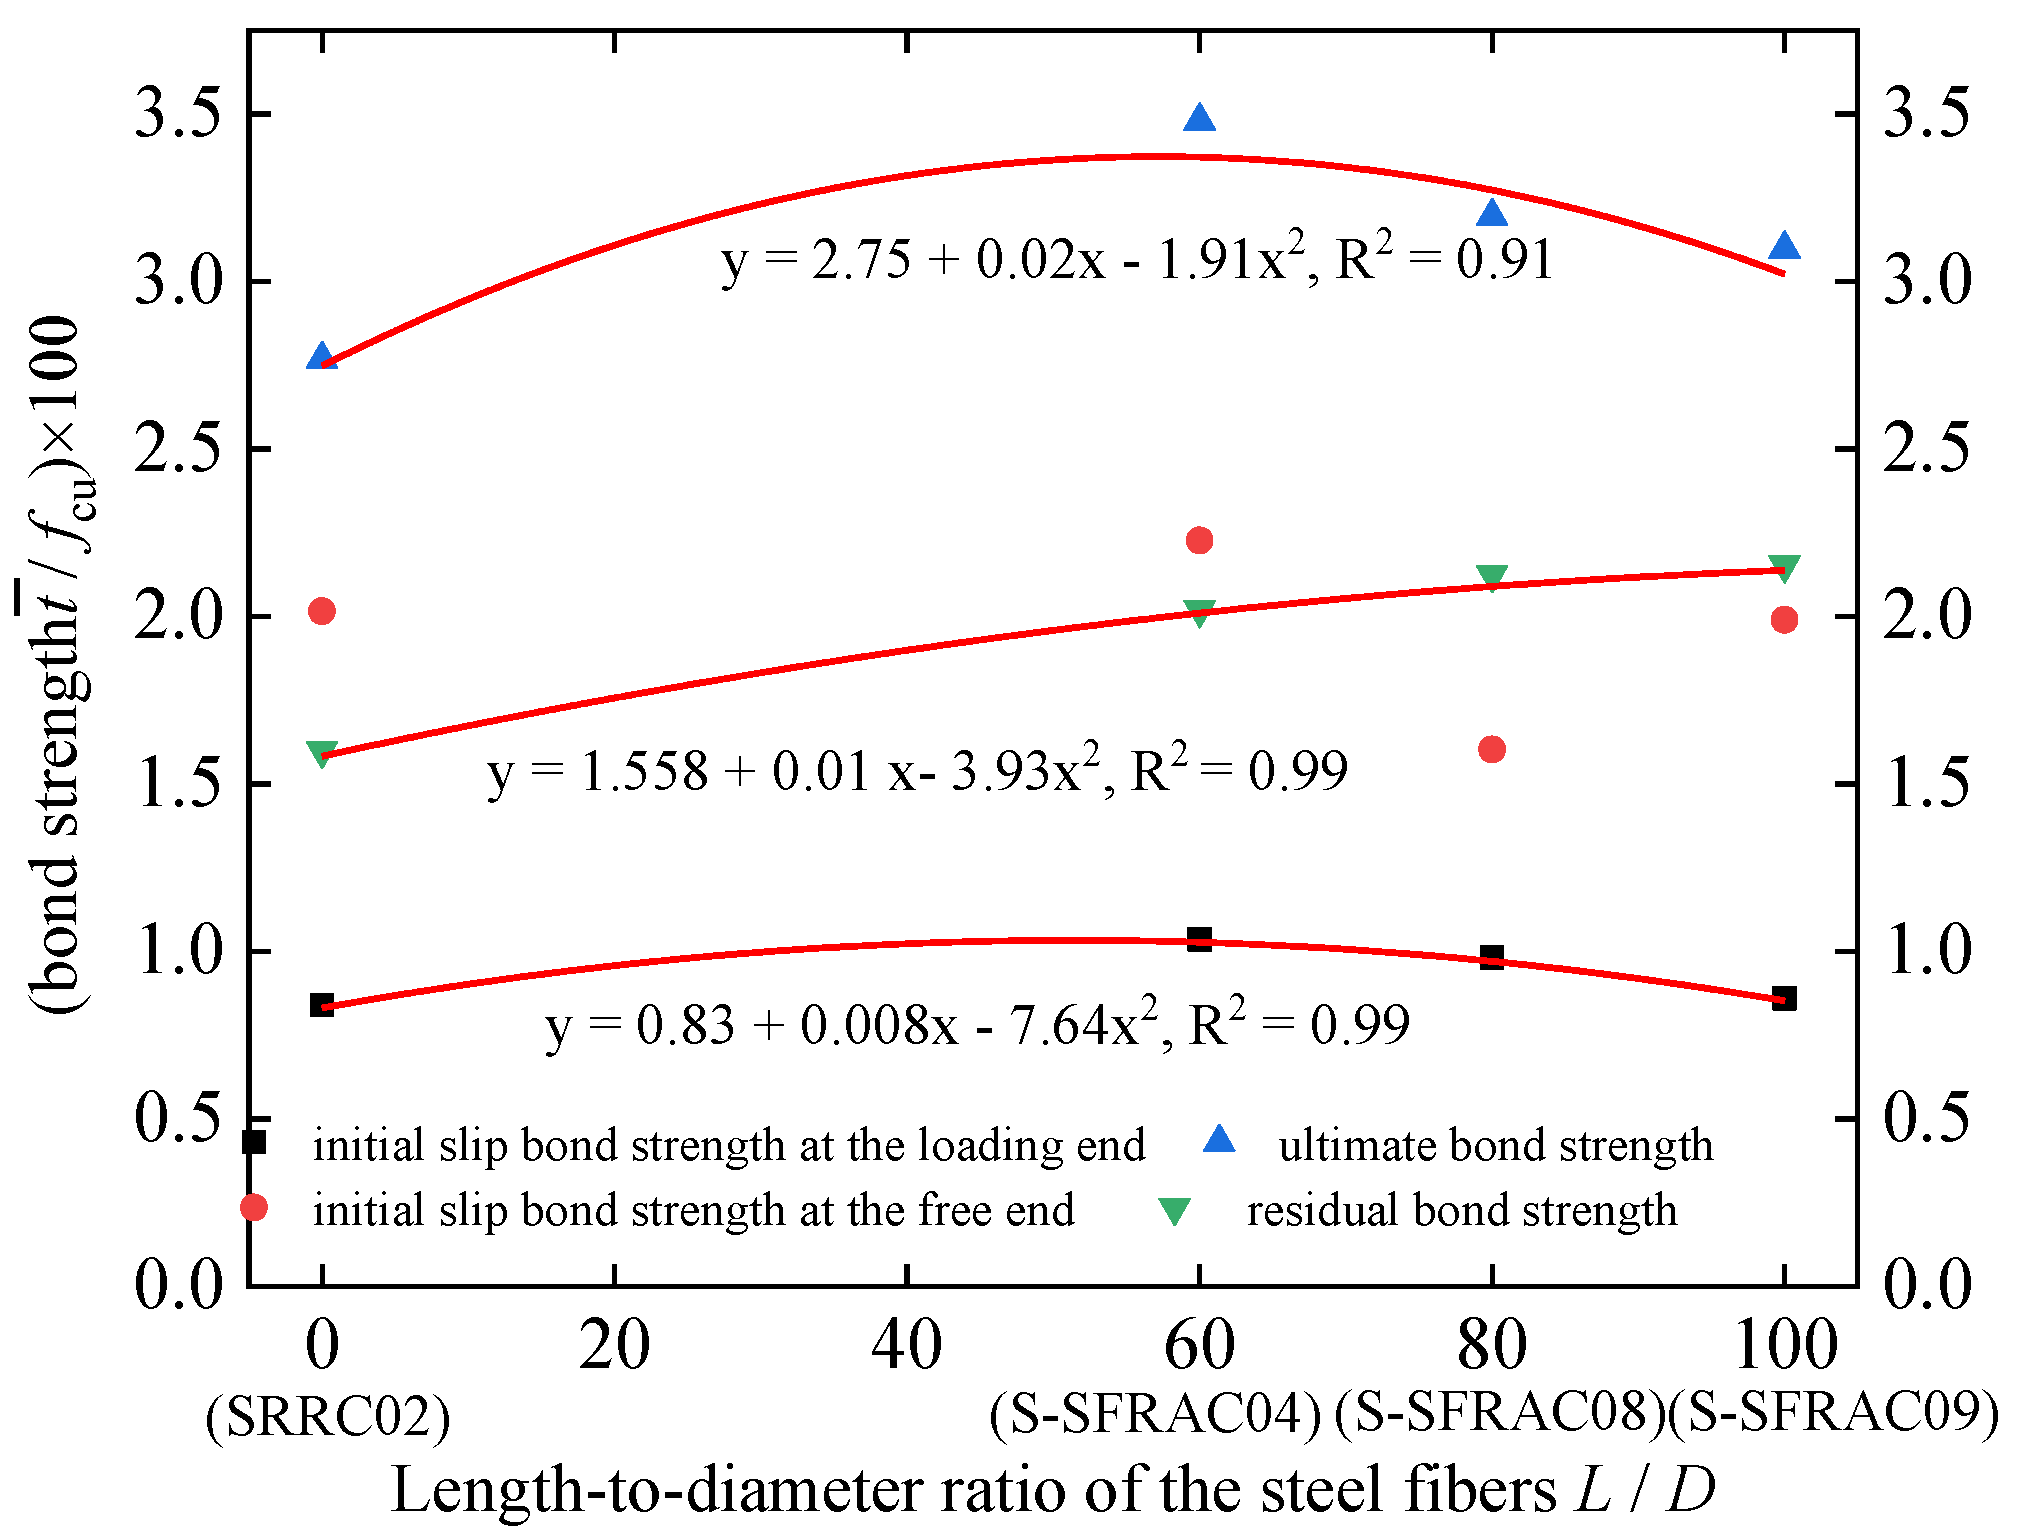
4.3.2. Length-to-Diameter Ratio of the Steel Fibers

As shown in Figure 17, when the aspect ratio of the steel fibers increased, the initial slip bond strength and ultimate bond strength at the loading ends both increased first and then decreased, while the residual bond strength increased slightly, and the initial slip bond strength at the free ends did not change significantly. With fine cracks in the recycled concrete, the steel fibers on both sides of the cracks were pulled out. Due to the bonds between the steel fibers and recycled concrete matrix, the development of cracks and damage to the recycled concrete was delayed, and the bond performance of the steel and recycled concrete was enhanced. When the length-to-diameter ratio of the steel fiber was large, the long steel fibers affected the uniform mixing of the recycled concrete, or the steel fibers were bent during mixing. Thus, the strengthening effect of the steel fibers did not occur, and the bond strength of the section steel–steel fiber recycled concrete was reduced.

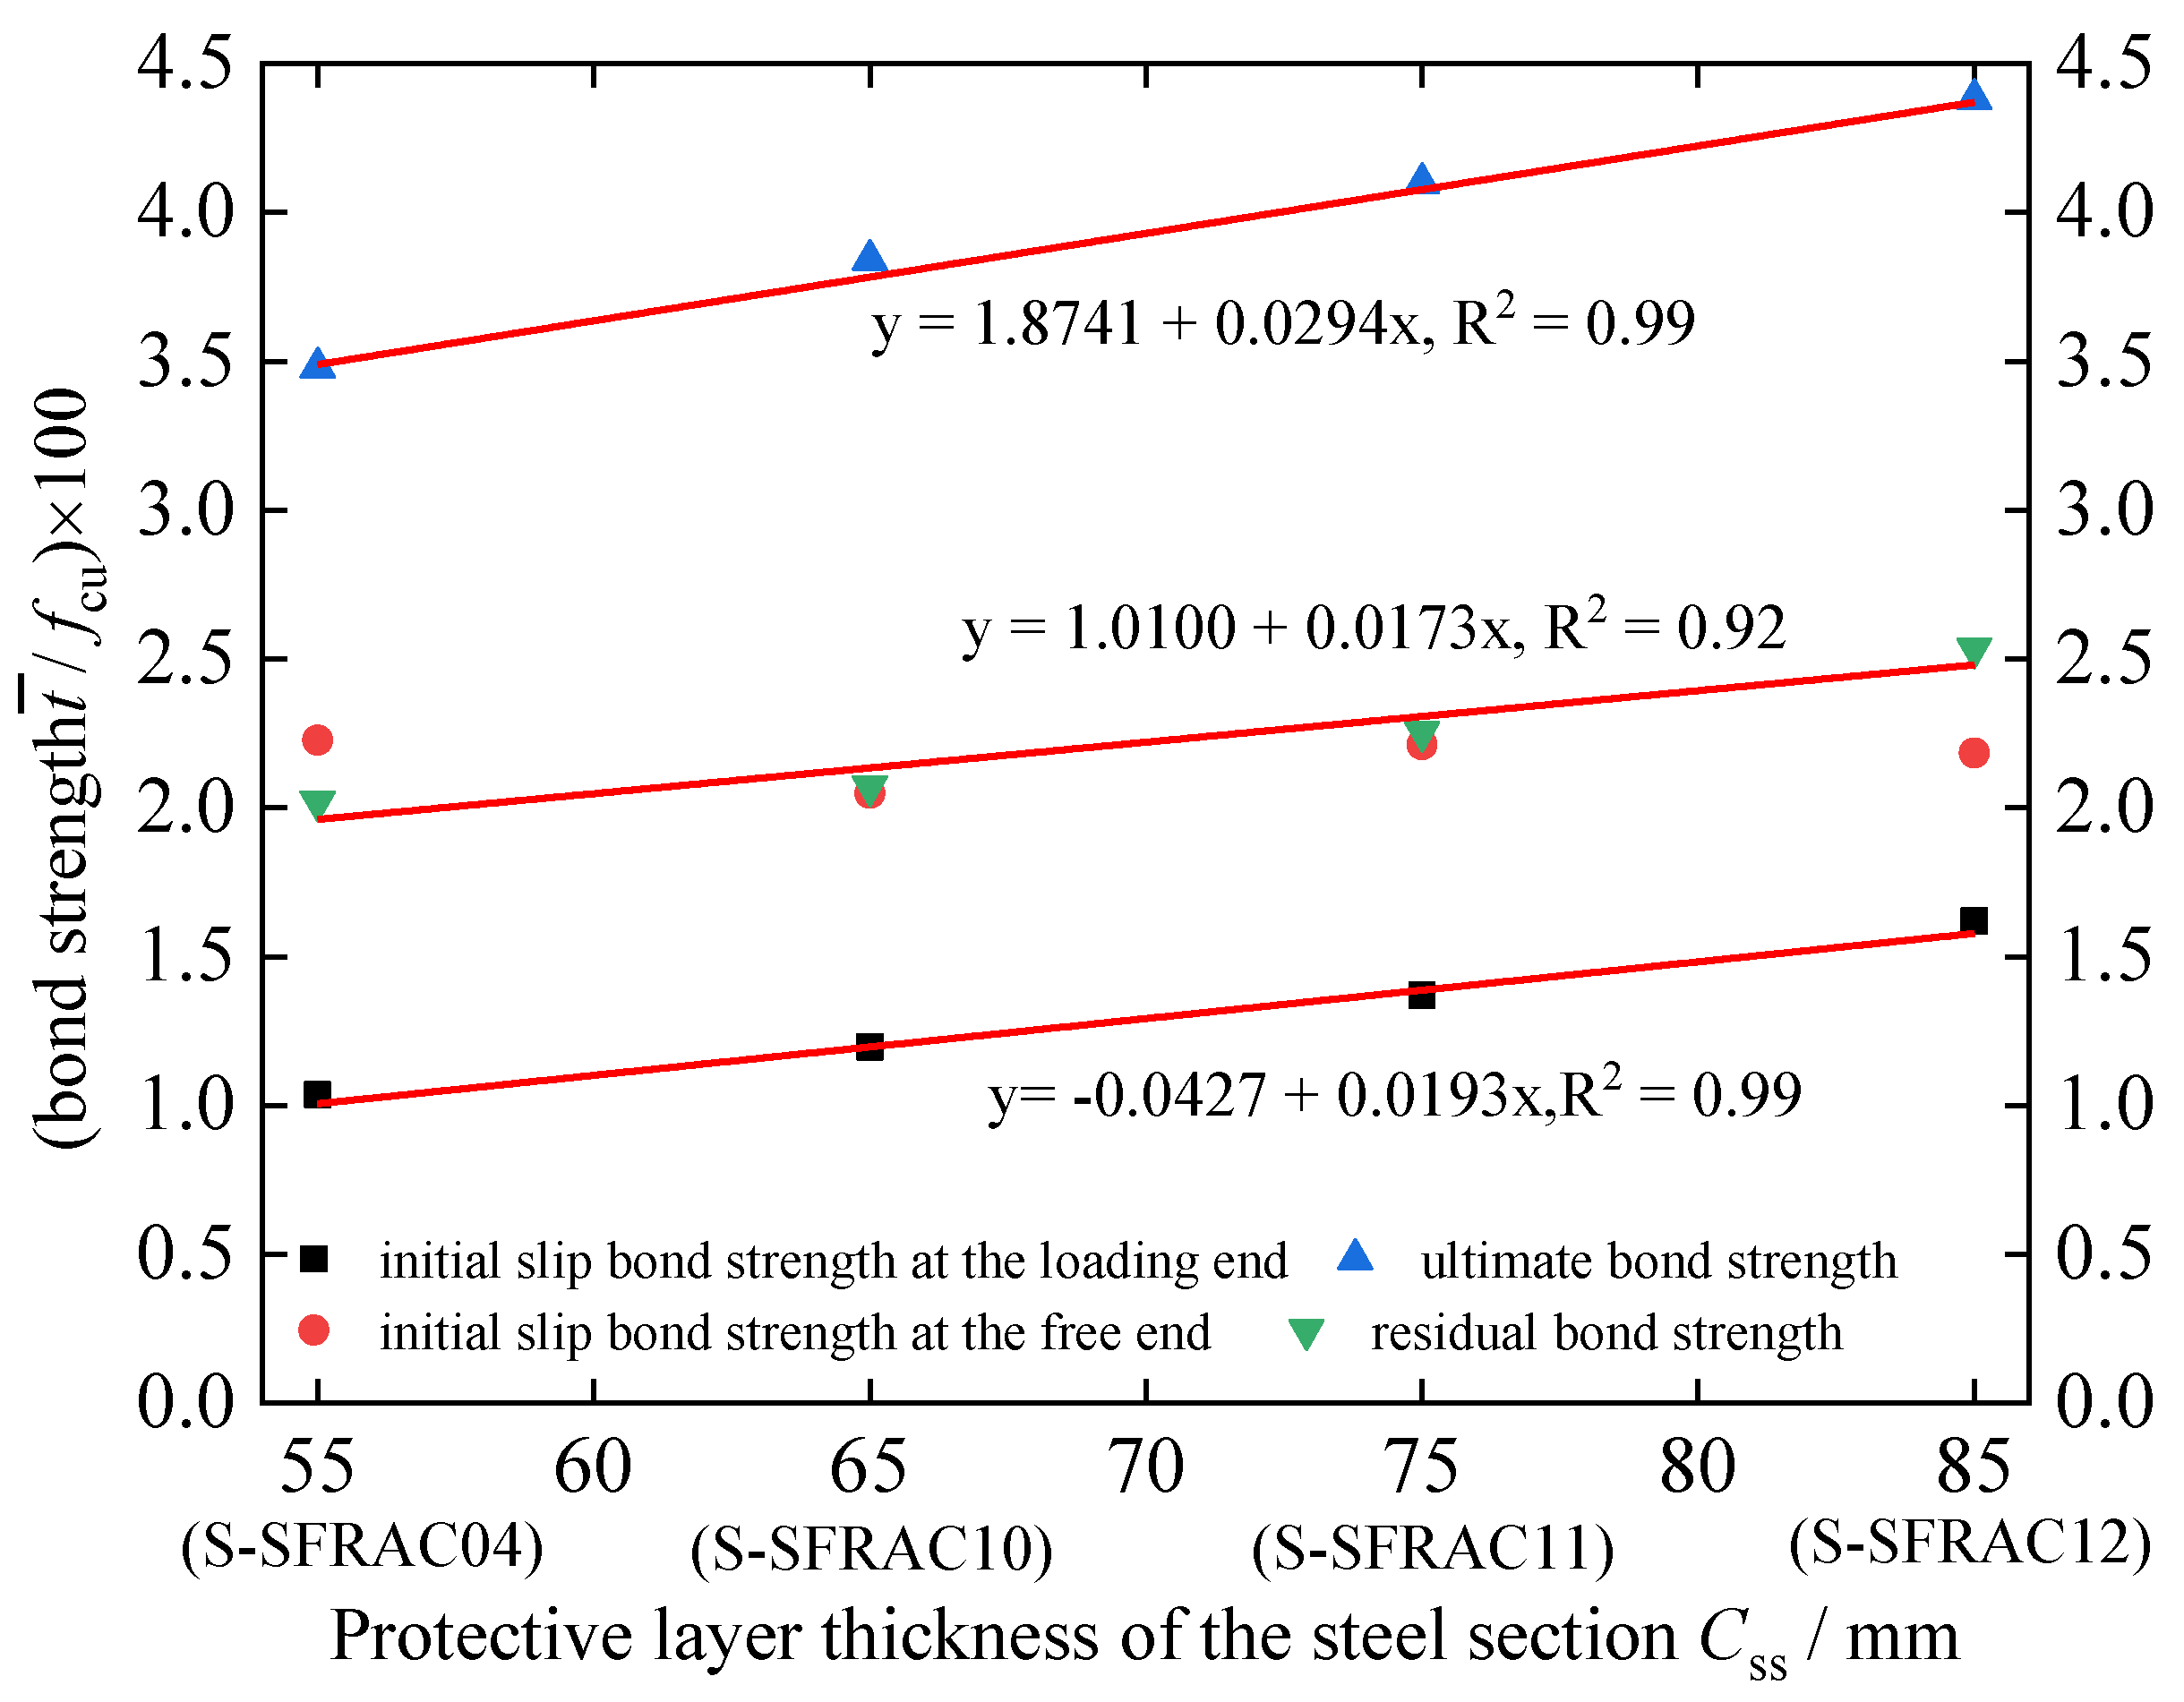
4.3.3. Protective Layer Thickness of the Steel Section

The influence of the thickness of the protective layer on the bond properties of the steel was assessed, as the steel fiber recycled concrete was mainly realized through the restraint of the protective layer on the transverse deformation of the steel. As shown in Figure 18, within a thickness range of the steel section protective layer set in this test, the greater the thickness of the protective layer, the stronger the constraint effect on the steel section. The initial slip bond strength, ultimate bond strength, and residual bond strength at the loading end of the specimen were all larger and showed a linear increase, while the initial slip bond strength of the free end did not change significantly.

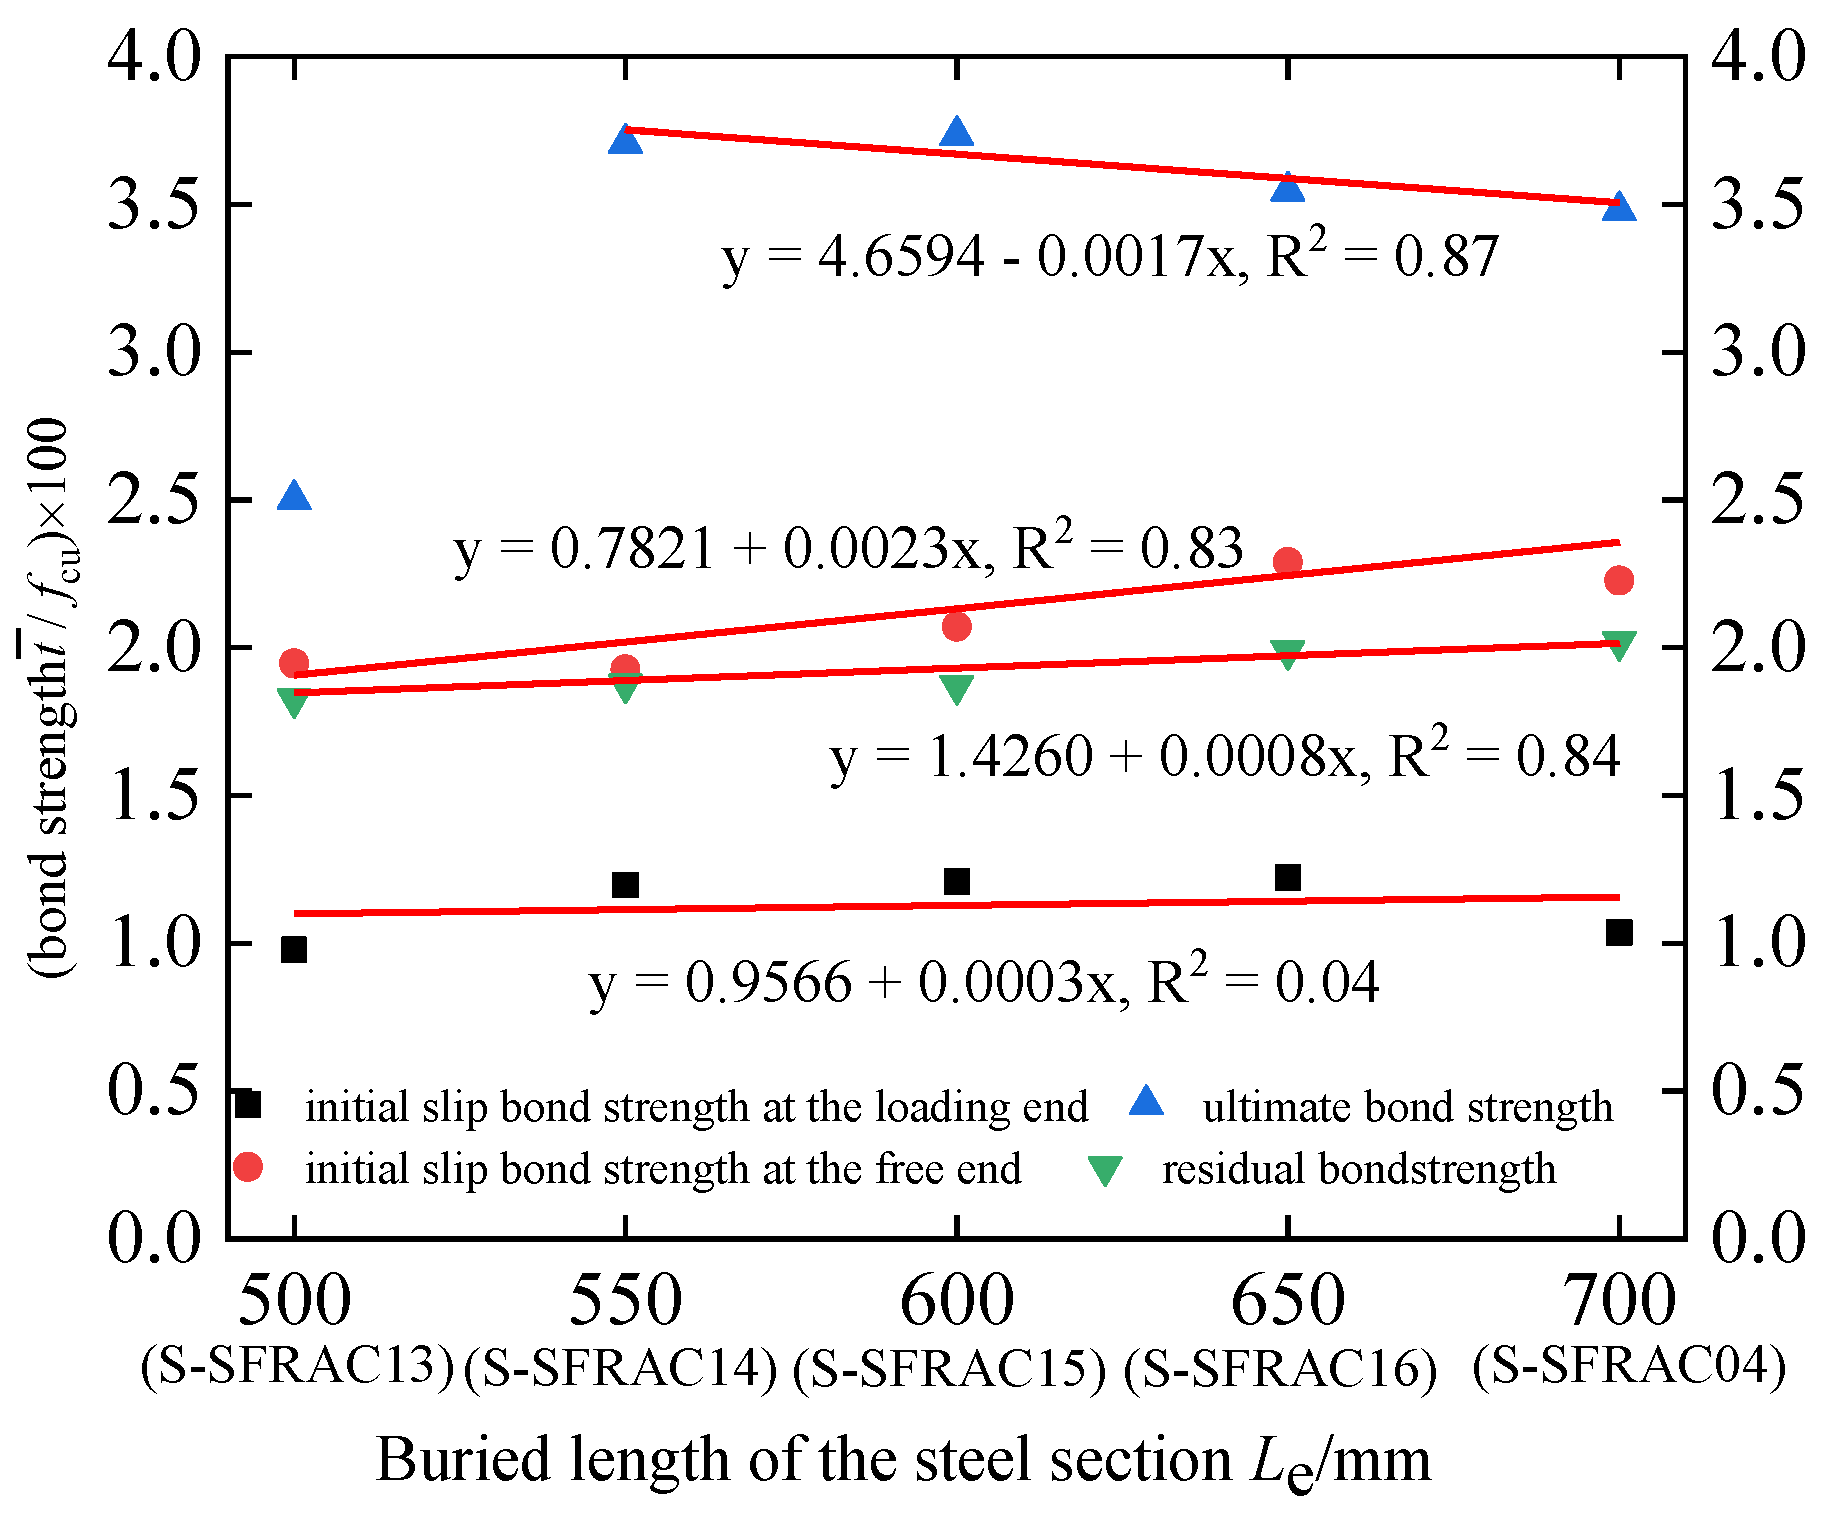
4.3.4. Embedment Length of the Steel Section

As shown in Figure 19, the ultimate bond strength between the steel and steel fiber recycled concrete interface decreased with increasing embedded length of the steel, while the residual bond strength increased slightly. The initial slip bond strength of the free end tended to increase, while the increase or decrease effects of the initial slip bond strength of the loading end were not obvious. Thus, the larger the embedded length of the steel, the larger the bond area of the steel–steel fiber recycled concrete, and the corresponding bond force was also larger. However, the stress distribution on the bond interface was less uniform, the high-stress zone was shorter, the low-stress zone was longer, and the ultimate bond strength showed a decreasing trend. In the residual stage, bonding between the steel and steel fiber recycled concrete was distributed evenly along the contact interface; thus, the bond strength was minimally affected by the embedded length of the steel.

4.4. Calculation Equation for the Characteristic Bond Strength

According to the effects of the above factors on the initial slip bond strength τ ¯ s l at the loading end, the initial slip bond strength τ ¯ s f at the free end, the ultimate bond strength τ ¯ u , and the residual bond strength τ ¯ r , 14 specimens (excluding SRC01 and S-Sfrac07) were deduced and fitted to establish the characteristic bond strength calculation equation. The test and calculation results of the characteristic bond strength of each specimen are shown in Table 7. The calculation results showed that the established characteristic bond strength calculation equation were consistent with the changing trends of the test results and the values were similar, meeting the calculation requirements.
(1)
The initial slip bond strength at the loading end was given by
τ ¯ sl = 0.0001 ( 1.3 + 79.4 η 59.7 η 2 + 0.45 L / D 0.0069 ( L / D ) 2 + 495.2 C ss / d + 48.2 L e / d ) f cu
(2)
The initial slip bond strength of the free end was given by
τ ¯ sf = 0.0001 ( 151.1 + 175.7 η 80.7 η 2 1.9 L / D 0.0079 ( L / D ) 2 + 63.4 C ss / d + 9.5 L e / d ) f cu
(3)
The ultimate bond strength was given by
τ ¯ u = 0.0001 ( 249.7 + 188.1 η 86.4 η 2 0.2 L / D 0.0051 ( L / D ) 2 + 615.3 C ss / d 40.8 L e / d ) f cu
(4)
The residual interface bond strength was given by
τ ¯ r = 0.0001 ( 13.4 + 24.4 η 2.0 η 2 + 0.5 L / D 0.0005 ( L / D ) 2 + 269.2 C ss / d + 19.0 L e / d ) f cu

5. Conclusions

In this study, 14 steel–steel fiber recycled concrete push-out specimens and two contrast push-out specimens were fabricated to study the bond slip performance of the interface between steel–steel fiber recycled concrete, and the following conclusions were drawn.
(1)
The failure cracks of the specimen mainly included bonding cracks and expansion cracks, while the side cracks of the specimens mainly consisted of vertical through-cracks and oblique cracks.
(2)
In the load increase stage, the flange strain was the largest near the loading end of the section, and gradually decreased toward the free end, and the slope of the strain distribution curve gradually decreased.
(3)
The load–slip curve of the specimens could be divided into five slip stages, namely, the slight-slip stage, slow-slip stage, accelerated-slip stage, sharp-slip and load-drop stage, and gentle-slip stage.
(4)
Based on the analysis of the influencing factors of bond strength, the optimal volume ratio range of the steel fibers was 0.8–1.2%. The established equation for calculating the characteristic bond strength of the section steel–steel fiber recycled concrete, considering multiple factors, had a good fitting effect.

Author Contributions

R.R. designed and conducted the core experiments and revised the draft of the manuscript. L.F., D.L. and X.X. conducted the experiment. X.L. and Q.L. wrote the draft of the manuscript. All of the authors contributed to the analysis for the results and conclusions and revised the paper. All authors have read and agreed to the published version of the manuscript.

Funding

This research received no external funding.

Institutional Review Board Statement

Not applicable.

Informed Consent Statement

Not applicable.

Data Availability Statement

Not applicable.

Acknowledgments

The authors gratefully acknowledge the support by the National Natural Science Foundation of China (No. 51608435, 51878547 and 52178163), the Science and Technology Project of Yulin City (Grant No. CXY-2020-062), and Special Scientific Research Project of Shaanxi Education Department (No. 21JK0711).

Conflicts of Interest

The authors declare no conflict of interest.

References

  1. Dabiri, H.; Kioumarsi, M.; Kheyroddin, A.; Kandiri, A.; Sartipi, F. Compressive strength of concrete with recycled aggregate; a machine learning-based evaluation. Clean. Mater. 2022, 3, 100044. [Google Scholar] [CrossRef]
  2. Chen, X.F.; Jiao, C.J. Microstructure and physical properties of concrete containing recycled aggregates pre-treated by a nano-silica soaking method. J. Build. Eng. 2022, 51, 104363. [Google Scholar] [CrossRef]
  3. Matar, P.; Barhoun, J. Effects of waterproofing admixture on the compressive strength and permeability of recycled aggregate concrete. J. Build. Eng. 2020, 32, 101521. [Google Scholar] [CrossRef]
  4. Zhang, J. The Characteristics of Mechanical Properties of Recycled Aggregate Concrete and Influencing Factors. Doctor’s degree, Jiaotong University, Beijing, China, 2010. [Google Scholar]
  5. Kim, Y.; Park, W.; Hanif, A. Steam-cured recycled aggregate concrete incorporating moderately high early strength cement: Effect of binder content and curing conditions. SN Appl. Sci. 2019, 1, 445. [Google Scholar] [CrossRef] [Green Version]
  6. Kim, Y.; Hanif, A.; Usman, M. Influence of bonded mortar of recycled concrete aggregates on interfacial characteristics–Porosity assessment based on pore segmentation from backscattered electron image analysis. Constr. Build. Mater. 2019, 212, 149–163. [Google Scholar] [CrossRef]
  7. Kim, Y.; Hanif, A.; Kazmi, S.M.; Munir, M.J.; Park, C. Properties enhancement of recycled aggregate concrete through pretreatment of coarse aggregates–Comparative assessment of assorted techniques. J. Clean. Prod. 2018, 191, 339–349. [Google Scholar] [CrossRef]
  8. Li, L. Experimental Study on Basic Mechanical Properties of Fiber Reinforced Recycled Fine Aggregate Concrete. Doctor’s degree, Zhengzhou University, Zhengzhou, China, 2019. [Google Scholar]
  9. Zhang, L. Mixture Design and Performance Calculation Method of Steel Fiber Reinforced Recycled Concrete. Doctor’s degree, Zhengzhou University, Zhengzhou, China, 2017. [Google Scholar]
  10. Pan, H.M.; Ma, Y.C. Impact resistance of steel fiber reinforced concrete and its mechanism of crack resistance and toughening. J. Build. Mater. 2017, 20, 956–961. [Google Scholar]
  11. Zhu, Q. Performance and Calculation Method of Steel Fiber Reinforced Recycled Aggregate Concrete. Doctor’s degree, Zhengzhou University, Zhengzhou, China, 2018. [Google Scholar]
  12. Chen, Z.; Xue, J.; Zhao, H.; Shao, Y.; Zhao, Y.; Men, J. Experimental study on seismic behavior of steel reinforced concrete special-shaped columns. J. Build. Struct. 2007, 28, 53–61. [Google Scholar]
  13. Li, J.; Wang, X.; Xue, J.; Zhao, H. Experimental study on the performance of steel reinforced high-strength concrete columns under low cyclic reversed loading. China Civ. Eng. J. 2007, 40, 11–18. [Google Scholar]
  14. Wang, H. Experimental Study on Flexural Behavior of Recycled Steel Fiber-Reinforced Concrete Beams. Ph.D. Thesis, Xihua University, Chengdu, China, 2017. [Google Scholar]
  15. Shi, X. Experimental Study on Flexural Behavior of Steel Fiber-Section Steel High Strength Recycled Concrete Beams. Doctor’s degree, Yanbian University, Yanji, China, 2019. [Google Scholar]
  16. Wu, K.; Xu, C.; Cao, P.; Lin, S.; Chen, F. Experimental study on the flexural behavior of profile steel-steel fiber reinforced concrete composite beams. China Civ. Eng. J. 2019, 52, 41–52. [Google Scholar]
  17. Wang, H. Seismic Behaviour of Steel Fiber-Steel Reinforced Concrete Joints under the Cyclic Reversed Loading. Ph.D. Thesis, Hunan University, Changsha, China, 2005. [Google Scholar]
  18. Xiao, H. Experimental Study on Antiseismic Performance of Steel Reinforced Super-High-Strength Concrete Short Columns Filled with Fibers. Ph.D. Thesis, Dalian University of Technology, Dalian, China, 2006. [Google Scholar]
  19. Meng, B.; Li, L.; Zhong, W.; Tan, Z.; Du, Q. Improving anti-progressive collapse capacity of welded connection based on energy dissipation cover-plates. J. Constr. Steel Res. 2022, 188, 107051. [Google Scholar] [CrossRef]
  20. Liu, X.; Ma, E.; Liu, J.; Zhang, B.; Niu, D.; Wang, Y. Deterioration of an industrial reinforced concrete structure exposed to high temperatures and dry-wet cycles. Eng. Fail. Anal. 2022, 135, 106150. [Google Scholar] [CrossRef]
  21. Liu, X.; Zhang, W.; Gu, X.; Ye, Z. Probability distribution model of stress impact factor for corrosion pits of high-strength prestressing wires. Eng. Struct. 2021, 230, 111686. [Google Scholar] [CrossRef]
  22. Yang, Y. Study on the Basic Theory and its Application of Bond-Slip between Steel Shape and Concrete in SRC structures. Doctor’s degree, Xi’an University of Architecture and Technology, Xi′an, China, 2003. [Google Scholar]
  23. Zhao, H.; Yang, Y.; Xue, J.; Wang, Y.; Lin, Y. A review on the bond-slip mechanical behaviors of SRC structures. Adv. Mech. 2003, 33, 74–86. [Google Scholar]
  24. Qin, Y.; Qiu, J.; Lai, J.; Liu, F.; Wang, L.; Luo, Y.; Liu, T. Seepage characteristics in loess strata subjected to single point water supply. J. Hydrol. 2022, 609, 127611. [Google Scholar] [CrossRef]
  25. Liu, T.; Xie, Y.; Feng, Z.; Luo, Y.; Wang, K.; Xu, W. Better understanding the failure modes of tunnels excavated in the boulder-cobble mixed strata by distinct element method. Eng. Fail. Anal. 2020, 116, 104712. [Google Scholar] [CrossRef]
  26. He, S.; Lai, J.; Zhong, Y.; Wang, K.; Xu, W.; Wang, L.; Liu, T.; Zhang, C. Damage behaviors, prediction methods and prevention methods of rockburst in 13 deep traffic tunnels in China. Eng. Fail. Anal. 2020, 121, 105178. [Google Scholar] [CrossRef]
Figure 1. Experiment materials. (a) Recycled aggregate. (b) Steel fibers.
Buildings 12 00823 g001
Figure 2. Test specimen size.
Buildings 12 00823 g002
Figure 3. Strain gauge position.
Buildings 12 00823 g003
Figure 4. Loading device. (a) Laboratory loading. (b) Load schematic.
Buildings 12 00823 g004
Figure 5. Expansion cracks. (a) S-SFRAC12. (b) S-SFRAC14.
Buildings 12 00823 g005
Figure 6. Bonding cracks. (a) SRRC02. (b) S-SFRAC04. (c) S-SFRAC11. (d) S-SFRAC16.
Buildings 12 00823 g006
Figure 7. Other cracks morphologies. (a) S-SFRAC05. (b) S-SFRAC13. (c) S-SFRAC08. (d) S-SFRAC09.
Buildings 12 00823 g007
Figure 8. Cracks in the side of the specimen. (a) S-SFRAC04. (b) S-SFRAC09. (c) S-SFRAC12. (d) S-SFRAC16.
Buildings 12 00823 g008
Figure 9. Typical side cracks in the specimens. (a) S-SFRAC15. (b) S-SFRAC08.
Buildings 12 00823 g009
Figure 10. Branch cracks. (a) S-SFRAC06. (b) S-SFRRAC10.
Buildings 12 00823 g010
Figure 11. Section steel flange strain distribution. (a) Load increase section. (b) Load decrease section.
Buildings 12 00823 g011
Figure 12. Bond stress distributions at the steel flanges in the load increase section.
Buildings 12 00823 g012
Figure 13. P–S curves of the test specimens. (a) SRC01. (b) SRC02. (c) S-SFRAC03. (d) S-SFRAC04. (e) S-SFRAC05. (f) S-SFRAC06. (g) S-SFRAC07. (h) S-SFRAC08. (i) S-SFRAC09. (j) S-SFRAC10. (k) S-SFRAC11. (l) S-SFRAC12. (m) S-SFRAC13. (n) S-SFRAC14. (o) S-SFRAC15. (p) S-SFRAC16.
Buildings 12 00823 g013
Figure 14. PS model.
Buildings 12 00823 g014
Figure 15. Distribution diagram showing the characteristic bond strengths of each specimen.
Buildings 12 00823 g015
Figure 16. Relationship between the bond strength and volume ratio of the steel fibers.
Buildings 12 00823 g016
Figure 17. Relationship between bond strength and length-diameter ratio of the steel fiber.
Buildings 12 00823 g017
Figure 18. Relationship between the bond strength and thickness of the section steel protection layer.
Buildings 12 00823 g018
Figure 19. Relationship between bond strength and embedded length of section steel.
Buildings 12 00823 g019
Table 1. Mixture design.
Strength Grade of the ConcreteMaterial Utilization Amount (kg/m3)
CementSand RatioRecycled AggregateSand
C40409.05334%1195.198615.764
WaterWater reducing admixtureAdded waterWater–cement ratio
175.8934.09157.3700.43
Table 2. Steel fiber parameters.
Product
Name
ModelNominal Diameter D/mmTensile Strength Rm/(N/mm2)Length L/mm
DRAMIX
STEEL FIBRE
3D 60/35BG0.58134535
3D 60/60BG1.00116060
3D 80/50BG0.62127050
3D 100/60BG0.62127060
Table 3. Physical properties of recycled aggregate.
Size/mmApparent Density kg/m3Bulk Density kg/m3Crush Indicator/%Water Absorption/%Void Ratio/%Mud Content/%Total Needle Flake Content/%Sturdiness/%
5–252500120013.23.8520.80.145.1
Table 4. Mechanical properties of the steel.
Categoryfy/MPafu/MPaEs/MPa
Channel steel flange2754202.07 × 105
Channel steel web3354402.08 × 105
Steel plate3004202.05 × 105
Longitudinal reinforcement4406152.12 × 105
Horizontal hooped reinforcement3805402.02 × 105
Table 5. Detailed design parameters of the specimens.
Specimen NumberSteel Fiber Volume Ratio η /% Length Diameter Ratio of Steel Fiber L/DSection Steel Protective Layer Thickness Css/mmEmbedded Length of Section Steel Le/mm
SRC010.0055700
SRRC020.0055700
S-SFRAC030.46055700
S-SFRAC040.86055700
S-SFRAC051.26055700
S-SFRAC061.66055700
S-SFRAC070.86055700
S-SFRAC080.88055700
S-SFRAC090.810055700
S-SFRAC100.86065700
S-SFRAC110.86075700
S-SFRAC120.86085700
S-SFRAC130.86055500
S-SFRAC140.86055550
S-SFRAC150.86055600
S-SFRAC160.86055650
Note: (60) indicates that the aspect ratio was also 60, with a different length and nominal diameter.
Table 6. Characteristic loads and bonding strengths.
Specimen NumberInitial Slip State of the Loading EndInitial Slip State of the Free EndUltimate StateResidual State
P sl / kN τ ¯ sl / MPa P sf / kN τ ¯ sf / MPa P u / kN τ ¯ u / MPa P r / kN τ ¯ r / MPa
SRC01294.600.478566.400.919834.041.354380.350.617
SRRC02202.450.329486.400.790668.231.085386.520.627
S-SFRAC03262.150.426424.100.689747.581.214480.280.780
S-SFRAC04249.880.406537.680.873839.881.364488.450.792
S-SFRAC05587.250.954459.700.747825.681.341542.300.880
S-SFRAC06145.150.236492.050.799803.901.305520.350.844
S-SFRAC07200.250.325584.800.950879.671.428520.270.844
S-SFRAC08237.000.385386.600.628770.961.252513.300.833
S-SFRAC09207.900.337480.150.780747.491.214528.240.857
S-SFRAC10289.000.469494.700.803927.671.506500.100.812
S-SFRAC11330.800.537533.550.867989.491.607544.750.884
S-SFRAC12388.500.635527.350.8561058.241.718612.400.994
S-SFRAC13168.550.383335.650.763431.370.981316.520.716
S-SFRAC14226.850.469365.550.755693.871.434371.200.767
S-SFRAC15250.400.474428.800.812793.271.503385.850.730
S-SFRAC16273.650.479557.700.976794.941.390446.250.780
Table 7. The experimental results of the characteristic bond strength compared with the calculated results.
Specimen No.Initial Slip State of the Loading EndInitial Slip State of the Free EndUltimate StateResidual State
τ ¯ sl / MPa τ ¯ sl e / MPa τ ¯ sl / τ ¯ sl e τ ¯ sf / MPa τ ¯ sf e / MPa τ ¯ sf / τ ¯ sf e τ ¯ u / MPa τ ¯ u e / MPa τ ¯ u / τ ¯ u e τ ¯ r / MPa τ ¯ r e / MPa τ ¯ r / τ ¯ e r
SRRC020.3290.3300.9970.7900.7990.9891.0851.0870.9980.6270.6261.002
S-SFRAC030.4260.4251.0020.6890.6980.9871.2141.2190.9960.7800.7641.009
S-SFRAC040.4060.4370.9290.8730.8211.0631.3641.3521.0090.7920.7980.992
S-SFRAC050.954-------------0.7470.8440.8851.3411.3760.9750.8800.8301.060
S-SFRAC060.2360.2370.9960.7990.7651.0441.3051.2911.0110.8440.8600.981
S-SFRAC080.3850.3970.9700.6280.7620.8241.2521.2840.9750.8330.8291.005
S-SFRAC090.3370.3351.0060.7800.7281.0711.2141.2001.0120.8570.8580.999
S-SFRAC100.4690.4970.9440.8030.8340.9631.5061.4771.0200.8120.8530.952
S-SFRAC110.5370.5560.9660.8670.8471.0241.6071.6031.0020.8840.9080.974
S-SFRAC120.6350.6151.0330.8560.8600.9951.7181.7290.9940.9940.9631.032
S-SFRAC130.3830.4380.8740.7630.7830.9740.981--------------0.7160.7200.994
S-SFRAC140.4690.4381.0710.7550.7920.9791.4341.4770.9710.7670.7401.036
S-SFRAC150.4740.4381.0820.8120.8021.0121.5031.4351.0470.7300.7590.962
S-SFRAC160.4790.4381.0940.9760.8121.2021.3901.3940.9970.7800.7791.001
Error analysisMean value 1.074
Standard deviation 0.246
Mean value 1.001
Standard deviation 0.087
Mean value 1.001
Standard deviation 0.021
Mean value 1.000
Standard deviation 0.029
Note: superscript E represents the calculated fitting value.
Publisher’s Note: MDPI stays neutral with regard to jurisdictional claims in published maps and institutional affiliations.

