Article

Window-Windcatcher for Enhanced Thermal Comfort, Natural Ventilation and Reduced COVID-19 Transmission

by
Odi Fawwaz Alrebei
1,*,
Laith M. Obeidat
2,
Shouib Nouh Ma’bdeh
2,
Katerina Kaouri
3,
Tamer Al-Radaideh
2 and
Abdulkarem I. Amhamed
1,*
1
Energy Department, Qatar Environment and Energy Research Institute (QEERI), Hamad Bin Khalifa University, Doha 34110, Qatar
2
Department of Architecture, Jordan University of Science and Technology, Irbid 3030, Jordan
3
School of Mathematics, Cardiff University, Cardiff CF24 4AG, UK
*
Authors to whom correspondence should be addressed.
Buildings 2022, 12(6), 791; https://doi.org/10.3390/buildings12060791
Submission received: 11 April 2022 / Revised: 1 June 2022 / Accepted: 3 June 2022 / Published: 9 June 2022
(This article belongs to the Topic Ventilation and Indoor Air Quality)

Abstract

:
We investigate and test the effectiveness of a novel window windcatcher device (WWC), as a means of improving natural ventilation in buildings. Using ANSYS CFX, the performance of the window-windcatcher is compared to a control case (no window-windcatcher), in three different geographic locations (Cardiff, Doha and Amman) which are representative of three different types of atmospheric conditions. The proposed window-windcatcher has been shown to improve both thermal comfort and indoor air quality by increasing the actual-to-required ventilation ratio by up to 9% compared to the control case as per the American Society of Heating, Refrigerating and Air-Conditioning Engineers (ASHRAE) standards. In addition, the locations with minimum velocities have been identified. Those locations correspond to the regions with a lower infection risk of spreading airborne viruses such as SARS-CoV-2, which is responsible for the COVID-19 pandemic.

1. Introduction

As one of the most significant threats to our lives, global warming needs to be tackled immediately and effectively. Global warming has been destroying the environment, thus affecting almost all aspects of our lives [1]. The construction industry is one of the main sectors contributing to global warming, through the emission of vast greenhouse gas (GHG), mainly CO2 [2]. In addition, 40% of the CO2 emissions is generated by buildings and around 40% of the global energy generated is consumed by buildings [3]. Energy consumption by buildings is expected to reach 64% of the total energy consumption by 2100, if no action is taken [4].
More than 60% of the energy consumption in buildings is used for heating, cooling, and ventilation [5]. This energy is obtained mainly from fossil resources [5]. In addition to the challenges of high energy consumption and CO2 emissions, maintaining acceptable indoor air quality (IAQ) using mechanical HVAC systems can be challenging. On average, people spend up to 90% of their time working and living indoors. The risk of sick building syndrome (SBS), metabolic diseases and transmission of COVID-19 and other airborne viral diseases are increased in air-conditioned buildings compared to naturally ventilated buildings [6]. It is, thus, critical to ensure good IAQ to maintain health and productivity [5]. In this context, passive strategies implemented in the building’s architecture, such as daylighting, natural ventilation, passive cooling and passive heating may provide significant benefits to users and to the environment as they lead to reduced energy consumption and CO2 emissions, mitigating negative impacts on the environment and health. Implementing such passive strategies could also lead to significant cost savings [7].
Passive cooling techniques have been studied extensively [7]. Acceptable thermal comfort and IAQ using passive cooling can be achieved with only a small fraction of the energy consumed by mechanical ventilation systems [6]. Natural ventilation is one of the leading passive cooling strategies that effectively improve the indoor atmosphere by: (1) providing good IAQ and (2) improving thermal comfort, through affecting ventilation rates, air velocity, temperature and humidity [7]. Natural ventilation is air exchange between outdoor (fresh) air and indoor (used) air [1]. It occurs naturally, without mechanical assistance, by establishing a pressure difference or a temperature difference.
Indoor thermal comfort could be directly improved by increasing the cooling sensation through increased airflow or indirectly by night ventilation (night flushing) [7,
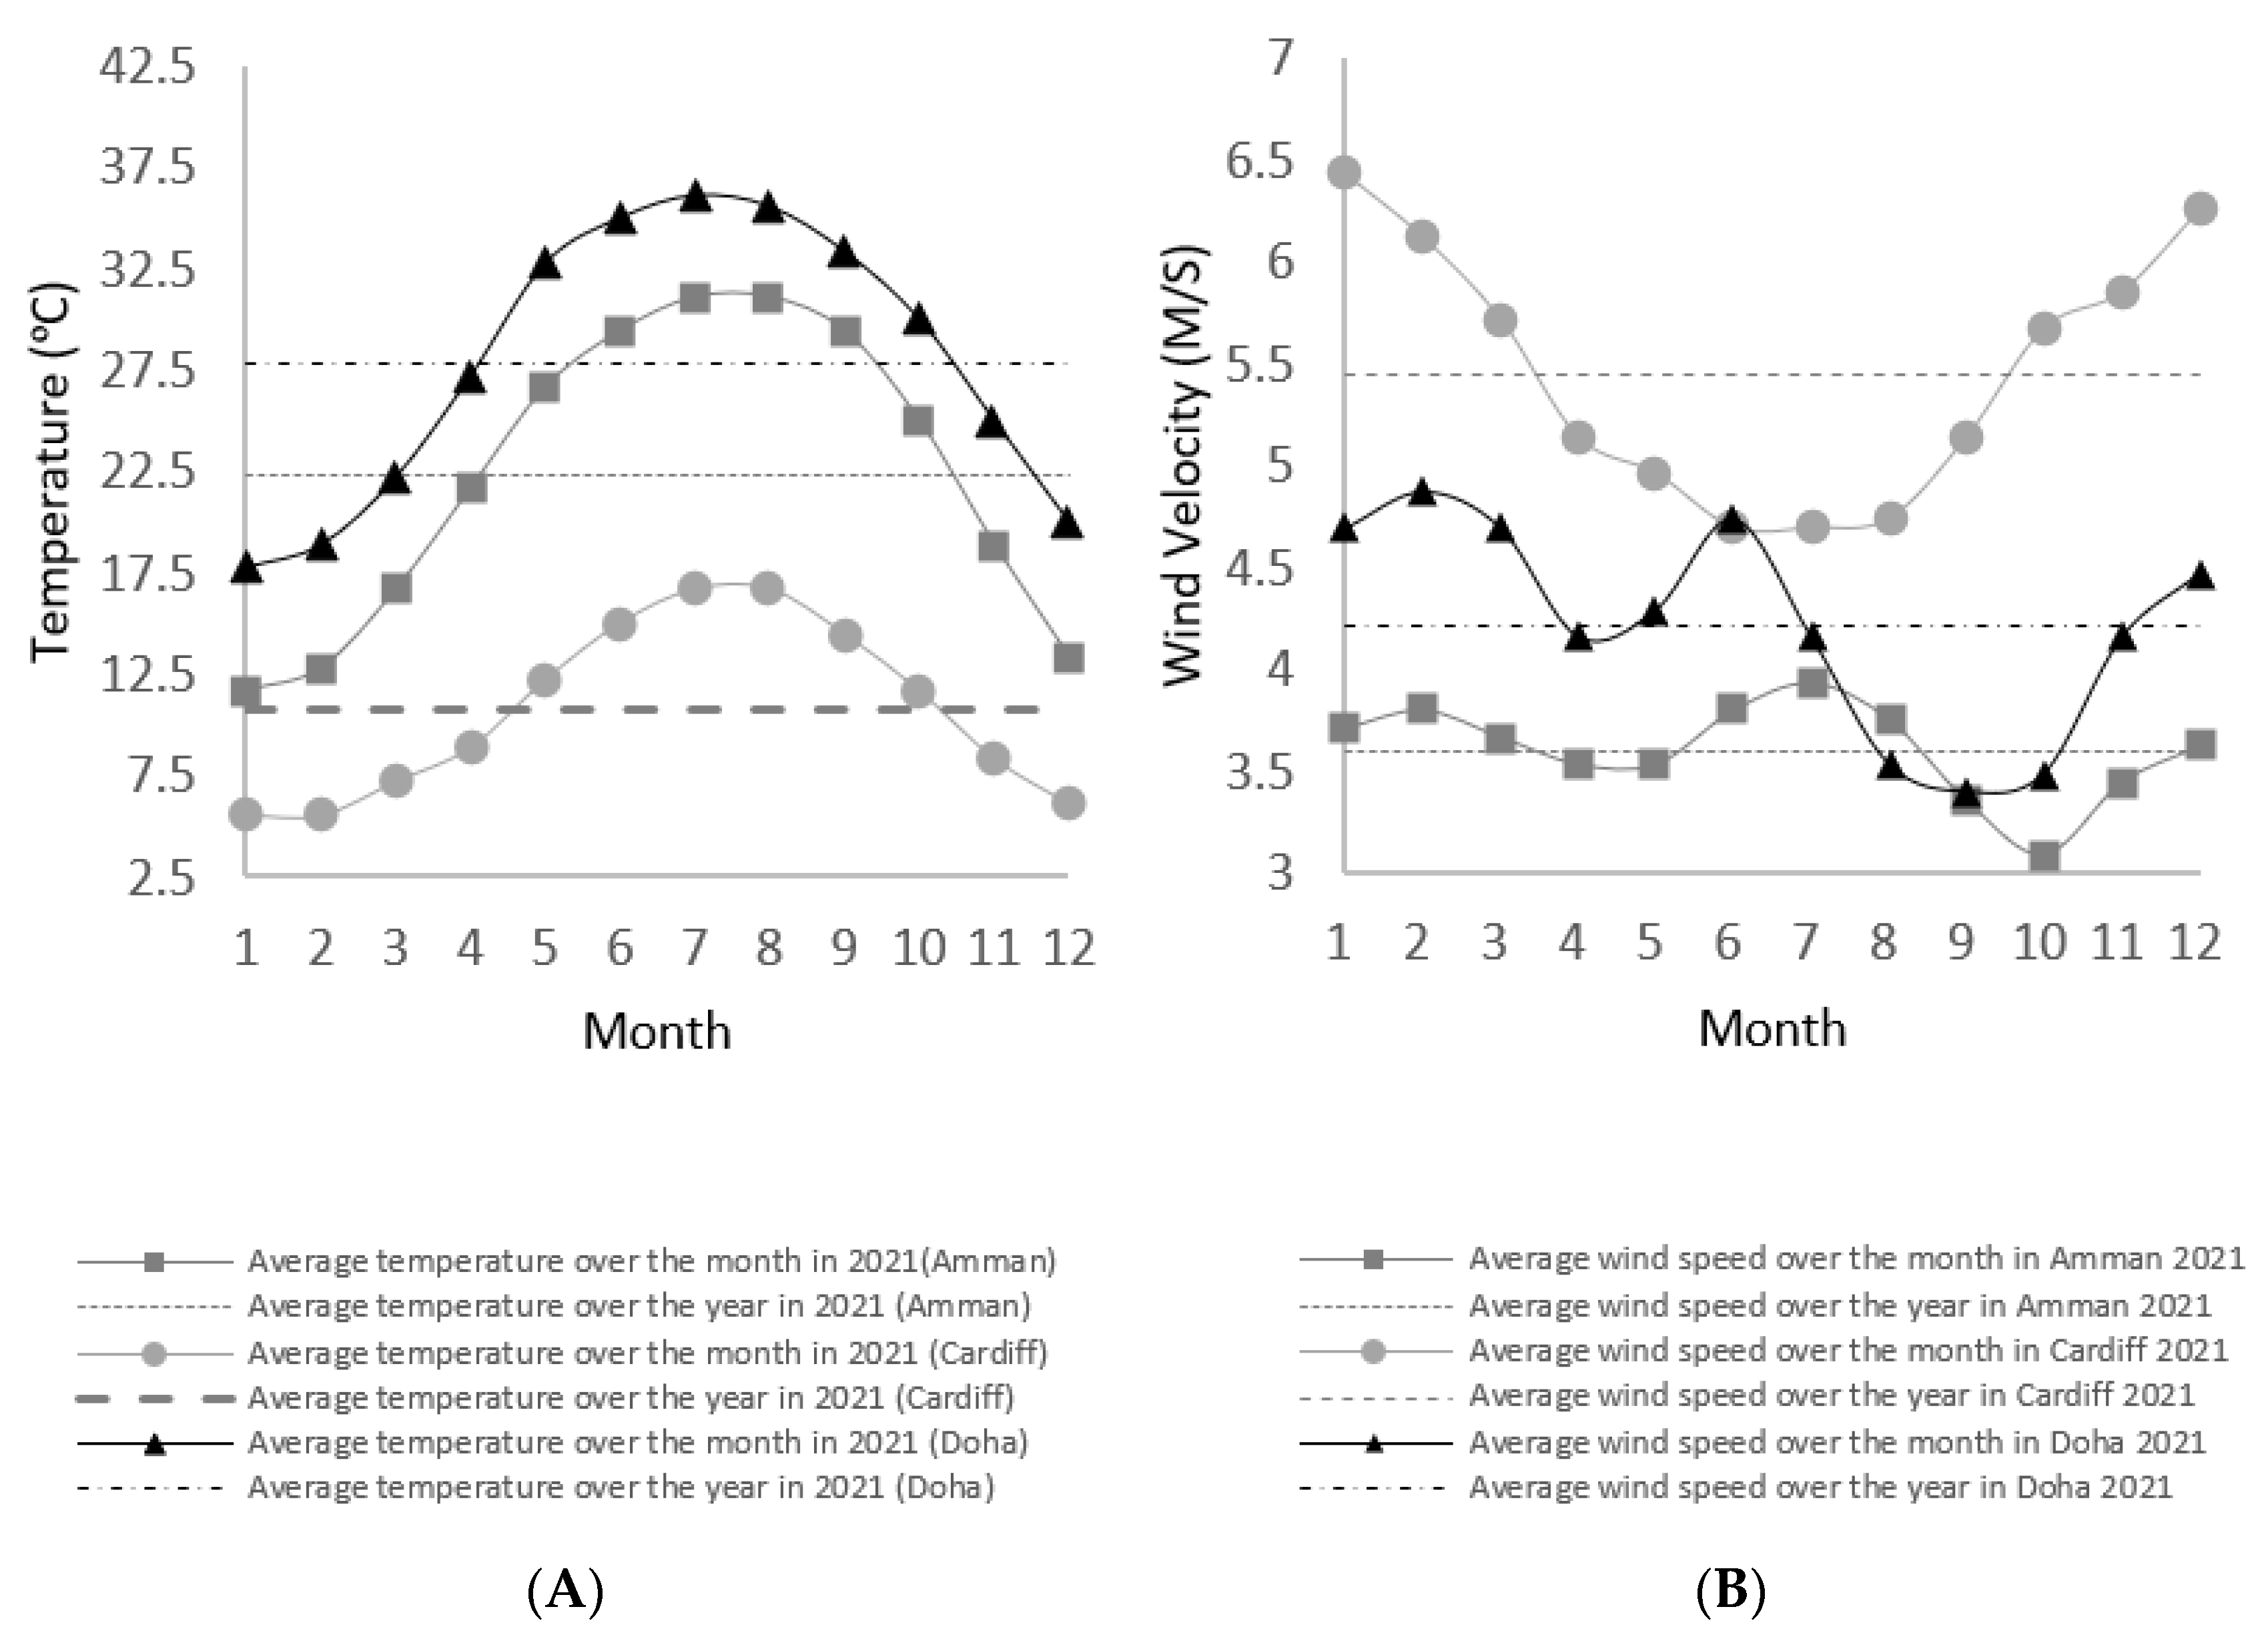
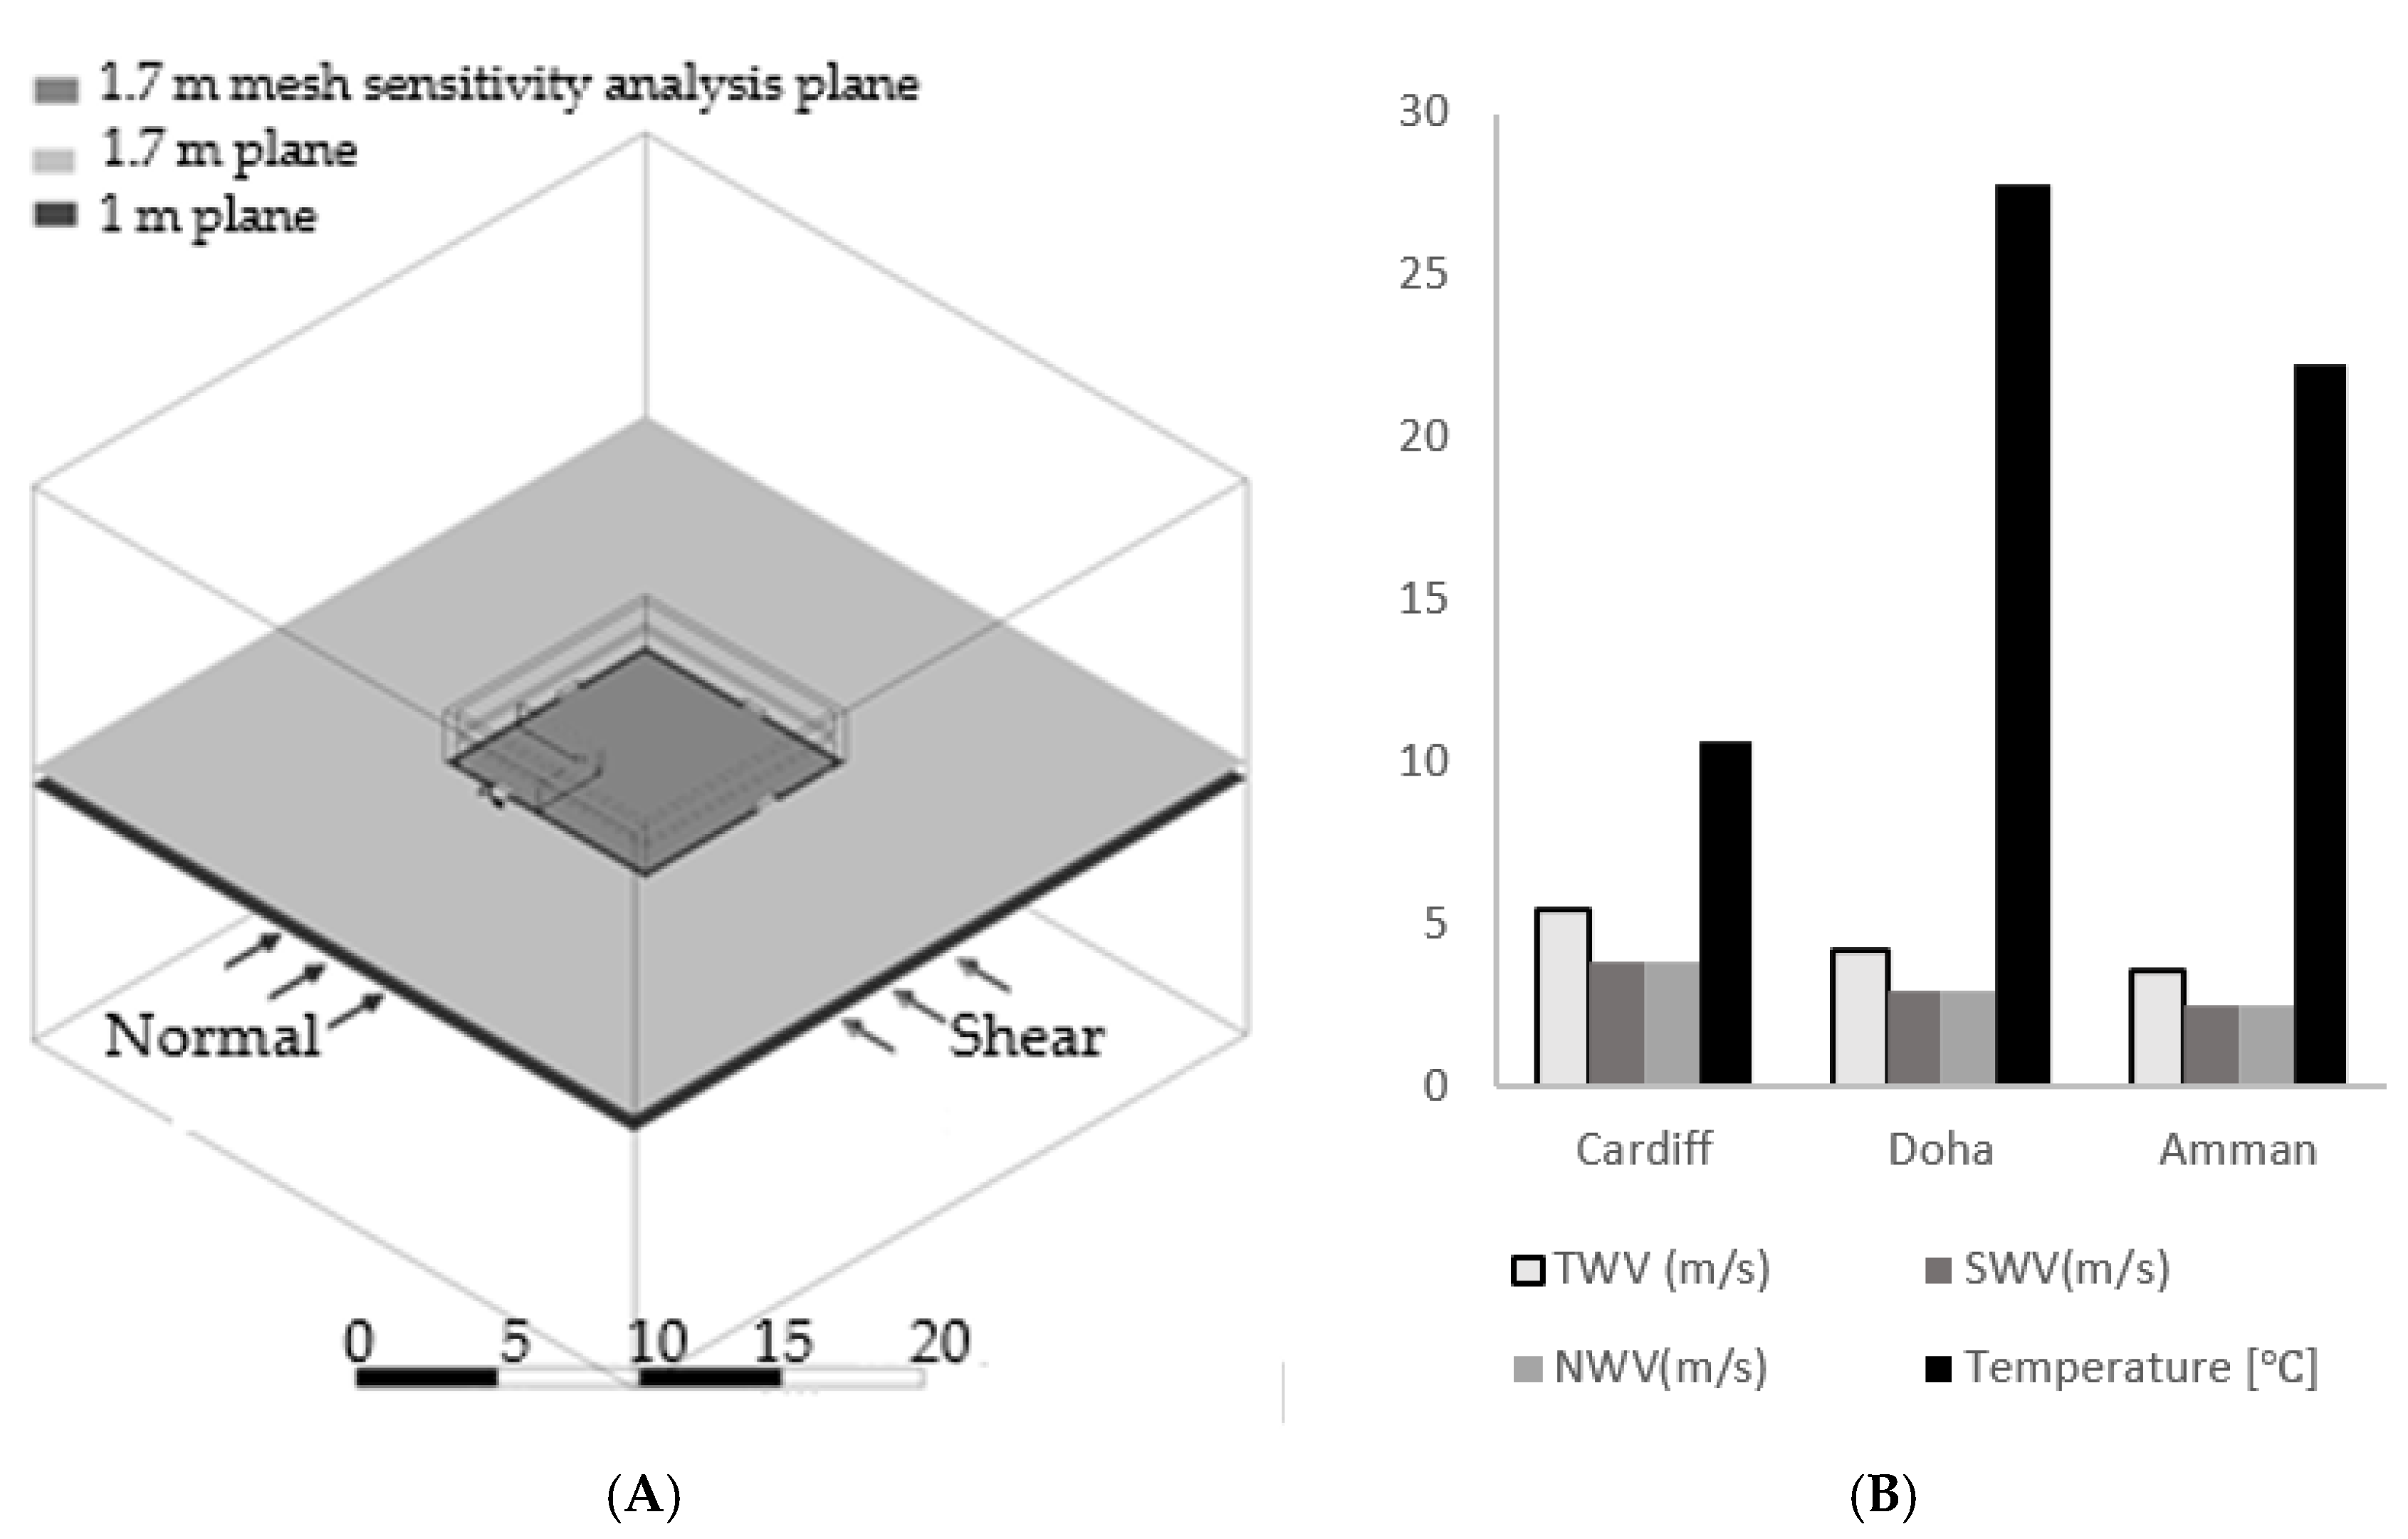
8]. Night ventilation can be achieved through natural ventilation, especially in the context of adequate fluctuation in air temperature over the day and the night. For example, the temperature during the hot, sunny summer months in Amman, Jordan usually reaches 40 °C in the day and drops significantly, to around 20 °C in the night. (Average temperatures during the day and night are 36 °C and 22 °C, respectively [9].) Such a significant fluctuation in temperature provides great potential for night ventilation and improvement of the indoor thermal comfort [10] by providing a cool breeze during the night, which would flush out hot air and cool off the internal thermal masses to effectively delay the thermal gain during daytime [11].
Implementing effective natural ventilation solutions in multi-family residential buildings is challenging and sometimes not easily applicable. The internal spatial organization of the building [11], and to a great extent, its layout and limited shared exterior walls with the outdoor environment contribute to the difficulty. The limited shared exterior walls, especially in the generic architectural typology of the multi-story residential buildings, lead to little or even no condition of the opposite openings (inlet and outlet) necessary to achieve effective cross-ventilation [12]. In addition, even in the single-family detached house typology, cross-ventilation conditions can be difficult to achieve, especially for large houses where some rooms have only a single exterior wall with all window openings on the same wall. Various techniques and systems have been developed in order to exploit these natural phenomena and conditions to achieve adequate natural ventilation. These systems vary in performance, requirements, and settings: they include Trombe wall, double skin façade, solar chimney, solar walls, atrium, wind tower, windcatcher and fenestration (single-sided ventilation and cross ventilation) [7]. These systems can be intertwined and used for other passive design strategies.
A traditional and common natural ventilation system for buildings is the windcatcher [13] as it can provide good air quality and improve thermal comfort in an environmentally friendly manner, using, mainly, renewable wind energy [14]. Windcatchers have a long history with enhancing indoor environmental comfort in arid and semi-arid regions. They achieve harmony between built environments and the surrounding natural environments. A windcatcher or wind tower is generally defined as a tower-like architectural component designed to be mounted on the building roof “to ‘catch’ the wind at higher elevations and direct it into the inner environment of a building” [2].
Windcatchers operate mainly with wind-driven ventilation and stack (buoyancy) effects [2]. Moreover, windcatchers are low maintenance since they operate without moving parts [2]. However, windcatchers have limitations. A key limitation is their large size and centrality (i.e., located at the building’s center). Since several windcatcher elements are generally required to achieve adequate natural ventilation, especially for large-scale buildings, restrictions are imposed on the building geometry. For example, windcatcher systems may limit future expansion and roof space use [3]. Many researchers have extensively studied their effectiveness and performance using different evaluation methods such as computational methods, experimental methods, analytical and empirical methods, or a combination. Each of these methods has its own advantages and limitations in terms of accuracy, cost, complexity of geometry, detail of the results and time to implement the method [15]. CFD is the most used computational method as it offers high accuracy and low financial cost (only the cost of the software package), and it is suitable for complex geometries, generating detailed results. Detailed information regarding the advantages of CFD compared to other methods can be found in [15].
According to [16,17], Environmental Controls (ECs) are based on methods for reducing concentrations of an infectious agent in the air and on surfaces in indoor environments. World Health Organization (WHO) guidelines recommend a combination of environmental control mechanisms to avoid the spread of viruses to health care workers (HCWs) and patients in health care settings [17]. The environmental regulations rely on the design of the healthcare environment and include (a) building materials, surfaces, and products used [17]; (b) indoor environmental factors (e.g., temperature, humidity, light, and airflow) [17]; and (c) indoor access to the outside. All of the above may influence the survival of infectious agents in the built environment.
Airflow and ventilation systems play a significant role in the airborne transmission of pathogens; improving ventilation decreases the risk of transmission. Identifying how the novel window-windcatcher improves ventilation is the focus of our work here [6,7]. The design of a ventilation system depends on the ability to contain, mitigate, and remove airborne pollutants through air change and inward indoor airflow [17].
Reducing the effect of overheating, and thus, improving thermal comfort in a building, is achieved mainly by two methods: building elements and ventilation [18]. The heat conductivity (k-value) of the building elements (such as walls, windows, etc.) can be reduced through selecting appropriate building elements. Ventilation is enhanced through increased air circulation, using, for example, window-windcatchers. The overheating is given by H l o s s = c p m ˙ Δ T , where c p is the air specific capacity, m ˙ is the air mass flow rate and Δ T is the temperature difference between the internal and external domains. The window-windcatcher can increase H l o s s by increasing m ˙ .
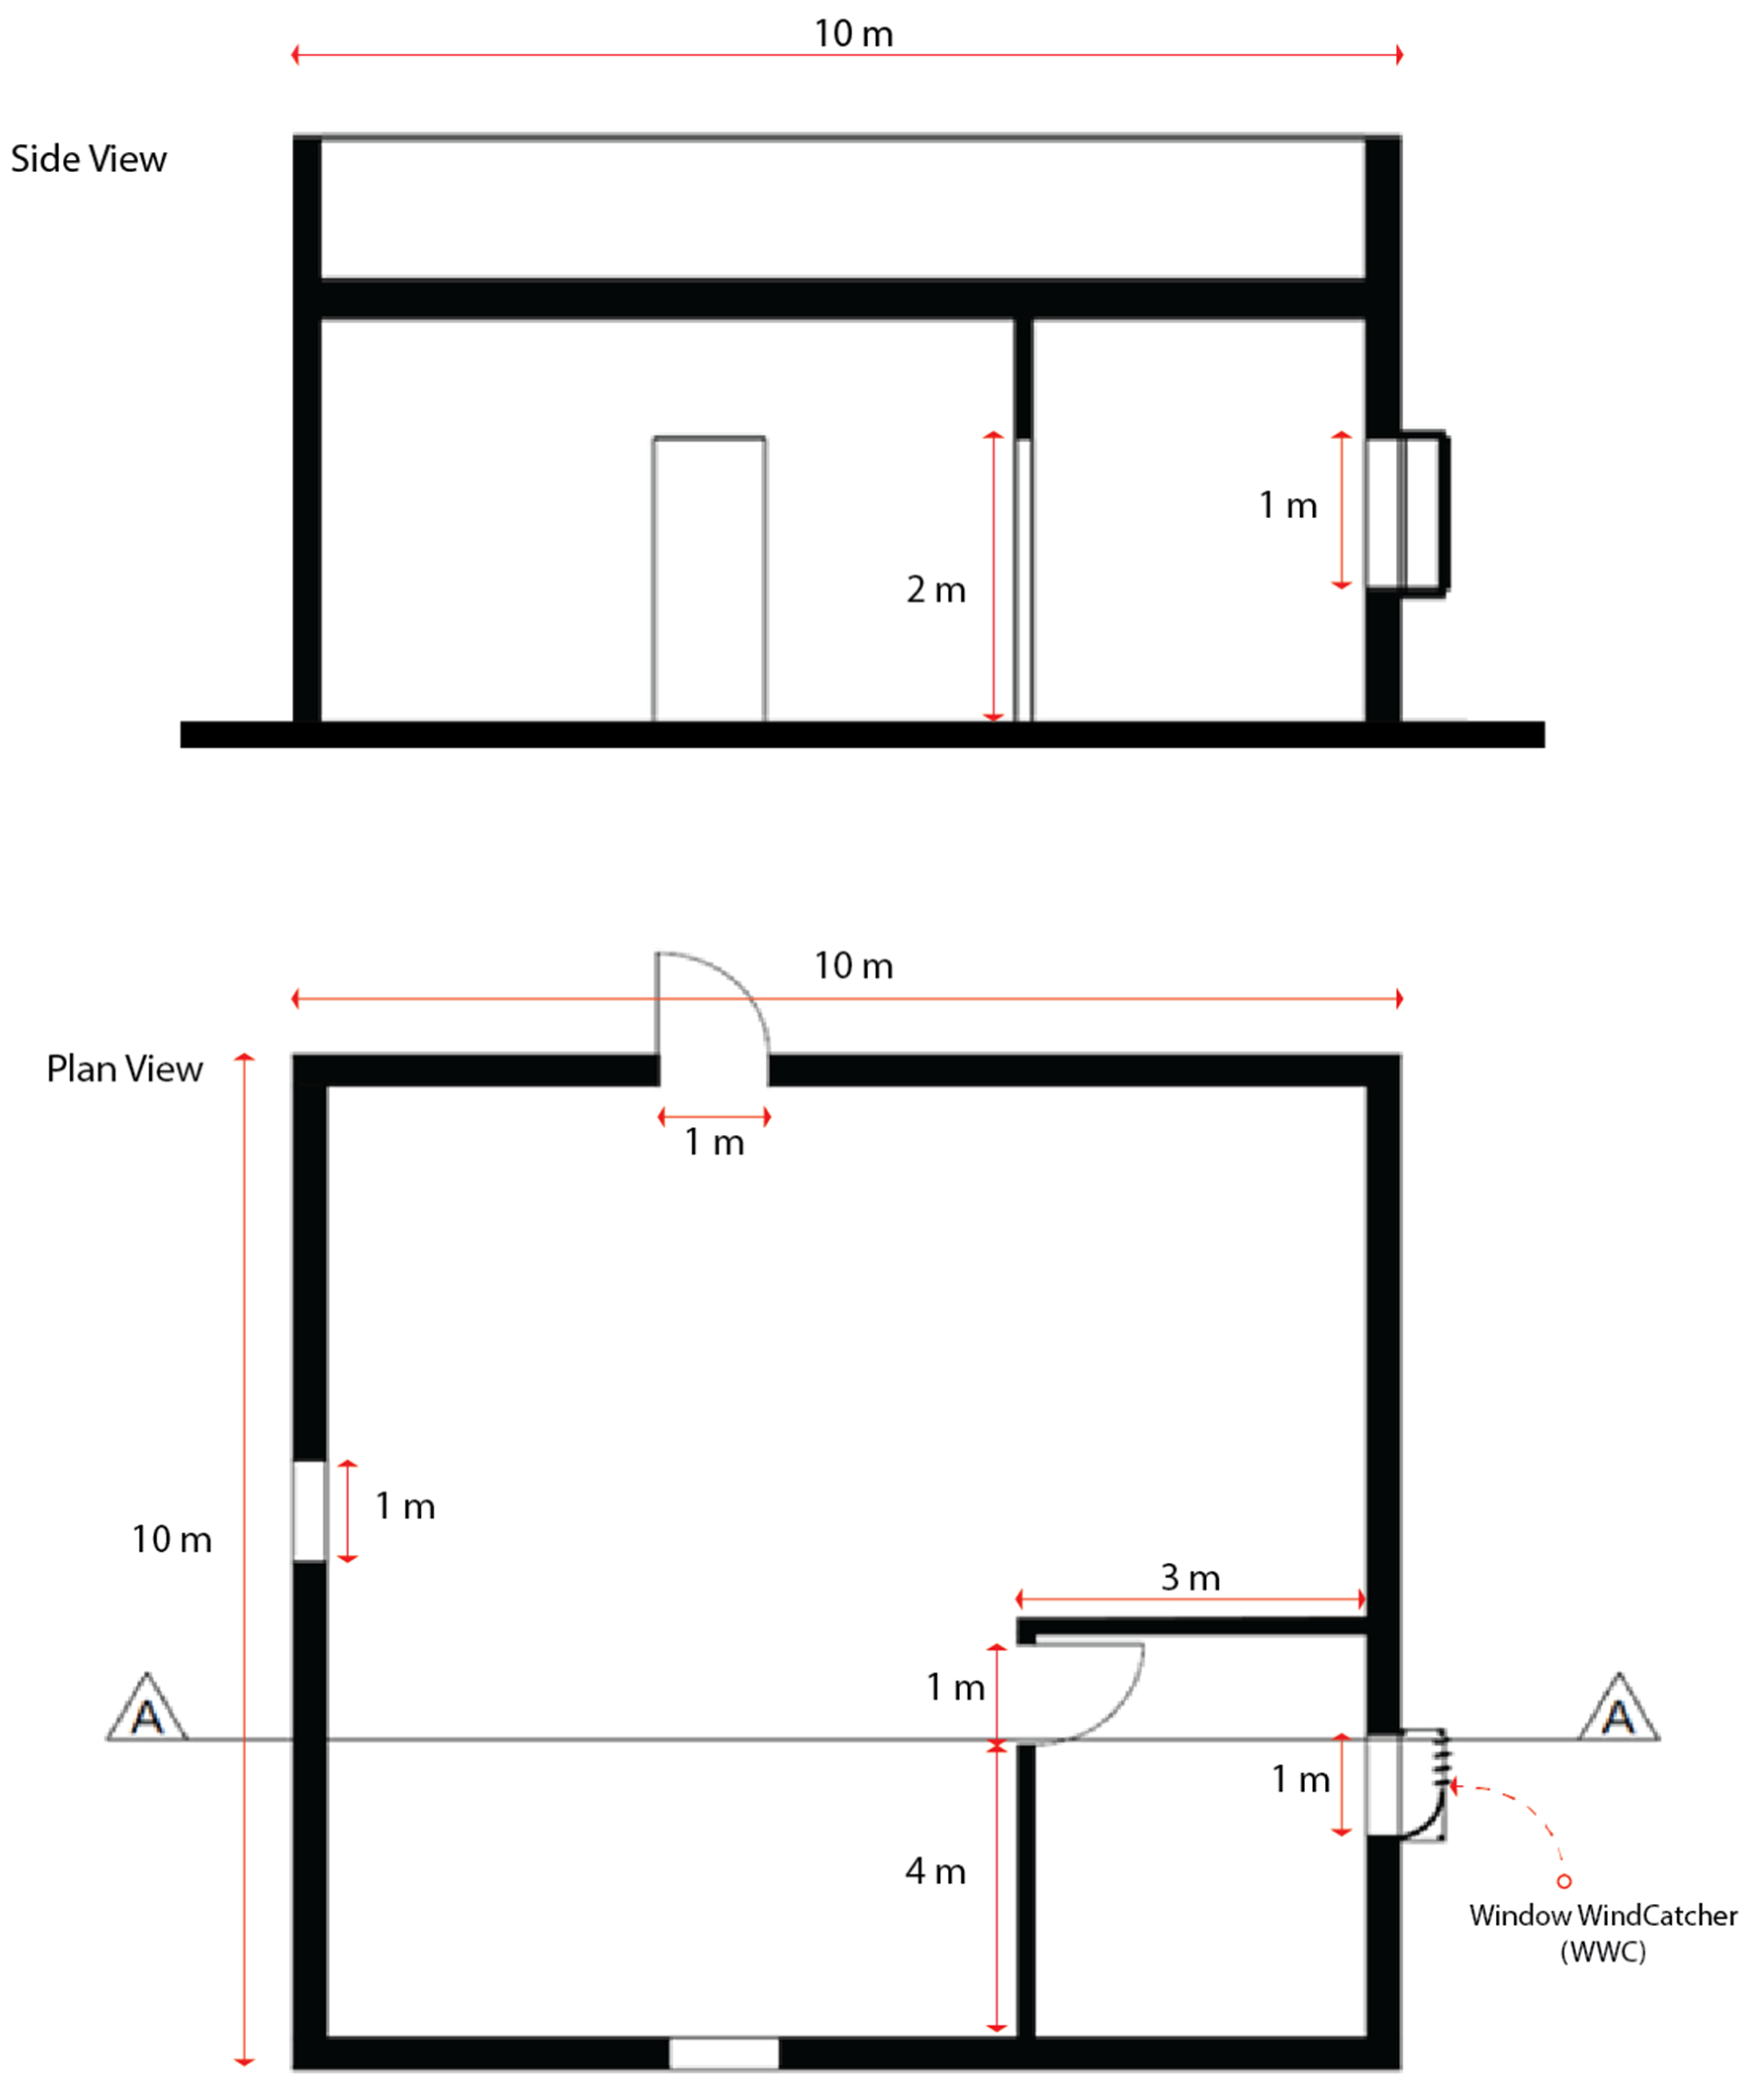
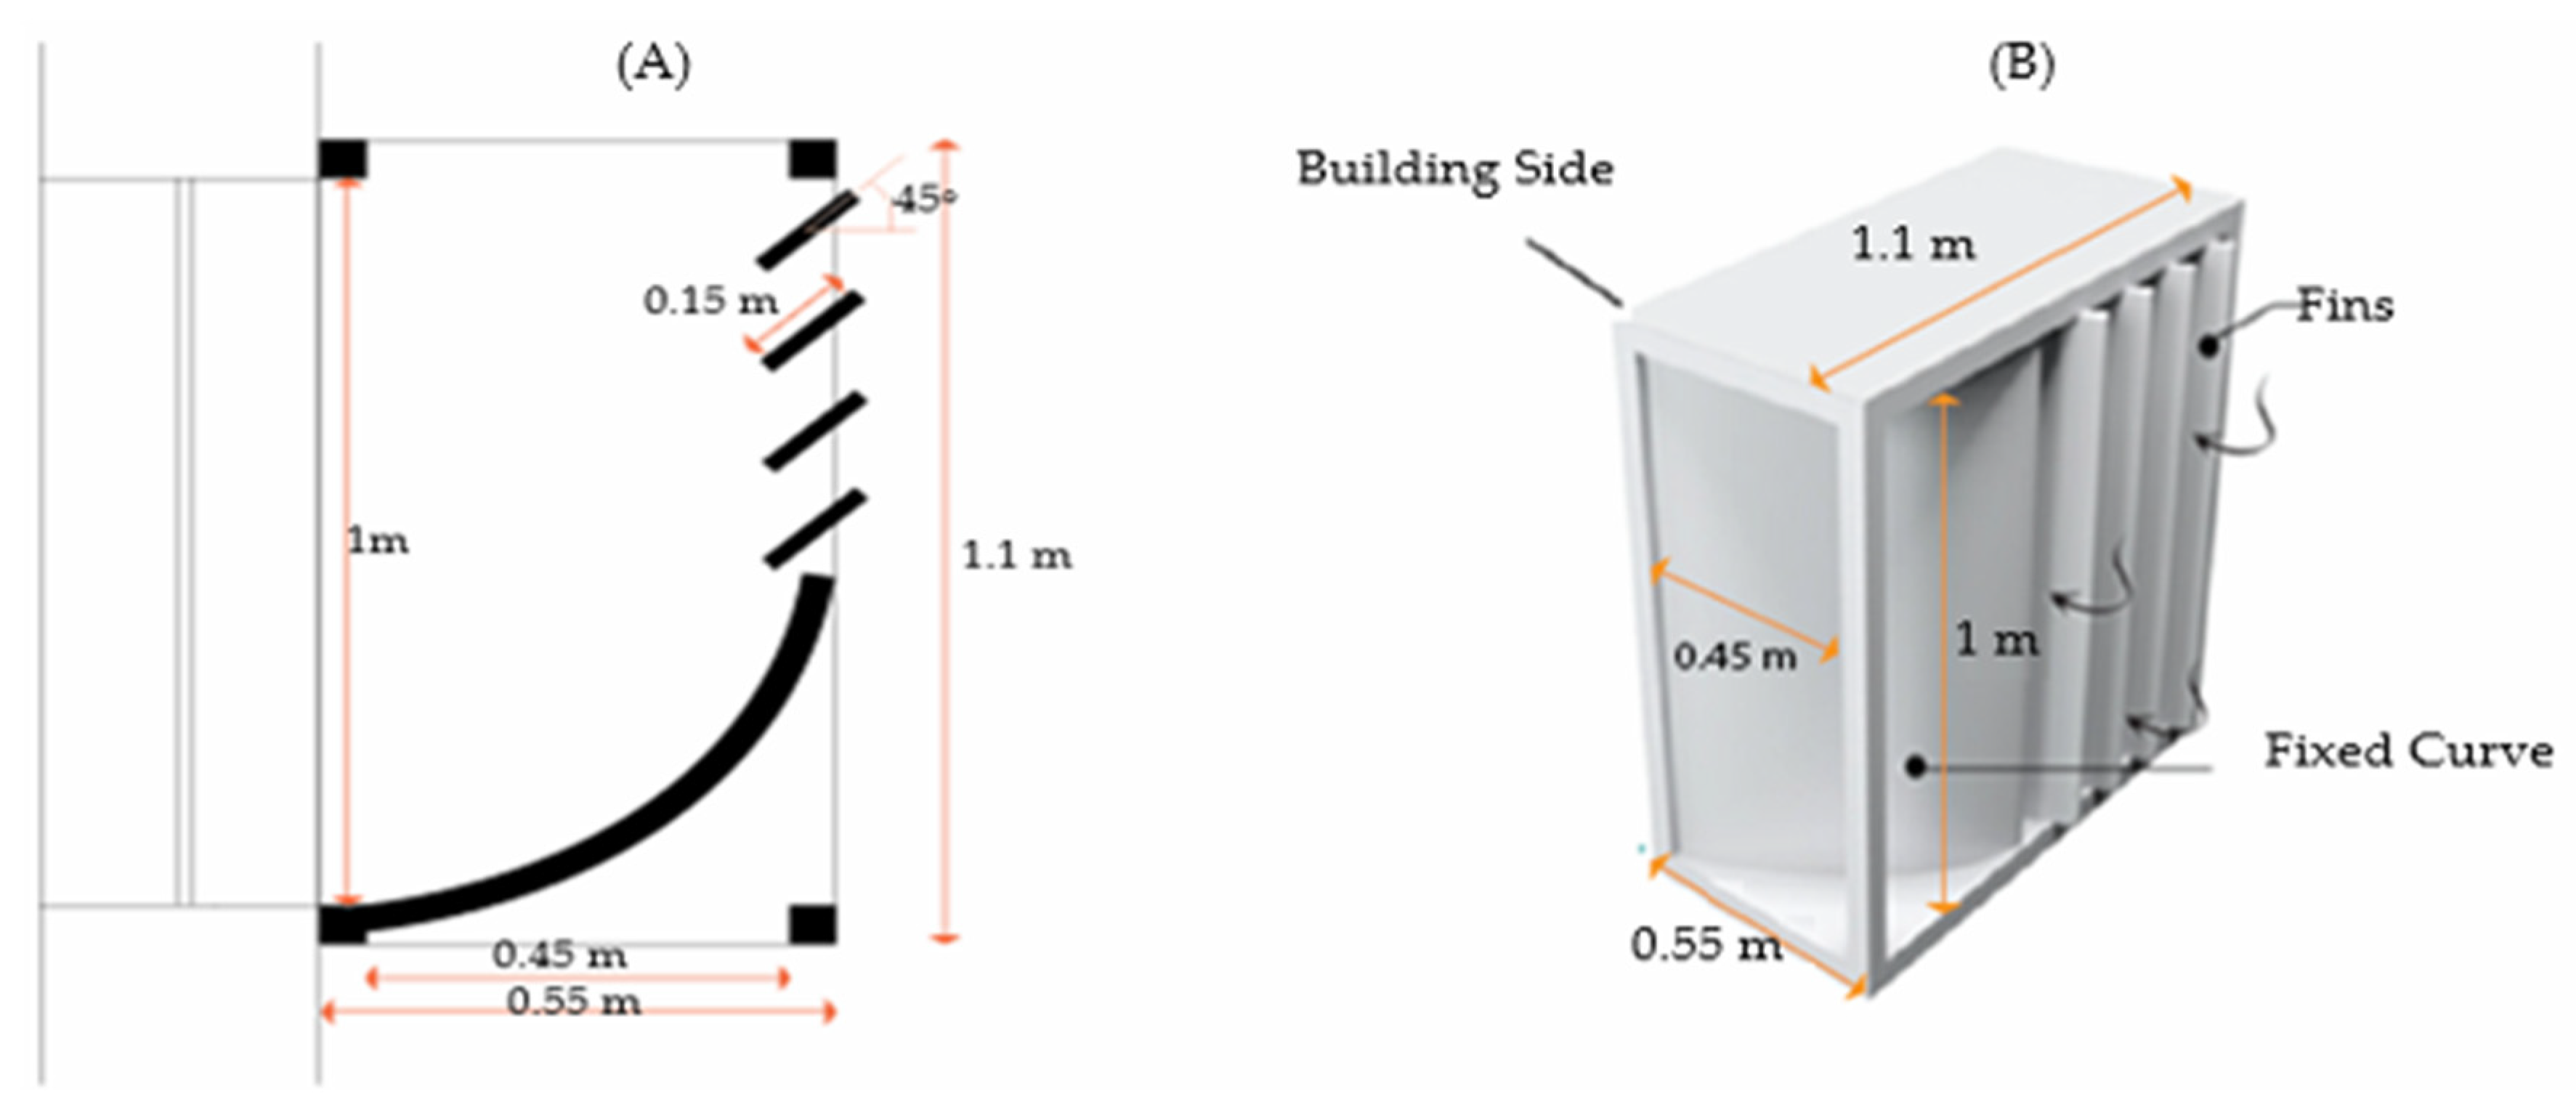
Our work aims to investigate and test, using CFD, the design of a novel window- windcatcher device that can be mounted on exterior walls to capture the prevailing wind and redirect it into indoor spaces. We demonstrate that the ventilation rate in an indoor space increases when we use the novel window-windcatcher. According to the World Health Organization (WHO), viral diseases, such as COVID-19, can be more easily transmitted in poorly ventilated enclosed spaces which have low ventilation rates [19]. The proposed design could replace or complement traditional large-scale windcatchers by small-scale decentralized windcatchers which can be mounted on exterior walls as a window component. The design of the device is suitable for retrofitting existing buildings or for new buildings. We find that the device could enhance the effectiveness of natural ventilation (passive cooling) in buildings, significantly improving IAQ and thermal comfort by increasing the actual-to-required ventilation ratio, as per the ASHRAE standards, by up to 9% compared to the control case without a window-windcatcher.
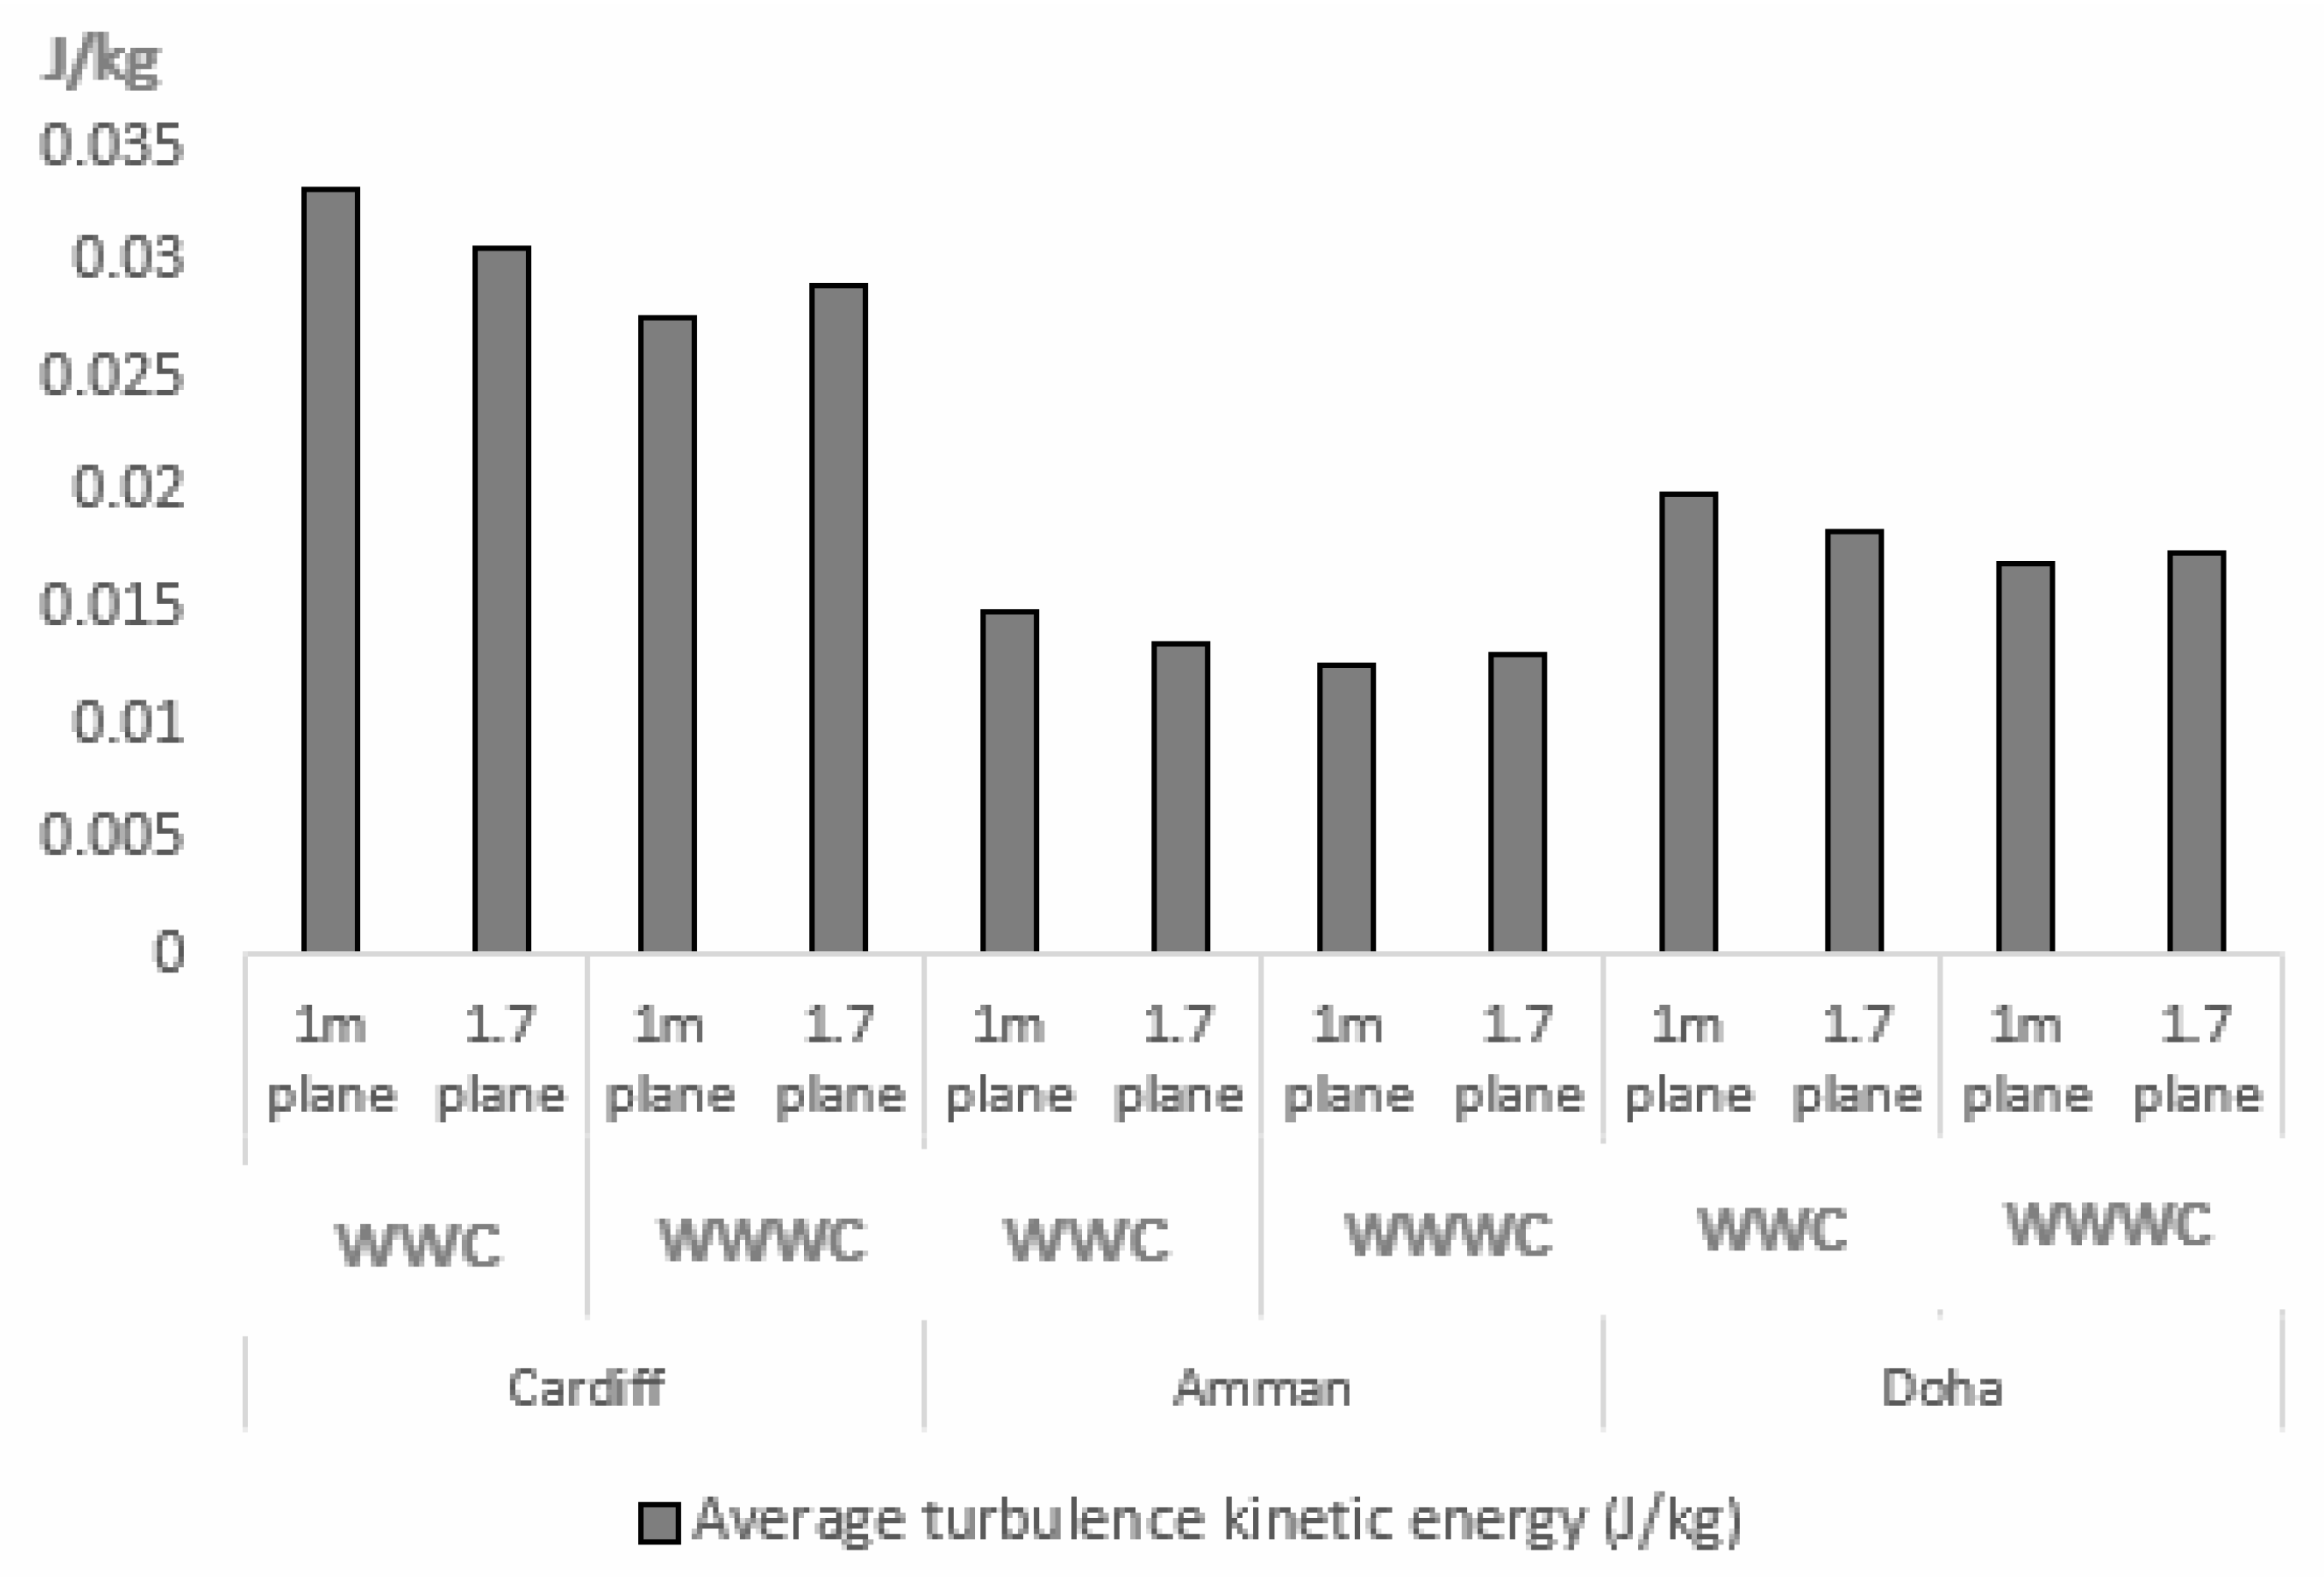
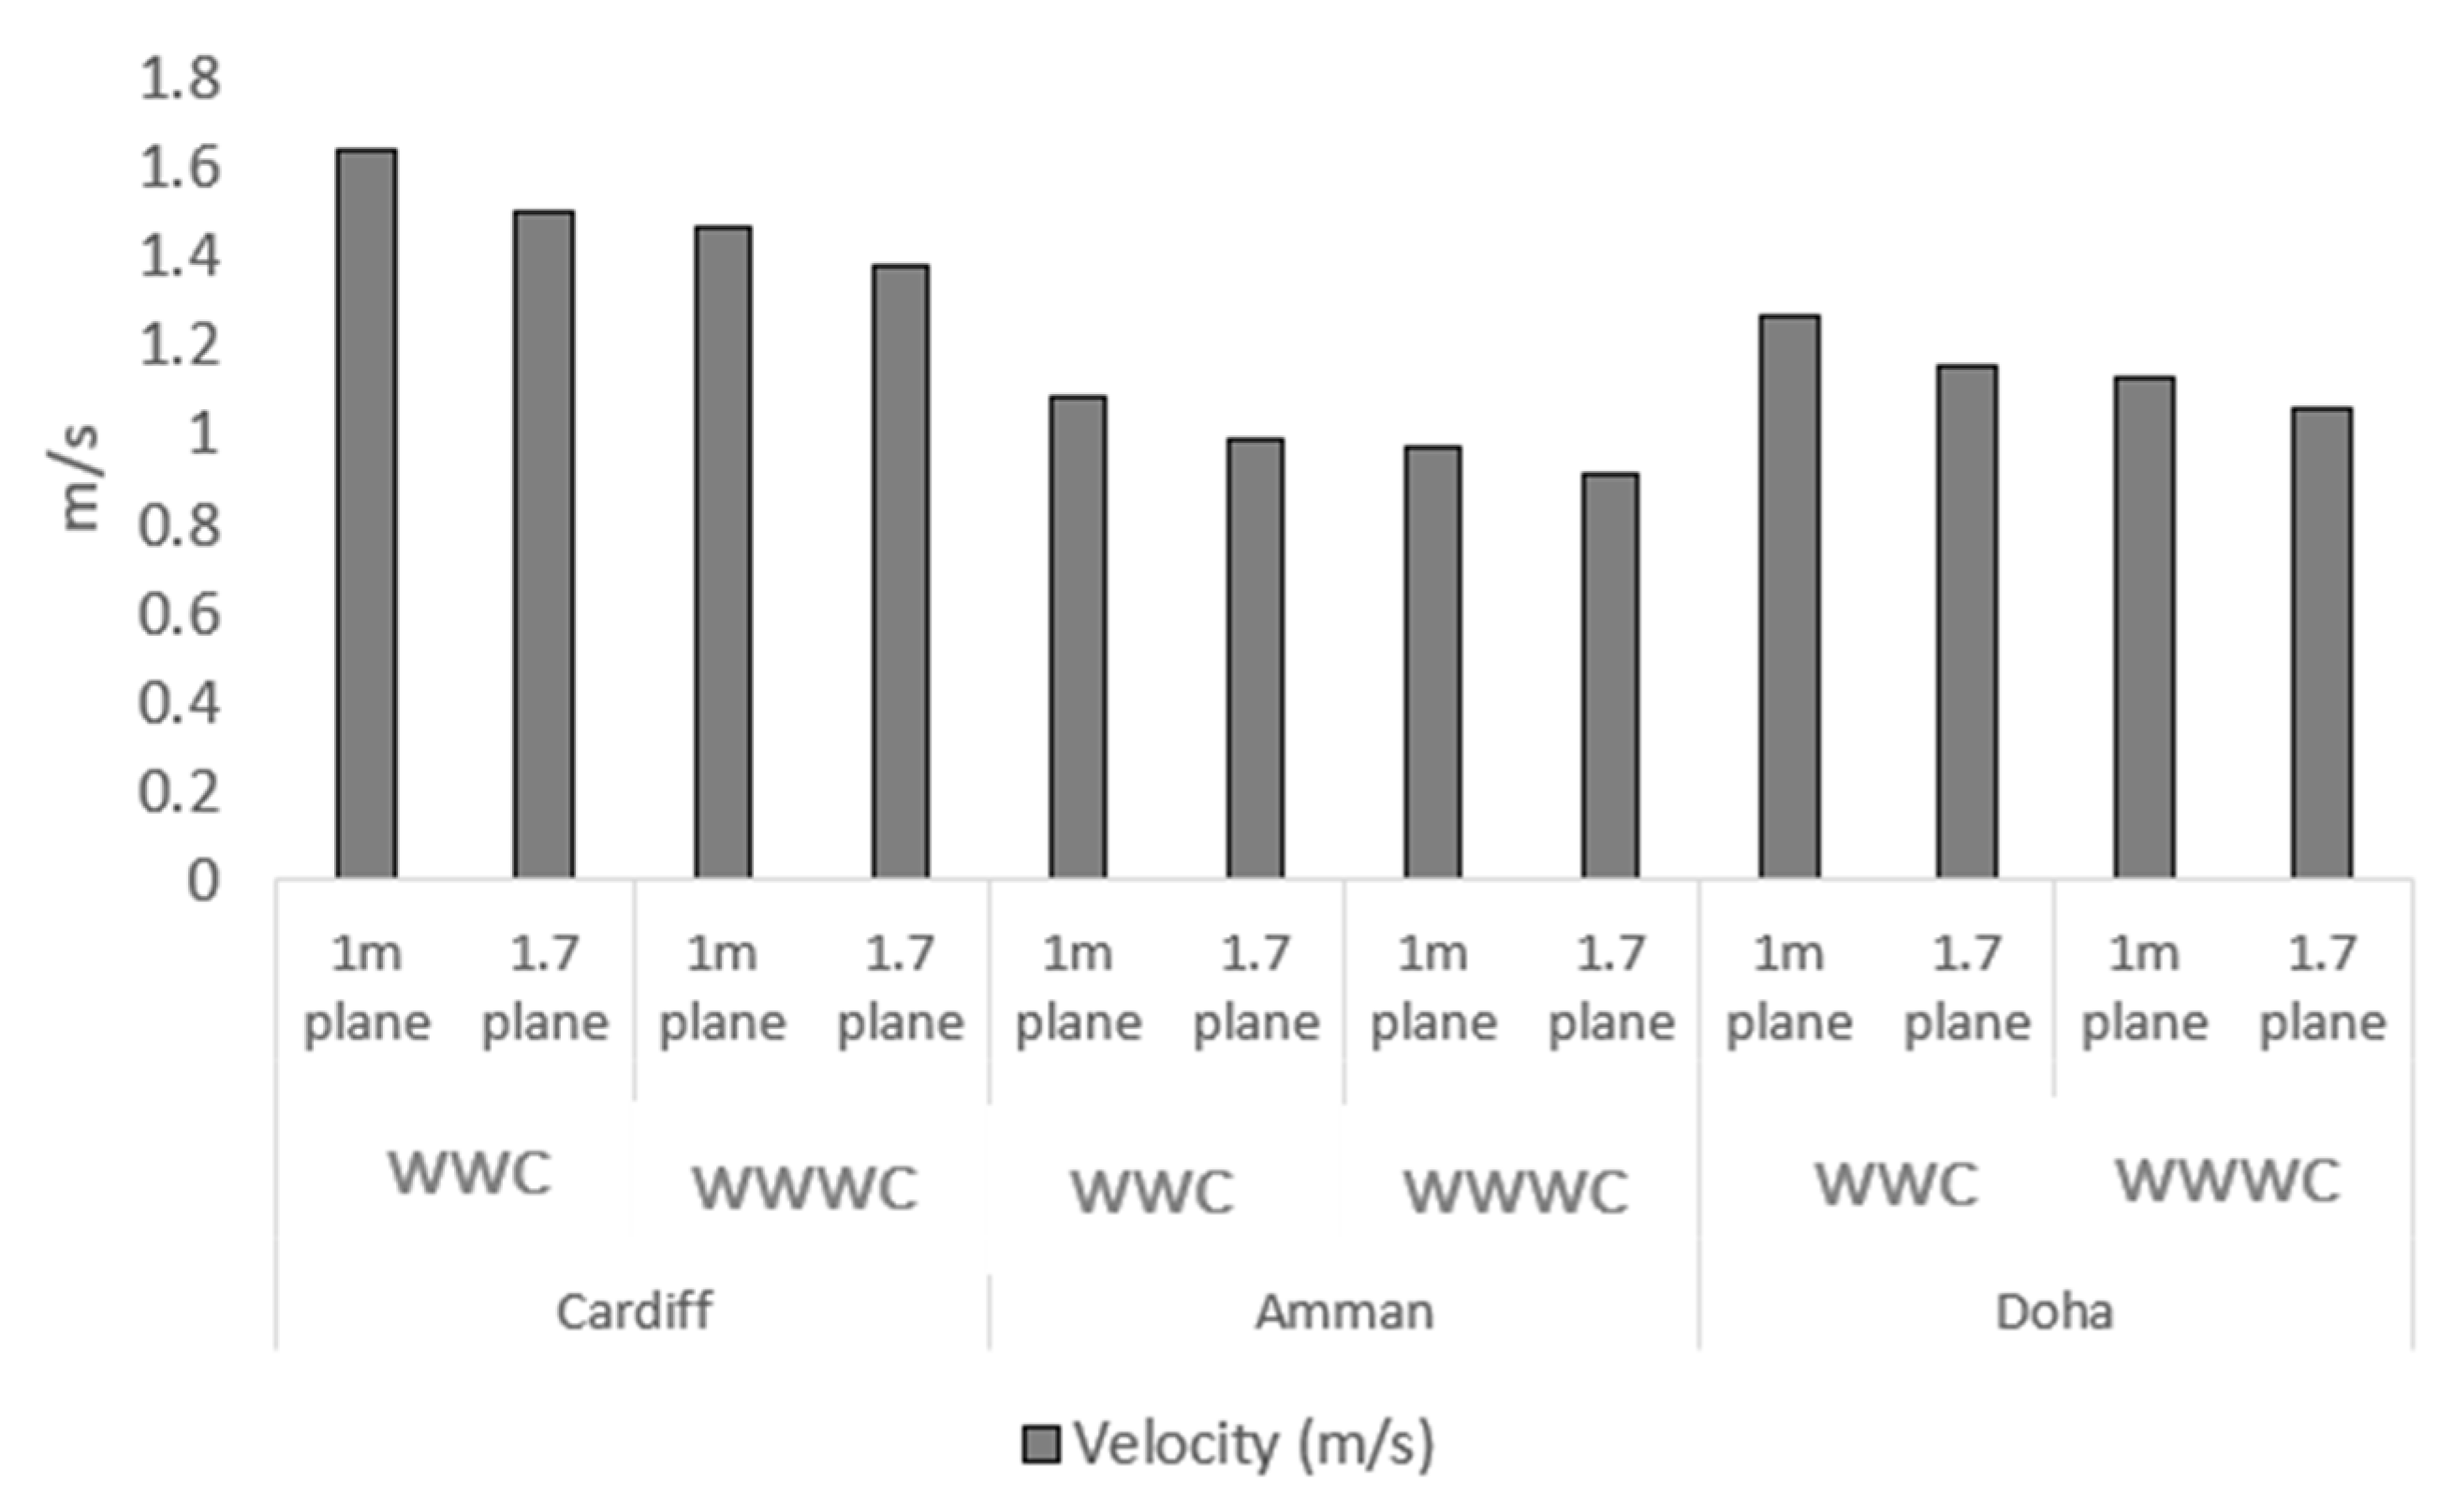
This can be achieved by increasing the ventilation rate while ensuring minimal turbulence. Increasing the ventilation rate is primarily achieved by increasing air velocity; however, as the turbulence kinetic energy is dependent on the air velocity, improving the ventilation rate could potentially increase the turbulence kinetic energy. Therefore, it is crucial to ensure that the increase in the turbulence kinetic energy is kept sufficiently low as the velocity increases.
Portable air cleaners, also known as air purifiers or air sanitizers, are designed to filter the air in a single room or area [20]. Central furnace or HVAC filters are designed to filter air throughout a home. Portable air cleaners and HVAC filters can reduce indoor air pollutants, including viruses, that are airborne [20]. By themselves, portable air cleaners and HVAC filters are not enough to protect people from the virus that causes COVID-19 [20]. Air purifiers could be placed in regions of high turbulence kinetic energy. Hence, such regions shall be carefully identified in order to formulate recommendations on the use of air purifiers. Placing air purifiers in high turbulence kinetic energy regions will: (1) ensure that the highest air flow rate is entering the air purifier; and (2) prevent the building’s residents to occupy those locations.
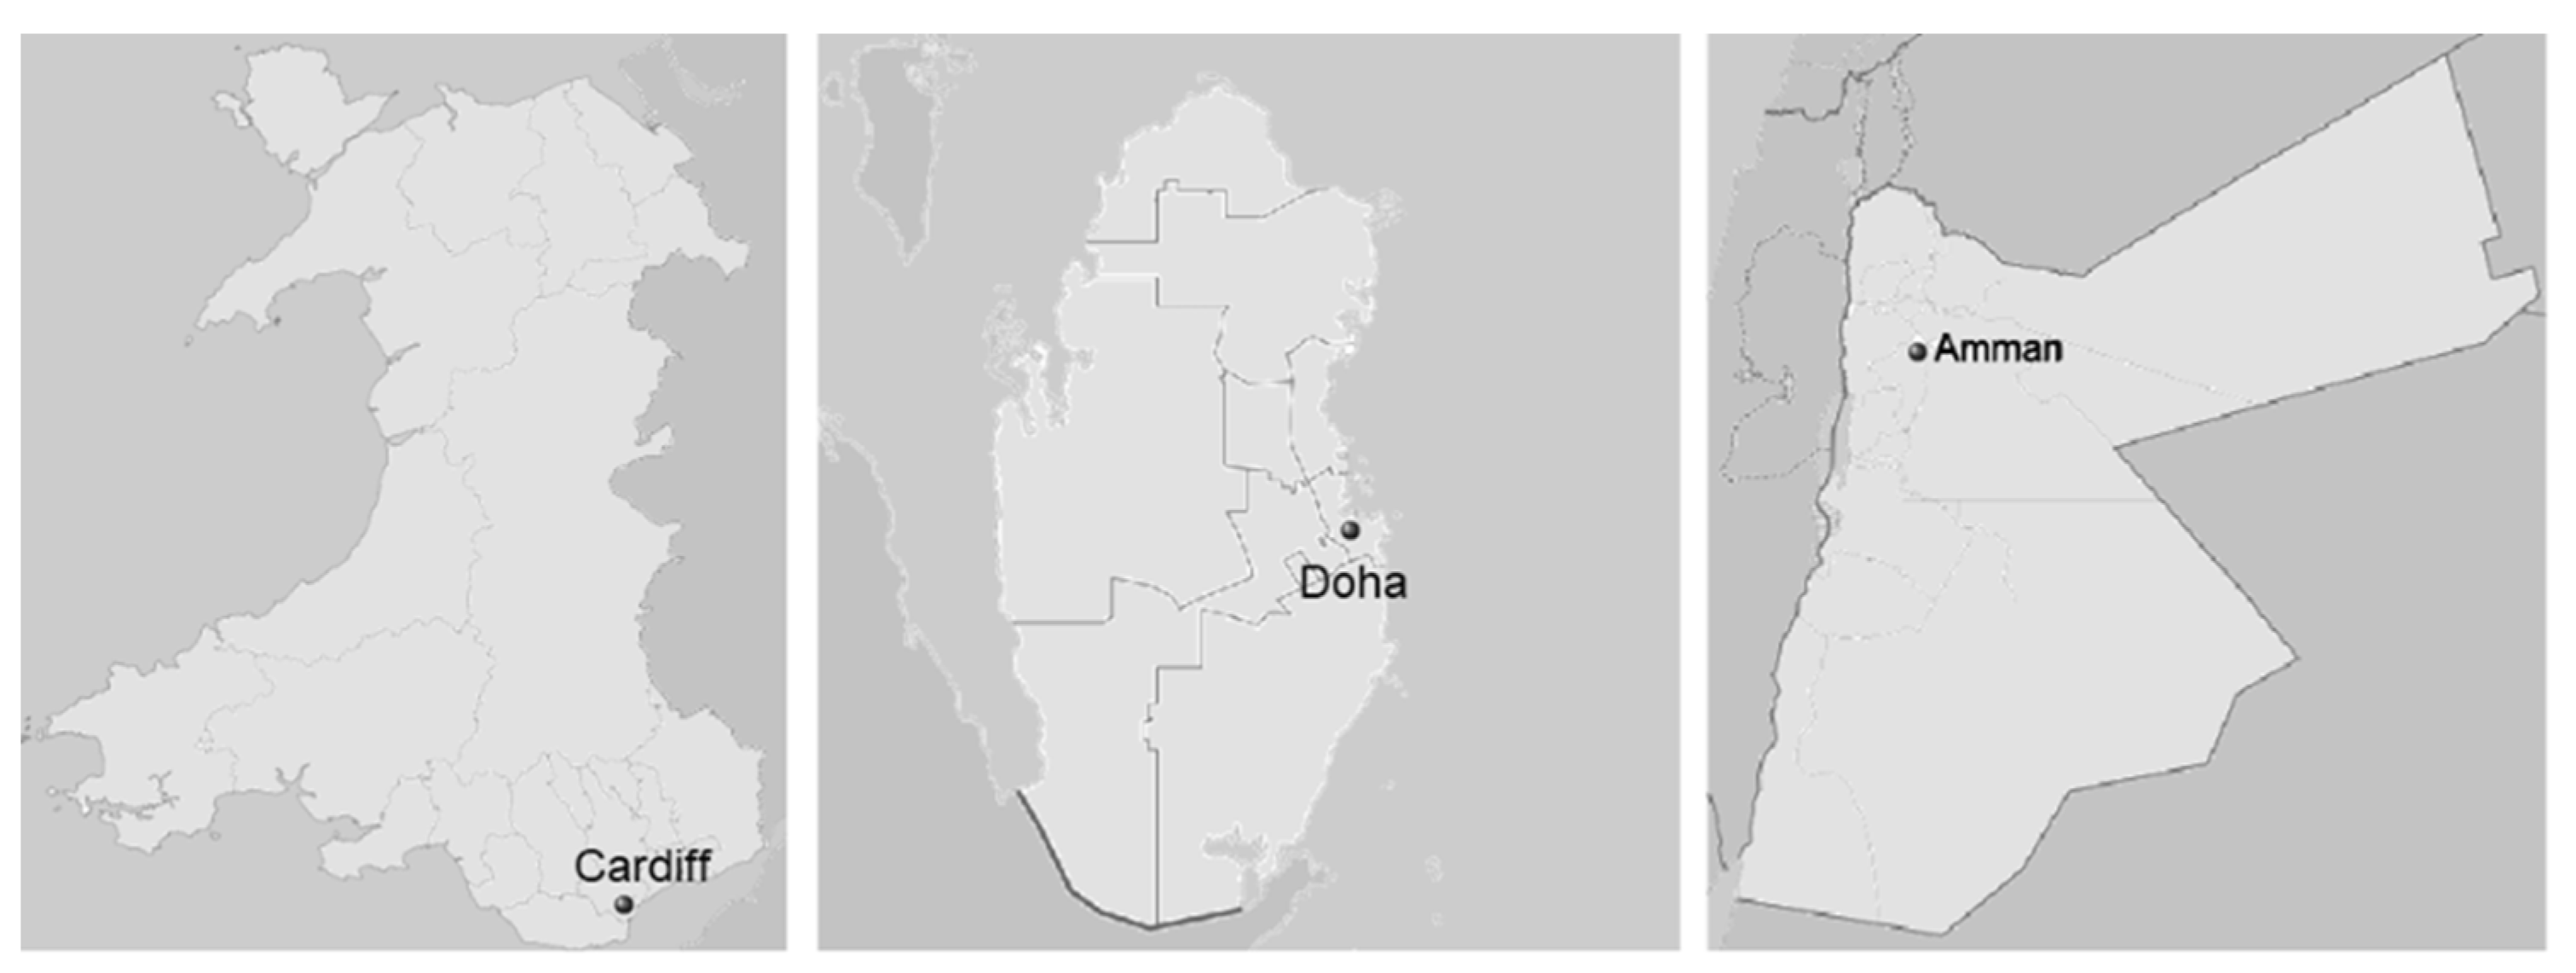
We outline the structure of the paper. The Introduction provides the rationale of the research, the benefits of implementing passive design techniques such as natural ventilation, the context of using the windcatcher natural ventilation system, our goals and objectives, and an overview of the used methodology. The Material and Methods section provides more detailed information about the proposed window windcatcher, building geometry, and the geographical locations of the three cities we study (Amman, Doha and Cardiff). In addition, this section provides information about the CFD method, software, sensitivity analysis, and inlet and outlet boundary conditions. The Results section consists of a qualitative and a quantitative part. The qualitative part presents visual comparisons of a case without or with a window windcatcher device, respectively. The comparison includes the turbulence kinetic energy, velocity, and velocity streamlines for the three selected cities, on selected planes of interest. The quantitative part shows the simulations with and without a window-windcatcher and the device’s effect on the actual-to-required ventilation ratio. In the Discussion section, we present the effect of the windcatcher on the IAQ. In addition, potential locations for deploying air purifiers in indoor spaces are discussed. Lastly, the Conclusions section presents the key results; the window-windcatcher increases the actual-to-required ventilation ratio as per the ASHRAE standards by up to 9%.

2. Materials and Methods

2.1. Description of the Window-Windcatcher and of the Building

To examine the efficiency of the proposed window-windcatcher device, a simplified building model representing a typical single-family house is used—see Figure 1. This building model was used in several studies to investigate natural ventilation and passive cooling in Jordan [21]. For example, it was used to examine the efficiency of the Solar-Wall system (combination of Trombe wall and solar chimney) on enhancing indoor thermal comfort [21]. The selected room dimensions are 4 m × 3 m × 2.7 m (length × width × height), so the floor area is 12 m2, and the volume is 32.4 m3. The external window of the room is 2 m in width, 1 m in length, and 1 m in sill height, with a total window-to-wall ratio of 18%. The window has an operable sliding glazing mechanism that allows up to 50% of its total area to be opened.
The proposed window-windcatcher aims to enhance natural ventilation in a particular room and in the whole residential unit—see Figure 1. The device is to be mounted on the envelope of existing or new buildings with minimal changes on the building shape or structure. Hence, the device could be used as a passive retrofitting technique. The design could be further developed to take into account requirements about privacy, daylighting, and aesthetic issues. Generally, as illustrated in Figure 2, the device consists of four vertical supporting elements (joists) that connect two horizontal planes, an upper and a lower plane. The distance between the upper and the lower plane is equal to the height of the window opening, in this case 1 m. The device consists of four fins (1 m height × 0.15 m width × 0.02 m thickness) tilted by 45 degrees located at the outside edge of the device and one curved element that spans from a point near the last fin in the group into the right internal corner of the two planes. The fins and the curved element are mounted between the two planes supported by the four supporting elements at the four corners of the horizontal planes. The aim is that the prevailing wind will be captured and pass through the device opening on the shorter side opposite the curved element and the areas between the tilted fins.
The vertical curved plane aims at enhancing the captured airflow toward the interior spaces. The tilting angle could be optimized by running the simulation for different angles; this is outside our research scope. Moreover, other issues could be investigated in future work, such as daylighting performance, privacy, and the finishing materials used for the various components of the proposed device.

2.2. Case Studies

The proposed window-windcatcher‘s performance has been evaluated against a control case without a window-windcatcher, in three geographical locations: Cardiff, Doha and Amman—see Figure 3. The three cities are located within three different climatic zones: Amman in a hot-summer Mediterranean climate, Doha in a hot desert climate and Cardiff is in an Oceanic climate. The Total Wind Velocity (TWV) and temperature in each city have been obtained for 2021 [22]. The average temperature and TWV have been evaluated and plotted in Figure 4. We find, respectively, for Cardiff, Doha and Amman, these values to be [10.7 °C, 5.45 m/s], [27.8 °C, 4.2 m/s], and [22.3 °C, 3.6 m/s].
As shown in Figure 5, the orientation of the building with respect to the direction of the average TWV is simulated for equal shear (SWV) and normal (NWV) wind velocity components (i.e., 3.85 m/s, 2.97 m/s and 2.55 m/s for Cardiff, Doha and Amman, respectively). The velocity components have been estimated, according to [23], as follows:
SWV 2 = NWV 2 = TWV 2 2

2.3. CFD Simulations

CFD simulations of the airflow passing through the proposed window-windcatcher were performed with the ANSYS 2020 CFX package [24]. We used a virtual machine with computational capabilities of Processor Intel® Core™i7-7700 CPU @ 3.6 Hz, installed memory 32 GB and a 64-bit operating system. The computational time was approximately 12 h for each case study. The geometry of the building was modelled and loaded into ANSYS. The building model was created using the Boolean algorithm (i.e., the solid domain is subtracted from the internal and external fluid domain [25]—see Figure 5. Figure 6 shows the computational mesh for these domains, created with approximately 2.19 × 10 6 elements.
Performing experiments with the novel windcatcher is not currently possible as the device has not been manufactured. In fact, the focus of the work is generating CFD simulations that are as accurate as possible in order to assess this device before proceeding to manufacture it. We establish the accuracy of the simulations through performing mesh-sensitivity analysis for the building that ensures that the findings are independent of the mesh size. The WWC CAD model is created using AutoCAD. This approach has been adopted in our previous studies [26,27]. Figure 7 shows how the number of elements was determined following mesh sensitivity analysis. The mesh sensitivity study was done for the Amman case study using an average velocity across an interior plane with an offset of 1.7 m from the floor, which is around the average person’s height [28]. At around 9.4 × 10 5 elements, the results do not change with the mesh size. Nevertheless, a much finer mesh with 2.19 × 10 6 elements was chosen for the simulation to give a high level of confidence and accuracy. In addition, the relative error to the selected mesh size has been estimated and shown to decrease when the mesh size decreases—see Figure 7. The velocity values converged with a relative error margin of 1%.
Furthermore, the mesh quality (Table 1) is consistent with previous studies [27,28,29]. The mesh is exported to CFX-PRE.
Using the k-ε turbulent flow model, we proceed with a steady-state analysis to determine the average velocities [27,28,29]. The fluid domain was chosen from the ANSYS library as air at 10.7 °C, 27.8 °C and 22.3 °C corresponding to the Cardiff, Doha and Amman case studies, respectively (as discussed in Section 2.2). The no-slip boundary conditions were implemented in ANSYS as ‘No Slip Walls’ [27,28,29].
The goal of this study is to demonstrate that the ventilation rate in an indoor space increases when we use the novel window-windcatcher. According to the World Health Organization (WHO), viral diseases, such as COVID-19, can be more easily transmitted in poorly ventilated enclosed spaces which have low ventilation rates [19].
Finally, the inlet boundary conditions (as specified in Figure 5) were set to velocity inlets with a turbulence intensity of 5% (default setting in ANSYS).
The Turbulence Kinetic Energy (k) is a proxy for the flow mixing level [26,29]. TKE has been chosen as a quantity to study in this work since COVID-19 spread increases with mixing. Equations (2)–(5) [26,29] give TKE:
k = 3 2 ( U I ) 2
ε = c μ 3 4 k 3 2 l 1
I = 0.16 R e 1 8
l = 0.07 L  
We plot TKE in ANSYS CFX. In addition, the performance of the window-windcatcher in preventing the spread of COVID-19 by increasing the ventilation rate has been evaluated against the required ventilation rate ( Q required ) as per the ASHRAE standards [30]. The acceptable ventilation rate in residential buildings, as defined by the ASHRAE standards, is given in Equation (6) [30]. The convergence of the results is shown in Figure 8.
The actual ventilation rate ( Q actual ) has been estimated computationally using ANSYS, and the ventilation performance has been benchmarked by the actual-to-required ventilation ratio ( n Q ), Equation (7) [30]:
Q required = 0.15 A f l o o r + 3.5 ( N b r + 1 )
  n Q = Q actual / Q required
The streamlines and contours of the velocity and TKE for the entire fluid domain are plotted in Figure 9, Figure 10, Figure 11 and Figure 12. In addition, as shown in Figure 5, data have been displayed at two distinct heights (1.7 m and 1 m) for four planes (two planes for the internal domain and two for the external domain): the first height is 1.7 m above the floor (i.e., the breathing level of an average person [26]). The second is at the height of 1 m above the ground, which is about the same as the height of a sitting person.

3. Results

3.1. Qualitative Analysis

As discussed in Section 2, we show how the novel window-windcatcher device we propose could increase the IAQ and hence mitigate the spread of COVID-19 indoors. This is essentially achieved by increasing the ventilation rate while ensuring minimal turbulence. Increasing the ventilation rate is primarily achieved by increasing air velocity; however, as the turbulence kinetic energy increases with the air velocity, increasing the ventilation rate would increase the turbulence kinetic energy.
Therefore, it is crucial to ensure that the increase in the turbulence kinetic energy is maintained at a low value. In addition, regions of high turbulence kinetic energy shall be carefully identified to inform other potential mitigations, for example placing air purifiers in relatively high turbulence regions. Therefore, the turbulence kinetic energy of the interior plane has been plotted for the 1 m (the average height for a seated person) and 1.7 m (the average height for a standing person) planes (Figure 9 and Figure 10, respectively) for the three locations of interest (Cardiff, Doha and Amman).
As shown in Figure 10 for Cardiff, the window-windcatcher has slightly increased the TKE inside the building compared to the case without the window-windcatcher. On the other hand, this increase was less significant in Doha and Amman. This is attributed to the lower levels of wind velocity in Amman and Doha compared to Cardiff. Moreover, as shown in Figure 9, Regions A and B, the high-turbulence regions are located at the building corners while the central region (Region C) remains approximately unaffected.
By comparing the turbulence kinetic energy profiles at the 1 m plane (Figure 9) to those at the 1.7 m plane (Figure 9 and Figure 10), it can be seen that the turbulence energy is higher at the 1.7 m plane (i.e., Region A in Figure 9 to Region D in Figure 10). Hence, Regions D and E could be good locations to place air purifiers.
The velocity profile of the interior plane has been plotted for the 1 m and 1.7 m planes (Figure 11 and Figure 12, respectively) for Cardiff, Doha and Amman. As shown in Figure 11, the window-windcatcher has increased the air velocity inside the building compared to the case without the window-windcatcher (i.e., Region F in Figure 12 compared to Region G in Figure 11). In addition, by comparing Regions F and G, it can be noted that the window-windcatcher has directed the air velocity towards the centre compared to the case without the window-windcatcher, where air velocity tends to be more attached to the building’s wall. This essentially indicates the window-windcatcher’s capability in vectoring the shear wind towards the building’s centre—thus increasing the ventilation rate.
Comparing the velocity profiles of the three case studies, the Cardiff case demonstrates higher velocity levels than Doha and Amman. This is directly related to the fact that the wind velocity in Cardiff is higher than in Doha and in Amman. By comparing the velocity profiles at the 1 m plane to those at the 1.7 m plane (Figure 11 and Figure 12, respectively), while Region F in the 1 m plane (Figure 11) follows approximately the same profile as the velocity at the 1.7 m plane (Region I in Figure 12), Region H in the 1 m plane (Figure 11) differs from that in the 1.7 m plane (Region J in Figure 12). Region H has a more consistent velocity magnitude compared to Region I, where a drop in the magnitude of the velocity has been demonstrated.
The streamlines at the interior plane have been plotted for the 1 m and 1.7 m planes (Figure 13 and Figure 14, respectively) for Cardiff, Doha and Amman. Streamlines are the fluid particle paths. Thus, they provide a visualization of the distribution of the air in the space. The locations with minimal velocities are also identified. These correspond to the regions with lower likelihood of spreading airborne viruses, such as SARS-CoV-2 [16,17]. Those locations correspond to the points where the velocity magnitude gradually decreases to approximately 0 m/s. Those locations are defined here as the near-zero-velocity regions. Correlating these regions to the potential of deploying air purifiers, it is recommended to avoid choosing those locations as those locations correspond to ‘safe’ regions. On the other hand, air purifiers could be deployed at locations with high velocity to maximise the airflow rate enters the air purifiers. As shown in Figure 13 and Figure 14, the centre of safe near-zero-velocity regions (SNZVR) has been identified for the 1 m and 1.7 m planes, respectively.
In addition, a 70% household limit of the maximum velocity has been used to propose the locations to deploy air purifiers. Those locations have been defined as the air-purifier regions (APR). As shown in Figure 13 and Figure 14, the streamline patterns at the 1 m follow closely the patterns in the 1.7 m plane. However, by comparing the case with the window-windcatcher to the case without the window-windcatcher, it is noted that the SNZVR in Region K without the window-windcatcher (Figure 12) is split into two smaller SNZVR when the window-windcatcher is deployed (Region L). This is attributed to the fact that the window-windcatcher directs the air velocity towards the center, thus splitting the SNZVR. The interaction of the interior and exterior plane streamlines has been plotted for the 1 m and 1.7 m planes (Figure 15 and Figure 16, respectively) for Cardiff, Doha and Amman. This helps us understand the interaction with the interior plane. As shown in Region M of Figure 15, the window-windcatcher has redirected the shear wind towards the interior plane of the building. However, it can be seen that some high-velocity wind streamlines (Region N) are not directed towards the internal plane of the building. This essentially suggests that the WWC design could be further optimized to enhance its aerodynamic capabilities. The WWC design optimization could include the depth of the WWC, the angles of the slanted fins and the number and thickness of the fins.
By comparing the 1 m plane in Figure 15 to the 1.7 m plane in Figure 16, we see that the streamline patterns are quite similar. Nevertheless, comparing the Cardiff case to Amman and Doha, it is noted that the velocity in the building is higher. This is due to the fact that the average wind velocity in Cardiff is higher than the other two cases of study. Another crucial point to note is that, in Region O, where the window-windcatcher has not been deployed (compare to region M), most of the shear wind streamlines are not directed towards the interior plane of the building. This suggests that the ventilation rate could be further increased by installing more than one WWC in Region O. Optimizing the number and positions of WWCs for a given space could significantly enhance the ventilation rate; this is another direction for future work.

3.2. Quantitative Analysis

Figure 16 displays the average turbulence kinetic energy of the two interior planes, 1 m and 1.7 m. It can be noted that the window-windcatcher has slightly increased the average turbulence kinetic energy at both planes, in all three cases of study. However, as discussed in Section 3.1, the turbulence kinetic energy increases in the regions that are less likely to be occupied by residents. The increase in the turbulence kinetic energy is directly caused by the increase in the velocity at those planes, as highlighted in Figure 17.
By correlating the average turbulence kinetic energy results in Figure 17 to the velocity results in Figure 18, in a case study with low average velocity (i.e., Amman), it can be noted that the window-windcatcher effect of increasing the turbulence energy is less significant than in the other two cases. This is due to the lower wind speed compared to the other two cases.
As shown in Figure 19, the ventilation rates using the window-windcatcher have increased for the three case studies compared to those without the window-windcatcher. In all three case studies, the ventilation rate using the window-windcatcher was increased by approximately 9% compared to the case without the window-windcatcher.
As discussed in Section 2, the ventilation rate has been evaluated against the required ventilation rate ( Q required ) as per ASHRAE standards [30]. The acceptable ventilation rate in the studied residential building was estimated using Equation (6) [30] (i.e., approximately 168.5 L/s). The actual ventilation rate ( Q actual ) has been estimated computationally using ANSYS, and the ventilation performance has been benchmarked by the actual-to-required ventilation ratio ( n Q ) using Equation (7) [30]. As shown in Figure 19, the window-windcatcher for Cardiff has managed to increase the actual-to-required ventilation ratio by approximately 9% compared to the case without the window-windcatcher ( n Q increased from 96.7% to 106%). For Amman and Doha, n Q has increased by approximately 6% (from 61.5% to 67.5%) and 7% (from 70% to 77.3%), respectively (Figure 20).
However, for Amman and Doha, although the actual-to-required ventilation ratio was increased using the window-windcatcher, the actual-to-required ventilation ratio is still less than 100%, that is, the actual ventilation rate is still lower than the required ventilation rate needed to fulfill the ASHRAE standards [30]. This suggests that deploying another window-windcatcher is necessary (possibly at Region O, as indicated in Figure 14). On the other hand, for Cardiff, the ASHRAE standards are fulfilled using only one window-windcatcher since the actual-to-required ventilation ratio is higher than 100% (i.e., n Q = 106%).
To investigate how the performance of the window varies with boundary conditions, the actual ventilation rates of the three cities (which correspond to three different boundary conditions of wind velocities) are plotted against the total wind velocity in Figure 21. As the wind velocity increases, the window-windcatchers performance improves. In Figure 22, we plot the actual-to-required ventilation ratio of each city against the wind velocity (TWV), which also increases as the wind velocity increases.
By utilizing the curve-fitting tool of Matlab “cftool”, we determine the relationships (8) and (9) which describe, respectively, the actual ventilation rate and the actual-to-required ventilation ratio against the wind velocity:
Q a c t = 35.75 TWV 16.9
n Q = 0.212 TWV 0.009
These relationships could then be applied to other geographical locations. In this study, we focus attention to specific regions and boundary conditions (in Amman, Doha and Cardiff); additional locations and hence boundary conditions could be investigated in future studies.

4. Discussion

The purpose of this study was to investigate, using CFD, the effectiveness of a novel window-windcatcher device that could be mounted on the exterior walls of new or existing buildings in order to capture and redirect prevailing wind into interior spaces. The proposed design could replace or supplement the typical large-scale windcatchers by utilising small-scale decentralised windcatchers on exterior walls as a window component. The suggested window-windcatcher is among the passive cooling approaches that have been shown in several studies to provide outstanding thermal comfort and indoor air quality while consuming only a fraction of the energy used by mechanical air conditioning systems [6]. Natural ventilation is one of the most popular passive cooling design strategies for improving indoor air quality and thermal comfort. The effectiveness of natural ventilation and passive cooling in buildings could be improved by using this new device, resulting in better indoor air quality and environmental comfort.
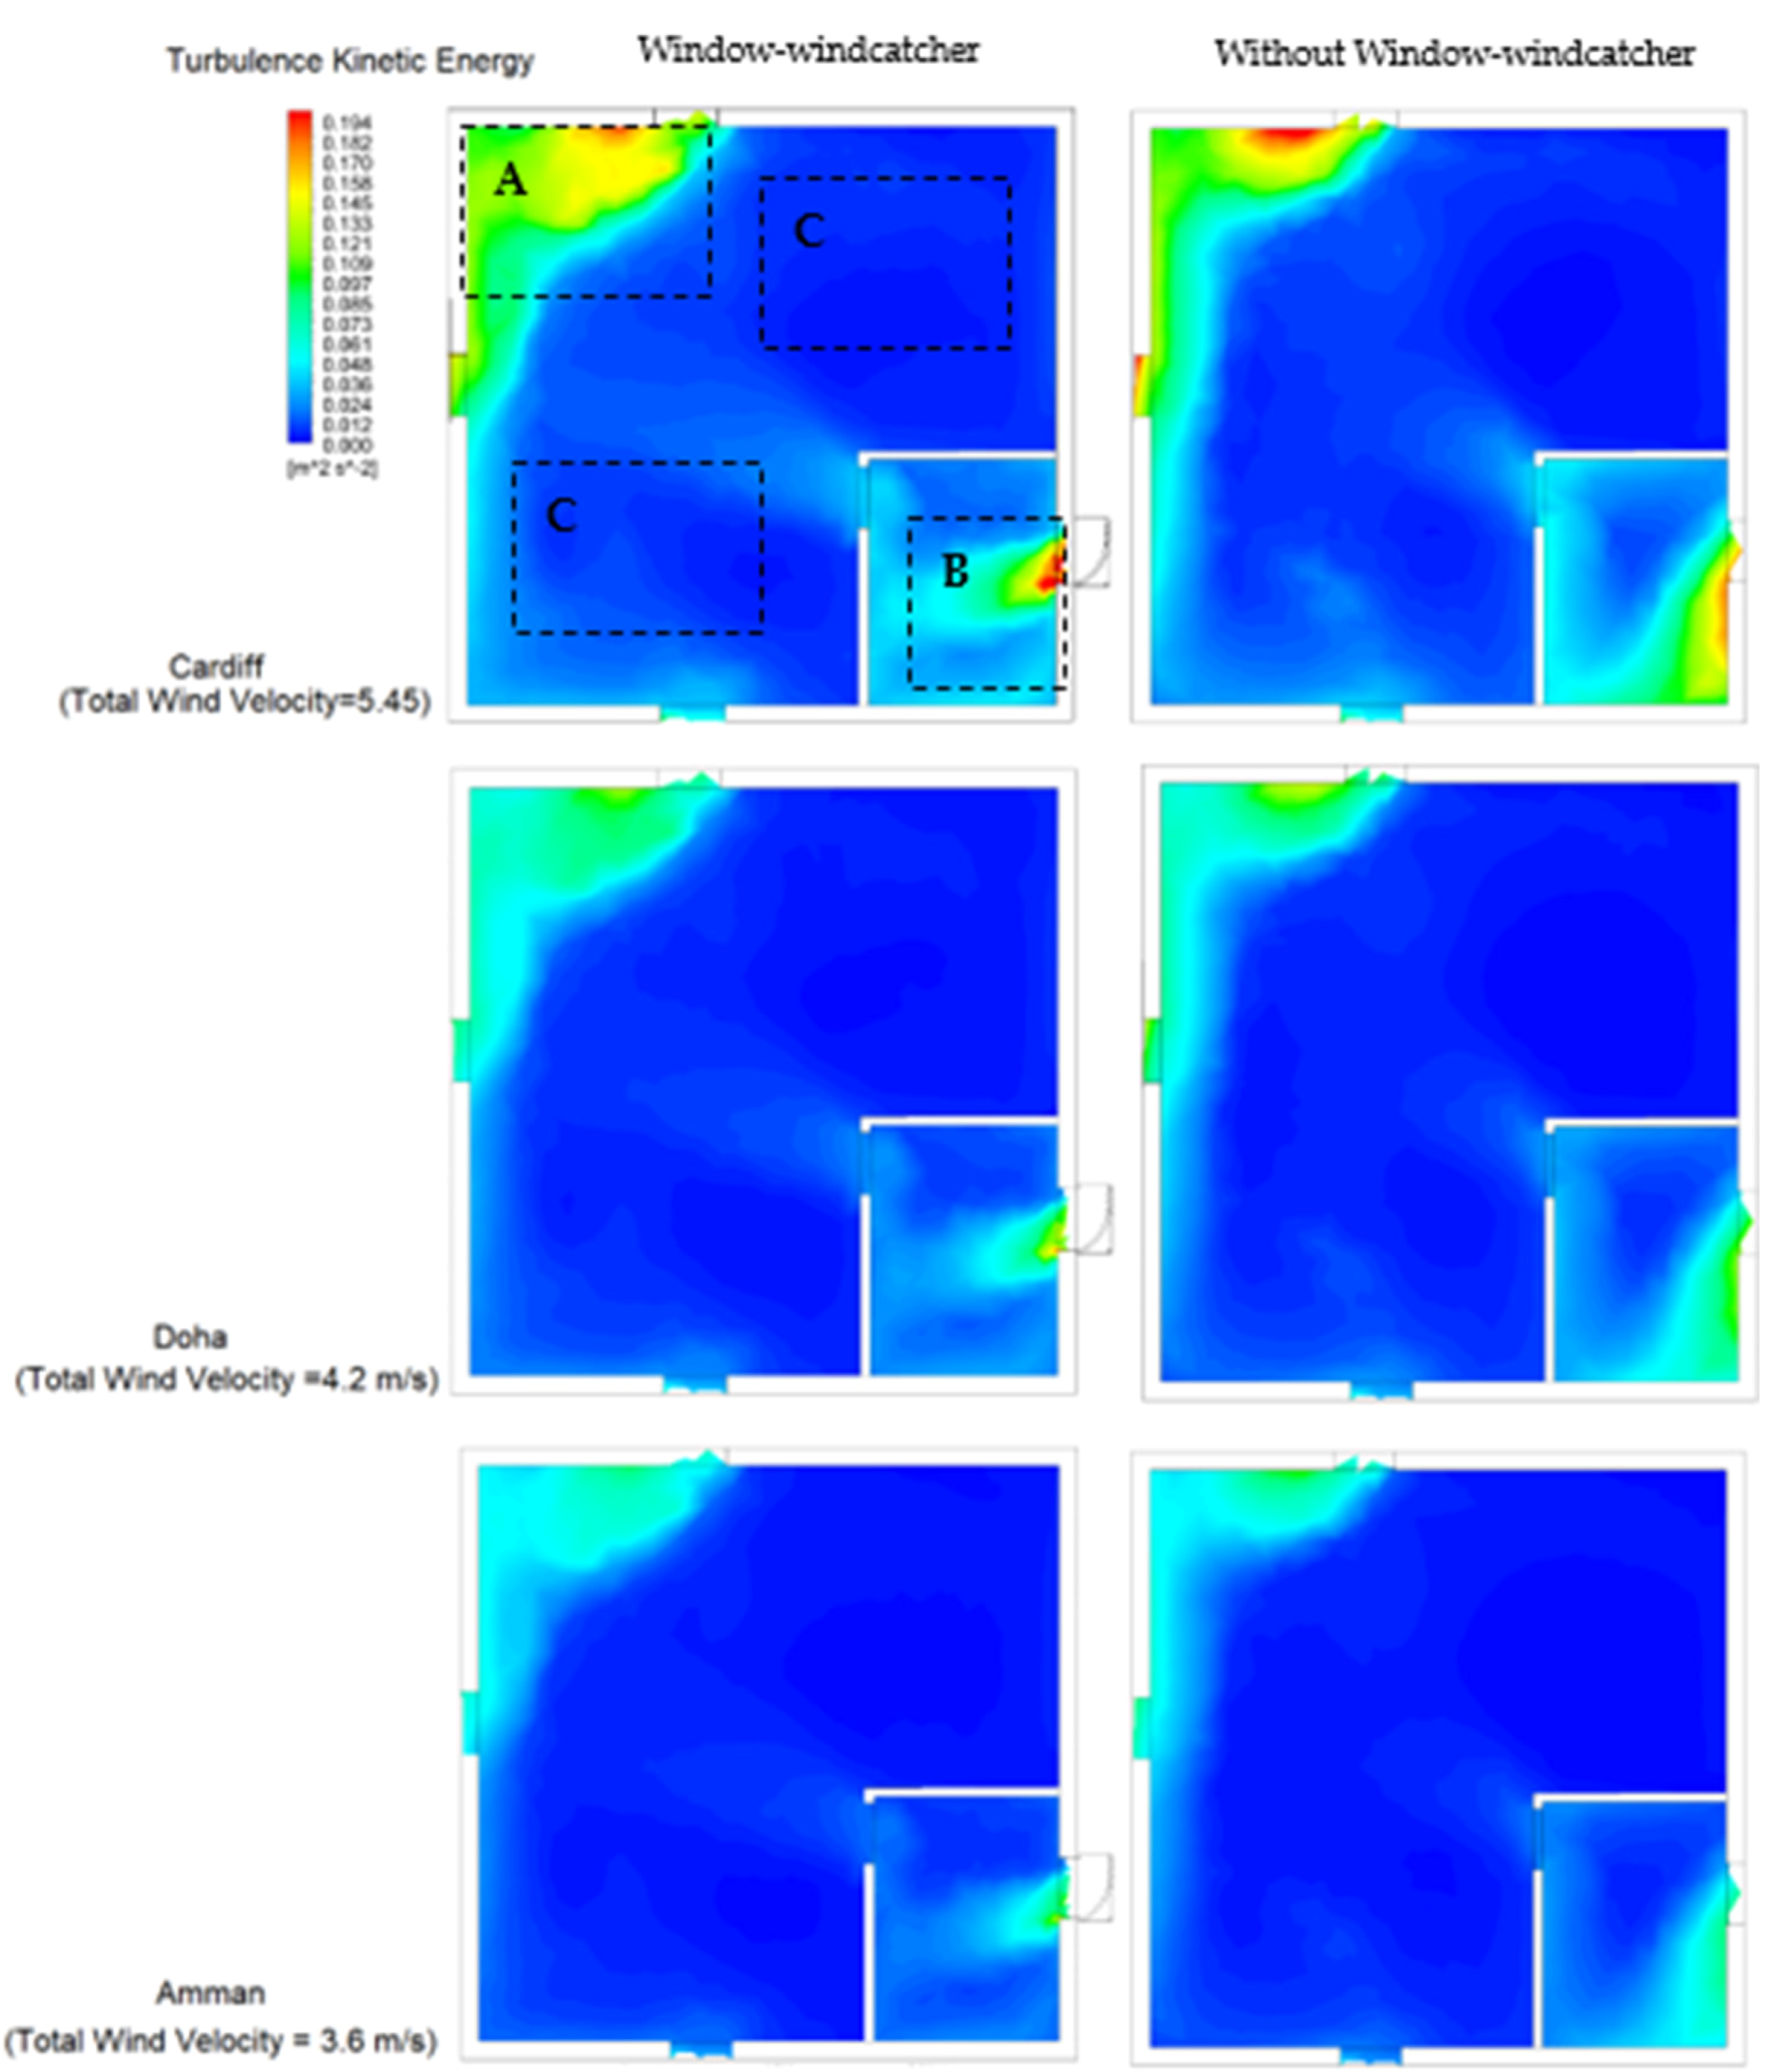
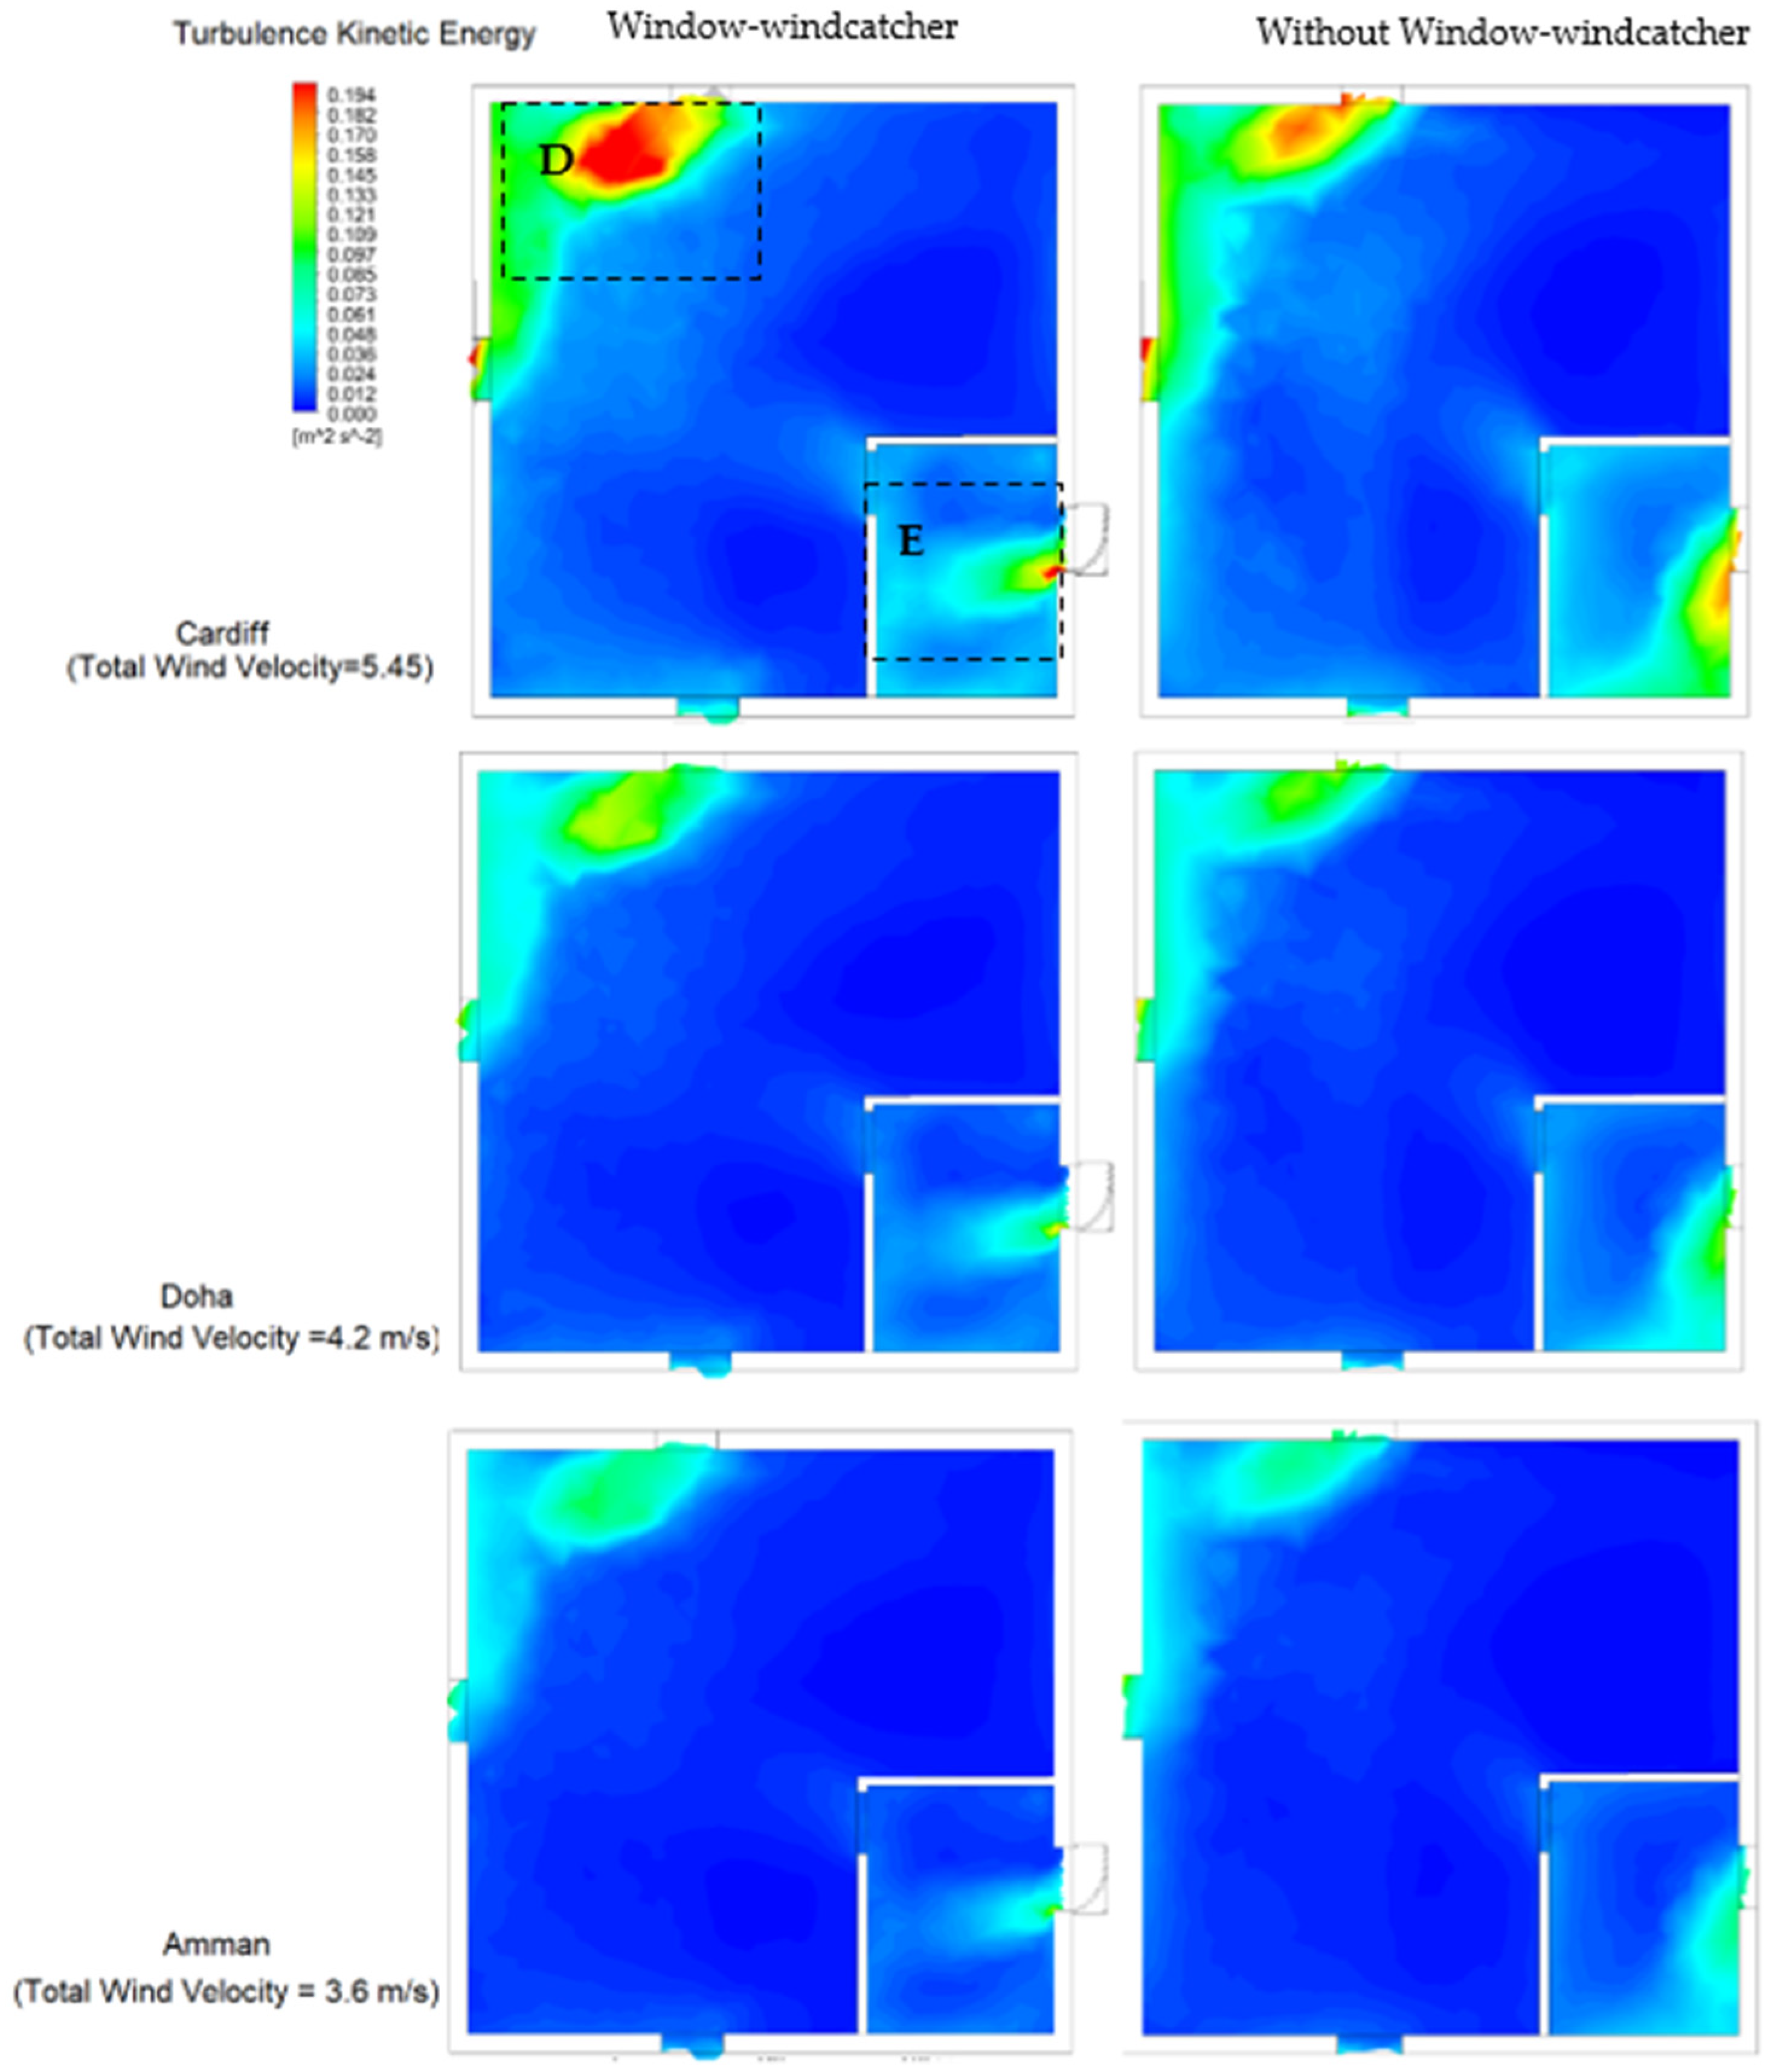
Furthermore, ensuring high indoor air quality is essential in mitigating the spread of COVID-19 and other viral diseases. Increasing air velocity is the most common way to increase ventilation rates; however, increasing ventilation rate increases turbulence kinetic energy. As a result, it is critical to keep the increase in turbulence kinetic energy as low as possible. In addition, high turbulence kinetic energy regions have been carefully identified to facilitate potential mitigation measures, such as the use of air purifiers in high turbulence/mixing areas (Figure 9 and Figure 10).
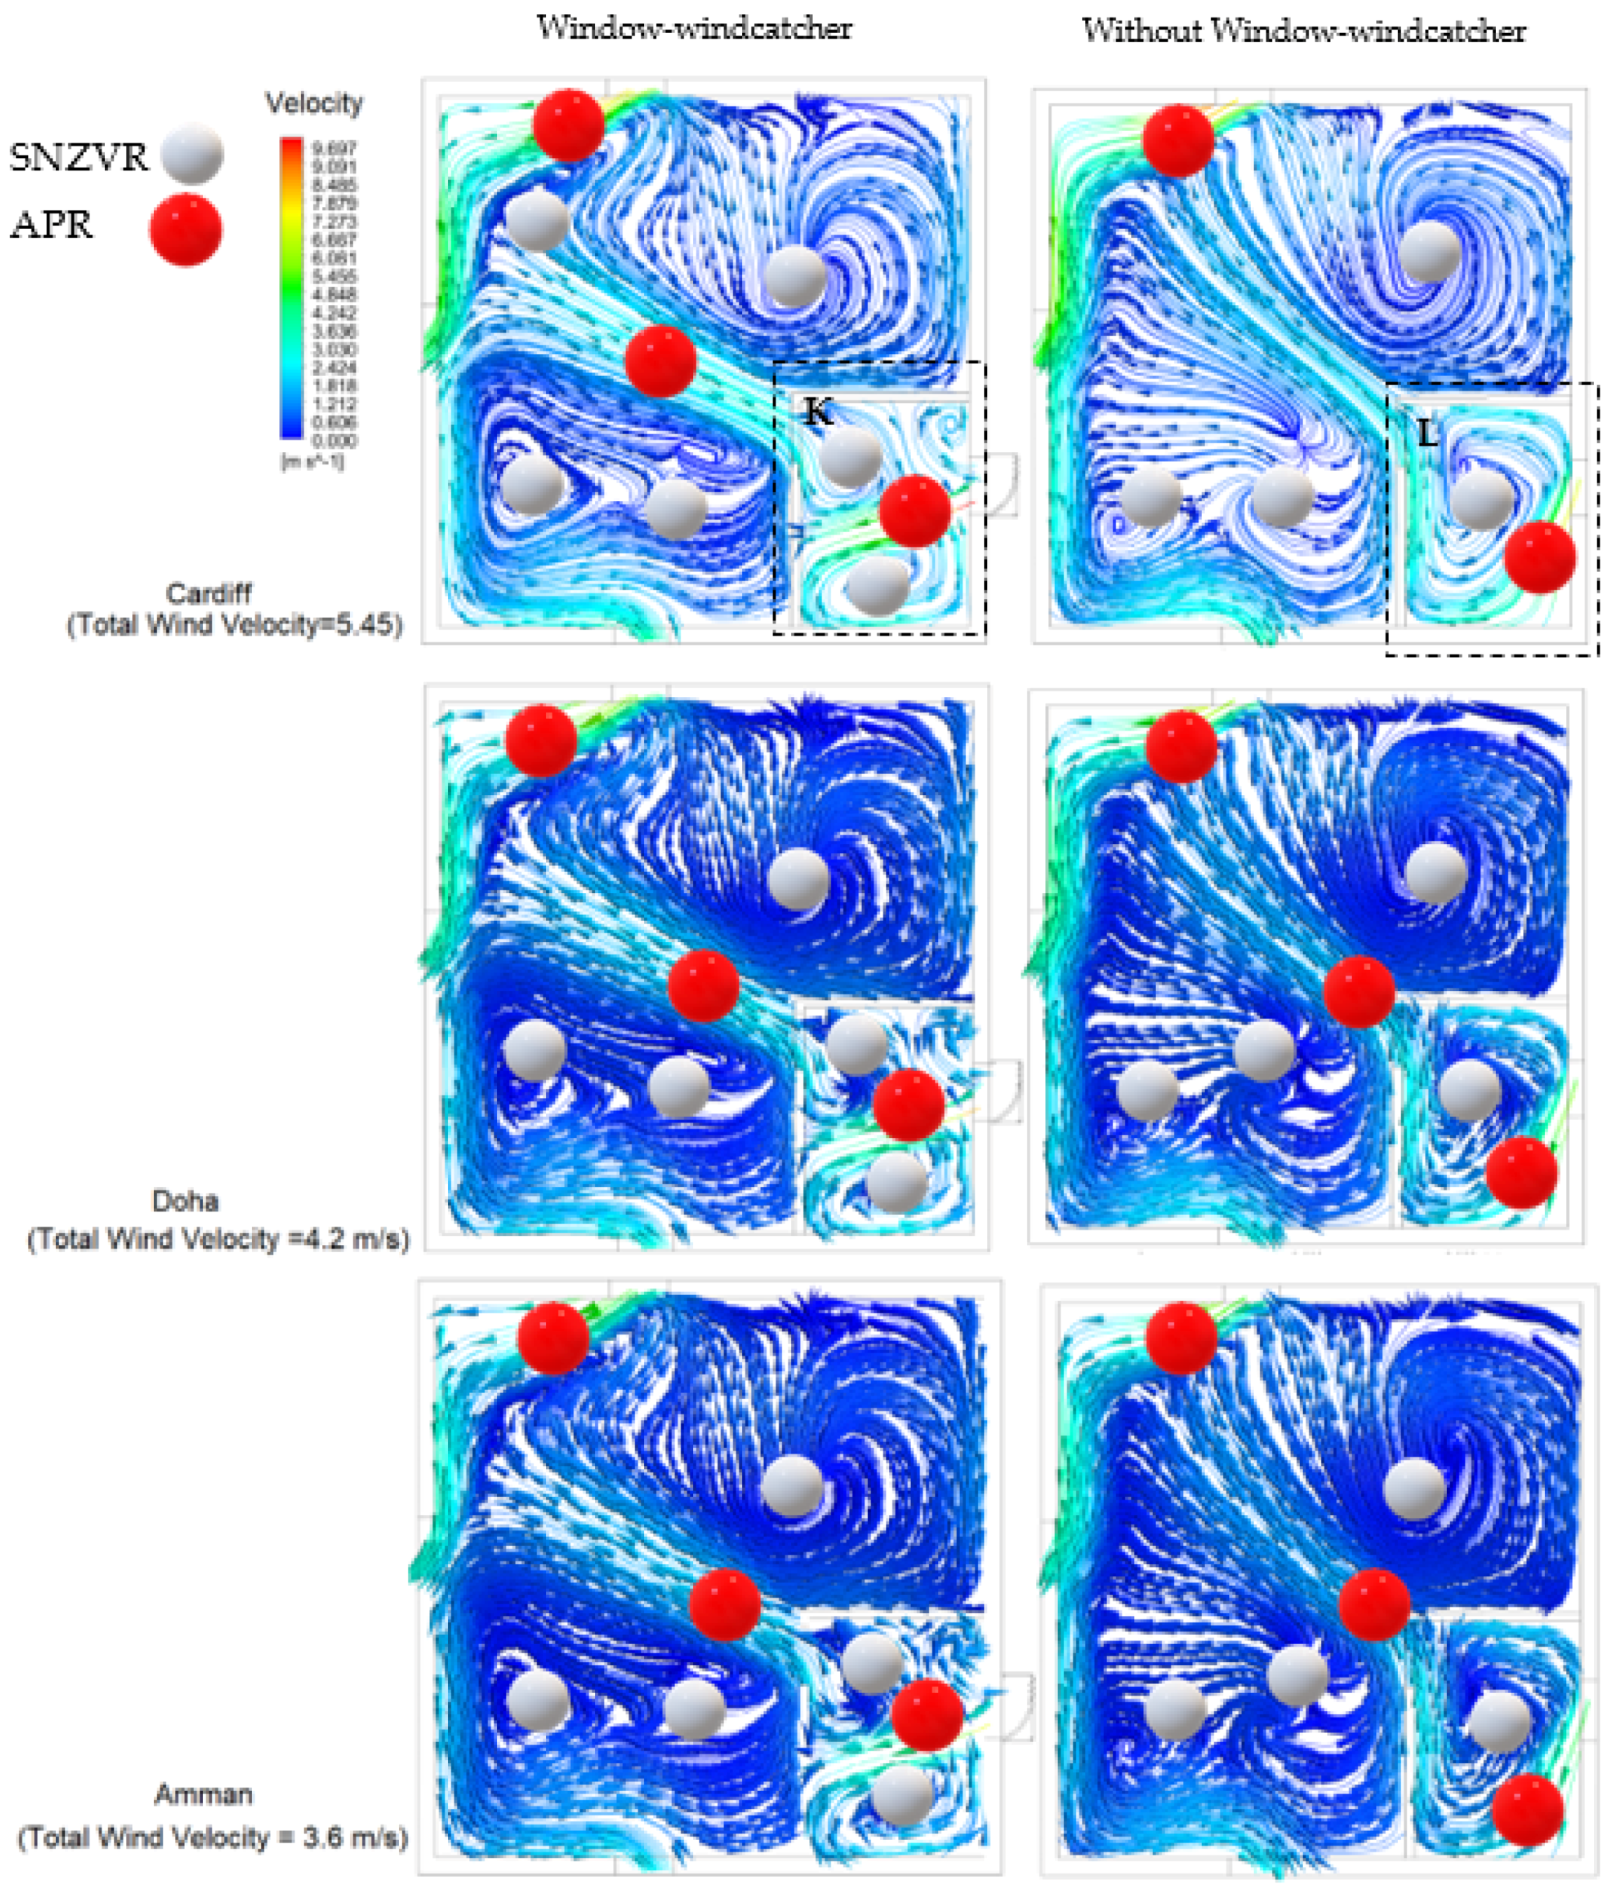
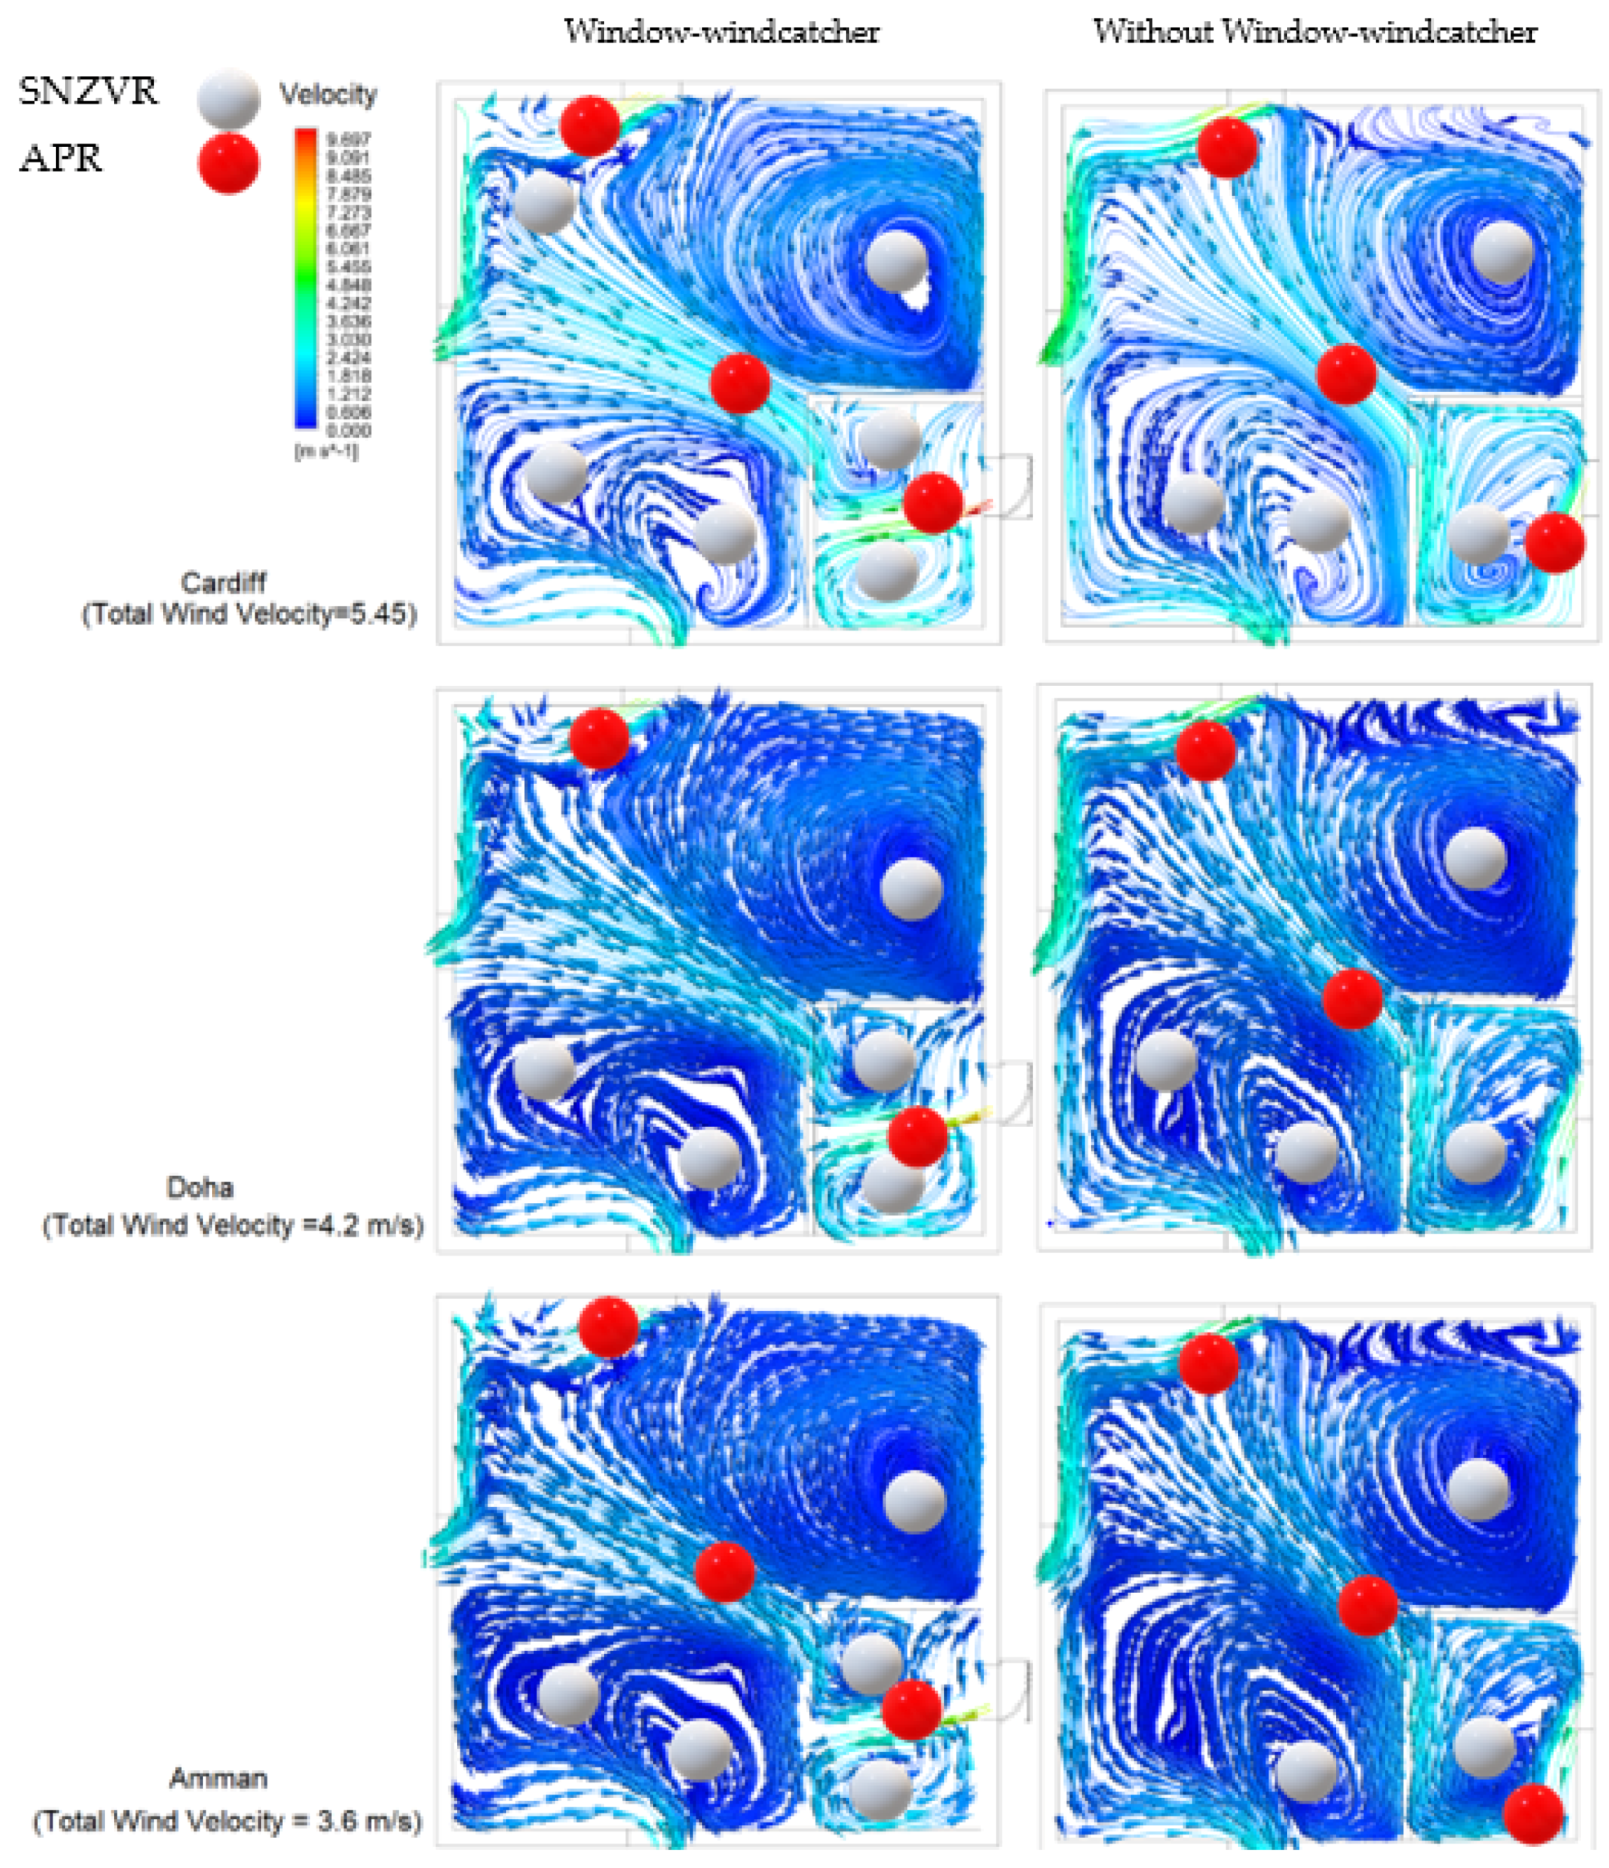
By plotting the streamlines in Figure 15 and Figure 16, the effect of the window-windcatcher on the airflow streamlines has also been evaluated. Streamlines trace fluid paths and, as a result, contribute to the understanding of the indoor air distribution. They also visualise the regions with the lowest velocities, and, therefore, with a lower risk of spreading airborne viruses like SARS-CoV-2 [16,
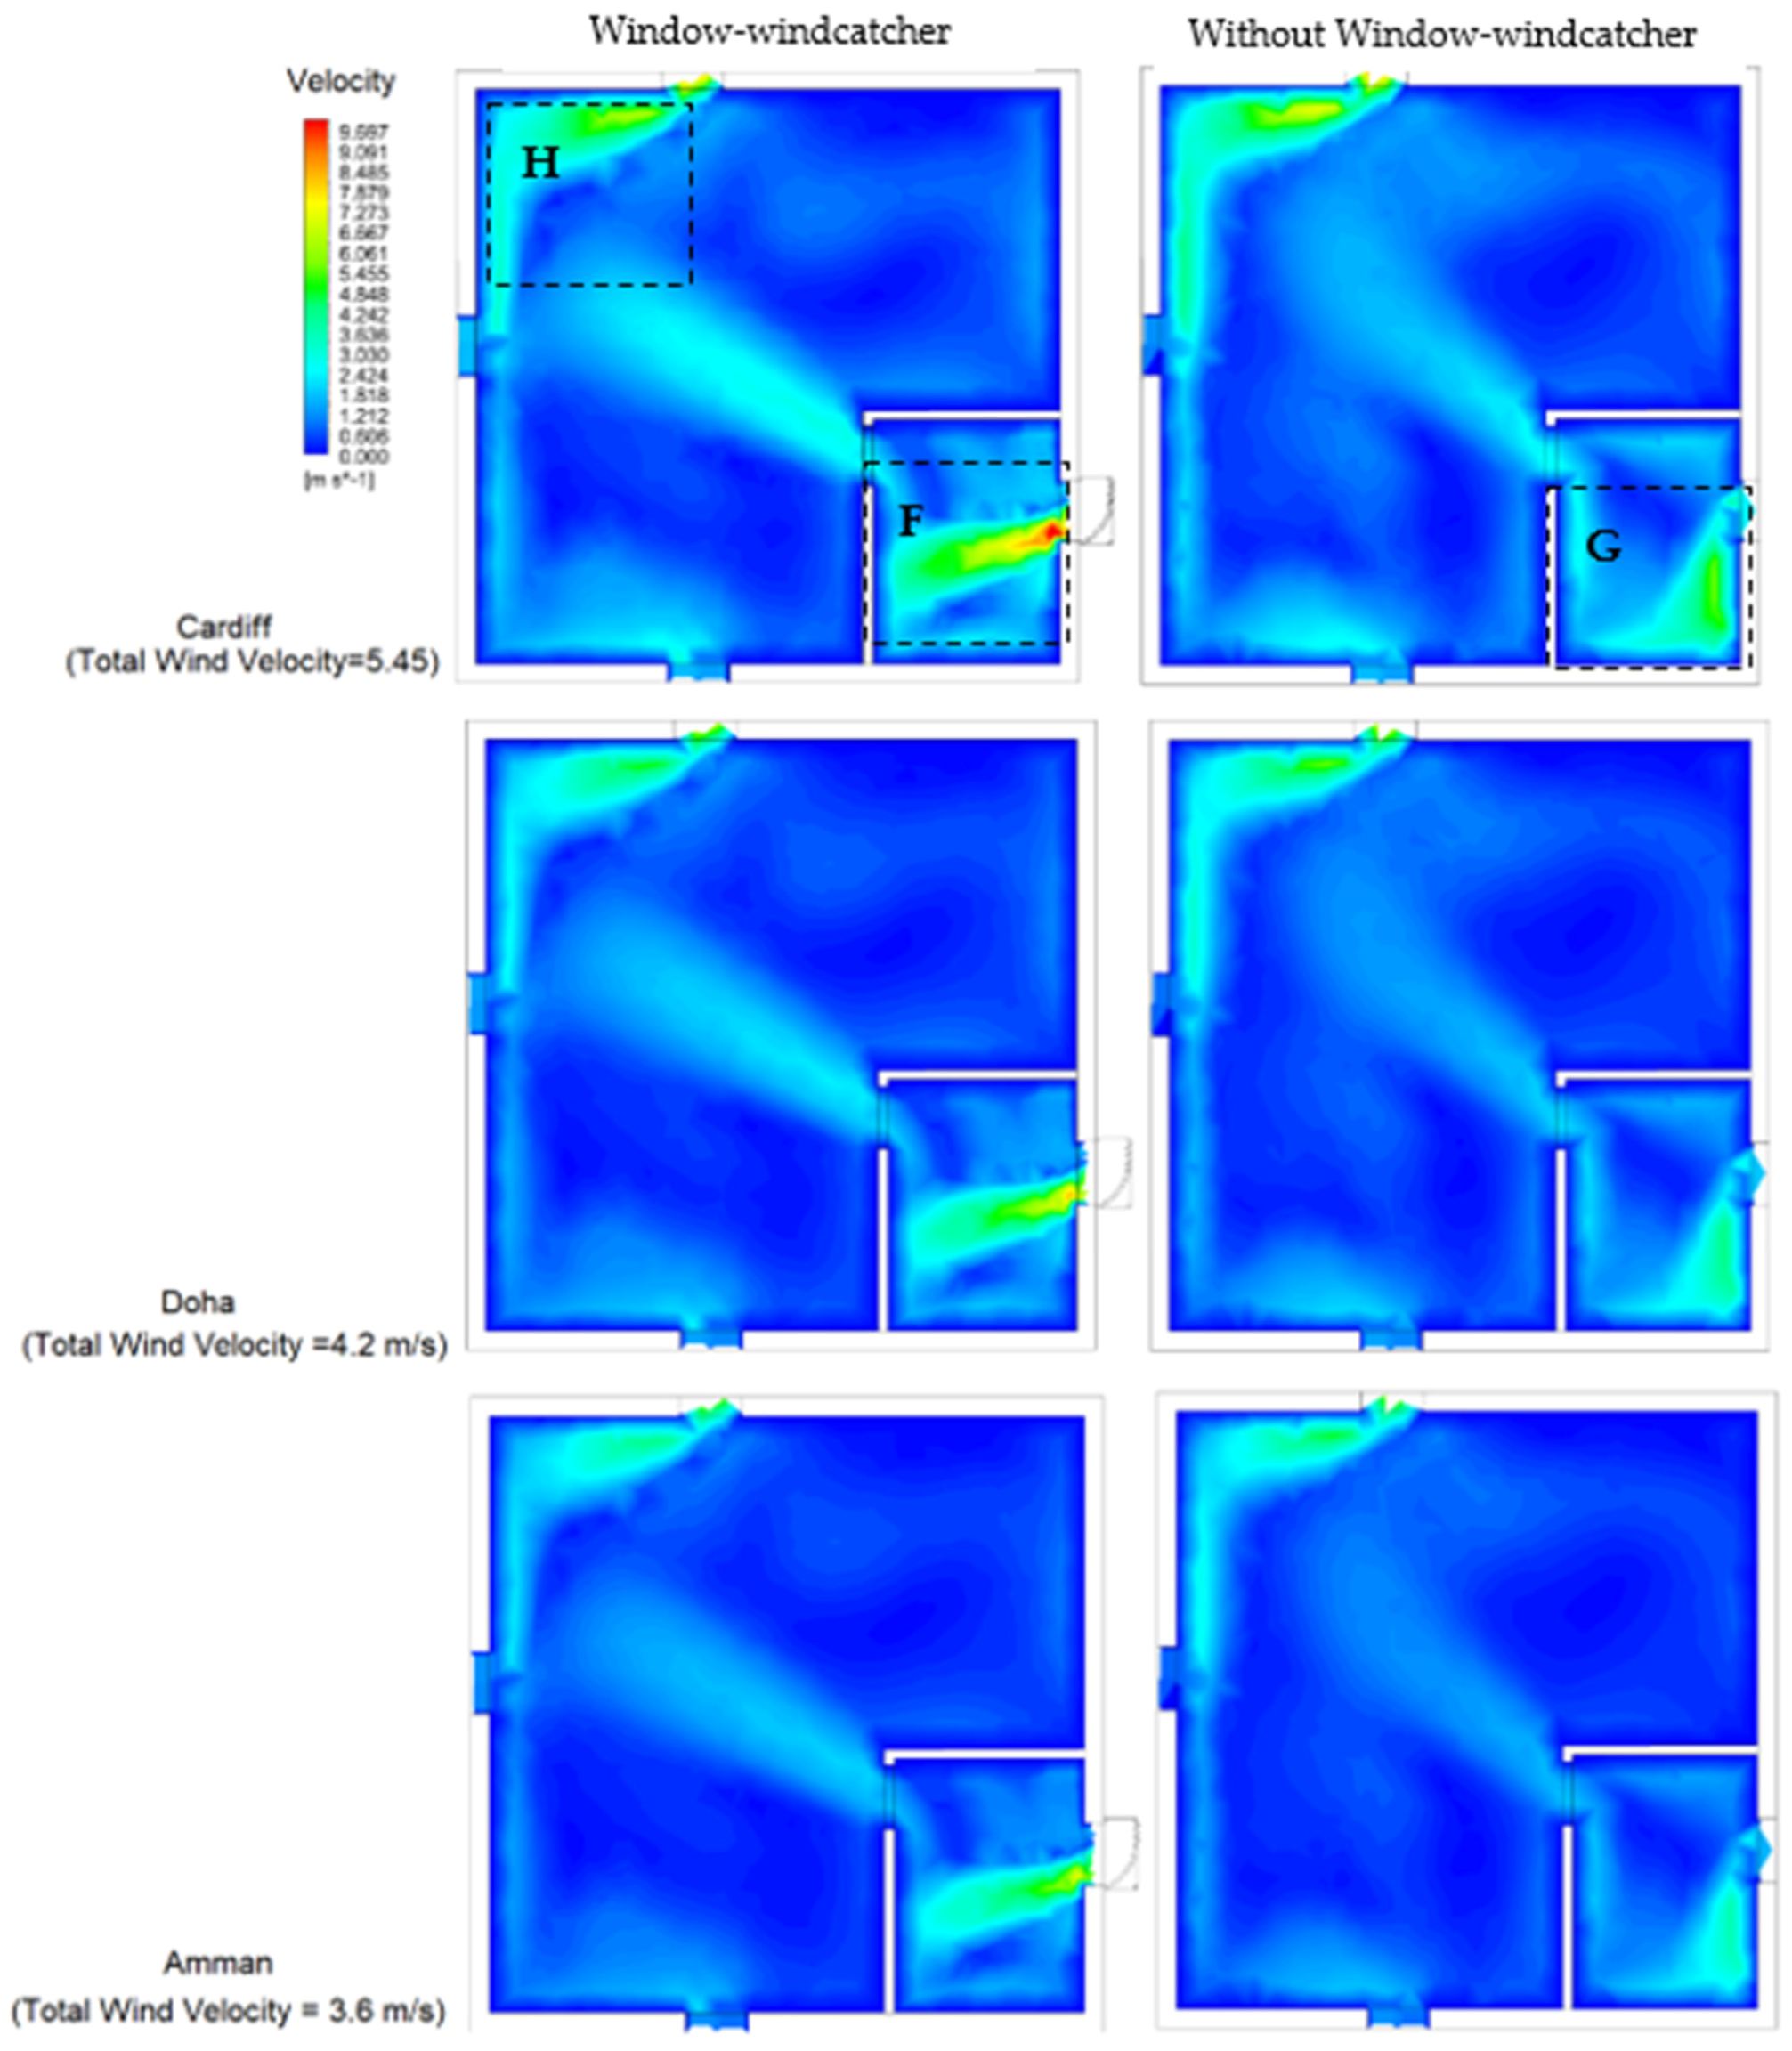
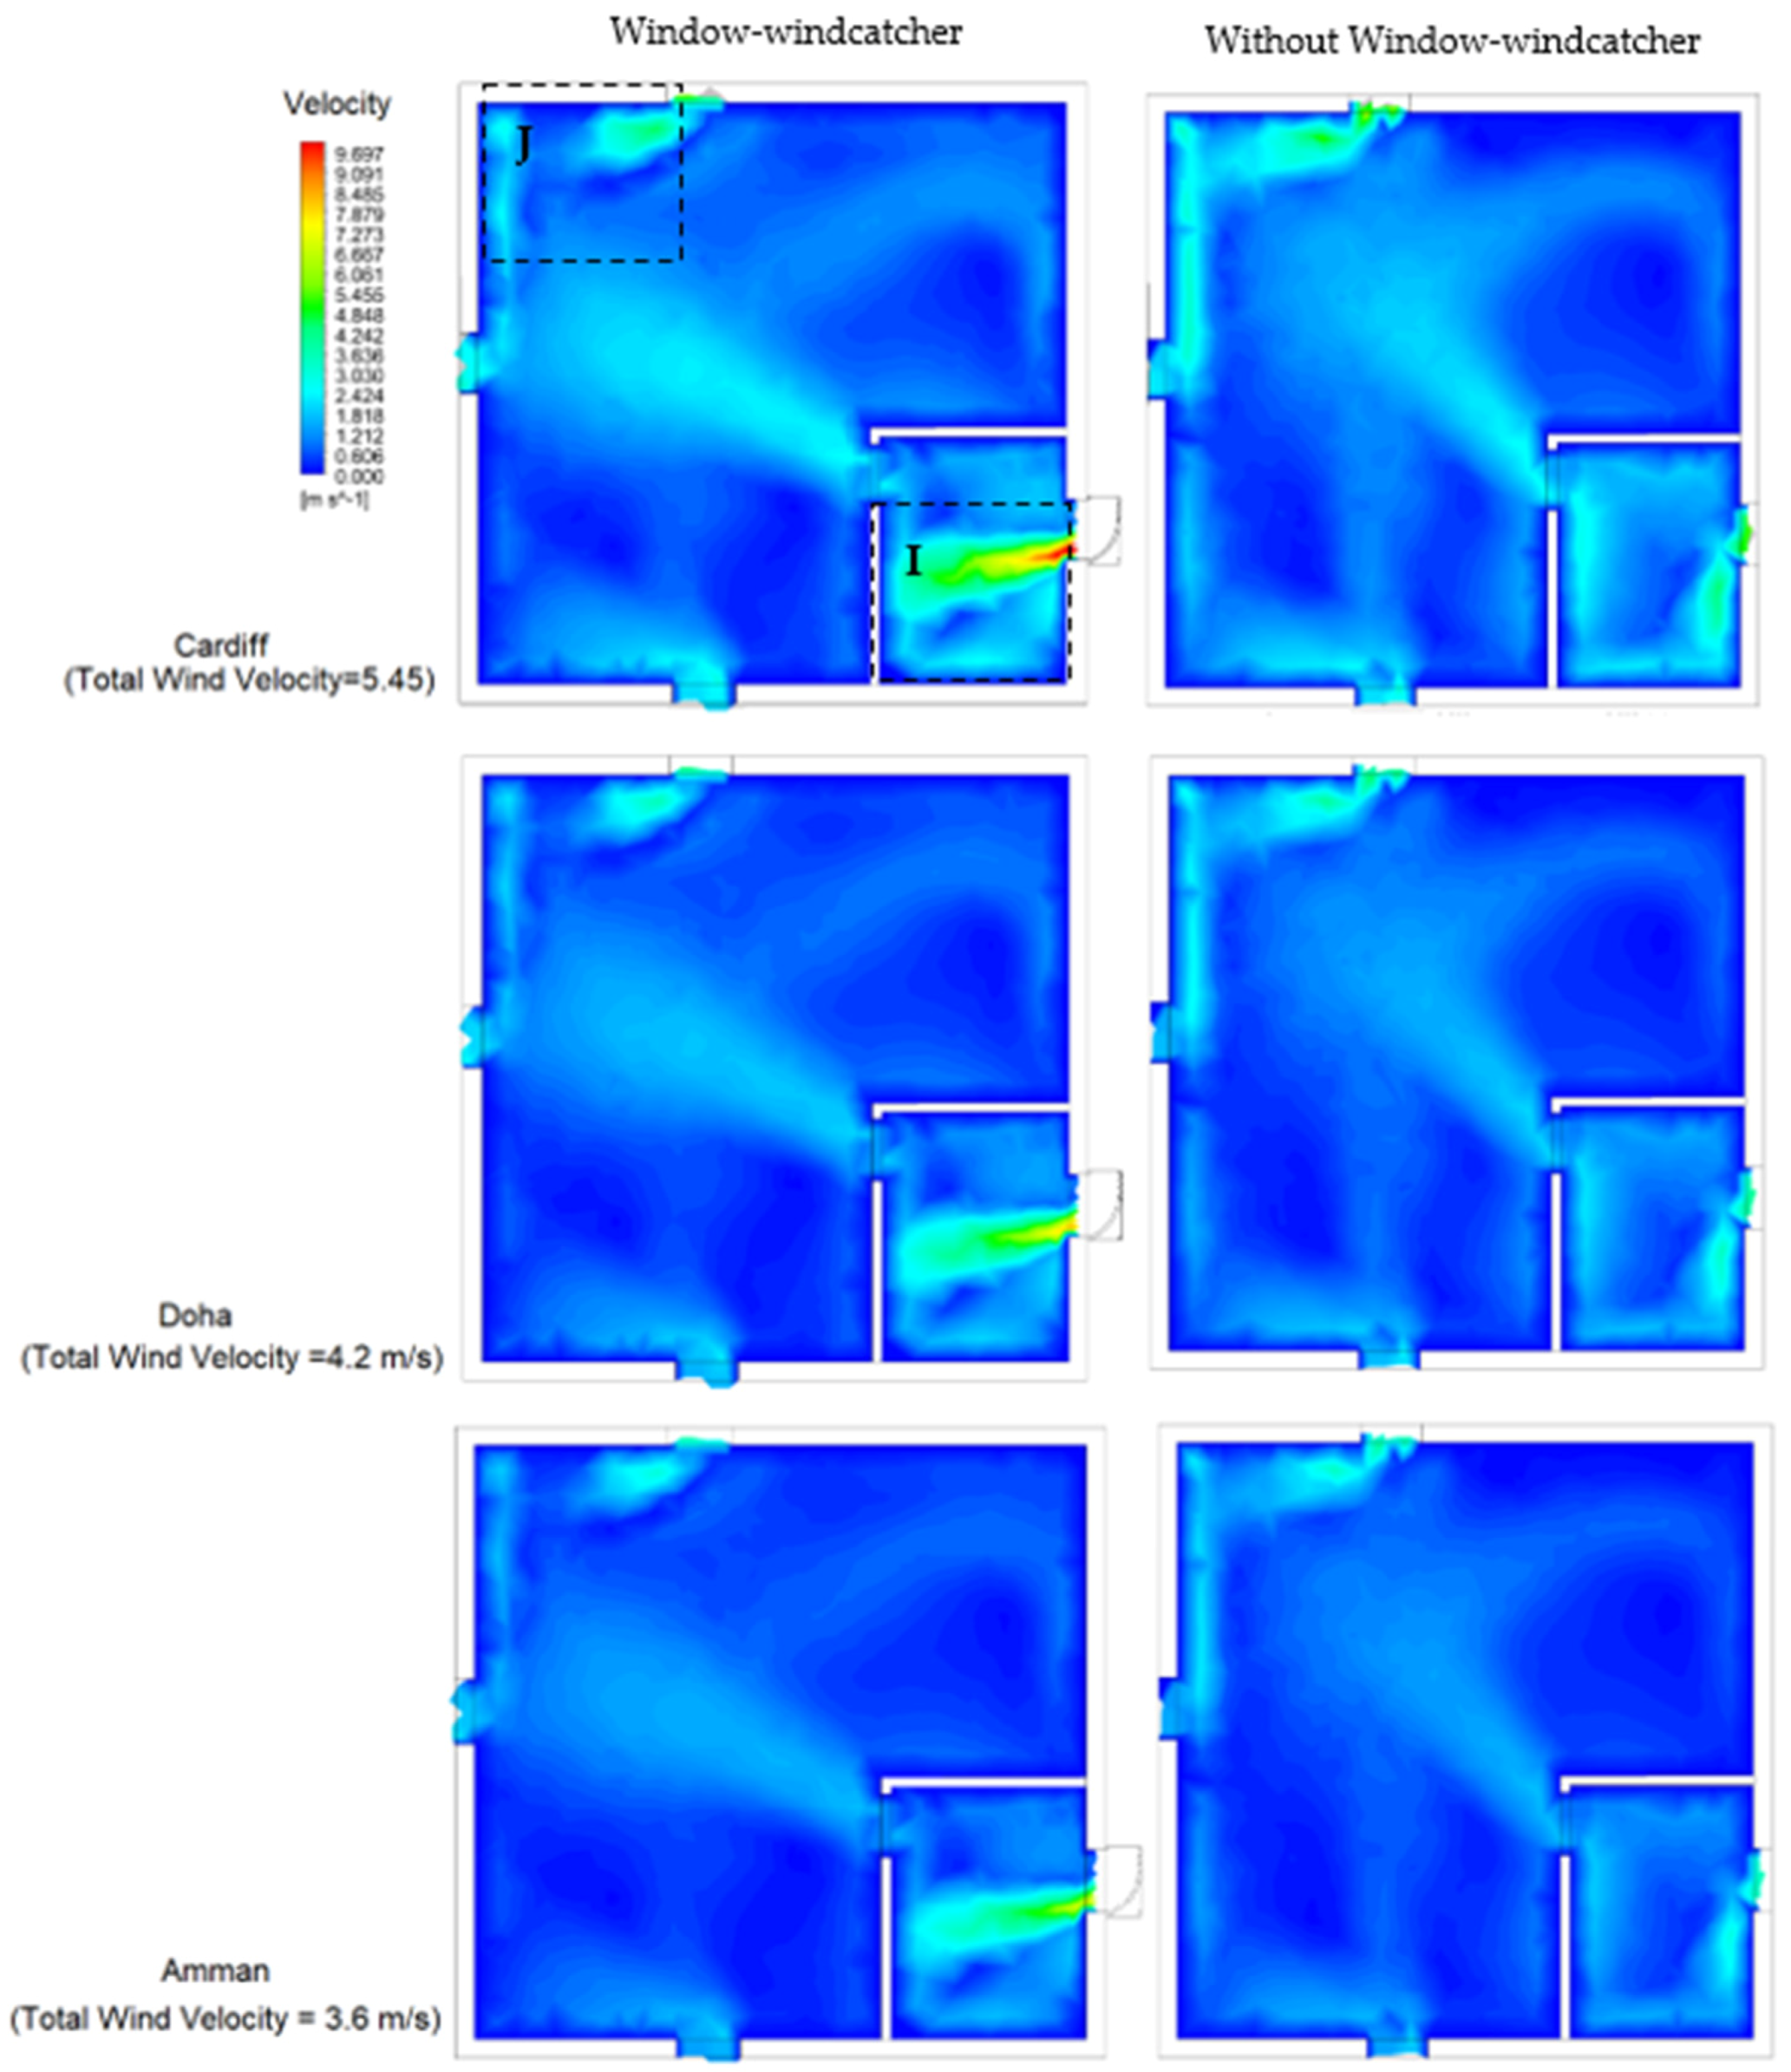
17]. At those locations, the velocity magnitude gradually decreases to approximately 0 m/s; Figure 13 and Figure 14 show the near-zero-velocity regions. By relating these regions to the possibility of deploying air purifiers, it is suggested that these locations should be avoided, as they correspond to ‘safe’ regions. Air purifiers, on the other hand, should be placed in areas with high velocity to maximise the airflow rate into the purifiers. In Figure 13 and Figure 14, those locations have been labelled as air-purifier regions (APR).
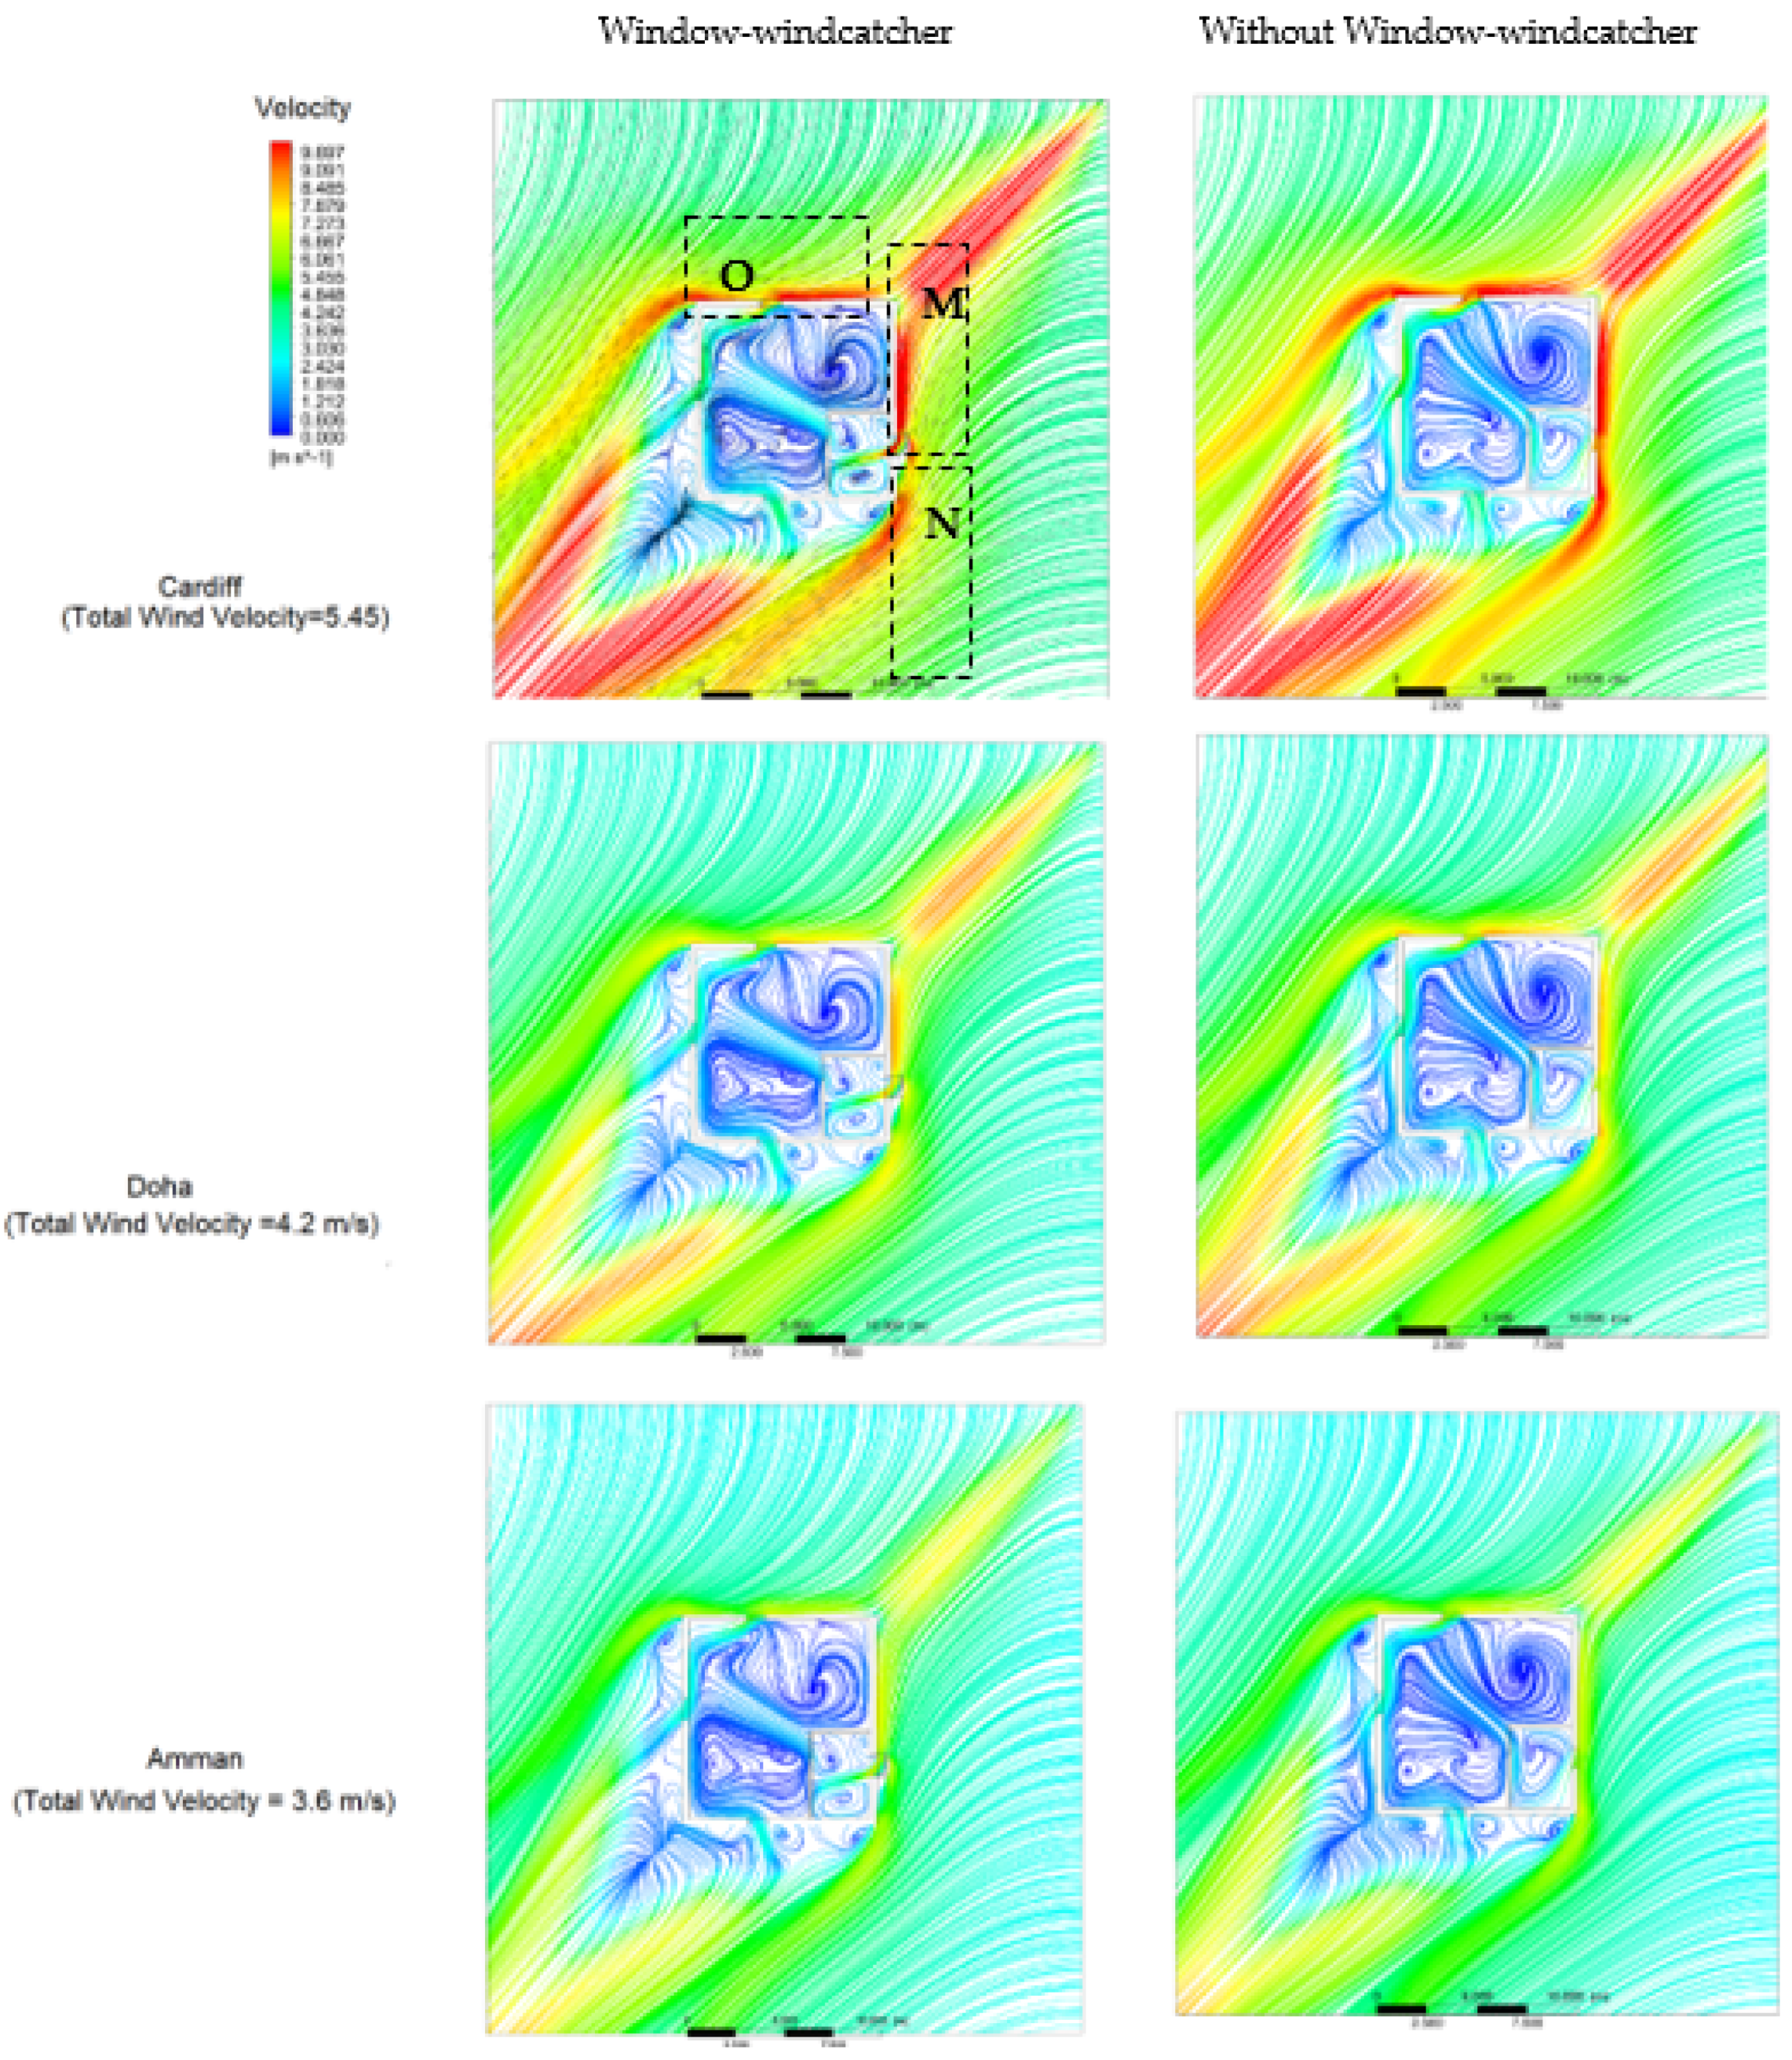
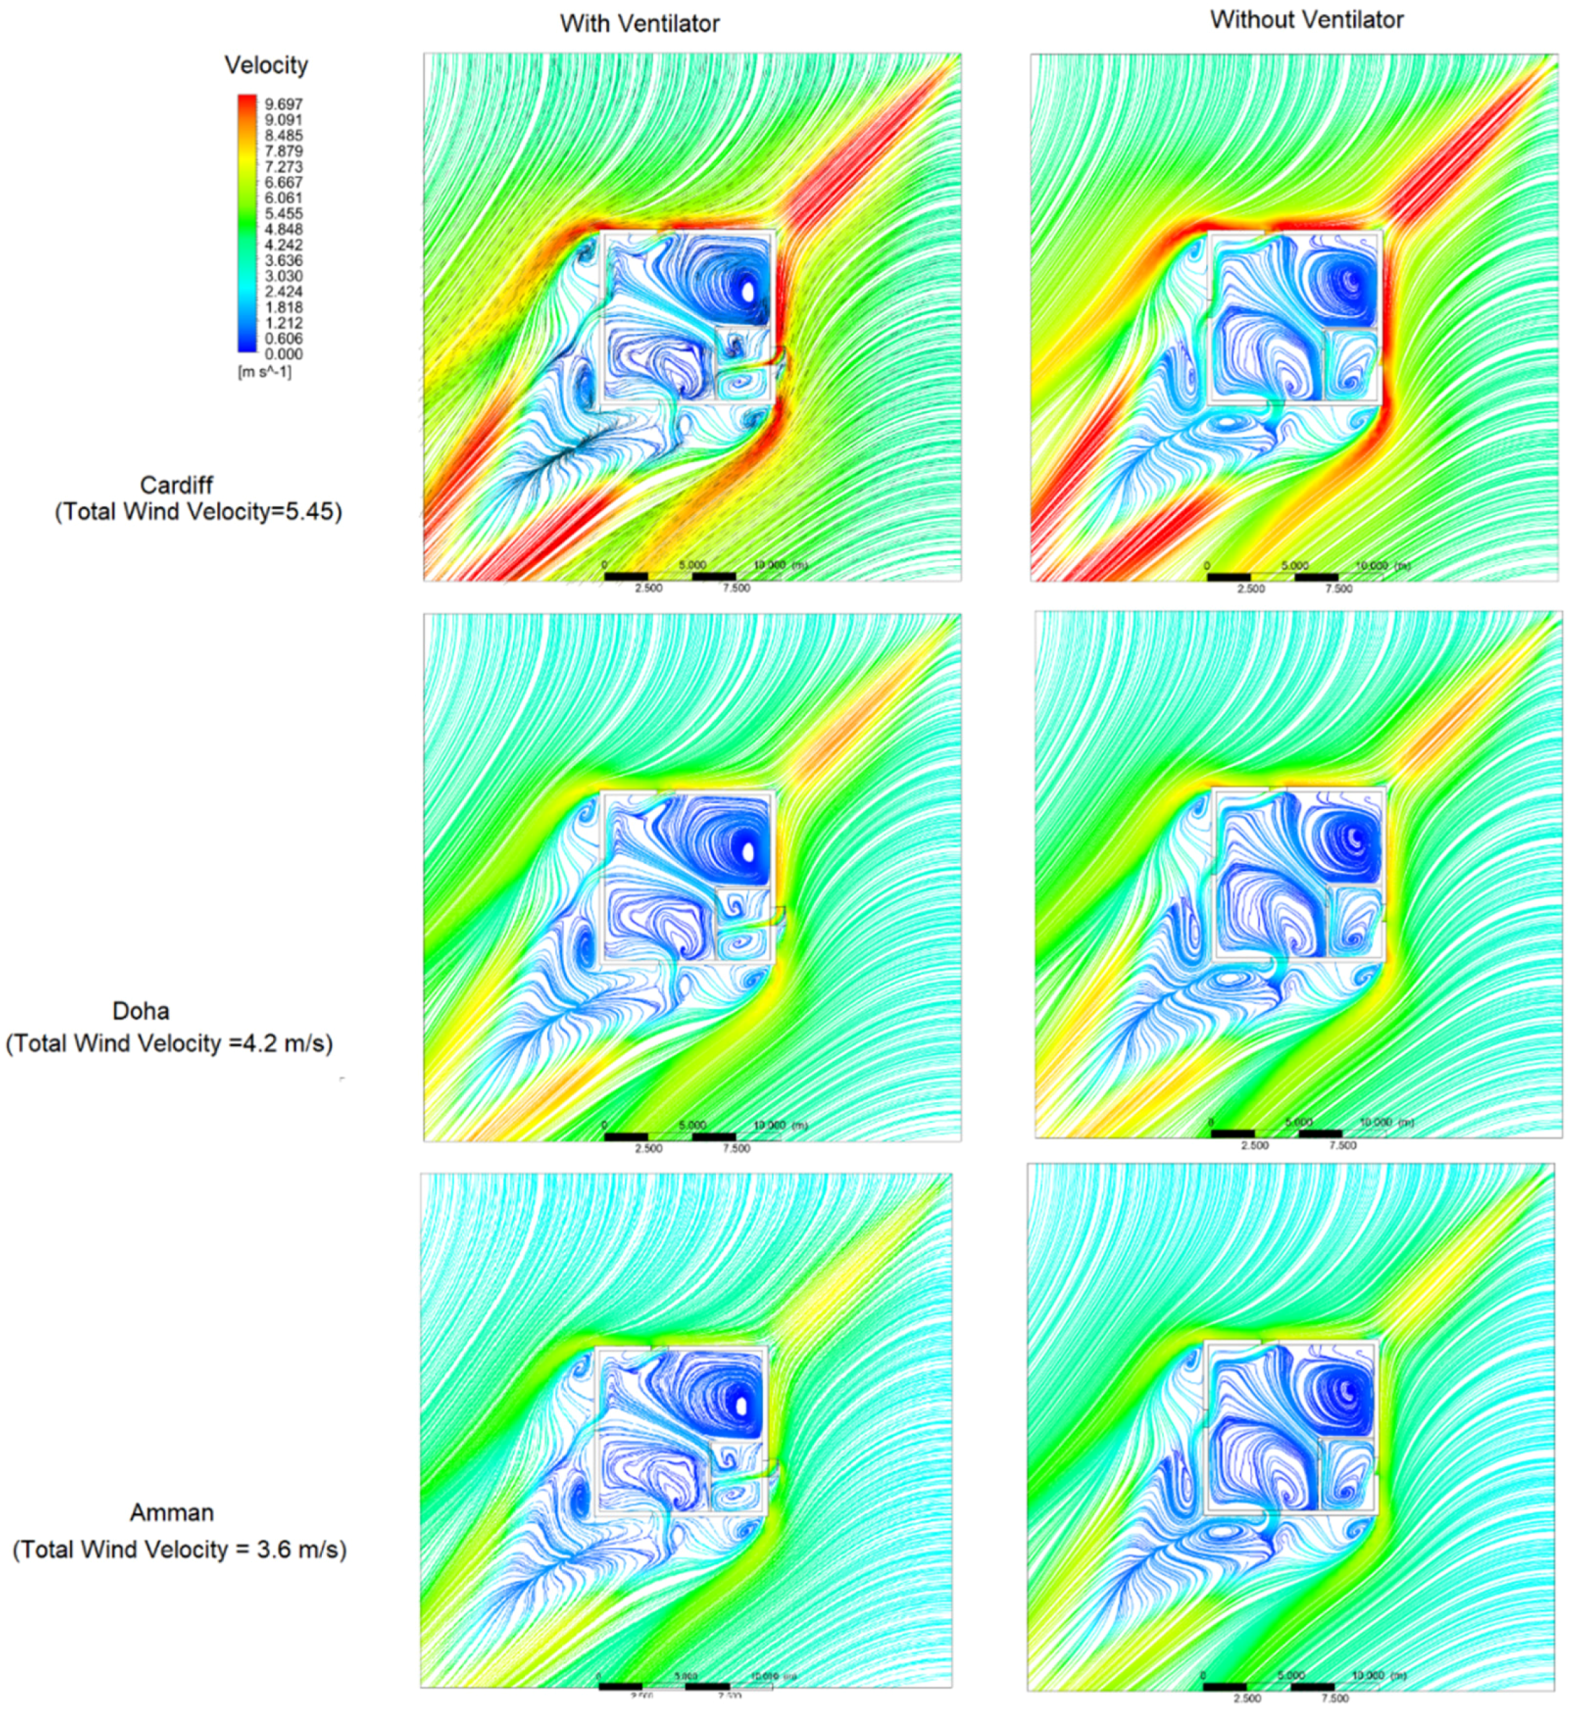
Furthermore, we looked at the interaction of the interior and exterior planes’ streamlines. Understanding the fluid interaction with the interior plane requires plotting the streamlines for the exterior planes. We also identified potential locations to place the window-windcatcher in order to increase the ventilation rate. The window-windcatcher redirects the shear wind towards the building’s interior plane, as shown in region M of Figure 14. However, some high-velocity wind streamlines (Region N) are not directed towards the building’s interior plane. This implies that the window-windcatcher design could be further improved in future work in order to enhance its aerodynamic capabilities.
Another important point is that, unlike Region M, where the window-windcatcher was not deployed, most of the shear wind streamlines are not directed towards the interior plane of the building in Region O (Figure 14). This means that, by deploying another window-windcatcher in Region O, the ventilation rate could be increased. According to the quantitative analysis (
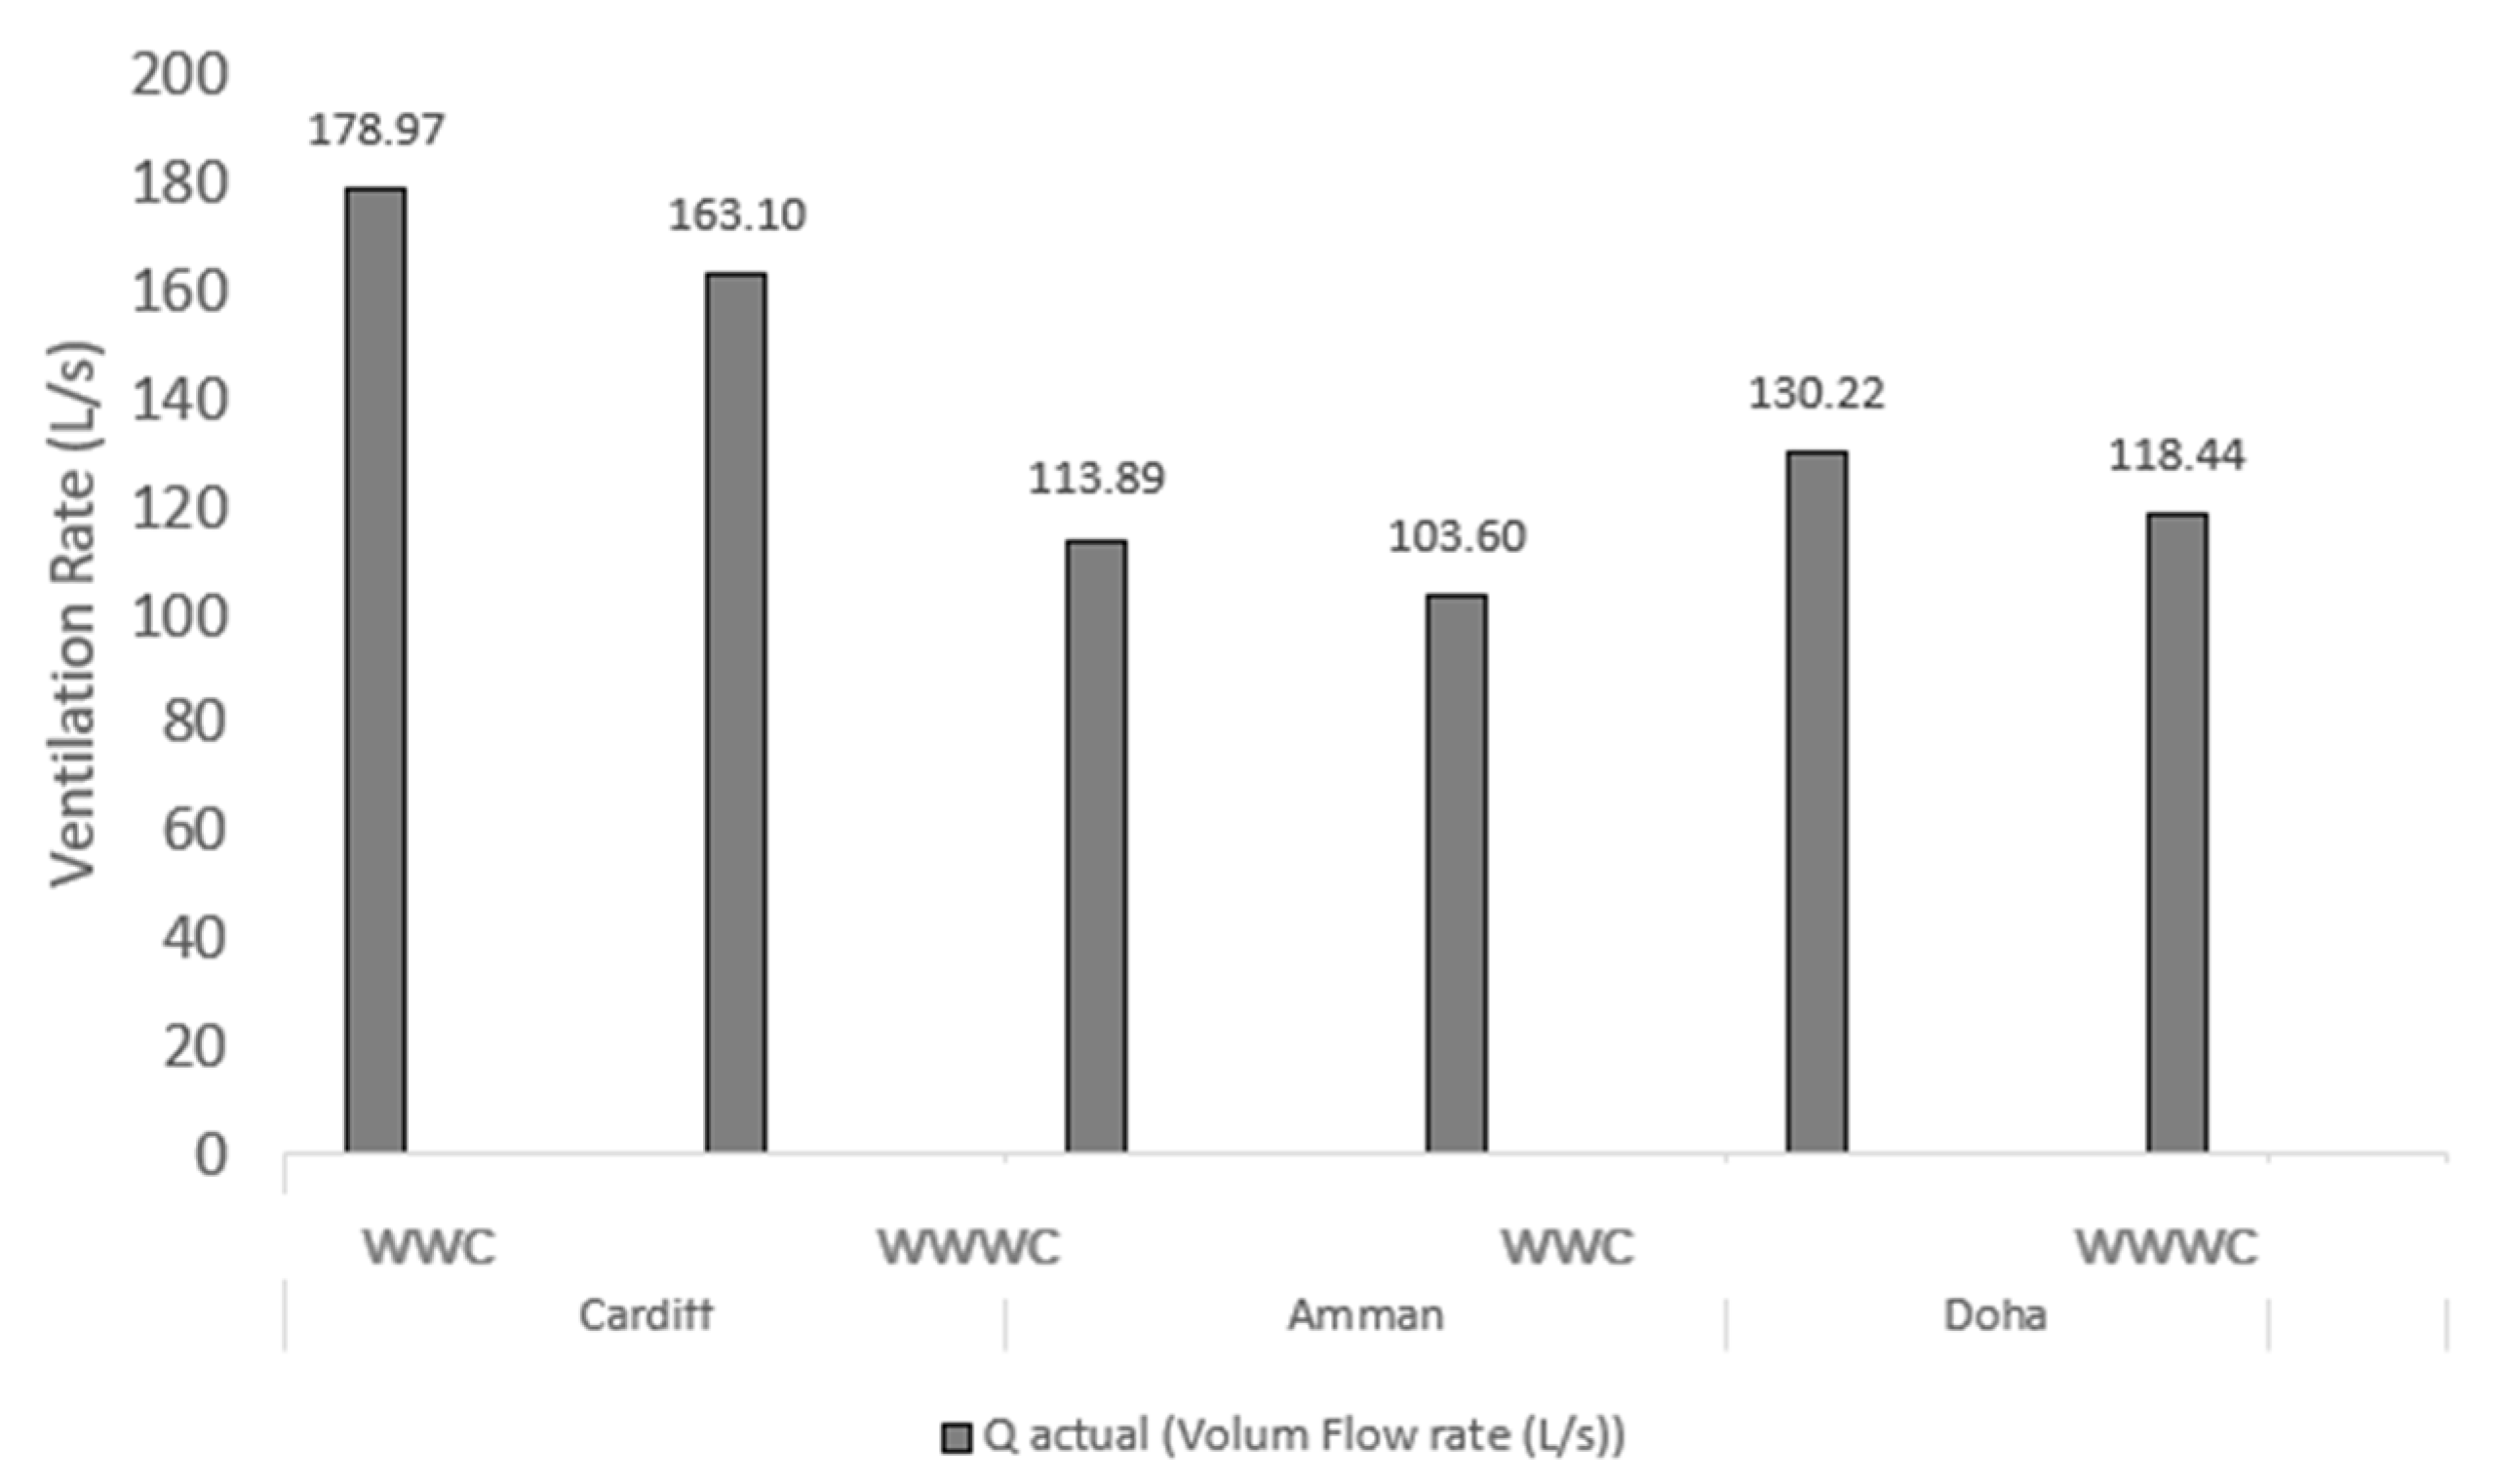
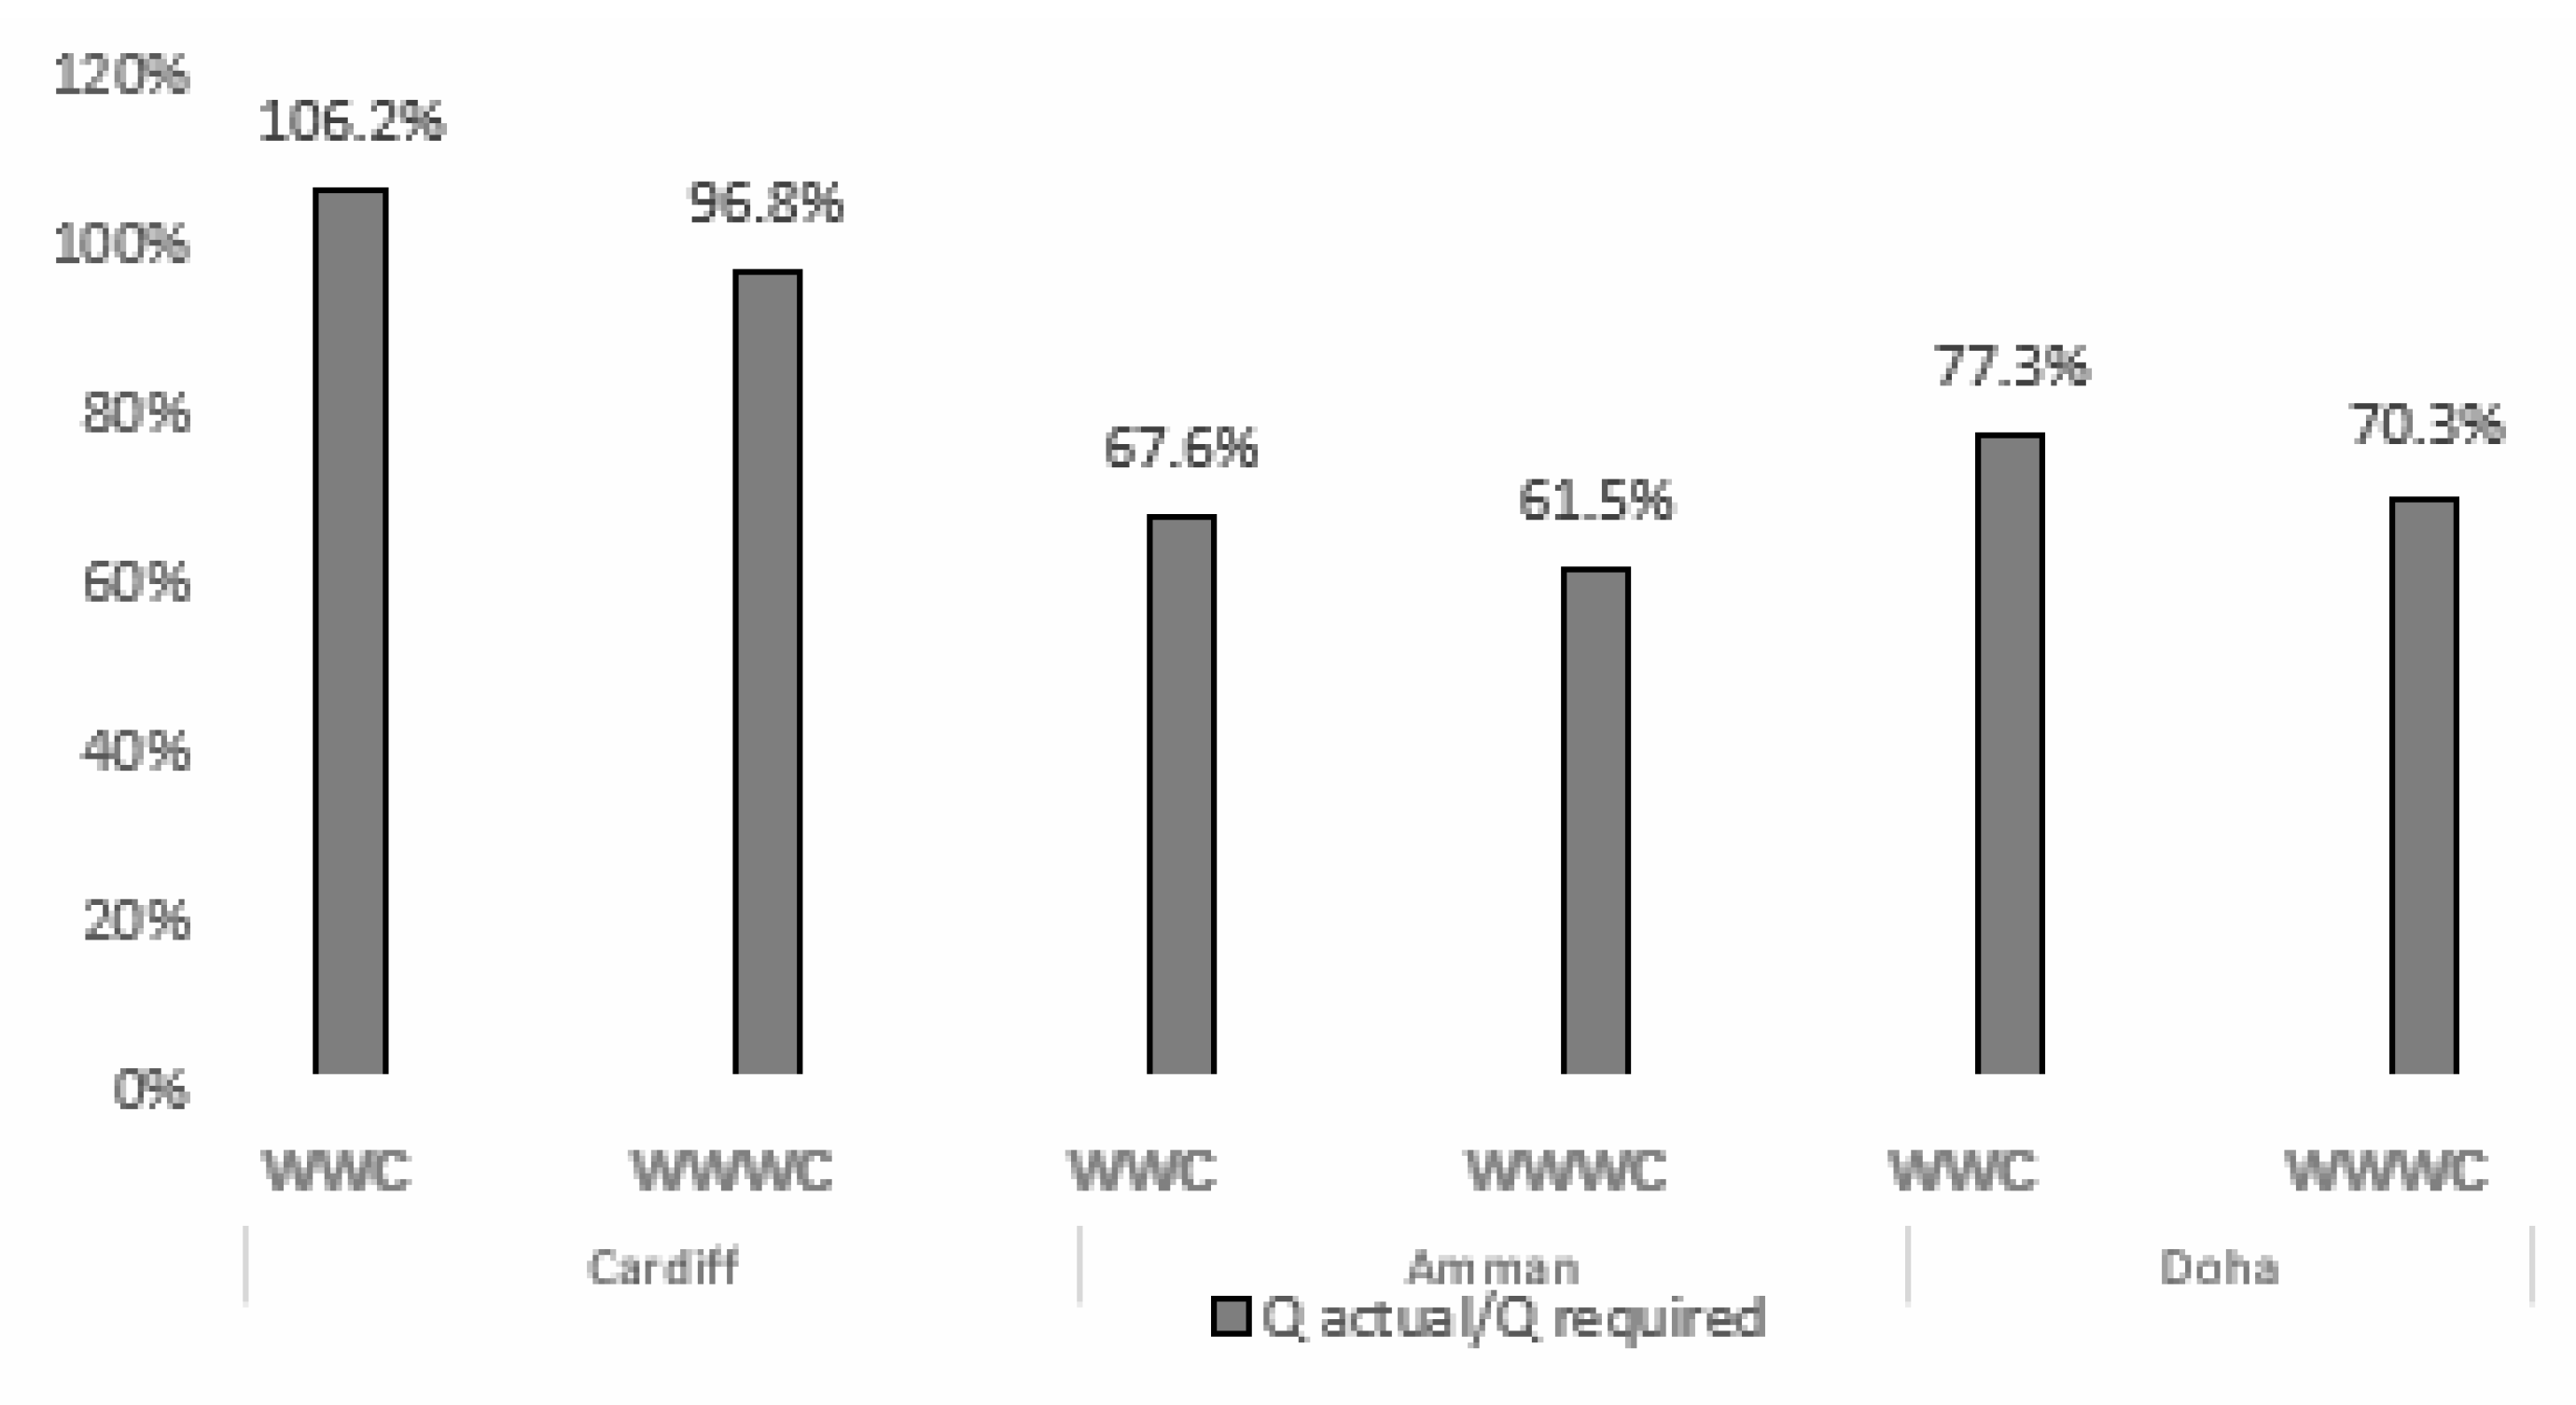
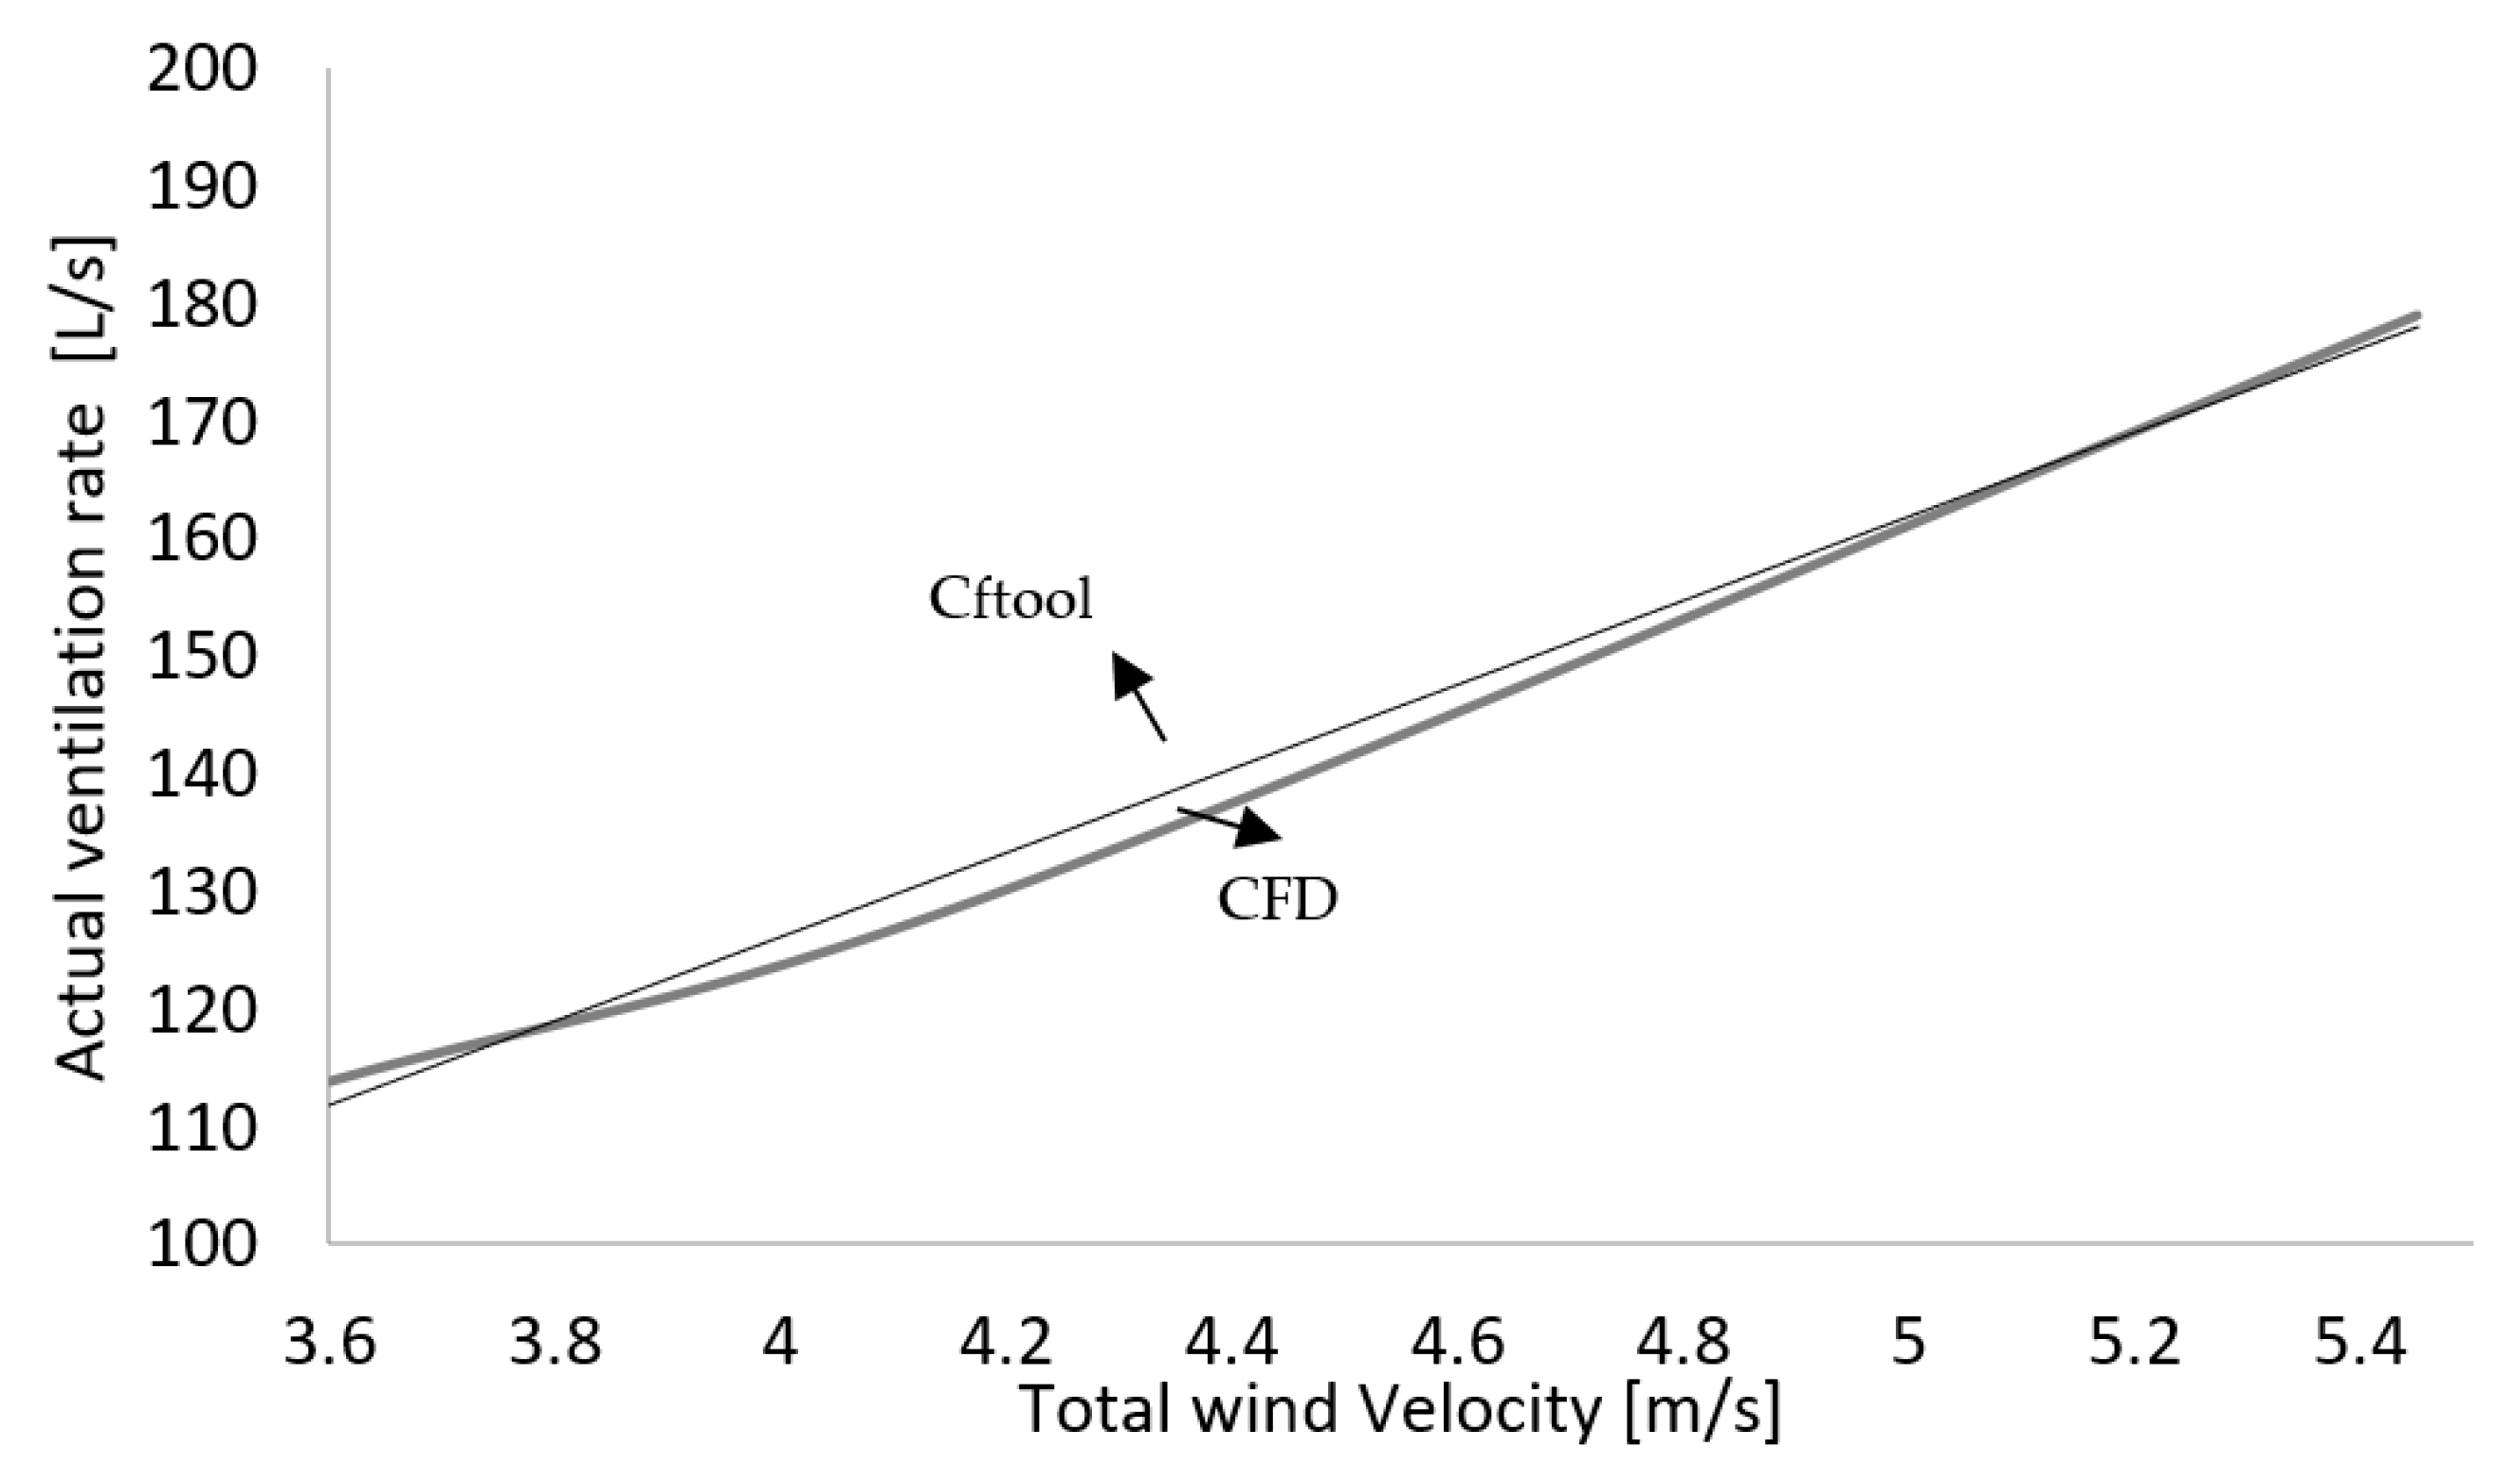
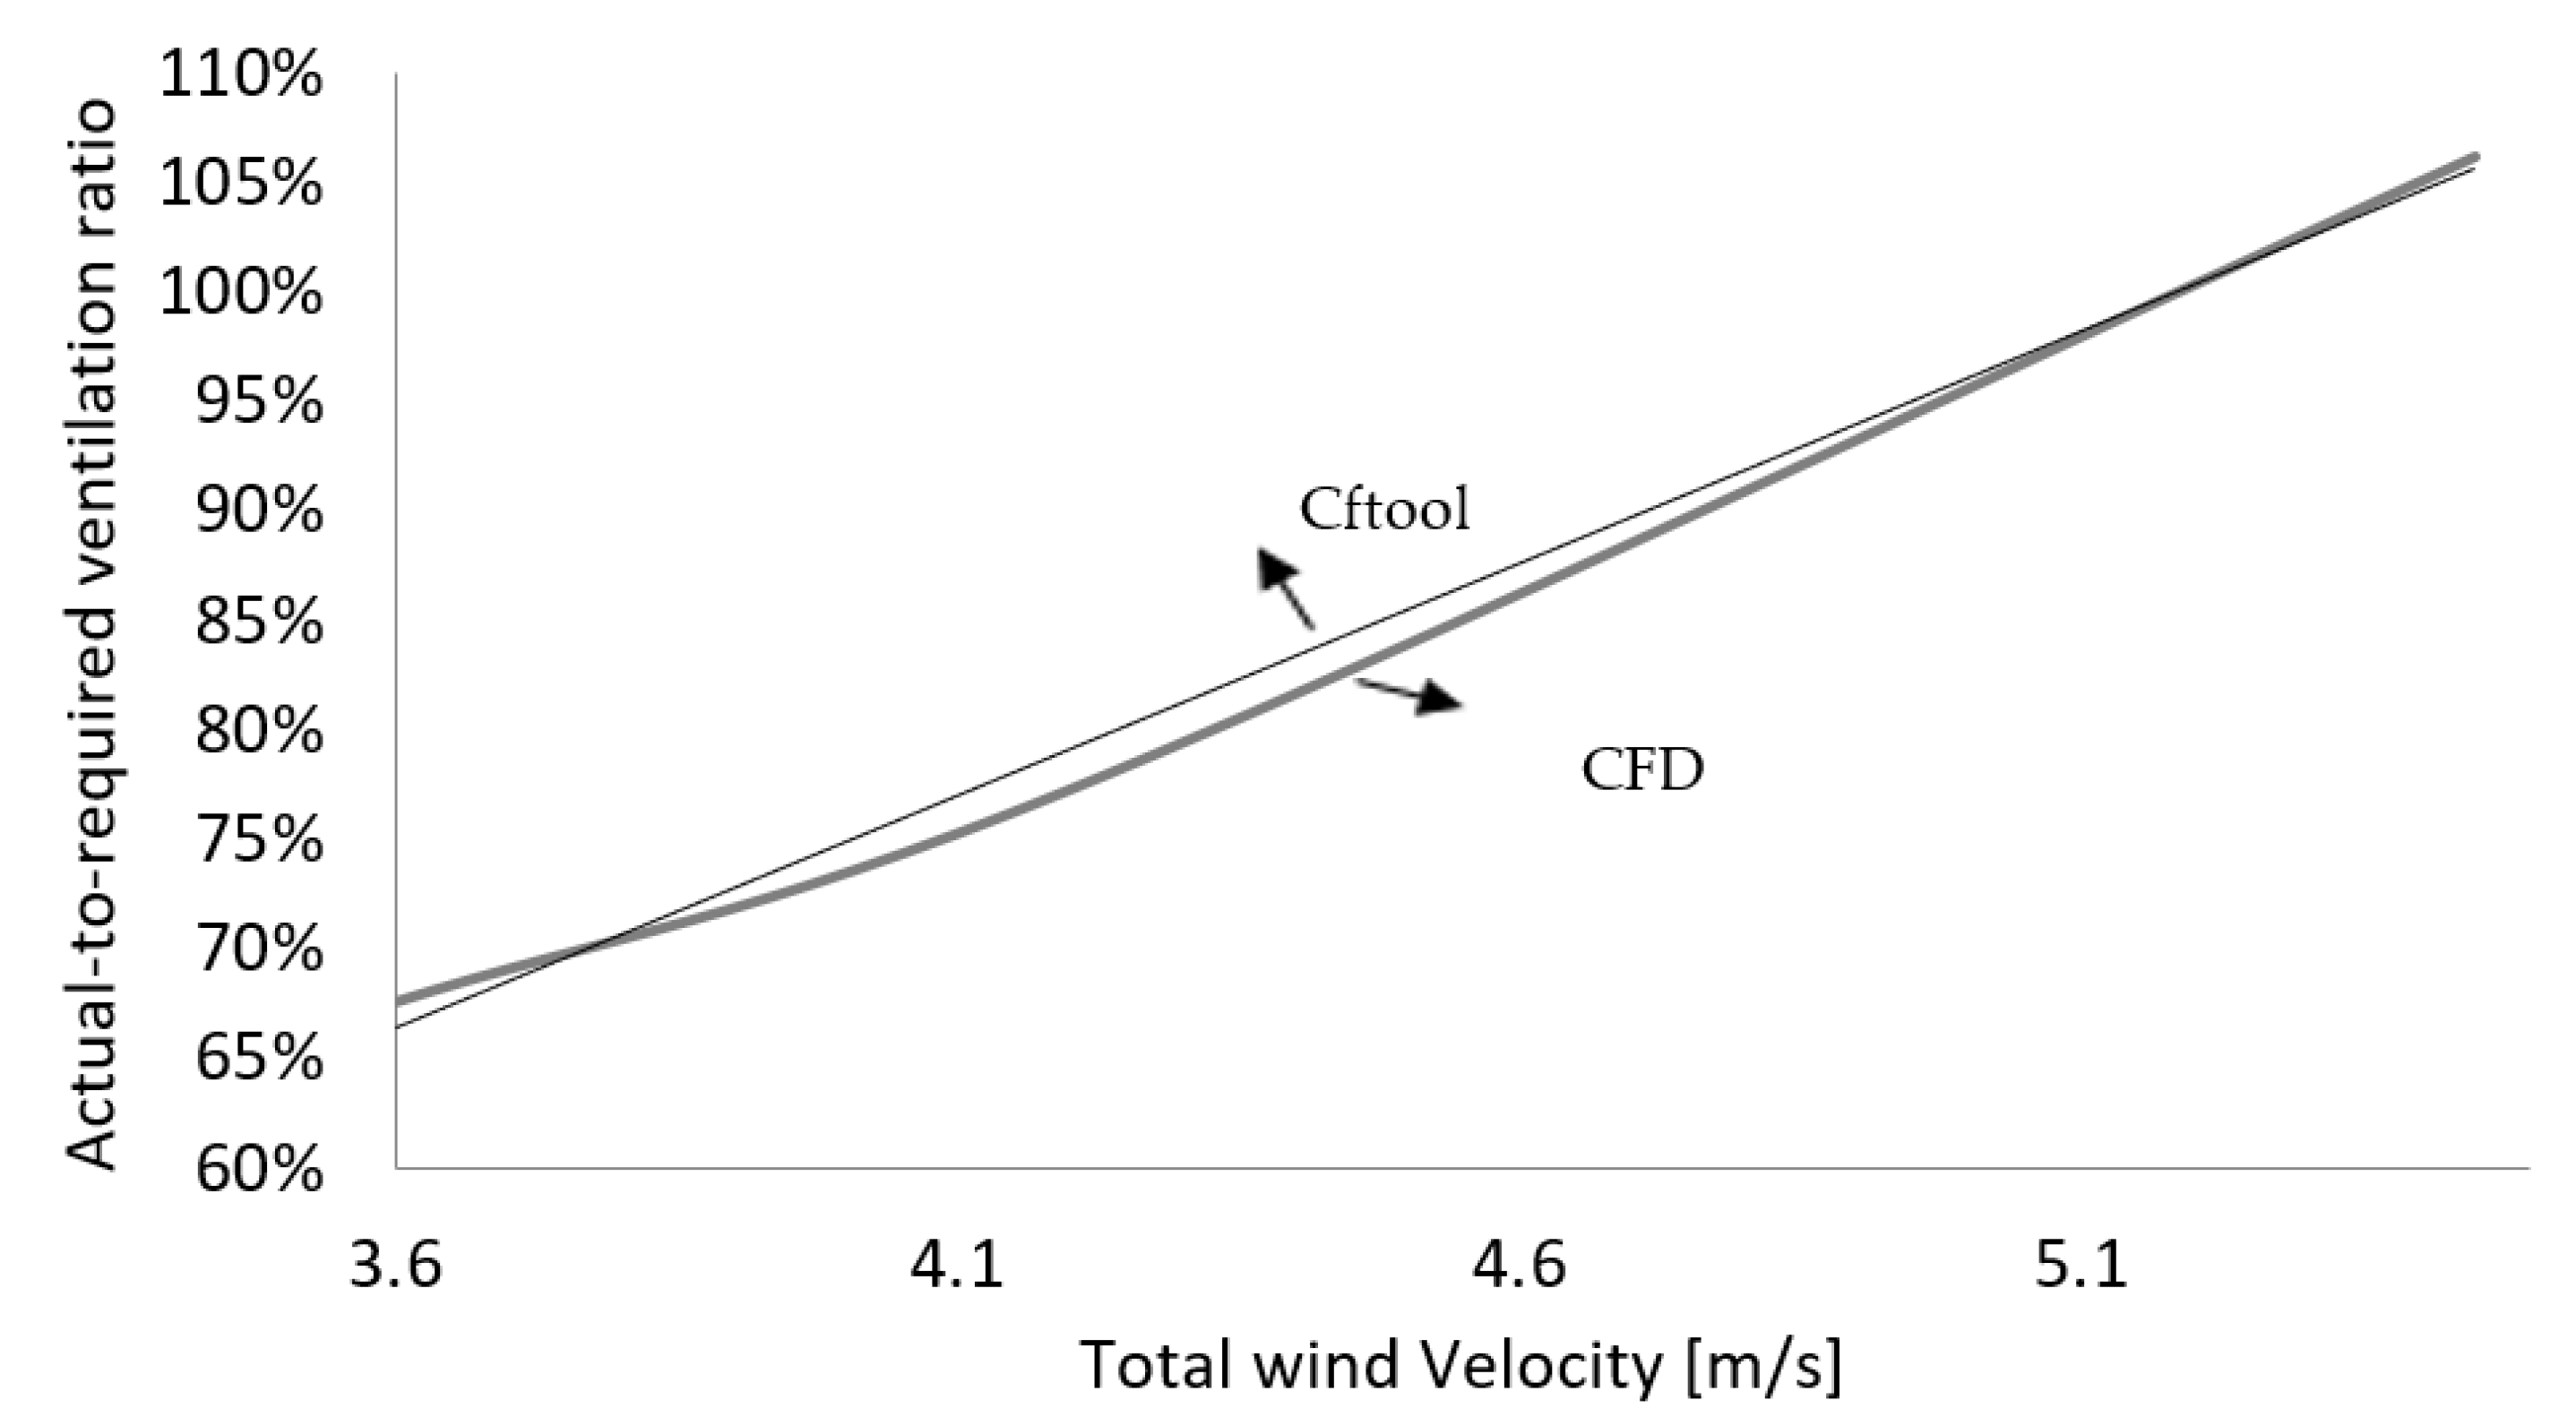
Section 3.2), the window-windcatcher has slightly increased the average turbulence kinetic energy at both planes in the three cases studied. The increase in turbulence kinetic energy, on the other hand, occurred in areas that are less likely to be occupied by people. However, the ventilation rate was compared to the required ventilation rate Q required ) as specified by the ASHRAE standards [30]. Compared to the case without the window-windcatcher ( n Q from 96.7 percent to 106 percent), the window-windcatcher managed to increase the actual-to-required ventilation ratio by approximately 9%. The actual-to-required ventilation ratio was increased by approximately 6% (from 61.5 percent to 67.5 percent) and 7% (from 70 percent to 77.3 percent) in the Amman and Doha cases, respectively.

5. Conclusions

This research aimed to investigate, using ANSYS CFX, the effectiveness of a design of a novel window-windcatcher device to be mounted on the exterior walls to capture the prevailing wind and redirect it into interior spaces. The performance of the proposed window-windcatcher has been evaluated in comparison to a control case (without a window-windcatcher) in three different geographical locations (Cardiff, Doha and Amman). The proposed window-windcatcher has proven to enhance thermal comfort and indoor air quality by increasing the actual-to-required ventilation ratio as per the ASHRAE standards by approximately 9% compared to the case without the window-windcatcher ( n Q from 96.7% to 106%). For Amman and Doha, the actual-to-required ventilation ratio was increased by approximately 6% (61.5% to 67.5%) and 7% (70% to 77.3%), respectively.
In addition, the location with minimal velocities has been identified by plotting the streamlines. Those locations correspond to the regions with a lower likelihood of spreading viral diseases such as COVID-19. Regarding the potential of deploying air purifiers, air-purifier regions (APR) with high velocity, where the airflow rate entering the air purifiers is increased, have been identified.
For future work, a prototype is recommended to be manufactured and tested in a wind tunnel to further examine the aerodynamic performance of the window-windcatcher.

Author Contributions

Conceptualization, O.F.A., L.M.O., S.N.M., K.K., T.A.-R. and A.I.A.; methodology, O.F.A., L.M.O., S.N.M., K.K., T.A.-R. and A.I.A.; software, O.F.A., L.M.O., S.N.M., K.K., T.A.-R. and A.I.A.; validation, O.F.A., L.M.O., S.N.M., K.K., T.A.-R. and A.I.A.; formal analysis, O.F.A., L.M.O., S.N.M., K.K., T.A.-R. and A.I.A.; investigation, O.F.A., L.M.O., S.N.M., K.K., T.A.-R. and A.I.A.; resources, O.F.A., L.M.O., S.N.M., K.K., T.A.-R. and A.I.A.; data curation, O.F.A., L.M.O., S.N.M., K.K., T.A.-R. and A.I.A.; writing—original draft preparation, O.F.A., L.M.O., S.N.M., K.K., T.A.-R. and A.I.A.; writing—review and editing, O.F.A., L.M.O., S.N.M., K.K., T.A.-R. and A.I.A.; visualization, O.F.A., L.M.O., S.N.M., K.K., T.A.-R. and A.I.A.; supervision, O.F.A., L.M.O., S.N.M., K.K., T.A.-R. and A.I.A.; project administration, O.F.A., L.M.O., S.N.M., K.K., T.A.-R. and A.I.A.; funding acquisition, O.F.A., L.M.O., S.N.M., K.K., T.A.-R. and A.I.A. All authors have read and agreed to the published version of the manuscript.

Funding

This publication was made possible by NPRP 13 Grant No. NPRP13S-0203-200243 from the Qatar National Research Fund (a member of the Qatar Foundation). The findings herein reflect the work and are solely the responsibility of the authors. Open Access funding is provided by the Qatar National Library.

Informed Consent Statement

Not applicable.

Data Availability Statement

Not applicable.

Acknowledgments

The authors gratefully acknowledge the support Oxford University through Ian Griffiths.

Conflicts of Interest

The authors declare no conflict of interest.

References

  1. Wang, T.; Foliente, G.; Song, X.; Xue, J.; Fang, D. Implications and future direction of greenhouse gas emission mitigation policies in the building sector of China. Renew. Sustain. Energy Rev. 2014, 31, 520–530. [Google Scholar] [CrossRef]
  2. Jomehzadeh, F.; Nejat, P.; Calautit, J.K.; Yusof, M.B.M.; Zaki, S.A.; Hughes, B.R.; Yazid, M.N.A.W.M. A review on windcatcher for passive cooling and natural ventilation in buildings, Part 1: Indoor air quality and thermal comfort assessment. Renew. Sustain. Energy Rev. 2017, 70, 736–756. [Google Scholar] [CrossRef]
  3. Saadatian, O.; Haw, L.C.; Sopian, K.; Sulaiman, M. Review of windcatcher technologies. Renew. Sustain. Energy Rev. 2012, 16, 1477–1495. [Google Scholar] [CrossRef]
  4. Santamouris, M. Cooling the buildings–past, present and future. Energy Build. 2016, 128, 617–638. [Google Scholar] [CrossRef]
  5. Chenari, B.; Dias Carrilho, J.; Gameiro da Silva, M. Towards sustainable, energy-efficient and healthy ventilation strategies in buildings: A review. Renew. Sustain. Energy Rev. 2016, 59, 1426–1447. [Google Scholar] [CrossRef]
  6. Ma’Bdeh, S.N.; Al-Zghoul, A.; Alradaideh, T.; Bataineh, A.; Ahmad, S. Simulation study for natural ventilation retrofitting techniques in educational classrooms—A case study. Heliyon 2020, 6, e05171. [Google Scholar] [CrossRef]
  7. Zhang, H.; Yang, D.; Tam, V.W.; Tao, Y.; Zhang, G.; Setunge, S.; Shi, L. A critical review of combined natural ventilation techniques in sustainable buildings. Renew. Sustain. Energy Rev. 2021, 141, 110795. [Google Scholar] [CrossRef]
  8. Faggianelli, G.A.; Brun, A.; Wurtz, E.; Muselli, M. Natural cross ventilation in buildings on Mediterranean coastal zones. Energy Build. 2014, 77, 206–218. [Google Scholar] [CrossRef]
  9. Ababsa, M. Atlas of Jordan: History, Territories and Society. Presses de l’Ifpo. 2014. Available online: https://books.google.jo/books?id=RIcNCwAAQBAJ (accessed on 20 April 2021).
  10. Geros, V.; Santamouris, M.; Tsangrasoulis, A.; Guarracino, G. Experimental evaluation of night ventilation phenomena. Energy Build. 1999, 29, 141–154. [Google Scholar] [CrossRef]
  11. Al-Hemiddi, N.A.; Al-Saud, K.A.M. The effect of a ventilated interior courtyard on the thermal performance of a house in a hot–arid region. Renew. Energy 2001, 24, 581–595. [Google Scholar] [CrossRef]
  12. Ahmed, T.; Kumar, P.; Mottet, L. Natural ventilation in warm climates: The challenges of thermal comfort, heatwave resilience and indoor air quality. Renew. Sustain. Energy Rev. 2021, 138, 110669. [Google Scholar] [CrossRef]
  13. Reyes, V.; Moya, S.; Morales, J.; Sierra-Espinosa, F. A study of air flow and heat transfer in building-wind tower passive cooling systems applied to arid and semi-arid regions of Mexico. Energy Build. 2013, 66, 211–221. [Google Scholar] [CrossRef]
  14. Esfeh, M.K.; Sohankar, A.; Shahsavari, A.; Rastan, M.; Ghodrat, M.; Nili, M. Experimental and numerical evaluation of wind-driven natural ventilation of a curved roof for various wind angles. Build. Environ. 2021, 205, 108275. [Google Scholar] [CrossRef]
  15. Omrani, S.; Garcia-Hansen, V.; Capra, B.; Drogemuller, R. Natural ventilation in multi-storey buildings: Design process and review of evaluation tools. Build. Environ. 2017, 116, 182–194. [Google Scholar] [CrossRef] [Green Version]
  16. Mabdeh, S.; Al Radaideh, T.; Hiyari, M. Enhancing Thermal Comfort of Residential Buildings through Dual Functional Passive System (Solar-Wall). J. Green Build. 2020, 16, 139–161. [Google Scholar] [CrossRef]
  17. Weatherspark. Available online: https://weatherspark.com/ (accessed on 30 December 2021).
  18. Toivanen, P.K.; Janhunen, P. Spin Plane Control and Thrust Vectoring of Electric Solar Wind Sail. J. Propuls. Power 2013, 29, 178–185. [Google Scholar] [CrossRef] [Green Version]
  19. Alrebi, O.F.; Obeidat, B.; Abdallah, I.A.; Darwish, E.F.; Amhamed, A. Airflow dynamics in an emergency department: A CFD simulation study to analyse COVID-19 dispersion. Alex. Eng. J. 2021, 61, 3435–3445. [Google Scholar] [CrossRef]
  20. Available online: https://www.epa.gov/coronavirus/air-cleaners-hvac-filters-and-coronavirus-covid-19 (accessed on 2 March 2022).
  21. Obeidat, B.; Alrebei, O.F.; Abdallah, I.A.; Darwish, E.F.; Amhamed, A. CFD Analyses: The Effect of Pressure Suction and Airflow Velocity on Coronavirus Dispersal. Appl. Sci. 2021, 11, 7450. [Google Scholar] [CrossRef]
  22. Ramponi, R.; Blocken, B. CFD simulation of cross-ventilation for a generic isolated building: Impact of computational parameters. Build. Environ. 2012, 53, 34–48. [Google Scholar] [CrossRef]
  23. Yuan, F.-D.; You, S.-J. CFD simulation and optimisation of the ventilation for subway side-platform. Tunn. Un-Derground Space Technol. 2007, 22, 474–482. [Google Scholar] [CrossRef]
  24. Average Height by Country 2021. Available online: https://worldpopulationreview.com/country-rankings/average-height-by-country2021 (accessed on 1 January 2022).
  25. de Roode, S.R.; Jonker, H.J.; van de Wiel, B.J.; Vertregt, V.; Perrin, V. A diagnosis of excessive mixing in smagorinsky subfilter-scale turbulent kinetic energy models. J. Atmos. Sci. 2017, 74, 1495–1511. [Google Scholar] [CrossRef]
  26. Paul Ninomura, P.; Richard Hermans, P. Ventilation standard for health care facilities. ASHRAE J. 2008, 50, 52–57. [Google Scholar]
  27. ASHRAE Standards. Available online: https://www.ashrae.org/ (accessed on 30 December 2021).
  28. Dimotakis, P.E. Turbulent mixing. Annu. Rev. Fluid Mech. 2005, 37, 329–356. [Google Scholar] [CrossRef]
  29. Lee, S.C.; Harsha, P.T. Use of turbulent kinetic energy in free mixing studies. AIAA J. 1970, 8, 1026–1032. [Google Scholar] [CrossRef]
  30. Learn|OpenEnergyMonitor. 2022. Available online: https://learn.openenergymonitor.org/sustainable-energy/building-energy-model/ventilation (accessed on 6 May 2022).
Figure 1. The dimensions of the building.
Buildings 12 00791 g001
Figure 2. The design and dimensions of the proposed window-windcatcher. (A) 2D view (B) 3D View.
Buildings 12 00791 g002
Figure 3. Geographical locations of the three cities we consider (Cardiff, Doha and Amman).
Buildings 12 00791 g003
Figure 4. (A) Temperature and (B) Total Wind Velocity (TWV) in 2021 in Amman, Cardiff, and Doha.
Buildings 12 00791 g004
Figure 5. (A) Internal and external computational domains—two planes at 1 m and two planes at 1.7 m; (B) computational setups of temperature and wind velocity.
Buildings 12 00791 g005
Figure 6. CFX mesh of the CAD model presented in Figure 2 and Figure 3 (building and window-windcatcher).
Buildings 12 00791 g006
Figure 7. Mesh analysis—average velocity at 1.7 m offset (internal plane).
Buildings 12 00791 g007
Figure 8. Convergence of results.
Buildings 12 00791 g008
Figure 9. Turbulence kinetic energy profile at the 1 m interior plane (A and B: High-turbulence region, C: Low-turbulence region).
Buildings 12 00791 g009
Figure 10. Turbulence kinetic energy profile at the 1.7 m interior plane (D: High-turbulence region, E: Low-turbulence region).
Buildings 12 00791 g010
Figure 11. Velocity profile at the 1 m interior plane (H, F and G: High-velocity regions).
Buildings 12 00791 g011
Figure 12. Velocity profile at the 1.7 m interior plane (I and J: High-velocity regions).
Buildings 12 00791 g012
Figure 13. Streamlines at the 1 m interior plane (APR: Air purifiers region, SNZVR: safe near-zero-velocity regions).
Buildings 12 00791 g013
Figure 14. Streamlines at the 1.7 m interior plane (APR: Air purifiers region, SNZVR: safe near-zero-velocity regions).
Buildings 12 00791 g014
Figure 15. Streamlines at the 1 m plane (internal and external domain).
Buildings 12 00791 g015
Figure 16. Streamlines at the 1.7 m full plane.
Buildings 12 00791 g016
Figure 17. Average turbulence kinetic energy of the interior planes (1 m and 1.7 m) using a Window-WindCatcher (WWC) and Without Window-WindCatcher (WWWC).
Buildings 12 00791 g017
Figure 18. Average velocity of the interior planes (1 m and 1.7 m) using a Window-WindCatcher (WWC) and Without Window-WindCatcher (WWWC).
Buildings 12 00791 g018
Figure 19. Actual ventilation rate using a Window-WindCatcher (WWC) and Without Window-WindCatcher (WWWC).
Buildings 12 00791 g019
Figure 20. The actual-to-required ventilation ratio using Window-WindCatcher (WWC) and Without Window-WindCatcher (WWWC).
Buildings 12 00791 g020
Figure 21. Actual ventilation rate with respect to the total wind velocity.
Buildings 12 00791 g021
Figure 22. Actual-to-required ventilation with respect to the total wind velocity.
Buildings 12 00791 g022
Table 1. Mesh properties.
PropertyValue
Elements maximum size (mm)500
Number of elements 2.19 × 10 6
Growth rate1.2
Defeature size (mm)2.5
Curvature minimum size (mm)5
Curvature normal angle (degree)18
Skewness0.21188
Orthogonal Quality0.78694
Inflation transition ratio0.75
Inflation number of layers5
Publisher’s Note: MDPI stays neutral with regard to jurisdictional claims in published maps and institutional affiliations.

