1. Introduction
Unreinforced masonry (URM) construction has existed since the ancient times to fulfill one of the bare necessities for the survival of mankind: shelter. All around the world, there are numerous historical masonry structures and monuments of ancient civilizations that had withstood the test of time and natural disasters. In today’s world, with the high advancement of construction technology, URM construction is only an alternative, and in fact, not a very popular one, especially after the use of concrete and steel for the construction of new structures. URM construction has tried to compete with other construction materials by the introduction of its recently developed variants, such as confined masonry or reinforced masonry, but the use of these specific types of masonry construction has never been popular worldwide like the URM, except in some specific locations (confined masonry in South American countries and reinforced masonry in the United States). However, it should be stated that non-engineered URM still constitutes a considerable percent of the building stocks, especially in earthquake-prone Mediterranean, Asian and South American countries. These structures are generally in the form of old residential buildings in small towns and rural areas, and they possess many structural deficiencies. During the past earthquakes, the general observation regarding non-engineered URM buildings is that they are highly vulnerable to seismic action, and they may experience severe damage when subjected to earthquakes with even moderate intensity levels.
Modeling and analysis of masonry structures is a challenging task due to several reasons. First, structural walls constitute a non-homogeneous continuum with highly nonlinear and complex behavior when compared to the material characteristics of basic ingredients of these walls, i.e., masonry units and mortar. Moreover, it is not easy to determine the material properties of the ingredients due to non-standard production of masonry units and inconsistency in the workmanship. It becomes even harder to identify the interface characteristics of masonry and mortar, and in most of the cases, the values of these enhanced parameters are generally assumed. For instance, in the cases of missing material properties, such as masonry compressive strength or modulus elasticity of masonry, some generic values from the available standards or technical documents are employed as a gross assumption for the masonry material type under consideration. Last but not least, the structural integrity and the connections between structural units, such as walls, piers, spandrels and floors, may be complex or not well defined, especially in the presence of openings. This issue generally hinders the development of a standard structural model, as in the case of frame structures, due to complicated load transfer paths.
Considering all of the aforementioned challenges of masonry modeling and analysis, researchers have focused on different modeling strategies and approaches to simulate masonry behavior within reliable measures. From the simplest to the most complex, these modeling approaches can be listed as macro-wall modeling, equivalent frame modeling and 2D (or 3D) continuous/discrete refined modeling. Macro-wall modeling approach is popular due to its simplicity and practicality, although it contains gross assumptions, such as homogeneous and isotropic material properties throughout the wall with few global structural parameters, which should be determined through experimental or analytical research [
1]. It is possible to reflect in-plane and out-of-plane failure modes of the walls in this approach, but it is not possible to simulate detailed parameters based on micro-modeling (such as interface properties between mortar and the unit). This approach has been extensively used in seismic codes [
2,
3] as a simplified empirical approach with simple stress checks and geometrical limitations. Rigid block analysis can be considered a variant of macro-modeling, which is more suitable for walls with low axial stress and therefore can exhibit rocking and sliding failure modes [
4]. A recently popular approach for modeling masonry structures is the equivalent frame method, which considers masonry piers and lintels as equivalent columns and beams that are connected by rigid members to form a frame structure [
5,
6]. The complexities of the equivalent frame method come mostly from the irregularities in geometry, which make it hard to idealize the structure. The last approach to mention is the continuous/discrete refined modeling that has been employed for the analysis of masonry structures in different forms, such as the finite element method (FEM) [
7,
8] or the relatively new discrete element method (DEM) [
9,
10]. In these methods, the whole medium is solved in a numerical manner by using a mathematical formulation based on the constitutive properties of each element that discretize the medium, and the solution can be dominated by continuous and discontinuous material behavior depending on the nature of the problem. The drawback of these techniques is that they require high computational effort and advanced structural engineering background.
It is not easy to assess the seismic performance of ordinary and non-engineered URM buildings, since the aforementioned analytical and numerical analysis approaches in the literature are generally appropriate for engineered masonry structures with well-defined design and construction practices. Hence, it becomes a waste of time and effort to employ complex and detailed structural modeling and analysis approaches for seismic performance assessment of non-engineered URM buildings. The best option is to use simplified approaches, which require a good understanding of the actual behavior under seismic action. To achieve this task, the only way is to gather and examine field data from real structures or experimental data from physical test models under laboratory conditions.
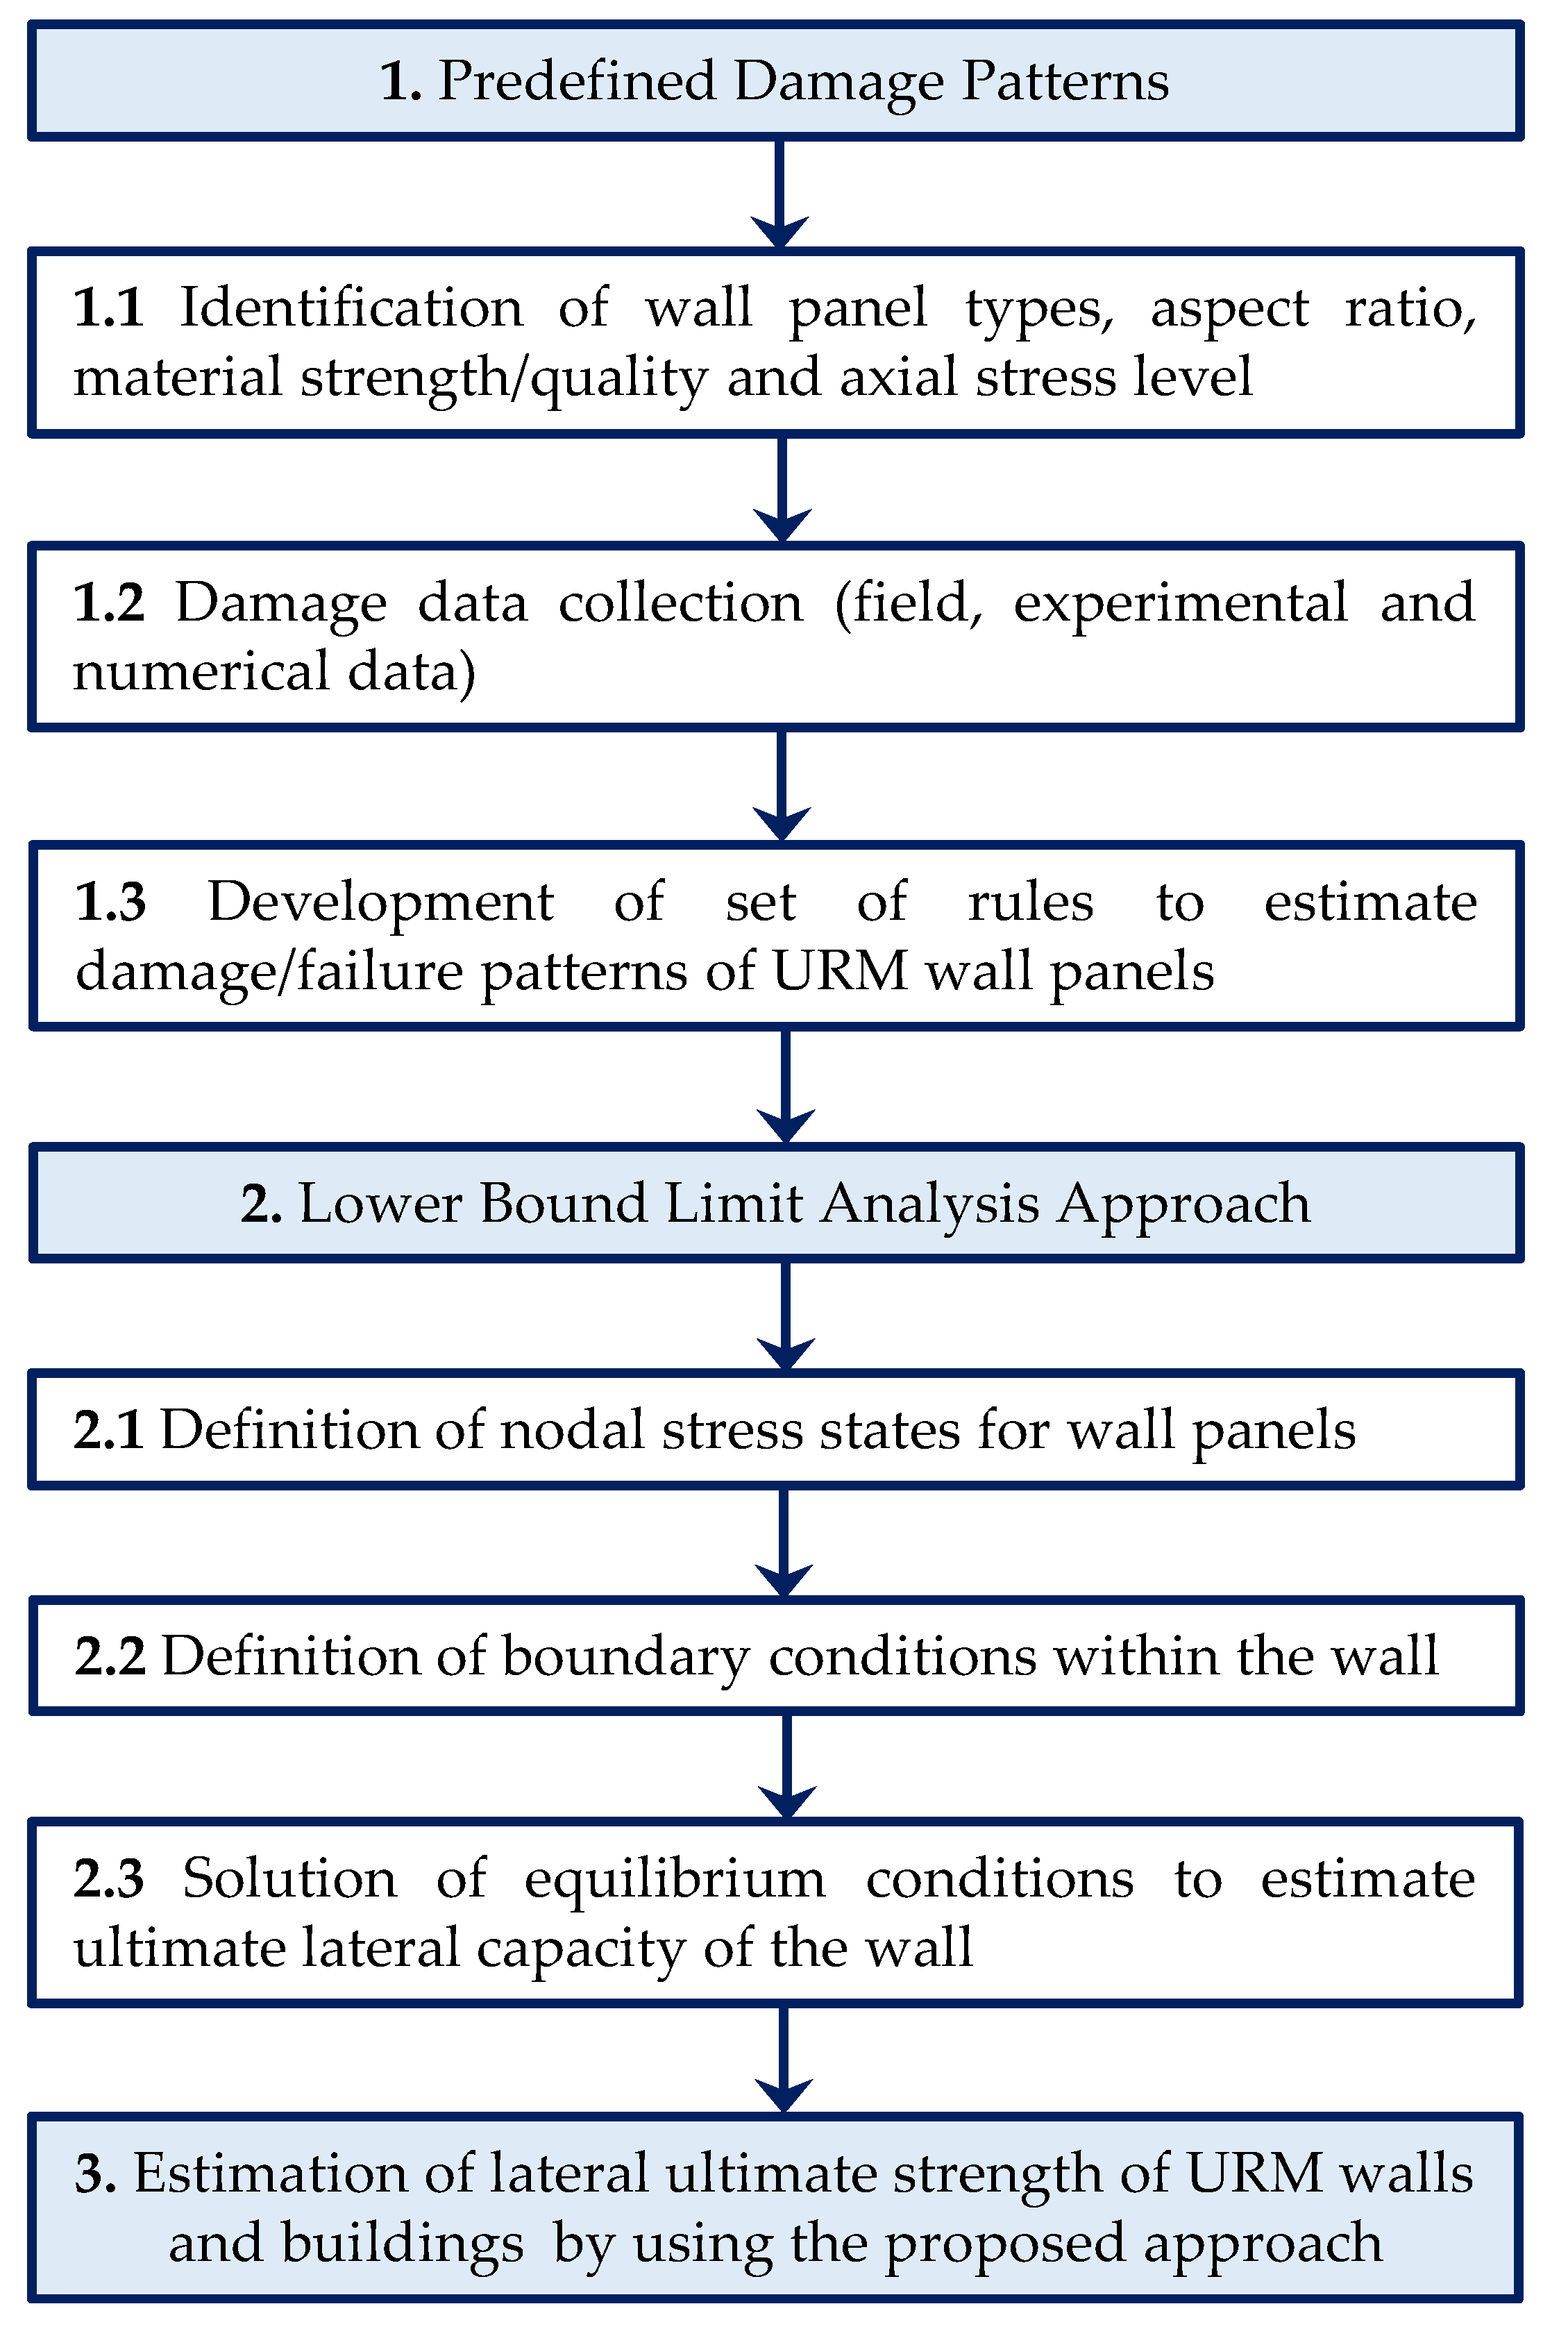
In this study, a two-phase simplified approach is proposed to predict the in-plane strength capacity of URM walls and also buildings (
Figure 1). In the first phase, in-plane damage and failure patterns of URM walls are determined from available observational (field) data, experimental data and also from numerical analysis data. Then, a set of rules are proposed to estimate damage and failure patterns of URM wall panels. In the second phase, this valuable information is employed to develop a simplified numerical model with a coarse mesh for the masonry wall, which is consistent with the crack formation at the ultimate state. Then, lower-bound limit analysis approach is used to predict the failure load of the wall without any further sophisticated analysis. At the final stage, the proposed approach is verified by comparing the numerical results with experimental data from URM wall tests. By the assistance of this approach, it becomes possible to estimate the lateral capacities of ordinary, non-engineered URM walls and buildings from damage patterns at failure stage. As an ultimate goal, this structural information can be used for seismic risk assessment of regions where the building typology considered in this study governs the building stock. In this paper, wall damage is assumed to occur within the plane of the wall due to cracking, which is a function of the in-plane behavior modes explained in
Section 2.
2. Materials and Methods
This section explains the methodology used for the proposed approach in accordance with the flowchart in
Figure 1. Only the input materials, modeling approaches and analysis methods involved in the process are explained in this section. All the results related to the numerical applications and verification studies together with some discussions of these results are provided in
Section 3.
2.1. Identification of the URM Wall Parameters
The main goal in the first phase of the study is to understand in-plane damage mechanisms and failure modes of URM walls in terms of major geometrical, material and loading properties of the wall by using an extensive database obtained from different sources. In order to achieve this task, masonry walls are classified according to number and type of openings, material properties, axial stress level, component geometry and observed damage pattern.
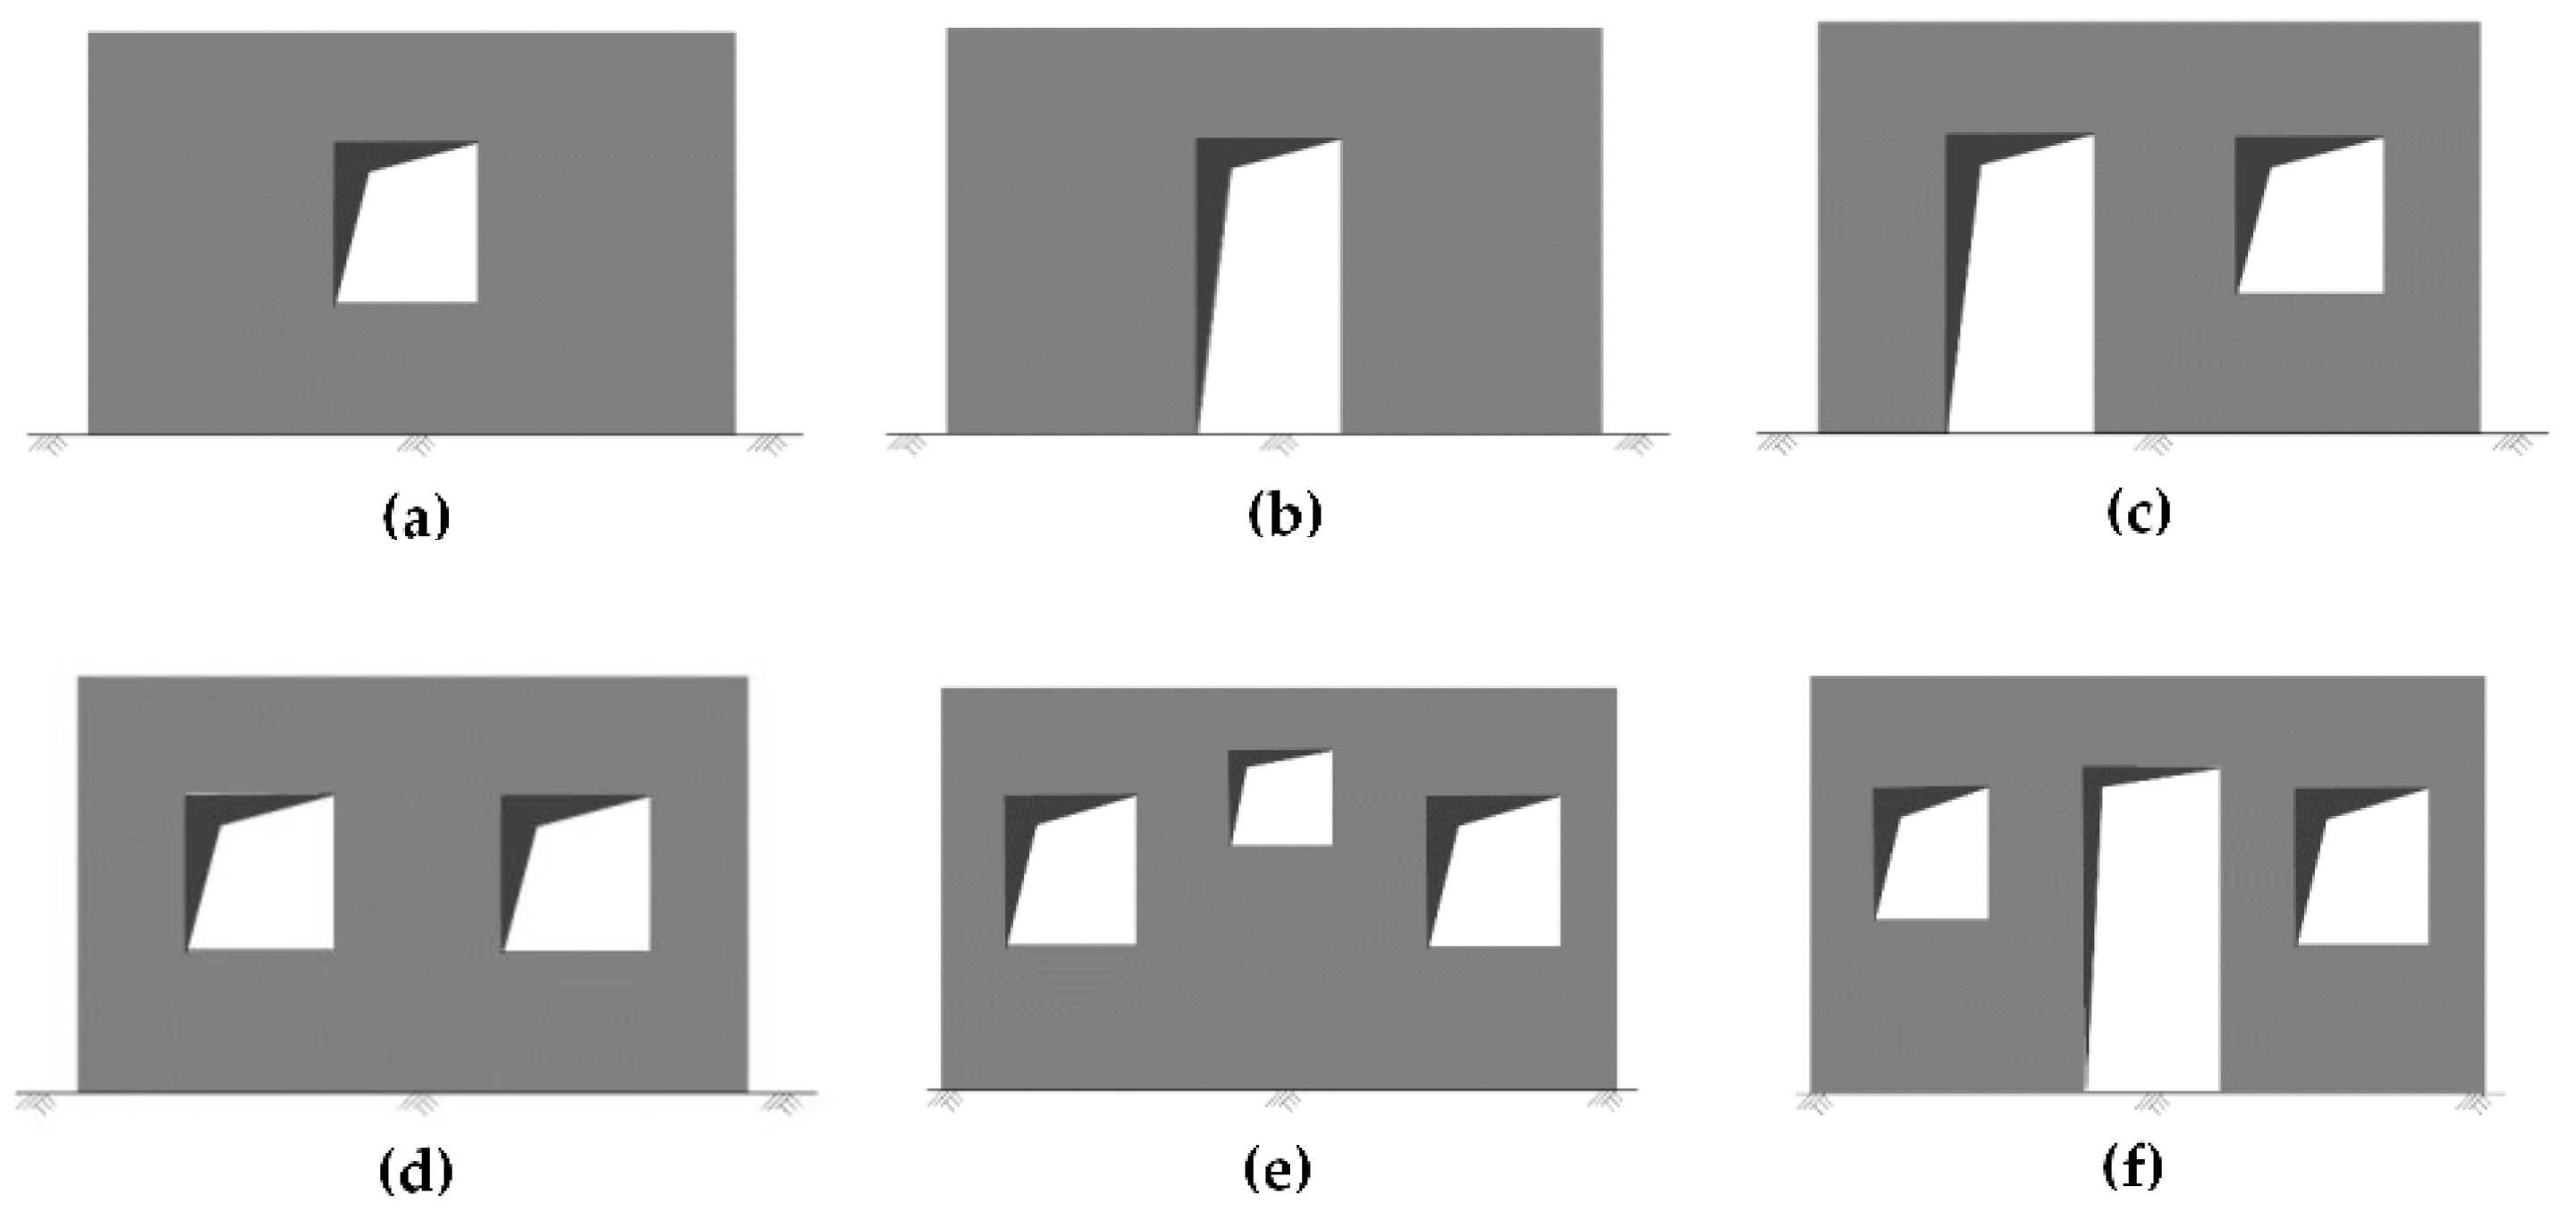
First, URM walls are classified into six different typologies according to the type and number of openings (
Figure 2) as Type 1 (single window opening), Type 2 (single door opening), Type 3 (single door and window opening), Type 4 (two window/door openings), Type 5 (more than two window openings) and Type 6 (at least a door opening and two or more window openings); note that a solid wall with no perforations can be regarded as a reference or Type 0 wall.
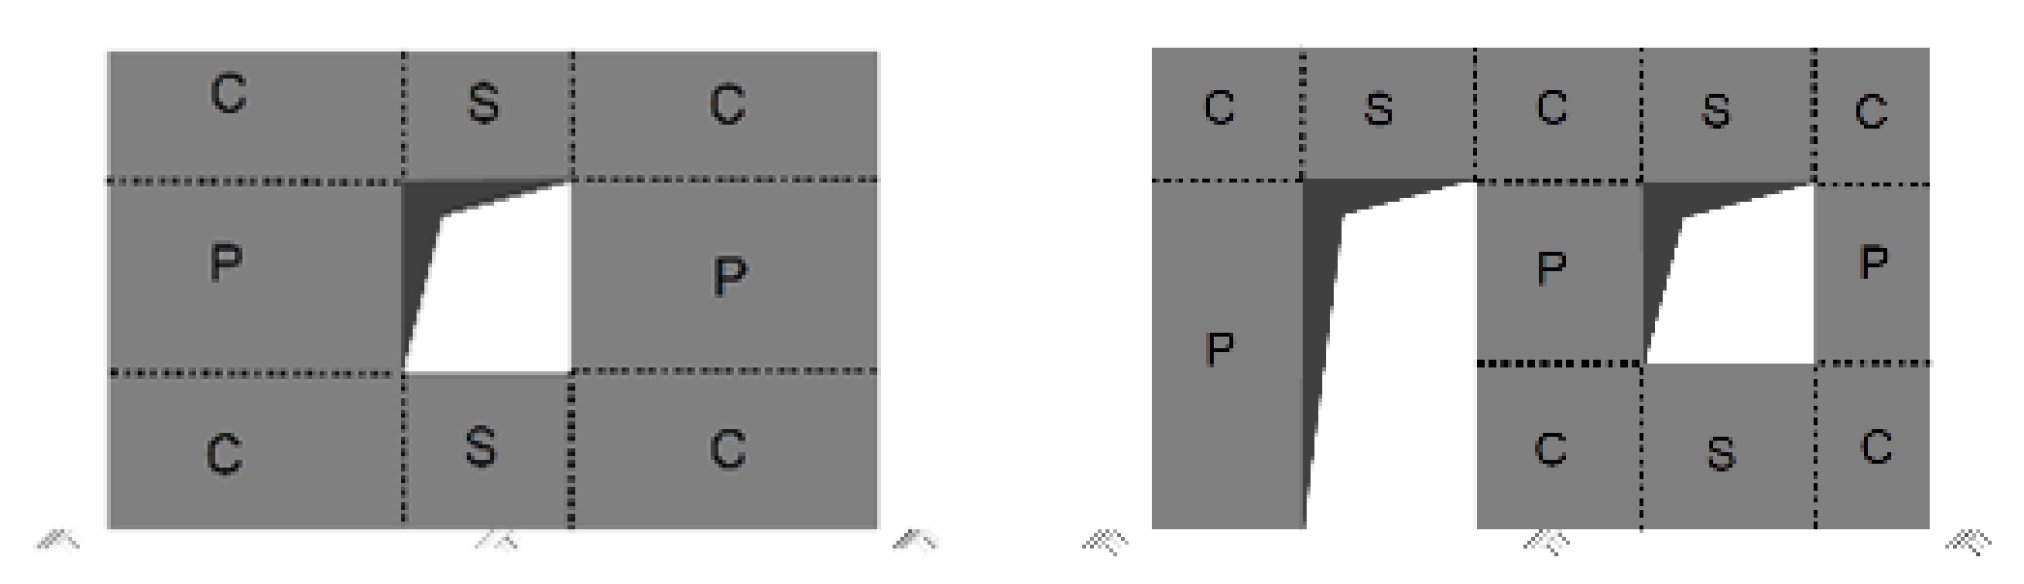
In order to distinguish the damage patterns in URM walls with openings in a more systematic manner, the walls are divided into panels according to their locations as pier (P), spandrel (S) and corner (C). The panel definitions are illustrated for Type 1 and Type 3 walls in
Figure 3. In this way, it becomes possible to obtain the aspect ratio (
λ) or, in other words, the height-to-length ratio of the panels, which is known to have a significant effect on the in-plane behavior of piers and spandrels. In this study, the panels are classified as squat (
λ < 1.0), regular (1.0 <
λ < 2.0) and slender (
λ > 2.0) in terms of their aspect ratios.
Another important parameter for the identification of damage mechanism and crack pattern is the axial stress level on the URM wall. In this study, three different levels of axial stress are considered as low, medium and high. Low level of axial stress represents walls in a single-story building or walls at the top story of a multistory masonry building (i.e., no story above). In a similar manner, medium level of axial stress belongs to URM walls at the intermediate story of a three-story building or the ground story of a two-story building (one story above), whereas high level of axial stress is valid for walls with at least two stories above them (i.e., ground story of a three-story building).
Masonry wall material is another important parameter that governs in-plane seismic performance of URM walls. It is a fact that local variations of mechanical properties for masonry wall materials are high. However, it can be stated that masonry units with standard production (i.e., concrete masonry unit, factory clay brick, auto-clave aerated concrete, etc.) always have superior mechanical properties when compared to locally produced units (local clay brick, adobe unit, natural stone unit, etc.). It should also be noted that mortar properties and workmanship affect in-plane behavior of URM walls in addition to masonry units. Overall, the quantification of in-plane strength capacity of URM walls in terms of material properties is a complicated task and shows drastic regional variations. In this study, the observed capacity (and also quality) of URM walls is classified in three groups as low, medium and high, for which the categorization is performed according to the available material types in Turkish construction practice.
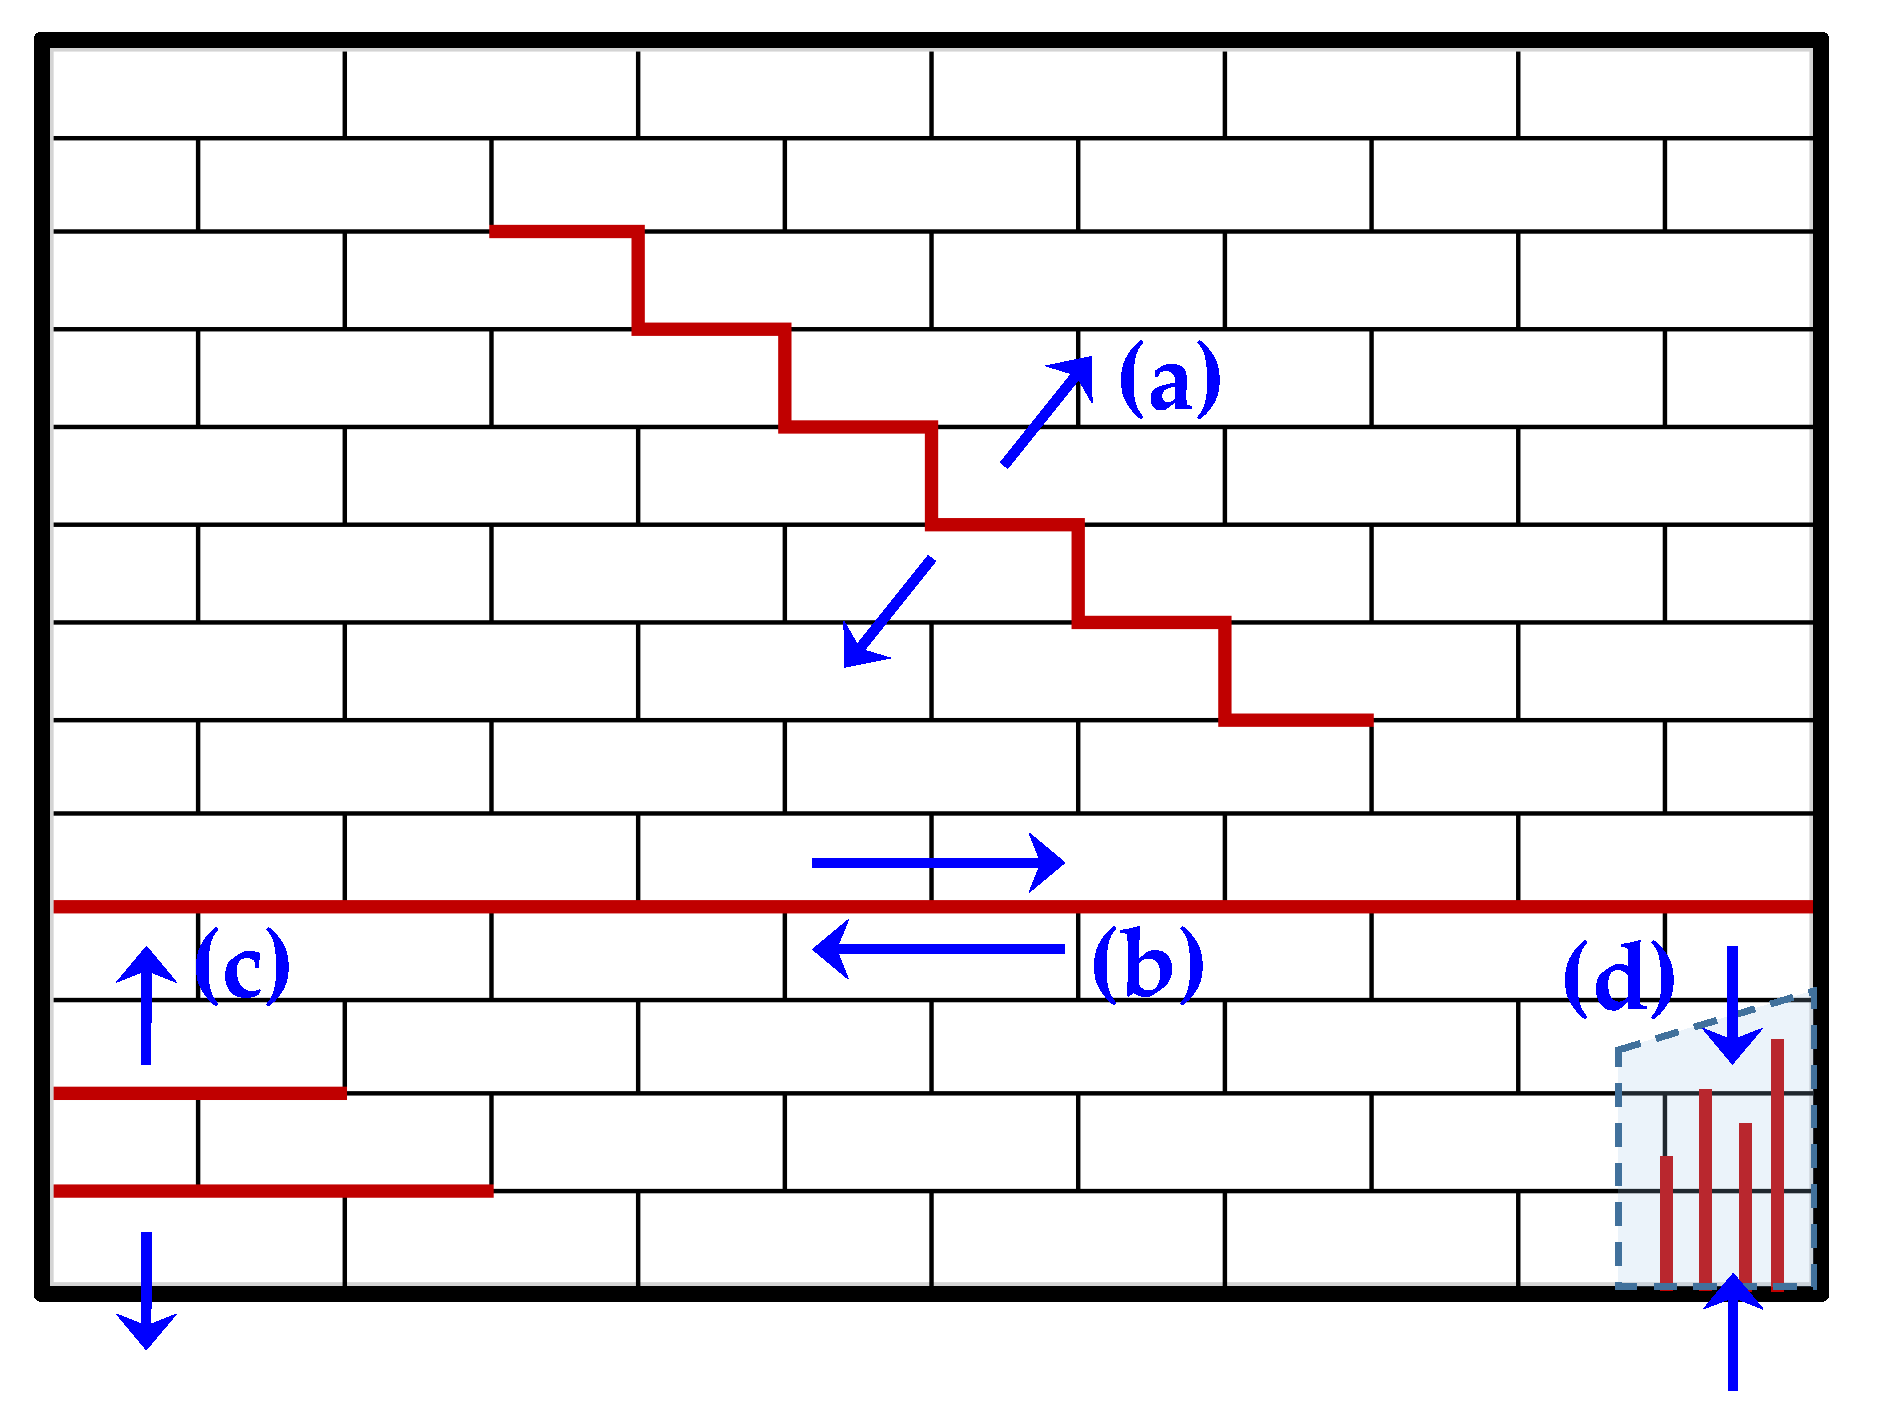
The aforementioned parameters (i.e., panel geometry, axial stress level and material strength and quality) play important roles in determination of the in-plane failure modes of URM panels. In this study, four major in-plane failure modes observed under seismic action are considered, which are diagonal tension failure, sliding shear failure, rocking (joint tension) failure and toe-crushing failure, as schematically shown in
Figure 4.
2.2. Collection of Damaged Wall Data from Field Investigations, Experimental Tets and Numerical Analysis
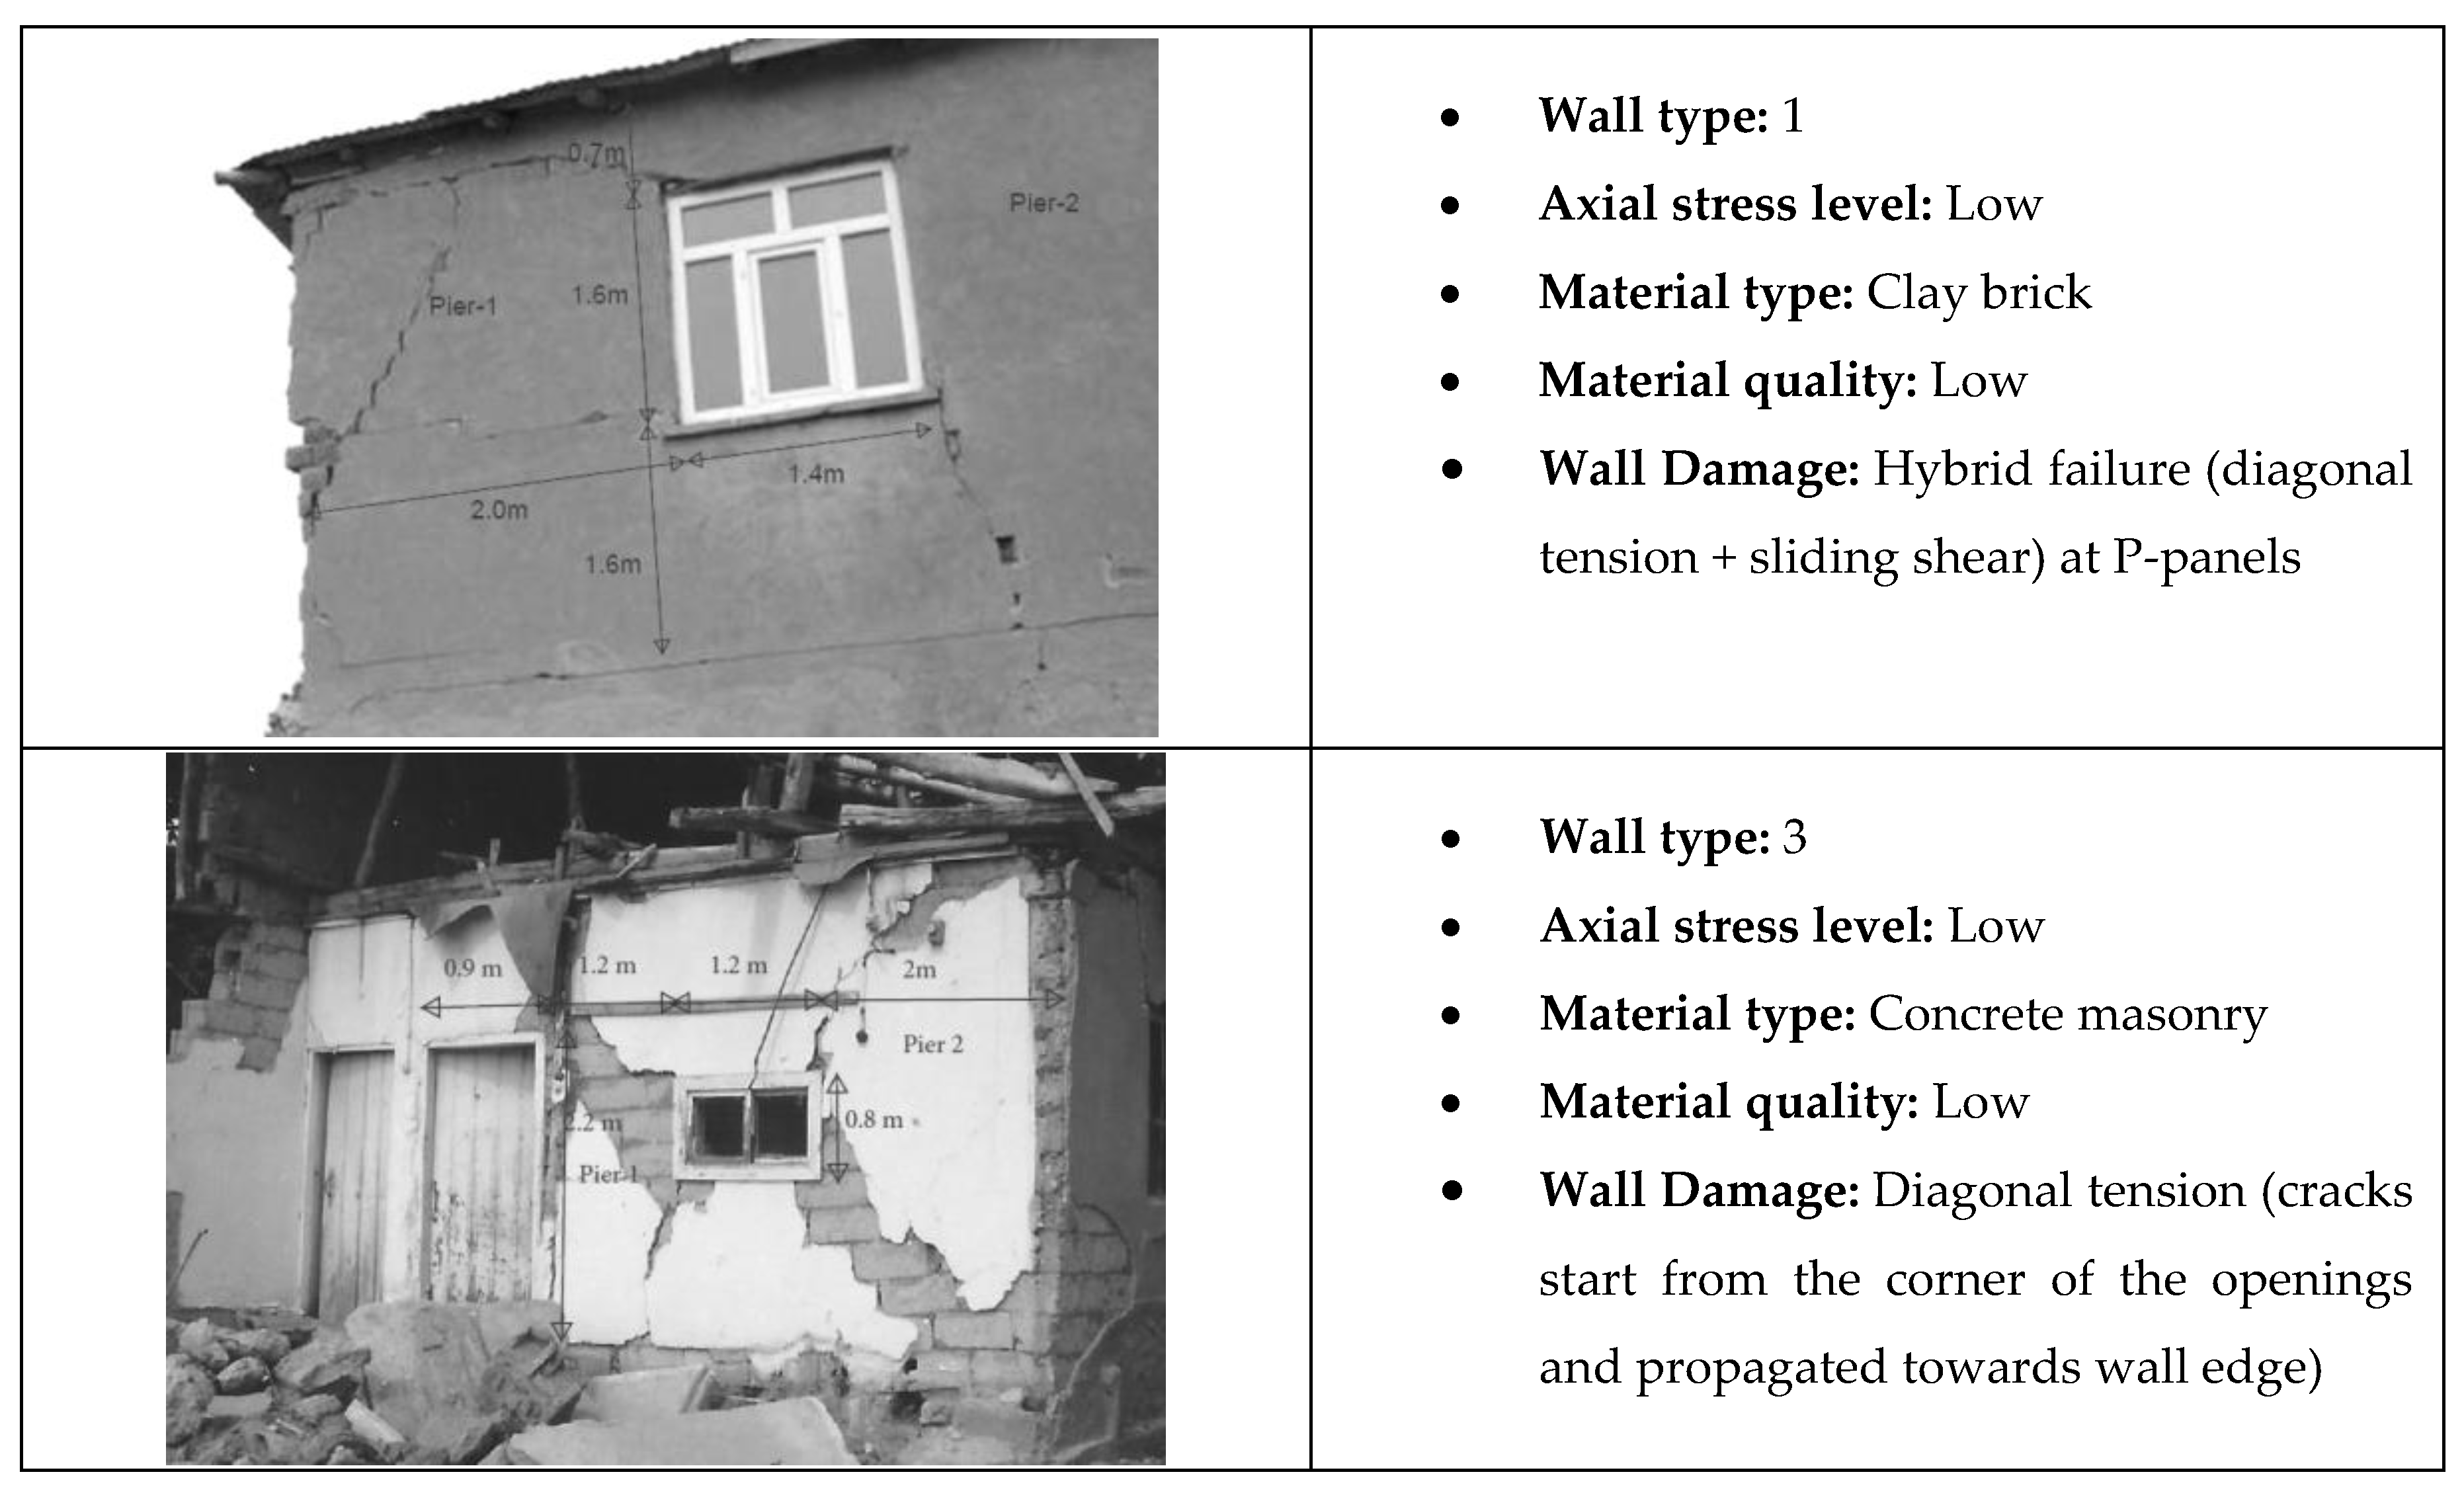
The first set of data is collected from field observations of seismic damage on perforated URM walls. Most of this classified information was obtained through a vast number of photos and notes taken during the post-earthquake site investigations of the authors after major earthquakes in Turkey, including the 1995 Dinar [
11], 1999 Kocaeli and Duzce [
12], 2010 Elazig Karakocan [
13,
14] and 2011 Van Ercis [
15] earthquakes. The remaining data were taken from the technical reports and papers, which include detailed information regarding URM damage after major earthquakes in different parts of the world [
16,
17,
18,
19,
20,
21,
22,
23,
24]. An example set of collected data is presented in
Figure 5. The complete data set for observed URM wall damage can be obtained from Ref [
25].
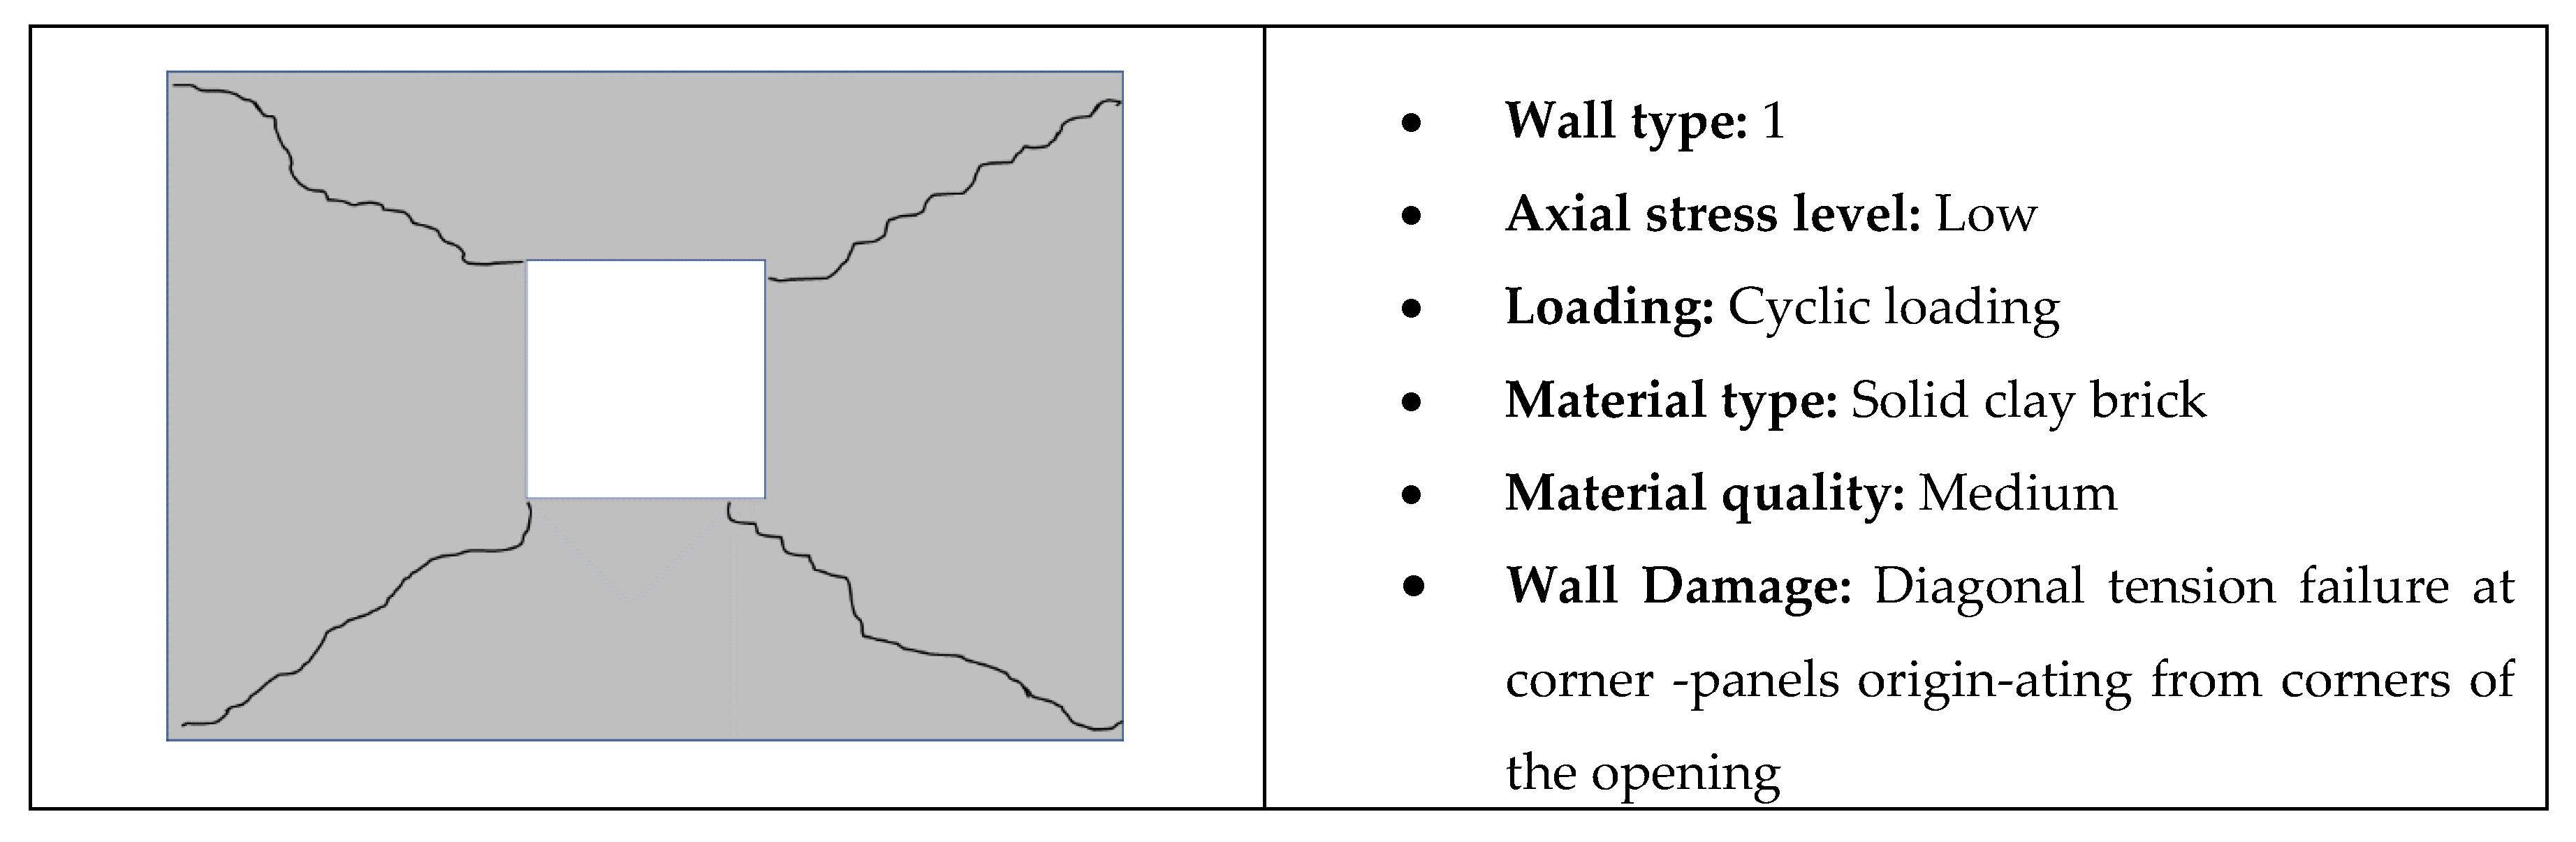
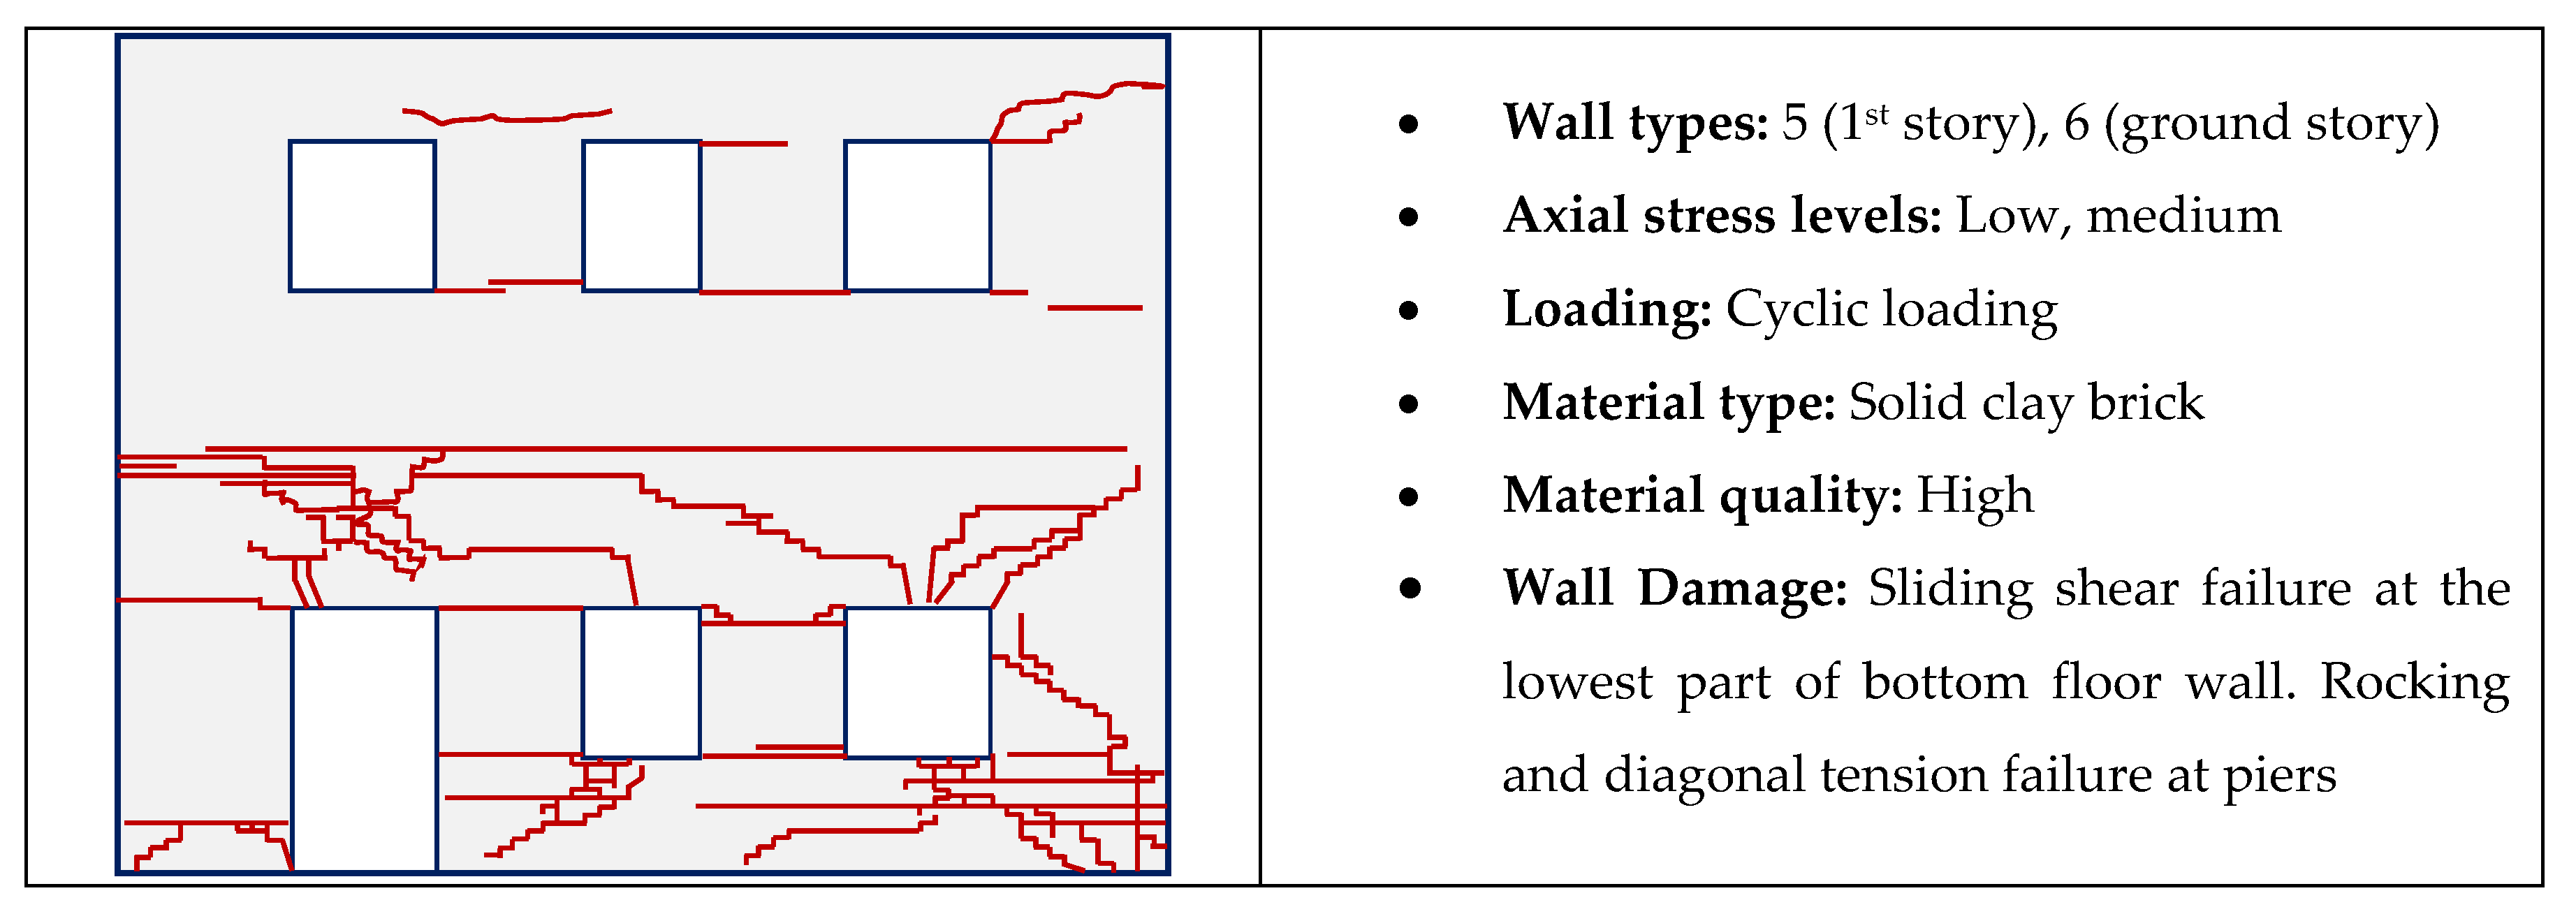
The second set of data is collected from experimental tests of URM wall and building specimens by examining numerous related papers and reports from the literature [
26,
27,
28,
29,
30,
31,
32,
33,
34,
35,
36,
37]. Just like in the case of observed damage, the collected data include wall aspect ratio, material type, axial load level and the corresponding damage/crack pattern. An additional parameter is the loading protocol (i.e., quasi-static, pseudo-dynamic or real-time dynamic test). Ultimate damage states for an example set of experimental data are illustrated in
Figure 6. The complete data set for experimental URM wall damage can be obtained from Ref [
25].
As stated in the last two paragraphs, more than 100 cases are gathered in order to examine the relationship between in-plane URM wall damage (i.e., cracking patterns and failure modes) and major structural parameters (panel geometry, material properties and axial load level). When the collected observational and experimental URM wall data are considered together, it becomes possible to make some generalizations. These generalized observations can assist in the estimation of damage mechanisms and failure modes of P and S panels in
Figure 3 by employing the aforementioned major structural parameters. Accordingly, for slender solid wall panels, rocking behavior seems to govern. However, in the case of low strength/quality of masonry unit and mortar, failure mode may shift to sliding shear, since the wall experiences premature failure across weak planes before the stress transfer through the wall panel is completed. For regular and squat URM wall panels, diagonal tension becomes the dominant failure mechanism under moderate and high levels of axial load and nominal level of material strength/quality. If the material properties are worse, the failure mode can shift to sliding shear from diagonal tension or to mixed mode. In low levels of axial stress, the possibility of experiencing sliding shear failure becomes high, especially for poor material strength/quality. For URM walls with openings, it is observed that the cracks initiate from the corners of these openings. Another finding is that the crack propagation tends to follow the shortest path to the closest stress concentration zone, such as the corner of the wall or the adjacent opening. Last but not least, both actual and experimental structural behavior verifies that pier failure generally leads to complete failure of the structure, and individual pier failure can be estimated from the behavior of single solid wall panels. Here, it should be mentioned that the behaviors of URM wall panels are also affected by the location of the wall within the floor in the case of torsional irregularity due to uneven distribution of structural URM walls in the considered story of the building.
The third source of collected data is based on simplified numerical analysis of each wall type under ultimate loading conditions for the purpose of estimating the initial crack locations and their propagation through the perforated URM walls. A test specimen from the literature is selected for each of the six perforated URM wall types in
Figure 2, and the experimental results are compared with the numerical findings. Selected specimens are modeled by finite element meshes using shell elements in SAP2000 v14.1.0 Analysis Software [
38]. Ultimate lateral loading conditions that were applied to the real specimens are considered in the numerical modeling with the addition of gravity loads. The 2D numerical wall models include a rigid beam element at the top of the wall in order to distribute the load evenly through the wall length. The geometrical and material properties are taken from the references that describe the selected URM wall tests. Out-of-plane behavior is not taken into account in this study.
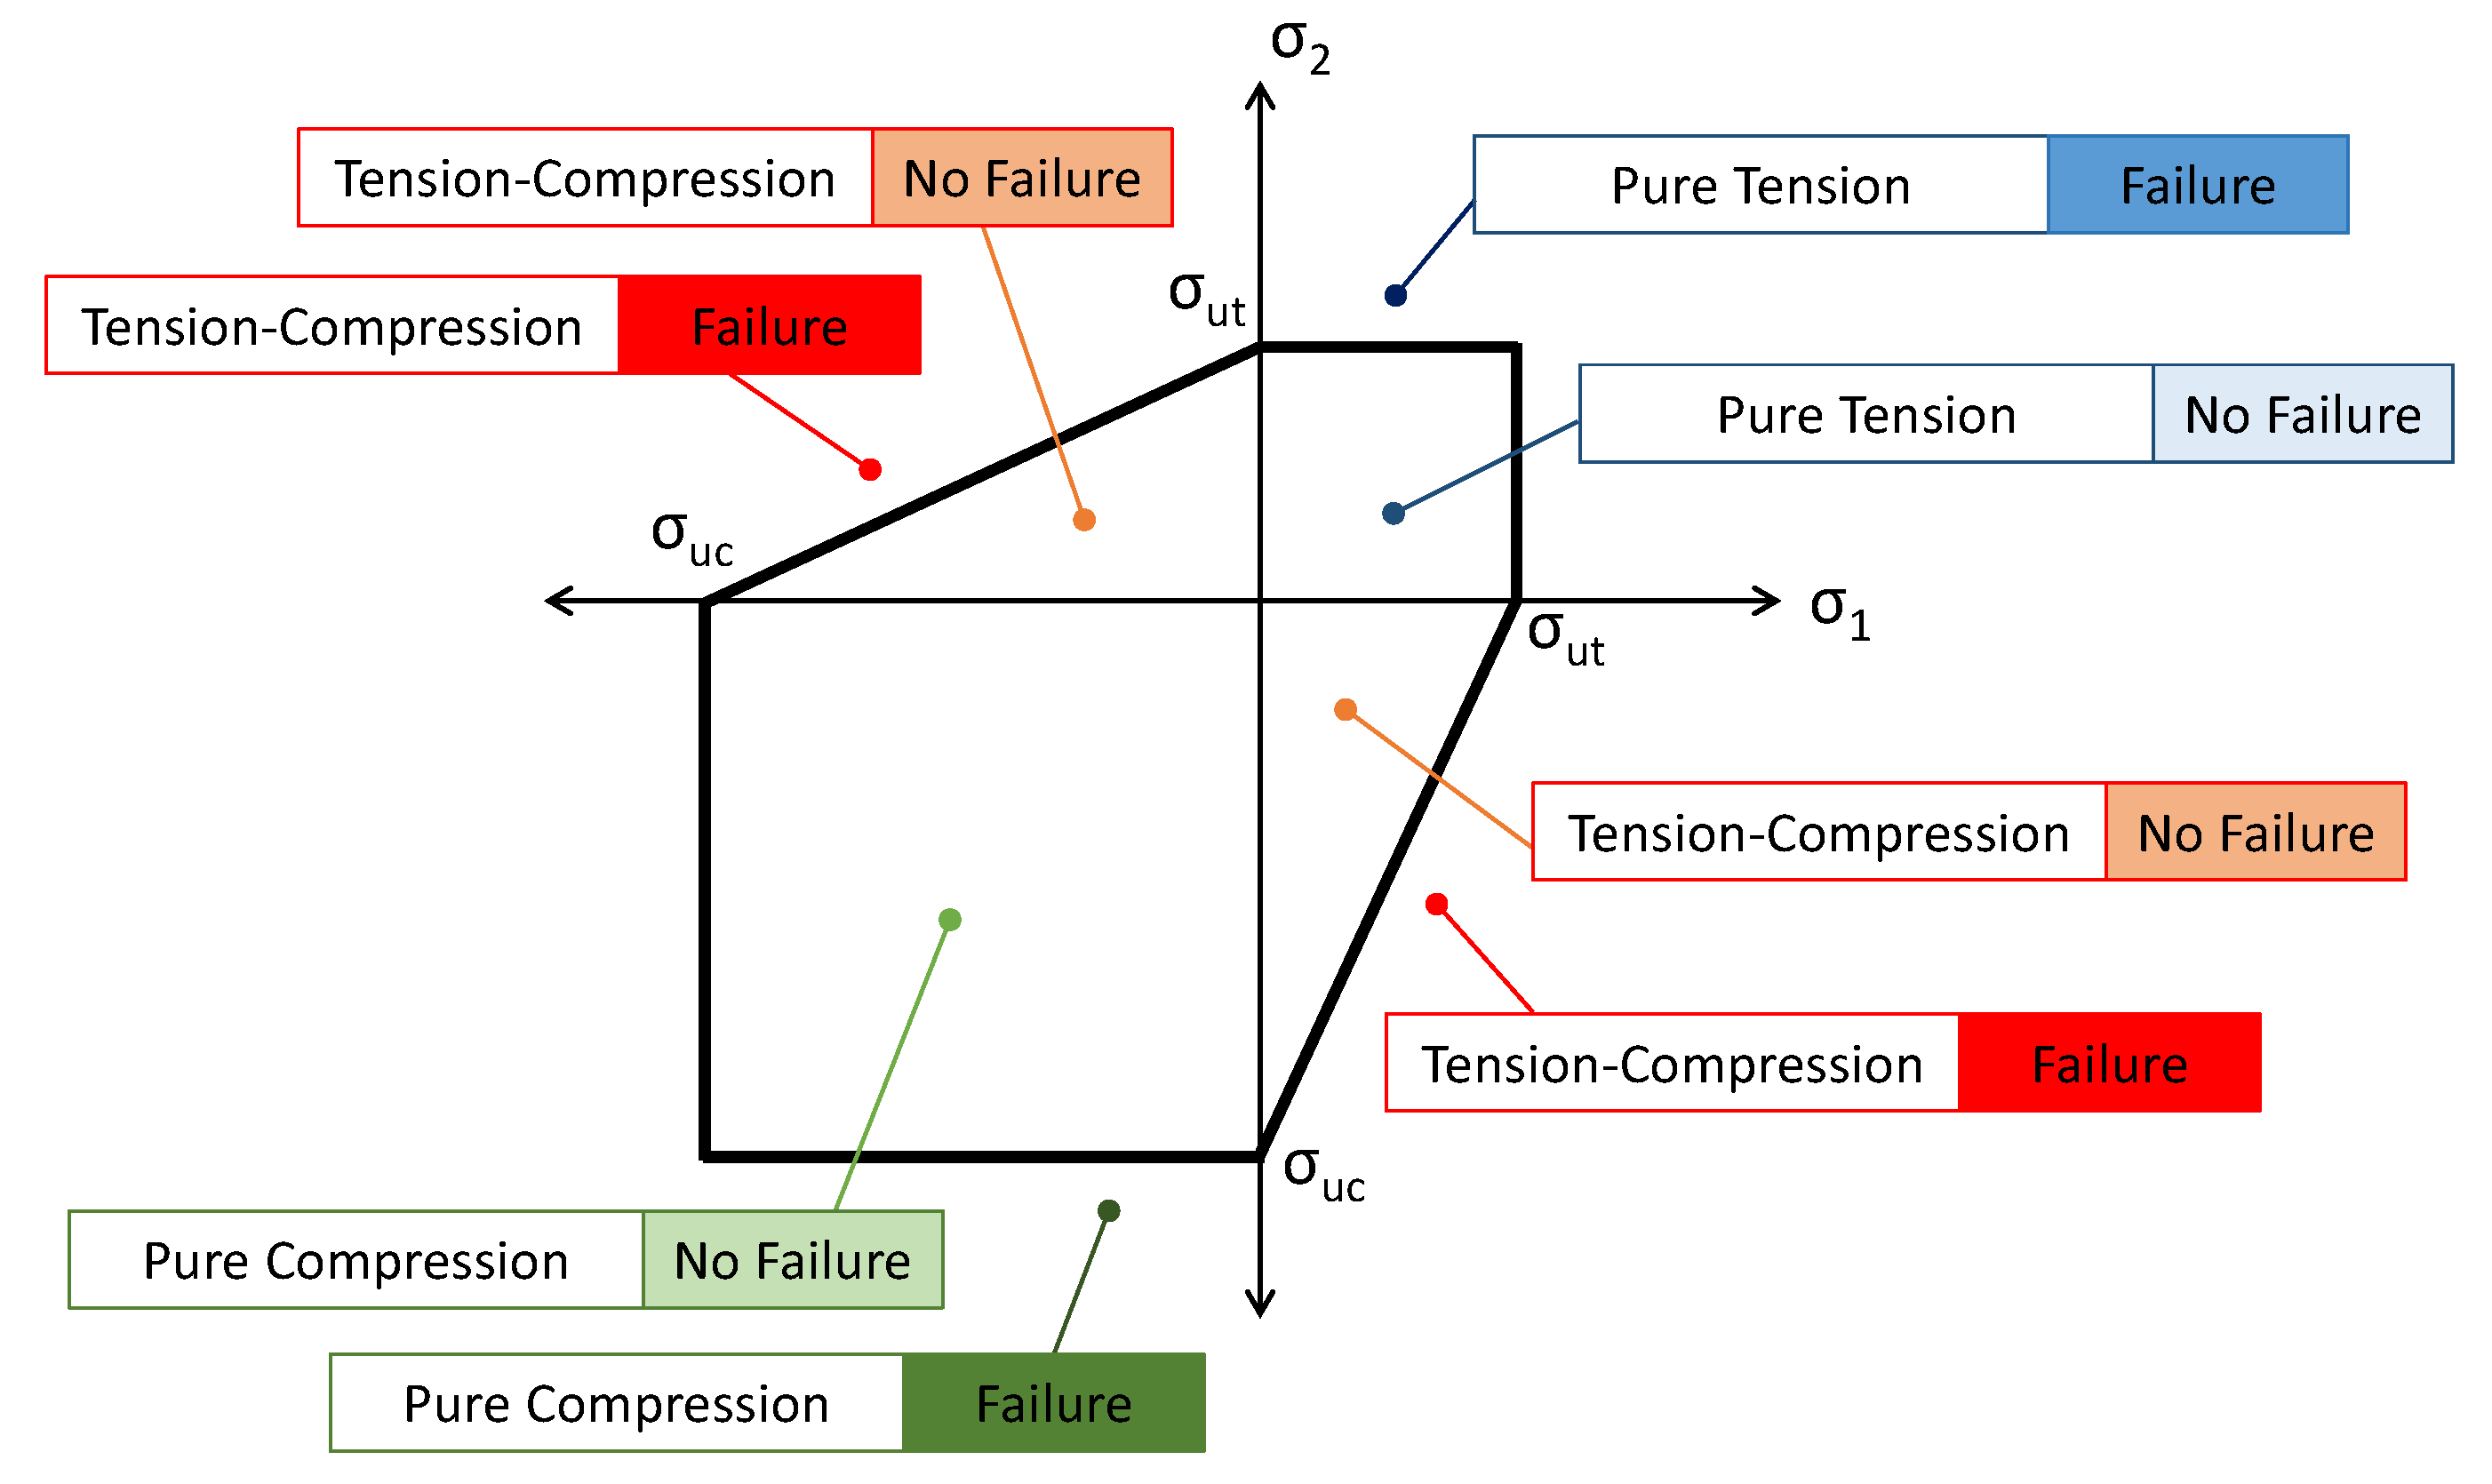
In the first stage of numerical analysis, ultimate load conditions are applied to the numerical wall specimens, and the principal stresses of the shell elements are obtained. Then, these values are compared with failure stress values that are obtained according to the Mohr–Coulomb failure criterion, which is a well-accepted failure theory in the literature and suitable for brittle masonry behavior with quite different strengths in states of compression and tension. Accordingly, eight different stress states are present for each cell in the wall mesh, as shown in
Figure 7. The light-colored stress states indicate below-failure levels, whereas dark-colored ones denote the failure in the given state of stress. This colored representation reveals the locations for the initial failure and the stress state of the wall at the ultimate loading conditions. The results of the numerical analysis are demonstrated in
Section 3.1 for wall types 5 and 6. The results on the remaining wall types and other details of the analysis procedure can be found in Ref [
25].
In the second stage of numerical analysis, the crack propagation is simulated by using an iterative procedure that includes cell removal from the mesh. Since stress distribution in the wall can be changed after the failure of the first shell element, the most overstressed adjacent cells are the next candidates for reaching the failure state. Hence, the cells at failure are removed from the mesh, and then, the adjacent cells are examined for whether they have reached their failure limits or not. In this way, it becomes possible to simulate the propagation of failure within the wall. The results of second stage numerical analysis are also provided in
Section 3.1.
2.3. Development of a Set of Rules to Estimate Damage Patterns of URM Walls
Based on the wall damage data obtained from field observations, experimental studies and numerical analysis, a set of rules are proposed to estimate the damage patterns of wall panels at ultimate loading conditions. These rules are obtained from the following generalizations:
Low material strength/quality leads to sliding shear failure in URM walls. However, aspect ratio and axial load level also play important roles in the development of sliding shear failure.
Material strength/quality is composed of two variables: unit strength and mortar strength. When mortar has less strength than unit, with low aspect ratio and axial load level, sliding shear failure becomes the most common failure type for URM walls.
For slender URM wall panels, flexural/toe-crushing failure is generally dominant. However, the failure mode shifts to diagonal tension or sliding shear for regular and squat URM walls.
For URM walls with low aspect ratio and high axial load levels, diagonal tension failure is more expected than the other types of failure. In the case of low axial load level with low material strength/quality, sliding shear failure becomes the predominant failure mode in URM walls.
Perforation geometry has a great impact on initializing and propagation of cracks. Cracks are initiated from the stress concentration locations at corners of the openings and tend to follow the shortest path toward other stress concentration points or free edges of piers.
The aforementioned observations are gathered to form a set of rules for the estimation of failure modes in terms of wall panel properties, as presented in
Table 1. For the sake of simplicity, abbreviations are used in the table for the failure modes: “1” for diagonal tension failure, “2” for sliding shear failure and “3” for rocking/toe-crushing failure. A verification example for the set of rules in
Table 1 is illustrated in
Section 3.2.
2.4. Lower-Bound Limit Analysis Methodology
Limit analysis approach is a powerful analysis tool in structural engineering, as elastic analysis does not answer questions about reserve strength beyond elastic limit. Limit analysis has been widely employed to predict in-plane and out-of-plane masonry behavior at collapse after the pioneering work of Heyman [
39] who focused on historical masonry structures. In the last two decades, researchers have focused on the behavior of masonry arches, vaults and domes by using either the lower-bound theorem, i.e., the static approach [
40,
41,
42], or the upper-bound theorem, i.e., the kinematic approach [
43,
44], in the context of limit analysis, although studies also exist related to the behavior of masonry walls [
45,
46,
47]. Lower-bound limit analysis is employed in this study in order to predict the failure load of perforated masonry walls by making use of the predefined damage patterns that were explained in previous sections. Basically, the lower-bound limit analysis postulates that the external forces acting on a body are in equilibrium with internal stresses, such that the stress distribution in the body never violates the yield criterion. In order to develop a simplified model of internal stress distribution, the URM wall is divided into macro-panels, and the stress state of each panel is determined by considering the predefined crack patterns associated with that panel. The corners of wall panels are considered as nodes that carry the stress information for that particular panel. After obtaining the equilibrium conditions at the nodes of the panels by also checking the boundary conditions, ultimate stress states are calculated by using the Mohr–Coulomb failure theory. Thus, the ultimate load that can be applied on the wall before collapse is obtained. At this point, it should be stated that only in-plane failure modes are taken into consideration, and out-of-plane failure is assumed to be prevented. The following sub-sections summarize the proposed limit analysis methodology.
2.4.1. Identification of Nodal Stresses for Wall Panels
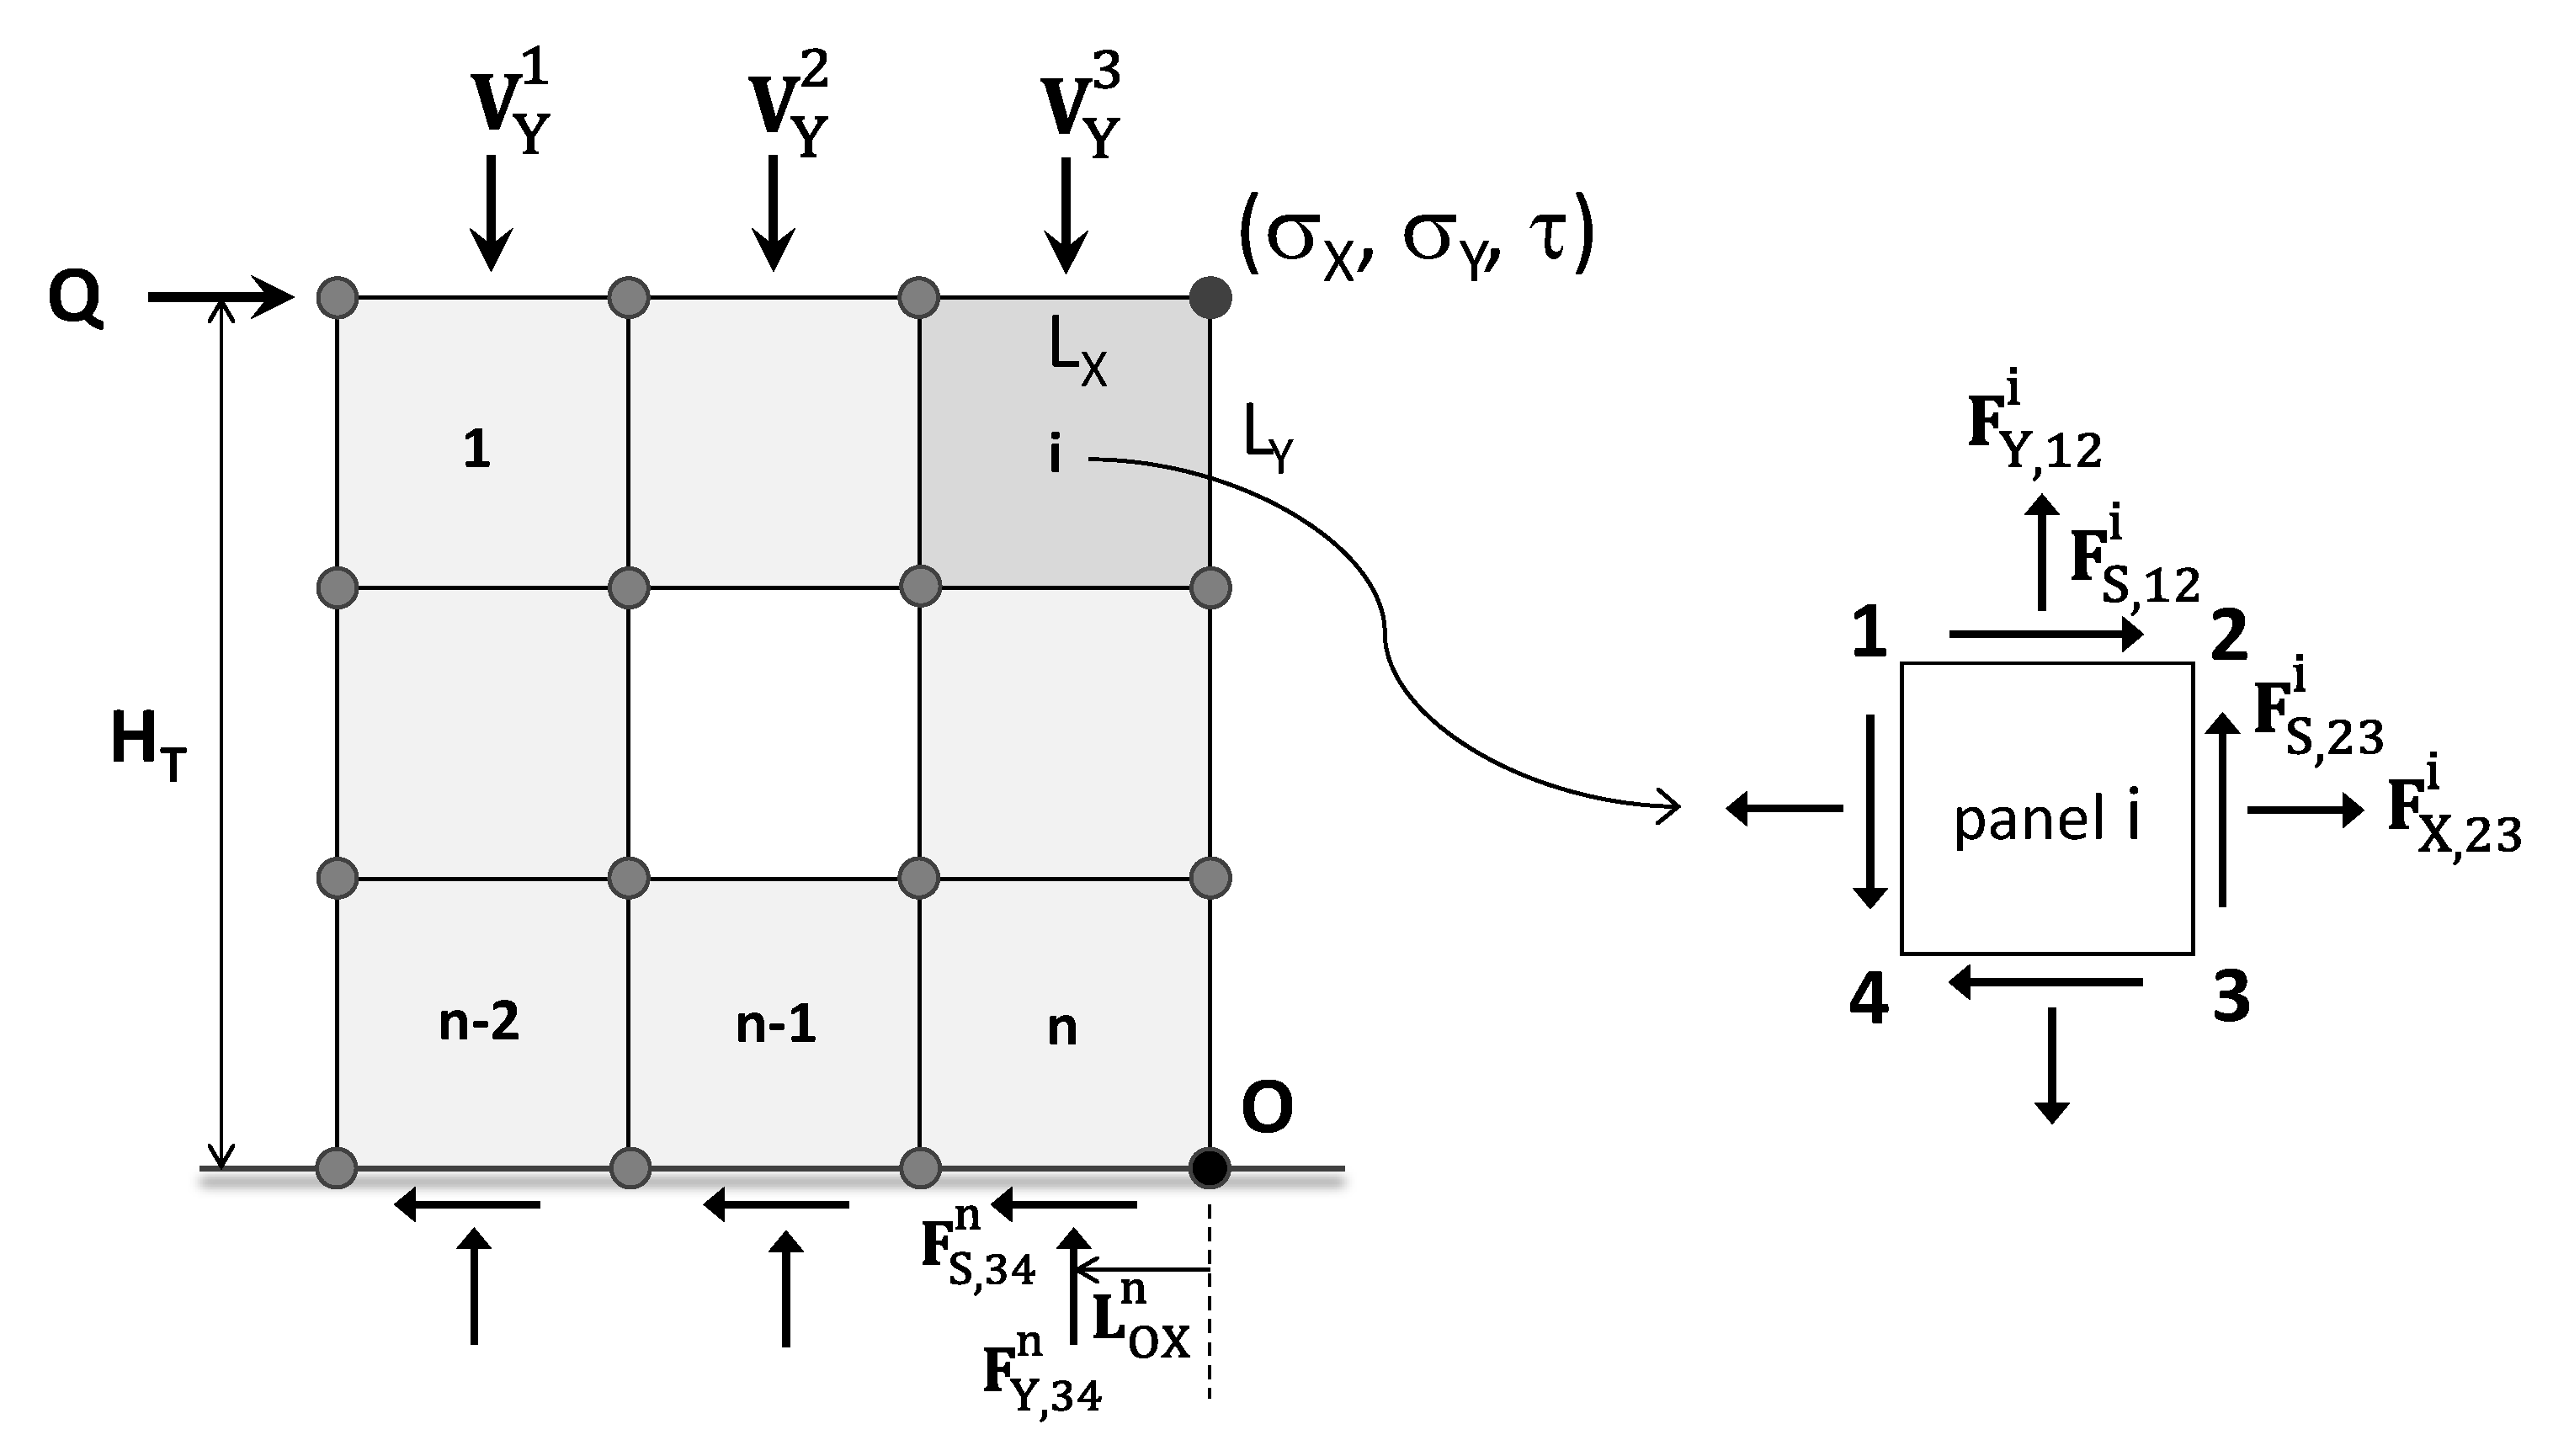
In the first stage of limit analysis, the masonry wall under concern is divided into macro-panels, as shown in
Figure 3. The corners of each rectangular panel are assumed to carry three in-plane stress components (two normal, one shear), which is consistent with the state of stress of that panel, as illustrated in
Figure 8. In the figure, Q denotes the unknown ultimate lateral force, and
stands for the known vertical load acting on the uppermost layer of panels, respectively. The nodal stresses are the unknowns in this lower-bound limit analysis problem, and they should be obtained through equilibrium conditions, as explained in the next sub-section.
2.4.2. Equations for Static Equilibrium and Boundary Conditions
In accordance with the lower-bound theorem, static equilibrium equations should be satisfied in both horizontal and vertical directions. Assuming linear variation of stress along each side of the panel, the resultant normal forces (, where i = 1–n and j,k = 1–4) and shear forces ( where i = 1–n and j,k = 1–4) acting on the sides of a typical panel are calculated, as given below.
The next step is to write the equilibrium equations for the acting resultant forces on the sides of each panel. An example set of equations is derived for panel
i in
Figure 8 as follows:
where
In these equations, σX and σY are the normal stresses, τ is the shear stress, LX and LY stand for the panel’s horizontal and vertical side lengths, t is the thickness of the panel.
In addition to Equations (1)–(6), another equilibrium equation is required, such that the resultant moment about the bottom-right corner O that is created by the forces acting on the wall should be equal to zero, i.e.,
In the above equation, is the moment arm from corner O to the application lines of the resultant normal forces at the lower-most layer of the wall (adjacent to the foundation), and is the wall height.
In addition, the boundary conditions on the top and sides of the wall and around the openings are applied to the nodes at the related corners of the panel as zero normal and shear forces on the free panel surfaces and location-specific values on the remaining panel surfaces (i.e., top surface of the wall and the surfaces around openings).
2.4.3. Application of Mohr–Coulomb Failure Criterion
According to the lower-bound limit analysis, none of the points on the wall should violate the yield function. Mohr–Coulomb failure criterion is applied to the stress states at each node of the wall, in accordance with the predefined damage patterns that were explained in the previous section. Consequently, there are three cases that describe the ultimate stress states during failure of a brittle material on Mohr’s Circle envelope:
Case 1: If principal stresses (
σ1 and
σ3) are both in the tension state (i.e.,
σ1 > 0 and
σ3 > 0), failure occurs when principal stress
σ1 is equal to the tensile strength of masonry (
fmt)
Case 2: If principal stresses are both in the compression state (i.e.,
σ1 < 0 and
σ3 < 0), failure occurs when principal stress
σ3 is equal to the compressive strength of masonry (
fm):
Case 3: If
σ1 is in the tension state and
σ3 is in the compression state (i.e.,
σ1 > 0 and
σ3 < 0), failure occurs when principal stresses satisfy the following condition:
For the sake of completeness, the principal stresses
σ1 and
σ3 can be written in open form in terms of normal and shear stresses (i.e.,
σX,
σY and
τXY) as
2.4.4. Solution of Equations to Obtain Ultimate Lateral Force Capacity
Equations (8)–(10) that are obtained from the Mohr–Coulomb criterion are linearized in order to be used in a linear system of equations for numerical solution. Hence, the Taylor series expansion is employed to convert nonlinear Mohr–Coulomb equations to approximate linear equations, and the solution is conducted by using the Newton–Raphson algorithm. The details for a numerical solution can be obtained from Ref [
48].
In the final stage, the equilibrium equations (i.e., Equations (1), (2) and (7)) and the boundary condition equations obtained for the boundary surfaces of the wall are substituted in a linear system of equations as
where {
σ} is a vector consisting of all unknown stresses, [
A] is the coefficient matrix consisting of multipliers for stresses in the available equations, and {
B} is the vector consisting of the constant terms in the same equations. Then, the linearized equations for the Mohr–Coulomb failure criterion are also substituted for each node according to its predefined state of stress. A recursive solution is required to calculate the stresses, such that
where subscript 0 denotes function values due to previous approximations for nodal stresses, and {
σ} stands for new approximations. The relative error function in terms of approximate stresses can be presented as
The recursive solution is ended when relative error is negligible, i.e.,
εσ < 10
−5. Then, the ultimate lateral load (Q in
Figure 8) is calculated by summing up the shear force values on the top surface of the wall, through the horizontal equilibrium equation. A Matlab code [
49] was written for the recursive algorithm, which is explained in this section.
3. Results and Discussion
This section includes the results of different analysis stages that were discussed in the previous section. The results are presented in different sub-sections according to the corresponding analysis stage.
3.1. Simplified Numerical Analysis Results for URM Walls
In this sub-section, simplified numerical analysis results of first-stage analysis (i.e., state of stresses at failure) and second-stage analysis (crack initialization and propagation within the wall) are demonstrated for wall types 5 and 6 (see
Figure 2). For this purpose, actual test specimens are employed (Ref [
31] for wall type 5 and 6, Ref [
32] for wall type 6).
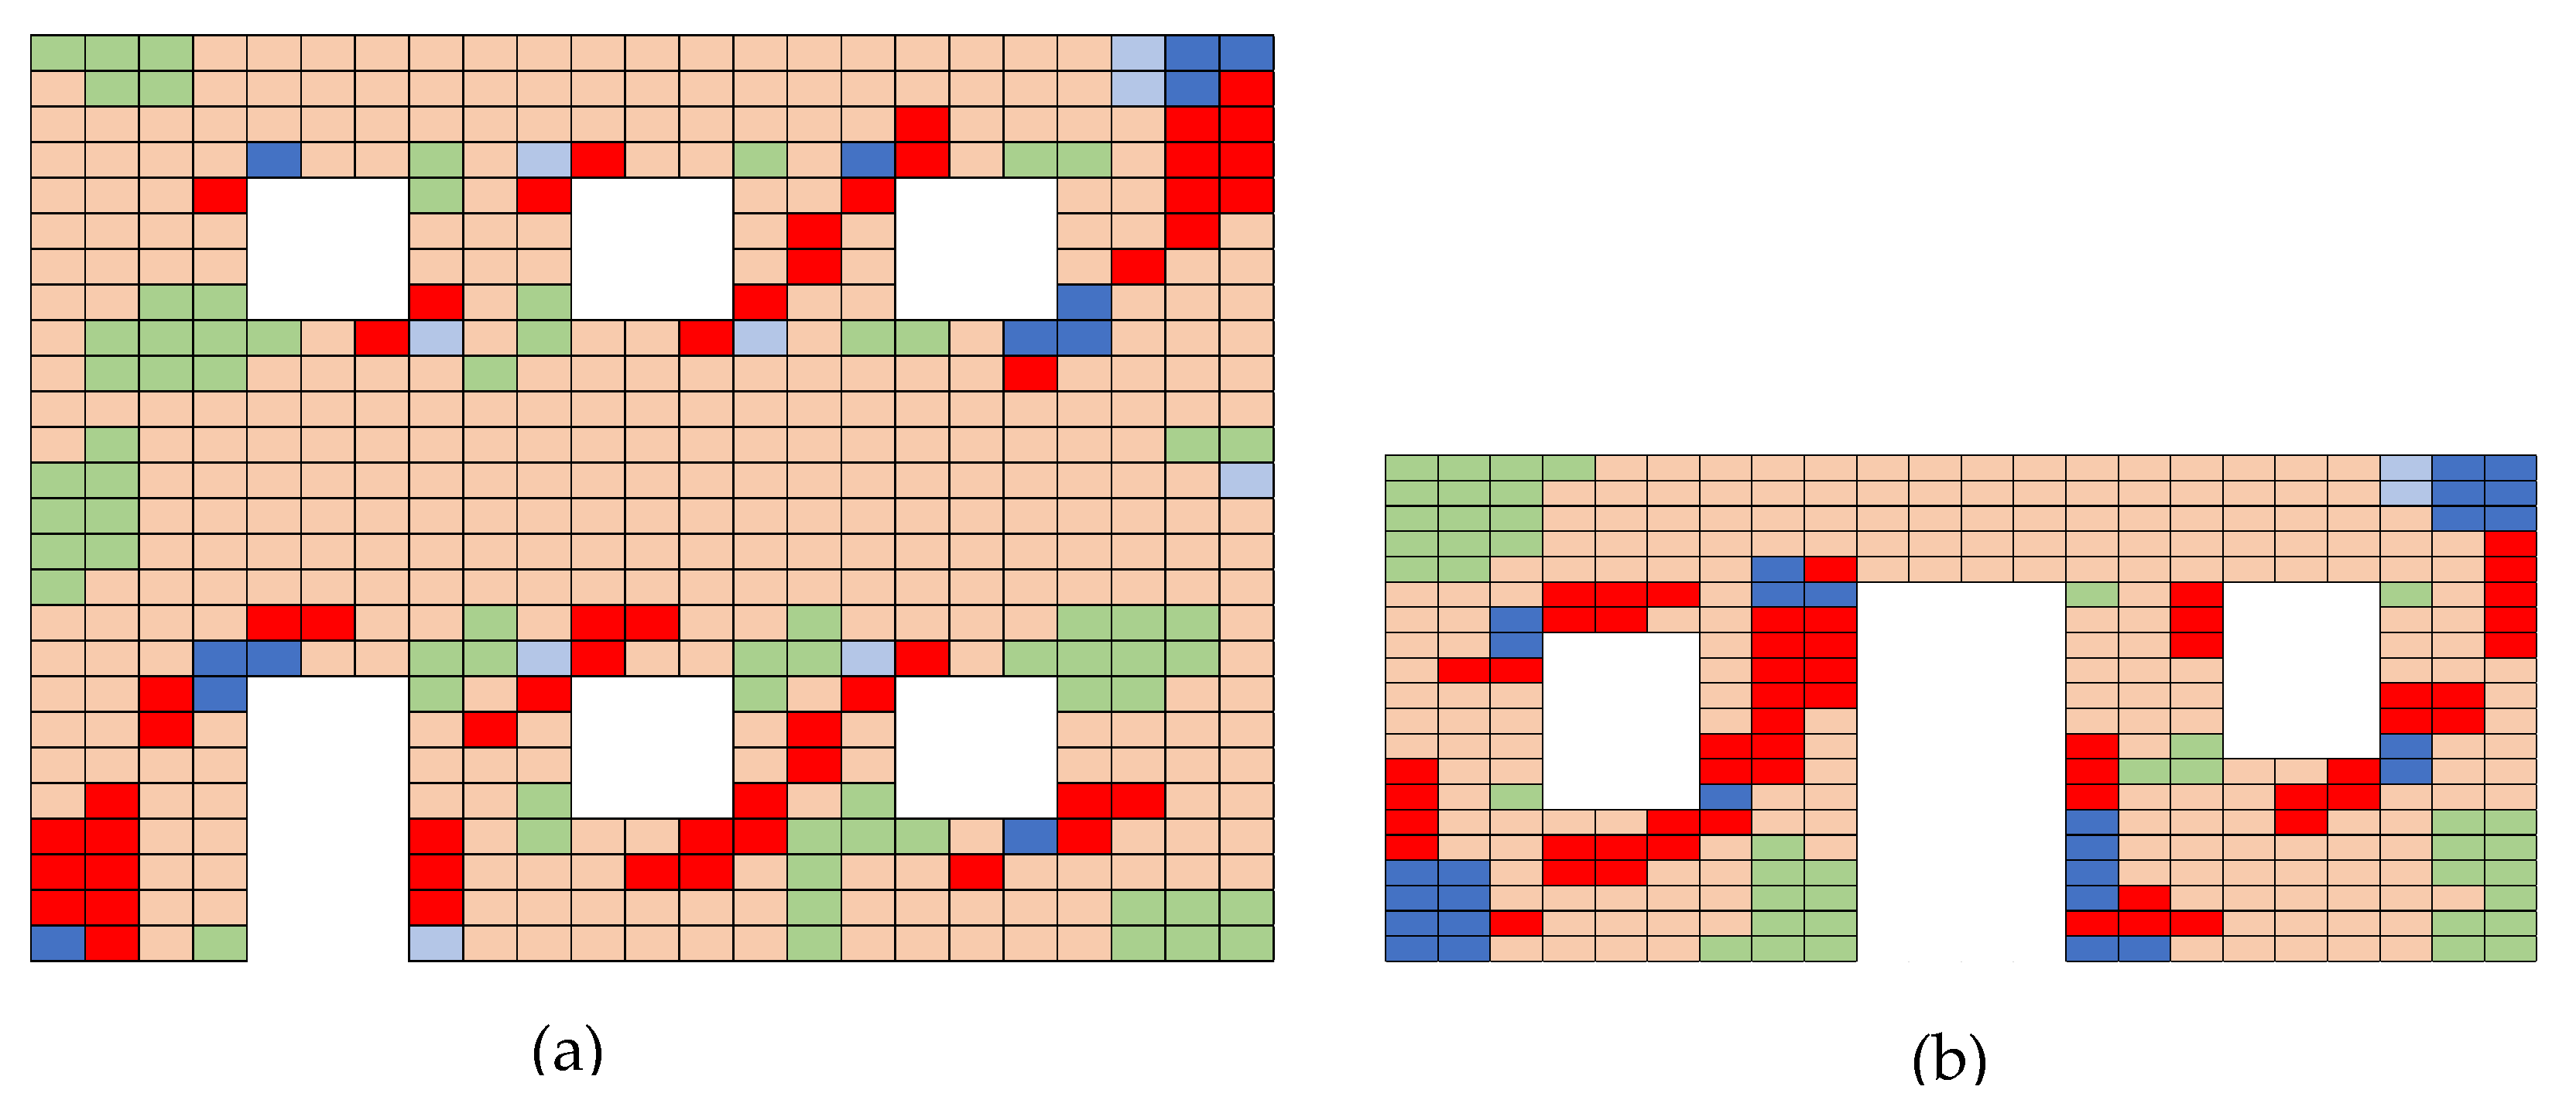
Figure 9a shows the state of stress for wall types 5 and 6 from the wall specimen by Ref [
31]. The considered masonry wall in this study is taken from one of the façades of a two-story URM building specimen, which was made of solid clay brick. The ground story of the specimen matches with wall type 6, whereas the first story represents wall type 5. All geometrical dimensions, material properties and loading conditions are taken from the reference.
Figure 9a reveals that overstressed locations are at the corners of openings and also at the corners of the wall itself, with a more intense distribution in the ground story, as expected.
Figure 9b presents the state of stress for wall type 6 from the wall specimen from Ref [
32]. The considered masonry wall in this study is a single-story wall panel with one door and two window openings. Just like the previous case, all geometrical dimensions, material properties and loading conditions are taken from the reference. According to
Figure 9b, the cells with stress values that exceed the failure criterion are mostly located at cross corners of window openings and bottom-left corners of the piers.
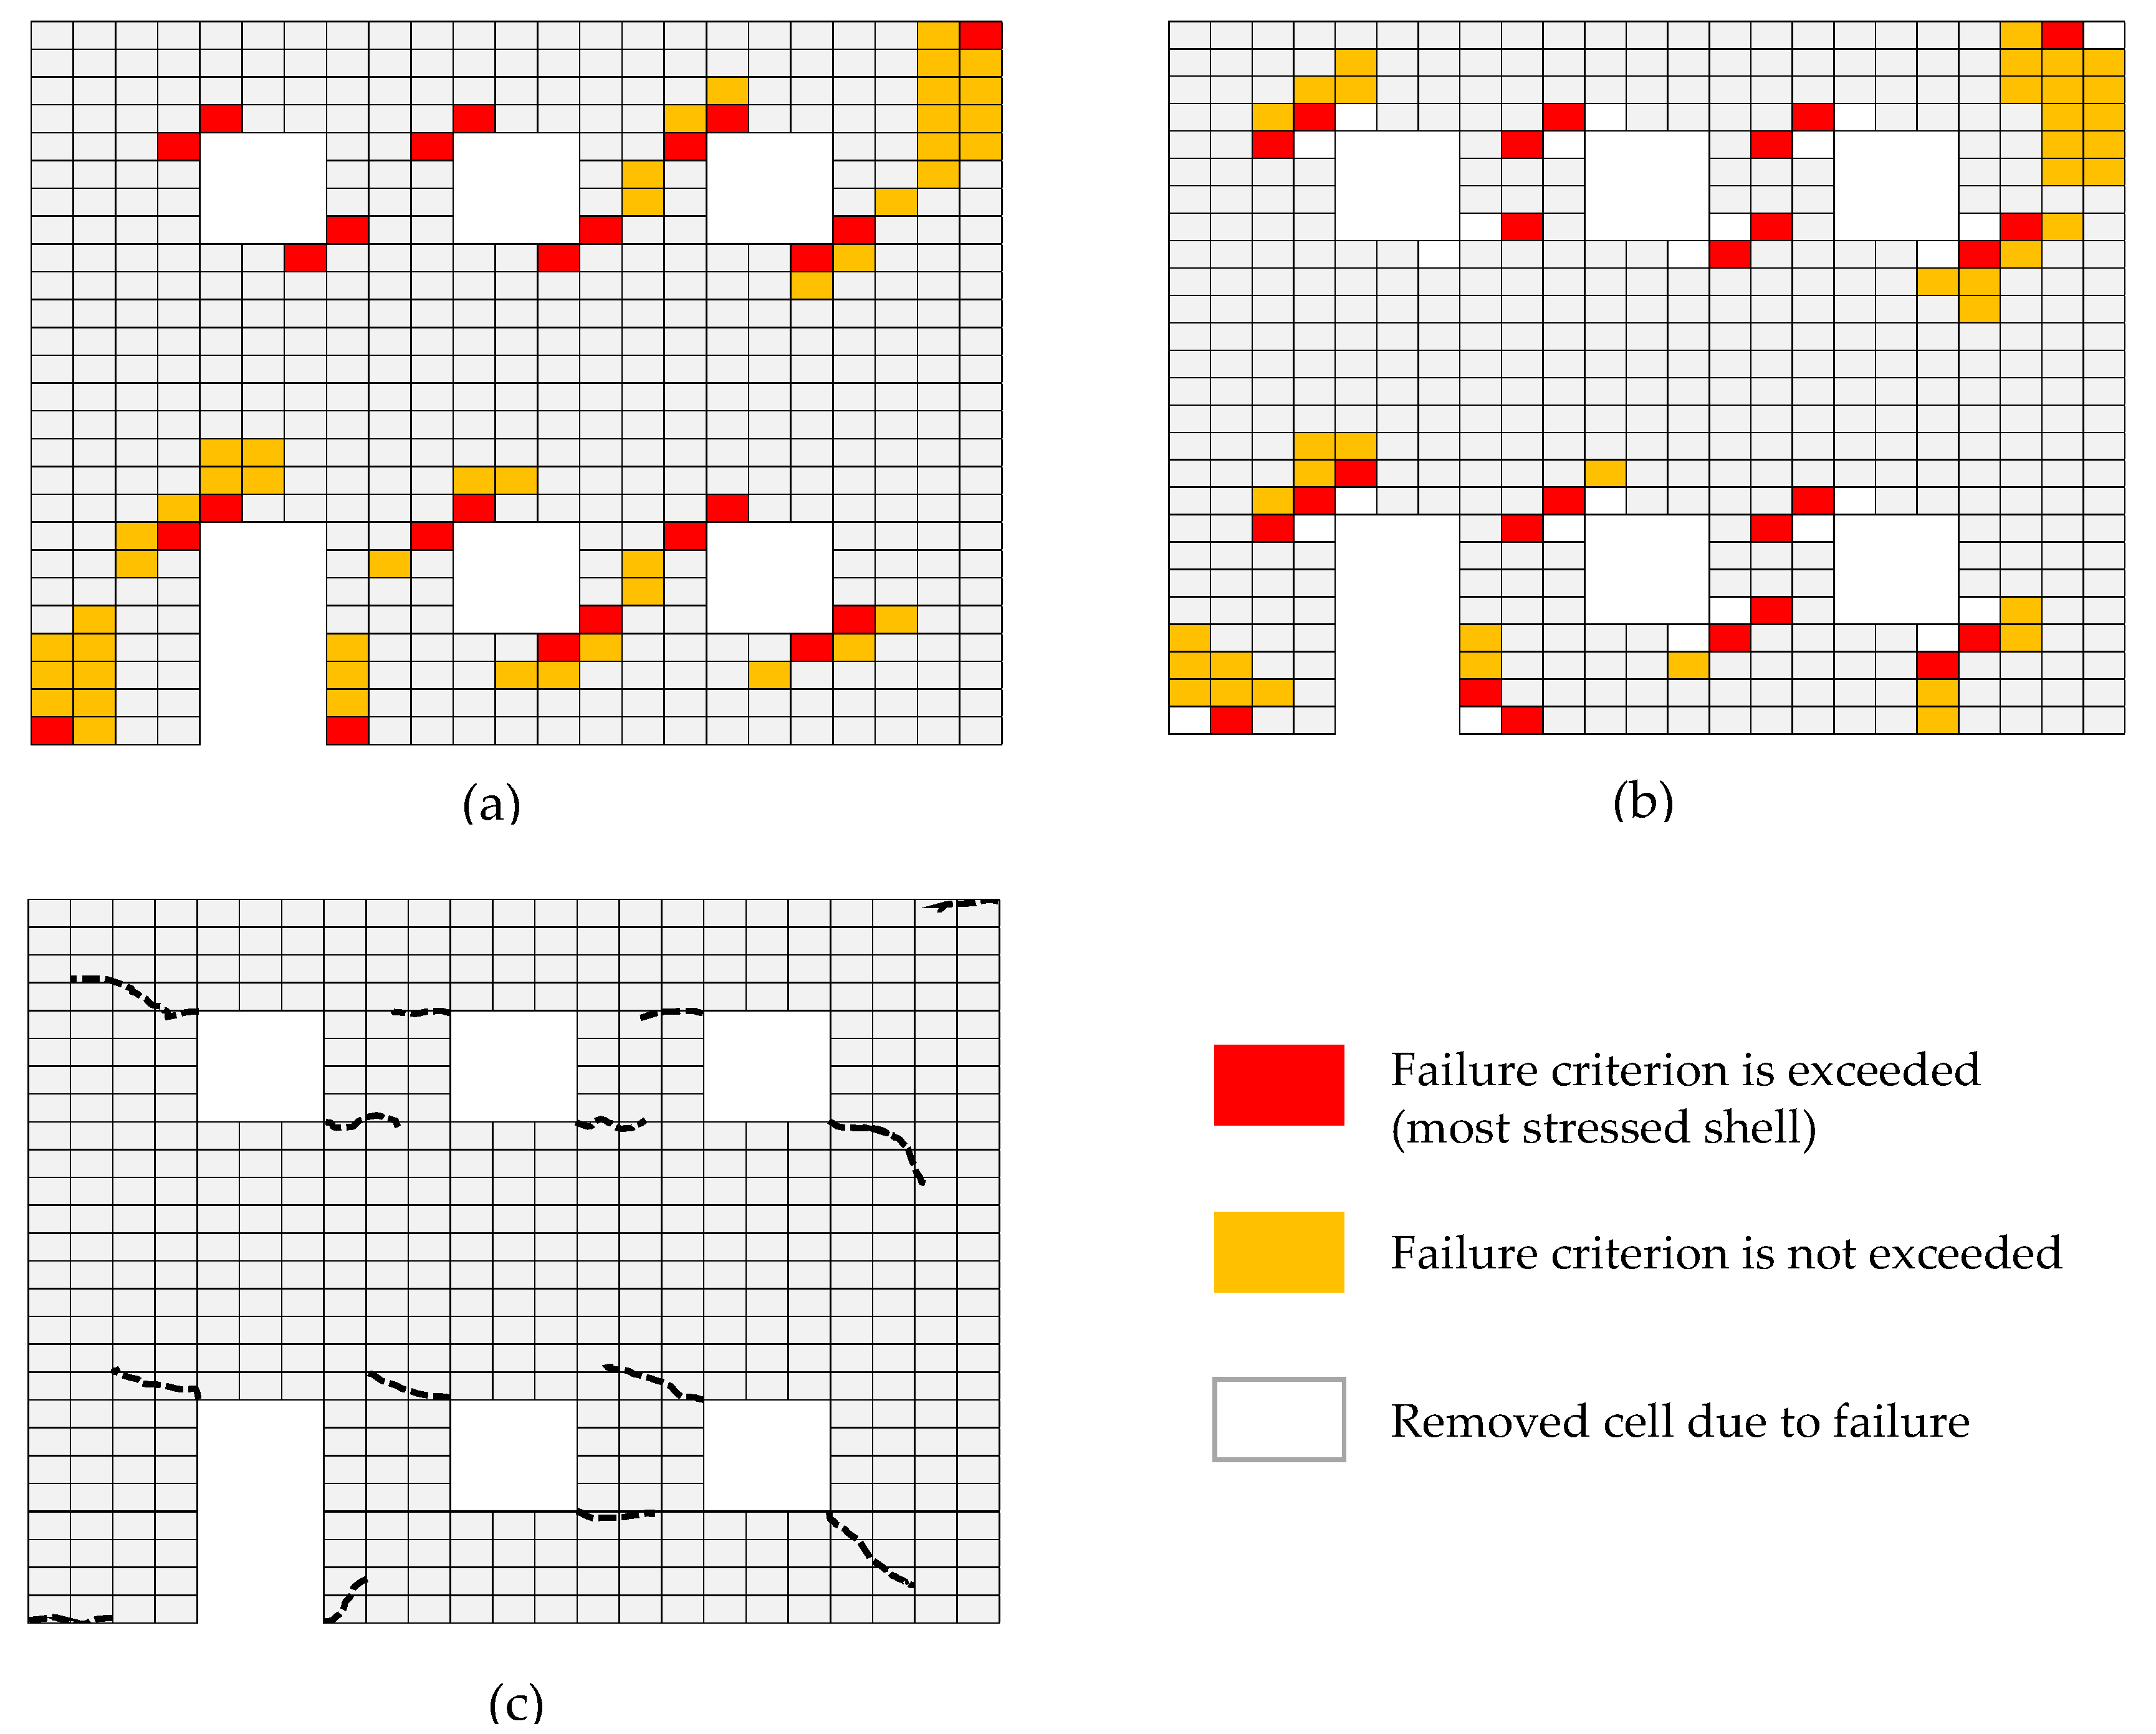
The second-stage numerical analysis contains information regarding initial crack locations and their propagation through the URM walls, as explained in the previous section.
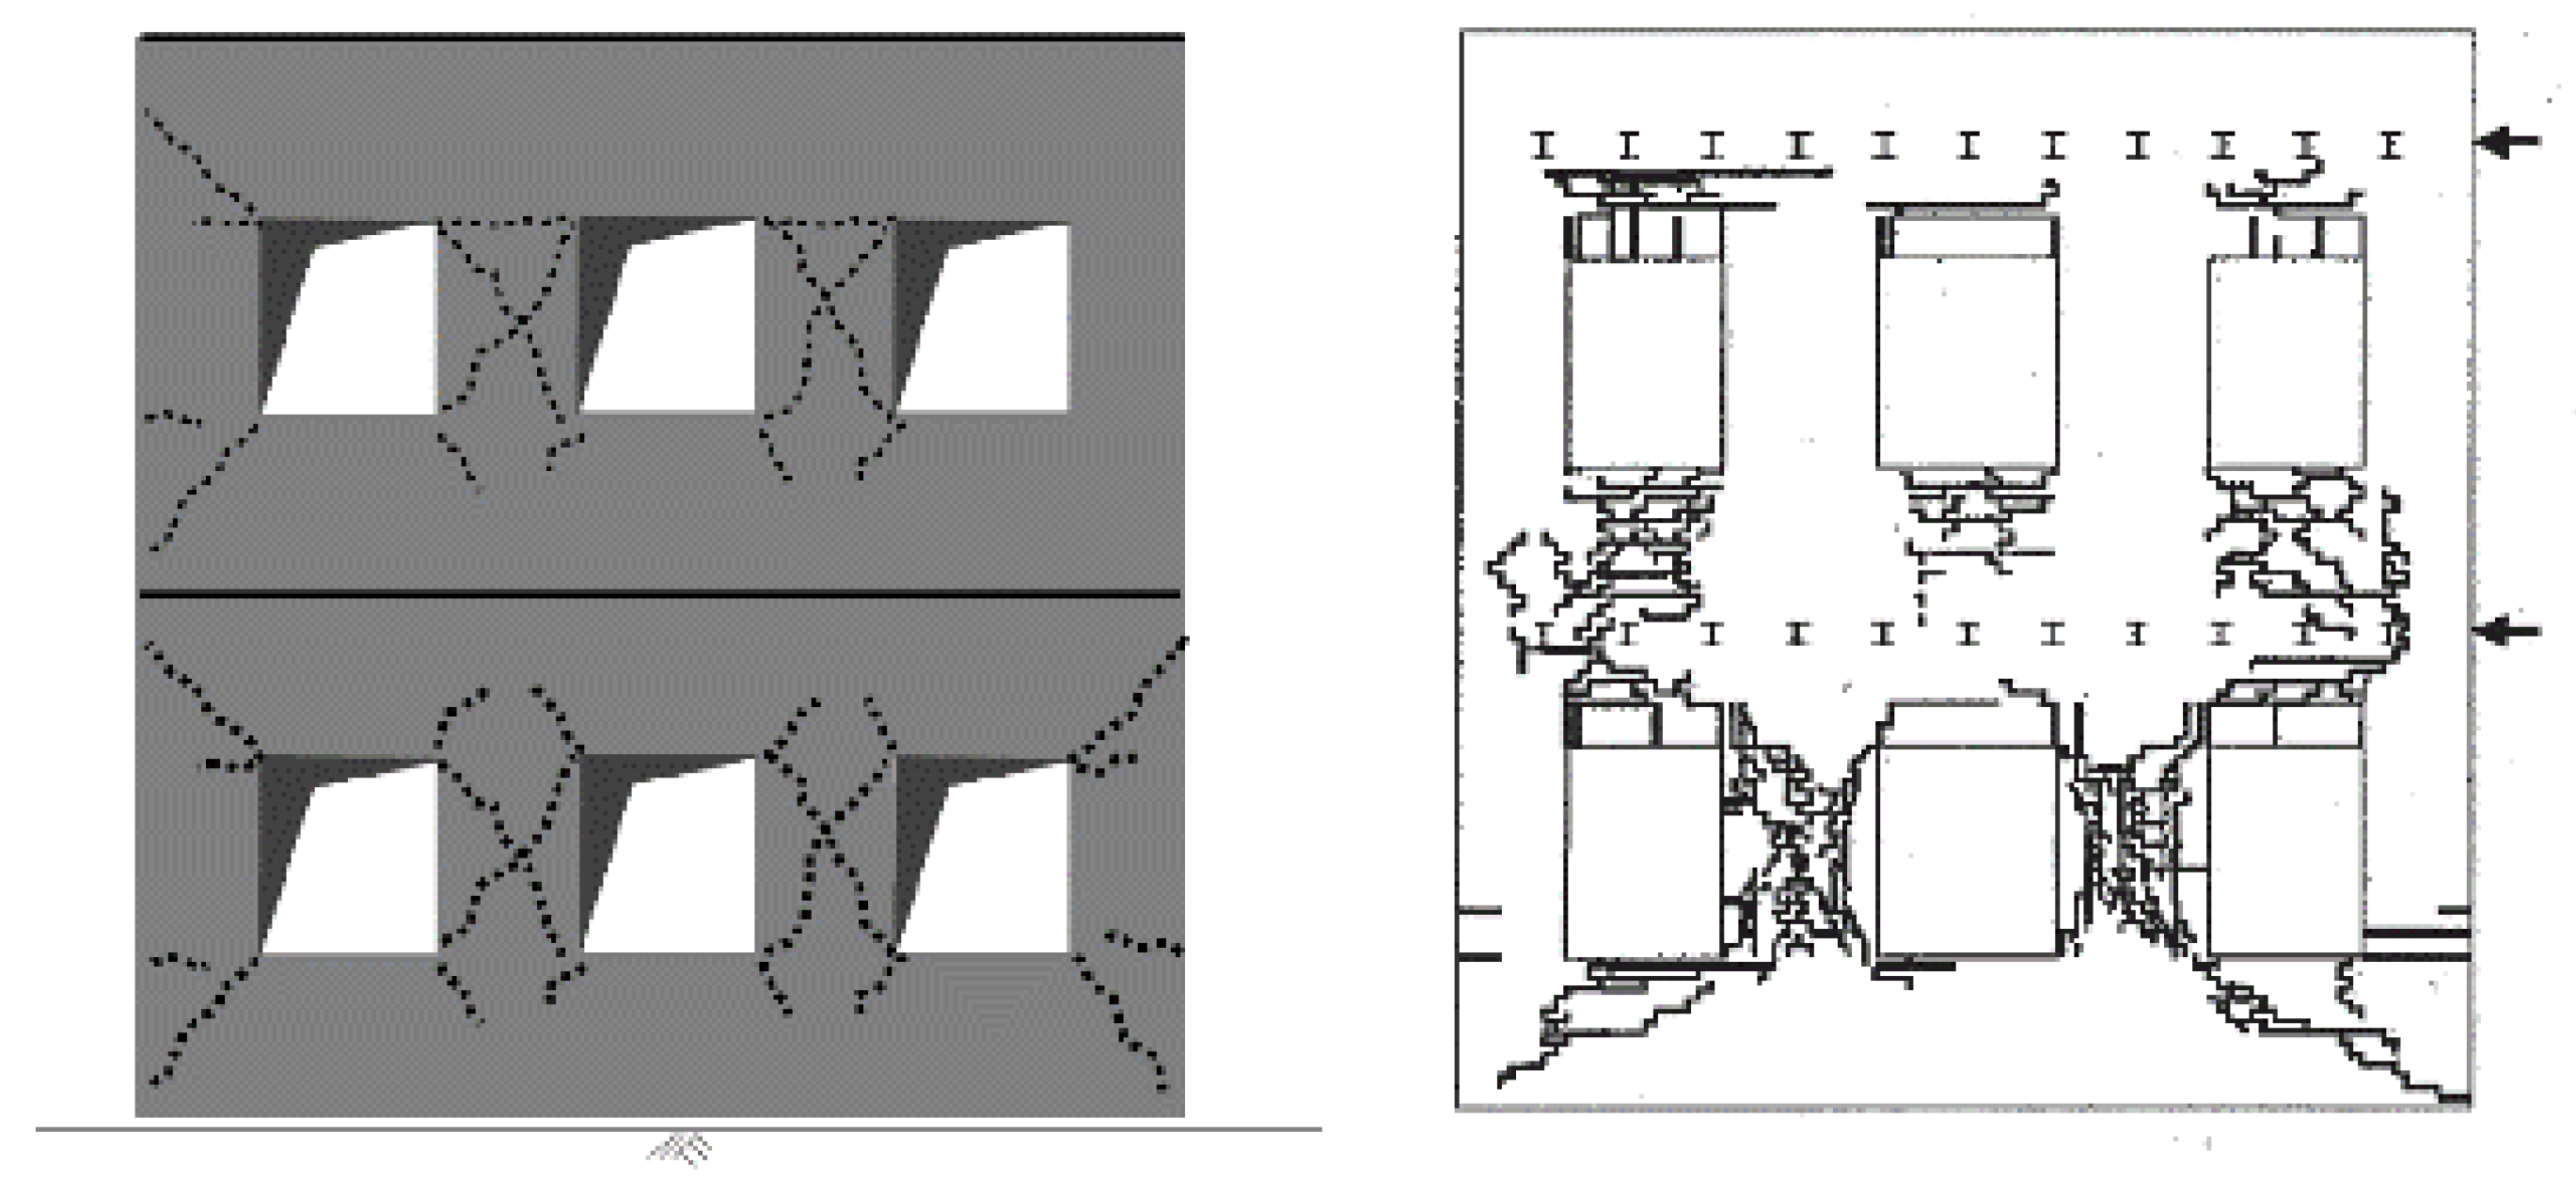
Figure 10a,b presents the first two steps of crack initiation and removal of overstressed cells from the mesh, whereas
Figure 10c shows the propagation of the cracks for final state of the considered wall with reference to Ref [
31]. Mostly diagonal tension failure seems to dominate the ultimate state of the wall. However, sliding shear failure is also observed at the bottom-left and top-right corners of the piers. With successive steps of cell removal, cracks at the middle of the wall propagate diagonally, and top and bottom corner cracks at the piers propagate horizontally. It should also be stated that the expected crack pattern of the wall matches with the experimentally obtained crack pattern by Ref [
31].
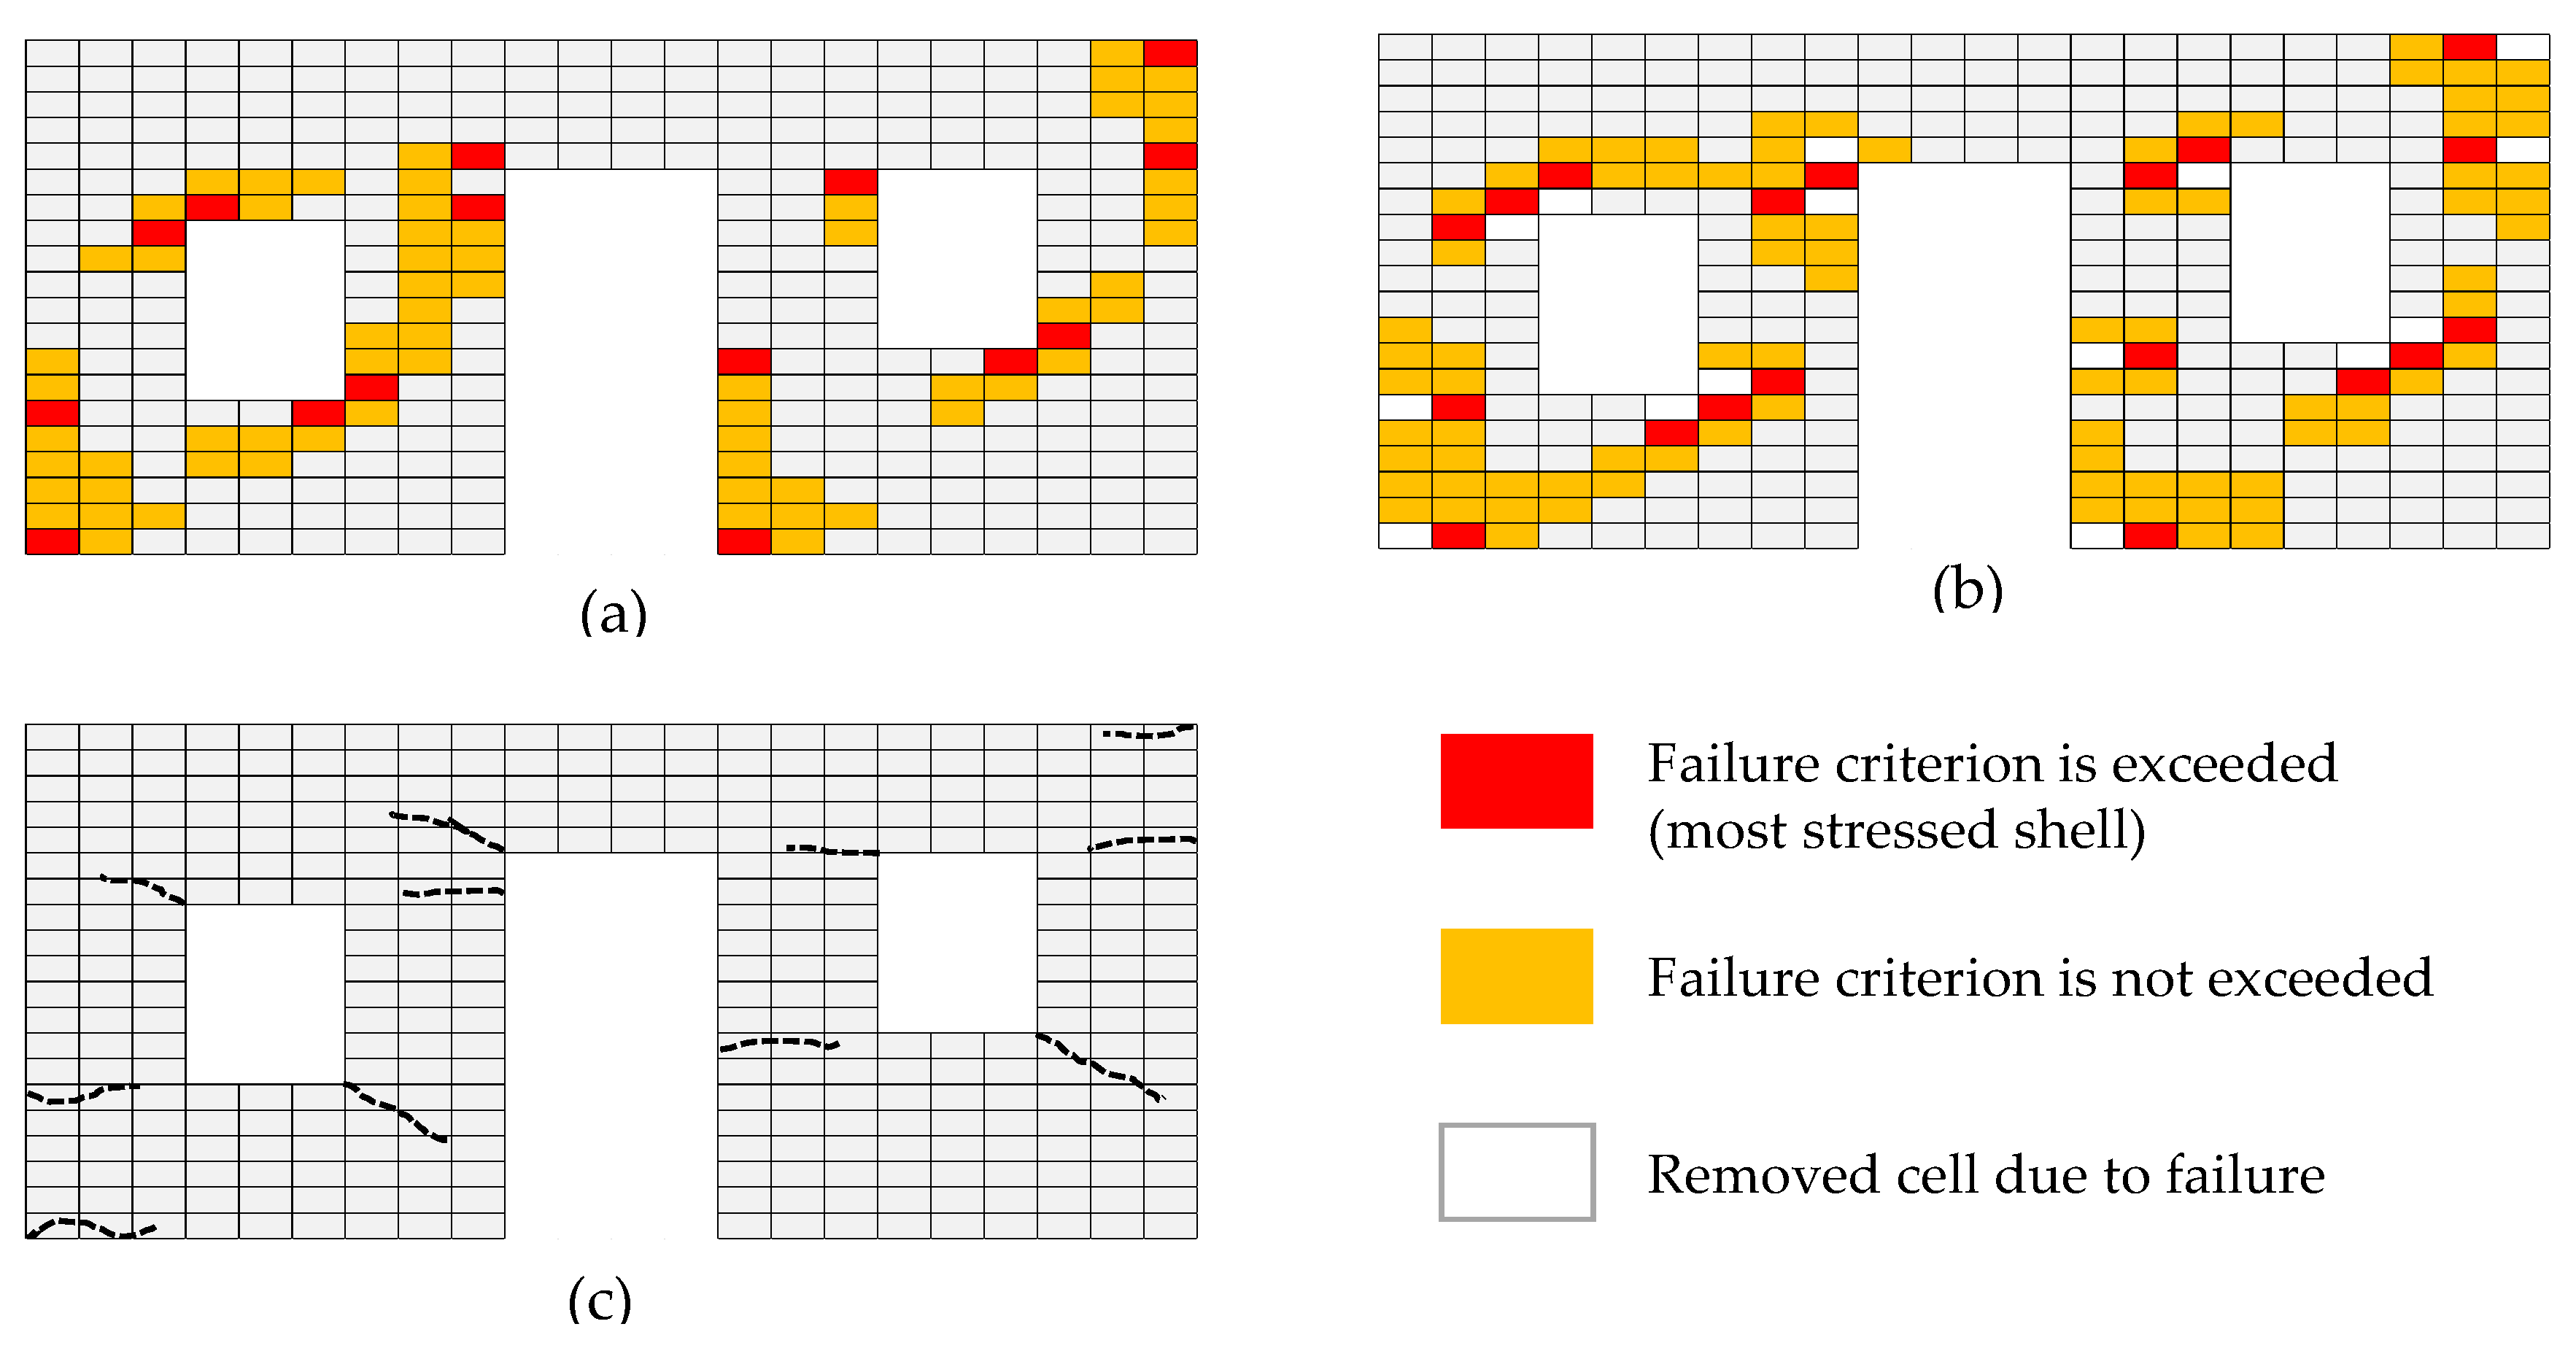
Similarly,
Figure 11 stands for the crack initialization and propagation of wall type 6 that was taken from the experimental study conducted by Ref [
32]. It can be observed that the crack patterns and corresponding failure modes in
Figure 11 are very similar to the ones presented in
Figure 10. Again, two different failure modes govern the wall behavior: diagonal tension and sliding shear. Moreover, the crack propagation, which starts from the corner of the openings, is not different from the previous findings. The damage distribution obtained from the numerical analysis has a satisfactory match when compared to the experimental behavior of the wall [
32].
3.2. Verification Study for the Set of Rules to Estimate Damage Patterns of URM Walls
A verification study is conducted to validate the failure mode predictions of URM walls. For this purpose, the two-story brick masonry building specimen tested by Ref [
50] is employed. In the verification study, the observed damage and crack patterns are compared with the ones estimated by using the proposed rules in
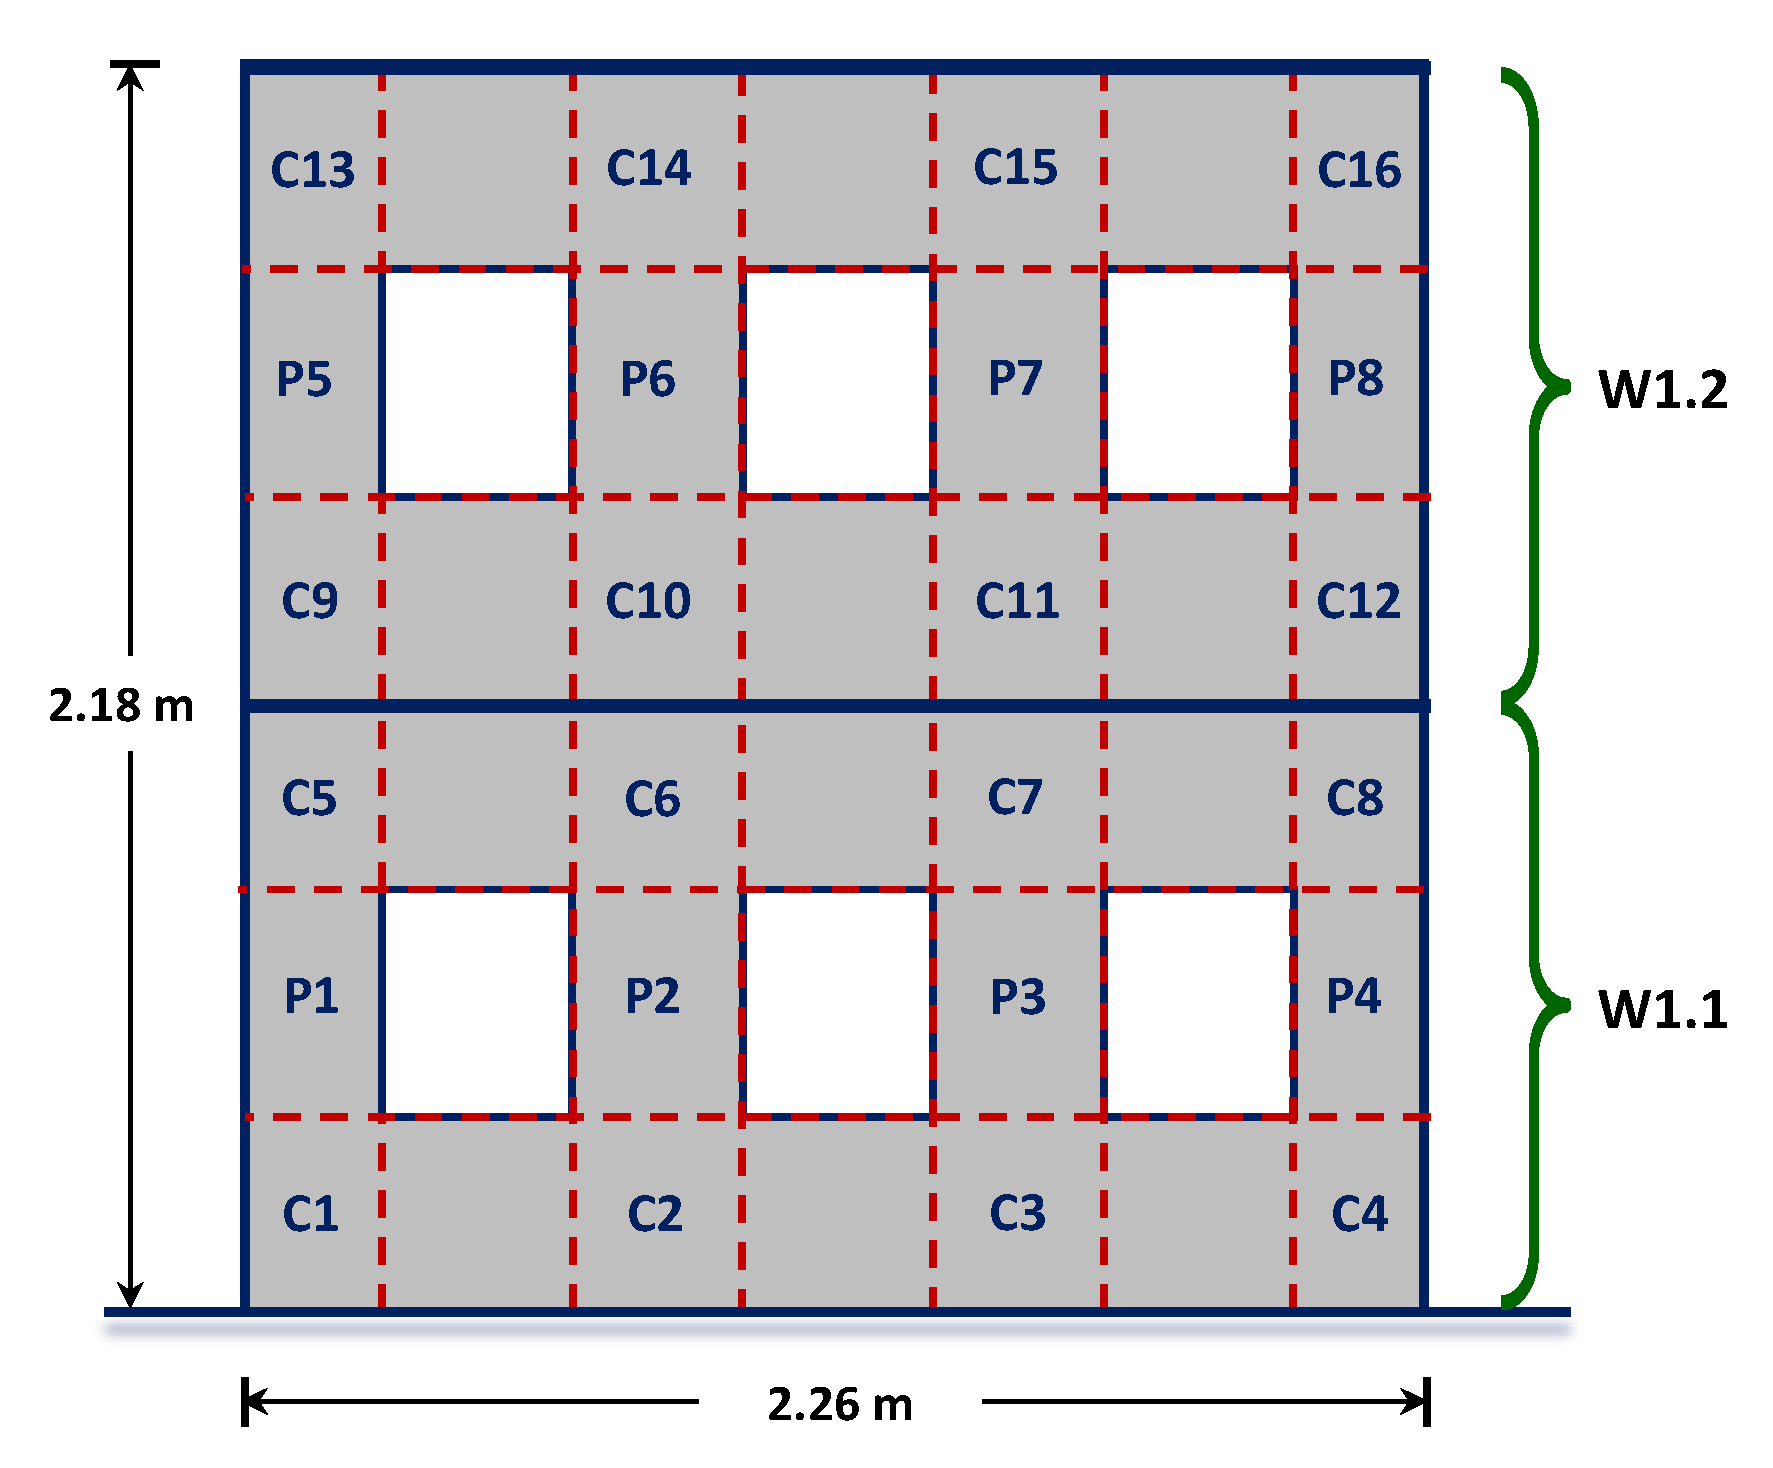
Table 1. Geometric properties of the considered URM wall from the test specimen is presented in
Figure 12a together with the assigned wall panels labeled, as shown. The walls at each story (W1.1 for the first story, W1.2 for the second story) are treated individually, since they are separated by rigid diaphragm floors.
Table 2 compares the expected failure modes of the wall panels in terms of, axial stress level, material strength/quality, panel aspect ratio, failure modes and the observed failure modes during the experiment. Additionally, sketches of the expected and observed damage patterns for the considered URM wall are provided in
Figure 13. Based on the results in
Table 2 and
Figure 13, it can be stated that there is a reasonable match between the observed and expected damage and crack patterns for the considered case study. This means material quality, axial stress level and aspect ratio of the URM walls have great impact on predicting their damage patterns. These parameters can be determined by simple observations and without conducting any complicated numerical calculations. Hence, this simply obtained and verified information can be used to estimate the ultimate lateral load capacity of non-engineered URM walls and buildings by using tools of limit analysis, as explained in the next section.
3.3. Verification Study for the Proposed Lower-Bound Limit Analysis Approach
The proposed approach to obtain in-plane strength capacity of URM walls by using lower-bound limit analysis and predefined damage patterns is validated by comparing its output with experimental data. Two different test specimens in the form of perforated URM walls are considered for this purpose.
The first wall specimen considered for verification belongs to Ref [
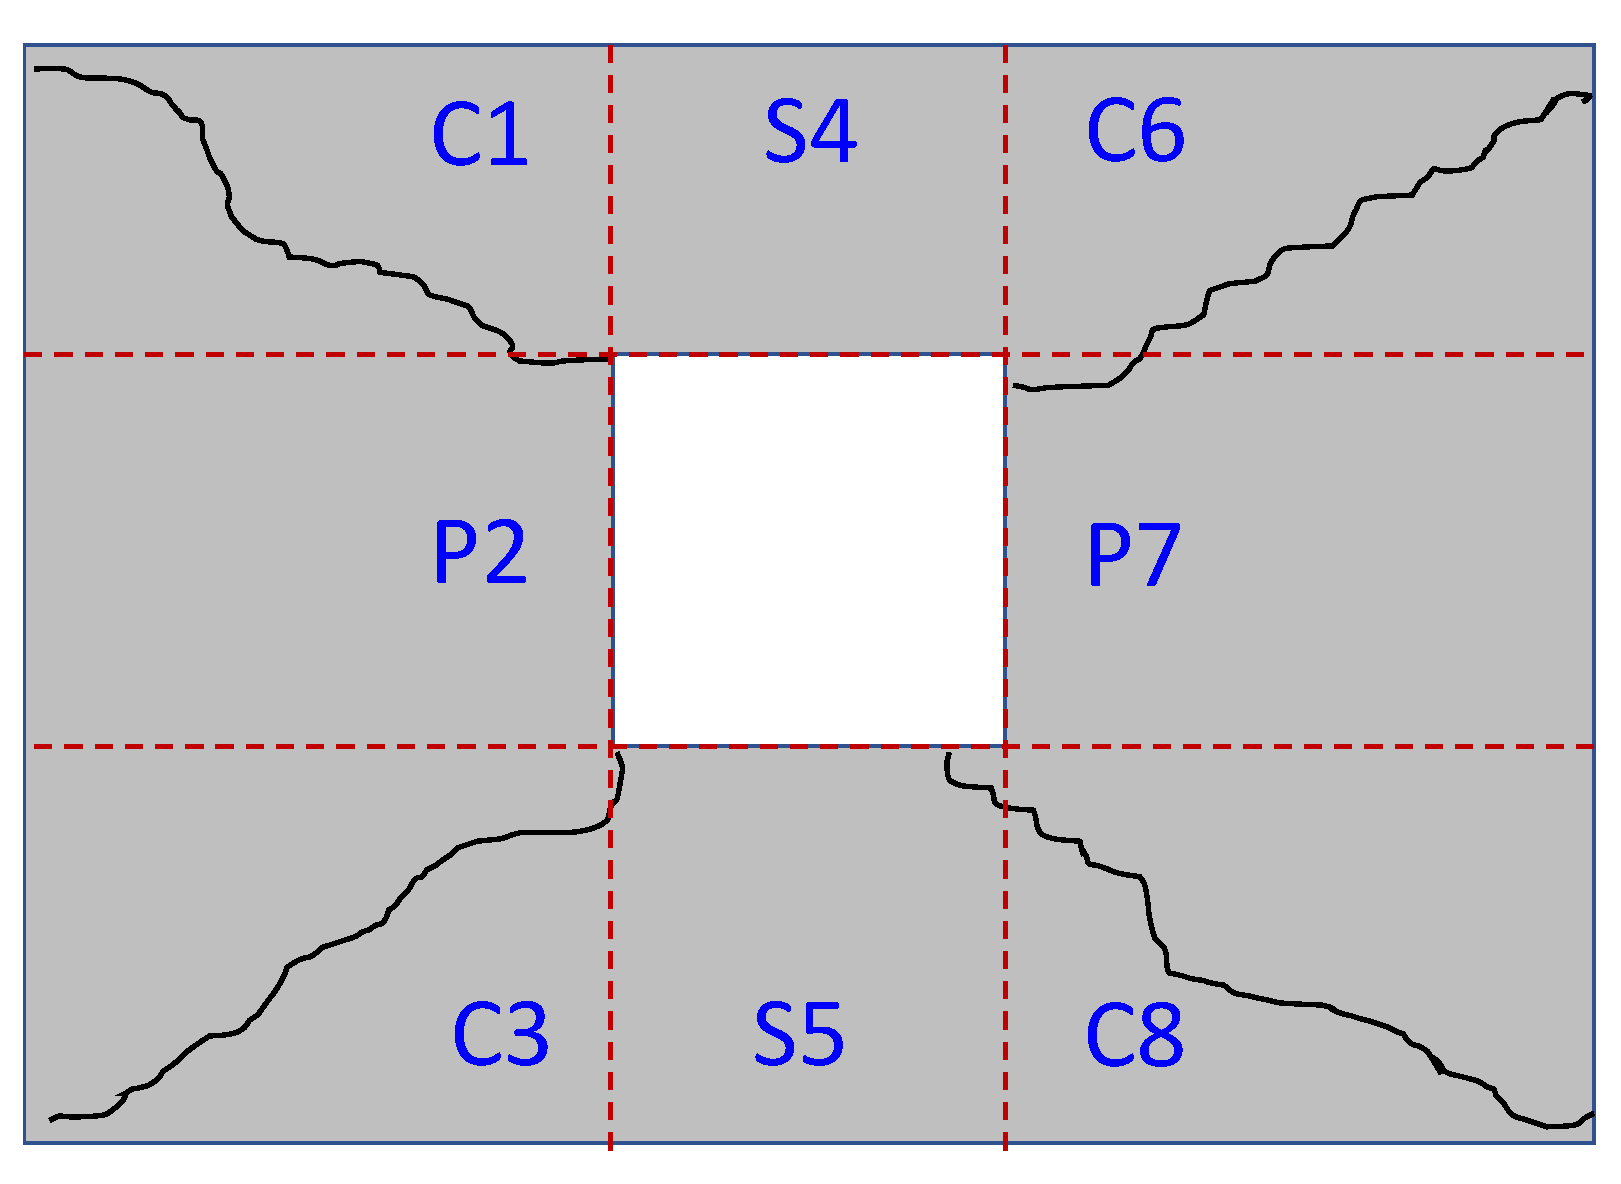
34]. The considered wall specimen has dimensions of 194 × 143 cm with 16 cm thickness and a window opening at its center, which has a dimension of 52 × 47 cm. As a URM wall, the compressive masonry wall strength
fm = 11.7 MPa is reported, while the tensile strength of the material is taken as 5% of the compressive strength, which is
fmt = 0.56 MPa. Under a vertical load of 41.2 kN, the maximum horizontal load was measured as 26.1 kN. The discretization of the damaged wall specimen under consideration is given in
Figure 14.
In order to analyze this wall with the proposed method, first, it is divided into macro-panels of 3 × 3 mesh size, including eight solid panels and one void panel for the opening. This means a total of 48 stress parameters are introduced at 16 nodes. In order to satisfy the equilibrium for eight rectangular panels, 16 equilibrium equations are obtained by using Equations (1), (2) and (7). For ensuring the boundary conditions, six normal force and six shear force equations are obtained. In addition to that, one equilibrium condition for vertical external force is provided at the top surface. Furthermore, two boundary conditions are obtained for the window opening. For 16 nodes, 16 Mohr–Coulomb points are considered according to the reported damage state of the specimen after experiment, and therefore, 16 equations are procured. At the end, for the 48 unknowns, 48 equations are obtained and solved by the written Matlab code.
The maximum lateral load Q is obtained as 28.13 kN as a result of the numerical computation. The maximum lateral load obtained from the experiment is 26.1 kN. It can be seen that the lateral capacity values obtained from the experiment and the proposed approach are very close to each other. The error percentage of 8% indicates that the analysis result is consistent with the physical behavior obtained through testing.
The second wall specimen considered for verification belongs to Ref [
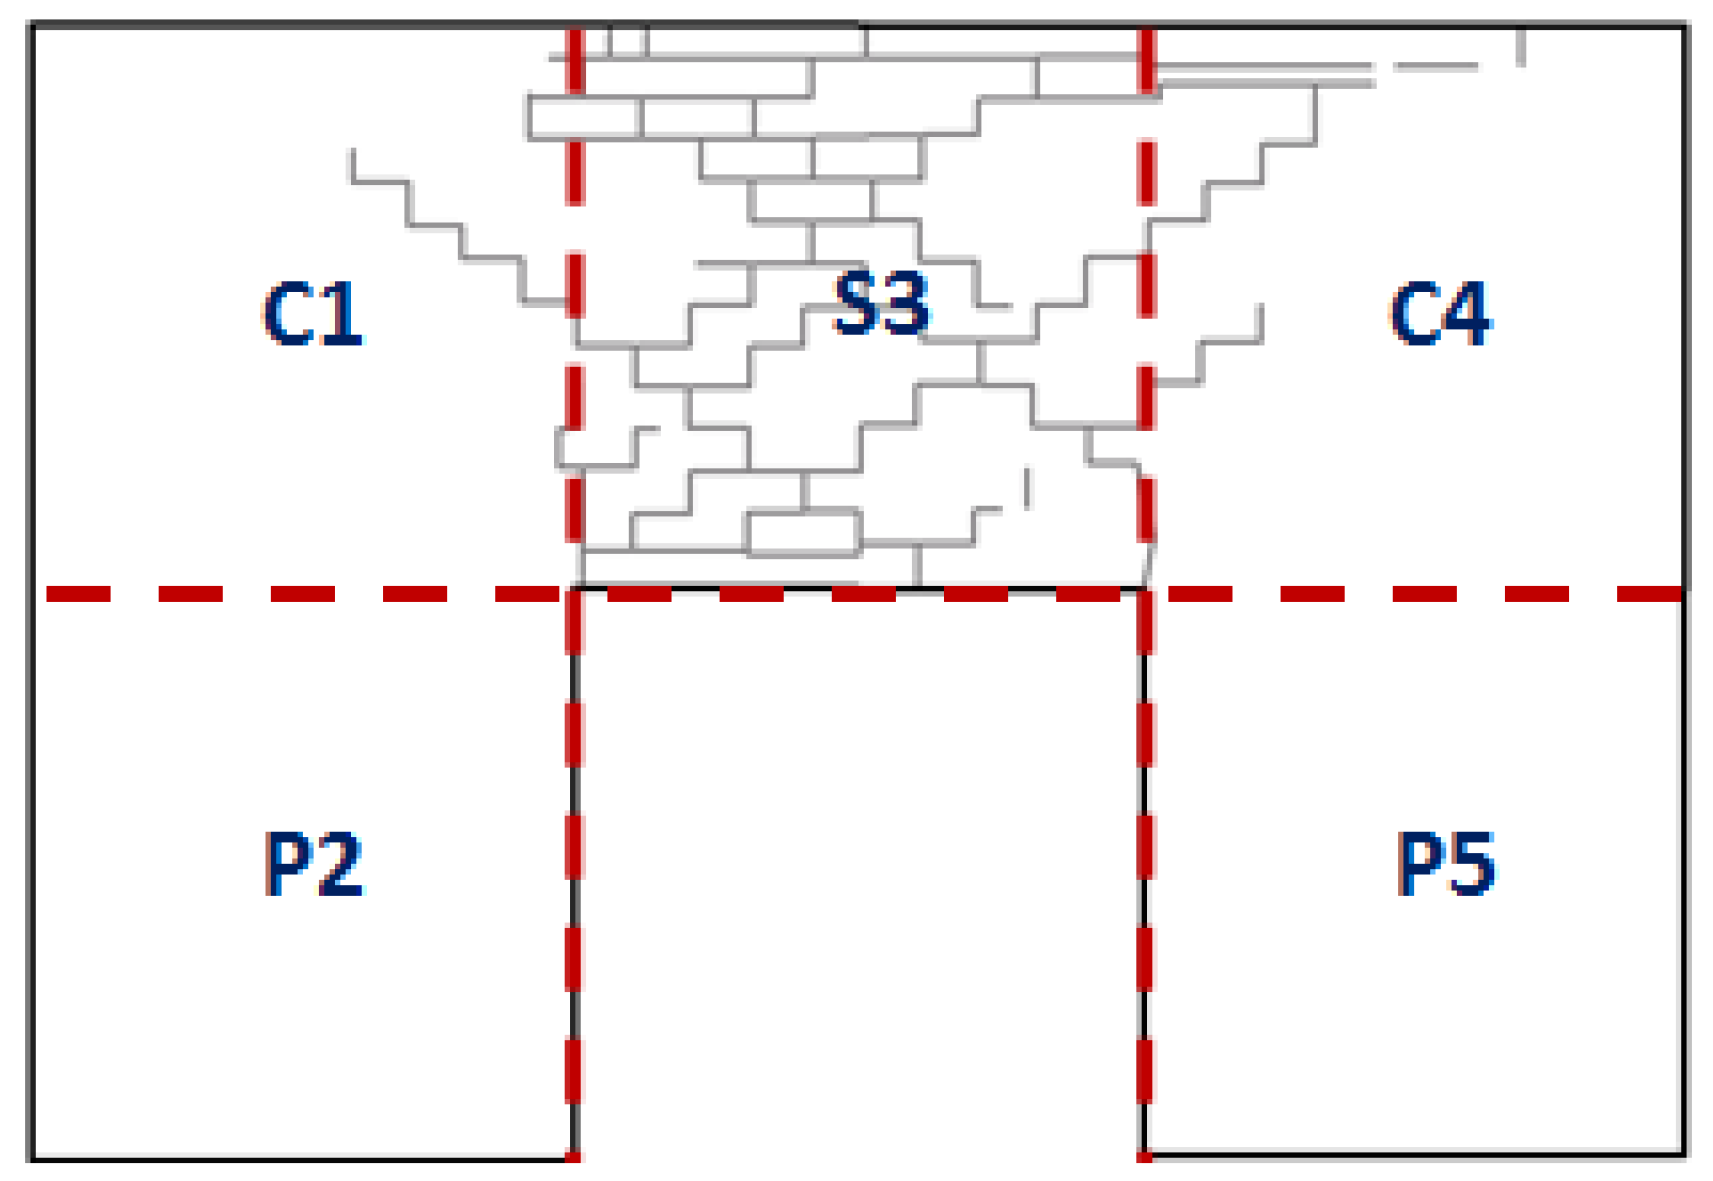
51]. They conducted an experimental testing program of URM walls with openings subjected to cyclic in-plane shear loading. They tested three different wall types. In this study, only the wall specimen labeled as “deep spandrel” is considered for verification. The compressive and tensile strengths of the specimen are reported as 9.6 MPa and 1.85 MPa, respectively. The considered value of the vertical load is 79.2 kN. After the specimen was tested, the maximum lateral load obtained for the wall was 39 kN. The discretization of the damaged wall specimen at the end of the test is presented in
Figure 15.
By using the proposed approach, the wall is divided into six macro-panels (five solid panels, one opening panel). Hence, 12 points are generated with 36 unknown stress components. The required equations are again obtained through equilibrium conditions (Equations (1), (2) and (7)) and boundary conditions for free surfaces and surfaces with given conditions. The maximum lateral load obtained from the experiment is 39 kN, while the recursive procedure yields a final value of 45.7 kN for the lateral ultimate wall capacity. The 17% deviation from the experimental capacity indicates that the analysis result may be considered as still valid after considering all the gross assumptions and simplifications of the method.
4. Conclusions
Old and non-engineered URM buildings constitute a considerable percent within the urban and rural building stocks of under-developed and developing countries in the world. It is a known fact that these structures are highly vulnerable to seismic action, and they may experience severe damage when subjected to earthquakes with even moderate intensity levels. Hence, it is vital to assess the seismic risk of this vulnerable building class. However, this is not an easy task, since the available analytical and numerical analysis approaches in the literature are generally appropriate for engineered masonry structures with well-defined design and construction practices. Hence, it becomes a waste of time and effort to employ complex and detailed structural modeling and analysis approaches for seismic performance assessment of non-engineered URM buildings. In such cases, the best solution is to use simplified approaches, which require a good understanding of the actual behavior under seismic action. With regard to this motivation, this study aims to predict the lateral load capacity of URM walls by using lower-bound limit analysis and predefined damage patterns. In-plane damage and failure patterns of URM walls are determined from the available observational (field) data, experimental data and also from numerical analysis data. Then, a set of rules are proposed to estimate the damage and failure patterns of URM wall panels. In the next stage, the obtained wall damage patterns are employed to develop a simplified numerical model with a coarse panel mesh for the masonry wall, which is consistent with the crack formation at the ultimate state. Finally, lower-bound limit analysis approach is used to predict the failure load of the wall without any further sophisticated analysis. A comparison of the predicted capacity by the proposed approach with the experimental data for some selected specimens reveals that the proposed approach can be used for a reasonable estimation of lateral load capacity of URM walls in non-engineered buildings.
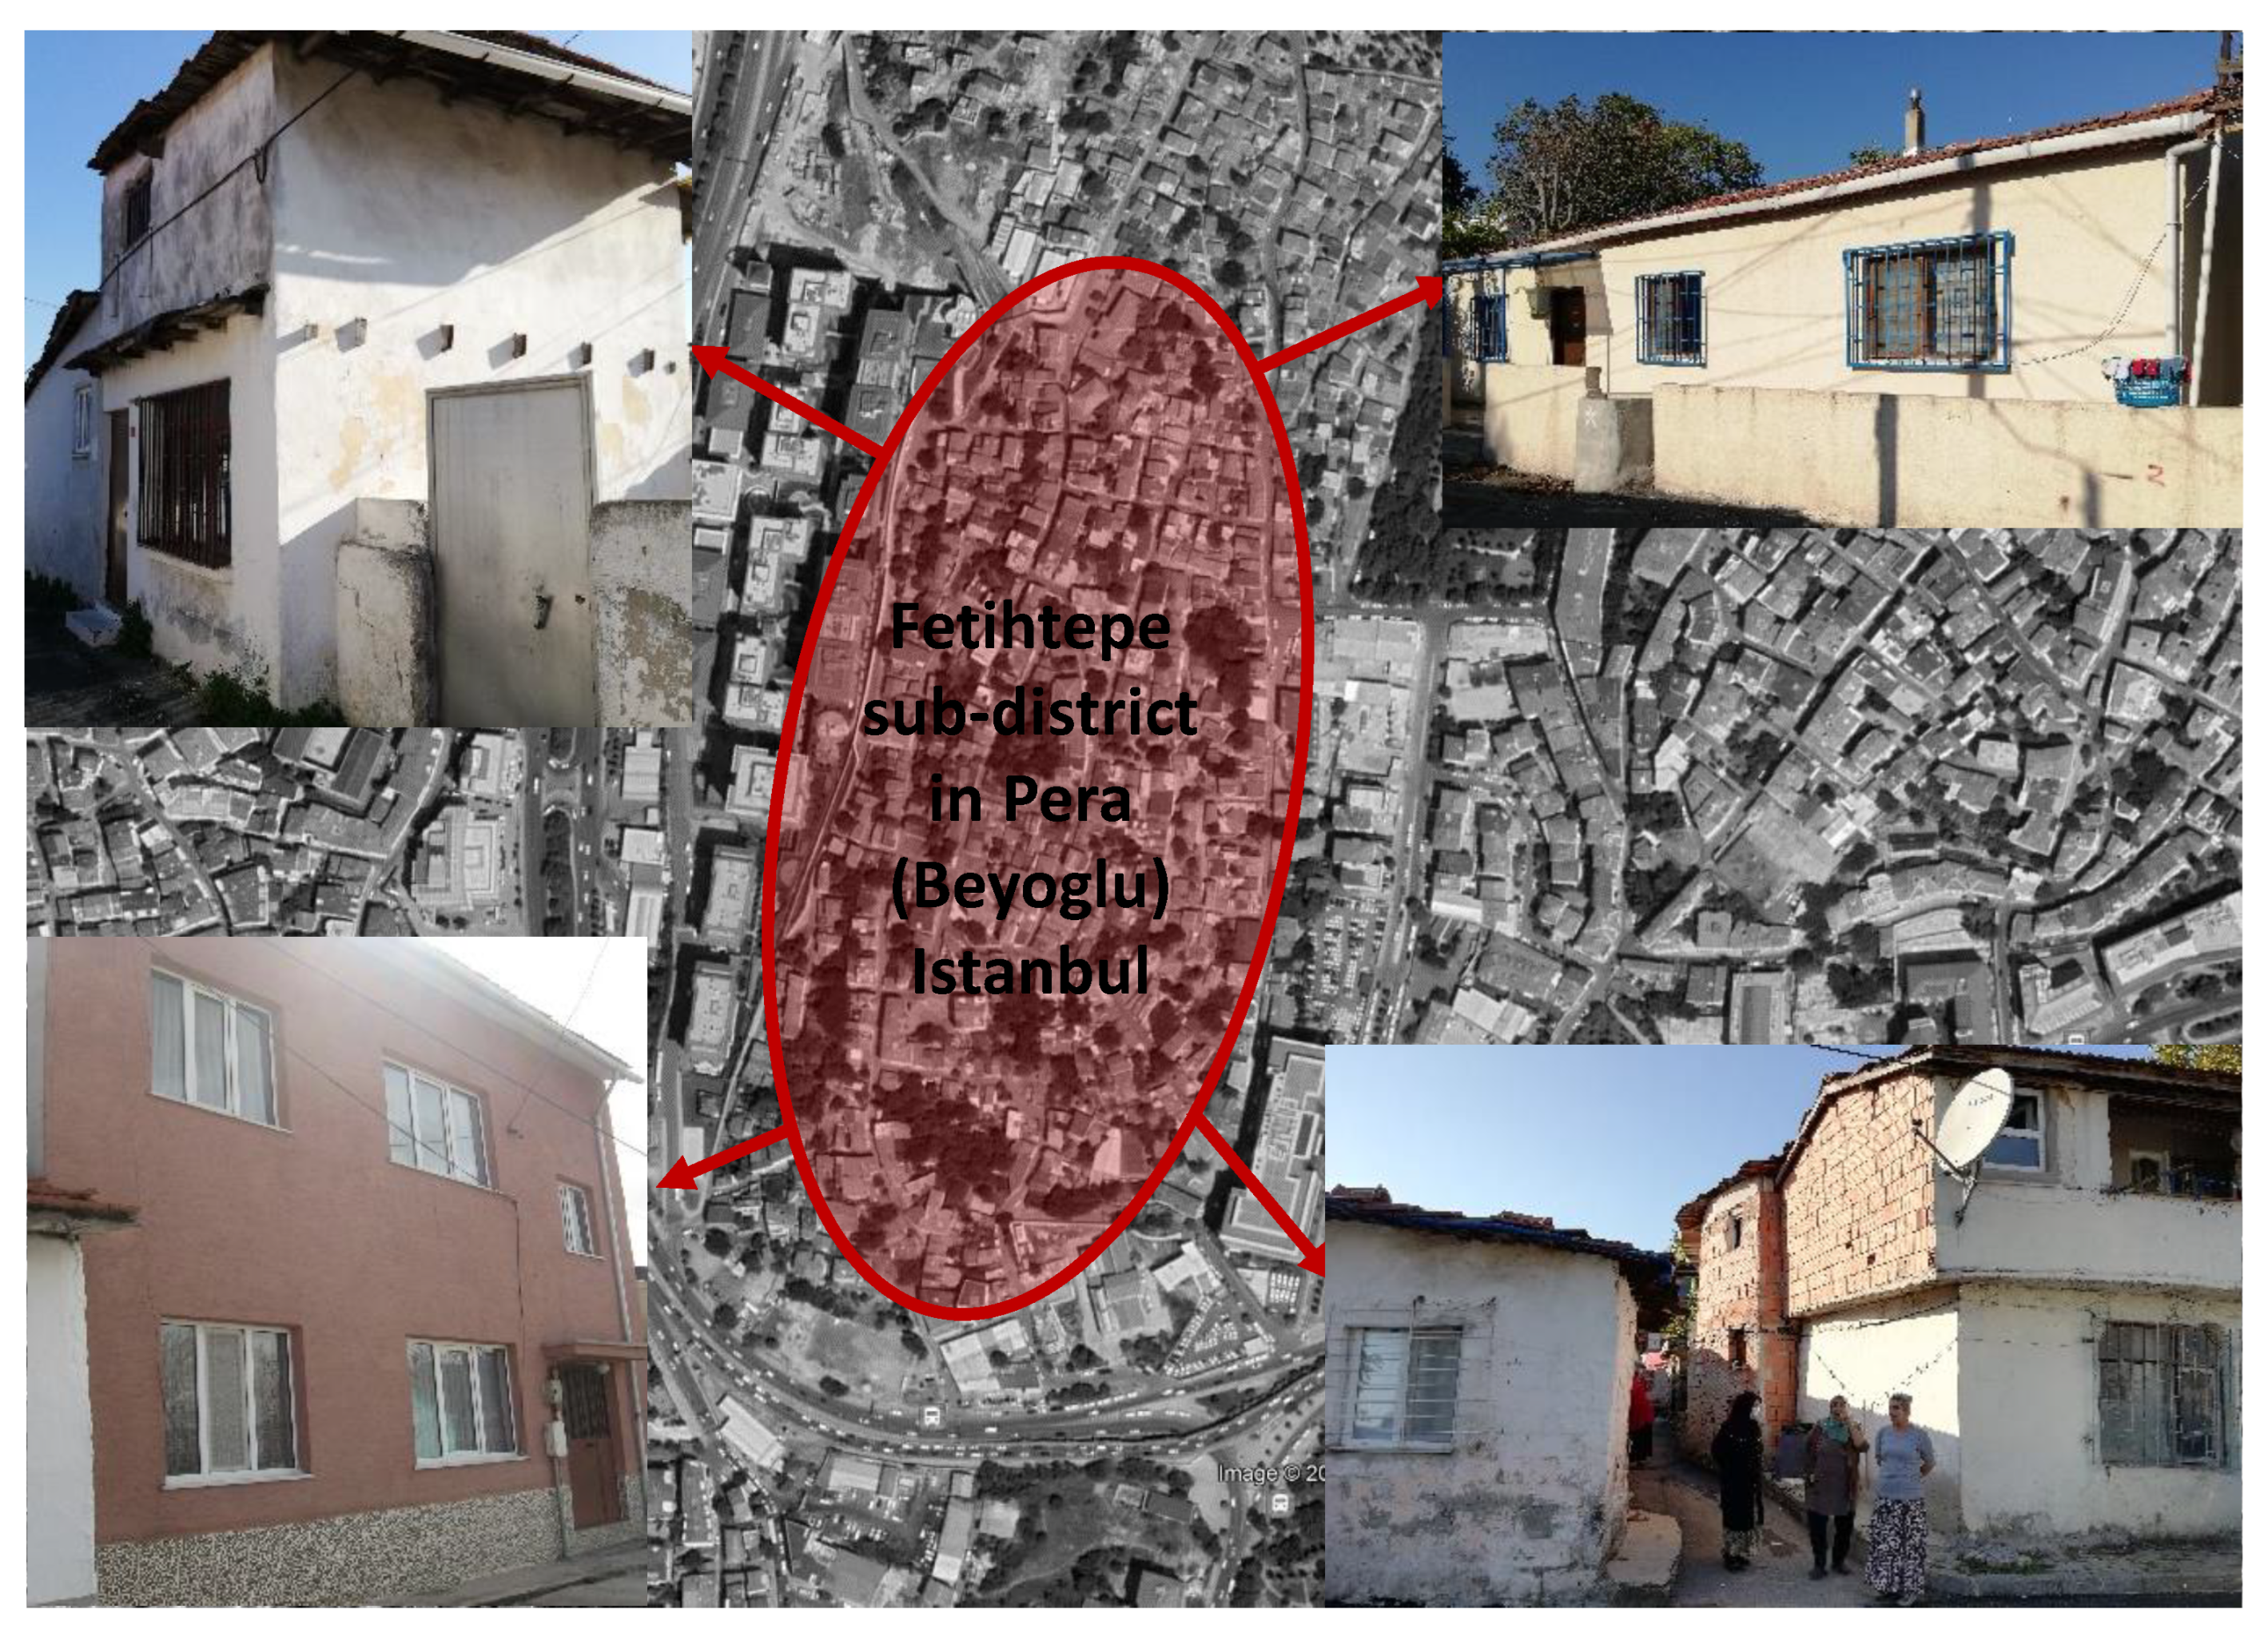
The proposed method is believed to be employed in both urban and rural territories to predict the lateral load capacities of non-engineered URM buildings with well-known in-plane seismic damage patterns in line with the local characteristics of the construction practice. The wall types of the non-engineered URM buildings under concern can be easily inspected with a rapid visual screening, and damage patterns can be assigned to each wall panel in accordance with the predefined rules (
Table 1). Then, the lateral load capacities of buildings can be calculated by using the limit analysis approach. Hence, the lateral load capacities of a considerable number of non-engineered URM buildings can be predicted in a relatively short period of time without using detailed numerical analysis. Possible application areas of the methodology include old urban centers within highly populated earthquake-prone cities (such as the sub-districts in Pera Istanbul,
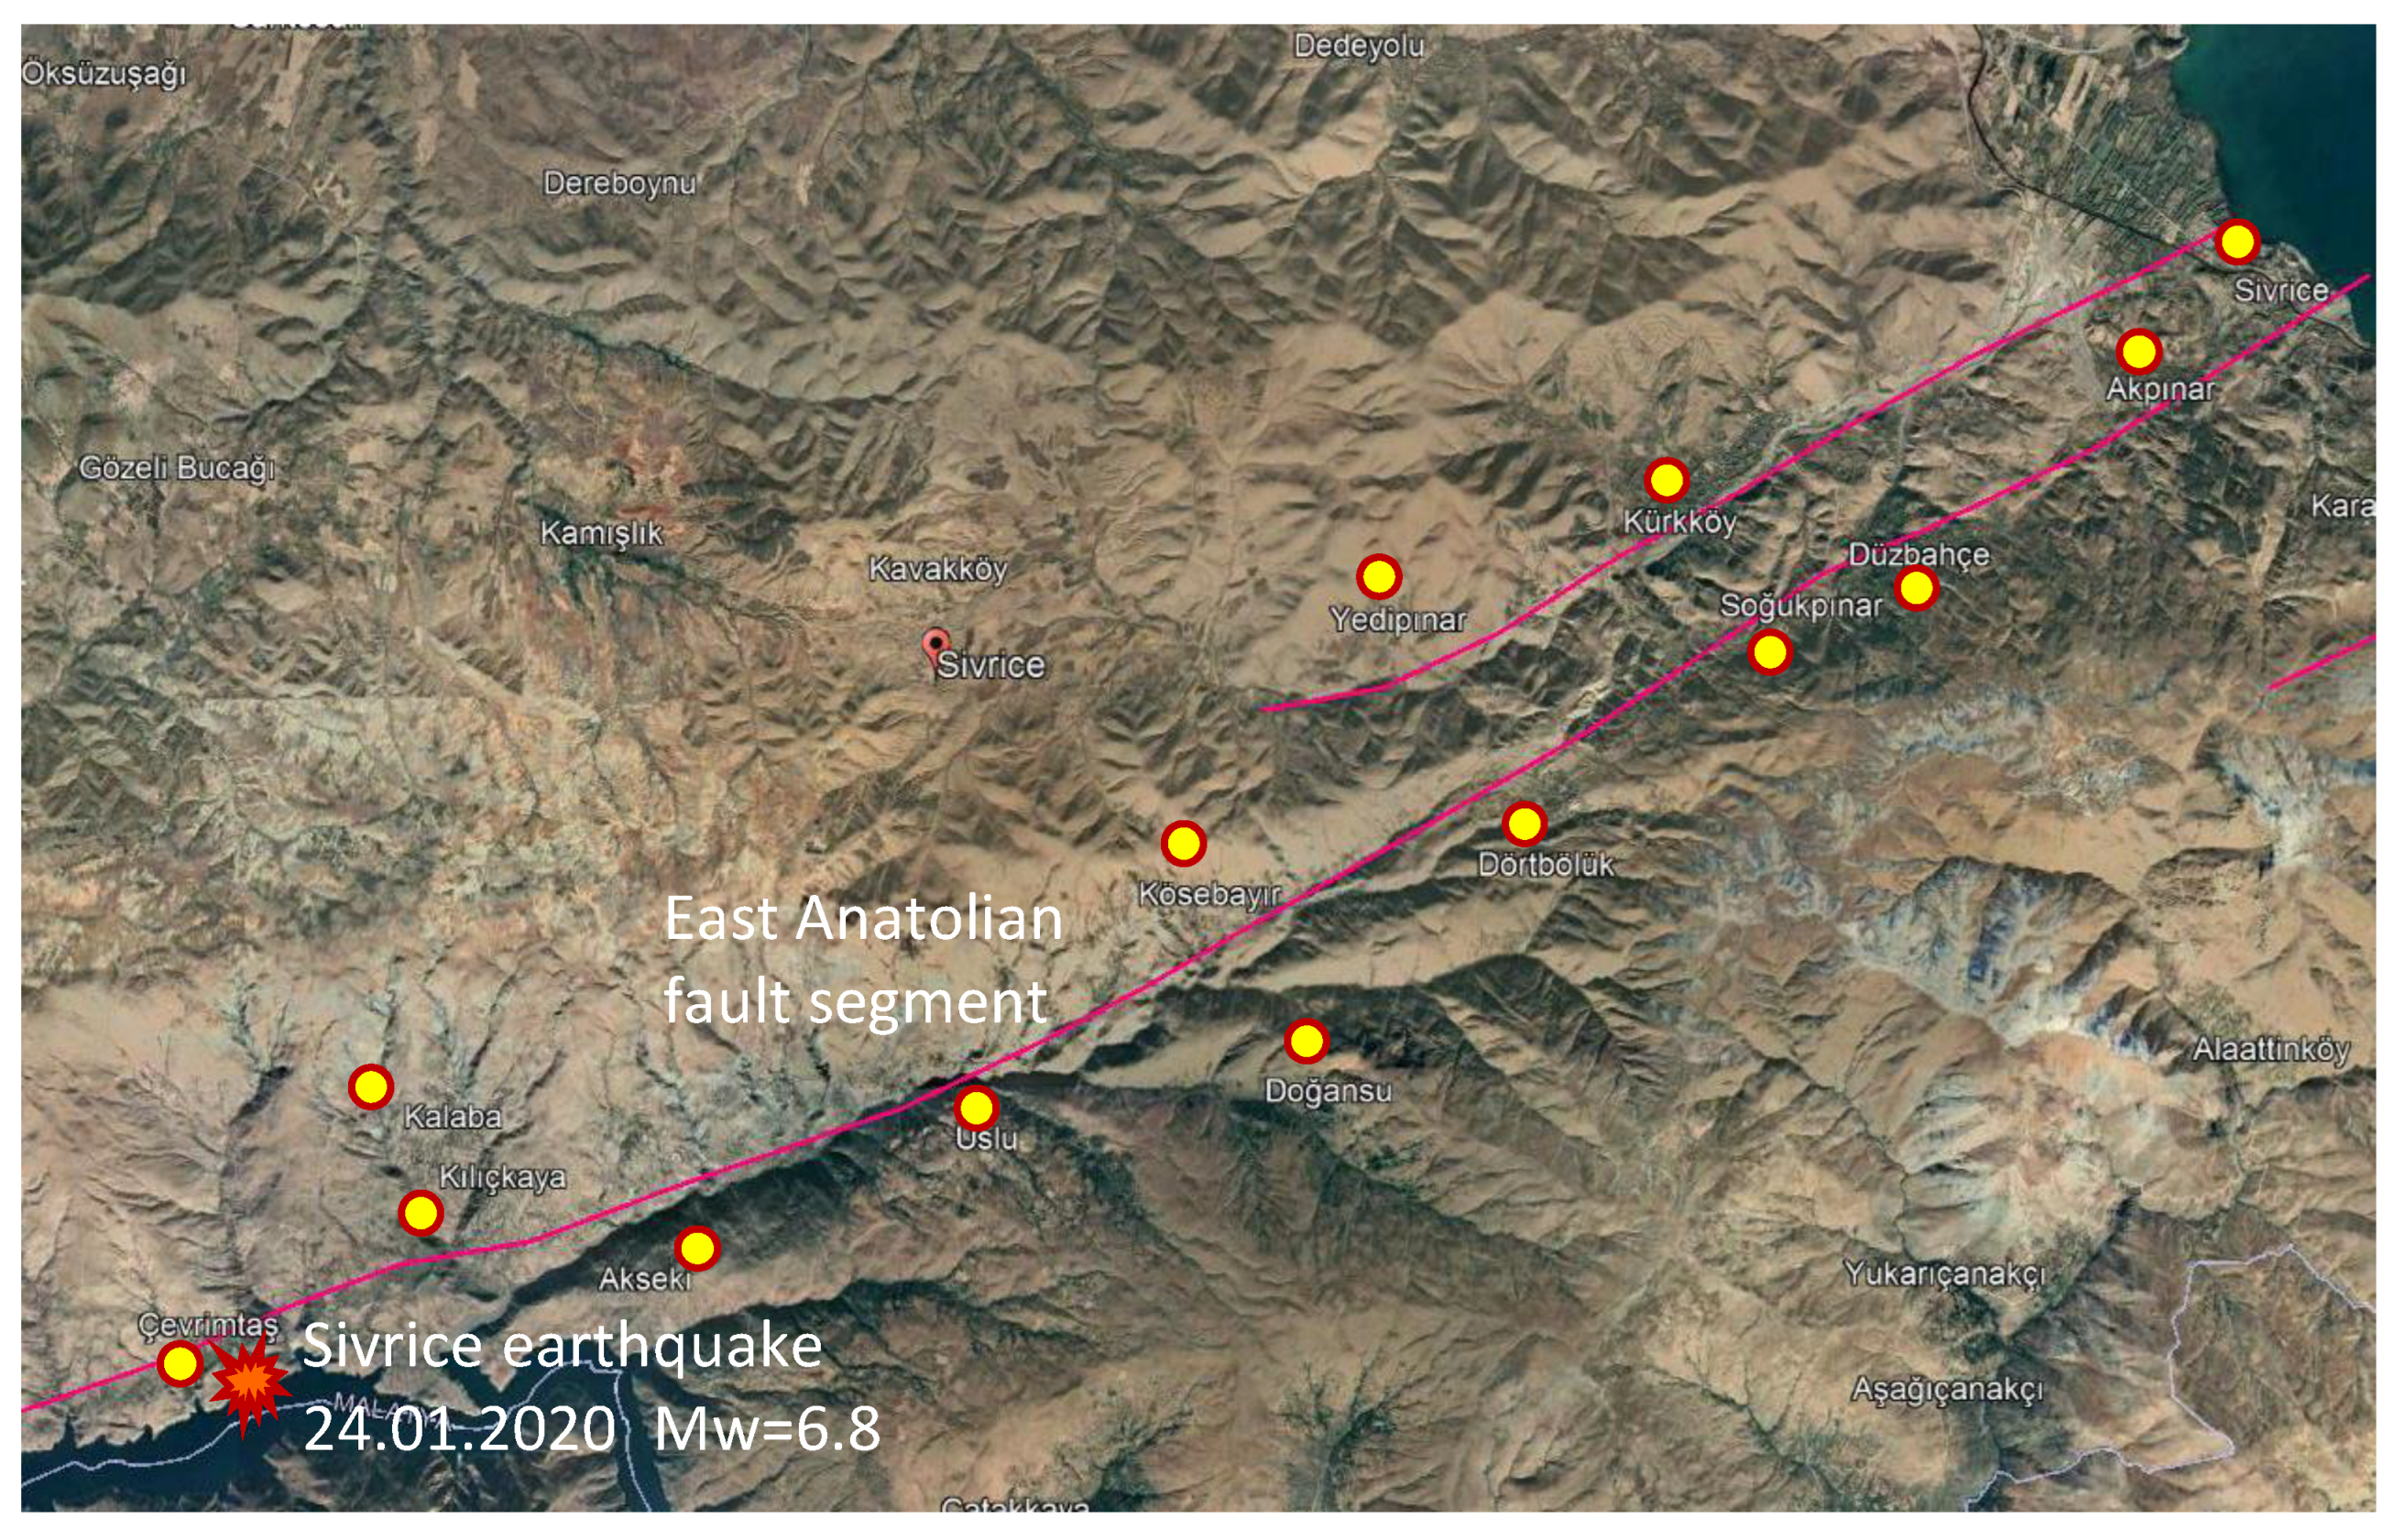
Figure 16) and remote villages in rural areas, which are very close to the active fault lines (such as the numerous villages in the eastern part of Anatolia, Turkey, among which the active East Anatolian Fault is passing and triggering major earthquakes in the area, the latest in 2020 with Mw = 6.8,
Figure 17).


