1. Introduction
According to the last Global Status Report for Building and Construction [
1], buildings have been responsible for up to 38% of the total global energy-related CO
2 emissions in the last five years. Compared to other sectors, reducing buildings’ energy use resulted in having lower costs and higher returns: for instance, the World Business Council for Sustainable Development (WBCSD) demonstrated that the amount of energy that can be cut is comparable to the amount that the entire transport sector currently uses.
The energy waste in buildings is partly due to the generally low citizens’ awareness of the concept of climate change and, more particularly, their role in stopping this challenge that society is confronting today. A great deal of the scientific literature is pointing towards the fact that energy use reduction needs a human-centric focus [
2] and that only with citizens with low-energy habits will the objectives be fulfilled [
3]. Nguyen and Aiello [
4] analysed the phenomenon and highlighted that unaware and unwise behaviour can add up to one-third extra cost to the appropriate energy performance in buildings. In particular, several studies underlined the impact of energy-related behaviour on energy use [
5], and several behavioural change programmes have been developed in the last decade to exploit this potential [
6]. In the same spirit, Saari et al. [
7] overview several studies that find awareness of energy consumption, real-time visual feedback, incentives and providing relevant information to improve human efforts towards energy saving. Respectively, for intelligent buildings, the potential of smart technologies for reducing energy used has been studied in [
8,
9]. For intelligent homes in particular, many researchers have also proposed several optimization techniques to achieve minimum energy consumption while providing the desired comfort level of the occupants [
10]. Few studies (e.g., [
11]) even explore and want to minimize the energy consumption of the IoT devices in IoT-enabled systems.
In behavioural change programmes, educating citizens in the field of energy has a crucial role; otherwise occupants tend to go back to their original behaviours after the experimental period [
12]. Dewaters and Powers [
13] consolidated in their work the concept of
energy literacy that has been used ever since as synonymous of knowledge about energy matters and its use and that defines the concept that this paper is built around well.
To have a more complete vision of behavioural changes, it is important to have it clear how the generation of models works. Models are mental artefacts that allow us to understand a phenomenon. As human behaviour is rather complex, models tend to isolate a given operation of it in a specific facet. This principle selects a model that will be the basis used to build the intervention. In our case, and due to past successful experiences, the Theory of Planned Behaviour by Azjen [
14] has been chosen. This model has been used in the past by Mogles et al. [
15], with good results. The models provide a method to decide on the factors that will have to be taken into consideration for the definition of the intervention, underpinning the justification of selecting the theory of planned behaviour for an intervention like the one chosen here.
Within the context described, society has the great opportunity to promote this behavioural change using new technologies. The new paradigm of the Internet of Things (IoT) is being used more and more in energy-related problems, converting buildings into smart buildings in the frame of smart cities. This opens the opportunity, through the use of activators and sensors of marginal cost, to create frameworks capable of monitoring the whole building’s energy use and supporting occupants in preventing energy waste [
16]. Sung et al. [
17] created an IoT architecture with sensors for each device. The experiment was meant for shared spaces in non-residential buildings and consisted of spotting the difference between three control modes that affect the indoor environment’s conditions. With the so-called ‘comfort mode’ they estimated an energy saving of 11.3%, maintaining the occupants’ thermal comfort. Zhang et al. [
18] studied the IoT application to non-residential buildings through a platform connected to wearable heaters (footwarmers) in order to obtain an overall energy saving due to lowering the HVAC setpoint. They achieved a goal of 75% savings. The same procedure is followed by Kim and al. [
19], who proposed the use of smart chairs, wirelessly connected to the IoT platform, which can be used for both heating and cooling. Another widely used IoT-enabled technique found in the literature consists of using sensors connected to the physiological data of the occupants, with the declared aim of avoiding people’s feedback since it is considered an unpractical sensing procedure. Ghahramani et al. [
20] applied this concept to create an infrared sensing system to be used in shared spaces in non-residential buildings that worked on thermography on human faces.
It appeared from the analysis of the literature that most of the energy consumption optimisation techniques based on the paradigm of the IoT do not consider the occupants’ acceptance of the strategy. According to several studies ([
3,
21]), up to 20% of energy savings can be achieved by provoking a behavioural change in people that use the buildings. In addition, combining behavioural changes in users with the operational efficiency of devices and workstations can lead to an extensive optimisation of the results [
22].
To tackle those behaviours that represent the largest energy waste, IoT technologies can be used to give users the opportunity to express their preferences through personalised real-time feedback. Feedback is of great importance since appliances that are fully controlled by IoT systems risk having a negative impact on the occupants’ comfort. The latest research has shown that these kinds of interventions in the behaviour of people that are based on providing personalised feedback to users in real-time provide more savings than those that provide general feedback ([
23,
24]). Recent experiments have shown great results in terms of energy-saving by using strategies based on personalised feedback. Sanguinetti et al. [
25] developed a user-friendly platform to be used in a university campus, proposing a comparison among the several users’ feedback through a pie chart of total votes. Jazizadeh et al. [
26] developed a framework for an experiment conducted in an office building, where the HVAC systems were operated according to users’ feedback. Ramallo-González et al. [
27] developed an IoT framework to improve communication between the users and the building, in which users received real-time consumption data and responded with their feedback through a mobile app; the collected votes were then used to control the HVAC system. Erickson and Cerpa [
28] obtained a 10% energy saving by developing a real-time control strategy of air conditioning based on people’s monitoring and feedback collection. Lam and Wamg [
29] conducted two experiments (both in a non-residential context) in which occupants’ reactions to environmental changes were collected through a smartphone app, obtaining a 13% energy saving.
It should be noted at this point that the building sector is undergoing a digital transformation and that the initiative to create the data ecosystem of this digital counterpart has already started [
30]. Part of that digitalisation effort has created the need for constructing data models that could help with the categorisation of the information coming from the buildings. It has been seen that that data modelling can help in valorising the digital information coming from the building [
31].
With respect to the design and the modelling of the construction section helped with digital technologies, Manfren et al. [
32] has shown that the importance of the harmonisation of the data is key to obtain the maximum potential of the technologies. In addition, when those data are publicly available, the sector can benefit from large-scale modelling and wide benchmarking to compare the designs at hand [
33].
Taking into consideration the studies that have been found in the literature and that are shown above, the novelty of the work presented in this paper is clear. We show the savings produced by a fully operational an integrated IoT platform that gathers data from a variety of sensors and that creates recommendations to reduce energy use. In other cases, in the literature (shown above), such platforms were experimental sets developed for research purposes; in our case, the platform is fully functional. Our research presents the results of a study that had the purpose of reducing the energy consumption within non-domestic buildings via IoT-enabled interventions that provide personalized advice in real-time, but the novelty is that the platform is fully functional and not experimental. Among others, this gives the advantage of making possible the testing of the impacts over long periods, which facilitated the gathering of the results. The paper shows the methodology used and the results in the real world, and it concludes with a discussion and conclusions section.
2. Methodology
2.1. Evaluation Approach of the Energy Behaviour Change Intervention
A systematic evaluation approach of the energy behavior change interventions in the application environment has been followed. On the one hand, the energy-saving behavior change was assessed of the pilot users based on a survey that collects the perceptions of the users about their daily energy saving actions (e.g., whether they turn off the lights when they leave a room). On the other hand, the actual energy data (heating, electricity, etc.) collected through the IoT sensing infrastructure was used to generate their actual impact on the energy consumption in the pilot buildings. In
Table 1, we see the evaluation means of this research.
A pre-pilot survey was conducted with the pilot users and a post-pilot one in order to collect their perceptions and compare them. In essence, the survey assessed the energy behavior profile of the users in terms of how they perceive their energy-saving actions daily.
A campaign took place in the pilot buildings and lasted about two weeks in summer and in winter, during which the participants used two energy behavioral interventions through which they received triggers (i.e., tips/recommendations) of energy saving in their office.
During the campaign, and for detecting explicit events and behaviors that were not appropriate in terms of energy consumption, several triggers were used, considering them as actuations of occupants that produce energy waste. Utilizing such triggers, the platform could then tackle occupants’ behaviors that imply energy reduction. At the same time, there were also other actions focused on the improvement in the energy literacy of the participants so that energy-saving actions become long-lasting and produce a more permanent effect.
The effectiveness of the campaign could be assessed because the sensors continuously monitored the conditions before, during and after the campaign. Furthermore, the interaction of the participants with the apps was monitored and collected through the platform with the intention to analyze the participants’ engagement and effectiveness of the provided advice. While engagement is fostered by the triggers, the collected data were valuable for understanding and assessing the success of the used tools and actuations.
More specifically, the number of users that interacted with the app can be found within the ENTROPY platform because their activities, such as “answer a quiz”, “perform a task”, “fill a questionnaire” or “read a tip”, were recorded. These recorded activities provided us with an assessment of the users’ engagement with the apps and, thus, the platform. The outcomes of the campaign can be therefore evaluated, given that engagement indicates the information and requests distributed by the platform.
2.2. IoT Platform
The key elements related to the energy ecosystem of a building were defined with a dedicated data model that converts the streams of data onto formats that are easily managed by the IoT platform. The entity building gathers operational and architectonic details of the building such as opening hours, orientation, etc. The entities building sensor, power meter and HVAC refer to the sensors deployed in the building. The external sensor and weather condition entities represent sensors that are external to the building but may provide important information related to consumption patterns [
34]. The proposed IoT platform has been structured in four different connected layers.
Sensorisation layer: This layer is in charge of connecting physical devices, sensors and actuators that are going to provide energy data to the platform. Once this is performed, it maps the collected data to data entities and sends the mapped information to the upper homogenization and storage layer. For this automatic process, the FIWARE IoT Agent enabler (Telefonica I + D, IoT Agent documentation, 2017.
https://iot-platform-docs.readthedocs.io/en/latest, accessed on 1 May 2022) [
35] was used.
Homogenisation and storage layer: This layer provides a uniform solution to store the previously collected data. This way, the heterogeneous data are homogenised. Moreover, these layers contain pre-processing mechanisms to ensure the quality of the data collected [
36].
Analytics support layer: The third layer of the platform provides support for data analytics and machine learning algorithms that use the previous homogenised data as input. In particular, two methodologies have been included in this layer: energy consumption estimation and profiling of HVAC users [
37].
Service layer: This layer serves as an interface between the platform and the different stakeholders that use it. The provision of services can be performed by anything/anyone from a building services manager to the back end of a smartphone application or a dashboard with personalised recommendations [
38].
The data collected at the sensitization layer are sent in NSGI format to the higher levels. Those data include the temperature in the rooms, relative humidity and CO2, but they also include other data streams such as air conditioning operation parameters. The set-point temperature received from the conditioning systems allowed for the estimation of the energy used by the devices for conditioning taking into consideration the learnings from the detailed thermal model. The model allowed us to estimate the expected consumption, and the real data were sufficient to analyse how the savings progressed.
2.3. Pilot
The project at hand had one pilot with different sensor sets that allowed us to capture the consumption of energy and the environmental conditions. The combination of them allowed us to have a full view of the energy demand in the building and the users’ perception of energy use.
The pilot is a public building equipped with more than 200 IoT devices to capture information related to energy consumption and people’s comfort. Thanks to this information, the objective of analysing the efficiency of this building regarding energy consumption was achieved. In order to perform the study, a thermal model of the building was built using EnergyPlus, taking into account the installed HVAC equipment that provides conditioning, as well as the thermal envelope that isolates the building from the outside. Using the data retrieved thanks to the IoT sensors, the model was calibrated to evaluate different scenarios of intervention success. The possibility of having a large building equipped with IoT actuators and sensors provided a real reference that serves to assure the reliability of the built models. This allowed us to evaluate the impact of providing IoT devices to other buildings. This study is intended to make a detailed work and identify rehabilitation strategies that result in energy savings. Furthermore, the use of simulated models helped to identify the distribution of heat flows in buildings, and thus different energy efficiency strategies can be provided to reduce the energy consumption. For the intervention, four specific offices were selected that were ideal for the test or their use (full occupation) with the sensing available (will be detailed below).
For the model’s design, the EnergyPlus software was used. This software provides an energy simulation environment that engineers, technicians and architects use to model heating and cooling processes and their associated energy consumption.
The building in which the pilot is performed is in fact a set of three buildings: building 1 has 5 floors, and it has the main entrance for the complex; buildings 2 and 3 have 3 floors each. All of them are internally communicated through the main corridor accessed via the Building 1 entrance. The fourth building, which can be seen at the right of the
Figure 1, is a library with 2 floors. The whole set of buildings is oriented 20° with respect to the north axis, located in a latitude of 38°. The rooms of this study are a set of laboratories of similar size located on the first floor of building 2. These laboratories will be referred to as labs 14, 15 and 16 and the largest as lab 17. The latter also includes a server room that is constantly generating heat due to the normal processing of different tasks in theirs CPUs. The distribution of these laboratories is shown in
Figure 1.
The information is gathered through sensors located in the rooms under study. In general, a total of 10 measurements an hour were obtained, but for a closer approximation, only one measurement every hour was collected to be able to obtain the appropriate variations to adjust the model. The measured variables were as follows:
Lab 14: temperature and CO2;
Lab 15: temperature and CO2;
Lab 16: temperature, CO2, lighting and humidity;
Lab 17: temperature, CO2, lighting and humidity.
In order to make energy comparisons and better consumption estimations, the temperature was the central variable; namely, the temperature of the set-point chosen in the HVAC, the air temperature inside the room and the temperature outside were recorded.
The setting point of the HVACs and their operational activity (on/off) were measured and taken into account to deduce the demand that was needed at each moment of the day and to see how the measured data vary when the equipment was working.
2.4. Baseline Calculations
In the following sections, assessment of the pilots and their savings produced by the ENTROPY project are shown. Such evaluation is based on both a data analytics strategy and the generation of the computer thermal models described above that are essential for observing how some actuations regarding behavioural change can impact the future energy demands.
3. Results
During the campaign, and in order to detect explicit events and behaviours that were not appropriate in terms of energy consumption, several triggers were used, considering those triggers and the actuations of occupants that produce energy waste. By means of those, the platform could then tackle behaviours that imply energy reduction. At the same time, there were also other actions focused on the improvement in energy literacy in the participants so that the energy efficiency ideas are long-lasting and produce a more permanent effect.
The effectiveness of the campaign could be assessed because the sensors continuously monitored the conditions before, during and after the campaign. Furthermore, the interaction of the participants with the platform and apps was collected with the intention of analysing the engagement and effectiveness of the provided advice. While engagement is driven by a variety of factors, it works together with effectiveness, and those data are valuable for a better understanding of the success of the tools and actuations.
A campaign was run in the building in order to evaluate the ENTROPY tools in terms of energy use. In the following sub-sections, the outcomes of the interventions are detailed.
3.1. Perceived Energy Impact
The participants of the campaign believe that they enact energy-saving actions (e.g., when I leave my work area, I turn off the Air Conditioner) regularly at work with a very high rate of agreement on average (5.86/7). After the campaign, most of the users (57.14%) maintained and increased their positive energy-saving behaviour even more so (5.92/7) on average. Specifically, the reported average increase in conducting energy-saving actions at work was 1.02%.
Respectively, in the campaign, the users agree that they practice energy-saving actions regularly at their office with a very high rate of agreement on average (5.4/7). After the campaign, most of the participating employees (73.91) believe that they continue to conduct the same energy-saving actions even more so (6.28/7) on average. In sum, the reported average increase in conducting energy-saving actions when utilizing devices at work was 16.11%.
Overall, it is seen that, after the campaign, the users believe that they perform energy-saving actions at their workplace (+16.11 increase versus +1.02 on average). It is noted that at the beginning of the campaign, the IoT-enabled interventions were work-in-progresses correcting technical issues and fine-tuning them. The installed infrastructure in the pilot buildings had to be reconfigured to best fit the buildings’ constraints and the intervention’s requirements. Simultaneously, the comments collected from the users during the campaign were utilized towards the final, optimum deployment of the interventions. Thus, at the end of the campaign, the user’s interaction with the interventions was a smoother increase in the users’ engagement and satisfaction. Hence, it is believed that this resulted in a more positive impact on the users’ energy-saving actions.
3.2. Actual Energy Impact—Heating
In several buildings, such as the one under study, a large part of the energy consumption is due to heating. Among the interventions, various tips and tasks were related to the effective use of heating. Two of the examples are encouraging a decrease in set-point temperature in winter and an increase in set-point temperature in summer.
To assess the effectiveness of ENTROPY intervention, the set temperatures of the four rooms of the pilots were analysed together with the weekly heating and cooling energy consumption. For this situation, it is important to see whether the user’s choice of high temperature has decreased. In that way, and by reducing the number of hours in which the heating was on, the energy from the conditioning machines would also be reduced (The heating/cooling console is regulated by four VRF machines on the roof, which provide refrigerant for the entire building. It was not possible to break down the electricity usage of a particular room).
Figure 2 depicts the data of weekly energy use for heating before, during and after the campaign in winter. The points are drawn over a curve representing theoretical energy use for heating due to weather. It can be seen that, in most cases, in this regard, the intervention is successful. It should be noted that the data were sufficient to make a valid assessment of the savings. The other three campaign did not provide enough data due to holidays and warm weather. Then, the results of the savings were extrapolated to understand the impact that these savings could have in the whole year.
To translate the change in set-point preferences, these and the outside temperatures were translated into watts using the information obtained from the detailed thermal model in
Section 2.3. In this way, it is possible to obtain a precise quantitative index of the energy required for adjustment.
Figure 2 and
Table 2 show the results of this conversion.
The savings shown in the previous table represent the savings in the two weeks of the campaign plus the two following weeks after the campaign (4 weeks). However, given that the forecasted energy consumption of the winter can be calculated, the energy savings that this intervention would have for the year can be estimated as well. The energy consumption for the whole winter would be 2478 kWh, and the savings would be 517 kWh considering an average savings as the one seen in the experiment of 20.9%.
It should be noted that, in this case, the largest savings were seen in Room 1.15 and in Room 1.16. This does not correlate with the previous consumption of the rooms themselves, so the most obvious reason for this savings to be larger could well be that the conditioning was not being used in an efficient manner before.
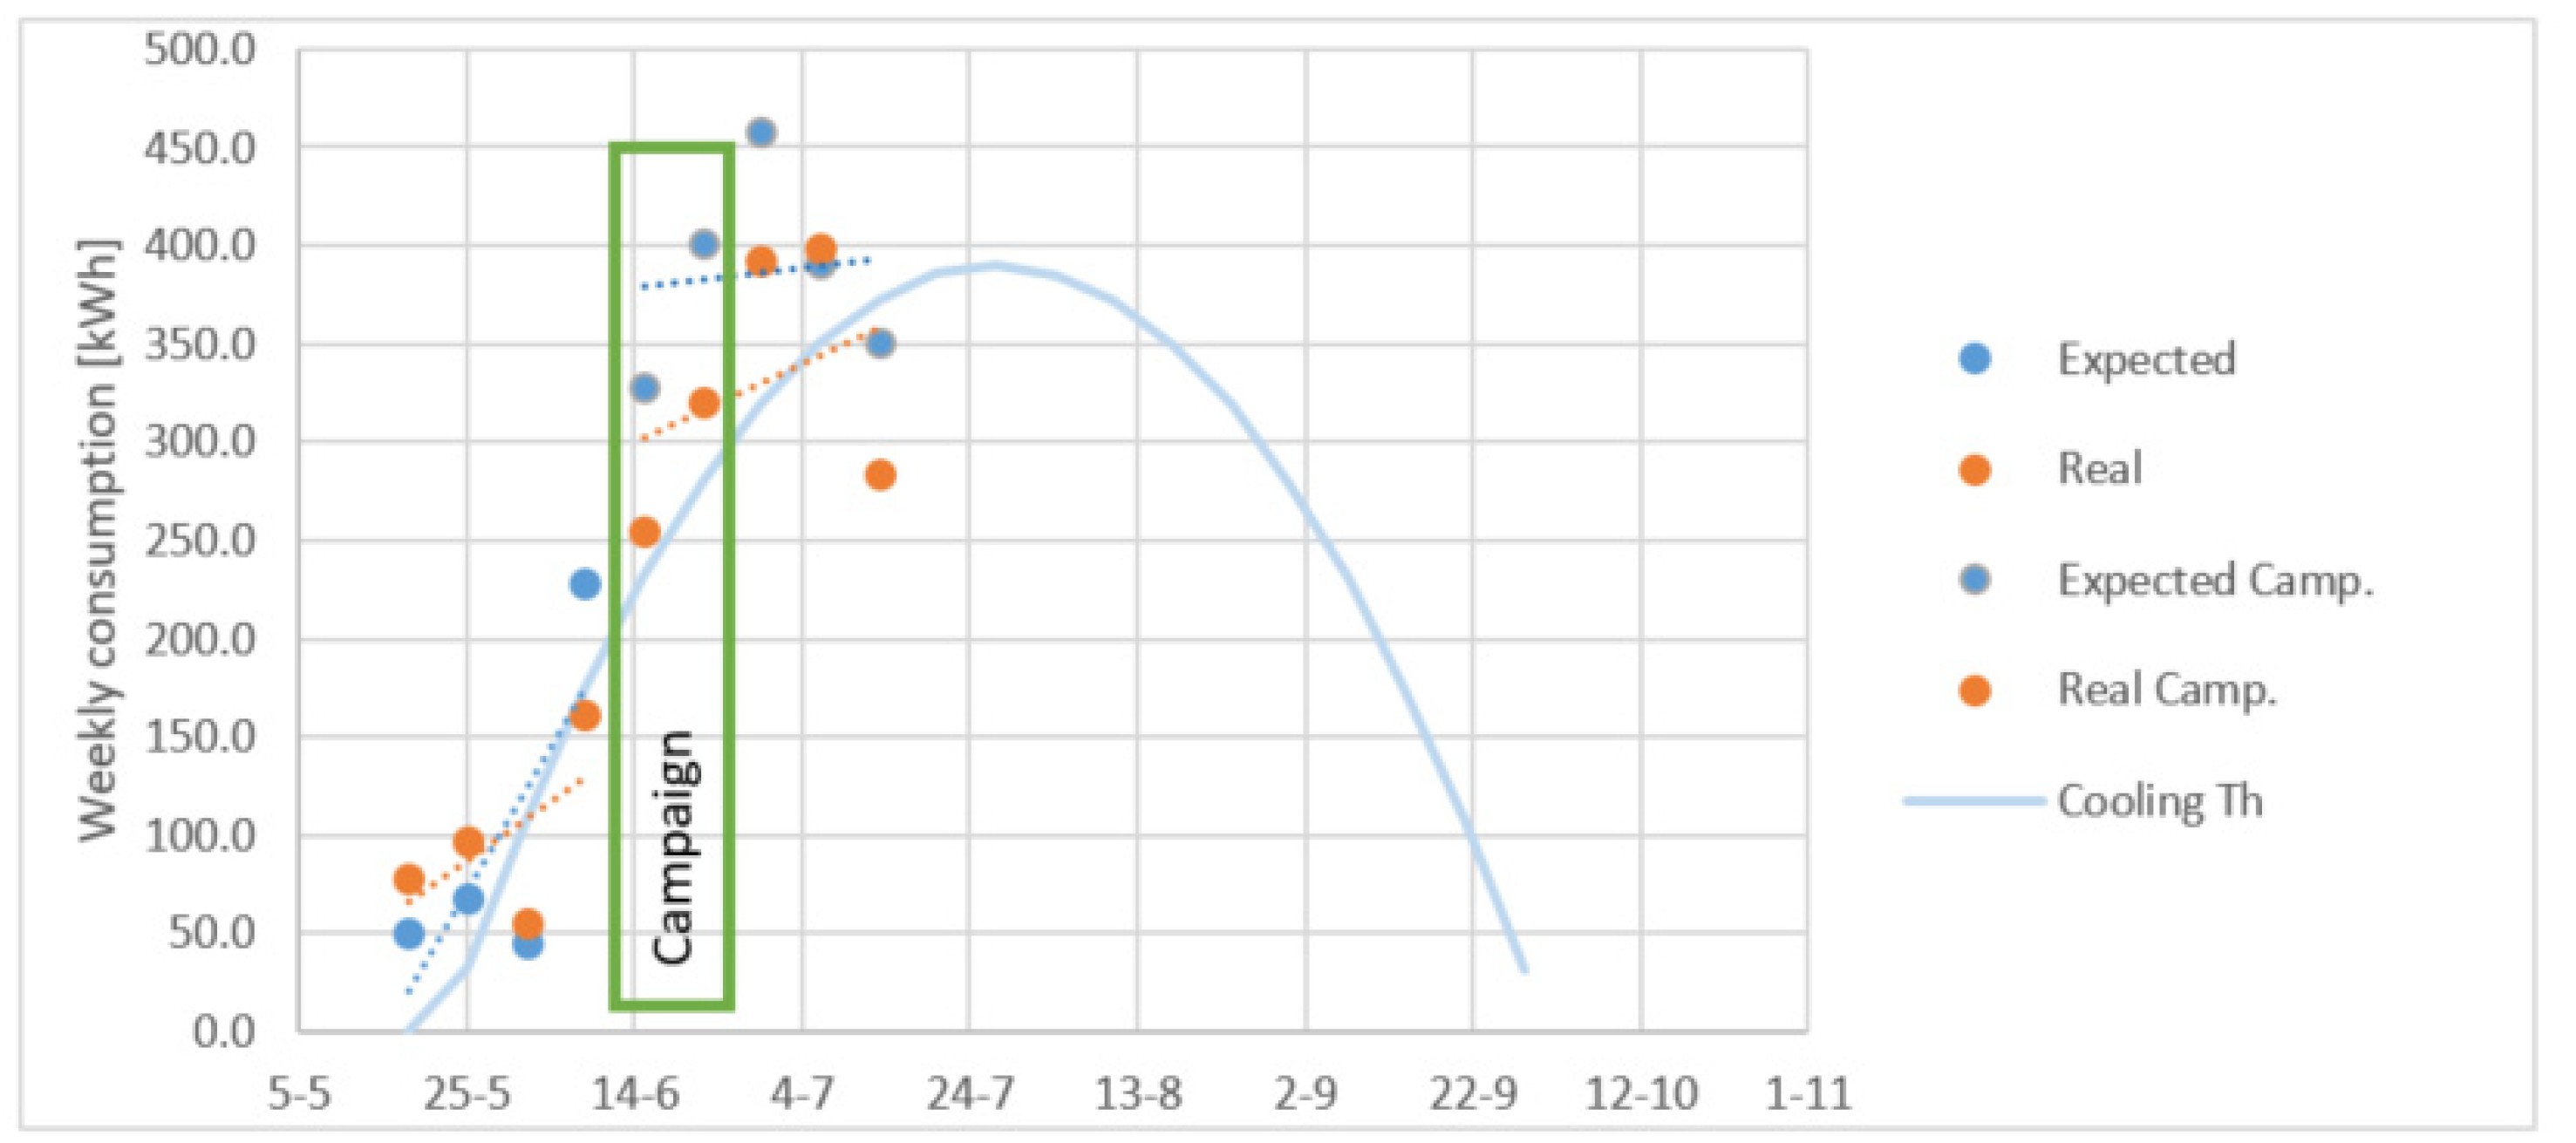
3.3. Actual Energy Impact—Cooling
On the experiments performed, cooling was a substantial portion of the energy use. The pilot was located in Murcia in the southeast of Spain, where a warm climate creates the necessity of cooling during most of the summer period. It is for this reason that the behaviour during the cooling season had to be studied. The savings this time of the year consisted of making users increase their set-point temperatures, as that results in saving energy.
As before,
Figure 3 shows the energy use and how it changed after the campaign being lower than the expected. As the pilot included four rooms, these were shown in
Table 2.
Table 2 portrays positive results. Even though in most cases the set temperature in winter is below 22 °C, in most cases, cooling seems to be set at a temperature higher than that, as we see that there are savings mainly in room 1.17.
When observing the savings in
Table 3, it can be seen that, depending on the room, the reduction in energy can be substantially different. The savings in Room 1.17 are substantially larger, and the changes in Rooms 1.14 and 1.15 are negative, meaning that an increase in the energy use occurred. It should be noted that room 1.17 is the one with the largest area and the largest machines for conditioning (hence the higher energy use). This means that the savings in the room with the large conditioning system overcompensate the slight increase in the others.
The savings in
Table 3 represent, as in the previous analysis, the four-week period that includes two weeks’ prior the intervention and two weeks after/during the intervention. Nevertheless, and thanks to the information that was gained with the thermal model and with the rest of the data from the baseline, it was possible to forecast the energy consumption that one should expect after observing the effectiveness of the intervention. This extrapolation would lead to a saving of 3031 kWh in the winter period and 407.5 kWh of savings in the summer period. Adding these two together, it was calculated that the intervention would be equivalent to a 13.4% saving over the year.
4. Discussion
The results presented here are a summary of the findings of the ENTROPY project, a European project that deeply investigated the possibility of reducing energy use via the use of ICT technologies to provide personalised timely advice and, with this, enhancing efficient habits and energy literacy.
The experimentation was carried out in a pilot study that included two buildings in the city of Murcia, Spain; in these two buildings, it was investigated the effect that the interventions had in energy use disaggregated by devices’ consumption. In addition to this, surveys have been performed that allowed us to measure psychological indicators that inform about the changes that the participants have had with respect to attitudes and energy literacy. Three surveys were completed by the participants, one at the beginning of the study, another one in between and a final one once the project had ended.
In the study, and looking at the results of the surveys, we found out that the personal norms with respect to energy saving were high, even before the interventions. The personnel of the university where the pilot test was carried out are highly educated, and it is their substantial knowledge about environmental issues that generated this intention to save energy, even at the beginning. Having said this, the surveys show that there has been a higher motivation to save energy during the interventions. This could be because of the gamification strategies of the feedback that give points to those saving energy and make the action into a competition. It is nevertheless seen that energy saving, if it is happening in a permanent way, is because it comes with an increase in energy literacy. This can be challenging when the building users seem to lose interest in feedback systems that continue giving the same recommendations for several weeks. It is important, therefore, that more work is conducted to design strategies that make interesting the energy feedback to users during long periods of time, or while the consumer is falling into energy waste.
Also from the surveys, it was extracted that the attitude to save energy was low before the interventions. This is important, as this is one of the indicators that will make people save energy. In this respect, it was interesting to see how the reactions of participants were different depending on the person. It is seen a clear group in which the attitude has increased, and they want to save energy. In the other group the attitude seems to stay the same. This could be because, for some people, the message did not come across, resulting in a failure of communication. It should be noted that the group that had their intention changed was larger than the other.
The results that have been seen to be more promising in the study are those corresponding to the actual behaviour. It has been seen how the group showed a considerable increase in behaviour towards energy saving between the interim survey and the final survey. This is highly relevant, as the theory of planned behaviour shows how the behaviour is the final stage of the other factors affecting an action (intention, norm, or control). It seems from the results that the users needed to change their intentions, their norms and their controls to finally fall into behaviours that save energy. This was achieved at the end of the experiment, where the savings in energy were observed.
As mentioned before, the personal norm was already high in the participants in the study. Nevertheless, a slight increase was found in the group under study. This translates to the perception of the participants of having more energy-efficient behaviours than before the intervention. In addition, a similar thing occurs in the behavioural intention and the self-reported behaviour. However, the most important finding in the authors’ opinion is the increase in energy-saving competence. This is highly related to energy literacy, which has been seen to be the most effective measure to produce long-lasting energy-saving behaviour.
With respect to savings in energy use, the intervention had a substantial effect in the pilot. The study gave us the opportunity of evaluating the energy savings with respect to conditioning. The behaviour tackled in this respect was the change in the set-point temperature, as it is known that this can substantially reduce energy use. For heating, a saving of around 20% was seen because of changes in the set-point temperature. In the second campaign, the decrease in energy use was not that clear, but that was correlated to a decline in the interest of the participants that has been seen in the literature before (for example, [
3]). The cooling was also considered in the campaign. As in the previous case, the set-point temperature was considered as the behaviour to tackle. In this case, we also saw correlation between high savings and big participation (completion of quizzes and other activities in the apps).
In general, the savings were considerable in both pilots, but it is even more important to see that the savings are similar to those seen in the literature. In addition, it is seen how the applications and personalised feedback increase energy literacy which is an important factor to achieve long-lasting energy-saving behaviours. It is also important, and this has been seen in the studies, to make the apps appealing so the participants do not loss interest. In this line, it was seen that too many messages can be counterproductive to this purpose. The participants become “weary”, and it is more difficult to send the message across. It is important to see that the amount of messages required depends on the users, so a detailed analysis of the demographics and the personality of the participants has to be conducted to design an effective campaign. In our case, it was found that a couple of messages a day was the optimal number.
5. Conclusions
Energy reduction is a complicated, multifaceted endeavour. The literature has shown that the literacy on energy is a key necessity to make savings effective and lasting. Our interventions show that sending personalised information to users to tell them how to save energy leads to a real reduction in energy use.
It is important considering the low levels of energy literacy of the general public to make interventions that increase energy literacy. From the experience of the pilots and due to the learning of casual interviews with the participants, it should be said that energy can be saved when you are told how to do it. The perceived energy saving competence increased in this study, which is a great indicator of how people were taught to save energy. In the future, more work will need to be conducted on how to make these interventions more educational.
Overall, this paper shows a large study to investigate the options to reduce energy use in buildings thanks to behavioural changes. It is firmly believed that the findings of the project are interesting to the scientific community and to developers and innovators. It has been seen how, when performed in the right way, energy can be saved in buildings and how those savings can pay for potential installation of sensors and actuators in some applications. For this case, it is legitimate to think that thanks to a step forward in the incorporation of ICT technologies in buildings, these can be more comfortable, efficient and trigger new business opportunities for a more advanced building energy management.


 ,
, 


