Article

Evaluation of Residual Lateral Capacities of Impact-Damaged Reinforced Concrete Members

1
School of Civil Engineering & Transportation, South China University of Technology, Guangzhou 510641, China
2
Guangzhou Jishi Construction Group Co., Ltd., Guangzhou 510115, China
3
Department of Civil Engineering, Foshan University, Foshan 528000, China
4
State Key Laboratory of Subtropical Building Science, Guangzhou 510641, China
*
Author to whom correspondence should be addressed.
Buildings 2022, 12(5), 669; https://doi.org/10.3390/buildings12050669
Submission received: 23 April 2022 / Revised: 10 May 2022 / Accepted: 14 May 2022 / Published: 17 May 2022
(This article belongs to the Special Issue Sustainability and Resiliency of Building Materials and Structures)

Abstract

:
To study the residual lateral capacity of reinforced concrete (RC) columns after being subjected to static and horizontal impact action, static and horizontal impact tests of a total of sixteen RC columns were conducted. The variables considered in the tests included the shear-span ratio, the impact weight and the velocity. The experimental results, including the impact force, the deflection and the strain, as well as the cracking pattern and the failure mode, were discussed. Compared with the load–deflection curves under static and impact loading, it can be found that the inertial effect plays a significant part in the dynamic behaviour of the RC columns. Subsequently, static tests of six specimens with slight impact damage were carried out to obtain their residual performance. Based on the Park–Ang damage model that is widely used for assessing the post-seismic performance of RC members, an evaluation method for the structural residual capacity of RC columns after being subjected to impact loading was developed, with its accuracy confirmed by the experimental results.

1. Introduction

With the development of international trade, marine structures are at a high risk of collision events from vessels during their life service. In the current design code of RC piers or columns, the equivalent static method is mainly adopted to consider the impact effect [1,2,3]. Namely, the equivalent impact force calculated by empirical formulae is regarded as the static loads acting on the structures, while the inertia effect and the strain rate effect of material induced by the impact process are neglected. Previous studies have indicated that the influence of the inertia effect and the strain rate effect on structural failure modes is significant. For example, simply supported RC beams with flexural modes under static loads may change to local shear failure when subjected to impact loads, with a shear pug developed in the mid-span impact area, especially for those without web reinforcement [4,5]. Therefore, the classical “shear failure valley” model for RC beams under static loads [6] is not applicable for those under impact loads, in which the effect of impact mass and speed should be considered. Regarding the existing design codes for equivalent impact forces of RC members, the calculation method in the Load Code of Port Engineering JTS 144-1-2010 [7] was established by a limited number of scaled physical model tests and numerical models, with only the impact mass considered; this may fail to reflect the actual response and the damage degree of RC members under impact loads. Therefore, more explicit design methods for assessing the dynamic behaviour of RC members under impact loads are required.
For RC members with damage caused by collision actions, their residual bearing capacities can be a significant index to reflect their damage degree and use as a reference for repair design [8,9]. Considering various reinforcement ratios, stirrup ratios and slenderness ratios, drop weight impact tests on a total of thirty RC beams were carried out by Adhikary et al. [10], and finite element software LS-DYNA was used for parametric analysis. By comparing the bearing capacity between the undamaged and impact-damaged specimens, the residual bearing capacity and the residual stiffness for RC beams after being subjected to impact loads were investigated. It was found that the reduction coefficient of bearing capacity for RC beams ranged from 0.8 to 1.0 for damaged specimens with obvious oblique cracks but not complete fail, while the residual bearing capacity coefficient may be decreased to 0.2 for those severely damaged specimens. Fujikake [11] conducted flexural tests on ultra-high performance concrete beams after impact, to assess their residual bearing capacity. It was found that the static load–deflection curves of the impact-damaged beams were generally consistent with the undamaged ones, but with the curves starting from the residual deflection after impact, indicating that the residual bearing capacity of RC beams could be determined according to their maximum displacements during impact loading. Based on six half-scale rectangular RC columns with different volumetric reinforcement ratios, Peng et al. [12] proposed a method for estimating the static shear performance and the residual axial capacity of RC bridge piers under near-ground lateral loads. A damage criterion relating to the reduction degree of bearing capacity was proposed by Tian et al. [13], aiming at investigating the effect of different protective measures, namely, externally bonded steel plates and external application of aluminium foam. Pei [14] conducted drop weight impact tests on twelve H-shaped steel members and residual bearing capacity static tests on the impact-damaged specimens; it was found that there is a linear relationship between the residual bearing capacity and the initial impact energy. In general, the drop-hammer impact device has been widely adopted for impact tests of structural components [15,16,17]. However, the horizontal impact test is rarely reported in the open literature [18,19], which has a higher capacity for applying impact loads with large mass.
In order to study the response of marine structures under vessel collision loads characterized by large mass and low speed, horizontal impact tests on a total of 13 square RC columns have been conducted by the authors [20,21], to study their dynamic behaviour under the effect of different column slenderness, impact masses and velocities. Besides, static load tests on three RC column specimens with different shear-span ratios have also been carried out. Through the comparisons of the load–displacement curves derived from the static load tests and impact tests, the difference in structural response was discussed. After the impact tests, six damaged specimens were selected for static tests, aiming at their residual capacities. Based on the experimental results from impact tests and static tests, this paper mainly focuses on the residual lateral capacities of the impact-damaged RC members, and further develops the predictive calculation model. The Park–Ang damage evolution model [22] that has been widely used for assessing the post-seismic resistances of RC members is modified, to propose an evaluation method for the post-impact damage coefficient. The accuracy of the modified Park–Ang model was assessed through the comparisons between the predicted results against the experimental ones, as well as those from RC beams subjected to drop-weight impact.

2. Previous Experimental Work

2.1. Tested Specimens

A total of 16 square cross-section RC columns were designed with various cross-sectional dimensions and diameters of the longitudinal rebars, as shown in Figure 1. For all the examined specimens, the effective height of the columns, defined as the distance from the horizontal loading point to the bottom of the column, was 1200 mm. The longitudinal steel bars were symmetrically reinforced with the reinforcement ratio being 1.4%, while the stirrups with a diameter equal to 8 mm and a spacing of 70 mm were adopted. The thickness of the concrete cover was 25 mm. All the specimens were divided into three groups according to their cross-section width (i.e., 120 mm, 150 mm and 180 mm), and the corresponding shear-span ratios were equal to 6.67, 8 and 10, with the diameters of the longitudinal bars being 12 mm, 10 mm and 8 mm, respectively. The material properties of the steel bar were measured and are listed in Table 1, in which Φ15 is the pre-stressed tendons used to apply axial load before the test. The measured average cubic compressive strength of concrete was 60.39 MPa.
The column specimens were tested under constant vertical compression loads with either static or dynamic horizontal loads. During the tests, four linear voltage displacement transducers (LVDTs) were arranged at the column side to monitor the displacement of specimens, as shown in Figure 1b. Strain gauges were arranged on the longitudinal steel bar at the bottom area of the column, and the prestressed tendons.

2.2. Static Test

Three RC columns (i.e., SL120, SL150 and SL180) with different cross-section sizes were tested under constant axial loads and monotonic static horizontal loadings, as Figure 2 shows. The labels of the specimens start with the letters “SL” (representing static loads), followed by their cross-section width. Axial loads were first applied to the target axial compression ratio of 0.1 by the jack located at the top of the column. Then, monotonic horizontal loads were applied by an MTS actuator until the failure of the RC columns. During the testing, the horizontal loads were recorded by the MST system, while the corresponding horizontal displacement was measured by the LVDT located at the top of the column, as displayed in Figure 1b.

2.3. Impact Test

Thirteen RC column specimens were utilized for the impact tests. The details of the specimens are listed in Table 2. The labels of the specimens begin with the letters “DL” (representing dynamic loads), followed by their cross-section width (i.e., 120, 150 and 180 mm), impact mass (i.e., 1.2, 1.5 and 1.8 t) and design impact velocity (i.e., 0.4, 0.8 and 1.2 m/s), respectively.
The setup for the impact test is indicated in Figure 3, which included a horizontal impact device and a vertical drop-hammer impact device. Both devices are connected by four fixed pulleys and steel strands. With the drop hammer falling from a certain height, the test truck accelerates along the horizontal guide rail under the traction of the steel strands until the collision. The initial self-weight of the test truck was 1.2 t, and the maximum weight can be up to 2.4 t by adding steel plates to the truck.
In order to accurately capture the time history data of the impact force, both piezoelectric and piezoresistive load sensors were respectively installed at the front of the test truck and the column cap. The impact velocity was recorded by infrared technology at the position of 10 mm in front of the specimen. Donghua DH5922N signal acquisition instrument was used to collect the data of each sensor (including the load sensors, LVDT and strain gauges), with the sampling frequency set equal to 100 kHz. During the impact tests, a high-speed camera (OS9, Integrated Design Tools Inc.) with a frame rate of 200 fps was applied to record the crack development at the bottom of the column.
Upon completion of impact tests, residual static load tests were conducted, with the test procedure consistent with the static tests, as introduced in Section 2.2.

3. Overview of Experimental Results

3.1. Static Test Results

All the examined specimens exhibited similar experimental phenomena during monotonic static horizontal loading. With the applied static loads increased, it can be observed that bending cracks developed in the tension zone, followed by the yielding of the longitudinal steel bars. Finally, the concrete cover in the compression area was crushed and spalled. The failure mode of RC columns was shown to be bending type with good ductility, as shown in Figure 4a. The load–displacement (F–u) curves of the three static tested specimens are shown in Figure 4b, and the ultimate strengths and the corresponding displacements are listed in Table 3. Compared with the specimens SL150 and SL180, the load–displacement curve of the specimen SL120 rises slowly before reaching the ultimate strength, indicating more ductile behaviour of the specimen when subjected to static loads.

3.2. Impact Test Results

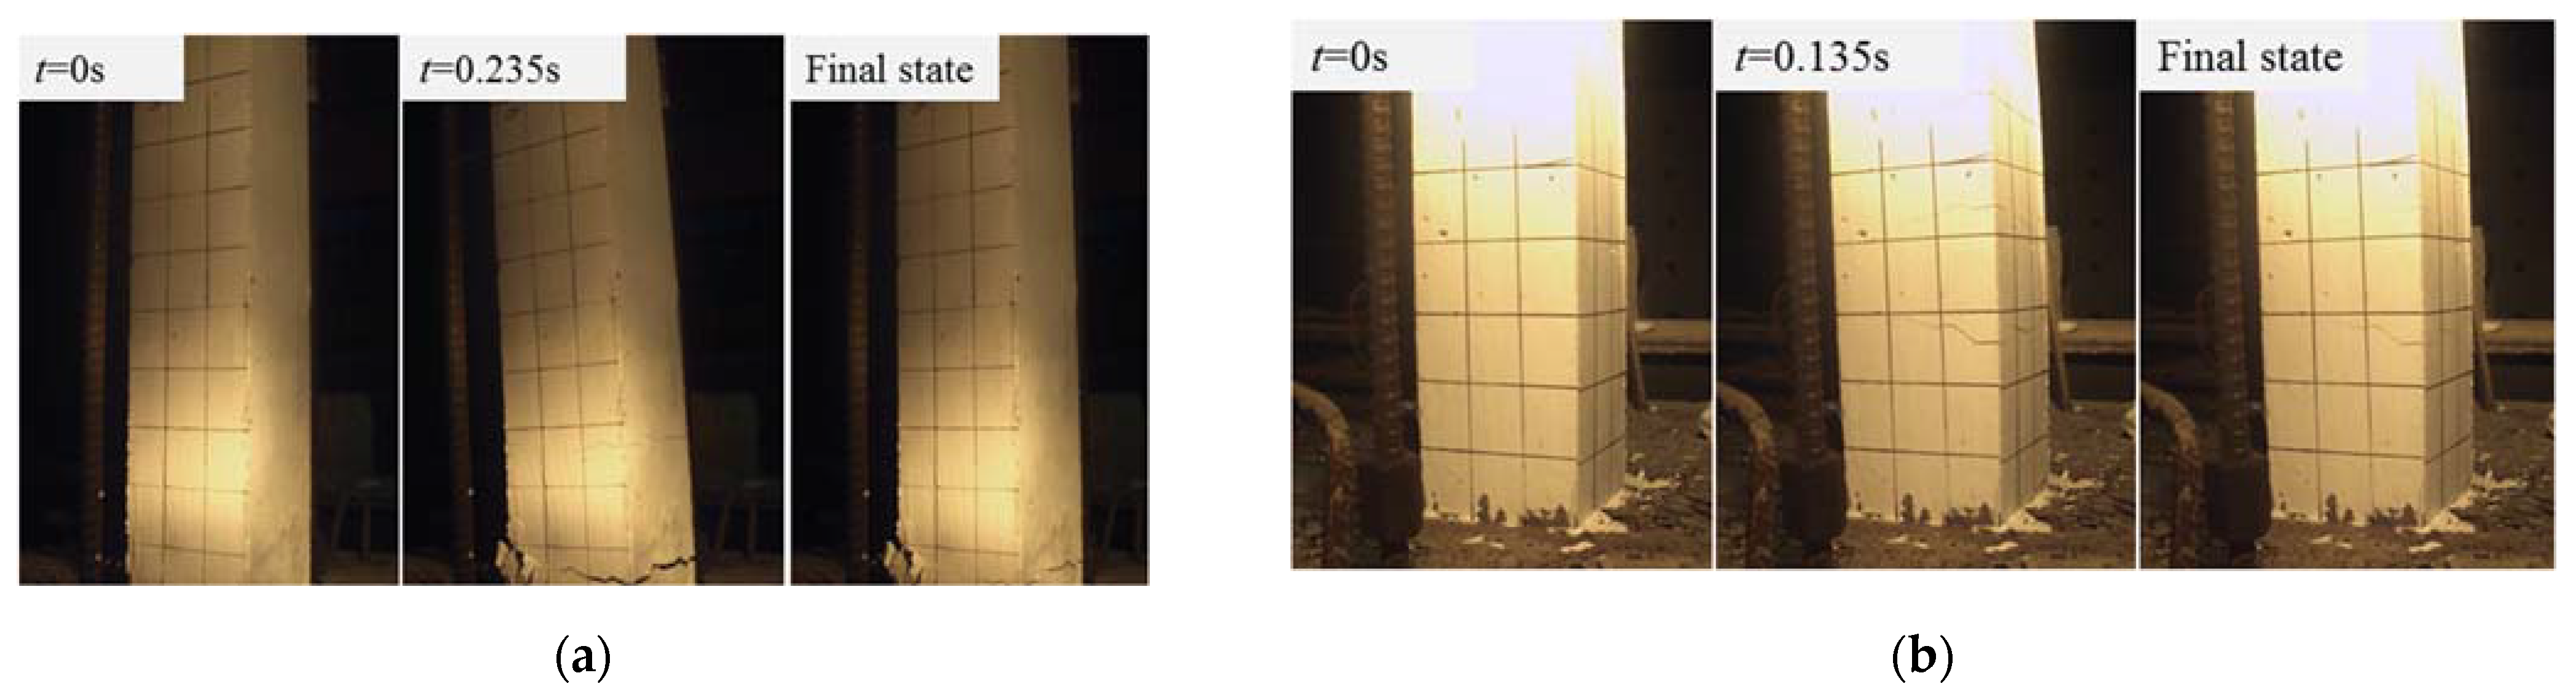
3.2.1. Crack Development

The column specimens DL150-1.5-1.2 and DL120-1.8-0.8 were severely damaged after subjected to large impact energy, with the typical flexural failure mode indicated in Figure 5a. As Figure 5a shows, the compressive concrete cover of these specimens was crushed. The rest of the column specimens did not reach the failure level in the impact tests, with the typical flexural failure mode displayed in Figure 5b. For these specimens, dense bending cracks gradually appeared on the concrete surface during the impact action, with obvious overall deformation of the columns. Until the maximum displacement was reached, the main bending cracks developed to be wide and obvious. After that, the column rebounded due to the elastic deformation energy saved during the impact process.

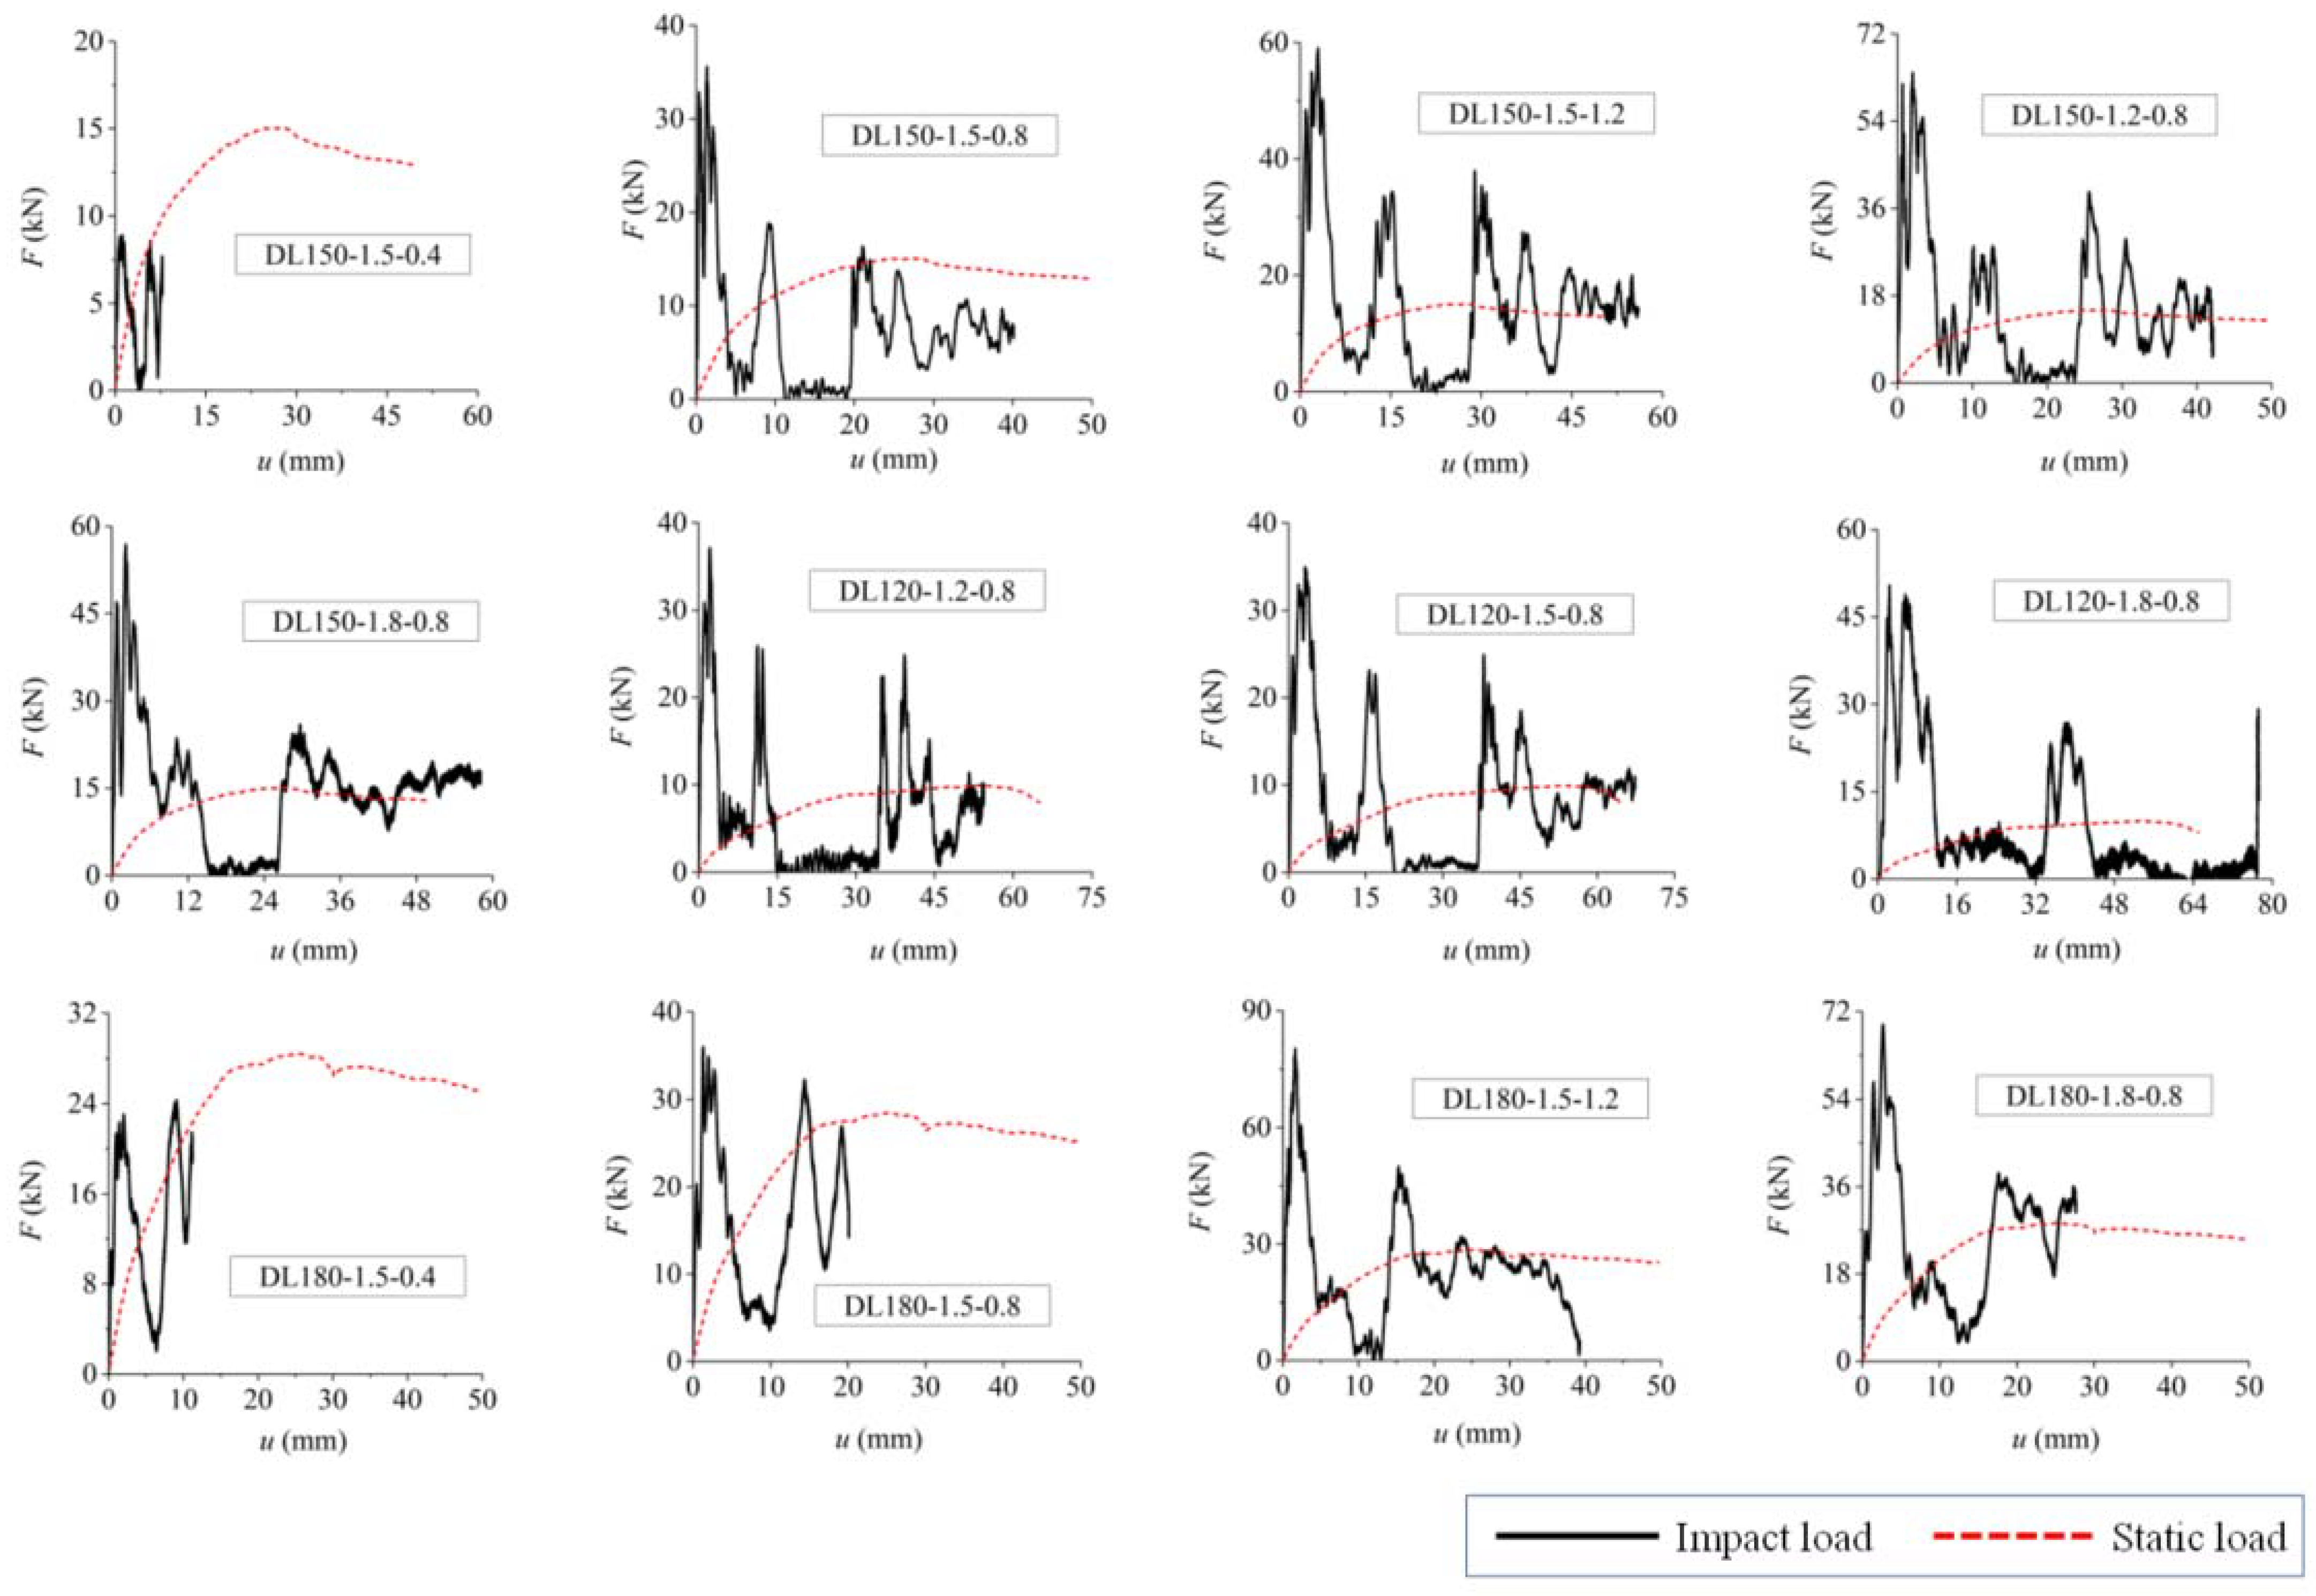
3.2.2. Load–Displacement Relationship

The load–displacement (F–u) curves of all specimens under static and dynamic loads are shown in Figure 6, in which the black solid line and the red dotted line represent the impact and static loaded specimens, respectively. Note that the displacement time history data of the specimen DL180-1.2-0.8 was not successfully recorded. It can be found from Figure 6 that the existence of the inertia effect leads to a significant difference in structural response under impact and static loads. The peak impact force, the impact duration time, the maximum and residual displacement and the deformation energy at the maximum displacement of each specimen can be obtained from the load–displacement curves and are summarized in Table 2.
According to the feature of the impact load–displacement curves, three stages of the impact action can be defined [21], namely, initial impact stage, separated stage and second peak impact stage.
With the initial impact, the RC column will process a larger velocity than that of the test truck, leading to its acceleration increasing rapidly in a short time. The impact force rose to a peak value much higher than that of the static load. In fact, the peak impact force is usually regarded as a virtual resistance [5], since it is mainly induced by the inertia effect, while the proportion that really acts on the member and results in the overall deformation is small. Therefore, the traditional ultimate capacity design method under the static condition may not be suitable for impact conditions, which will lead to a conservative design.
After the initial impact, the test truck was temporarily separated from the RC column, and the load–displacement curves showed an “unloading valley”. The separated distances for the specimen series DL150 are about 10 mm. For the specimen series DL120 with large slenderness ratios and small bending stiffnesses, the separated distances may be relatively larger and up to about 16 mm.
Due to the existence of structural stiffness, the velocity of bending deformation of the specimen decreases gradually, and the test truck catches up with it again. Because the acceleration direction of the column turns to be opposite to that of the test truck, the direction of inertia force changes to be consistent with the impact force, so the impact force–time history curve develops in a fluctuated state that is slightly lower than the static load.
For the specimens (e.g., specimens DL150-1.5-0.4 and DL180-1.5-0.4) impacted with low initial energy, the longitudinal bars did not reach their yield strains, and the load–displacement curves fluctuate along the static load curve. From the residual deflection data listed in Table 2, it can be seen that most of the slightly damaged specimens were able to bounce back to the initial position eventually. Then, the free vibration with damping was performed, and the bending cracks were closed when the impact tests ended. However, for specimens DL150-1.5-1.2 and DL120-1.8-0.8 with larger impact energy, their bearing capacities have a significant decrease after the “unloading valley”; it can be concluded that these specimens have completely lost their impact-resistance capacity after the second peak impact force.

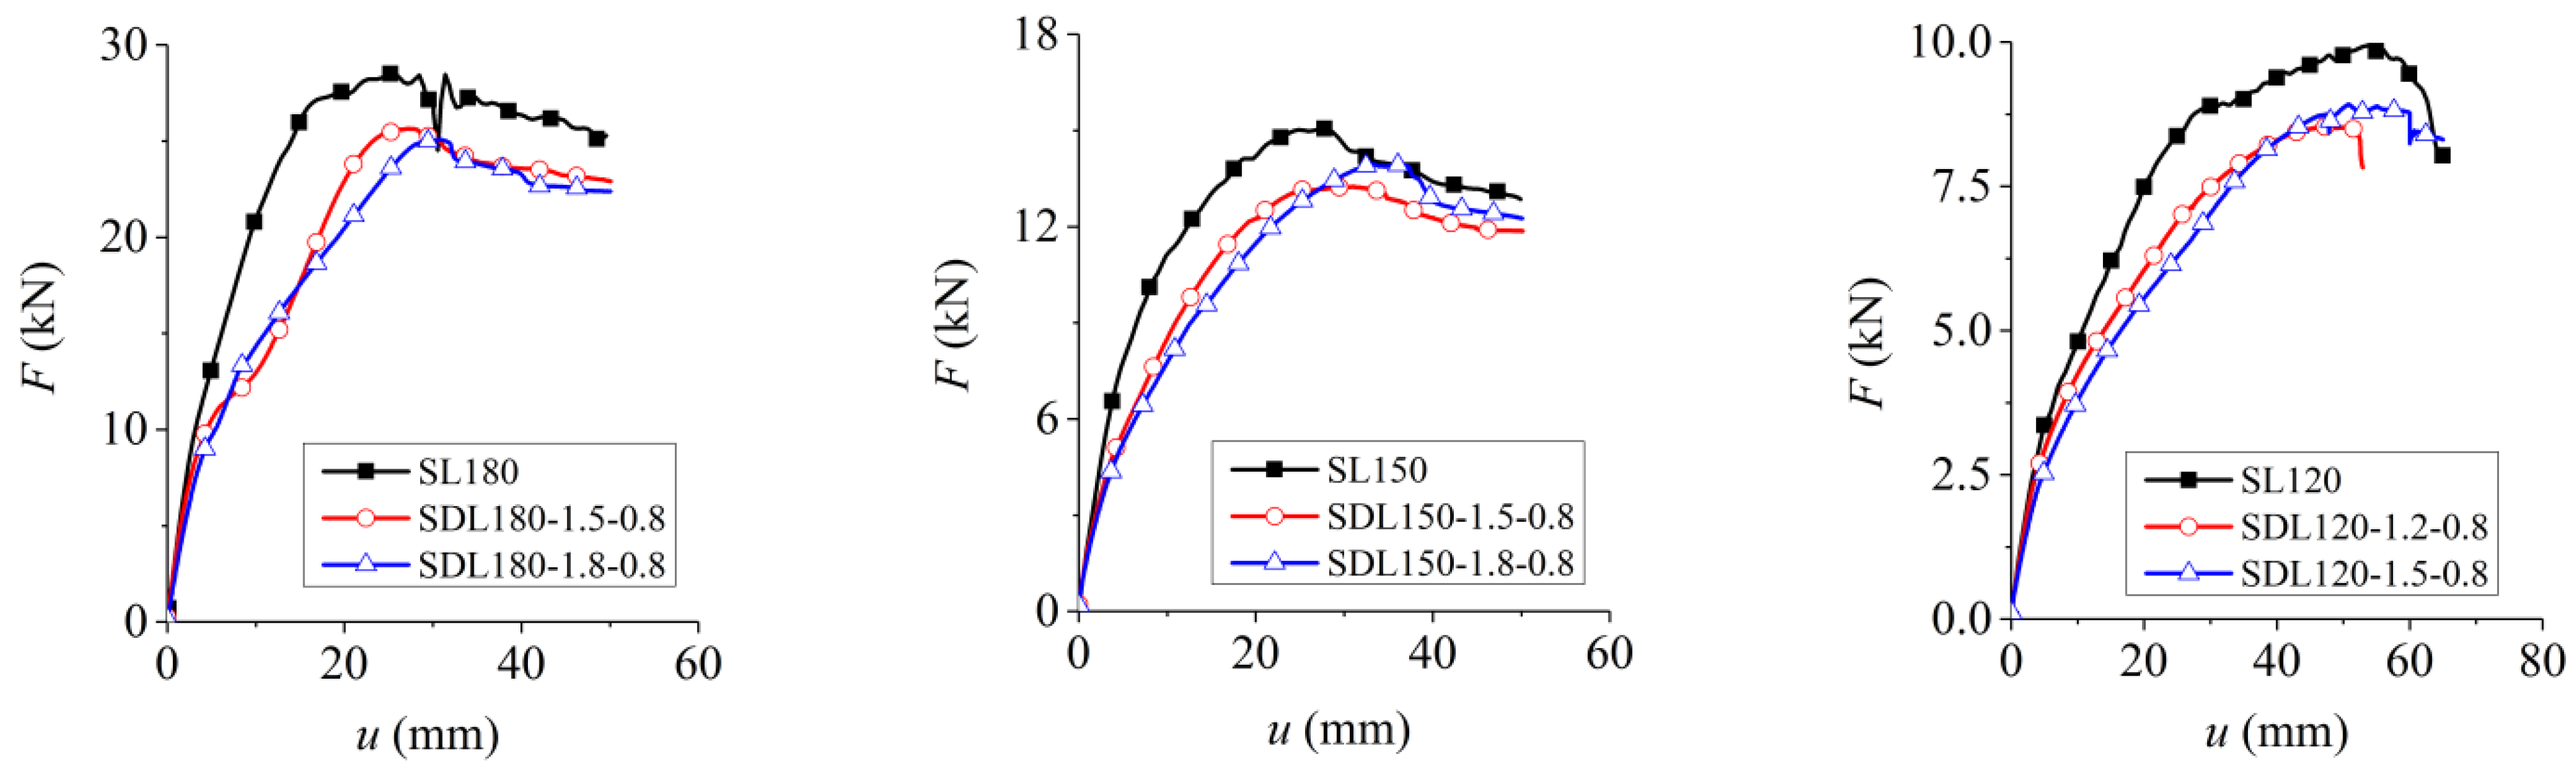
3.3. Residual Strength Test Results

After the horizontal impact tests, six RC columns with slight damage were selected for the subsequent residual bearing capacity tests, as listed in Table 4. The letters “DL” on the labels of these specimens were replaced by the letters “SDL”. It can be seen from Table 2 that the residual deformations of these six specimens are small, which are in the range of 0.17~7.51 mm. Prior to the residual static tests, the residual deflection of each specimen after the impact test is reset to zero. Figure 7 shows the load–displacement curves of the specimens, while the maximum strengths and the corresponding displacement are listed in Table 4. It can be concluded that the stiffness and ultimate bearing capacity of the impact-damaged specimens decreased when compared with their undamaged counterpart, in which the ultimate bearing capacity decreased by 86% to 93%. Moreover, the initial impact energy had a slight effect on the residual bearing capacity, as the shapes of the curves were similar.

4. Damage Assessment and Residual Bearing Capacity Evaluation

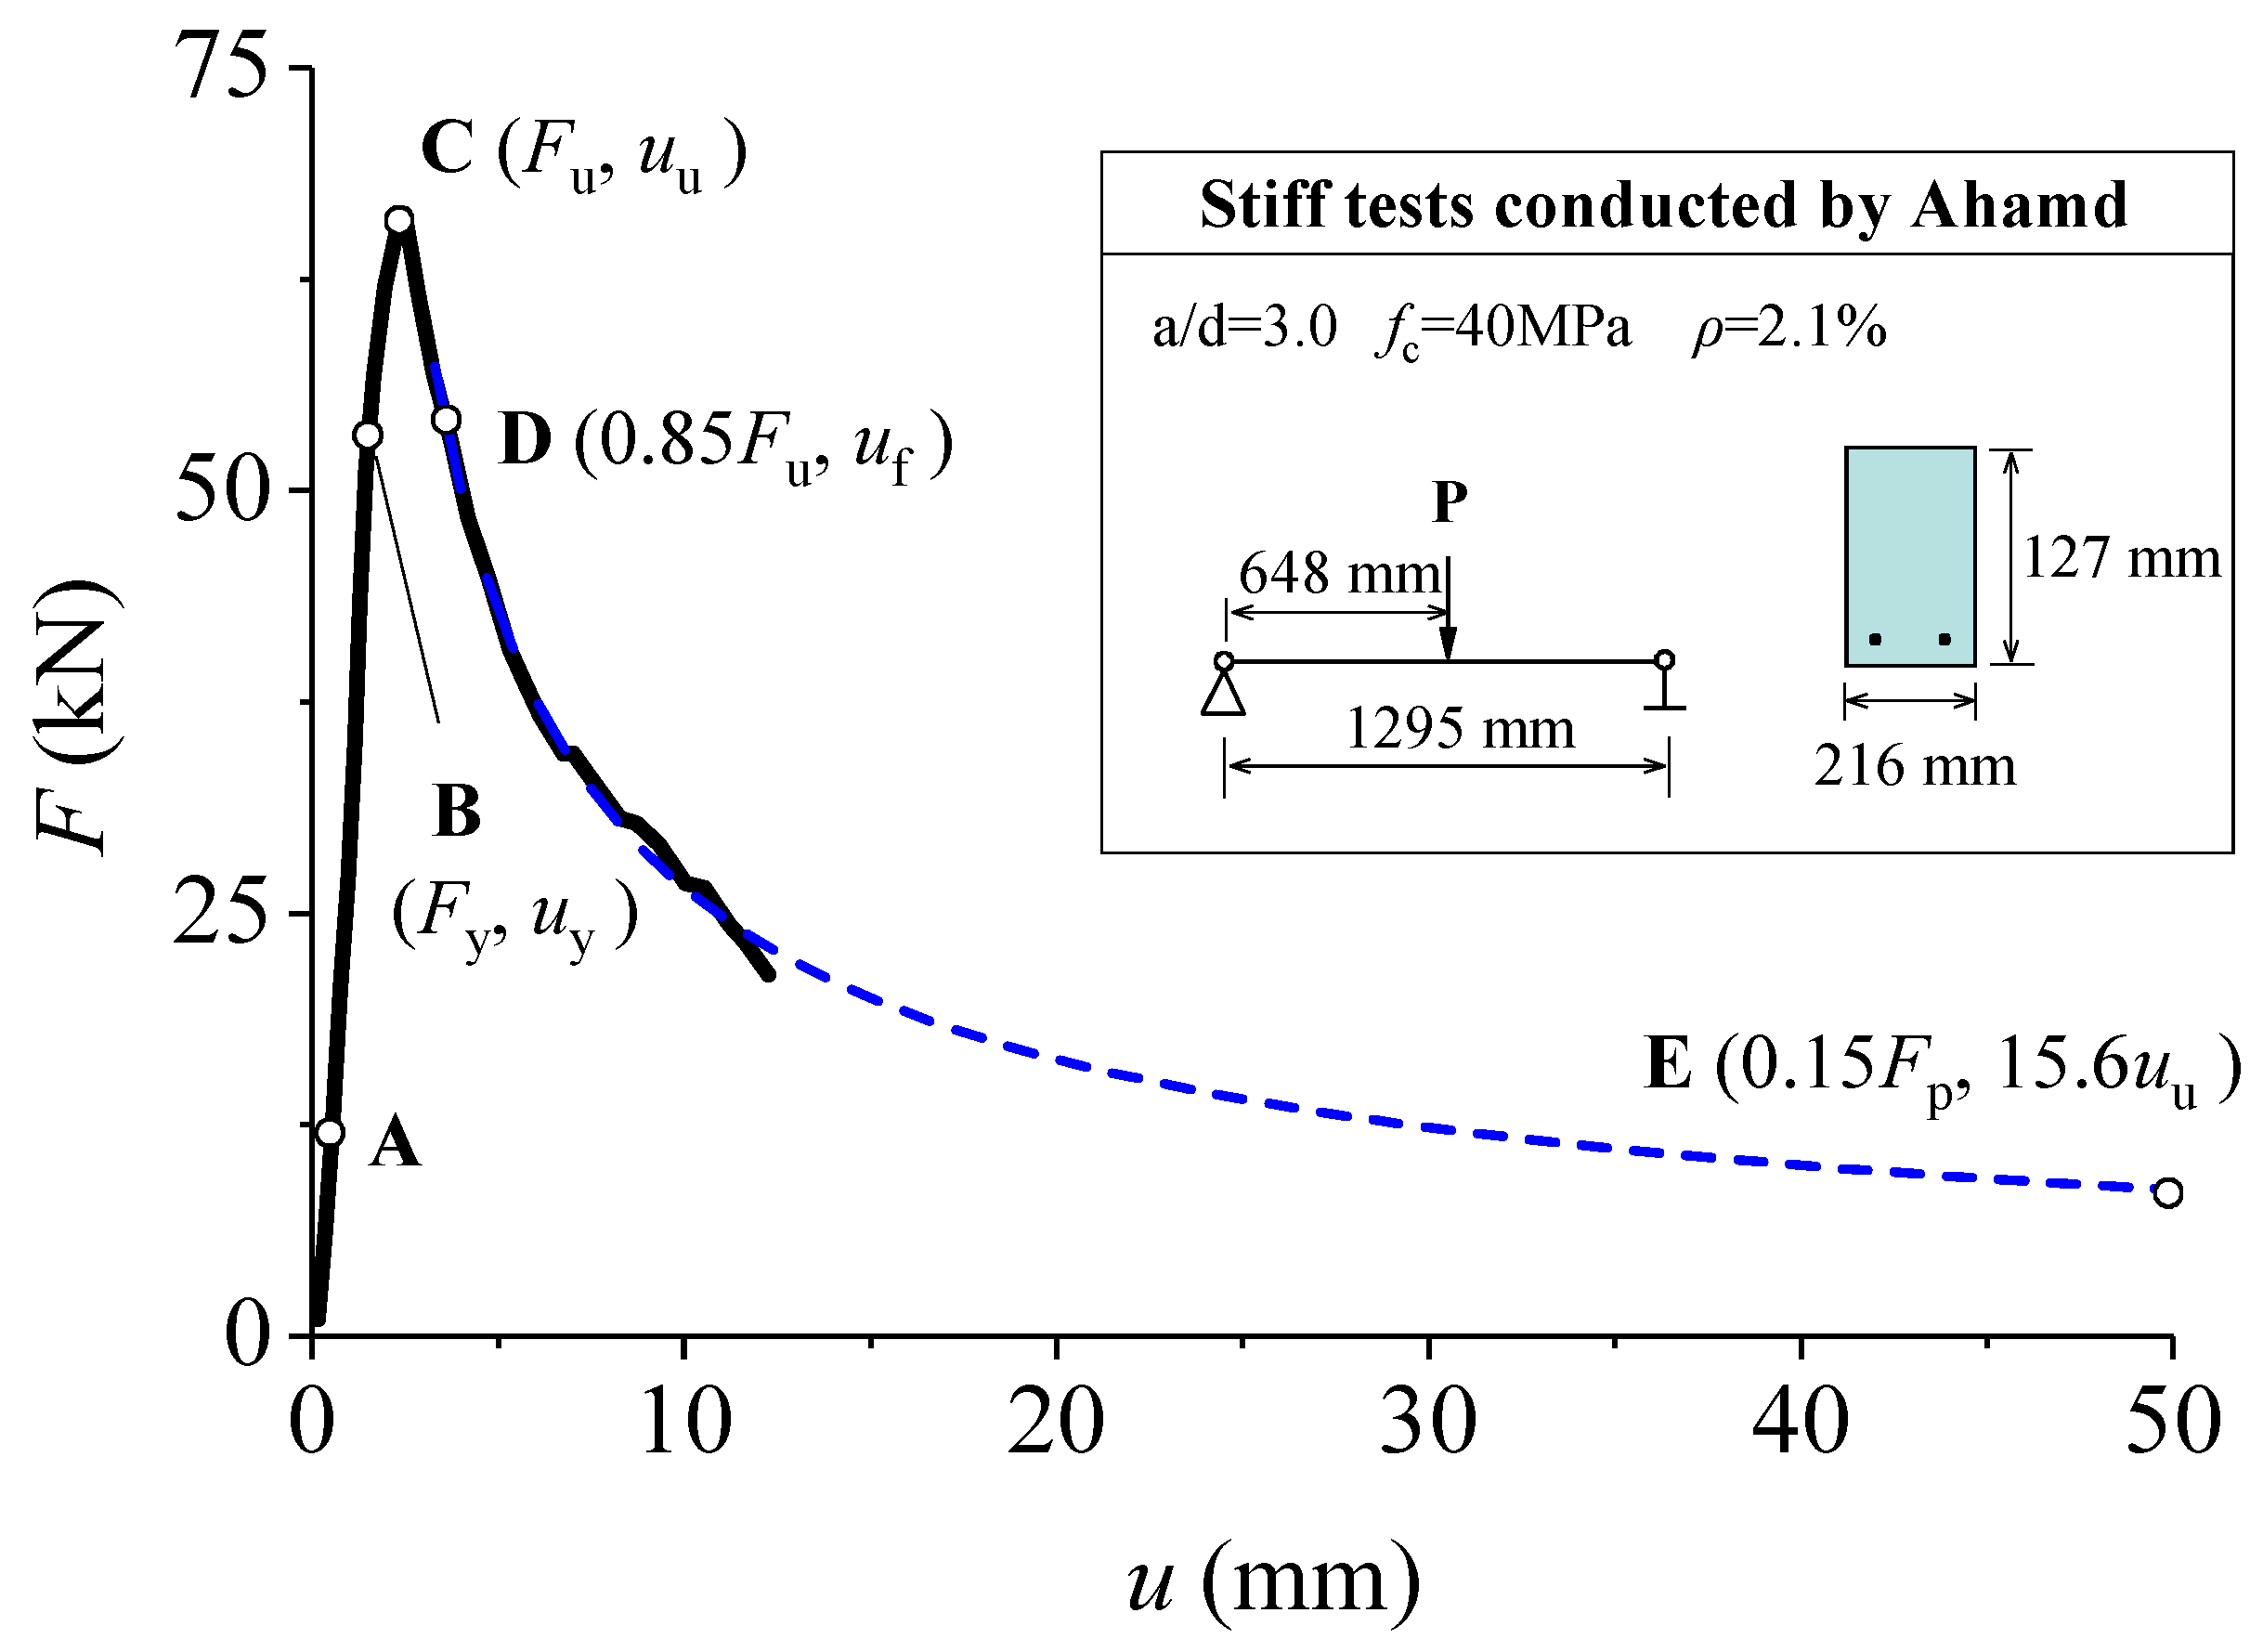
4.1. Modified Park–Ang Damage Model

In order to evaluate the damage degree of RC members under seismic loading, Park and Ang (1987) [22] proposed a damage calculation model based on the structural deformation and energy absorption, as given in Equation (1).
D = u m u f + β d E F y u f
in which um is the maximum deformation under seismic loading, uf is the failure deformation when the post-peak resistance of the member has decreased to 85% of its maximum strength, as indicated in Figure 8, d E is the cumulative hysteretic energy dissipation, Fy is the yield strength and β is the energy dissipation factor and can be calculated by:
β = ( 0.447 + 0.073 λ + 0.4 n 0 + 0.314 ρ t ) × 0.7 100 ρ w
in which λ is the shear-span ratio and is equal to 1.7 when λ < 1.7, n0 is the axial compression ratio and is equal to 0.2 when n0 < 0.2, ρt is the longitudinal reinforcement ratio and is equal to 0.75% when ρt < 0.75%, and ρw is the transverse reinforcement ratio. In general, β is in the range between 0 and 0.85, and can be taken as 0.05 for the ductile components.
However, when predicted by the Park and Ang model [22], the damage coefficients for RC members at the condition of initial undamaged and complete failure under monotonic loading are not equal to 0 and 1, respectively. Thus, a modified formula was proposed by Chen et al. (2010) [23] based on the Park and Ang model [22], as given in Equation (3), which limited the damage coefficient to the range from 0 to 1.
D = ( 1 β ) u m u f + β d E F y ( u f u y )
in which uy is the deformation at the yield strength. The damage coefficient is equal to 1 when the post-peak resistance of the member has decreased to 85% of its maximum strength, representing the complete failure of RC elements.
In this study, in order to evaluate the decreasing degree of ultimate bearing capacity of impact-damaged members, and satisfy the damage coefficient being equal to 1 when the member is severely damaged (i.e., its bearing capacity is equal to 0), an attenuation coefficient α0 is introduced in Equation (3), which can be used to describe the post-peak branch of the load–displacement curve. The formula for calculating the reduction coefficient of residual bearing capacity is defined in Equation (4),
D res = ( 1 β ) α 0 u max u u + β E ab , d F y ( u u u y )
in which α0 = 1/μ0, and μ0 is the ductility coefficient of the post-peak branch of the load–displacement curve, umax is the maximum displacement during the impact process, uu is the displacement corresponding to the static ultimate capacity, Eab,d is the cumulative energy dissipation, namely, the deformation energy in the impact test, and can be determined by Eab,d = 0.6Ek [24], in which Ek is the initial impact kinetic energy and can be calculated by 0.5mv02.
In order to obtain the whole post-peak branch of load–deflection curves, Ahamd et al. [25] designed a rigid test device for three-point bending tests of simply supported RC beams with their shear-span ratios being 2.0 and 3.0. Through these tests, the load–deflection curves with the post-peak loads decreased to 30% of the corresponding peak loads were obtained, as shown in Figure 8. On this basis, the post-peak branch of the curve can be regressed by a power function, as depicted in Figure 8 by the blue dotted line. However, the fitting curve fails to capture the bearing capacity of the member equal to 0. Therefore, the point E with its post-peak strength equal to 15% of the maximum strength is intercepted as the zero point of the bearing capacity, with the corresponding damage coefficient Dres taken as 1; this leads to its corresponding displacement equal to about 15.6uu. The ductility coefficient μ0 of the post-peak branch can be defined as the ratio of the displacement at point E and the displacement at the maximum strength (uE/uu). The ductility coefficient μ0 thus is equal to 15.6 and α0 = 0.064.
From the above discussion, it can be found that, for general ductile members, the value of α0 is equal to 0.064. For the members with complete brittleness, α0 is equal to 0, while it is 0.2 for those with significant flexural failure after impact. To sum up, the residual bearing capacity of RC members after being subjected to impact can be determined by Equation (5), in which Fres is the residual strength and Fu is the static strength.
F res = ( 1 D res ) × F u

4.2. Calculation Method of Residual Bearing Capacity

The residual bearing capacity of each of the impact-damaged specimens was determined by Equations (4) and (5) and listed in Table 4. It was found that the predicted results agreed well with the experimental ones. With the objective to verify the reliability of the calculation method of residual bearing capacity after impact, the residual bearing capacity results of 29 RC beams after drop-hammer impact in References [10,23] were also collected. The details of the specimens in References [10,26] are listed in Table 5, in which the label of each specimen starts with the letters “SR” (indicating singly reinforced) or “DR” (indicating doubly reinforced), followed by the shear-span ratio, longitudinal reinforcement ratio and stirrup ratio. These specimens were subjected to an identical impact weight of 300 kg. From the load–displacement curve given in Reference [10], Specimen SR3.8-0.8 failed in complete brittle shear-type under static load, and α0 is equal to 0. For the specimens subjected to impact loads with impact heights of 1.2 m and 1.6 m, wide oblique cracks and concrete crushing were observed after impact, thus α0 is taken as 0.2. The residual strengths of the beam specimens are determined by Equations (4) and (5), as listed in Table 5. It was found that the predictions are in good agreement with the measured residual bearing capacity of flexural failure-oriented members after impact. The mean ratio of the measured to calculated values is 1.01, with the standard deviation being 0.11. It can be concluded that the proposed damage model can reflect the damage level of RC members after being subjected to impact and predicting the residual strength of impact-damaged RC members.

5. Conclusions

Through the static and horizontal impact tests of RC columns and the subsequent static residual bearing capacity tests, the following conclusions can be drawn:
(1) With the increase of impact energy, the RC columns finally failed in flexure-dominant type, characterized by the yielding of tensile longitudinal rebar and the crushing of concrete cover.
(2) The inertia effect had a significant influence on the impact behaviour of RC members. When subjected to impact loads with relatively low energy, the impact response of the member fluctuates along the static load–displacement curve. However, the bearing capacity shows an obvious unloading trend when subjected to a relatively high energy impact load.
(3) The Park–Ang damage evolution model for RC members under seismic loading is modified, to propose a method for evaluating the residual bearing capacity of impact-damaged members. Through the comparisons of the residual bearing capacity of six RC columns in the current study and twenty-nine RC beams subjected to drop-hammer impact in the existing literature, the accuracy of the proposed evaluation method is verified. Therefore, the proposed method can be applied to determine the damage coefficient after impact and evaluate the residual strength of RC elements in practical engineering.

Author Contributions

Conceptualization, J.Y., J.C. and A.H.; methodology, Q.C. and A.H.; software, Y.W.; validation, Y.W., Q.C. and A.H.; formal analysis, Y.W.; investigation, Y.W. and A.H.; resources, J.C.; data curation, Q.C.; writing—original draft preparation, J.Y.; writing—review and editing, A.H.; visualization, J.Y.; supervision, J.C.; project administration, A.H.; funding acquisition, J.Y. All authors have read and agreed to the published version of the manuscript.

Funding

Funding for this research project was provided by the National Natural Science Foundation of China (52108143), GuangDong Basic and Applied Basic Research Foundation (2021A1515110109), Science and Technology Planning Project of Guangzhou Municipal Construction ([2021]-KJ004; [2021]-KJ021; [2021]-KJ036; [2021]-KJ037). The support for the research is acknowledged with thanks.

Data Availability Statement

Not applicable.

Conflicts of Interest

The authors declare no conflict of interest.

References

  1. Fan, W.; Sun, Y.; Yang, C.; Sun, W.; He, Y. Assessing the response and fragility of concrete bridges under multi-hazard effect of vessel impact and corrosion. Eng. Struct. 2020, 225, 111279. [Google Scholar] [CrossRef]
  2. AASHTO-LRF; LRFD Bridge Design Specifications. American Association of State Highway and Transportation Official: Washington, DC, USA, 2007.
  3. JTG D60-2015; General Specification for Design of Highway Bridges and Culverts. China Communication Press: Beijing, China, 2015. (In Chinese)
  4. Saatci, S.; Vecchio, F.J. Effects of shear mechanisms on impact behavior of reinforced concrete beams. ACI Struct. J. 2009, 106, 78–86. [Google Scholar]
  5. Fu, Y.; Yu, X.; Dong, X.; Zhou, F.; Ning, J.; Li, P.; Zheng, Y. Investigating the failure behaviors of RC beams without stirrups under impact loading. Int. J. Impact Eng. 2020, 137, 103432. [Google Scholar] [CrossRef]
  6. Kani, G.N.J. Basic facts concerning shear failure. ACI Struct. J. 1966, 63, 675–692. [Google Scholar]
  7. JTS 144-1-2010; Load Code for Harbour Engineering. China Communication Press: Beijing, China, 2010. (In Chinese)
  8. Dok, G.; Caglar, N.; Ilki, A.; Yilmaz, C. Effect of impact loading on residual flexural capacity of high-strength reinforced concrete beams. Structures 2020, 27, 2466–2480. [Google Scholar] [CrossRef]
  9. Esfahani, M.; Hoseinzade, M.; Shakiba, M.; Arbab, F.; Yekrangnia, M.; Pachideh, G. Experimental investigation of residual flexural capacity of damaged reinforced concrete beams exposed to elevated temperatures. Eng. Struct. 2021, 240, 112388. [Google Scholar] [CrossRef]
  10. Adhikary, S.D.; Li, B.; Fujikake, K. Residual resistance of impact damaged reinforced concrete beams. Mag. Concr. Res. 2014, 67, 364–378. [Google Scholar] [CrossRef]
  11. Fujikake, K. Impact Performance of ultra-high performance fiber reinforced concrete beam and its analytical evaluation. Int. J. Prot. Struct. 2014, 5, 167–186. [Google Scholar] [CrossRef]
  12. Peng, T.; Chen, L.; Liu, T.; Demartino, C.; Xu, J. Static shear performance and residual axial capacity of rectangular RC bridge piers under near-ground lateral loads. J. Struct. Eng. 2021, 147, 04021219. [Google Scholar] [CrossRef]
  13. Tian, L.; Zhu, C. Damage evaluation and protection technique of RC columns under impulsive load. Eng. Mech. 2013, 30, 144–150. [Google Scholar] [CrossRef]
  14. Pei, C. Experimental Studies and Simulation Analysis on Dynamic Response and Residual Strength of H-Shaped Steel Member under Lateral Impact. Master’s Thesis, Taiyuan University of Technology, Taiyuan, China, 2013. (In Chinese). [Google Scholar]
  15. Tran, T.T.; Pham, T.M.; Huang, Z.; Chen, W.; Hao, H.; Elchalakani, M. Impact response of fibre reinforced geopolymer concrete beams with BFRP bars and stirrups. Eng. Struct. 2021, 231, 111785. [Google Scholar] [CrossRef]
  16. Hao, H.; Tran, T.T.; Li, H.; Pham, T.M.; Chen, W. On the Accuracy, Reliability and Controllability of Impact Tests of RC Beams. Int. J. Impact Eng. 2021, 157, 103979. [Google Scholar] [CrossRef]
  17. Tran, T.T.; Pham, T.M.; Huang, Z.; Chen, W.; Ngo, T.T.; Hao, H.; Elchalakani, M. Effect of fibre reinforcements on shear capacity of geopolymer concrete beams subjected to impact load. Int. J. Impact Eng. 2022, 159, 104056. [Google Scholar] [CrossRef]
  18. Demartino, C.; Wu, J.G.; Xiao, Y. Response of shear-deficient reinforced circular RC columns under lateral impact loading. Int. J. Impact Eng. 2017, 109, 196–213. [Google Scholar] [CrossRef]
  19. Xiao, Y. Development of structural testing equipment for impact and complex loading. J. Struct. Integr. Maint. 2021, 6, 1–15. [Google Scholar] [CrossRef]
  20. Cai, J.; Ye, J.-B.; Chen, Q.-J.; Liu, X.; Wang, Y. Dynamic behaviour of axially-loaded RC columns under horizontal impact loading. Eng. Struct. 2018, 168, 684–697. [Google Scholar] [CrossRef]
  21. Ye, J.-B.; Cai, J.; Chen, Q.-J.; Liu, X.; Tang, X.-L.; Zuo, Z.-L. Experimental investigation of slender RC columns under horizontal static and impact loads. Structures 2020, 24, 499–513. [Google Scholar] [CrossRef]
  22. Park, Y.J.; Ang, A.H.S.; Wen, Y.K. Seismic Damage Analysis of Reinforced Concrete Buildings. J. Struct. Eng. 1987, 111, 740–757. [Google Scholar] [CrossRef]
  23. Chen, L.; Jiang, H.; Lv, X. Modified Park-Ang damage model for reinforced concrete structures. J. Tongji Univ. (Nat. Sci.) 2010, 38, 1103–1107. (In Chinese) [Google Scholar]
  24. Kishi, N.; Mikami, H.; Matsuoka, K.; Ando, T. Impact behavior of shear-failure-type RC beams without shear rebar. Int. J. Impact Eng. 2002, 27, 955–968. [Google Scholar] [CrossRef]
  25. Ahmad, S.H.; Hino, S.; Chung, W.; Xie, Y. An experimental technique for obtaining controlled diagonal tension failure of shear critical reinforced concrete beams. Mater. Struct. 1995, 28, 8–15. [Google Scholar] [CrossRef]
  26. Adhikary, S.D.; Li, B.; Fujikake, K. Low velocity impact response of reinforced concrete beams: Experimental and numerical investigation. Int. J. Prot. Struct. 2015, 6, 81–111. [Google Scholar] [CrossRef]
Figure 1. Details of specimen and measurements. (a) Dimensions of the specimens; (b) Measurements.
Buildings 12 00669 g001
Figure 2. Static test set-up.
Buildings 12 00669 g002
Figure 3. Impact test set-up.
Buildings 12 00669 g003
Figure 4. Static test results. (a) Flexural failure mode; (b) Load–displacement curves.
Buildings 12 00669 g004
Figure 5. Process of cracking propagation. (a) DL120-1.8-0.8; (b) DL120-1.2-0.8.
Buildings 12 00669 g005
Figure 6. Load–displacement curves under static and impact loading.
Buildings 12 00669 g006
Figure 7. Load–displacement curves of residual capacity tests.
Buildings 12 00669 g007
Figure 8. Typical load–deflection curve of RC members [22].
Buildings 12 00669 g008
Table 1. Material properties of reinforcements.
ReinforcementΦ8Φ10Φ12Φ15
fy (MPa)408.8424.6470.4886.2
fu (MPa)541.1642.3685.71135.7
Note: fy and fu represent the tensile yield strength and ultimate strength of rebar, respectively.
Table 2. Details of the specimens and impact test results.
Specimenv0 (m/s)Fp (kN)td (s)umax (mm)ures (mm)Eab,d (kJ)Damage State
DL150-1.5-0.40.3298.8990.1427.8030.530.035
DL150-1.5-0.80.76744.4630.21140.127.510.307
DL150-1.5-1.21.19159.0030.23856.015.160.872
DL150-1.2-0.81.08363.9430.14943.16-0.638
DL150-1.8-0.80.89156.8780.21458.08-0.696
DL120-1.2-0.80.80237.1390.22154.370.170.364
DL120-1.5-0.80.79434.9780.22867.31.810.402
DL120-1.8-0.80.86950.4190.38577.25-0.645
DL180-1.5-0.40.50324.3250.09511.24-0.153
DL180-1.5-0.80.74336.0250.12420.10.650.335
DL180-1.5-1.21.29180.3090.12439.26-0.925
DL180-1.2-0.80.79130.1310.12215.84--
DL180-1.8-0.80.90771.9010.11427.641.290.708
Note: v0 is the measured impact velocity of test truck, Fp is the peak impact force, td is the impact duration time, umax and ures are the maximum and the residual displacement, respectively, Eab,d is the deformation energy at the maximum displacement. Damage state can be divided into two types: slight damage (○) and complete failure (●).
Table 3. Results of static tests.
Static Tested SpecimenFu (kN)uu (mm)Eab,s (kJ)
SL1209.92530.708
SL15015.0527.790.321
SL18028.525.230.406
Note: Fu is the static flexural strength; uu is the displacement at the ultimate strength; Eab,s is the absorbed energy in the static ultimate state, calculated by the surrounding area of the F-u curve and x-axis.
Table 4. Results of residual capacity test.
Specimenuu (mm)Fres,ex (kN)Fres,eq (kN)
SDL180-1.5-0.827.2425.65 (0.90)26.38 (0.93)
SDL180-1.8-0.830.9025.07 (0.88)25.10 (0.88)
SDL150-1.5-0.836.6113.25 (0.88)13.11 (0.87)
SDL150-1.8-0.830.9113.94 (0.93)11.78 (0.78)
SDL120-1.2-0.850.828.92 (0.96)8.93 (0.90)
SDL120-1.5-0.849.948.52 (0.86)8.73 (0.88)
Note: SDL represent static residual loaded specimen after dynamic test; Fres,ex and Fres,ep are the measured residual bearing capacity and the result calculated by Formula (5), respectively. The value in parentheses is the reduction factor of residual bearing capacity.
Table 5. Results of residual capacity tests in literature [10,26].
Specimenb × h (mm)Fu (kN)Fy (kN)uu (mm)h0 (m)umax (mm)Eab,d (J)Fres,ex (kN)Dres,eqFres,eq (kN)Fres,ex/ Fres,pPost-Impact Failure Mode
DR3.3-2.4150 × 250120.35108.82.760.153.8264.6116.740.13104.441.13Shear- compression Buildings 12 00669 i001
0.36.9529.278.230.2590.490.88 Buildings 12 00669 i002
0.612.71058.463.790.4763.701.04 Buildings 12 00669 i003
DR3.3-2.4-0.12150 × 250136.88130.497.310.36.4529.2146.460.08125.411.19Shear- compression Buildings 12 00669 i004
0.611.51058.4102.660.16115.500.91 Buildings 12 00669 i005
0.918.21587.6106.770.24103.681.08 Buildings 12 00669 i006
1.221.62116.8102.660.3095.811.14 Buildings 12 00669 i007
DR3.3-2.4-0.56150 × 250243.73233.2619.040.69.01058.4231.540.04233.450.97Flexure Buildings 12 00669 i008
0.913.41587.6212.040.06228.400.90 Buildings 12 00669 i009
1.215.72116.8194.980.19197.730.90 Buildings 12 00669 i010
1.619.22822.4182.800.23186.830.88 Buildings 12 00669 i011
SR3.8-0.8160 × 24073.2873.285.670.310.8529.281.340.0668.611.19Shear Buildings 12 00669 i012
0.620.21058.476.210.1363.951.19 Buildings 12 00669 i013
0.929.51587.658.630.1959.280.99 Buildings 12 00669 i014
DR3.8-0.8-0.11160 × 24080.2567.3527.780.618.61058.486.670.0774.541.19Flexure Buildings 12 00669 i015
0.934.51587.672.220.1270.471.07 Buildings 12 00669 i016
1.241.02116.841.730.3552.021.01 Buildings 12 00669 i017
DR3.8-0.8-0.15160 × 24091.8668.7527.090.619.61058.484.510.0785.001.02Flexure Buildings 12 00669 i018
0.928.81587.681.760.1181.691.05 Buildings 12 00669 i019
1.239.22116.874.410.1578.131.01 Buildings 12 00669 i020
SR5.7-1.6120 × 17052.1147.5122.570.320.0529.247.320.0847.870.96Flexure Buildings 12 00669 i021
0.4528.8793.835.360.2936.880.86 Buildings 12 00669 i022
0.637.11058.424.960.3832.410.66 Buildings 12 00669 i023
DR5.7-1.6-0.15120 × 17049.4345.9812.090.320.0529.243.500.1541.840.96Flexure Buildings 12 00669 i024
0.4530.0793.839.540.2338.050.92 Buildings 12 00669 i025
0.639.11058.430.650.3034.491.08 Buildings 12 00669 i026
DR5.7-1.6-0.2120 × 17048.9341.7819.410.319.1529.246.460.1044.251.00Flexure Buildings 12 00669 i027
0.4528.8793.841.570.1441.890.93 Buildings 12 00669 i028
0.637.91058.434.230.4626.630.96 Buildings 12 00669 i029
Mean 1.01
COV 0.11
Note: b and h are the width and height of RC beam section, respectively; h0 is impact height of drop hammer.
Publisher’s Note: MDPI stays neutral with regard to jurisdictional claims in published maps and institutional affiliations.

