Article

Effect of Foundation Geometry and Structural Properties of Buildings on Railway-Induced Vibration: An Experimental Modeling

by
Mehrad Mousavi-Rahimi
,
Jabbar Ali Zakeri
and
Morteza Esmaeili
*
Department of Railway Track & Structures Engineering, Faculty of Railway Engineering, Iran University of Science and Technology, Tehran 13114-16846, Iran
*
Author to whom correspondence should be addressed.
Buildings 2022, 12(5), 604; https://doi.org/10.3390/buildings12050604
Submission received: 8 April 2022 / Revised: 24 April 2022 / Accepted: 29 April 2022 / Published: 6 May 2022
(This article belongs to the Topic Advances in Dynamics of Building Structures)

Abstract

:
This paper considers the impact of foundation geometry on the vibrations transferred to a building in the vicinity of a railway line from the aspect of choosing an appropriate foundation type. For this purpose, a 1-g scale physical model is developed that includes the main parts containing dry sandy soil, a rigid soil container, and a five-story structure with three types of foundations, i.e., single, strip and mat. Next, the effects of the floor slab frequency associated with the local bending mode, the dominant soil frequency in vertical translation, and foundation geometry on the vibration level in the building are investigated. The experimental results obtained from the impulse loading exciting the frequency range of 0–156 Hz and scaled train axle load show that the vibration level transmitted to the floors in a structure with mat foundation is the smallest. Additionally, the strip and mat foundations reduced the root mean square ratio of vertical velocity on the first floor by, respectively, almost 8% and 53% in comparison with the single foundation, confirming the superior performance of the mat foundation. When the natural frequency of the slab bending mode approaches the dominant frequency of the ground’s vertical motion, resonance amplification becomes an inevitable phenomenon.

1. Introduction

With the urban population growing apace, the development of rail transportation systems has become of paramount importance to cope with traffic ramifications. Therefore, the construction of railways close to residential areas, hospitals, and other buildings that are sensitive to vibration is inevitable. To tackle the ensuing matters in such structures including noise and vibration, numerous researchers have probed the control methods of vibrations generated by railway vehicles.
In recent years, many researchers have become interested in applying different types of the finite element method (FEM) to study ground-borne vibration problems. Along with the application of FEM to vibration analysis, physical modeling has been used successfully in past decades [1]. Scaled physical modeling and experimental approaches are also suitable for dealing with complex problems. The advantages of practical approaches and experiments have been extensively documented in previous studies [2]. By contrast, physical modeling takes scaling into account, i.e., it maps the behavior from the laboratory scale to the full scale, to find out the response of structures in realistic conditions [1,3]. Attractive aspects of physical modeling include size reduction, simplicity, limited cost, and the possibility to study intricate systems and processes under controlled situations. This approach also paves the path for researchers to validate numerical and analytical findings based on the acquired empirical data [4].
Physical modeling is a common method in the investigation of ground-borne vibrations initiated from underground tunnels [5,6,7], the seismic damage characteristics of a subway structure under strong ground motions in saturated soft soil [8], the seismic response features of geogrid reinforced rigid retaining walls with saturated backfill sand [9], and the three-dimensional (3D) physical and numerical modeling of circular tunnels subjected to seismic excitations [10].
In addition to the widespread use of scale modeling to study the behavior of underground tunnels, physical and numerical models have broadly been applied in earthquake engineering to account for the soil–structure interaction (SSI) and the influence of foundation type on the vibrations in the structures [11]. The SSI effect on the seismic response of four systems was studied [12]. Two physical models comprised of fixed and flexible bases were utilized that underwent four scaled earthquake acceleration records [13]. Additionally, the influence of shallow foundations on the seismic response of a fifteen-story moment-resisting frame under earthquake excitations was inspected [14].
Certain analytical studies have addressed the impact of a series of important parameters such as Winkler–Pasternak constants, material properties, wave number, and thermomechanical loading, among others, on the wave propagation and behavior of functionally graded sandwich/anisotropic plates laid on an elastic foundation using the refined plate theory without the shear correction factor [15,16,17,18].
3D FEM has been employed to inspect the effect of isolation using foundations on train-induced vibrations in buildings [19]. Finite element (FE) analysis has also been implemented to investigate the influence of different parameters of concrete slabs and stabilized soil underneath the slab on vibration reduction [20]. The vibration characteristics of ballasted tracks with and without a ballast mat were analyzed using numerical simulations and field experiments [21]. François et al. [22] investigated a two-story building with three different foundation types (i.e., slab, strip and box) under traffic-induced vibrations considering the SSI. It was found that the response of the floors was dominated by local bending modes, and the effect of foundation type on the vertical structural response was relatively insignificant. Auersch [23] analytically computed the vertical transfer functions of the soil–structure system through resonance and compared the findings with field results. The building was taken as a lumped mass on the foundation, and the influence of soil type and foundation geometry on the vibration in different floors was neglected. Kuo et al. [24] used a hybrid model to evaluate the effect of structure and soil parameters on the level of vibration in the building. Their results indicated that the soil type had a more noticeable effect on the vibrations compared to the building geometry, whereas the foundation type had a small effect on the vibrations in different floors. Sanayei et al. [25,26] reported that increasing the thickness of the first floor in a multi-story building could reduce the ground-borne vibration attributed to the passage of trains. They examined a scaled-down building to test a previously developed analytical prediction model [27]. They also analyzed the vibration attenuation via a thick slab, indicating its applicability as an attenuator of external vibration sources. Colaço et al. [28] ran a series of in situ tests on the structure built next to a railway line to investigate the soil–structure interaction under ground-borne vibration and validated their developed 3D FEM model.
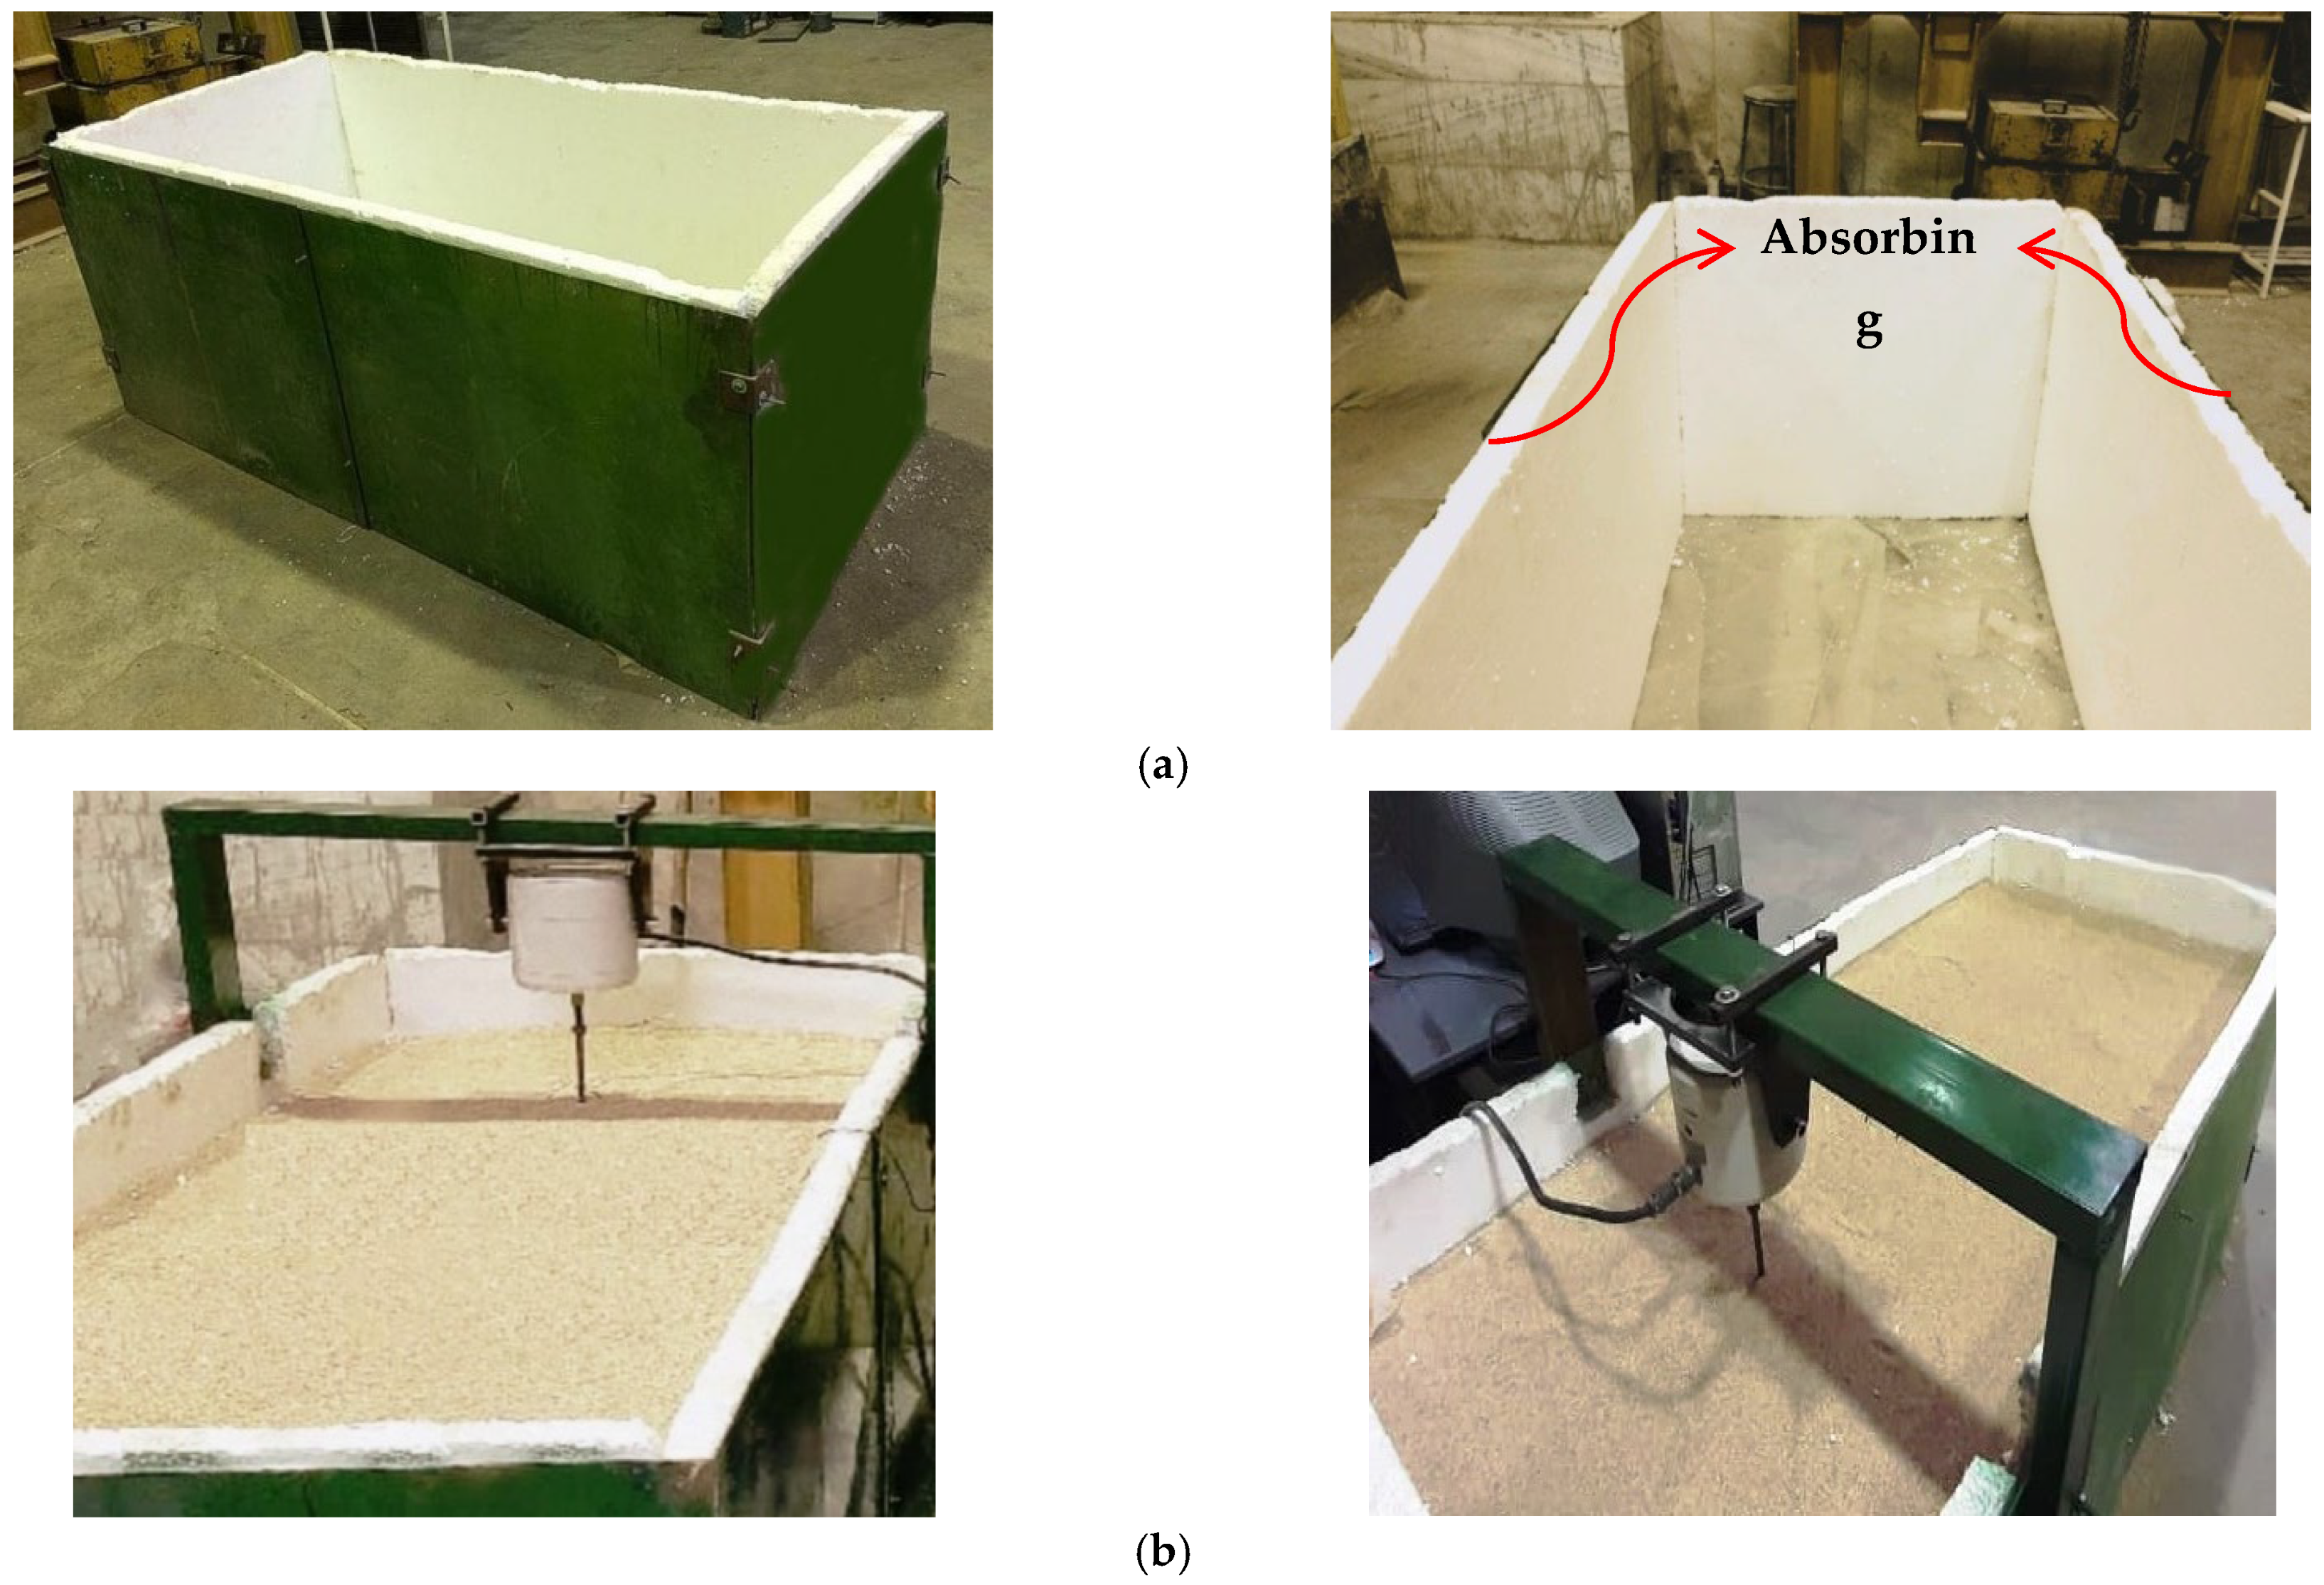
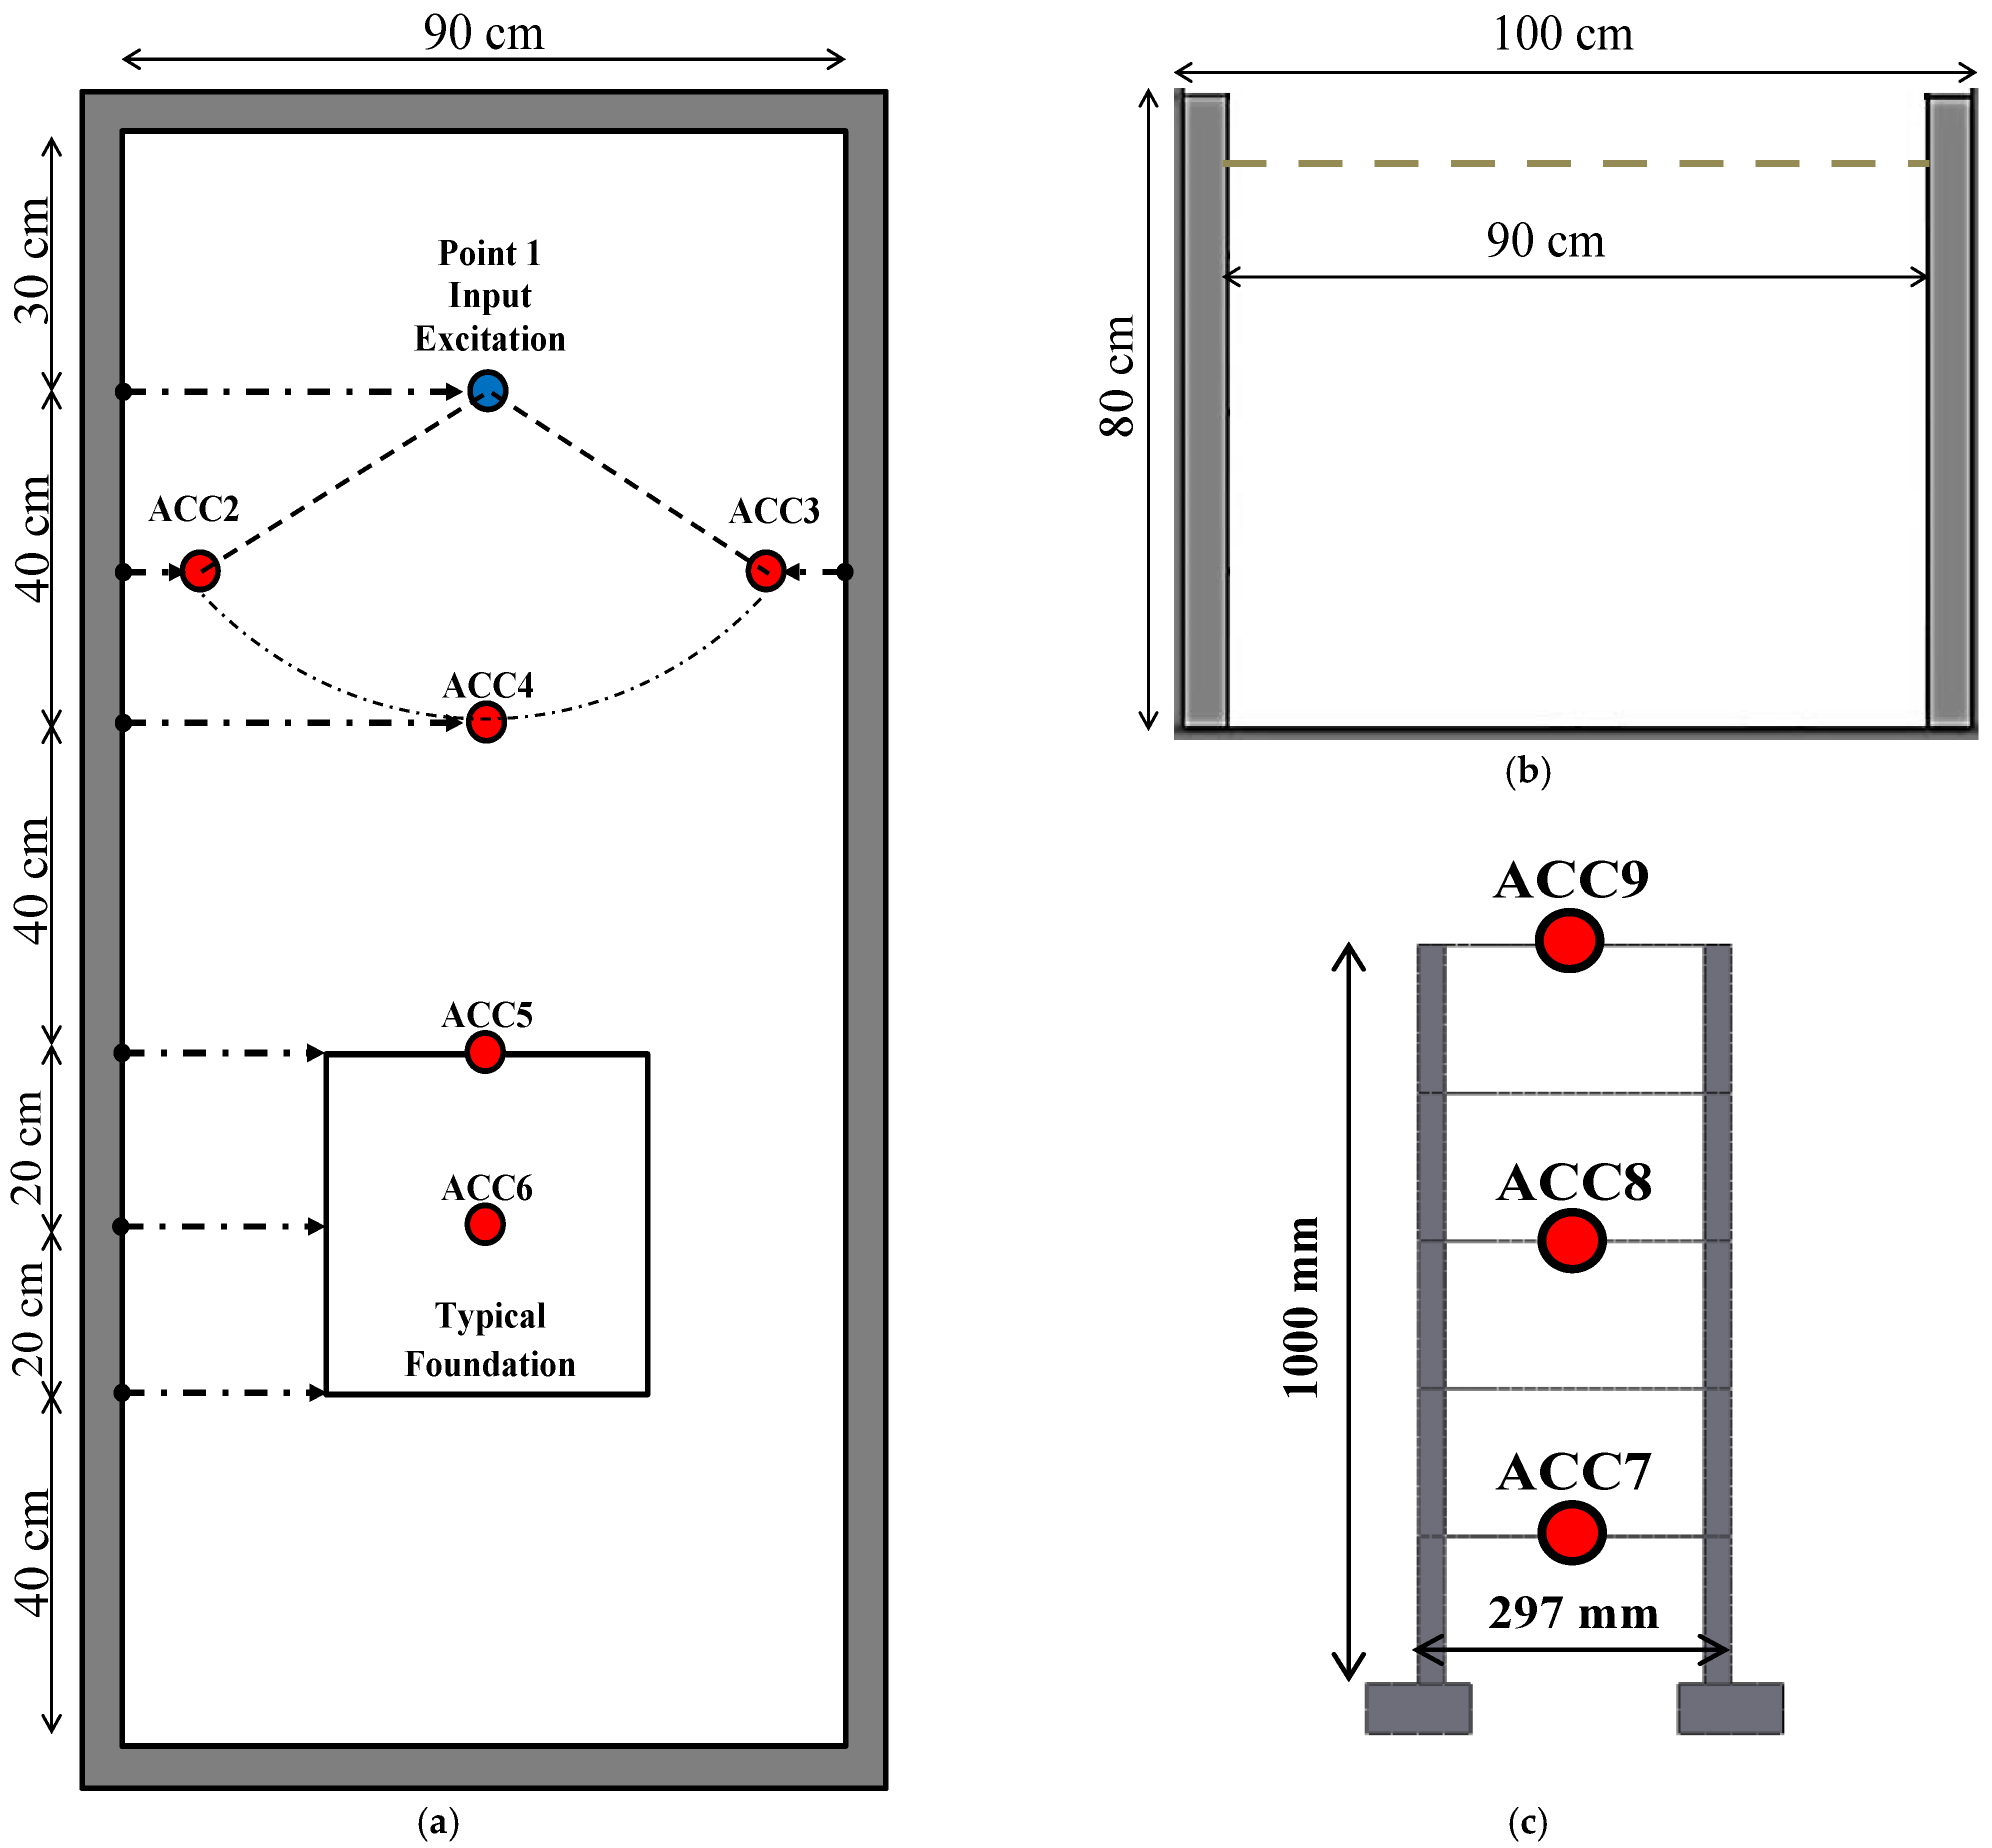
The technical literature review shows the lack of a small-scale soil–structure experimental study under controlled conditions focusing on the effect of foundation type on vertical vibrations in a building while taking all of the effective parameters into account. To fill this gap, this paper lays the groundwork for further realistic scaled-down modeling of structures subjected to train-induced vibrations. To this end, a framework is presented for small-scale modeling to estimate the impact of foundation geometry on the ground-borne vibrations in a building near a railway track. This procedure includes the following steps: (i) introducing the right scale relations and factors to model the prototype considering the wave propagation problem, (ii) choosing the proper granular soil and rigid container with energy-absorbing boundaries to simulate an infinite soil layer under free field conditions, (iii) scaling down the prototype and manufacturing the adequate steel model, and (iv) applying the input excitations to take into account the loading effects produced through the train passage and measuring the dynamic test data. To quantitatively evaluate and compare the vibration attenuation efficacy of these three different foundation types against the received vibrations in the soil and floors, an analysis in the frequency domain is performed and the vibration levels of the structure model with single, strip, and mat foundations are extracted from the test results.

2. Experimental Modeling

2.1. Prototype Structure Characteristics

The prototype selected for testing purposes is a conventional building system whose characteristics are shown in Table 1. The building is a typical five-story concrete moment-resisting frame. Its height and width are 15 and 6 m, respectively. The central lines of the columns are 5.5 m apart in two directions. The lateral dimension of the concrete slab of the floors is 6 m and its thickness is 0.15 m. The dimensions of the column cross-section are 0.5 × 0.5 m and the net center to center height is 3 m. The building is resting on single footings that are 2 m wide, 2 m long and 1 m thick, as shown in Figure 1. It should be noted, that the conventional buildings with ordinary floor dimensions have the first local bending mode frequency of the slab in the range of 8–16 Hz [24,28].
This real prototype structure was developed in the commercial FE package ABAQUS [29] to find out the slabs’ dynamic properties [30]. The FE model of the prototype structure was simulated as depicted in Table 2. The local bending mode frequency of the fifth slab in the prototype building was determined to be 10.07 Hz. Moreover, the fundamental frequency associated with the local bending mode of the slabs from the fifth to the first floor was obtained at the interval of 10.07–10.50 Hz [30,31].

2.2. Scaling Laws

Full-scale field experiments take advantage of realistic conditions. Nonetheless, scaled-down physical modeling as a cost-effective method simulates complex systems under controlled conditions and provides a real insight into the basic working mechanisms in such systems [13]. Designing the physical models depends on the similarity ratios of the prototype to the model from large to small scales and from 1-g to N-g [32]. To build up a scaled physical model, one should consider what follows. First, the design of the physical model depends on the purpose of the study and the features of the prototype. Second, the basic physical variables required in the similitude rule must be identified and confirmed [4]. The similitude rules concerning various physical and mechanical variables that were introduced by Buckingham’s π theorem in dimensional analysis theory were used to evaluate the characteristics of the vibration response of the soil and structure in a scaled model [9]. Regarding the linear elastic behavior of the materials due to the railway-induced excitations [33,34], a series of scaling factors are considered for the soil and structures.
To truly model the full-scale structure, all three conditions, i.e., geometric, kinematic, and dynamic similarities, must be maintained. Geometric similarity defines a model and prototype with comparable physical dimensions. Kinematics similarity refers to a model and prototype with similar particles at similar points at similar times, such that the model is dynamically akin to the prototype as long as the corresponding parts of the model and the prototype are subjected to the homologous net forces [35]. The scaled models meet the requirements of similarity to the prototype to varying degrees. Therefore, the researchers may categorize them as “true”, “adequate” or “distorted” models [36].
An adequate model—an appropriate approximation used in this research—scales the primary characteristics of the problem, with secondary influences being allowed to deviate, while the prediction equation is not significantly affected. 1-g scale modeling is applied where g represents the gravitational acceleration. Additionally, l p and l m represent the length in prototype and model scale, respectively. According to the Froude constant (Fr) of the π theorem that must be kept equal to unity, the Froude constant can be expressed by the shear wave velocity of soil, ν s . Hence, the geometric similitude ratio, λ l , of the test model could be obtained by Equation (1), whereas Equation (2) is known as the Cauchy condition [36].
F r = v 2 l . g = v s 2 l . g     v s 2 m l m . g = v s 2 p l p . g
λ l = l p l m = v s p 2 v s m 2
By defining the length, density, and acceleration as the fundamental physical and mechanical parameters of the soil and structure model, the testing is thus conducted in a 1-g environment that considers equal accelerations for the model and prototype. Furthermore, a model with the density similar to that of the prototype is desired. Accordingly, the scale relations can all be derived in terms of the geometric-scaling factor, λ l . Based on the size of the container and the structure, the length scale ratio (prototype to model) in this study was selected as λ l = 20 . The similitude ratios and relations of different geotechnical and structural parameters in the 1-g test are given in Table 3. The mentioned scaling relations have been utilized by several researchers heretofore [13,35].

2.2.1. Scaled Structure

In this experimental study, the adopted structural model simulates most of the structural properties related to the prototype building such as the frequency of local bending modes, number of stories, and mass. Consistent with the scale factor 20 (the ratio of the prototype to the true model) as mentioned in the previous section, the dimensions of the model are obtained through this geometric scaling; the height, length, and width of the structure’s physical model were determined to be 0.75, 0.30, and 0.30 m, respectively. According to Table 3, the scaling factor between the local bending mode frequency of the scaled model and that of the prototype is derived from:
f p f m = 1 λ l = 0.224
As stated earlier, the frequency of the fifth-floor slab of the prototype is f p = 10.07   Hz , and hence f m = 45   Hz . Furthermore, based on Table 3, the density of the model should be equal to that of the prototype and consequently, the mass of the prototype is M p . The true model mass M m is thus found from:
M p M m = ρ p ρ m . V p V m = λ l 3 M m = 18.125 kg
In accordance with the above discussion, the required characteristics of the true structural model are listed in Table 4.
Since it is not feasible to manufacture the scaled true model with dimensions and material properties shown in Table 4, after determining the specifications of the true model, to fit the required dynamic similarities including frequency and mass of the true and adequate model, a 3D numerical model was implemented in ABAQUS as explained above [29]. The scaled adequate model was made using steel, and the thickness of steel plates and the height of bar columns in the adequate model were determined in the design process after several cycles of trial and error to match the required bending mode frequency and mass. The adequate model consists of five steel plates as floors and four vertical steel bars as columns. ST37 steel plates were implemented according to DIN17100, EN10025-2 (Structural Steel), with a minimum yield stress of 240 MPa and minimum tensile strength of 360 MPa. In addition, steel bars were grade A1 230—380 MPa. If the employed materials are both isotropic and elastic, then the bending stiffness of the slabs and columns are the main parameters affecting the local bending mode frequency of floors as explained by [20,37]. Since the wave propagation caused by railways yields small strains, the material behavior in the current study was assumed to be linearly elastic [33,34].
D s = E t 3 12 1 ν 2
D c = 12 E I L 3
where D s and   t are, respectively, the plate bending stiffness and thickness. Additionally, D c ,   I , and   L are the column bending stiffness, moment of inertia, and length, respectively. The columns and floors are joined by welds. It is known that the foundation type does not affect the slab bending mode frequency [30]. After the numerical modeling and design iterations, the adequate structural model was constructed in the laboratory, as summed up in Table 5 and shown in Figure 2.

2.2.2. Foundation Properties

To build steel foundations in the laboratory and investigate the effect of foundation geometry on the received vertical vibrations and the level of transferred vibrations to the floors, three different foundations, namely single, strip, and mat foundations, were devised as presented in Table 6. An effort was made to keep the weight of all three foundation types nearly constant (see Figure 3 for a schematic representation of the foundations). The key reason for the observed unequal weight is the flame-cutting error when manufacturing the plates and the small changes in the thickness.

2.3. Soil Properties

Several studies in the field of soil vibrations induced by railway excitation were based on the simulation of an idealized infinite soil stratum spreading on the bedrock [38]. The material used in geotechnical physical modeling should be repeatable, operator-independent, and result in an allowable deviation from soil conditions [39]. In order to study the soil behavior, the unit weight, as well as the elastic and strength parameters, should be considered.
The coarse-grained material (i.e., sand) is widely used to simulate the soil because of its limited number of parameters [40]. The behavior of sand depends principally on the friction angle and density. The scale factor for the friction angle is equal to unity, which facilitates the physical model construction. The sand provides the main privilege of an identical friction angle for the prototype and scaled model. For this reason, different types of sands are generally used to simulate the soil [4,41]. In this test, poorly graded sand (SP) of Firoozkooh with a particle size of 0.4–1 mm and the relative density Dr = 70% was used for empirical studies. Firoozkooh sand is a well-documented sand type in Iran. The specifications are presented in Table 7 based on previously conducted static tests [42,43].

2.4. Chamber Specifications

Most studies use rectangular rigid containers —as the simplest case with no moving parts—to closely imitate the 3D wave propagation resulting from ground-borne vibrations. In such dynamic tests, an unwanted reflection of waves from the container boundaries is of notable importance. Various researchers have used energy-absorbing materials to reduce the effects of reflected waves from the container boundaries. In some studies, as an energy-absorbing material, duxseal (with a thickness of 30 mm) has been mounted on the bottom and sidewalls of the container to absorb the reflected waves [5,6,7]. Several researchers utilized absorbing material including commercially available conventional foams to minimize the generation and reflection of body waves from rigid walls [38,44]. Additionally, thick layers of polystyrene minimize the reflection of outward propagating waves back into the model. In many studies, 25 mm thick absorbing layers of polystyrene foam sheets were installed on the last walls of the soil container to simulate viscous boundaries in the free field conditions, henceforth named FF [13,36].
In the present study, a physical model was constructed around a rigid steel container. Its width, length and height were 2, 1, and 0.8 m, respectively [43]. To reduce the reflected surface waves from boundaries, soft materials consisting of conventional foams with proper dimensions and a thickness of 50 mm were installed on the sidewalls of the container, as seen in Figure 4.

2.5. Model Construction

As specified above, a box with the dimensions 2 × 1 × 0.8 m was used for the construction of the test model. Assuming bedrock at the depth of 14 m, the test box was filled to a height of 70 cm. The dry sand was poured into layers of 10 cm thickness, and each layer was compacted by a laboratory roller and vibrator. During the compaction of each layer, the dry density was measured continuously to ensure a relative density of 70%. Figure 5 illustrates the scaled structure with various foundations on the soil [43].

2.6. Model Instrumentation

As observed in Figure 6, an array of uniaxial accelerometers was installed at respective points of the model to measure the dynamic response of the soil and structure. To evaluate the efficacy of absorbing foams, three accelerometers, ACC2, ACC3, and ACC4, were placed on the soil surface at constant distances of 40 cm from the input load point on the perimeter of a circle. Furthermore, ACC5 and ACC6 were situated at regular intervals from the load point and in the midline of the soil container (at the same distances from the sidewalls). Finally, ACC7, ACC8, and ACC9 were located at the midpoint of the floor slabs. An electromagnetic shaker was utilized to induce dynamic vibrations, as seen in to Figure 4 and Figure 5. The complete collection of the setup instruments is provided in Figure 7 including the computer, data logger, amplifier, and shaker. The data acquisition system was ECON AVANT MI-7016 [45], and the sensors specifications are summarized in Table 8.
The shaker was fixed on top of the soil container by a steel frame made of welded box profiles, as seen in Figure 4. To guarantee accurate measurements, the sampling frequency was taken as 2560 Hz, which is at least 16 times the maximum frequency component of the measured signal. Since aliasing errors should be eliminated, all measured signals were filtered by a low-pass digital eighth-order filter in MATLAB that removed higher-frequency components in the range of 0–156 Hz (model scale). A modal hammer was used to apply an impulse input to ensure the accuracy of results in some tests, as depicted in Figure 8.

2.7. Input Excitations

The considered input for the model should take the loading effects produced by the train passage into account. According to previous studies, train-induced vibrations generally occur along the vertical direction. For heavy-haul trains yielding the largest vibration amplitudes in surrounding buildings, the frequency has been reported to go up to 35 Hz [46]. If the effect of railway-induced vibrations on residents’ comfort or structural integrity is of interest, the frequencies up to 80 Hz are important with particular attention in the range between 5 and 20 Hz. Higher frequencies are diminished by the soil [34]. Moreover, given the maximum axle load of passing trains in field surveys between 100 and 150 kN [30] and considering the scale relations in Table 3, the magnitude of forces applied on the experimental model was scaled to 15–30 N, as seen in Figure 9.
For implementing both frequency and time domain analyses, two types of input vibrations were applied to the scaled model. The first type was impulse loading, which produces the entire frequency range up to 156 Hz, as illustrated in Figure 9. This input was adopted to determine the resonance frequency and elastic response of the soil and structure. The second vibration input was a sinusoidal sweep load used to obtain the frequency response function of the model. Given the natural frequencies related to the soil’s vertical motion and the floor slab bending mode (frequency around 45–50 Hz), the frequency of the sweep load was limited to 100 Hz, as seen in Table 9.

3. Results and Discussion

3.1. Free Field Response

First, the dominant frequency concerning the soil’s vertical motion in the FF, i.e., in the absence of a structure, should be determined. To meet this criterion, the type A1 impulse load that excites the entire considered frequency range was applied to the soil using the shaker. Figure 10a displays the time history of the output acceleration in ACC4, and Figure 10b shows the soil frequency response in the frequency band 5–156 Hz. The frequency content of the FF response was dominated by a first peak around 49 Hz, which is related to the vertical translation of soil. In addition, a closer inspection of this figure indicates the dominating frequencies of the higher modes of the soil’s vertical motion: 62, 65, 68, 74, and 81 Hz. Each experiment was performed three times in sequence to avoid any possible errors.

3.2. Performance of Absorbing Boundary

As indicated in Section 2.6, the performance of the absorbing boundaries can be evaluated by placing ACC2, ACC3, and ACC4 at the same distance of 40 cm on a circular perimeter with the center being the load point. According to Figure 11, no matter where the location of the accelerometers was, the foams performed efficiently as absorbing boundaries since the Fourier amplitude did not change in the three positions. One concludes that the waves reflected from the end walls did not affect the FF response, which is in good agreement with previously conducted research [44].

3.3. Structural Response

This section evaluates the fundamental frequencies concerning the bending mode of the floor slab in the scaled model. Initially, to confirm what is described in Section 2.2.1, load type A1 was applied to the soil in the presence of the structure on the mat foundation, and the outputs of ACC7 to ACC9 were acquired. Additionally, the frequency response of the first, third, and fifth slabs was calculated, as seen in Figure 12. The response of the floors is dominated by first local bending modes [22].
Resonance frequencies of the slabs were found from the peaks in the frequency domain. The experimental assessment focused on the mode shapes and natural frequencies of the structure associated with the bending mode of slabs [28]. The resonance points in the frequency content of the first-, third- and fifth-floor responses signified the frequencies 48, 47 and 45 Hz in descending order. The peaks on the diagram imply the natural frequency of the slabs corresponding to the slab local bending mode. The amplitude of the resonance frequency of the first floor had the highest value. The reason is that the natural frequency of the slab was close to the dominant frequency associated with the vibration mode of the soil’s vertical motion. Moreover, at a frequency of 49 Hz, a peak with a smaller amplitude could be seen on the green line related to the first floor, which is the peak associated with the soil.
The sinusoidal load types B1 to B12 as presented in Table 9 were applied using the shaker at a distance of 100 cm from the center of the experimental scaled structure with a mat foundation while ACC7, ACC8 and ACC9 measured the acceleration data of the first, third and fifth floors, respectively. Next, each time history was divided by its absolute maximum value to become normalized in terms of amplitude. These normal accelerations were added in accordance with the superposition principle, shown in Figure 13. Finally, the frequency response was acquired which is shown in Figure 14. For a detailed view, 4 s of the acceleration time history are presented in Figure 13; however, the test data have been recorded for up to 6 s.
Figure 13a–c display the time history of normal accelerations. In Figure 14a–c, the peak of the frequency response diagram is detectable around 45 and 47.5 Hz at the fifth, third and first slabs, respectively, confirming the occurrence of the resonance at the frequency associated with the bending mode of slabs. Due to the closeness of the natural frequency of the first and third slabs to the frequency of the harmonic input at 47.5 Hz, these two frequencies are indiscernible. On the other hand, while the dominating frequencies of the vertical ground motion approach the local bending mode frequency of slabs, the Fourier amplitude increases at these resonance frequencies rationally.

3.4. Effect of Foundation Geometry

According to previous studies, to examine the effect of foundation geometry on the received vibrations in the developed scaled structure, the impact of vibrations caused by the input type A1 on the first-floor slab should be studied. As the human body responds to the average amplitude of a signal, the root-mean-square (RMS) of the signal is used to inspect the vibration levels. The RMS value was used as a measure of the vibration magnitude for evaluation and comparison purposes [47]. To this end, as suggested by FTA regulations, the RMS for the velocity term was used to study the vertical vibrations [48].
As mentioned above, three different foundations were considered. The weight of these foundations was almost kept constant throughout the tests. The values in column (4) of Table 10 indicate that the wave transmission factor (TRF)—obtained via dividing column (2) by column (3) in Table 10—in the structure with a mat foundation had the minimum value. This illustrates the proper performance of the mat foundation in comparison with other types, as depicted in Figure 15d and Figure 16. Furthermore, the values of column (5) imply that the RMS Ratio (RR)—column (2) divided by the array of column (2), row (2) in Table 10—was also significantly reduced in the structure with a mat foundation. It was the corollary of the uniform performance of this foundation type according to Figure 16. The values of column (4) exceed unity due to the approaching natural frequency of the slab local bending mode to the dominant frequency associated with the vertical translation mode of soil. This issue has culminated in the appearance of resonance and, consequently, the growth of TRF.
The values in column 5 clearly indicate the improved performance of the mat foundation in terms of RR. A satisfactory agreement was achieved with a prior study that has concluded that using a mat foundation reduces a building’s response to vertical vibrations remarkably [46]. The RR in the structure with strip and mat foundations decreased by about 8% and 53%, respectively, compared with the single footing. These values show a significant reduction due to the structural integrity in vertical vibrations and are in good agreement with other works [30,46]. This is partly in contrast to ref. [24] that concluded that the effect of the foundation geometry on the vertical structural response was relatively insignificant. The effect of foundation geometry on the level of vibrations in the structure seems to be also dependent on the soil type, which has somewhat been neglected in preceding studies.

4. Conclusions

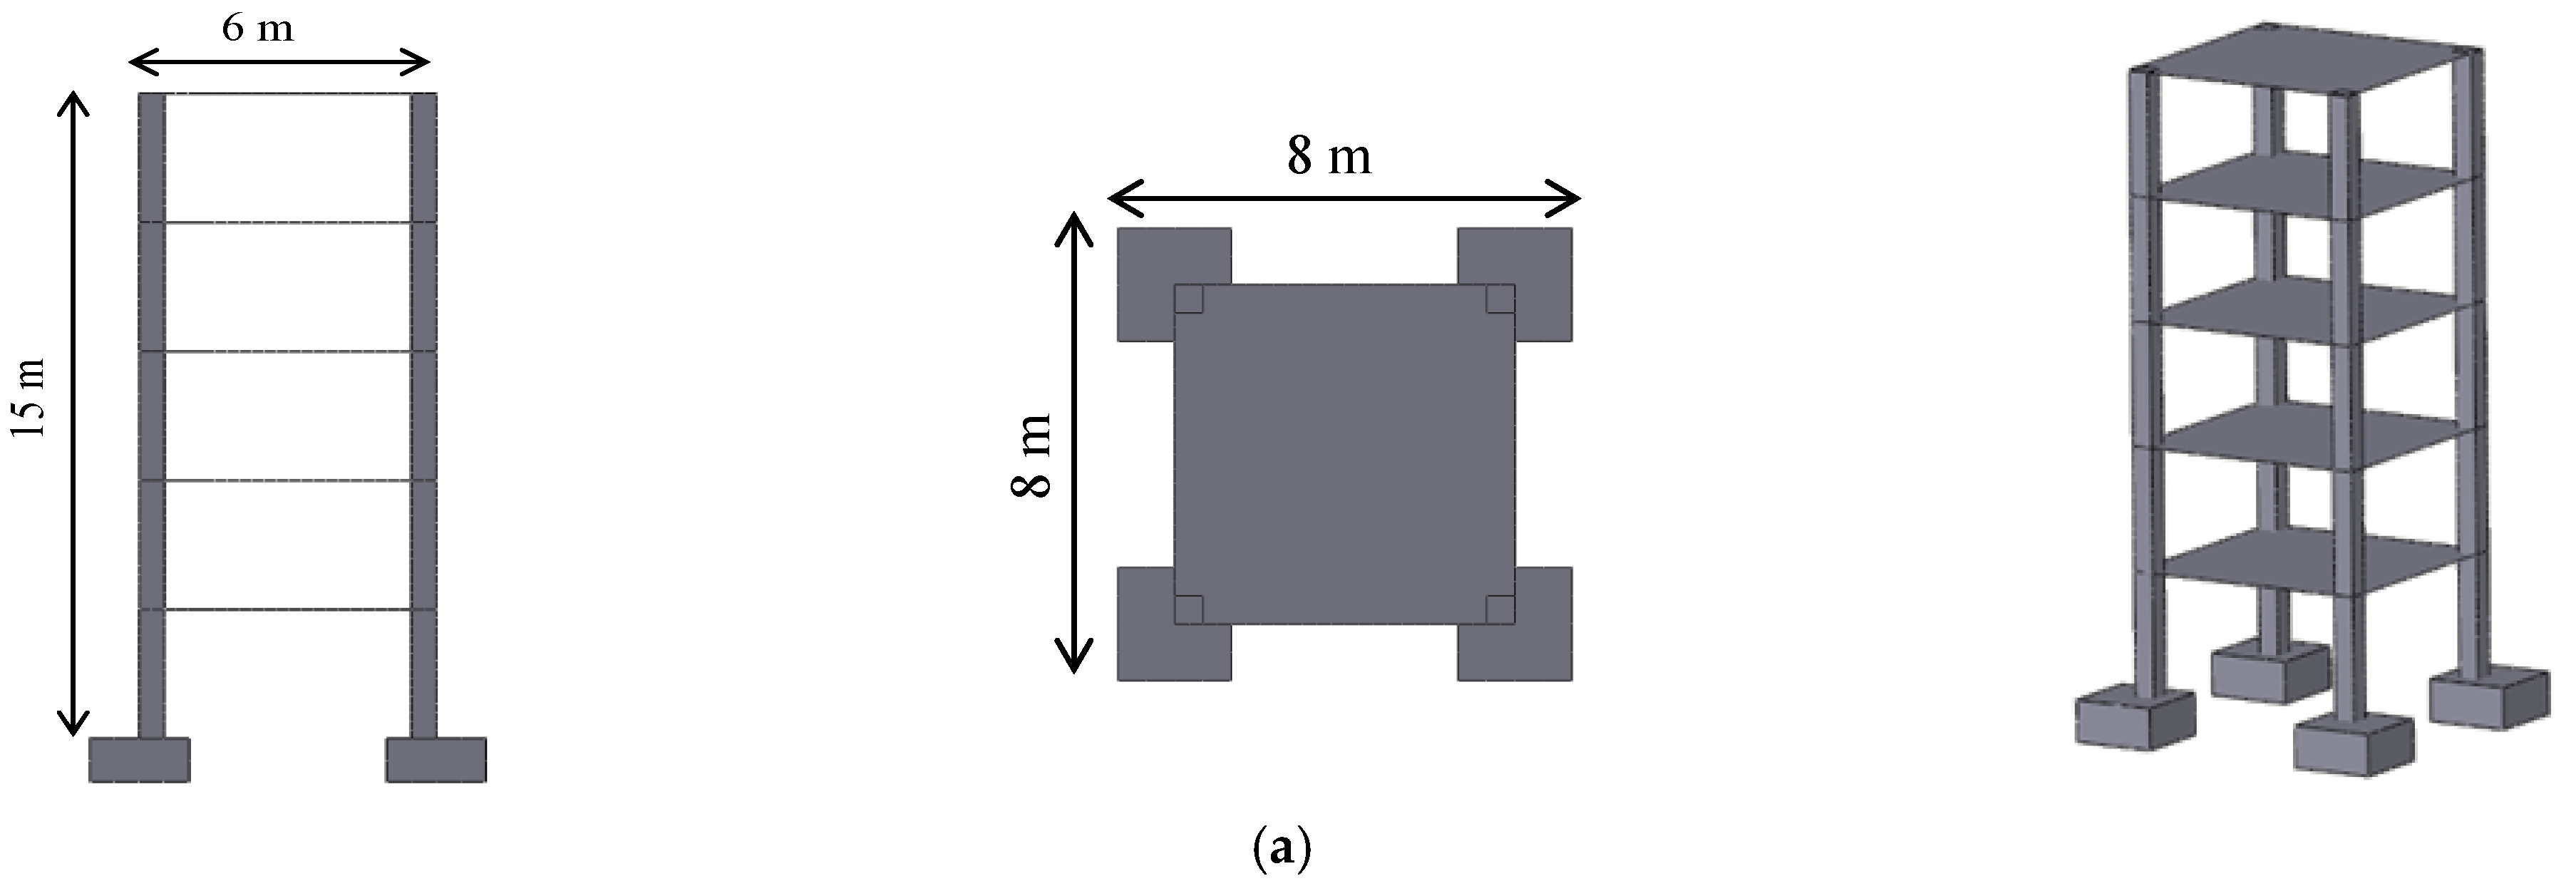
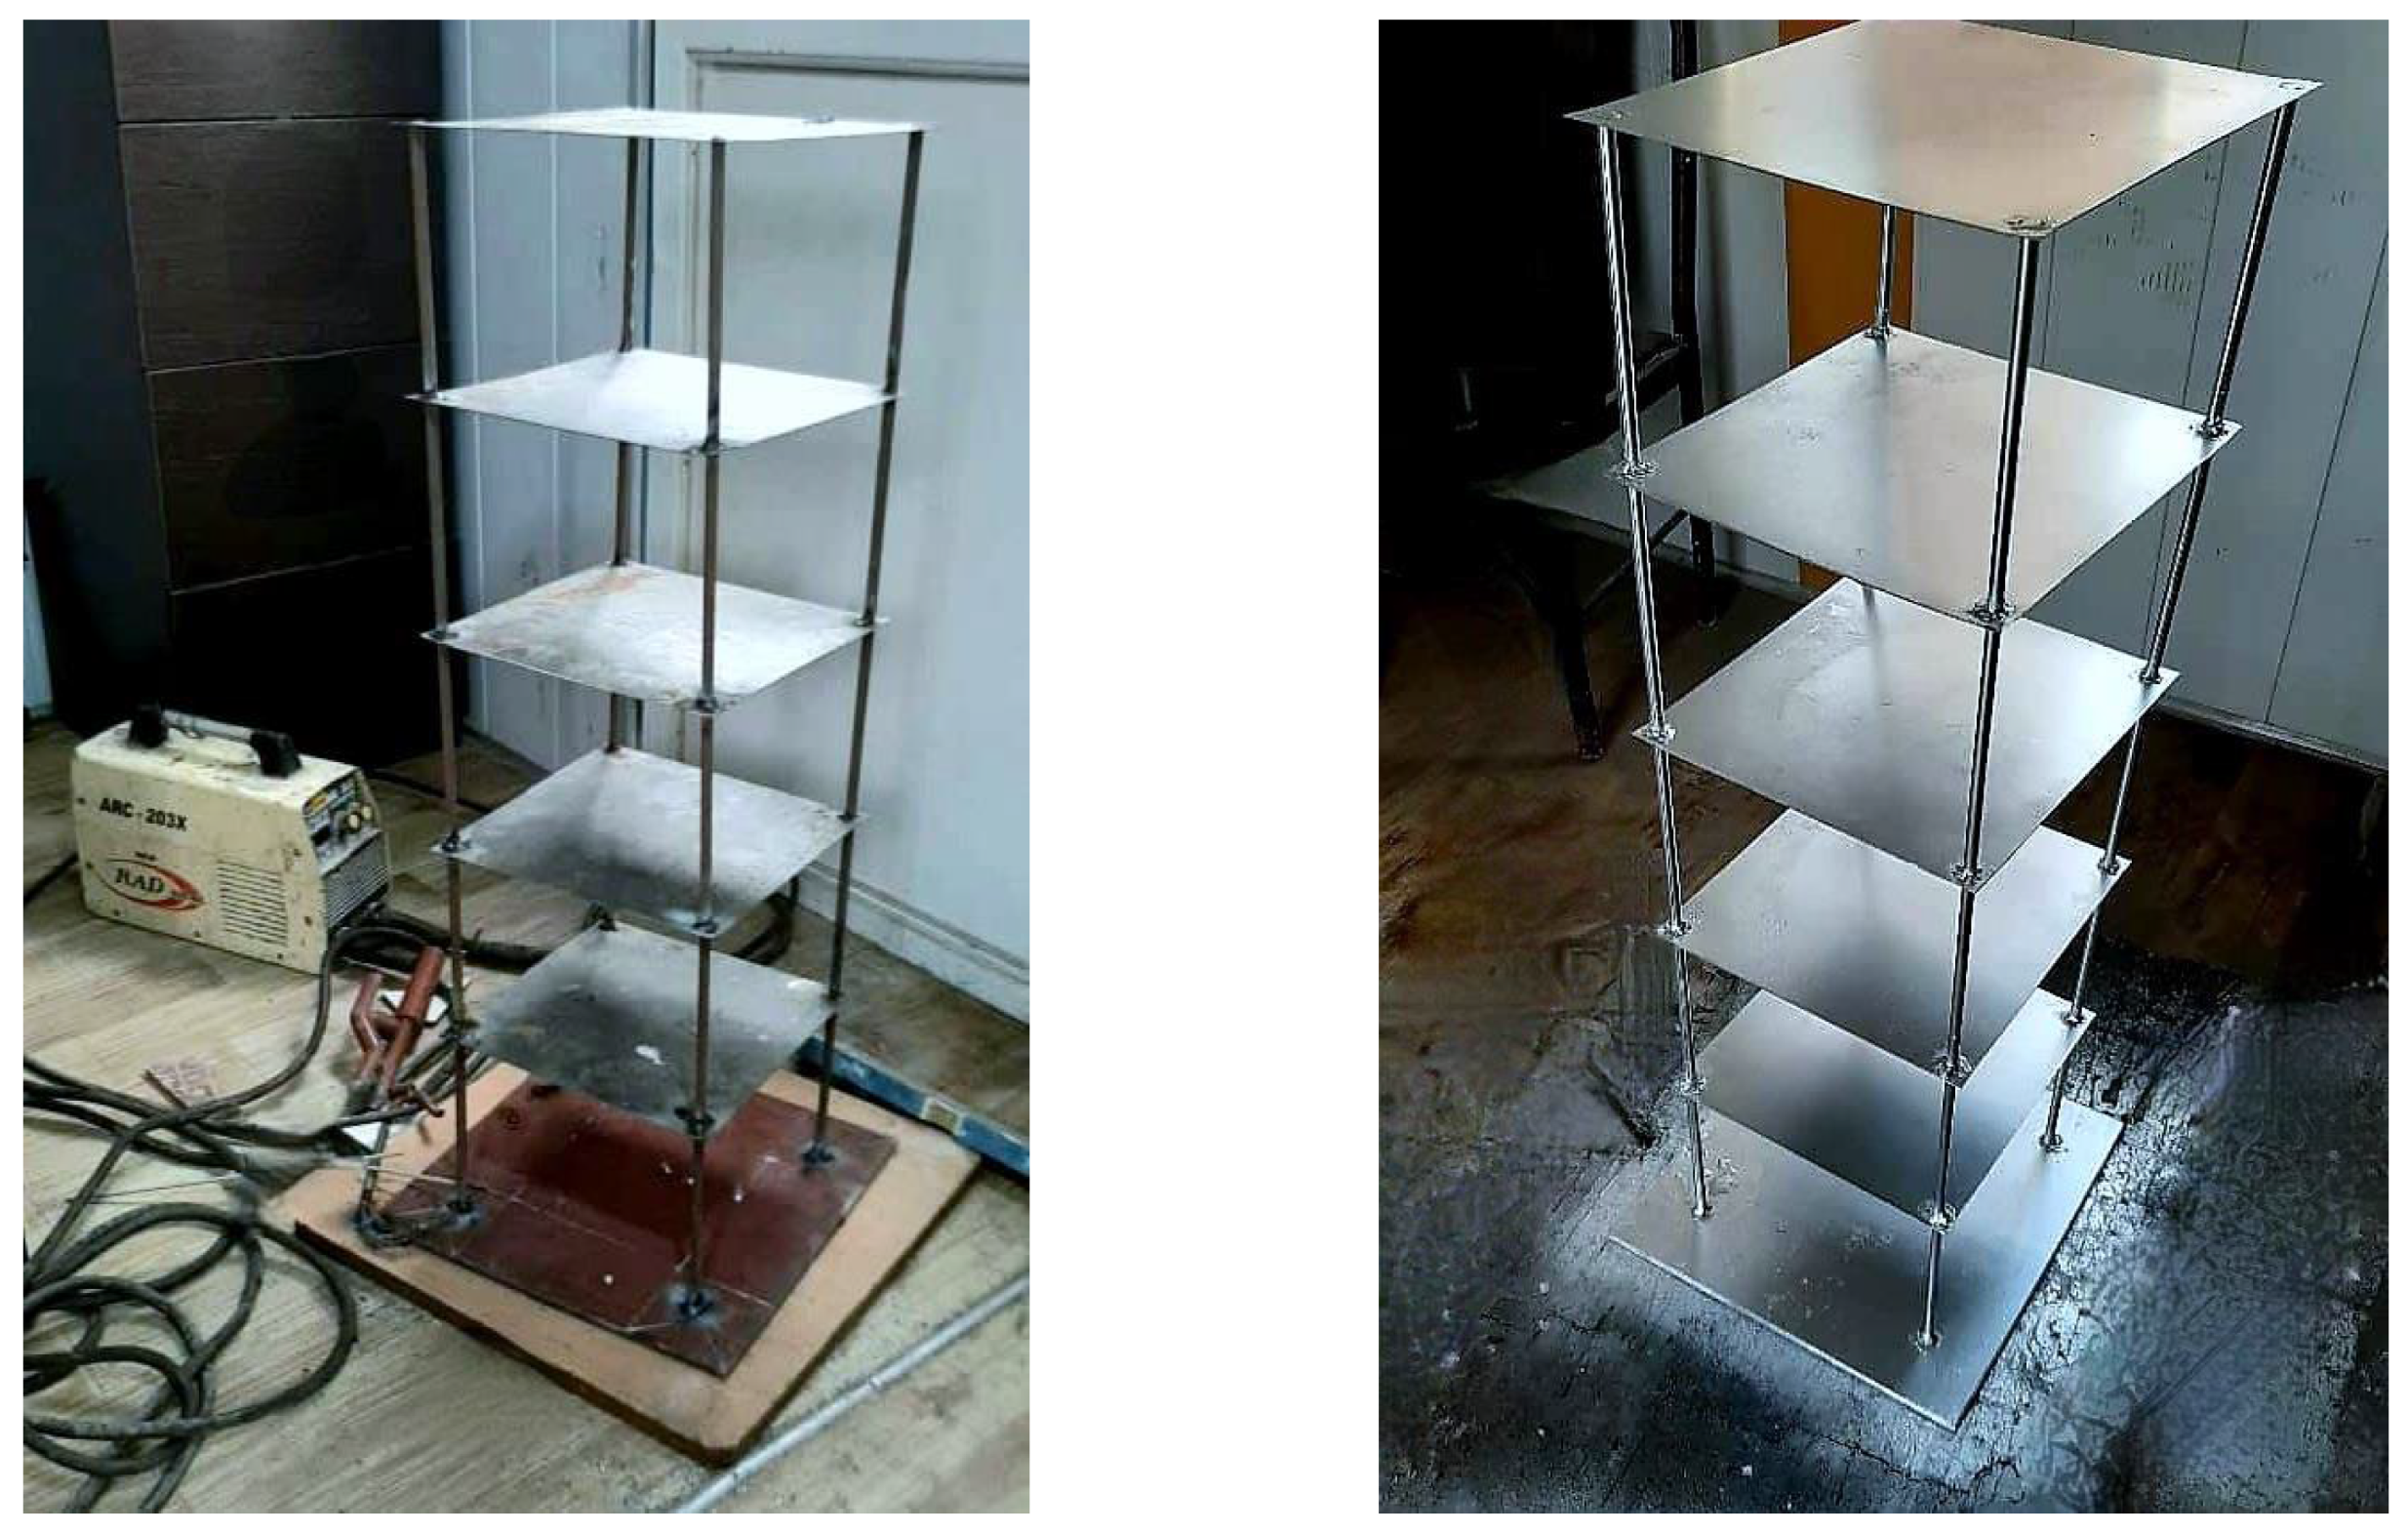
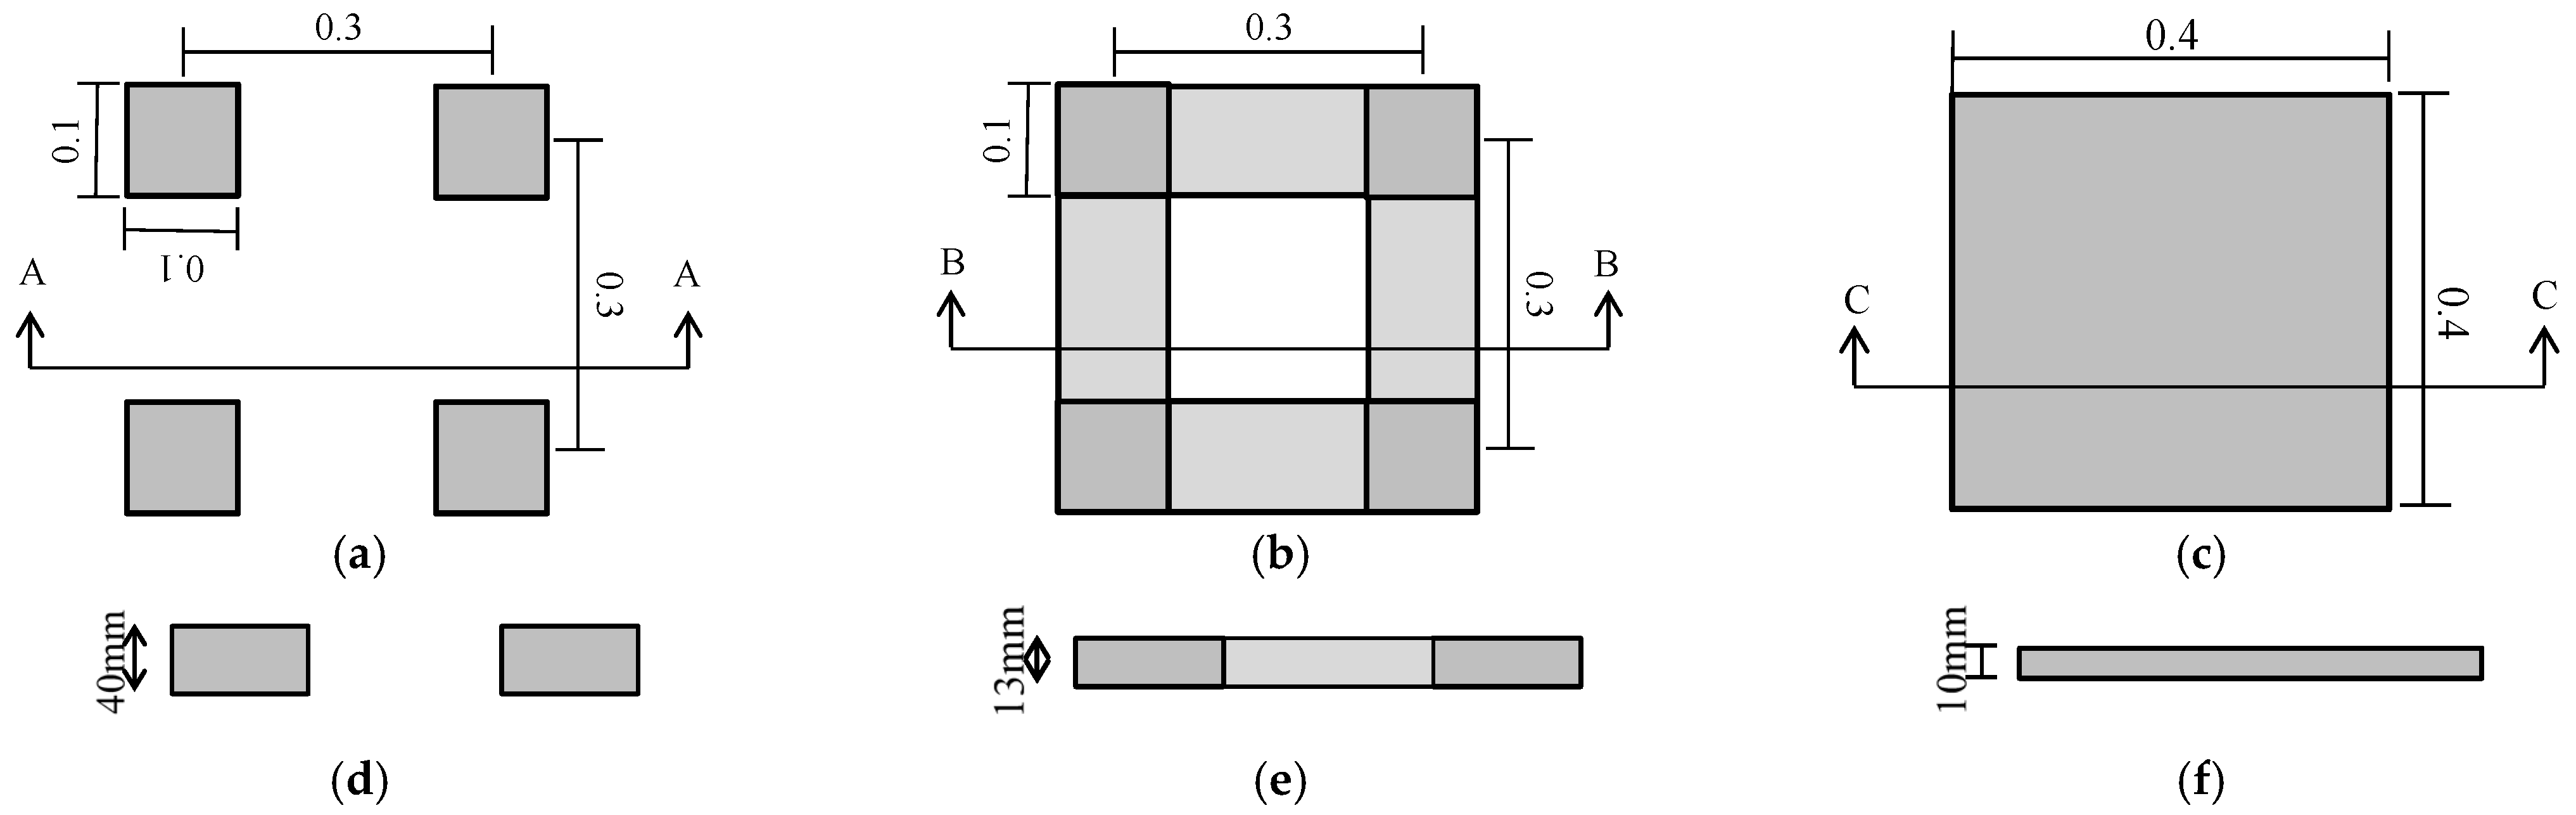
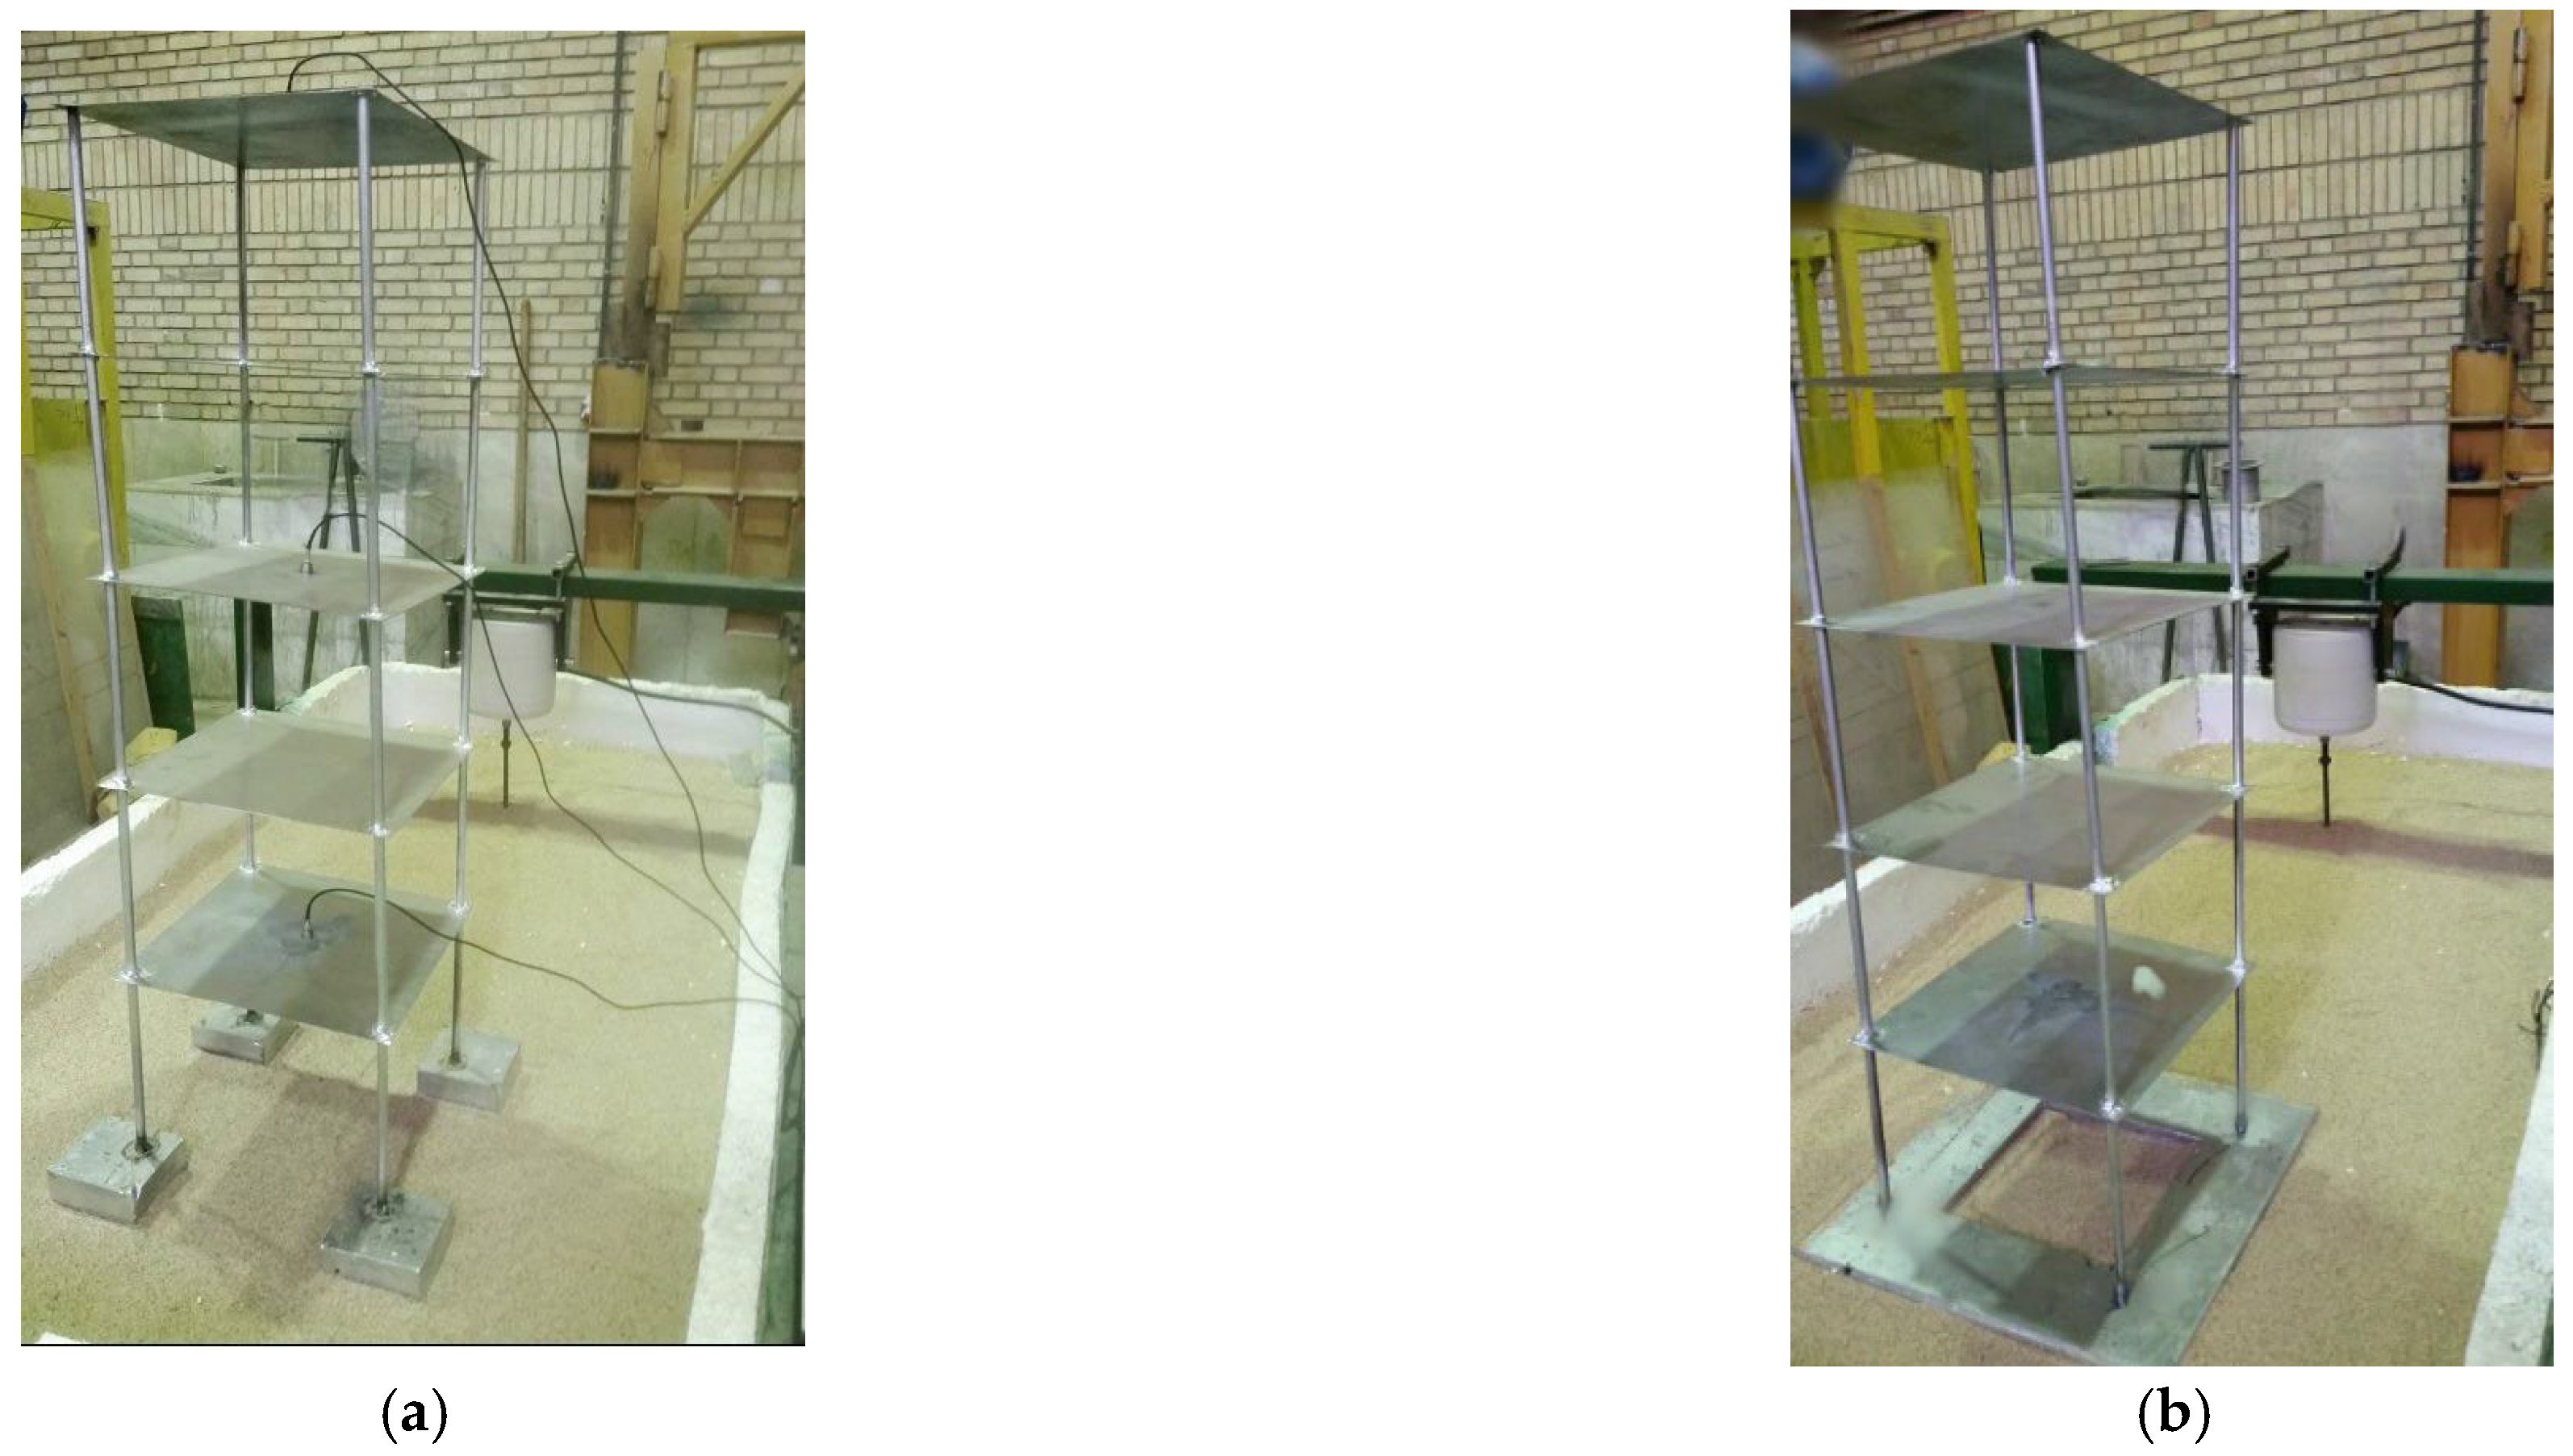
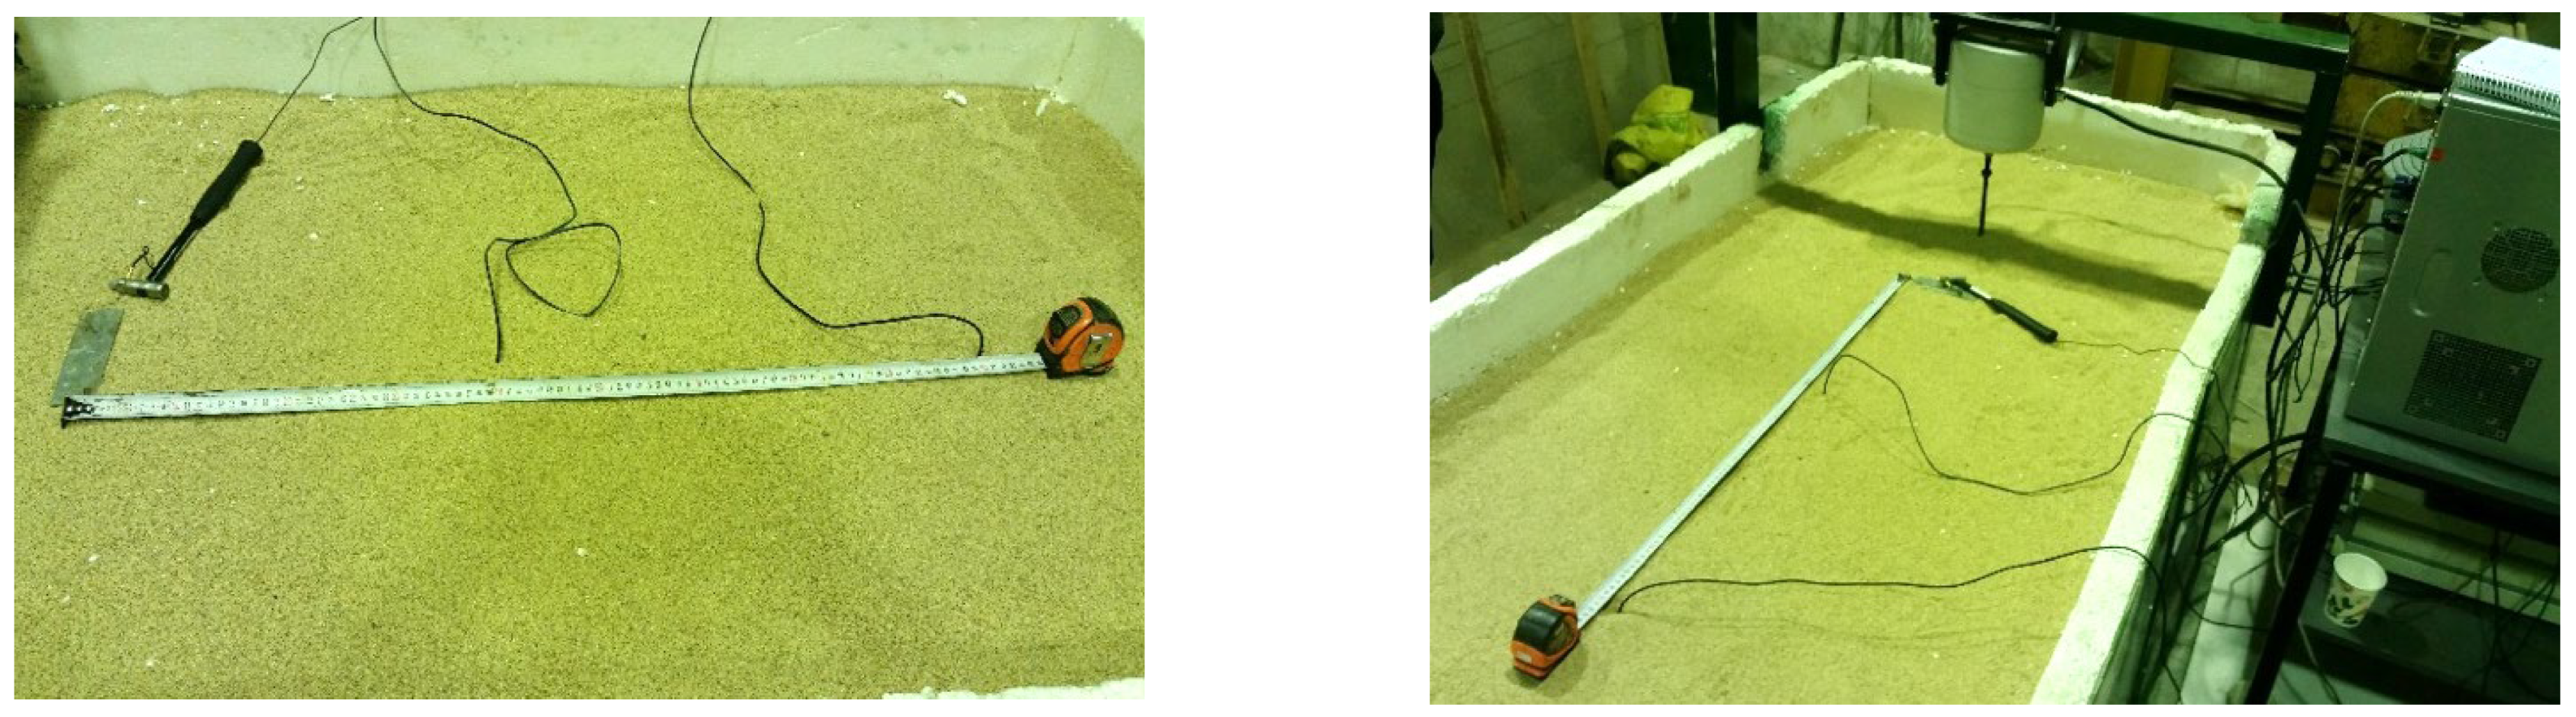
The present study exhibited an organized approach for the scaled modeling of a typical five-story concrete moment-resisting frame subjected to train-induced vibration. To this aim, 1-g scale modeling, where g is gravitational acceleration, was implemented and the geometric-scaling factor, λ l (prototype to model) was considered to be 20. To form the test model, a rigid container was meticulously manufactured from steel plates and the conventional foams were placed on the side walls as energy-absorbing boundaries. Dry sand was poured in layers and compacted by a laboratory roller to achieve a relative density of Dr = 70%. Consistent with the simulation factor λ l = 20 , the scaled structure was made using five steel plates as floors and four vertical steel bars as columns with welded connections. Three foundation types, namely single, strip and mat, were utilized in the steel experimental model, seeking the effect of foundation geometry on the ground-borne vibration in the building. The weight of all three foundations was kept almost constant.
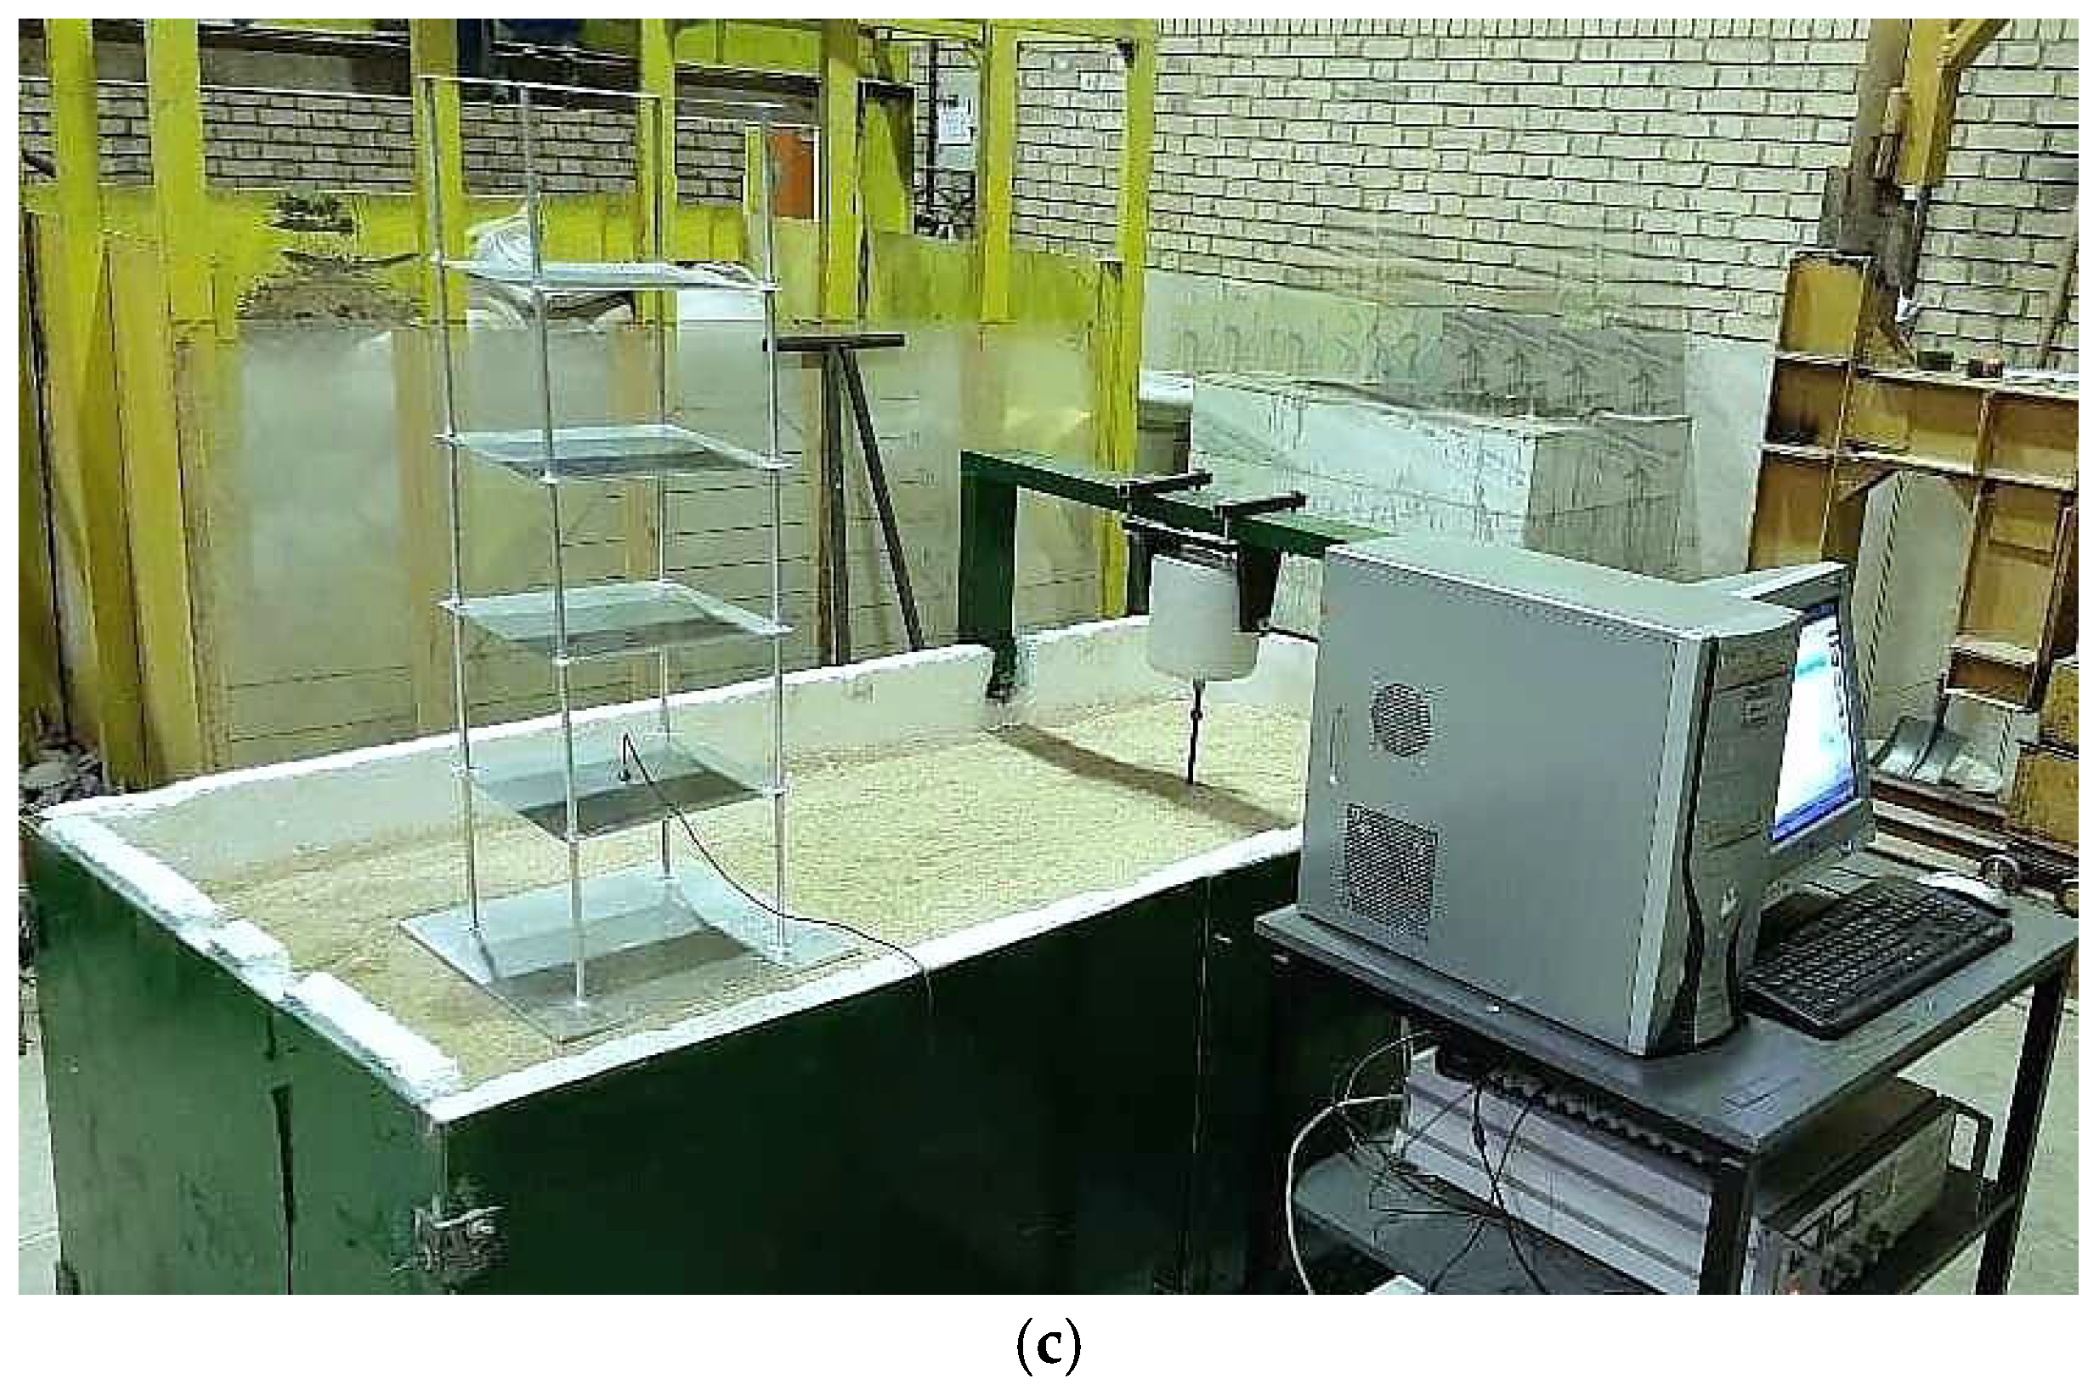
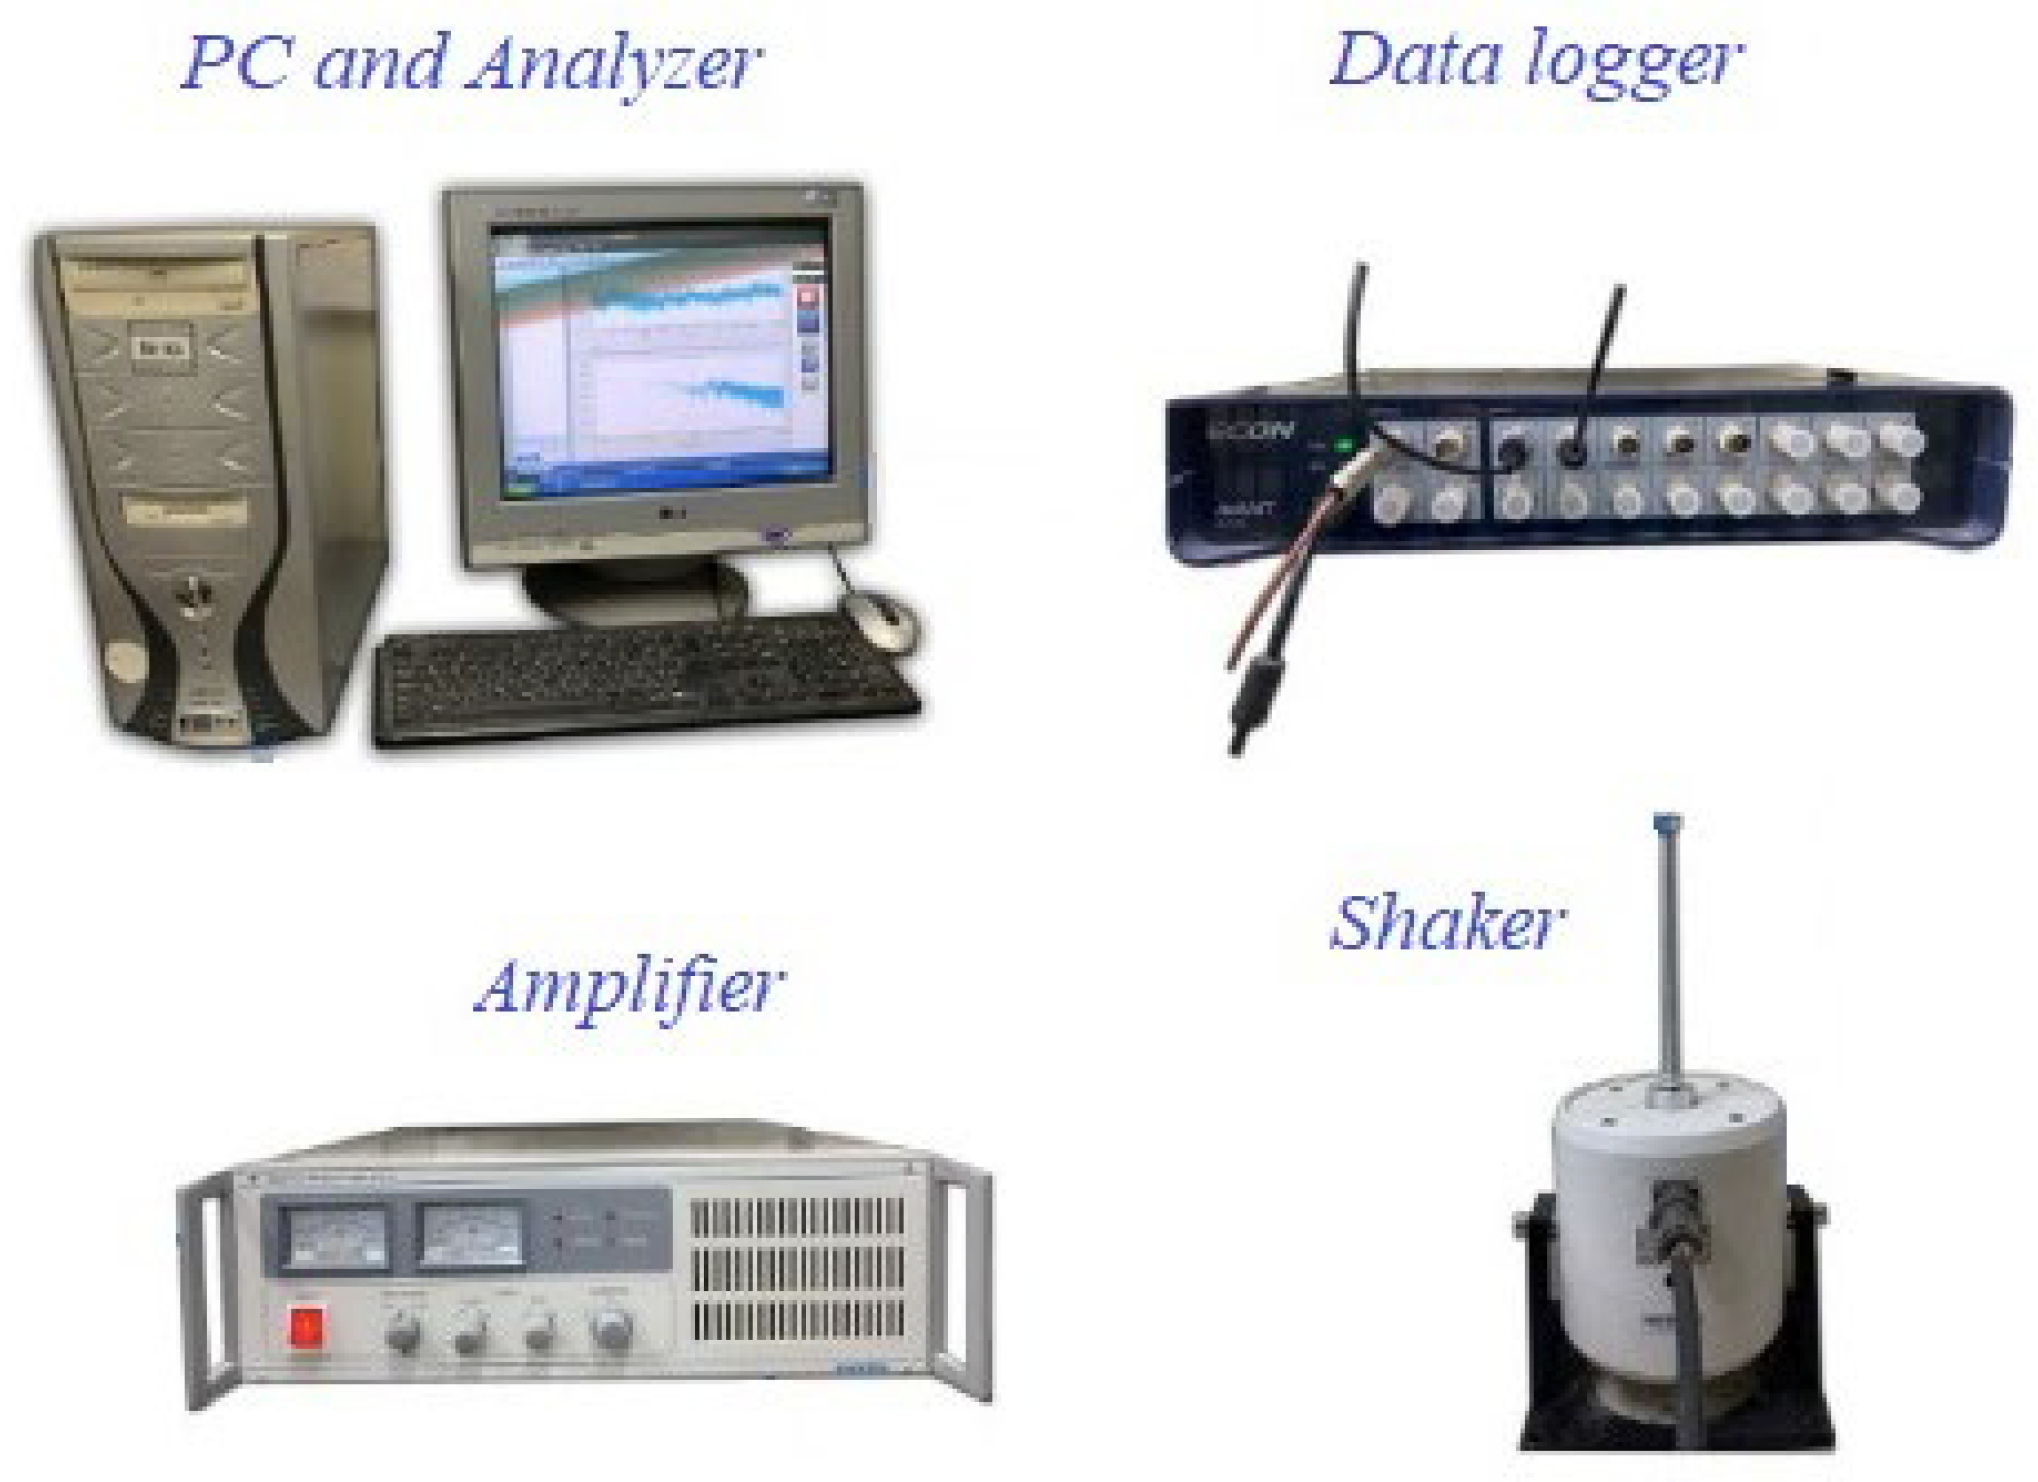
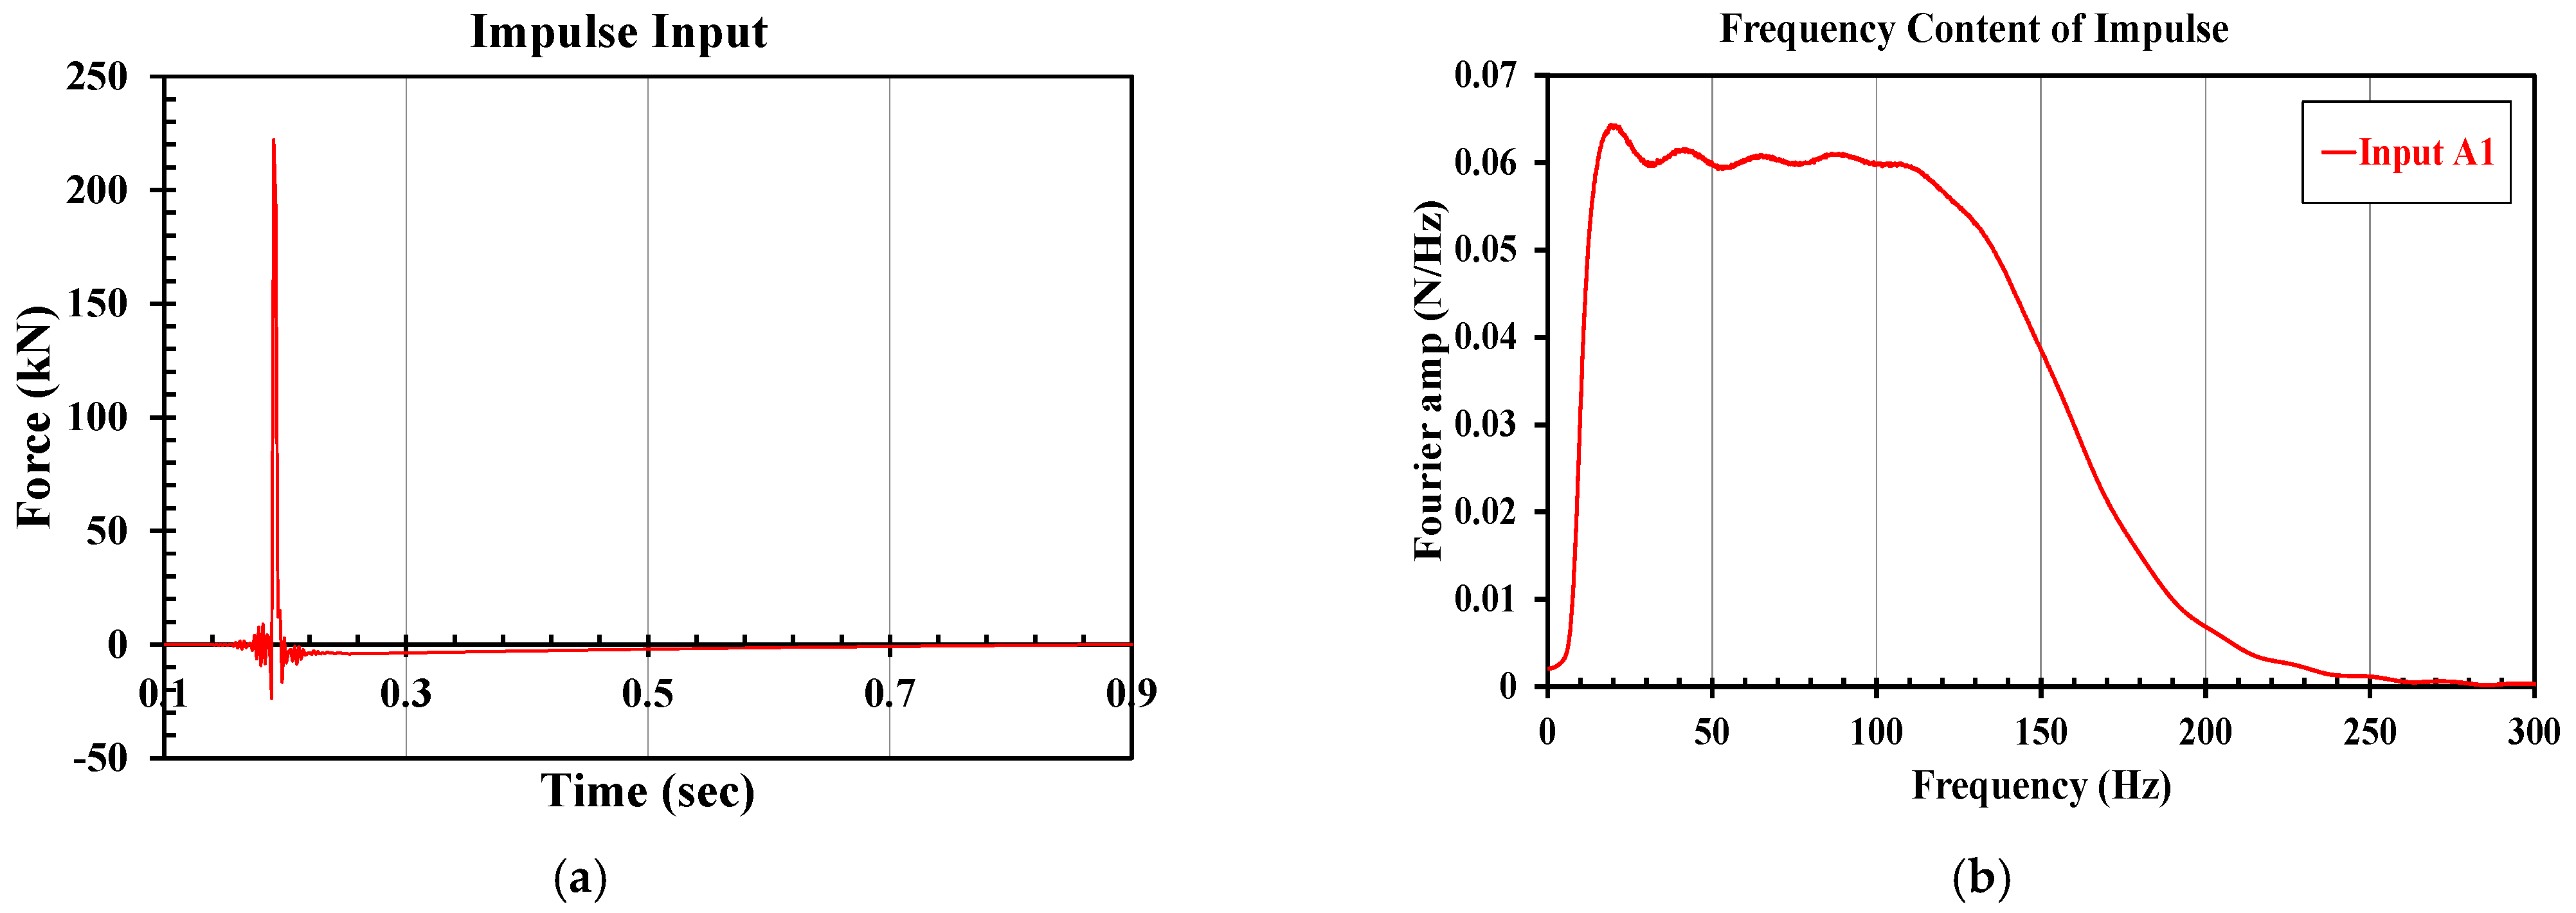
An array of uniaxial accelerometers was installed at respective points of the test model to measure the required dynamic response. The scaled impulse and harmonic inputs were applied for the realization of the natural frequencies and linear elastic dynamic responses of the soil and structure. All presented results are in the model scale. In the following lines, the remarkable outcomes are summarized:
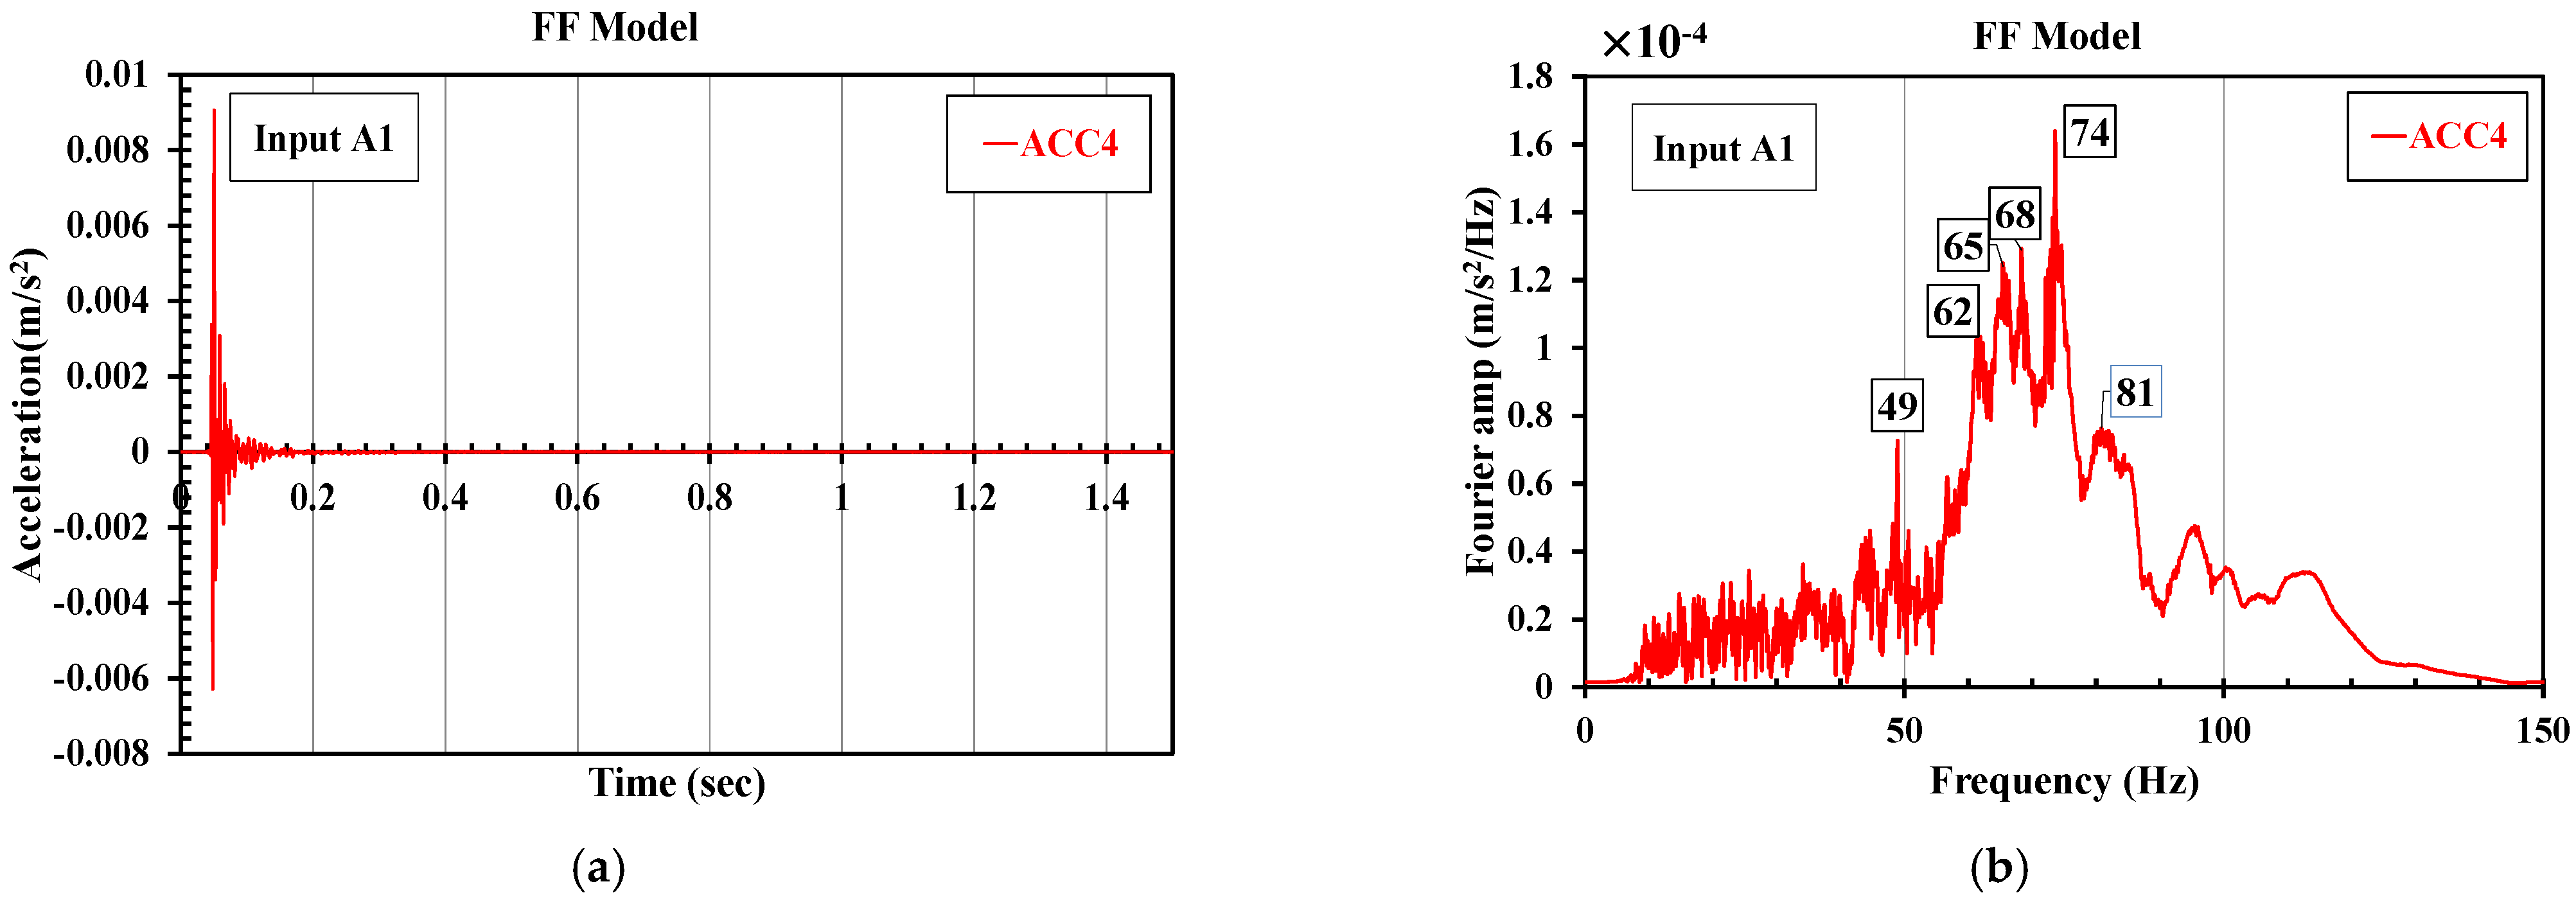
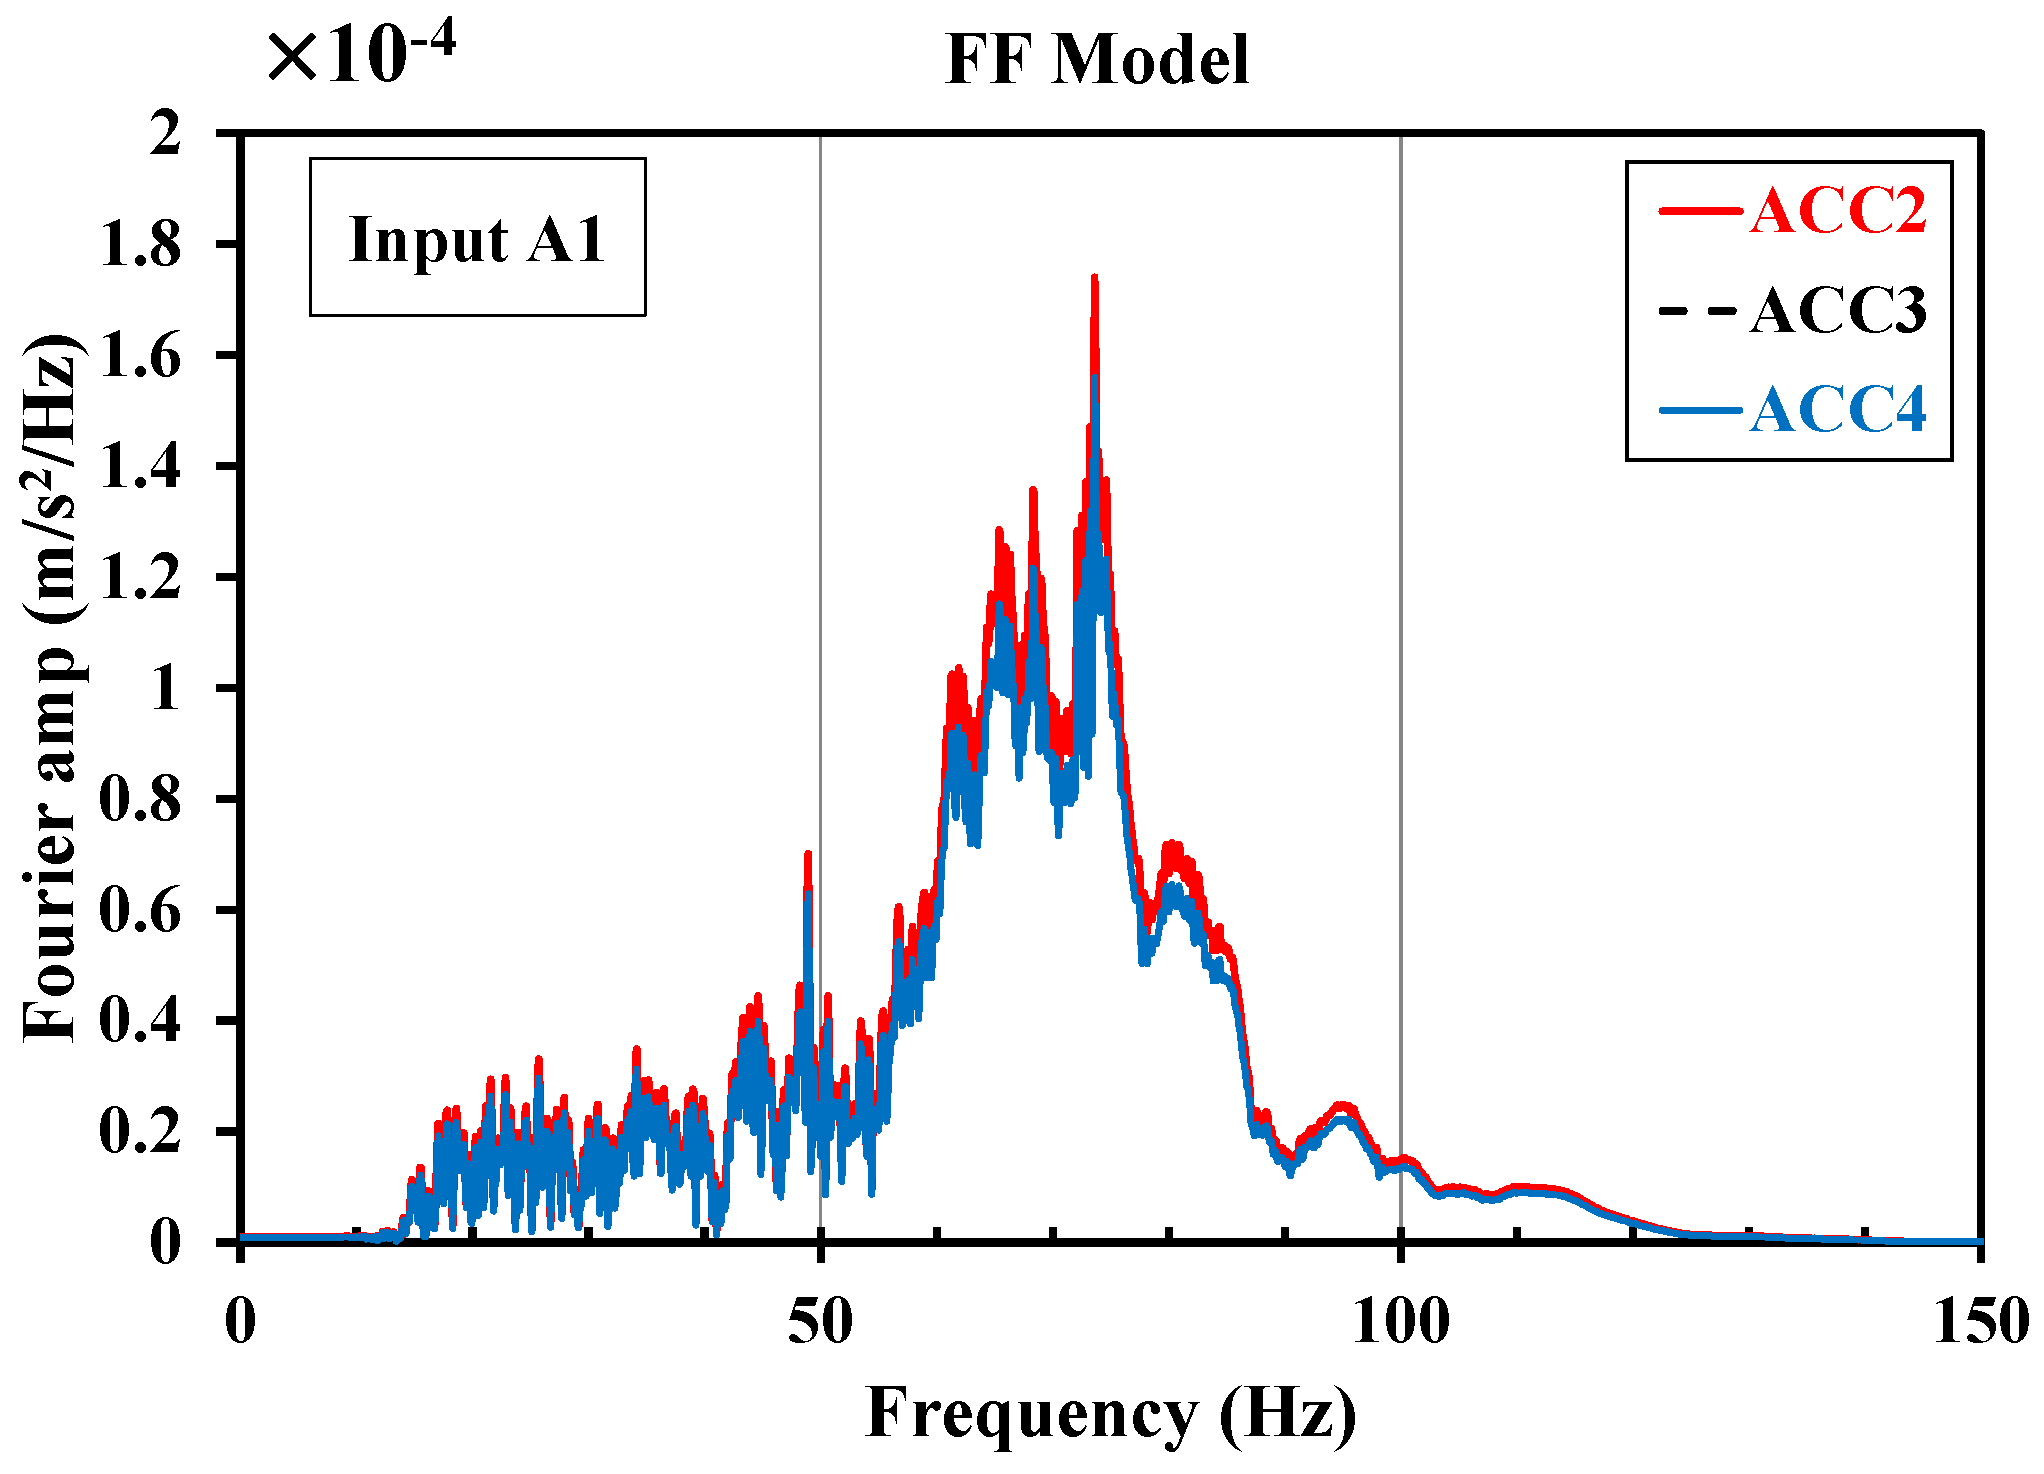
  • Based on experimental modeling, the frequency content of FF response was dominated by the frequencies of the vertical translation modes, i.e., 49, 62, 65, 68, 74, and 81 Hz.
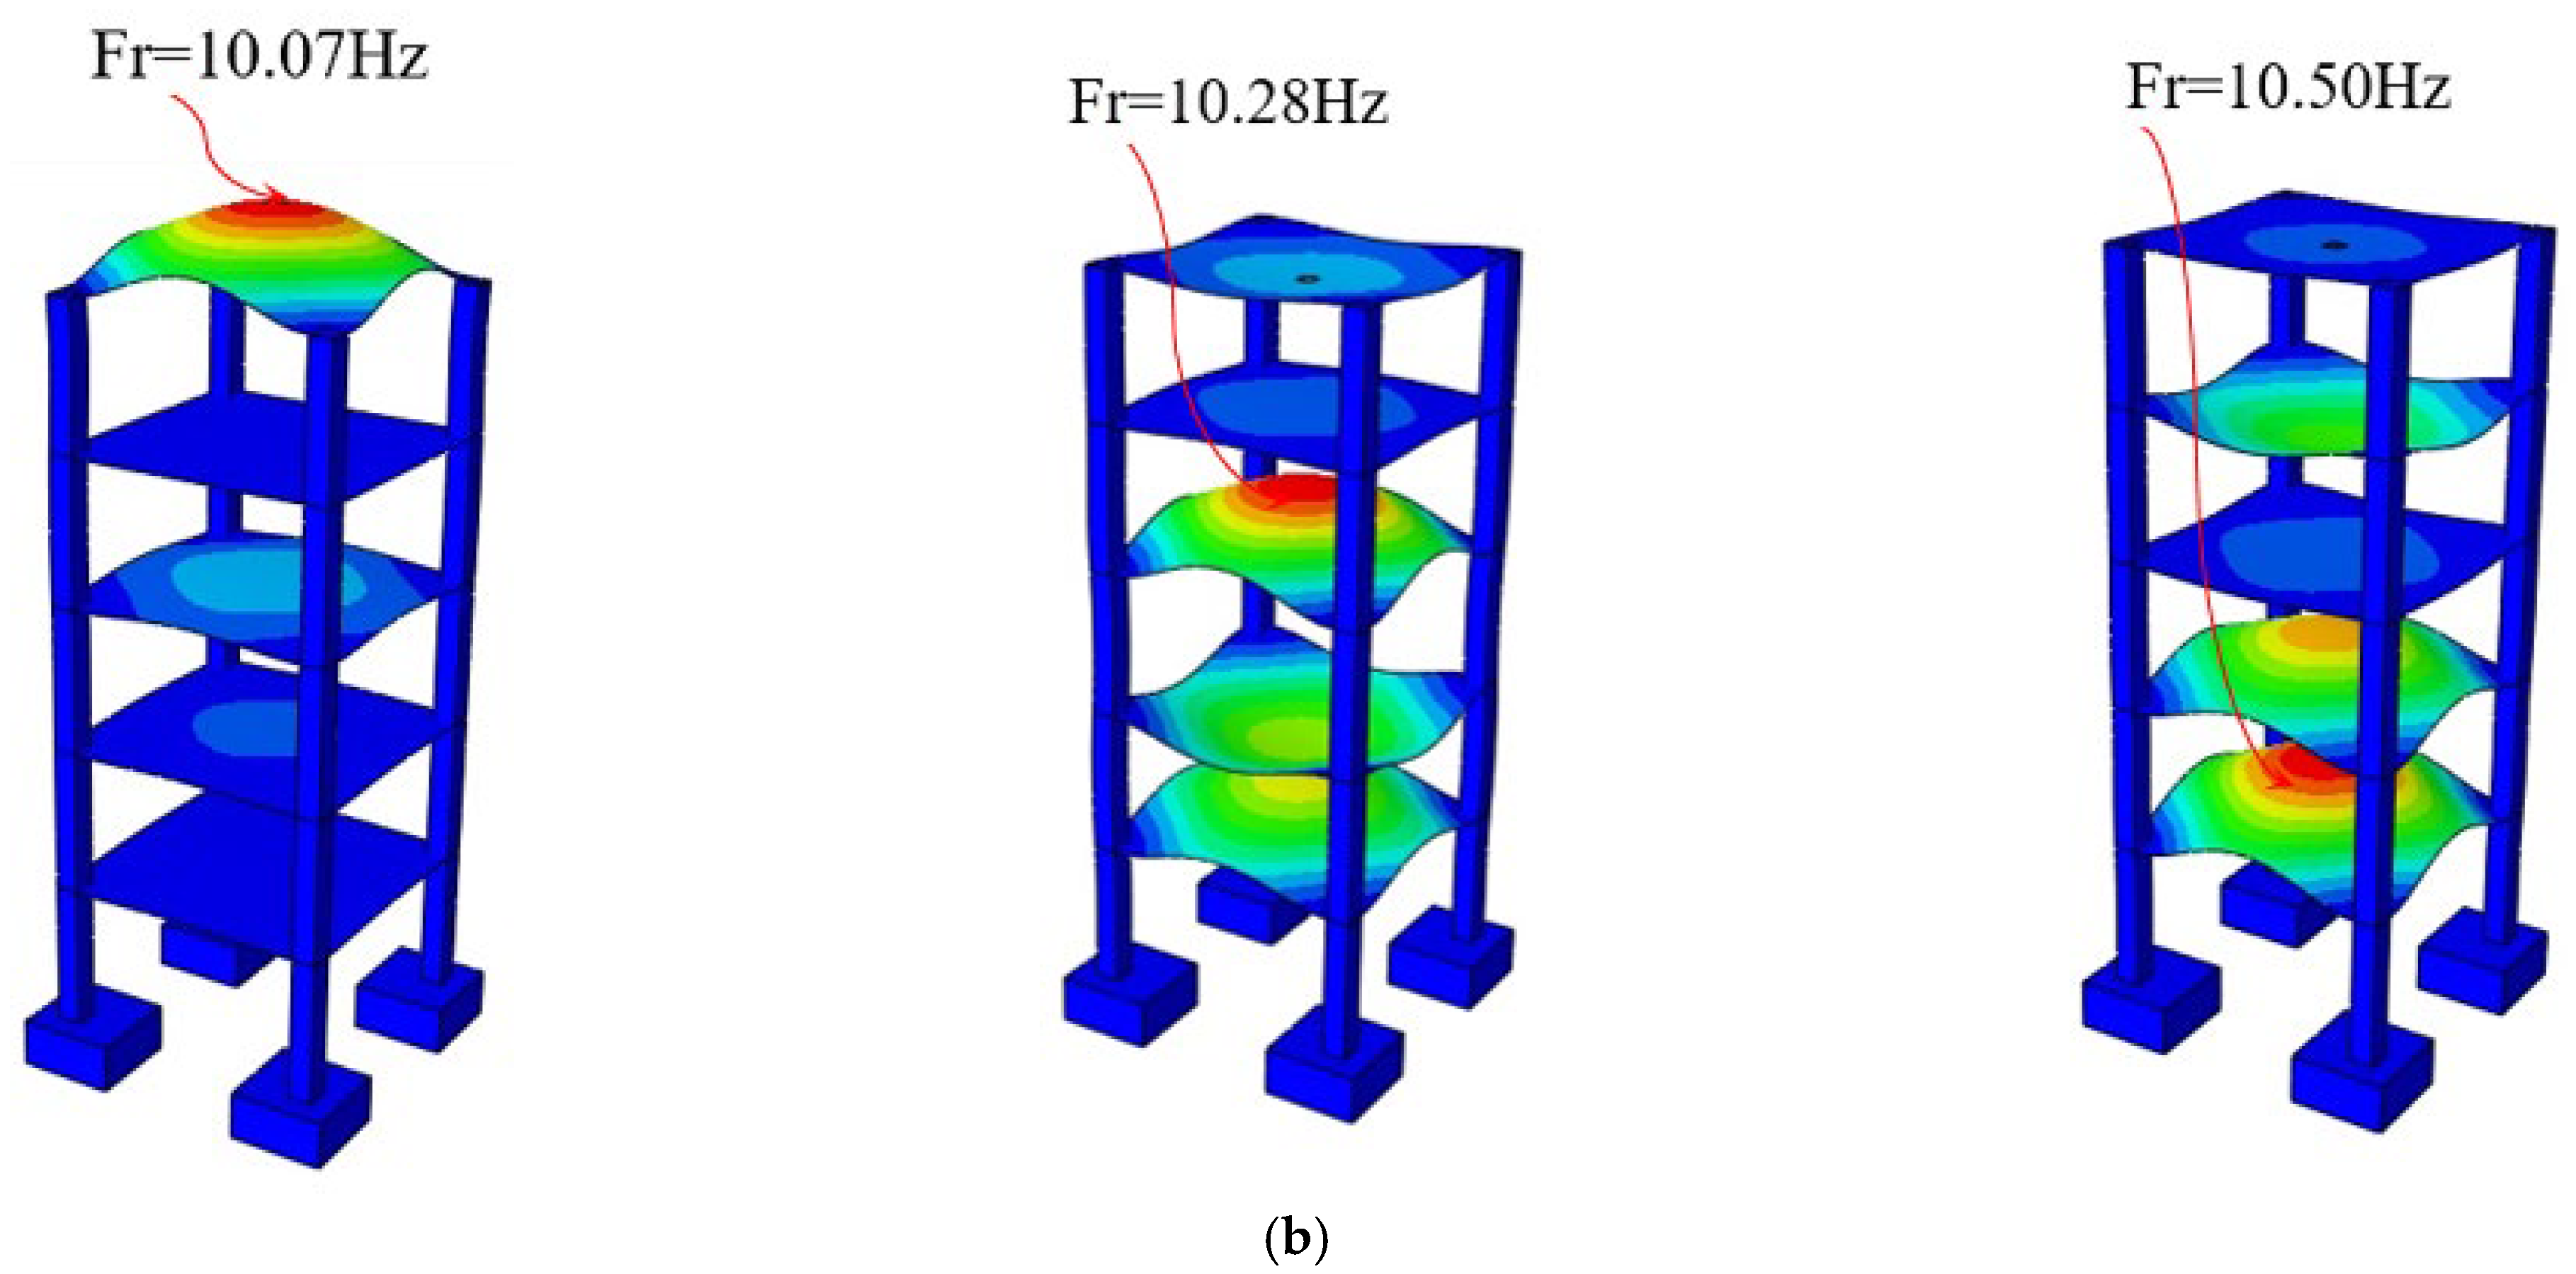
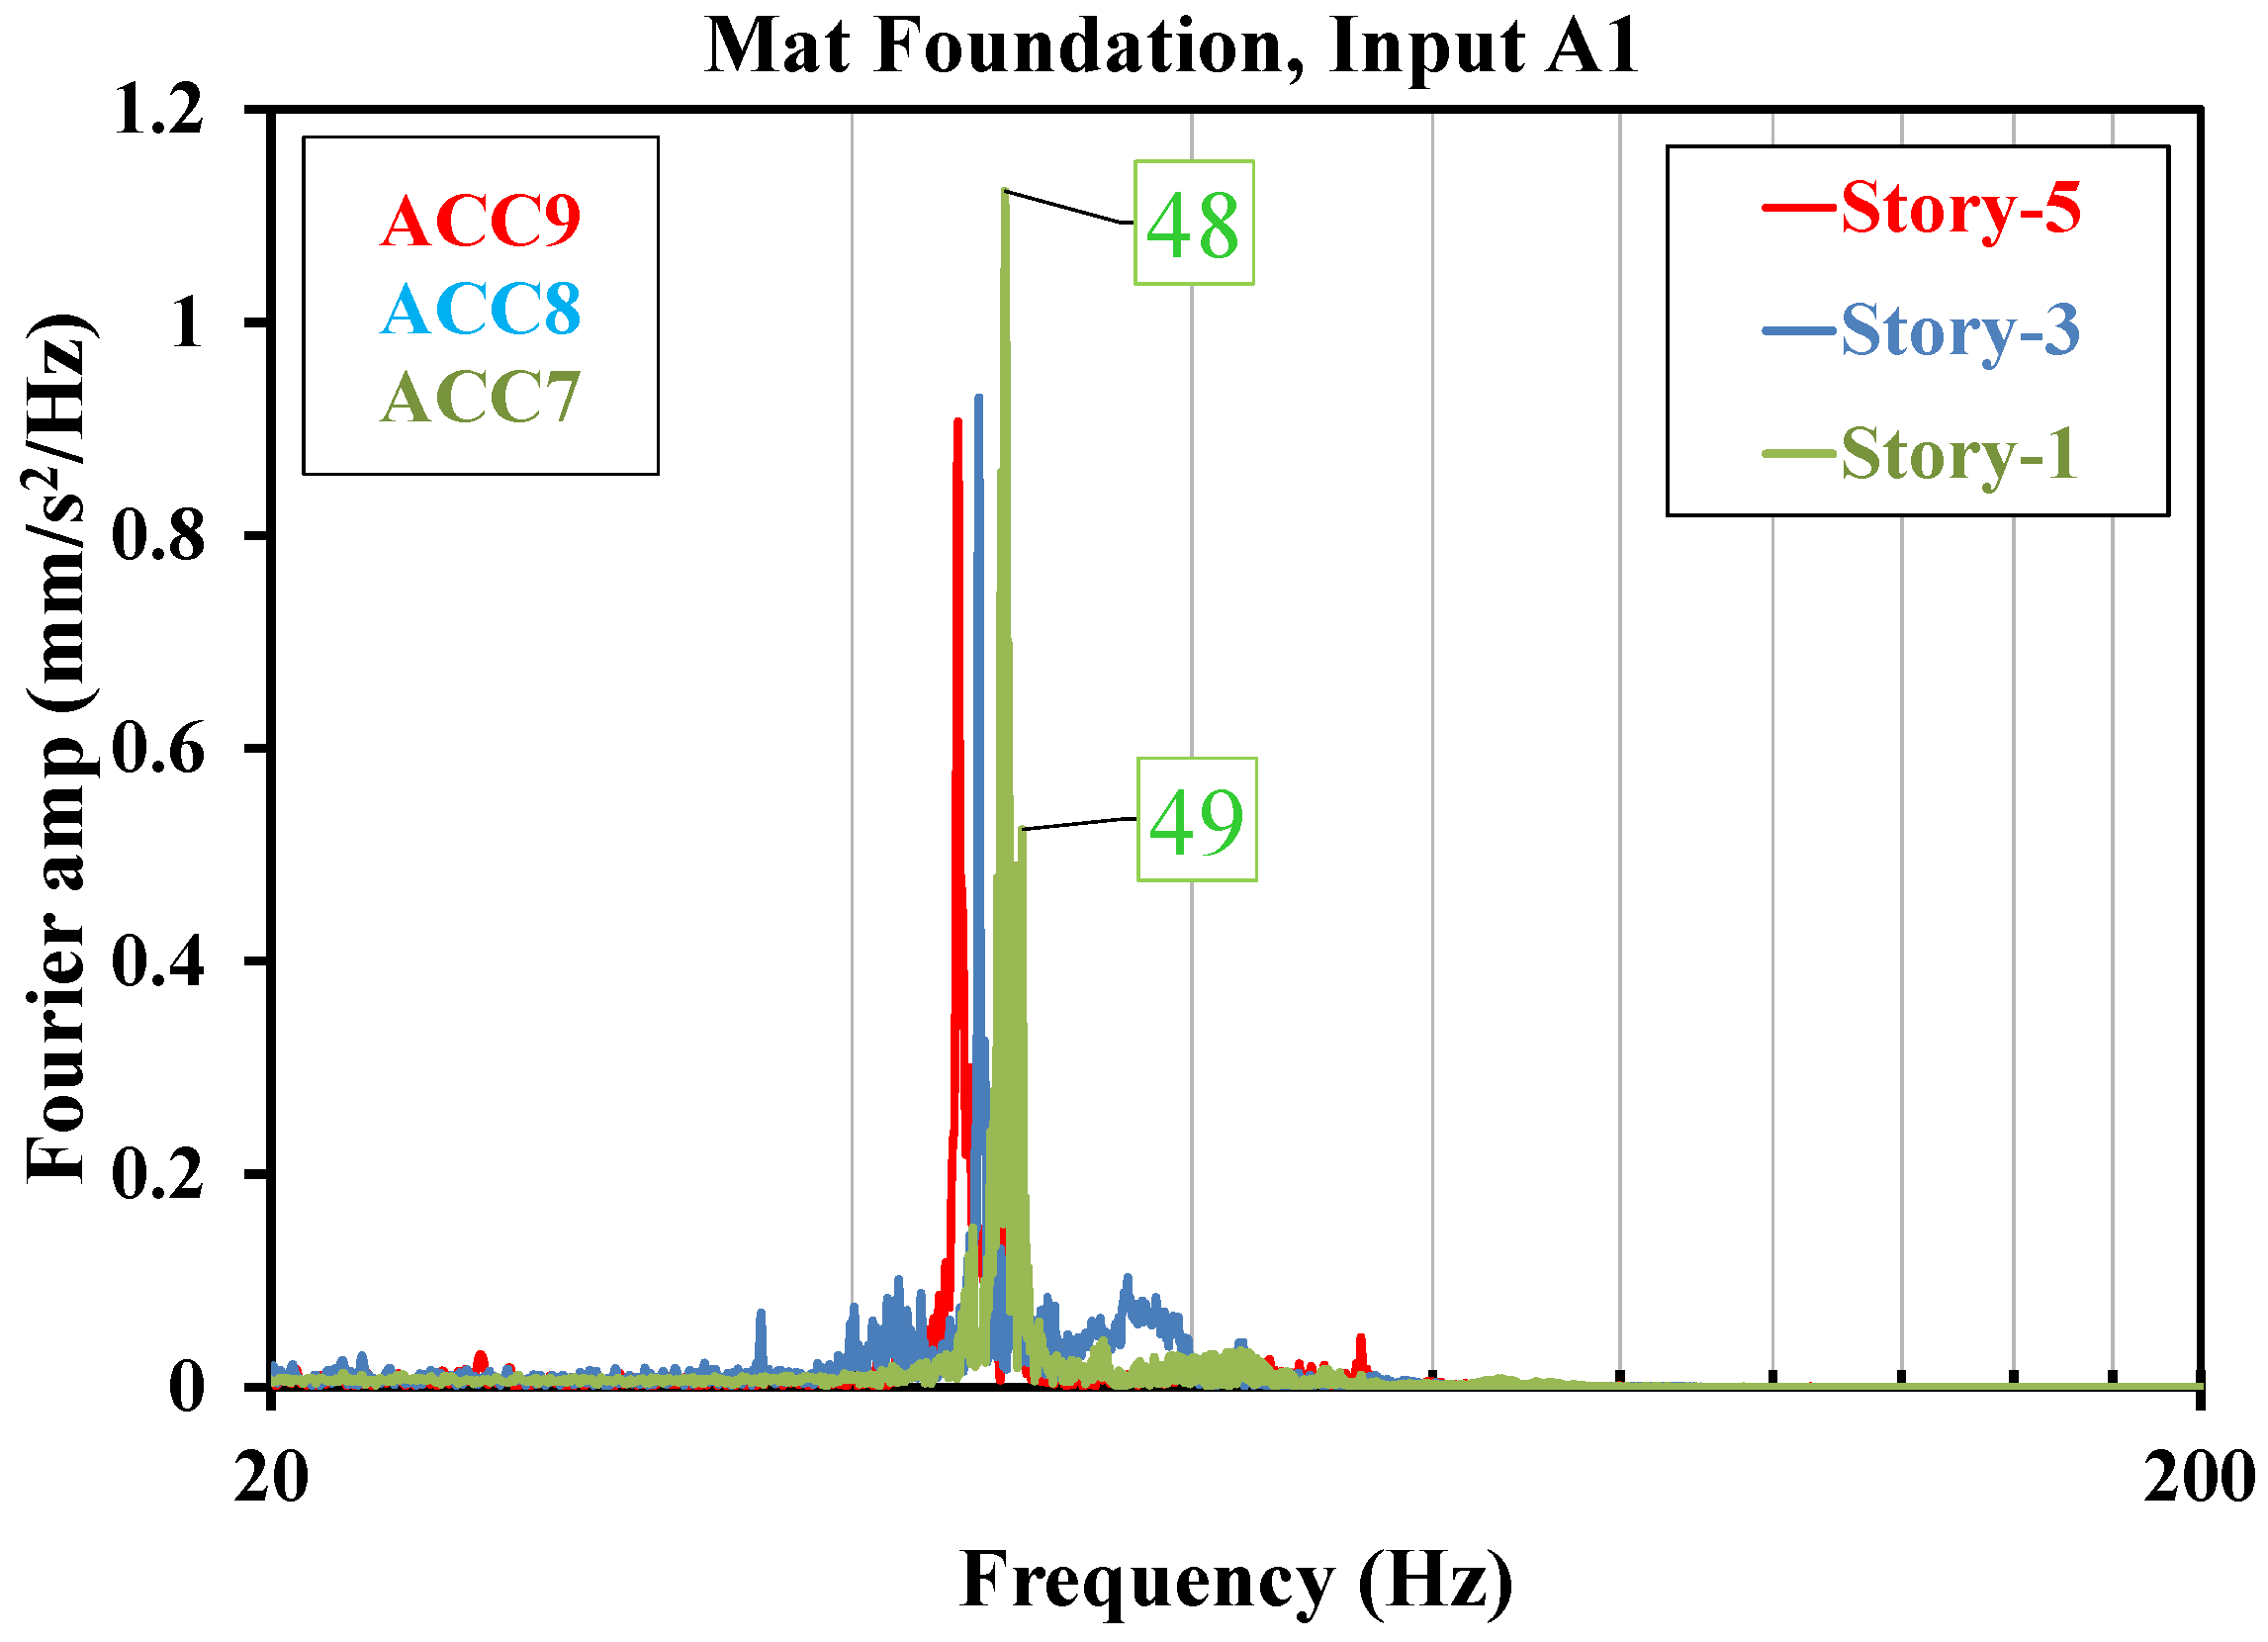
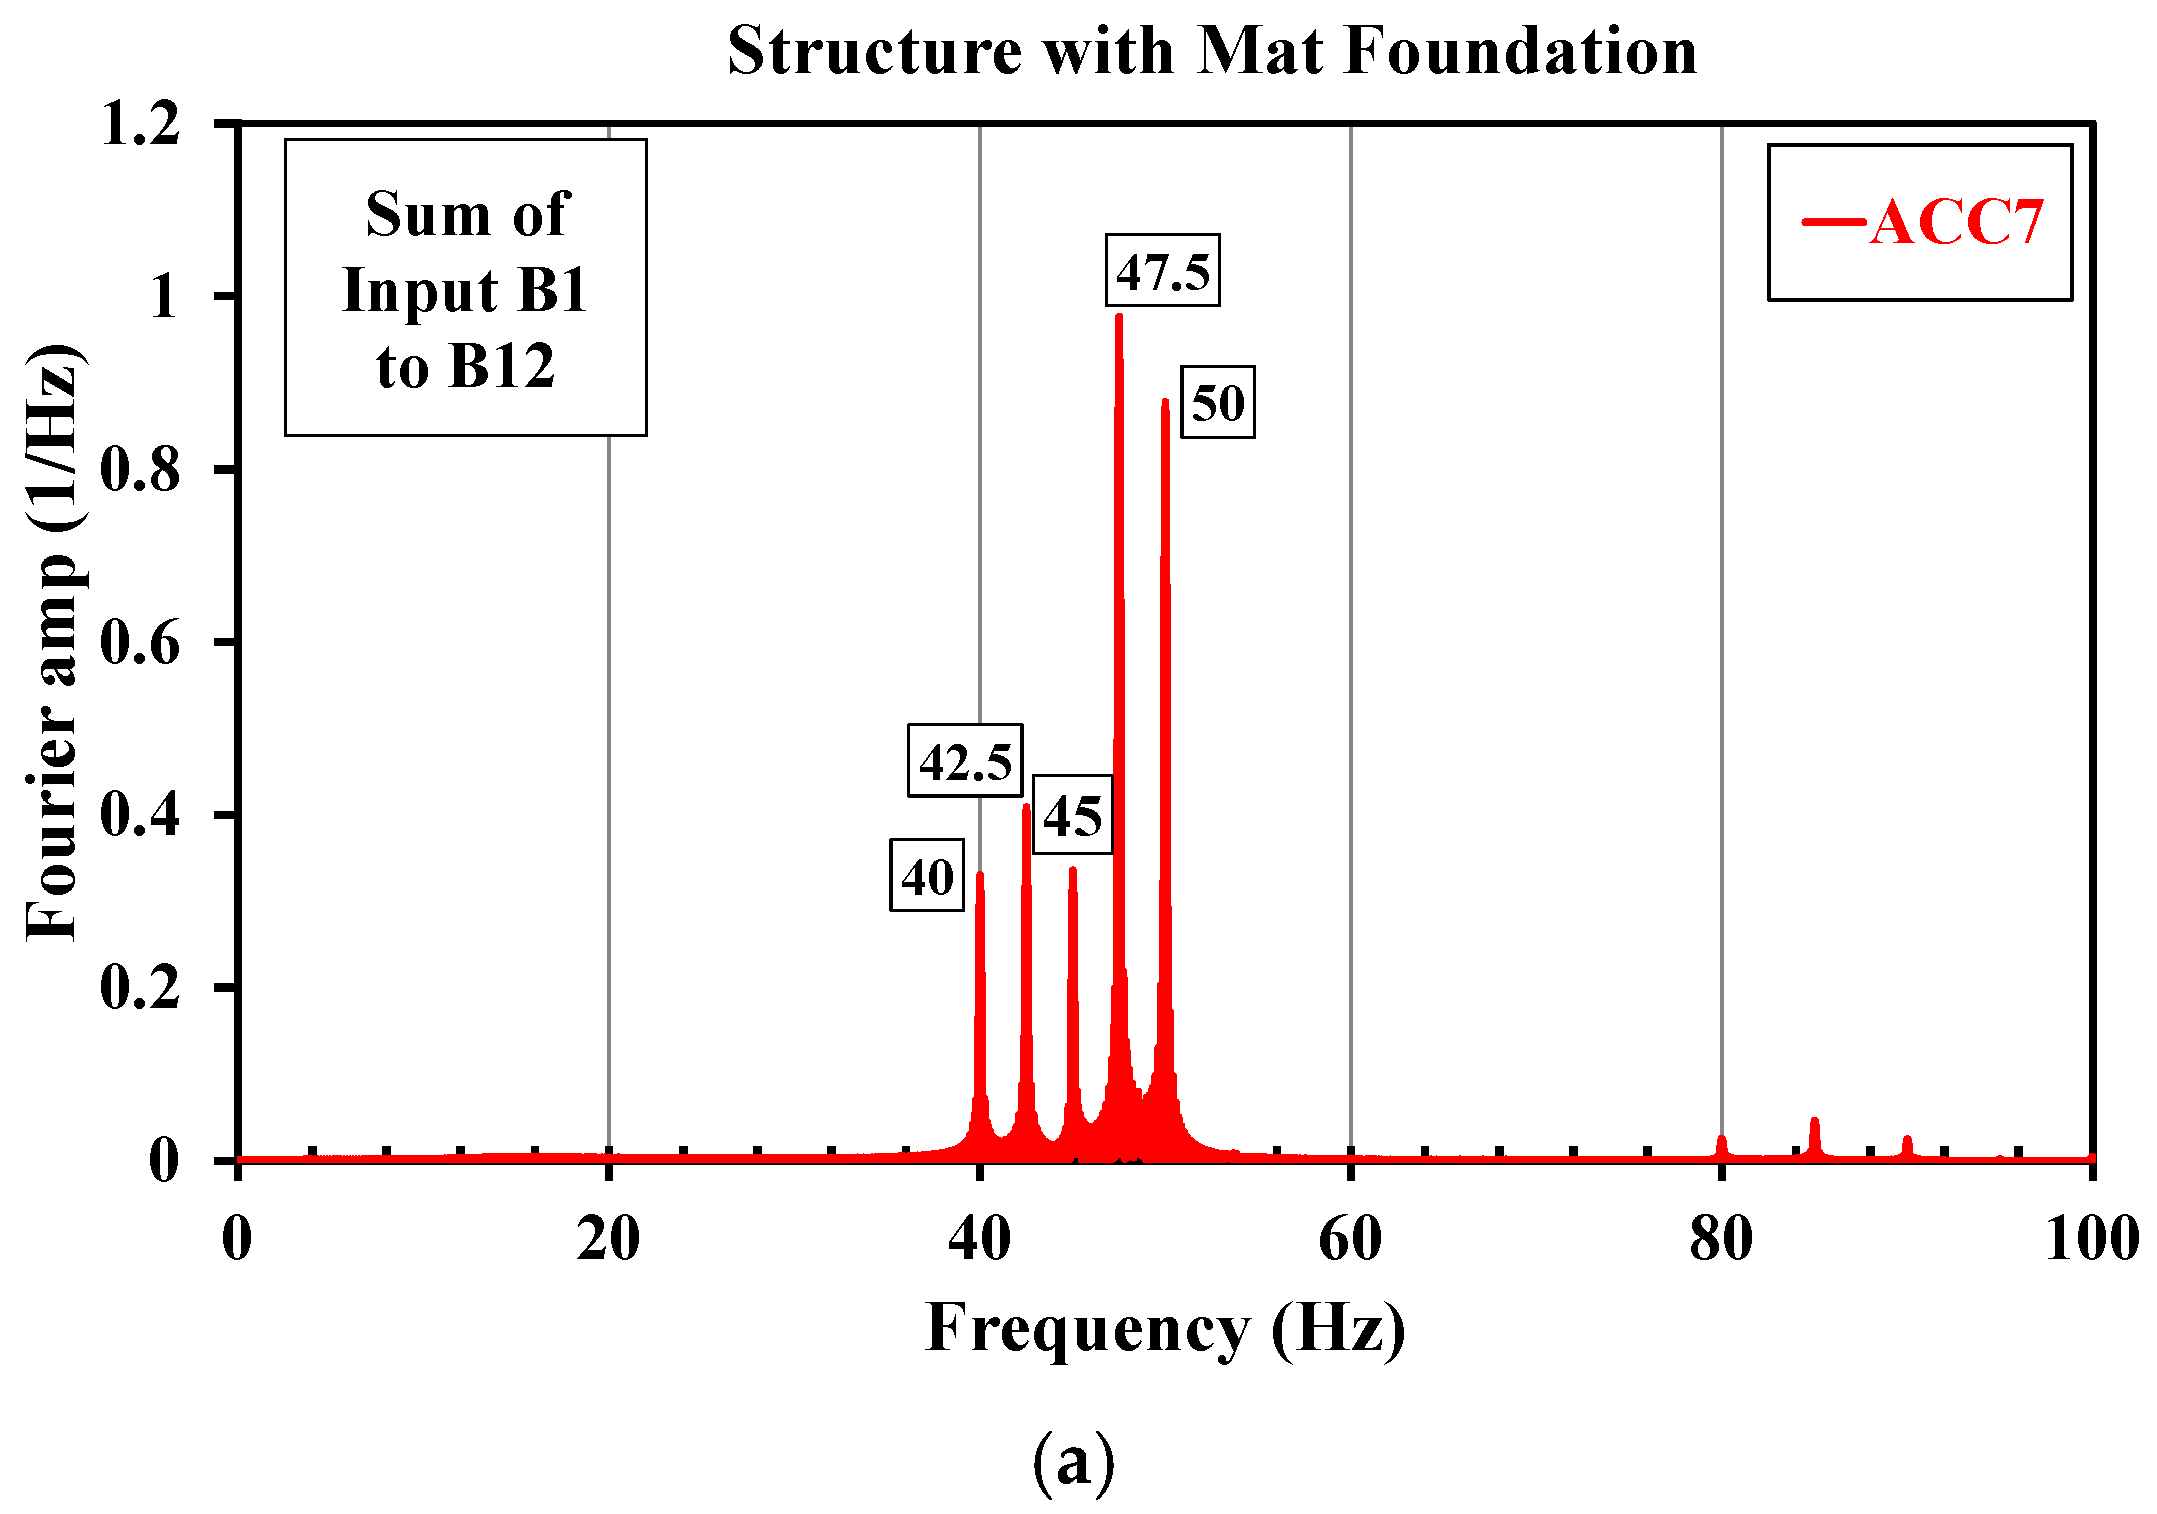
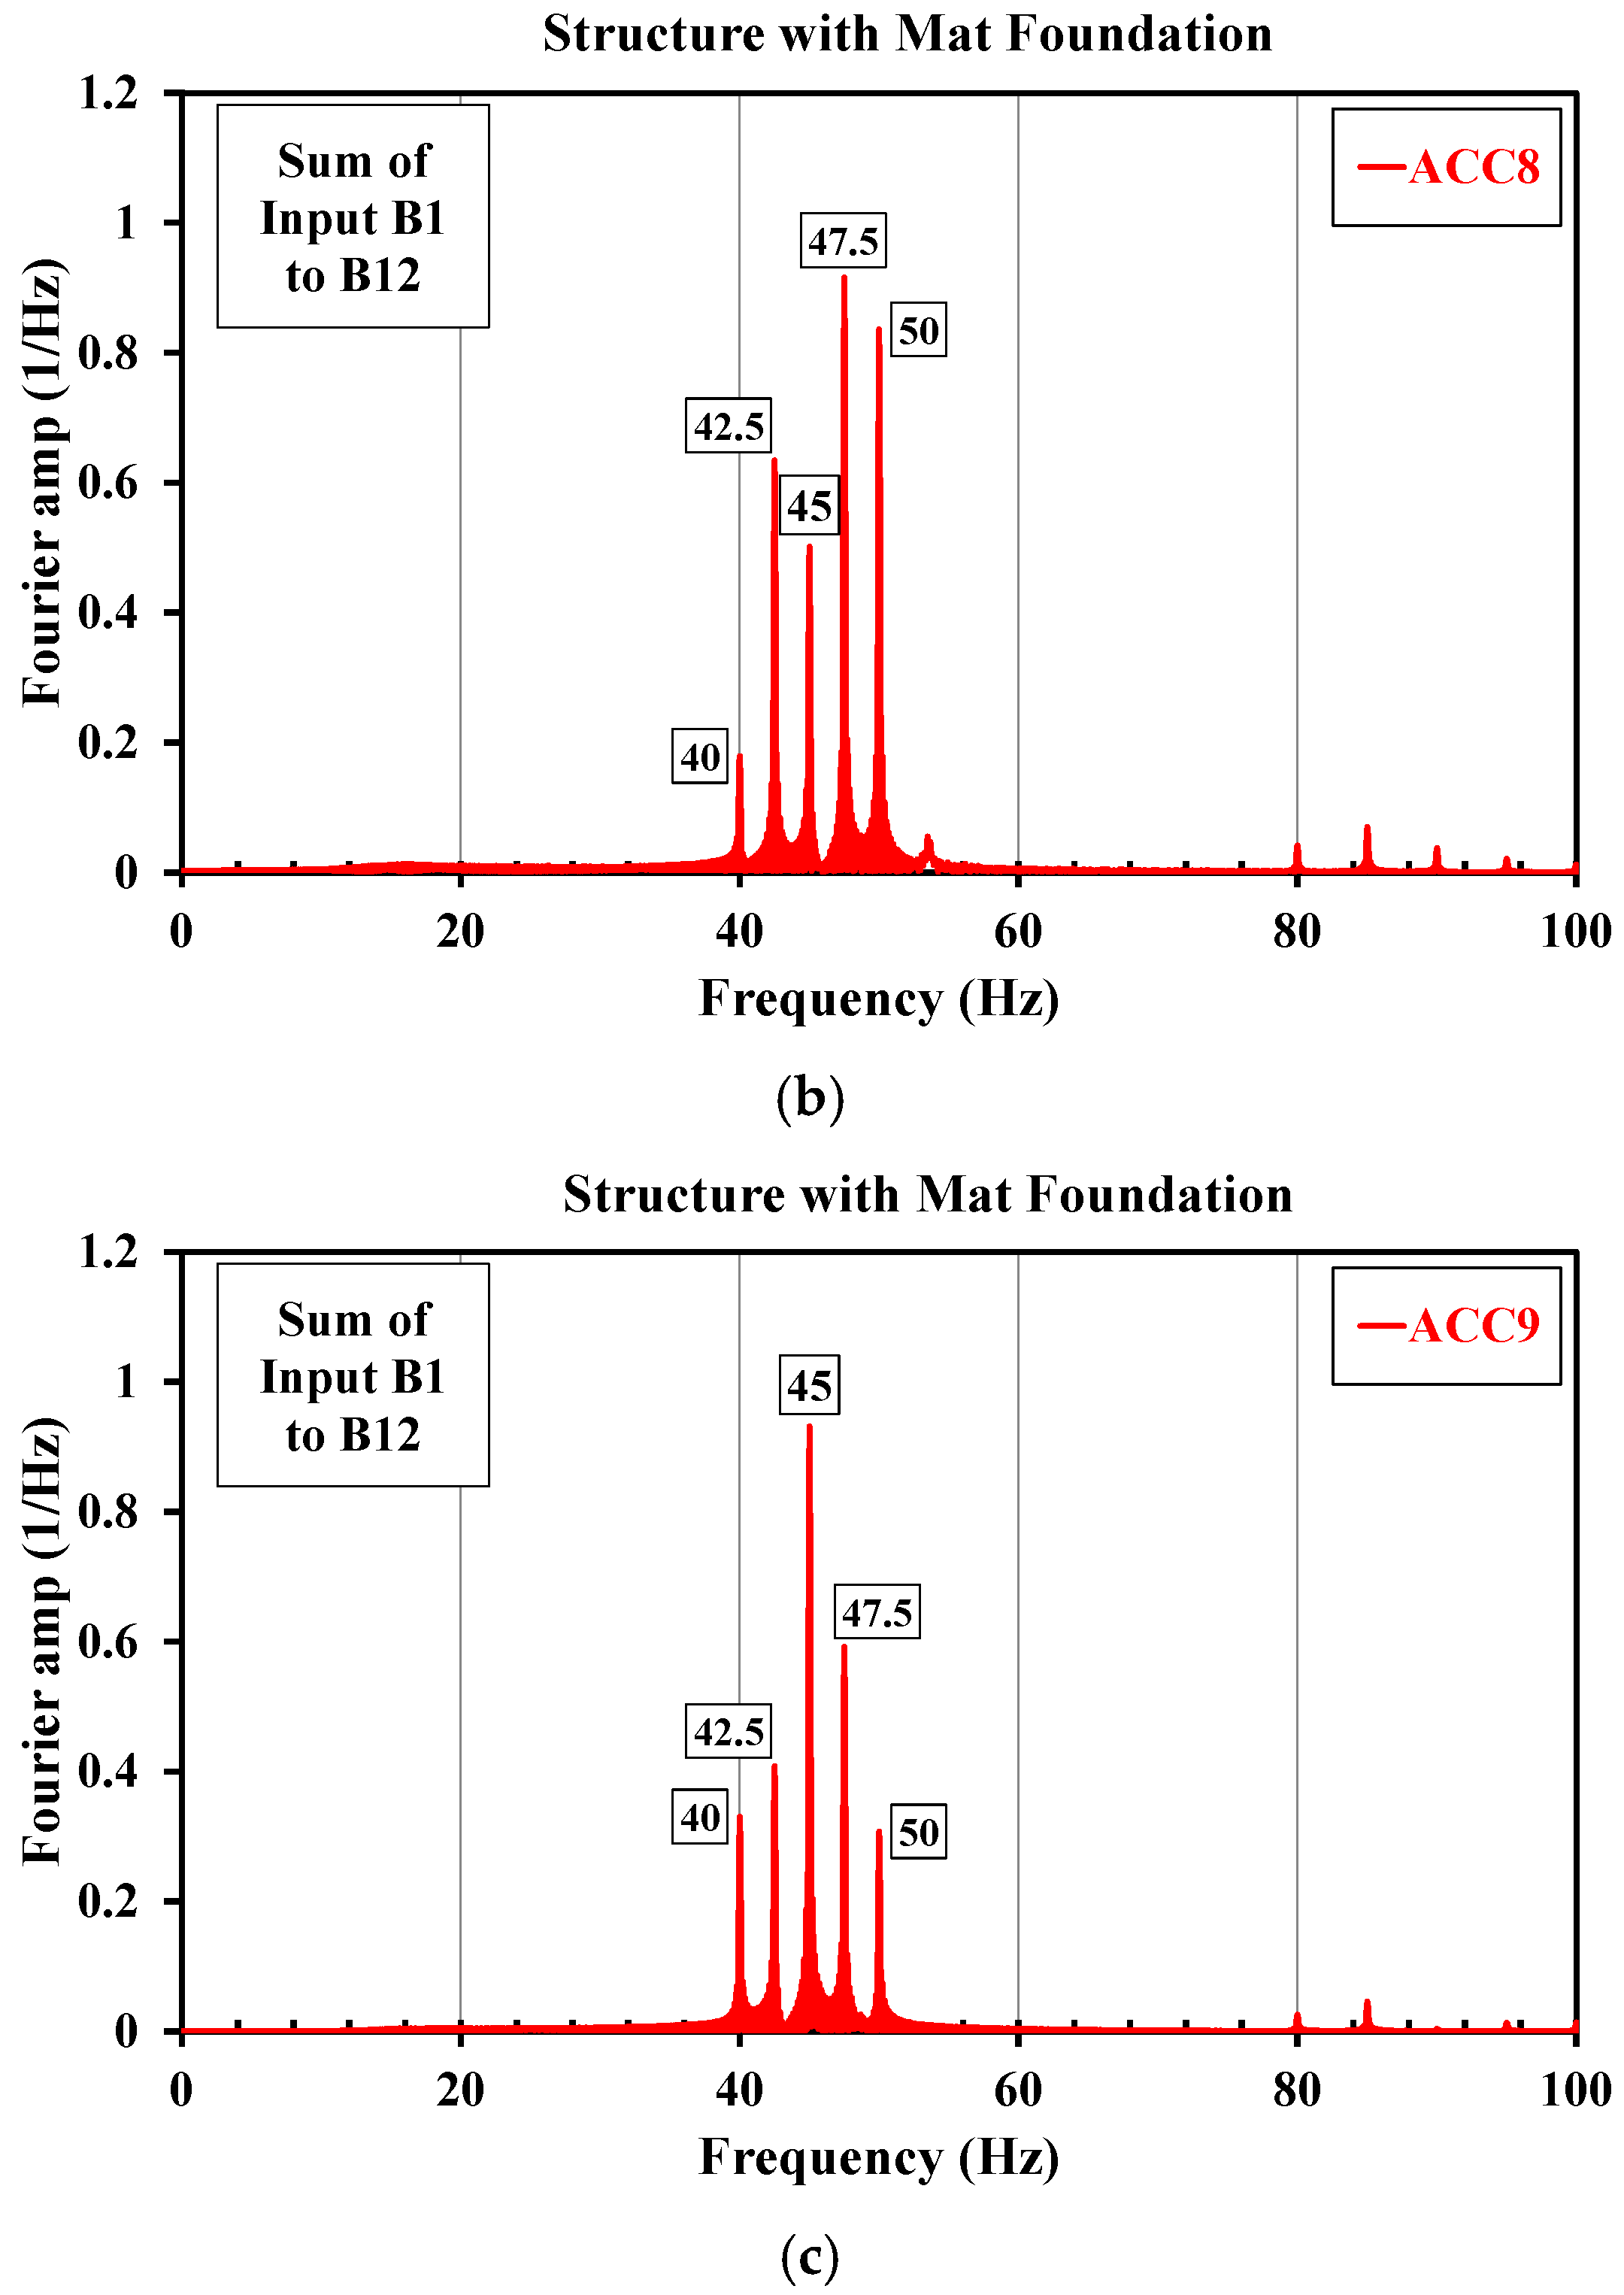
  • The experimental measurements concentrated on the mode shapes and natural frequencies of the structure associated with the first local bending mode of slabs. The resonance points in the frequency response of the slabs signified the frequencies 45, 47 and 48 Hz corresponding to the fifth, third and first floors, respectively, in ascending order.
  • As the bending mode frequency of the floor slab approached 49 Hz, the Fourier amplitude was sharply amplified.
An assessment of vibration level in the soil and on the floors as the main indicator that quantitatively depicts the effectiveness of the evaluated foundations subjected to ground vibration is listed below.
4.
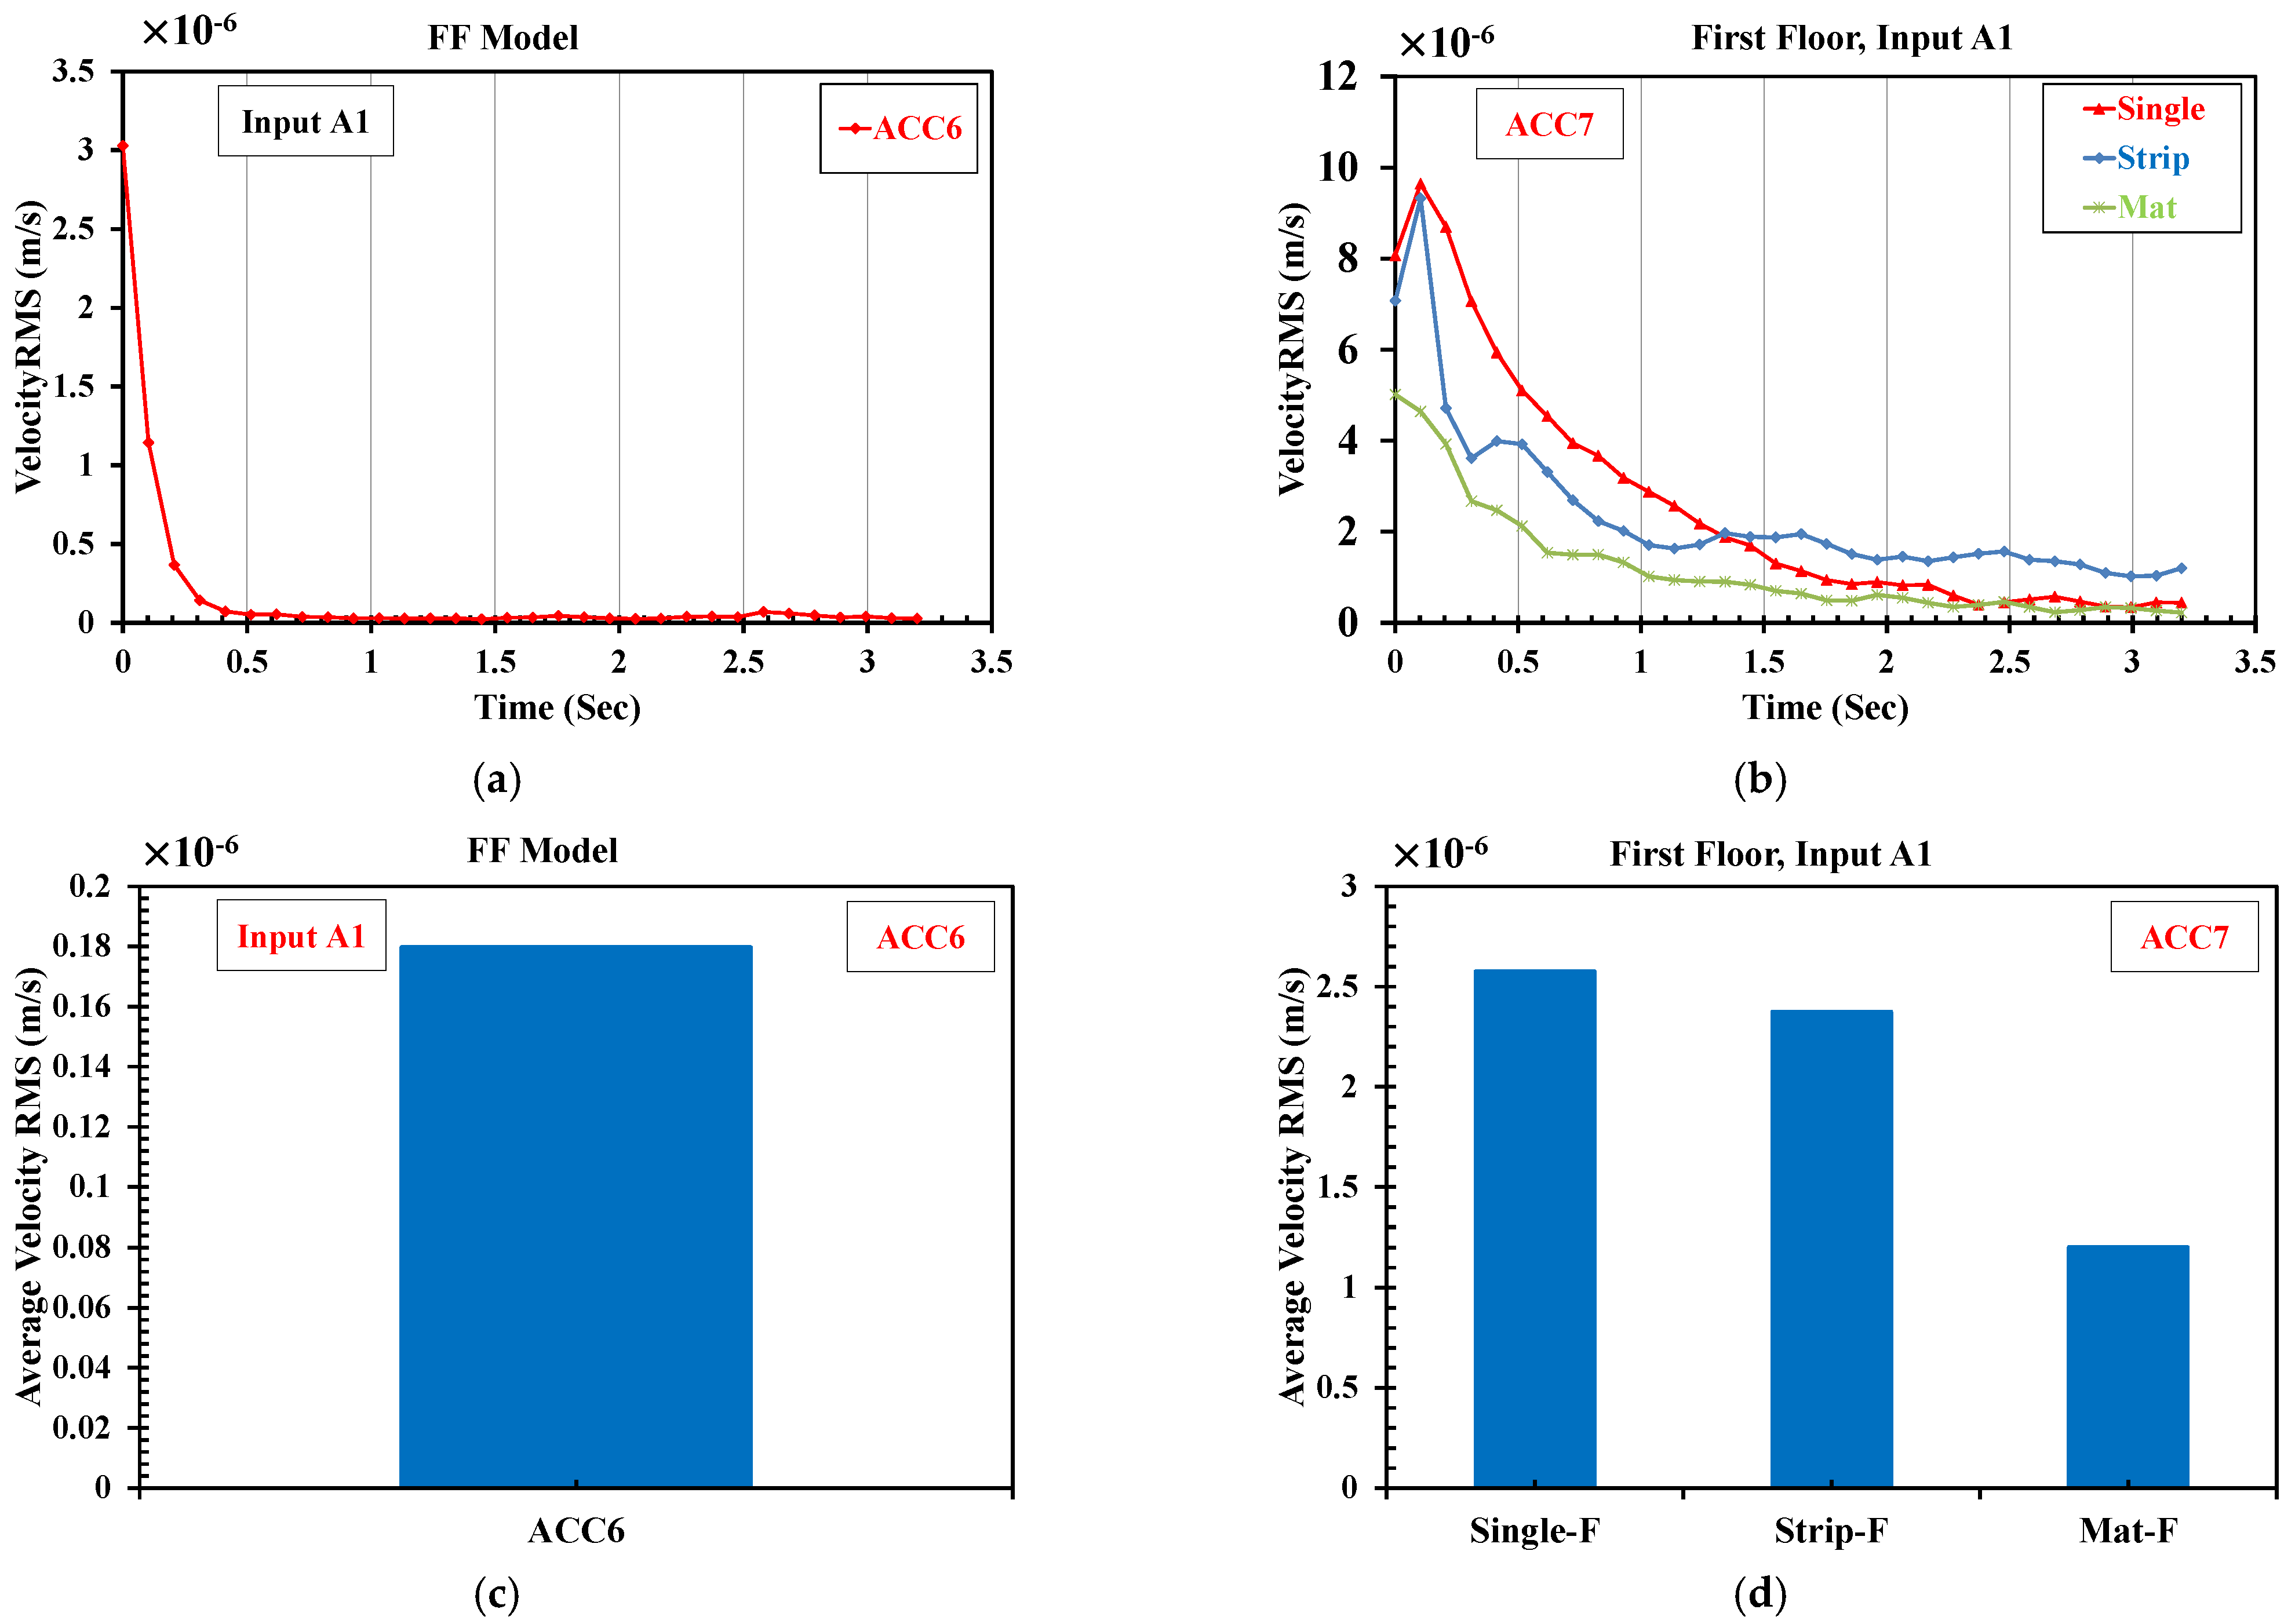
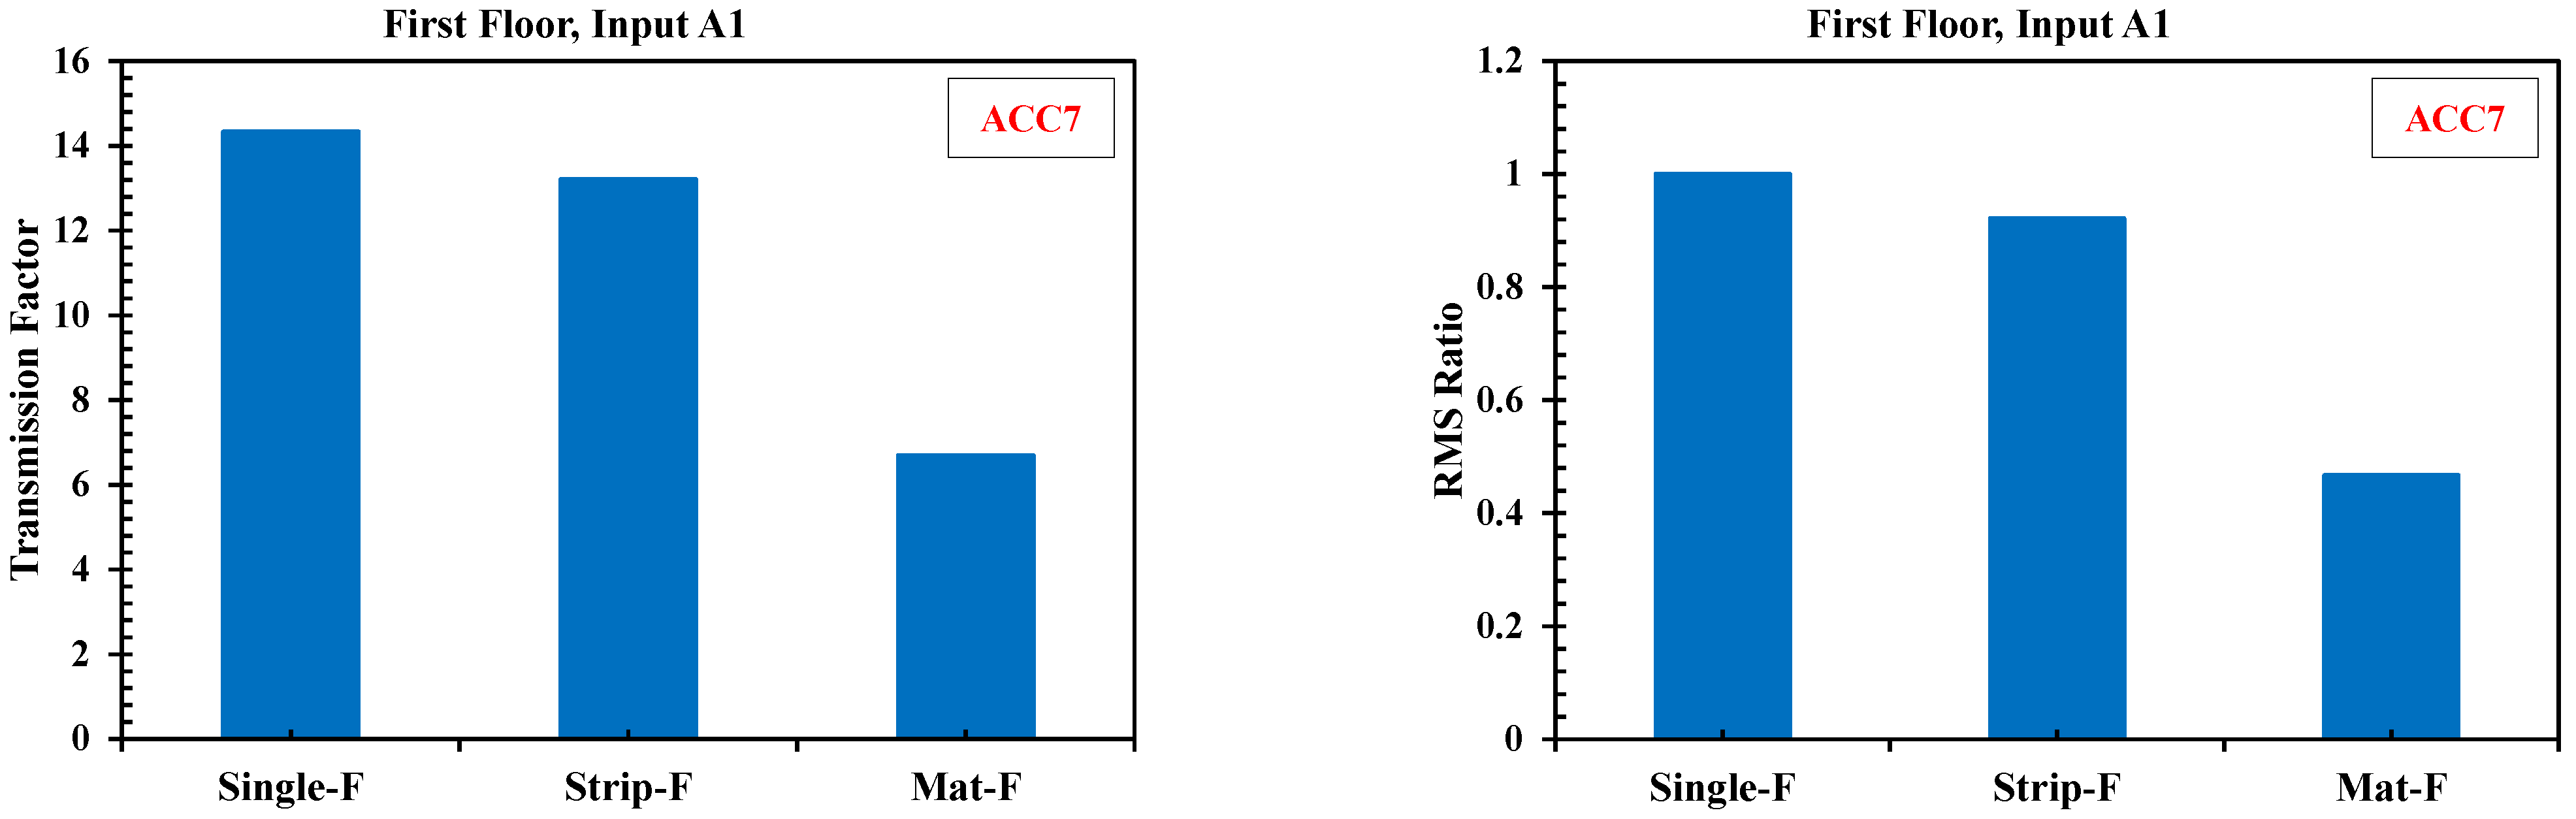
The vibration level transmitted via foundations to the floors, i.e., TRF, had the minimum value in the structure with a mat foundation, displaying the best efficiency among all foundation types.
5.
The RMS ratio (RR), which is defined as the RMS of other foundation types divided by that of a single one, confirms the decreasing operation of the mat foundation vis-à-vis other types, generated by its rigidity.
6.
In agreement with item 3, it should be emphasized that the TRF values exceeded unity since the bending mode frequency of the floor slab tended to approach the frequency of the soil’s vertical translation, leading to resonance amplification.
7.
The strip and mat foundations caused RR to diminish on the first floor by, respectively, about 8% and 53% compared to the single footing. This is a notable achievement, particularly in satisfactory agreement with previous works. In the end, it is proposed to implement the same experimental investigation making use of other soil types and multi-span frames.

Author Contributions

Investigation and Writing, M.M.-R.; Methodology, M.M.-R. and J.A.Z.; Supervision, J.A.Z. and M.E. All authors have read and agreed to the published version of the manuscript.

Funding

This research received no external funding.

Conflicts of Interest

The authors declare no conflict of interest.

References

  1. Green, D.L. 5.3. Modelling Geomorphic Systems: Scaled Physical Models. In Geomorphological Techniques; British Society for Geomorphology: London, UK, 2014. [Google Scholar]
  2. Shiau, J.; Sams, M.; Lamb, B. Introducing Advanced Topics in Geotechnical Engineering Teaching–Tunnel Modelling. Int. J. Geomate 2016, 10, 1698–1705. [Google Scholar] [CrossRef]
  3. White, D.J.; Gaudin, C.; Take, W.A. General Report for TC104 Physical Modelling in Geotechnics. In Proceedings of the 18th International Conference on Soil Mechanics and Geotechnical Engineering: Challenges and Innovations in Geotechnics, Paris, France, 2–7 September 2013; Volume 2, pp. 867–873. [Google Scholar]
  4. Al Heib, M.; Emeriault, F.; Nghiem, H.-L. On the Use of 1g Physical Models for Ground Movements and Soil-Structure Interaction Problems. J. Rock Mech. Geotech. Eng. 2020, 12, 197–211. [Google Scholar] [CrossRef]
  5. Yang, W.; Cui, G.; Xu, Z.; Yan, Q.; He, C.; Zhang, Y. An Experimental Study of Ground-Borne Vibration from Shield Tunnels. Tunn. Undergr. Space Technol. 2018, 71, 244–252. [Google Scholar] [CrossRef]
  6. Yang, W.; Yuan, R.; Wang, J. Vibration Induced by Subway Trains: Open-Trench Mitigation Analysis in the Time and Frequency Domains. Shock Vib. 2018, 2018, 1879392. [Google Scholar] [CrossRef]
  7. Yang, W.; Zhang, C.; Liu, D.; Tu, J.; Yan, Q.; Fang, Y.; He, C. The Effect of Cross-Sectional Shape on the Dynamic Response of Tunnels under Train Induced Vibration Loads. Tunn. Undergr. Space Technol. 2019, 90, 231–238. [Google Scholar] [CrossRef]
  8. Guoxing, C.; Su, C.; Xi, Z.; Xiuli, D.; Chengzhi, Q.I.; Zhihua, W. Shaking-Table Tests and Numerical Simulations on a Subway Structure in Soft Soil. Soil Dyn. Earthq. Eng. 2015, 76, 13–28. [Google Scholar] [CrossRef]
  9. Wang, L.; Chen, G.; Chen, S. Experimental Study on Seismic Response of Geogrid Reinforced Rigid Retaining Walls with Saturated Backfill Sand. Geotext. Geomembr. 2015, 43, 35–45. [Google Scholar] [CrossRef]
  10. Singh, D.K.; Karumanchi, S.R.; Mandal, A.; Katpatal, Y.B.; Usmani, A. Effect of Earthquake Excitation on Circular Tunnels: Numerical and Experimental Study. Meas. Control 2019, 52, 740–757. [Google Scholar] [CrossRef] [Green Version]
  11. Chen, Z.; Bian, M. Dynamic Centrifuge Test and Numerical Modelling of the Seismic Response of the Tunnel in Cohesive Soil Foundation. Buildings 2022, 12, 337. [Google Scholar] [CrossRef]
  12. Haiyang, Z.; Xu, Y.; Chao, Z.; Dandan, J. Shaking Table Tests for the Seismic Response of a Base-Isolated Structure with the SSI Effect. Soil Dyn. Earthq. Eng. 2014, 67, 208–218. [Google Scholar] [CrossRef]
  13. Tabatabaiefar, S.H.R.; Fatahi, B.; Samali, B. Numerical and Experimental Investigations on Seismic Response of Building Frames under Influence of Soil-Structure Interaction. Adv. Struct. Eng. 2014, 17, 109–130. [Google Scholar] [CrossRef]
  14. Van Nguyen, Q.; Fatahi, B.; Hokmabadi, A.S. The Effects of Foundation Size on the Seismic Performance of Buildings Considering the Soil-Foundation-Structure Interaction. Struct. Eng. Mech. 2016, 58, 1045–1075. [Google Scholar] [CrossRef] [Green Version]
  15. Karami, B.; Janghorban, M.; Tounsi, A. Wave Propagation of Functionally Graded Anisotropic Nanoplates Resting on Winkler-Pasternak Foundation. Struct. Eng. Mech. 2019, 70, 55–66. [Google Scholar]
  16. Mahmoudi, A.; Benyoucef, S.; Tounsi, A.; Benachour, A.; Adda Bedia, E.A.; Mahmoud, S.R. A Refined Quasi-3D Shear Deformation Theory for Thermo-Mechanical Behavior of Functionally Graded Sandwich Plates on Elastic Foundations. J. Sandw. Struct. Mater. 2019, 21, 1906–1929. [Google Scholar] [CrossRef]
  17. Boukhlif, Z.; Bouremana, M.; Bourada, F.; Bousahla, A.A.; Bourada, M.; Tounsi, A.; Al-Osta, M.A. A Simple Quasi-3D HSDT for the Dynamics Analysis of FG Thick Plate on Elastic Foundation. Steel Compos. Struct. 2019, 31, 503–516. [Google Scholar]
  18. Kaddari, M.; Kaci, A.; Bousahla, A.A.; Tounsi, A.; Bourada, F.; Tounsi, A.; Bedia, E.A.; Al-Osta, M.A. A Study on the Structural Behaviour of Functionally Graded Porous Plates on Elastic Foundation Using a New Quasi-3D Model: Bending and Free Vibration Analysis. Comput. Concr. 2020, 25, 37–57. [Google Scholar]
  19. Sadeghi, J.; Haghighi, E.; Esmaeili, M. Performance of under Foundation Shock Mat in Reduction of Railway-Induced Vibrations. Struct. Eng. Mech. 2021, 78, 425. [Google Scholar]
  20. Persson, P.; Persson, K.; Sandberg, G. Numerical Study on Reducing Building Vibrations by Foundation Improvement. Eng. Struct. 2016, 124, 361–375. [Google Scholar] [CrossRef]
  21. Hou, B.; Wang, D.; Wang, B.; Chen, X.; Pombo, J. Vibration Reduction in Ballasted Track Using Ballast Mat: Numerical and Experimental Evaluation by Wheelset Drop Test. Appl. Sci. 2022, 12, 1844. [Google Scholar] [CrossRef]
  22. François, S.; Pyl, L.; Masoumi, H.R.; Degrande, G. The Influence of Dynamic Soil-Structure Interaction on Traffic Induced Vibrations in Buildings. Soil Dyn. Earthq. Eng. 2007, 27, 655–674. [Google Scholar] [CrossRef]
  23. Auersch, L. Dynamic Stiffness of Foundations on Inhomogeneous Soils for a Realistic Prediction of Vertical Building Resonance. J. Geotech. Geoenviron. Eng. 2008, 134, 328–340. [Google Scholar] [CrossRef]
  24. Kuo, K.A.; Papadopoulos, M.; Lombaert, G.; Degrande, G. The Coupling Loss of a Building Subject to Railway Induced Vibrations: Numerical Modelling and Experimental Measurements. J. Sound Vib. 2019, 442, 459–481. [Google Scholar] [CrossRef]
  25. Sanayei, M.; Zhao, N.; Maurya, P.; Moore, J.A.; Zapfe, J.A.; Hines, E.M. Prediction and Mitigation of Building Floor Vibrations Using a Blocking Floor. J. Struct. Eng. 2012, 138, 1181–1192. [Google Scholar] [CrossRef]
  26. Sanayei, M.; Zhao, N.; Maurya, P.; Moore, J.A.; Zapfe, J.A.; Hines, E.M. Impedance modeling for prediction of train induced floor vibrations. In Proceedings of the Structures Congress, Las Vegas, NV, USA, 14–16 April 2011; pp. 371–382. [Google Scholar]
  27. Sanayei, M.; Maurya, P.; Zhao, N.; Moore, J.A. Impedance Modeling: An Efficient Modeling Method for Prediction of Building Floor Vibrations. In Proceedings of the 2012 Structures Congress, Chicago, IL, USA, 29–31 March 2012; pp. 886–897. [Google Scholar]
  28. Colaço, A.; Costa, P.A.; Castanheira-Pinto, A.; Amado-Mendes, P.; Calçada, R. Experimental Validation of a Simplified Soil-Structure Interaction Approach for the Prediction of Vibrations in Buildings Due to Railway Traffic. Soil Dyn. Earthq. Eng. 2021, 141, 106499. [Google Scholar] [CrossRef]
  29. Systèmes, D. Abaqus 6.14: Abaqus/CAE User’s Guide. 2014. Available online: https://www.3ds.com/products-services/simulia/services-support/support/documentation/ (accessed on 6 November 2020).
  30. Zakeri, J.; Esmaeili, M.; Mousavi-Rahimi, M. Effect of Foundation Shape and Properties of the Adjacent Buildings on the Railway-Induced Vibrations. Asian J. Civ. Eng. 2020, 21, 1095–1108. [Google Scholar] [CrossRef]
  31. Xia, H.; Chen, J.; Wei, P.; Xia, C.; De Roeck, G.; Degrande, G. Experimental Investigation of Railway Train-Induced Vibrations of Surrounding Ground and a Nearby Multi-Story Building. Earthq. Eng. Eng. Vib. 2009, 8, 137–148. [Google Scholar] [CrossRef]
  32. Aklik, P.; Idinger, W.; Wu, W. Modelling face stability of a shallow tunnel in a geotechnical centrifuge. In Proceedings of the 7th International Conference on Physical Modelling in Geotechnics, Zurich, Switzerland, 28 June–1 July 2010; pp. 531–536. [Google Scholar]
  33. Kouroussis, G.; Verlinden, O.; Conti, C. Ground Propagation of Vibrations from Railway Vehicles Using a Finite/Infinite-Element Model of the Soil. Proc. Inst. Mech. Eng. Part F J. Rail Rapid Transit. 2009, 223, 405–413. [Google Scholar] [CrossRef]
  34. Kouroussis, G.; Van Parys, L.; Conti, C.; Verlinden, O. Using Three-Dimensional Finite Element Analysis in Time Domain to Model Railway-Induced Ground Vibrations. Adv. Eng. Softw. 2014, 70, 63–76. [Google Scholar] [CrossRef]
  35. Sulaeman, A. The Use of Lightweight Concrete Piles for Deep Foundation on Soft Soils. Ph.D. Thesis, Civil Engineering, University of Tun Hussein Onn, Parit Raja, Malaysia, 2010. [Google Scholar]
  36. Tabatabaiefar, H.R. Detail Design and Construction Procedure of Laminar Soil Containers for Experimental Shaking Table Tests. Int. J. Geotech. Eng. 2016, 10, 328–336. [Google Scholar] [CrossRef]
  37. Sanayei, M.; Moore, J.A.; Brett, C.R. Measurement and Prediction of Train-Induced Vibrations in a Full-Scale Building. Eng. Struct. 2014, 77, 119–128. [Google Scholar] [CrossRef]
  38. Lombardi, D.; Bhattacharya, S.; Scarpa, F.; Bianchi, M. Dynamic Response of a Geotechnical Rigid Model Container with Absorbing Boundaries. Soil Dyn. Earthq. Eng. 2015, 69, 46–56. [Google Scholar] [CrossRef]
  39. Garnier, J.; Gaudin, C.; Springman, S.M.; Culligan, P.J.; Goodings, D.; Konig, D.; Kutter, B.; Phillips, R.; Randolph, M.F.; Thorel, L. Catalogue of Scaling Laws and Similitude Questions in Geotechnical Centrifuge Modelling. Int. J. Phys. Model. Geotech. 2007, 7, 1–23. [Google Scholar] [CrossRef]
  40. Hassoun, M.; Villard, P.; Al Heib, M.; Emeriault, F. Soil Reinforcement with Geosynthetic for Localized Subsidence Problems: Experimental and Analytical Analysis. Int. J. Geomech. 2018, 18, 4018133. [Google Scholar] [CrossRef]
  41. Asha, M.N. Application of Particle Image Velocimetry to Study Pile Soil Interaction. Stress 2016, 1, 10. [Google Scholar]
  42. Esmaeili, M.; Gharouni-Nik, M.; Khajehei, H. Evaluation of Deep Soil Mixing Efficiency in Stabilizing Loose Sandy Soils Using Laboratory Tests. Geotech. Test. J. 2014, 37, 817–827. [Google Scholar] [CrossRef]
  43. Esmaeili, M.; Astaraki, F.; Khajehei, H. Laboratory Investigation on the Effect of Microsilica Additive on Mechanical Properties of Deep Soil Mixing Columns in Loose Sandy Soils. Eur. J. Environ. Civ. Eng. 2020, 24, 321–335. [Google Scholar] [CrossRef]
  44. Moghadam, M.R.; Baziar, M.H. Seismic Ground Motion Amplification Pattern Induced by a Subway Tunnel: Shaking Table Testing and Numerical Simulation. Soil Dyn. Earthq. Eng. 2016, 83, 81–97. [Google Scholar] [CrossRef]
  45. Esmaeili, M.; Ebrahimi, H.; Sameni, M.K. Experimental and Numerical Investigation of the Dynamic Behavior of Ballasted Track Containing Ballast Mixed with TDA. Proc. Inst. Mech. Eng. Part. F J. Rail Rapid Transit. 2018, 232, 297–314. [Google Scholar] [CrossRef] [Green Version]
  46. Adam, M.; Von Estorff, O. Reduction of Train-Induced Building Vibrations by Using Open and Filled Trenches. Comput. Struct. 2005, 83, 11–24. [Google Scholar] [CrossRef]
  47. Persson, P.; Persson, K.; Sandberg, G. Numerical Study of Reduction in Ground Vibrations by Using Barriers. Eng. Struct. 2016, 115, 18–27. [Google Scholar] [CrossRef]
  48. Hanson, C.E.; Towers, D.A.; Meister, L.D.; Miller, H.M. Transit Noise and Vibration Impact Assessment, Relatório Técnico; US Department of Transportation: Washington, DC, USA, 2006. [Google Scholar]
Figure 1. Dimensions and local bending mode frequencies of the floors in the prototype structure: (a) prototype structural dimensions and (b) fundamental frequencies of the fifth, third, and first floor related to the local bending mode shapes.
Buildings 12 00604 g001aBuildings 12 00604 g001b
Figure 2. Adequate model built from structural steel.
Buildings 12 00604 g002
Figure 3. Schematic representation of studied foundations: (a) single foundation, (b) strip foundation, (c) mat foundation, (d) A–A cross section, (e) B–B cross section, and (f) C–C cross section.
Buildings 12 00604 g003
Figure 4. Soil and container used in the physical model: (a) rigid container and absorbing boundaries, (b) sandy soil poured and compacted into the container.
Buildings 12 00604 g004
Figure 5. Scaled model with three types of foundation on the sandy soil: (a) scaled model with single foundation, (b) scaled model with strip foundation, (c) scaled model laid on the mat foundation and data recording instruments.
Buildings 12 00604 g005aBuildings 12 00604 g005b
Figure 6. Instruments located in the soil and on the floors: (a) top view of the container and experimental setup on the soil, (b) side view of the soil container, (c) instruments located on the floors.
Buildings 12 00604 g006
Figure 7. Experimental setup and instruments.
Buildings 12 00604 g007
Figure 8. Modal hammer used to apply the impulse input in certain tests.
Buildings 12 00604 g008
Figure 9. Applied impact load: (a) time history and (b) frequency content of impulse input A1.
Buildings 12 00604 g009
Figure 10. Time history and frequency contents of the FF response: (a) time history of acceleration; (b) frequency content of the FF response.
Buildings 12 00604 g010
Figure 11. Frequency content of the FF response, ACC2, ACC3, and ACC4.
Buildings 12 00604 g011
Figure 12. Frequency content of the slab response.
Buildings 12 00604 g012
Figure 13. Normalized acceleration time history at the first, third and fifth floors: (a) first floor; (b) third floor; (c) fifth floor.
Buildings 12 00604 g013
Figure 14. Frequency contents of the first, third and fifth floor responses: (a) first floor; (b) third floor; (c) fifth floor.
Buildings 12 00604 g014aBuildings 12 00604 g014b
Figure 15. Vibration RMS of the FF and first floor in the structure with single, strip and mat foundations: (a) FF; (b) first floor; (c) average RMS of FF; (d) average RMS on the first floor.
Buildings 12 00604 g015
Figure 16. TRF and RR of first floor in the structure with single, strip and mat foundations.
Buildings 12 00604 g016
Table 1. Prototype structure specifications.
Structural MembersDimensions (m)Elastic Modulus,
E   GPa
Poisson’s Ratio,
ν  
Mass Density,
ρ   kg / m 3
Total Mass,
ton
Single foundation 2 × 2 × 1 250.22500145
Column 0.5 × 0.5 × 3
Slab 6 × 6 × 0.15
Table 2. Characteristics of the FE structural model.
Structural MembersElement NameElement TypeDescription
Floor slabsS4 4-node structural elementDoubly curved general-purpose shell, finite membrane strains
ColumnsC3D88-node linear brick3D solid continuum finite elements
FoundationsC3D88-node linear brick
Table 3. Scaling relations in terms of geometric-scaling factor, λ l [13].
Mass Density1Acceleration1Length λ l
Force λ l 3 Shear wave velocity λ l 1 / 2 Stress λ l
Stiffness λ l 2 Time λ l 1 / 2 Strain1
Elastic modulus λ l Frequency λ l 1 / 2 Flexural rigidity λ l 5
Table 4. Scaled true model specifications.
Structural MembersDimensions (m)Elastic Modulus,
E   GPa
Poisson’s Ratio,
ν  
Mass Density,
ρ   kg / m 3
Total Mass,
kg
Single foundation 0.1 × 0.1 × 0.050 1.250.2250018.125
Column 0.025 × 0.025 × 0.150
Slab 0.3 × 0.3 × 0.0075
Table 5. Scaled adequate model specifications.
Structural MembersDimensions (m)Elastic Modulus,
E   GPa
Yield Stress, Y   MPa Poisson’s Ratio,
ν  
Total Mass
kg
Bar column 0.010   d × 0.200 2002300.35.77
Slab 0.297 × 0.297 × 0.001 240
Table 6. Specifications of three types of foundation in the scaled model.
Foundation TypeDimensions (m)Elastic Modulus,
E   GPa
Poisson’s Ratio,
ν  
Mass (kg)
Single 0.1 × 0.1 × 0.040 2000.312.88
Strip 0.1 × 0.013 12.85
Mat 0.4 × 0.4 × 0.010 12.78
Table 7. Specifications of Firoozkooh sand (SP) [43].
ParameterCohesionFriction AngleUnit WeightRelative Density
SymbolC φ γ Dr
UnitkPa ° kN/m3%
Value03716.370
Table 8. Response channel and accelerometer properties [45].
ChannelAccelerometer TypeModelMass (gr)Measuring Capacity (G)Frequency Range (Hz)Sensitivity (mV/m/s2)
ResponseuniaxialCA-YD-11605501–5000 10
Table 9. Input loads applied to the scaled model.
SetVibration TypeNo.Frequency Band (Hz)
AImpulseA10–156
BHarmonicB120
B230
B340
B442.5
B545
B647.5
B750
B860
B970
B1080
B1190
B12100
Table 10. Transmission factor and RMS ratio of three foundation types.
- 1 2 3 4 5
1 Foundation GeometryAverage velocity RMS (m/s) on the First Floor, ACC7Average velocity RMS (m/s) on the Soil, ACC6Transmission Factor (TRF)RMS Ratio (RR)
2 Single 2.58 × 10 6 1.80 × 10 7 14.33 1.00
3 Strip 2.37 × 10 6 13.21 0.92
4 Mat 1.20 × 10 6 6.69 0.47
Publisher’s Note: MDPI stays neutral with regard to jurisdictional claims in published maps and institutional affiliations.

