Article

Characteristics and Mechanism of Fire Spread between Full-Scale Wooden Houses from Internal Fires

Institute of Building Fire Research, China Academy of Building Research, Beijing 100013, China
*
Author to whom correspondence should be addressed.
Buildings 2022, 12(5), 575; https://doi.org/10.3390/buildings12050575
Submission received: 8 March 2022 / Revised: 21 April 2022 / Accepted: 28 April 2022 / Published: 29 April 2022
(This article belongs to the Special Issue Sustainability and Resiliency of Building Materials and Structures)

Abstract

:
In ancient villages, the spread of uninterrupted fires caused great damage to clustered wooden houses. Thus, the spread of fire among wooden houses should be systematically studied to explore its characteristics. Statistical analysis is a feasible way to study the characteristics and underlying mechanisms of fire in full-scale wooden houses. In this study, 4 full-scale wooden buildings were built in an ethnic village in Guizhou Province, and the fire spread test was conducted by igniting a 0.63-MW power wood crib. To investigate the fire spread, the visual characteristics were observed, and the temperatures and heat radiation at special locations were monitored with thermocouples and radiation flowmeters, respectively. The effect of relative slope, heat radiation, and wind direction on fire spread characteristics was established by mathematical statistics, and the measured temperatures were used to verify the statistics’ regularity. The results showed that in wooden houses, fire spread was mainly influenced by the slope, the distance between houses, and wind direction. When the inner wall of a wooden house is protected by a fireproof coating, the thermal radiation spread and fire spread are both slower. The slope and distance had the same influence weight (0.41) on fire spread; however, since they affect the process in different ways, they should be analyzed separately for fire risk evaluation. The findings of this study provide a theoretical foundation for understanding the fire spread process in wooden buildings.

1. Introduction

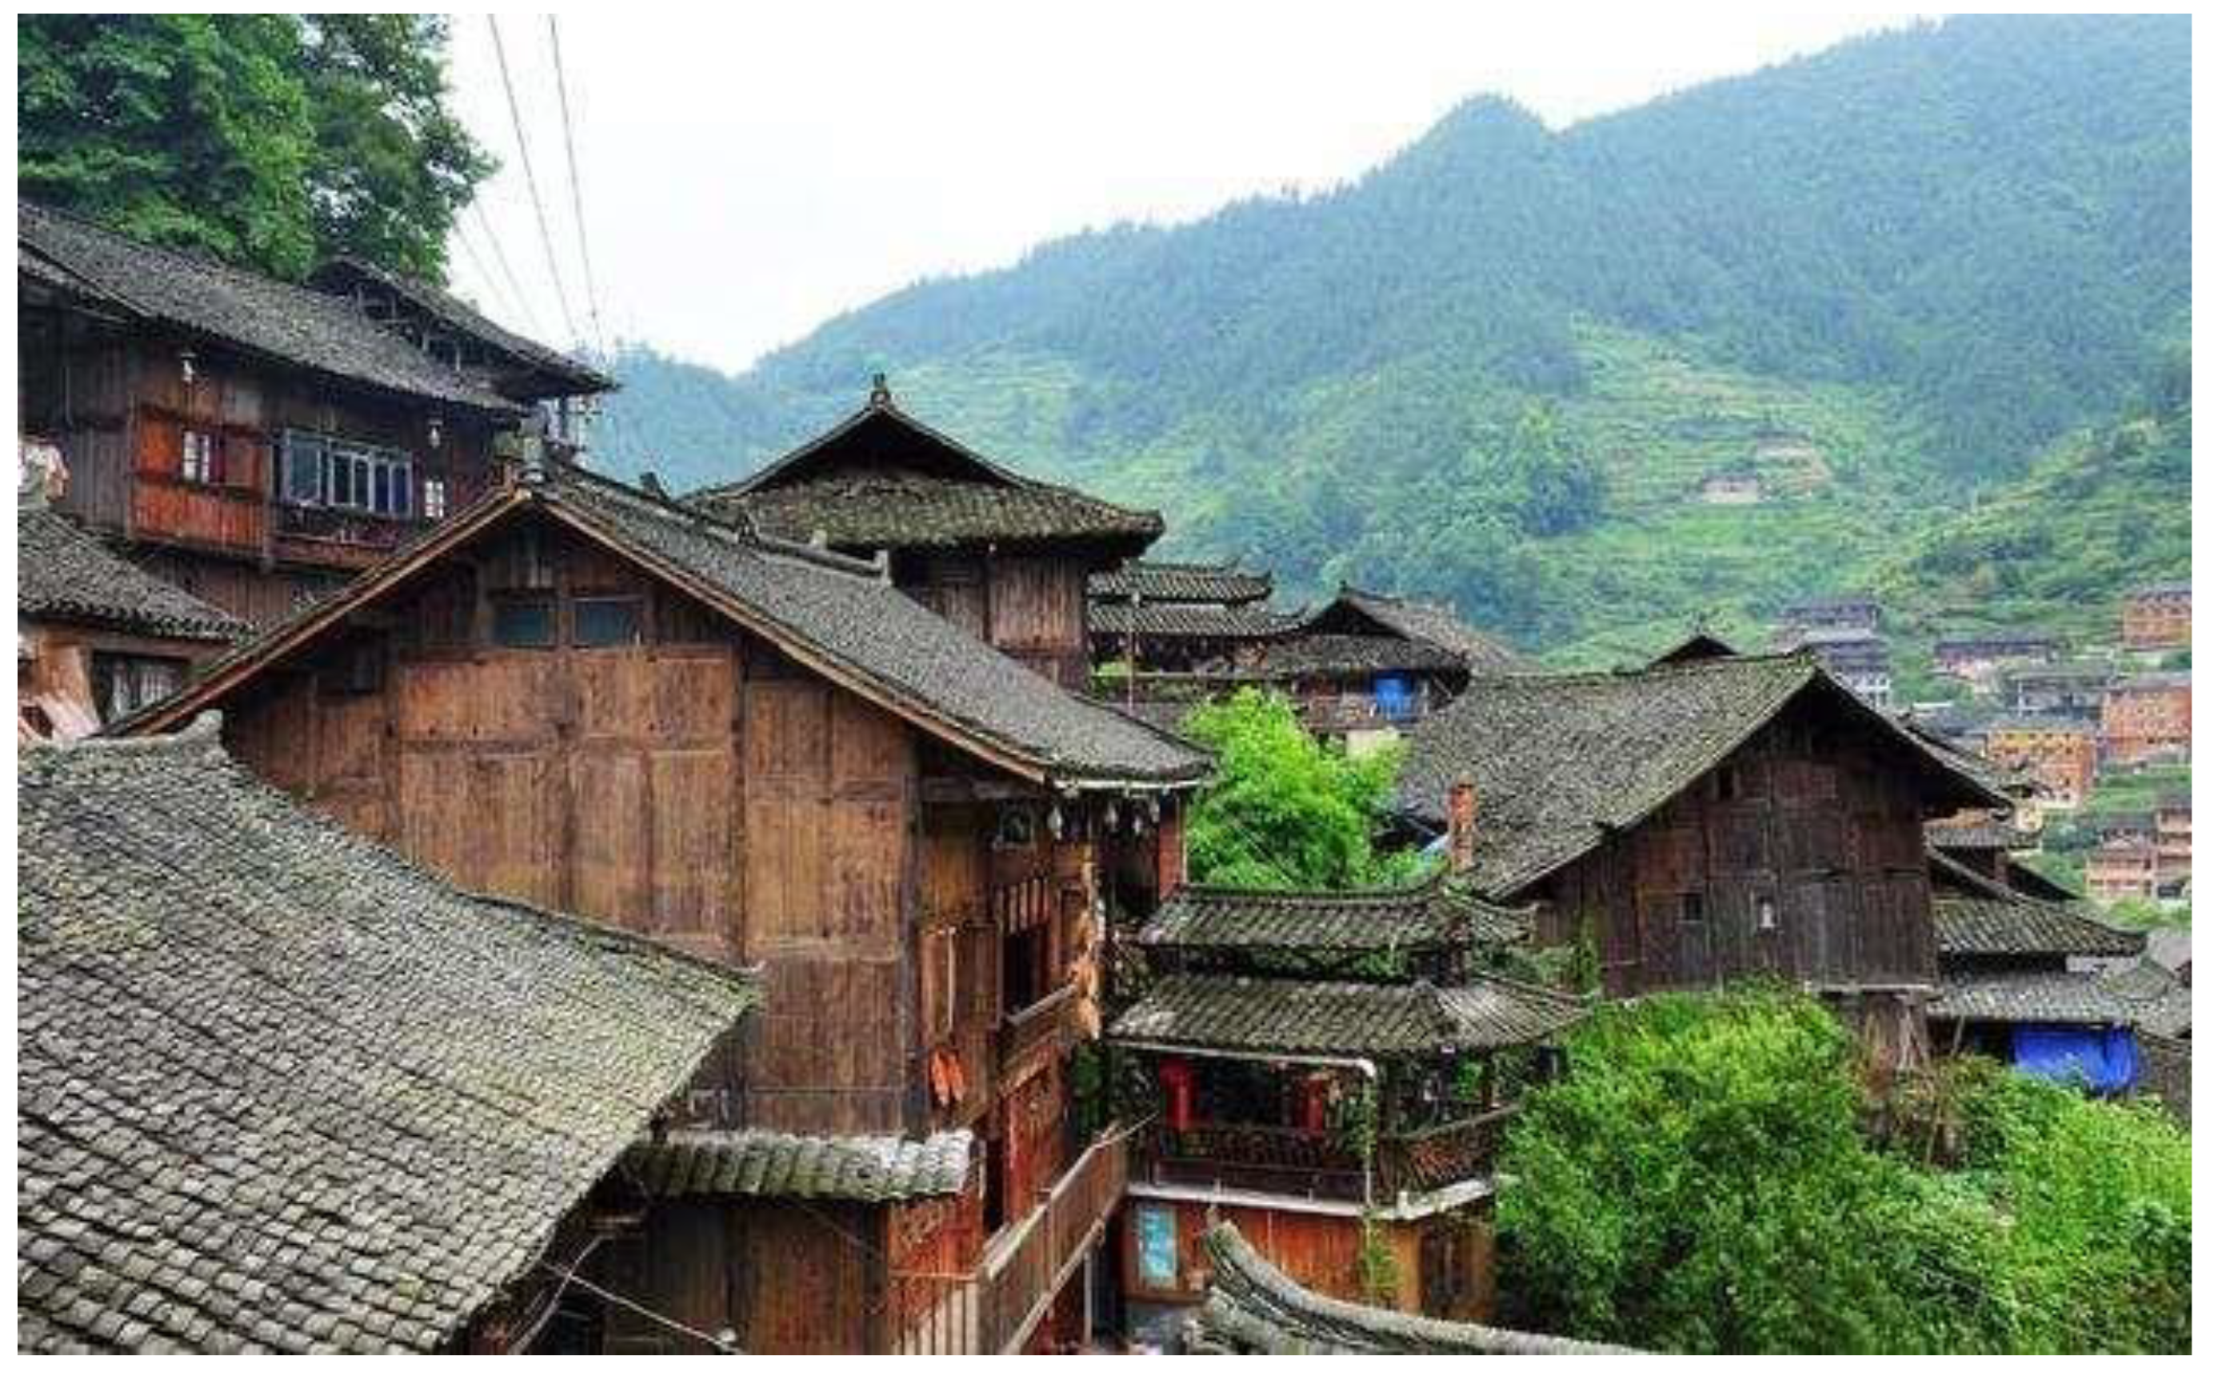
1.1. Introduction to Fire Spread of Wooden Houses

Due to China’s long history and ethnic diversity, ancient wooden buildings with regional characteristics are widespread throughout the country [1,2,3]. These buildings have not only residential value but also are integrated into the local folklore, culture, history, economy, and natural scenery and have both historical and touristic value [4,5,6].
Figure 1 depicts one type of stilt-style architecture, which is a common style of ancient rural wooden buildings in southwest China. This type of house is often built near the mountains and is supported by wooden columns. Since this type of building is composed of stacked wood, they are at high risk of fire [7]. When uninterrupted fires occurred in ancient villages, the fire spread caused great damage to clustered wooden houses [8]. Deteriorated wooden buildings might have a greater possibility of catching fire when they contact open flame [9,10,11]. However, the current fire protection force in rural areas is still relatively weak, mainly due to a lack of public firefighting facilities, a lack of firefighting management, low firefighting awareness among villagers, and difficulties in external firefighting rescue [12]. Unlike wildfire spread in grass and forests, wooden houses are prone to igniting from the building’s interior [13]. The internal fire process consists of ignition, flashover, full development, collapse, and extinguishment. This happens quickly, causes great damage, and harms people’s safety and lives [14,15]. Traditional small-scale experiments cannot objectively and accurately reproduce the fire spread characteristics of wooden building clusters [5,16]. Therefore, it is important to adopt a full-scale experimental approach for fire spread research on wooden houses.

1.2. Literature for Wooden Houses Research

Several studies have investigated the fire spread characteristics of wooden building clusters in China and other countries. Hasemi [17] discussed the fire spread characteristics of three-story wood houses using a full-scale experimental approach, while Matthew et al. [18] found that fires of intermediate size were negatively associated with relative humidity. Zhang et al. [19] studied the thermo-mechanism behavior of wooden joints under fire exposure. Kristoffersen et al. [11] summarized improving the fire protection of wooden buildings with limited additional costs. Bartlett et al. [11] presented the pyrolysis, ignition, and combustion processes associated with wood products. Li et al. [20] conducted an in-depth study on fire safety planning and strategies for rural ancient building groups in Japan; moreover, Maraveas et al. [21] studied the factors influencing the fire resistance of wood-based houses. Stubbs et al. [22] found that flame height and surface area increased significantly with wood materials but also approached asymptotic values.
Until now, only a few full-scale studies have focused on the fire hazard of multiple wooden houses in China. Notably, the smoke concentration and the temperature distribution during fire spread are closely related to a series of conditions [23,24], such as the fire separation between adjacent buildings [25], the combustion structure [26], the relative slope [27], the roof temperature [28], the external wind speed at the time of fire [29], the moisture content of wood [30], and the atmospheric temperature [31,32]. Therefore, the main factors influencing fire spread need to be analyzed by actual fire tests [33,34]. Traditionally, fire spread tests have been based on small-sized models of wooden structures [35,36]. Although these studies have provided a basic theoretical understanding of the fire spread phenomenon, they focused less on wind speed and space temperature; therefore, their results were not completely realistic [37,38].
Fire spread in full-size buildings have been studied mainly considering the material [39], geometry [39], ventilation [40], boundary properties [26,41,42], and wood structures [43,44]. Their studies have systematically analyzed how these factors affected the spread of fire in full-scale buildings. However, these factors were analyzed by a simple variable method, and only a few studies have investigated the main factors influencing the fire spread process by statistical theory, which could further study the inter-correlations among these factors. Additionally, the tendencies of fire spread when these factors are simultaneously varied are not yet known. Thus, the aim of this study was to (i) investigate the fire spread in wooden houses when multiple factors simultaneously varied; (ii) analyze the main factors influencing fire spread by statistical theory; (iii) provide fire protection suggestions for wooden houses in the ethnic villages of China.

1.3. Brief Description of This Experiment

In this study, we studied the actual fire spread process in 4 full-scale wooden houses by igniting a 0.63-MW power wood crib. Four full-size wooden houses were built on a vacant lot in an ethnic village in Guizhou Province. The fire spread, temperature, and heat radiation were monitored, and the factors, i.e., relative distance, height, relative slope, and wind direction, influencing fire spread were investigated. Subsequently, the statistical software Statistical Product Service Solutions (SPSS) was used on the measured temperature and radiation; analysis of cluster and dimension reduction were used as the main methods. Finally, the analysis result by SPSS was verified by the detection results. The findings of this study will provide a theoretical foundation for understanding fire spread in wooden houses.

2. Materials and Methods

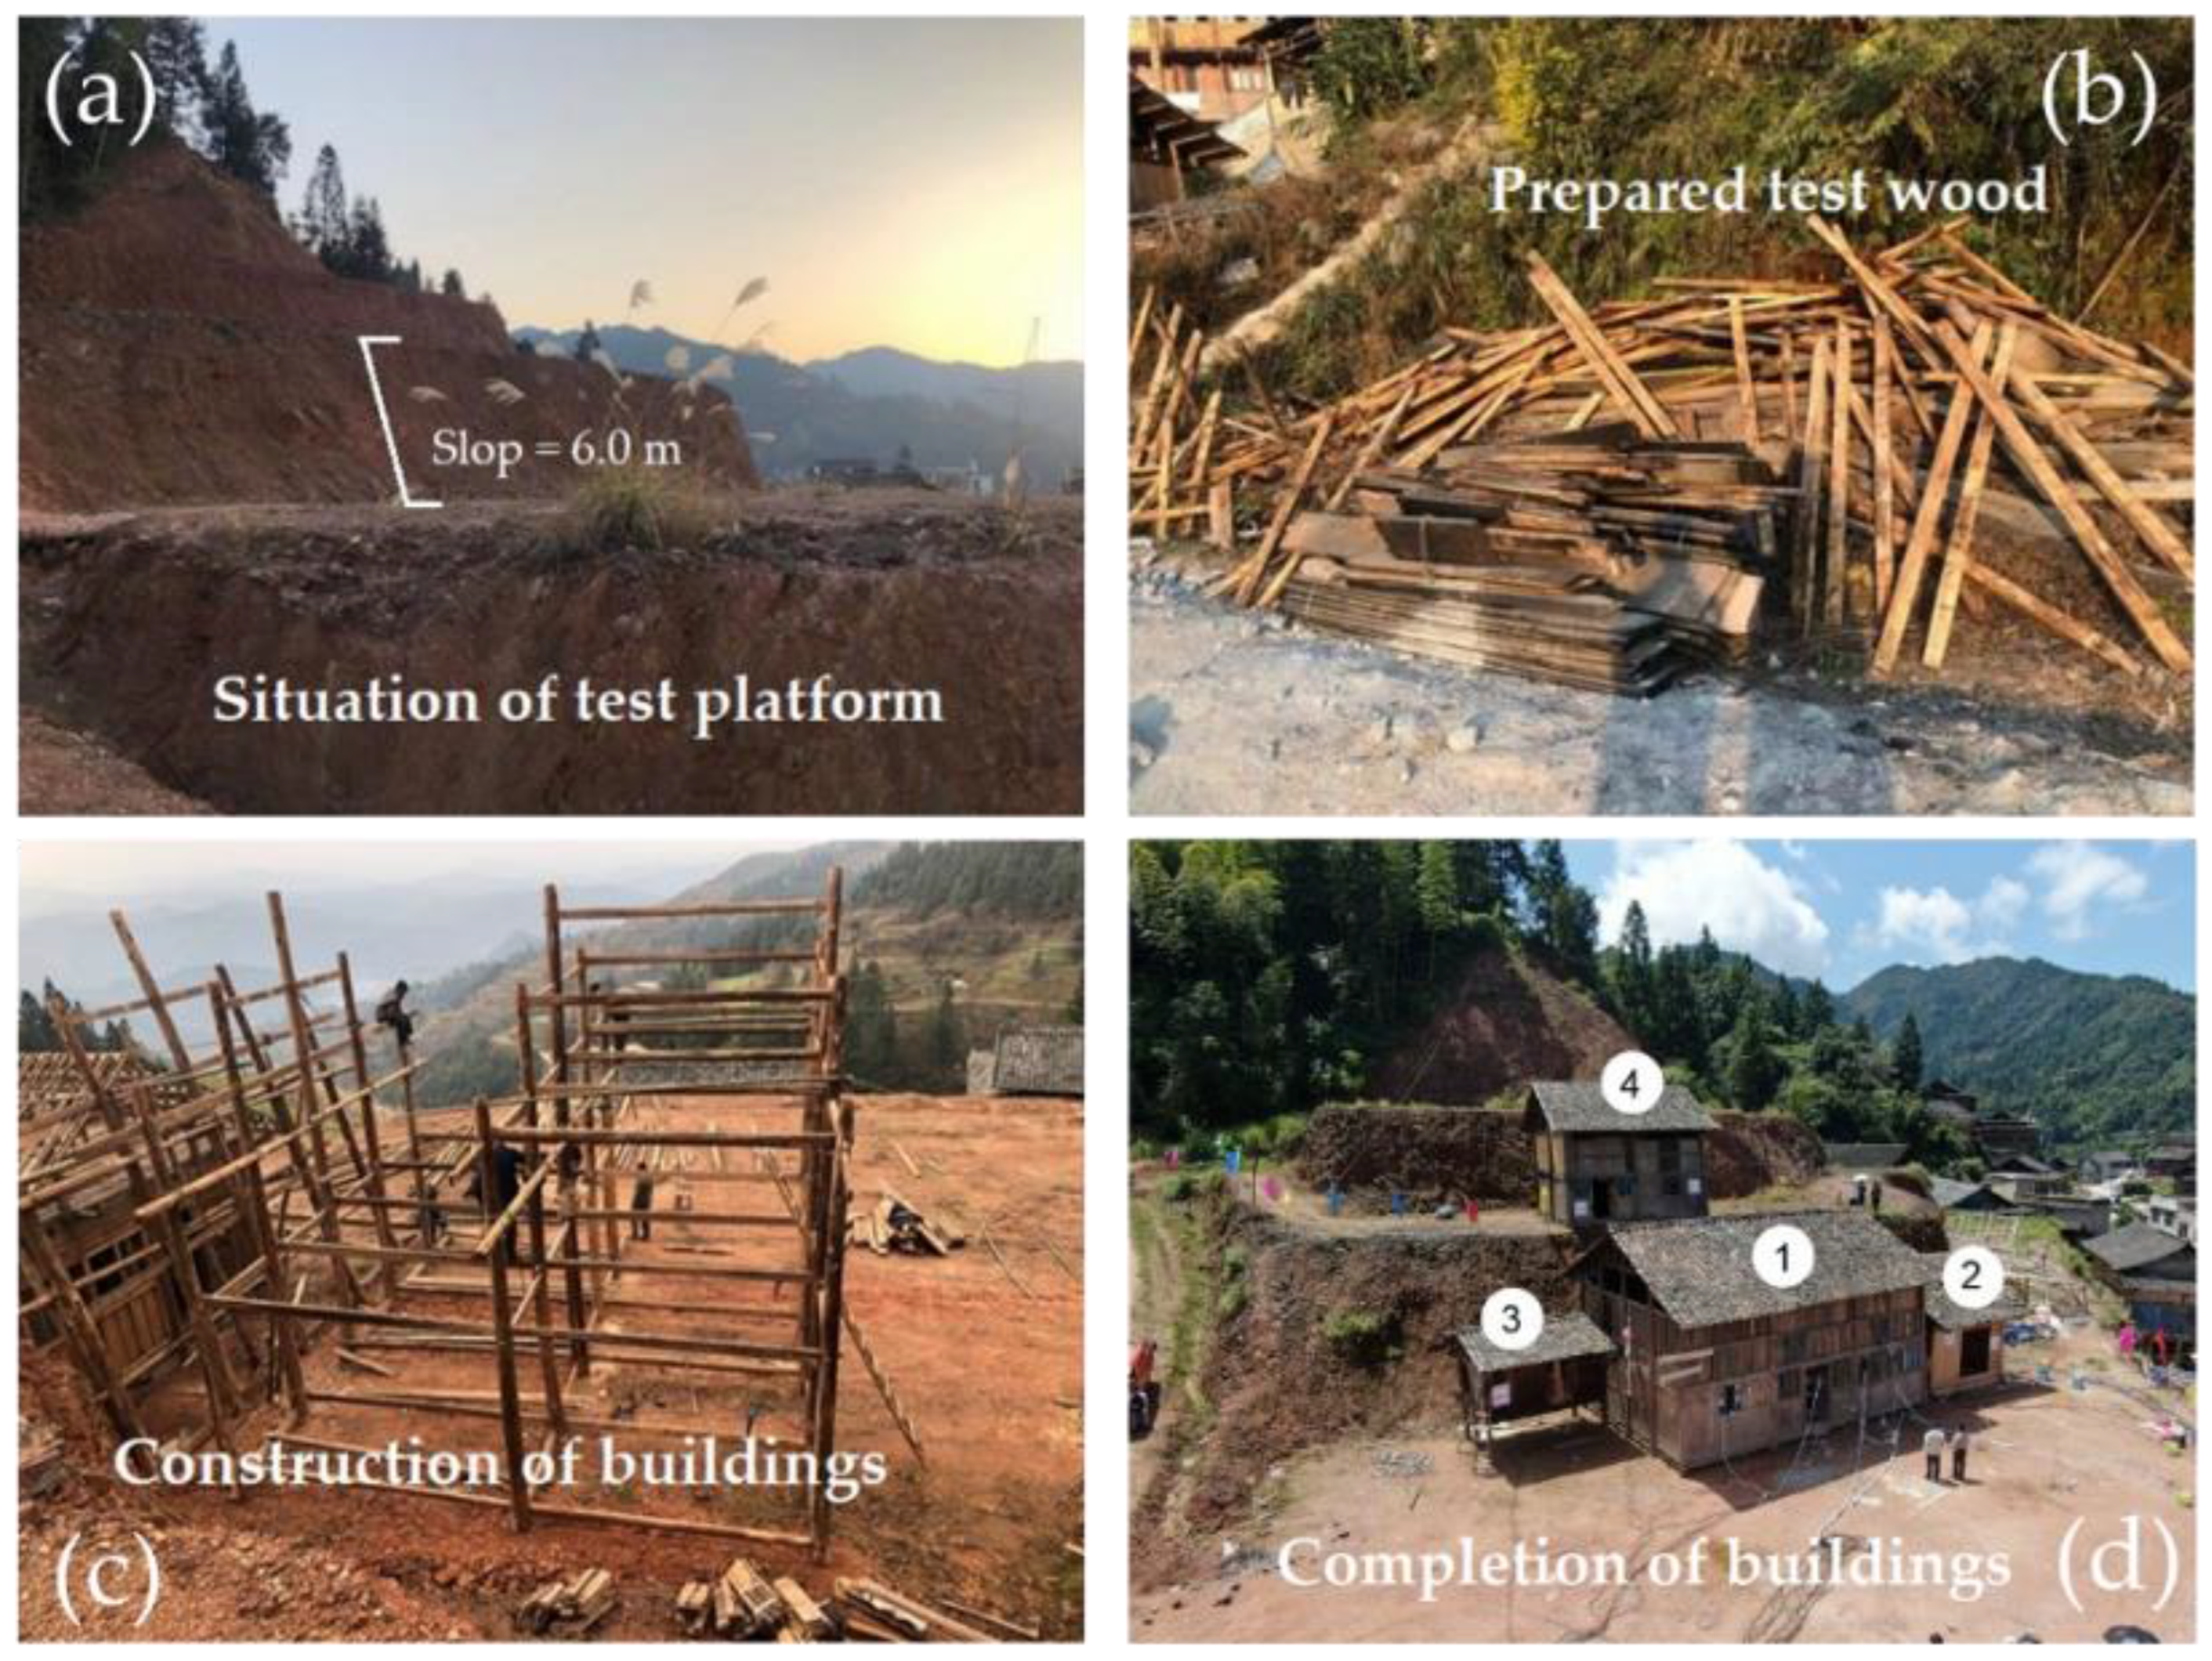
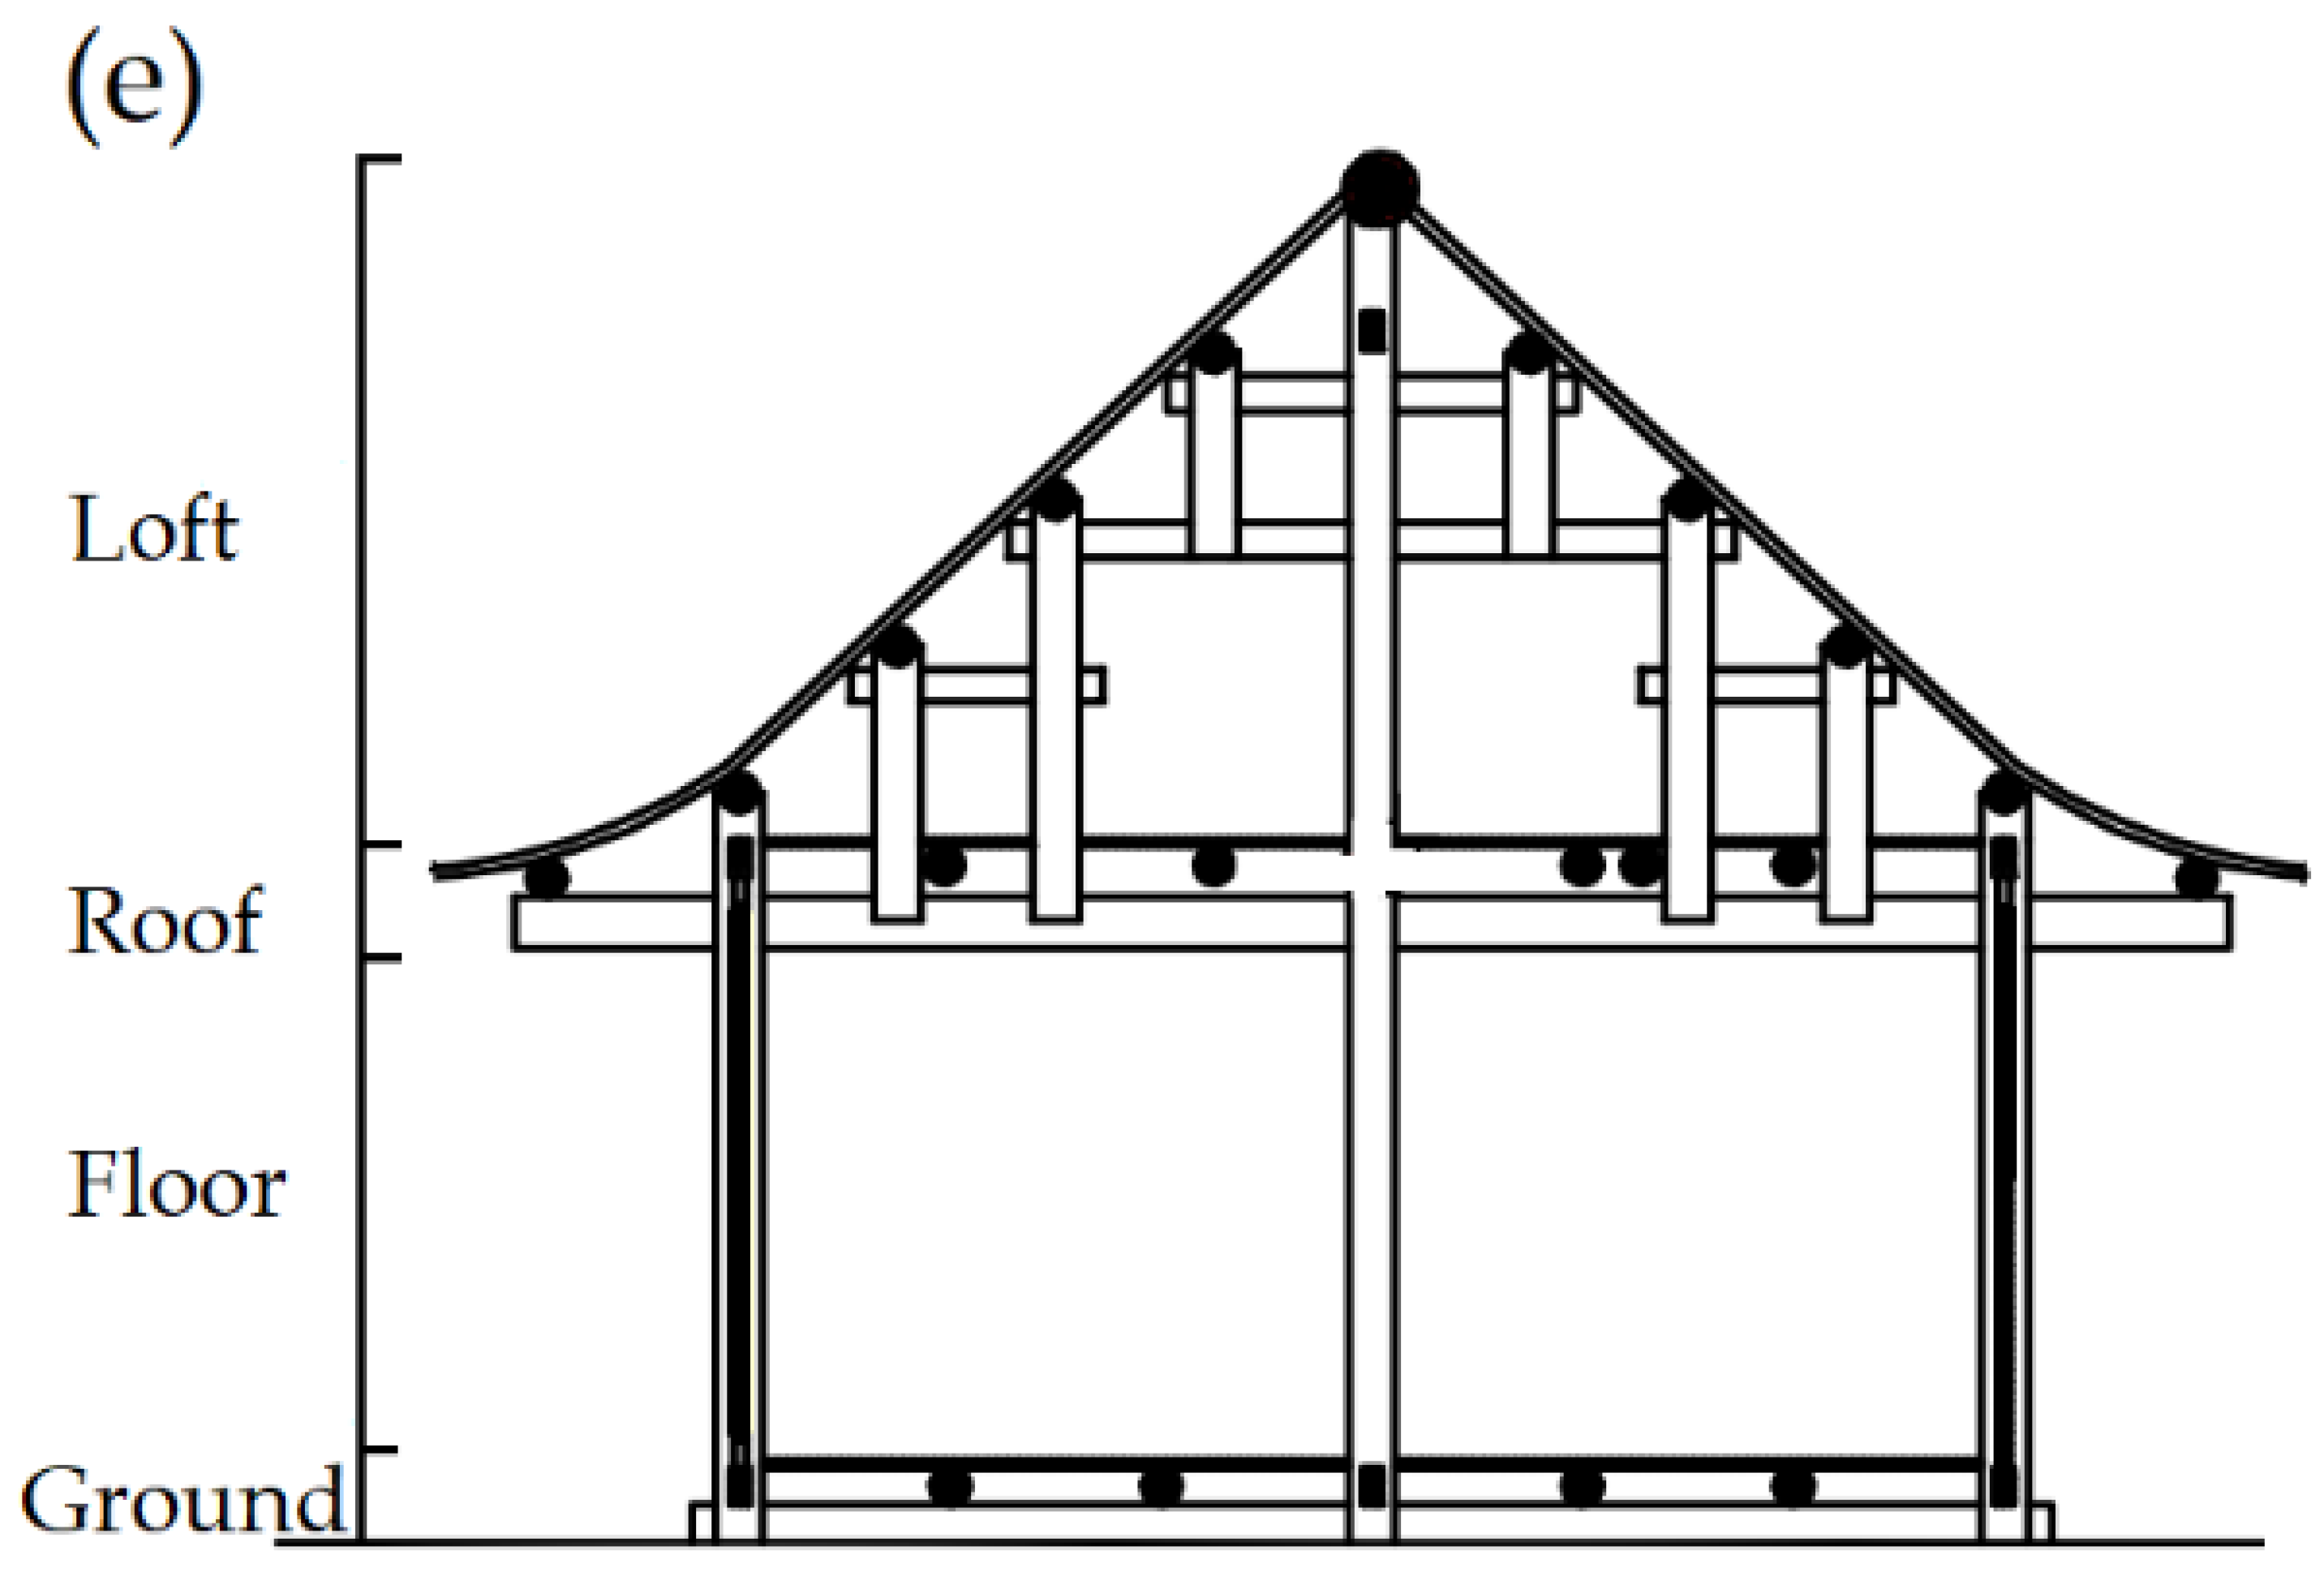
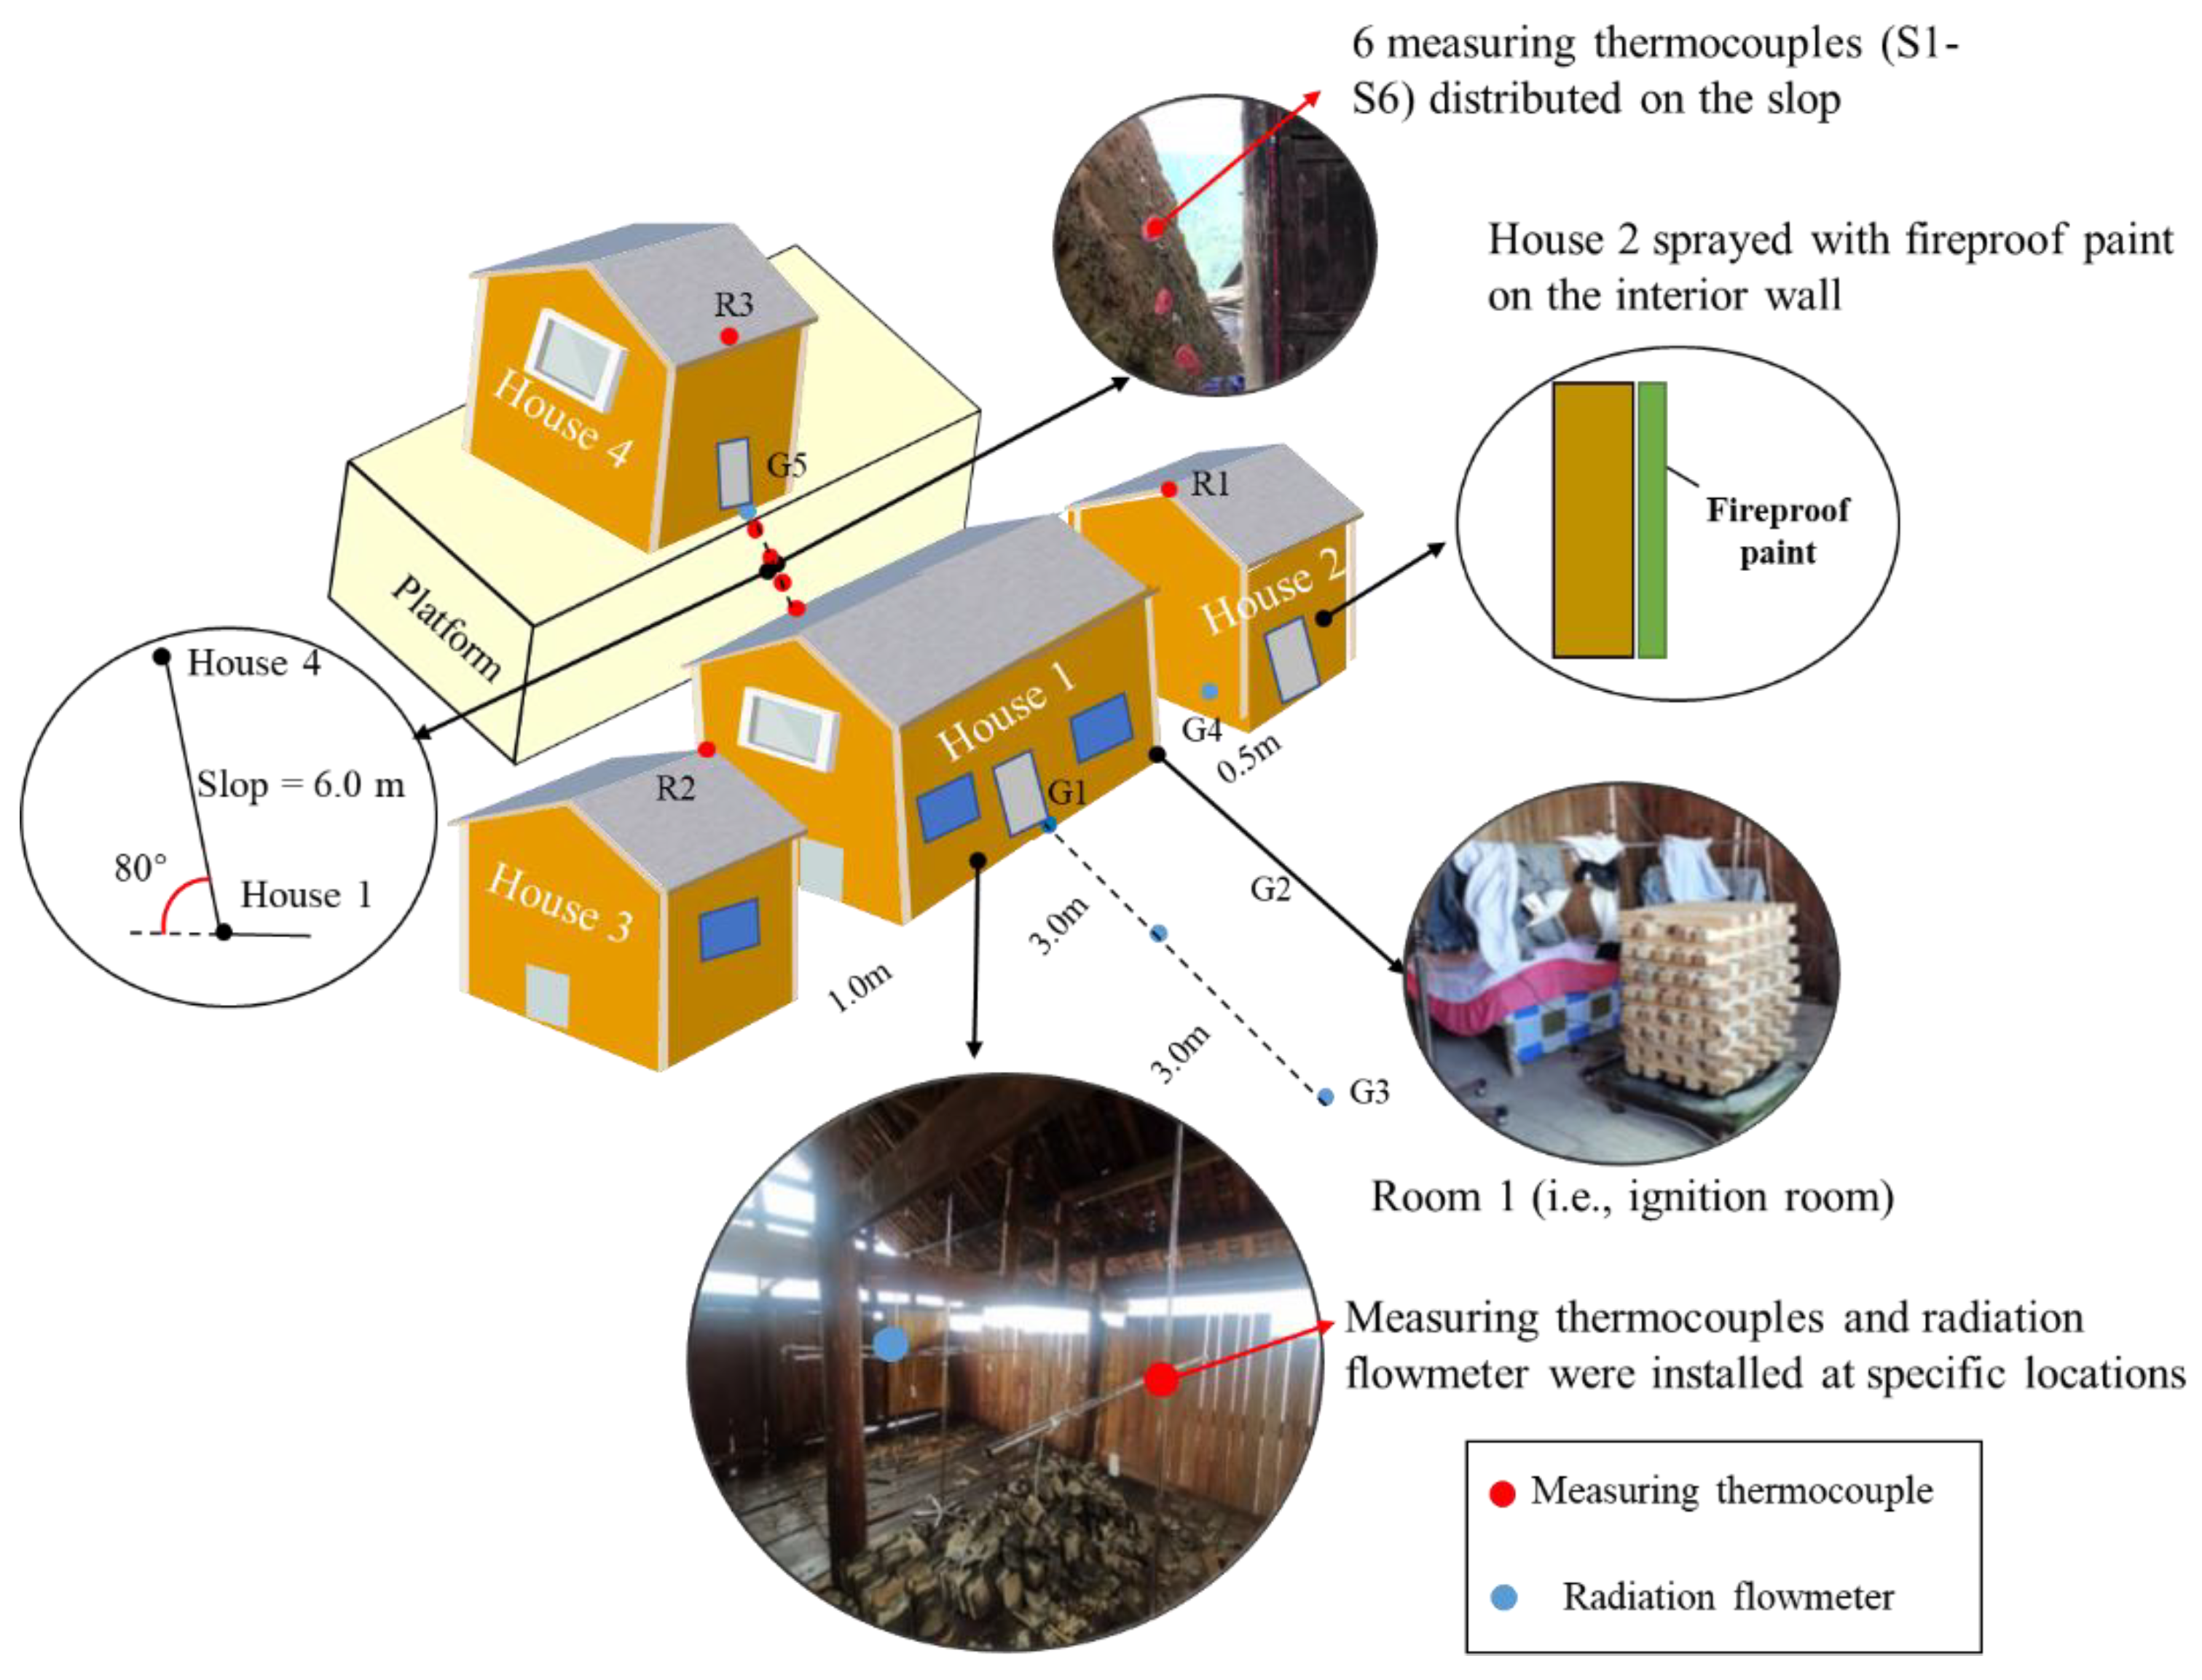
2.1. Construction and Test Environment of the Wooden Houses

The test site was located on a vacant lot characterized by yellow mud in a village in Southeastern Miao and Dong Autonomous Prefecture (Guizhou Province, China). A 6.0 m high platform, backed by a wooded area, was positioned north of the site (Figure 2a).
In order to improve the accuracy of the experiment, after field investigation, four representative adjacent wooden houses were selected as models for the experimental wooden houses. The building size, separation distance between houses, and architectural structure were based on the models. The wood used for the test construction was taken from a wooden building that had been inhabited for more than 10 years (Figure 2b). A total of 4 wooden buildings (1–4) were erected for the test. Their structural frames, roof covers, floor slabs, beams, and other structural elements were composed mainly of wood (Figure 2c,d). Figure 2d shows the side structure of one of the buildings. The space between the floor and the ceiling of the living space was 2.3 m, and the space between the ceiling and the roof (i.e., the loft) was 2.7 m. Notably, the loft was partially open (i.e., the building created a non-completely confined space); moreover, the rooms and the loft of all the buildings had the same height (Figure 2d). The four buildings were exactly made of the same materials. The walls were composed of two parts, outer and inner wood panel walls. In addition, Houses 1 and 4 had 2 floors (floor areas of 75.52 m2 and 42.24 m2, respectively), while Houses 2 and 3 had only 1 floor (floor areas of 20.67 m2 and 42.24 m2, respectively).

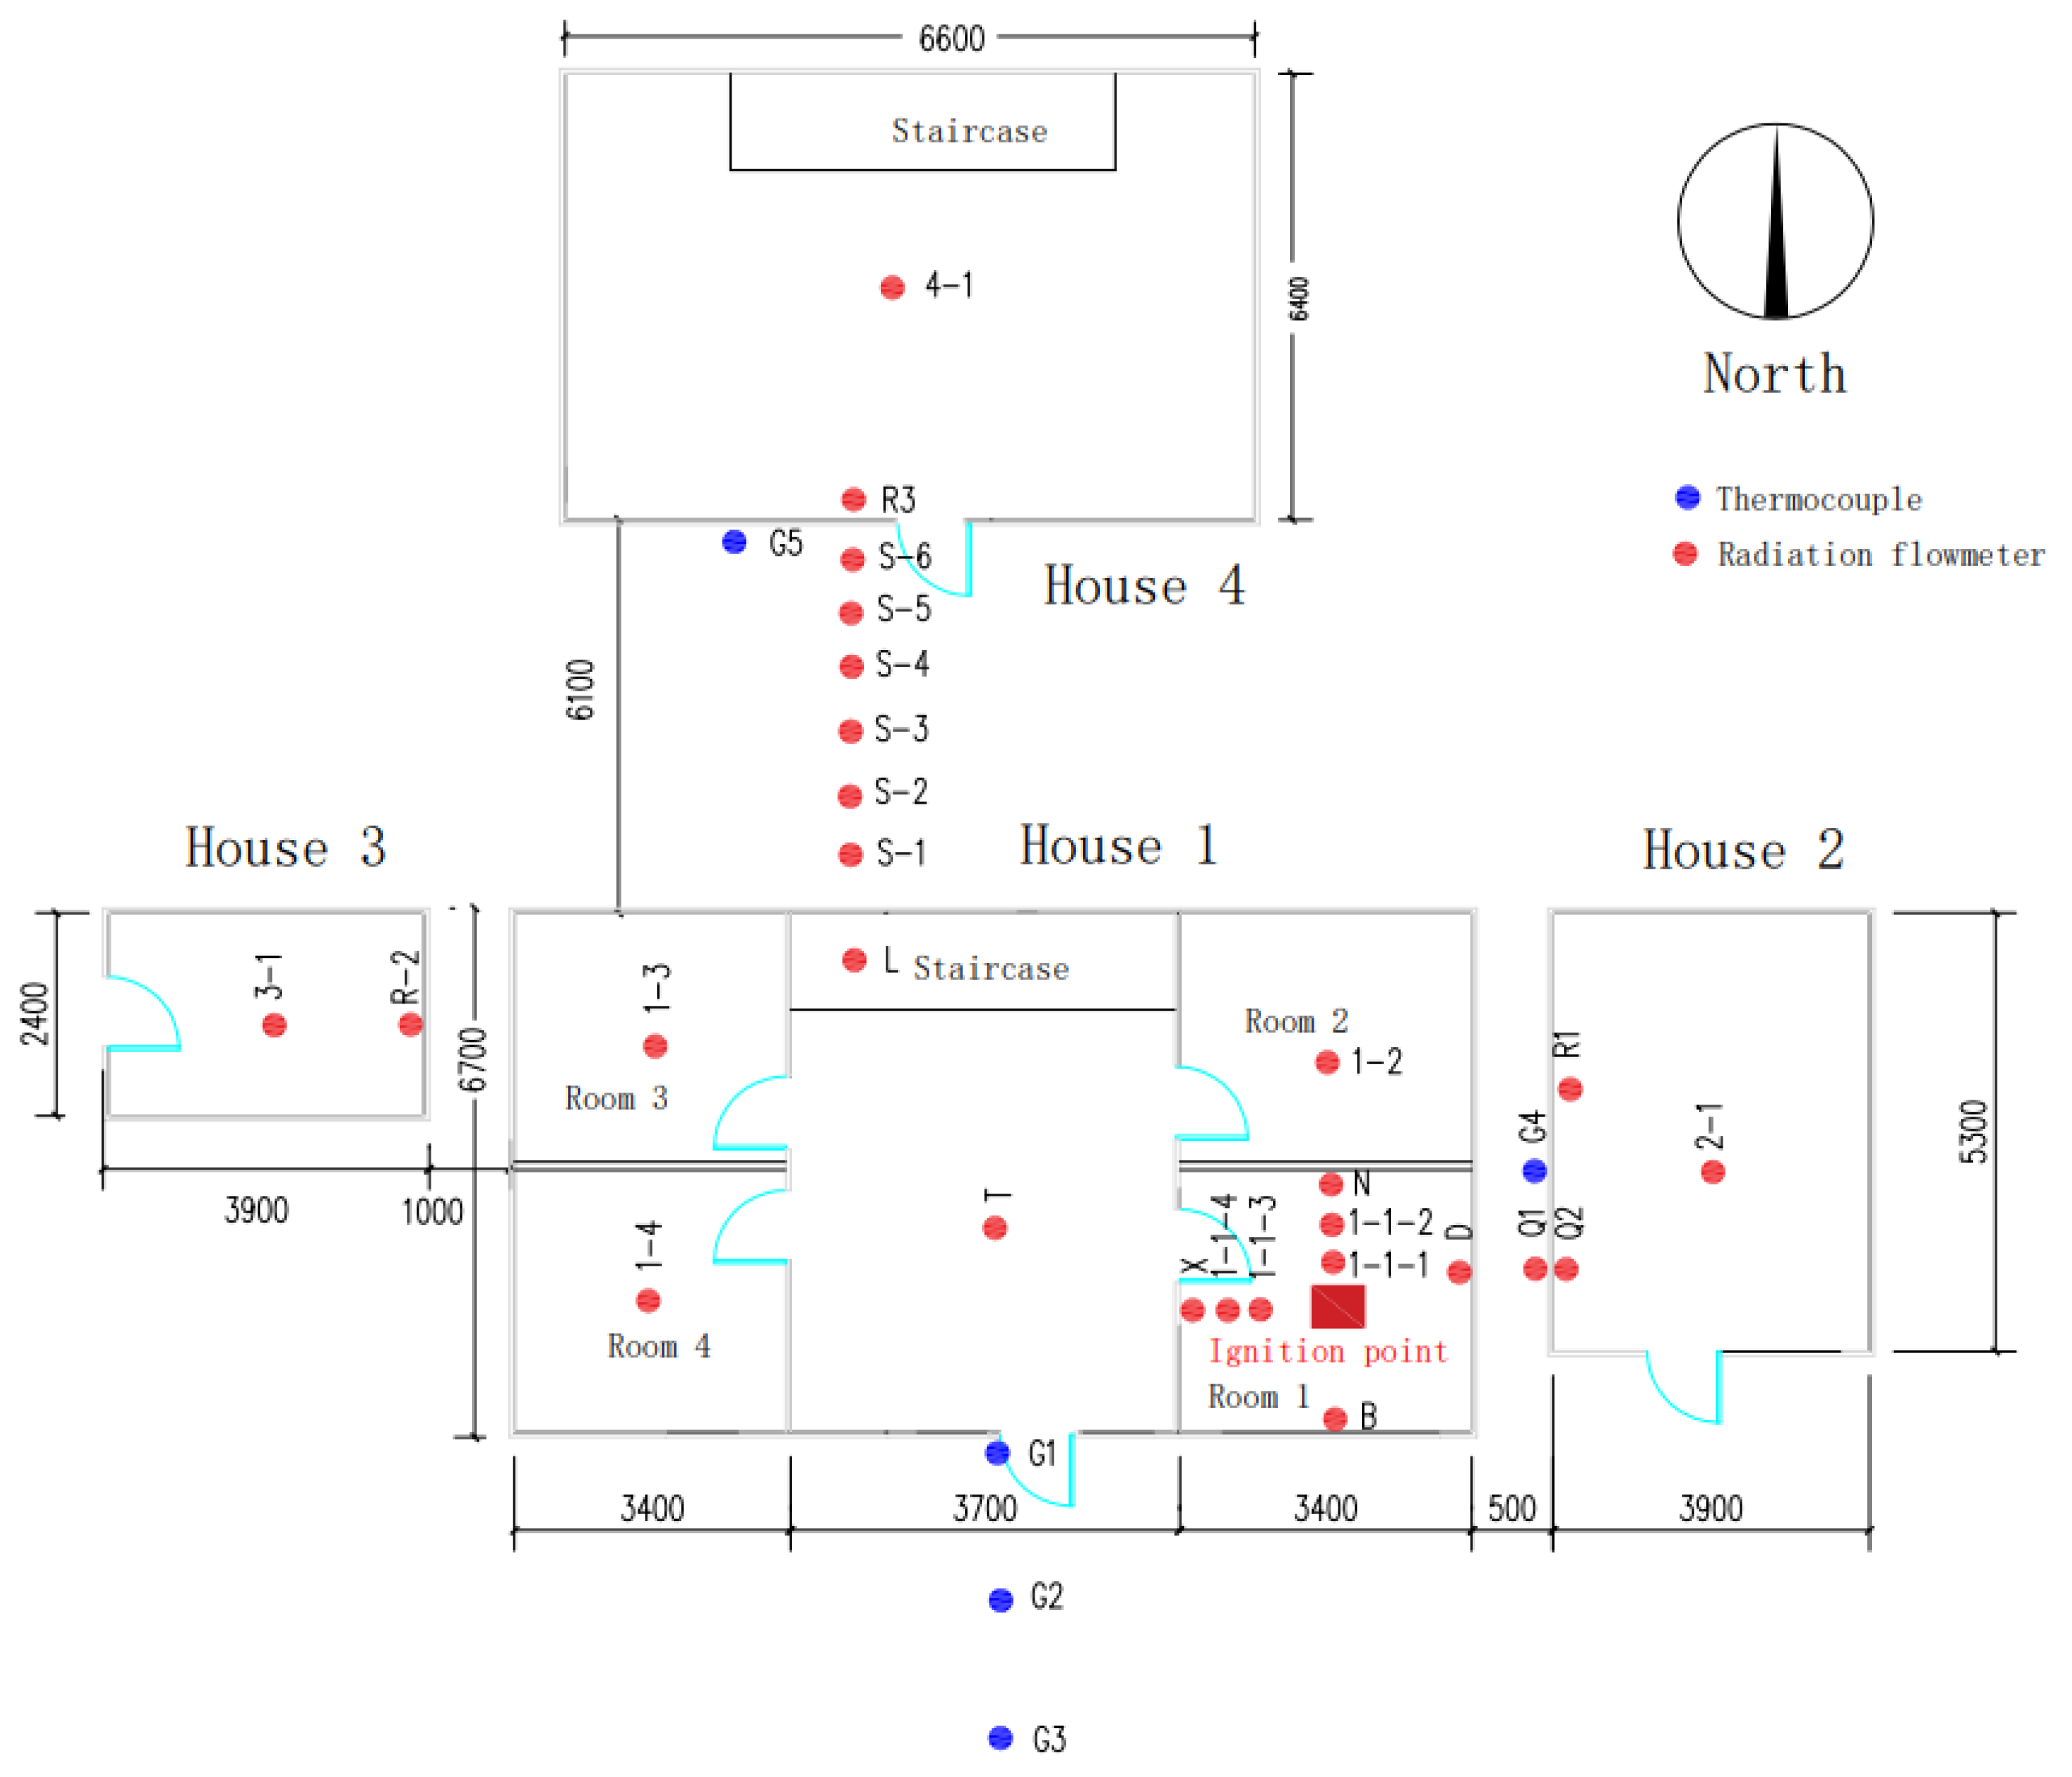
2.2. Arrangement of the Test Points

A layout of the experimental site and the arrangement of test points are shown in Figure 3. House 1 (i.e., the ignition building) had 2 floors, with 4 rooms on the first floor; notably, the rooms on the second floor were intercommunicating. For free burning conditions, these cribs would have had a maximum surface-controlled mass loss rate (MLR) of 0.39 kg/s combined, according to [19].
A total of 80 wood cribs (about 25.0 Kg) with the dimension of 250 mm × 25 mm × 25 mm (length × weight × height) were set as the fire source according to [15]. The heat of combustion of wood cribs used was 17 MJ/kg as measured by a bomb calorimeter, thus giving a maximum surface-controlled heat release rate of 0.63 MW.
The location of rooms 1, 2, 3, and 4 is shown in Figure 3. The center of room 1 was set as the ignition point. Temperature measuring thermocouples (type K, Omega, New York, NY, USA) were installed on the east, south, west, and north walls of room 1, with correspondent measuring points named D, N, X, and B, respectively. Additional temperature measuring thermocouples were installed at heights of 0.5, 1.0, 1.5, and 2.0 m from the floor and on the floor of room 1: the corresponding points were 1-1-1, 1-1-2, 1-1-3, 1-1-4, and L2, respectively. In room 1, at the height of 1.0 m, we positioned another temperature measuring thermocouple (E-1). The lobby, rooms 2, 3, and 4 were equipped with temperature measuring thermocouples 1.0 m above the floor, named points T, 1-2, 1-3, and 1-4, respectively. Additional temperature measuring thermocouples, named points E-2 and E-3, were located 1.0 m above the ground on the second floor directly above the hall and 1-3. Another temperature measuring thermocouple, located in the middle of the staircase against the wall, was identified as point L. At the height of 1.0 m, water-cooled radiant heat flowmeters (radiant heat flow dual-use type, Shanghai Tuxin Company, Shanghai, China) were set at the front door, at a horizontal distance of 3.0 m and 6.0 m, respectively, from the front door, named points G1, G2, and G3. The total number of thermocouples and heat flowmeter were 31 and 5, respectively, as listed in Table A1.
The distance between Houses 1 and 2 was 0.5 m (based on the position of the respective inner walls). In particular, House 2 was located to the east of House 1. In House 2, temperature measuring thermocouples were set at the height of 1.0 m from the base of the first floor, in correspondence to the inner and outer walls (points Q1 and Q2, respectively), as well as 1.0 m below the eaves (point R1). There was also a water-cooled radiant heat flow meter at the same location on the exterior wall Q1, named point G4. Notably, the interior wall of House 2 was sprayed with a halogen-free, efficient, and environmental fireproof paint (commercial products from Cuizhixin New Technology Development Co., Ltd., Suzhou, China), which has been independently fire-tested to a standard and applied to materials made of wood, paper, and plastic. Detailed information about the fireproof paint is listed in Appendix A. The dose of brushing the paint on the wall was 350 g/m2, while the exterior wall was not sprayed.
House 3 was constructed to the west of House 1, and the distance between them (measured from the respective inner walls) was 1.0 m. The interior and exterior walls of House 3 were not treated with fireproof paint. Here, 1 temperature measuring thermocouple was set at the height of 1.0 m from the floor (point 3-1), while the other was 1.0 m below the eaves (point R2), respectively.
House 1 was attached to a 6.0 m platform on the north side. This platform had a slope inclination of about 80° and a slope length of 6.1 m. Six temperature measuring thermocouples were uniformly distributed along the straight slope to measure the fire spread temperature along its length. From bottom to top, the locations of the instruments were marked as S1, S2, S3, S4, S5, and S6. House 4, whose interior and exterior walls were not fireproof, was built on the platform. This house had two floors, each containing intercommunicating rooms. Temperature measuring thermocouples were set at the height of 1.0 m from the floor and 1.0 m below the eaves on the first and second floors, named 4-1, E-4, and R3 points, respectively. The exterior wall was equipped with a water-cooled radiant heat flow meter located at the height of 1.0 m from the floor (point G5).

2.3. Test Procedure

The test took place on 23 August 2020, between 11:00 and 13:00, the temperature ranged from 21 to 28 °C, and the humidity was 91%. The weather on that day was sunny, with an east-southeast wind at the speed of 2.4–5.4 m/s. At 11:30 a.m., all the windows and doors of House 1 were opened, and a fire was lit in the center of room 1 (Figure 3). A video camera was used to film the spread of the fire in all four houses; meanwhile, the temperature measuring thermocouples monitored the temperature at different points. To ensure the accuracy of the measurements, two measuring thermocouples were installed horizontally at each measurement point, and their results were averaged. Additionally, radiation flowmeters were installed at special locations, shown in Figure 4, to monitor the heat radiation power. In the middle and late stages of the test (20 min after ignition), a professional team was asked to extinguish the fire in Houses 2 and 4 to prevent the test-fire from getting out of control.

2.4. Statistical Analysis

As shown in Figure 4, the temperature and thermal radiation results obtained from the test were verified using the software IBM SPSS 25.0 (with the Python 2.2.17 extension package); statistical analysis was conducted on the detection results using the actual measured temperature and radiation during the whole experimental process. Following the previous method [45], cluster analysis and dimension reduction analysis was applied to analyze the correlation among measured temperatures, while the algorithm of the bootstrapping method was used to obtain the confidence intervals. The cluster analysis was based on the algorithm of K-means, while the dimension reduction analysis was based on the algorithm of principal component analysis.

3. Test Results and Discussion

3.1. Analysis of the Fire Spread Patterns in the Igniting House

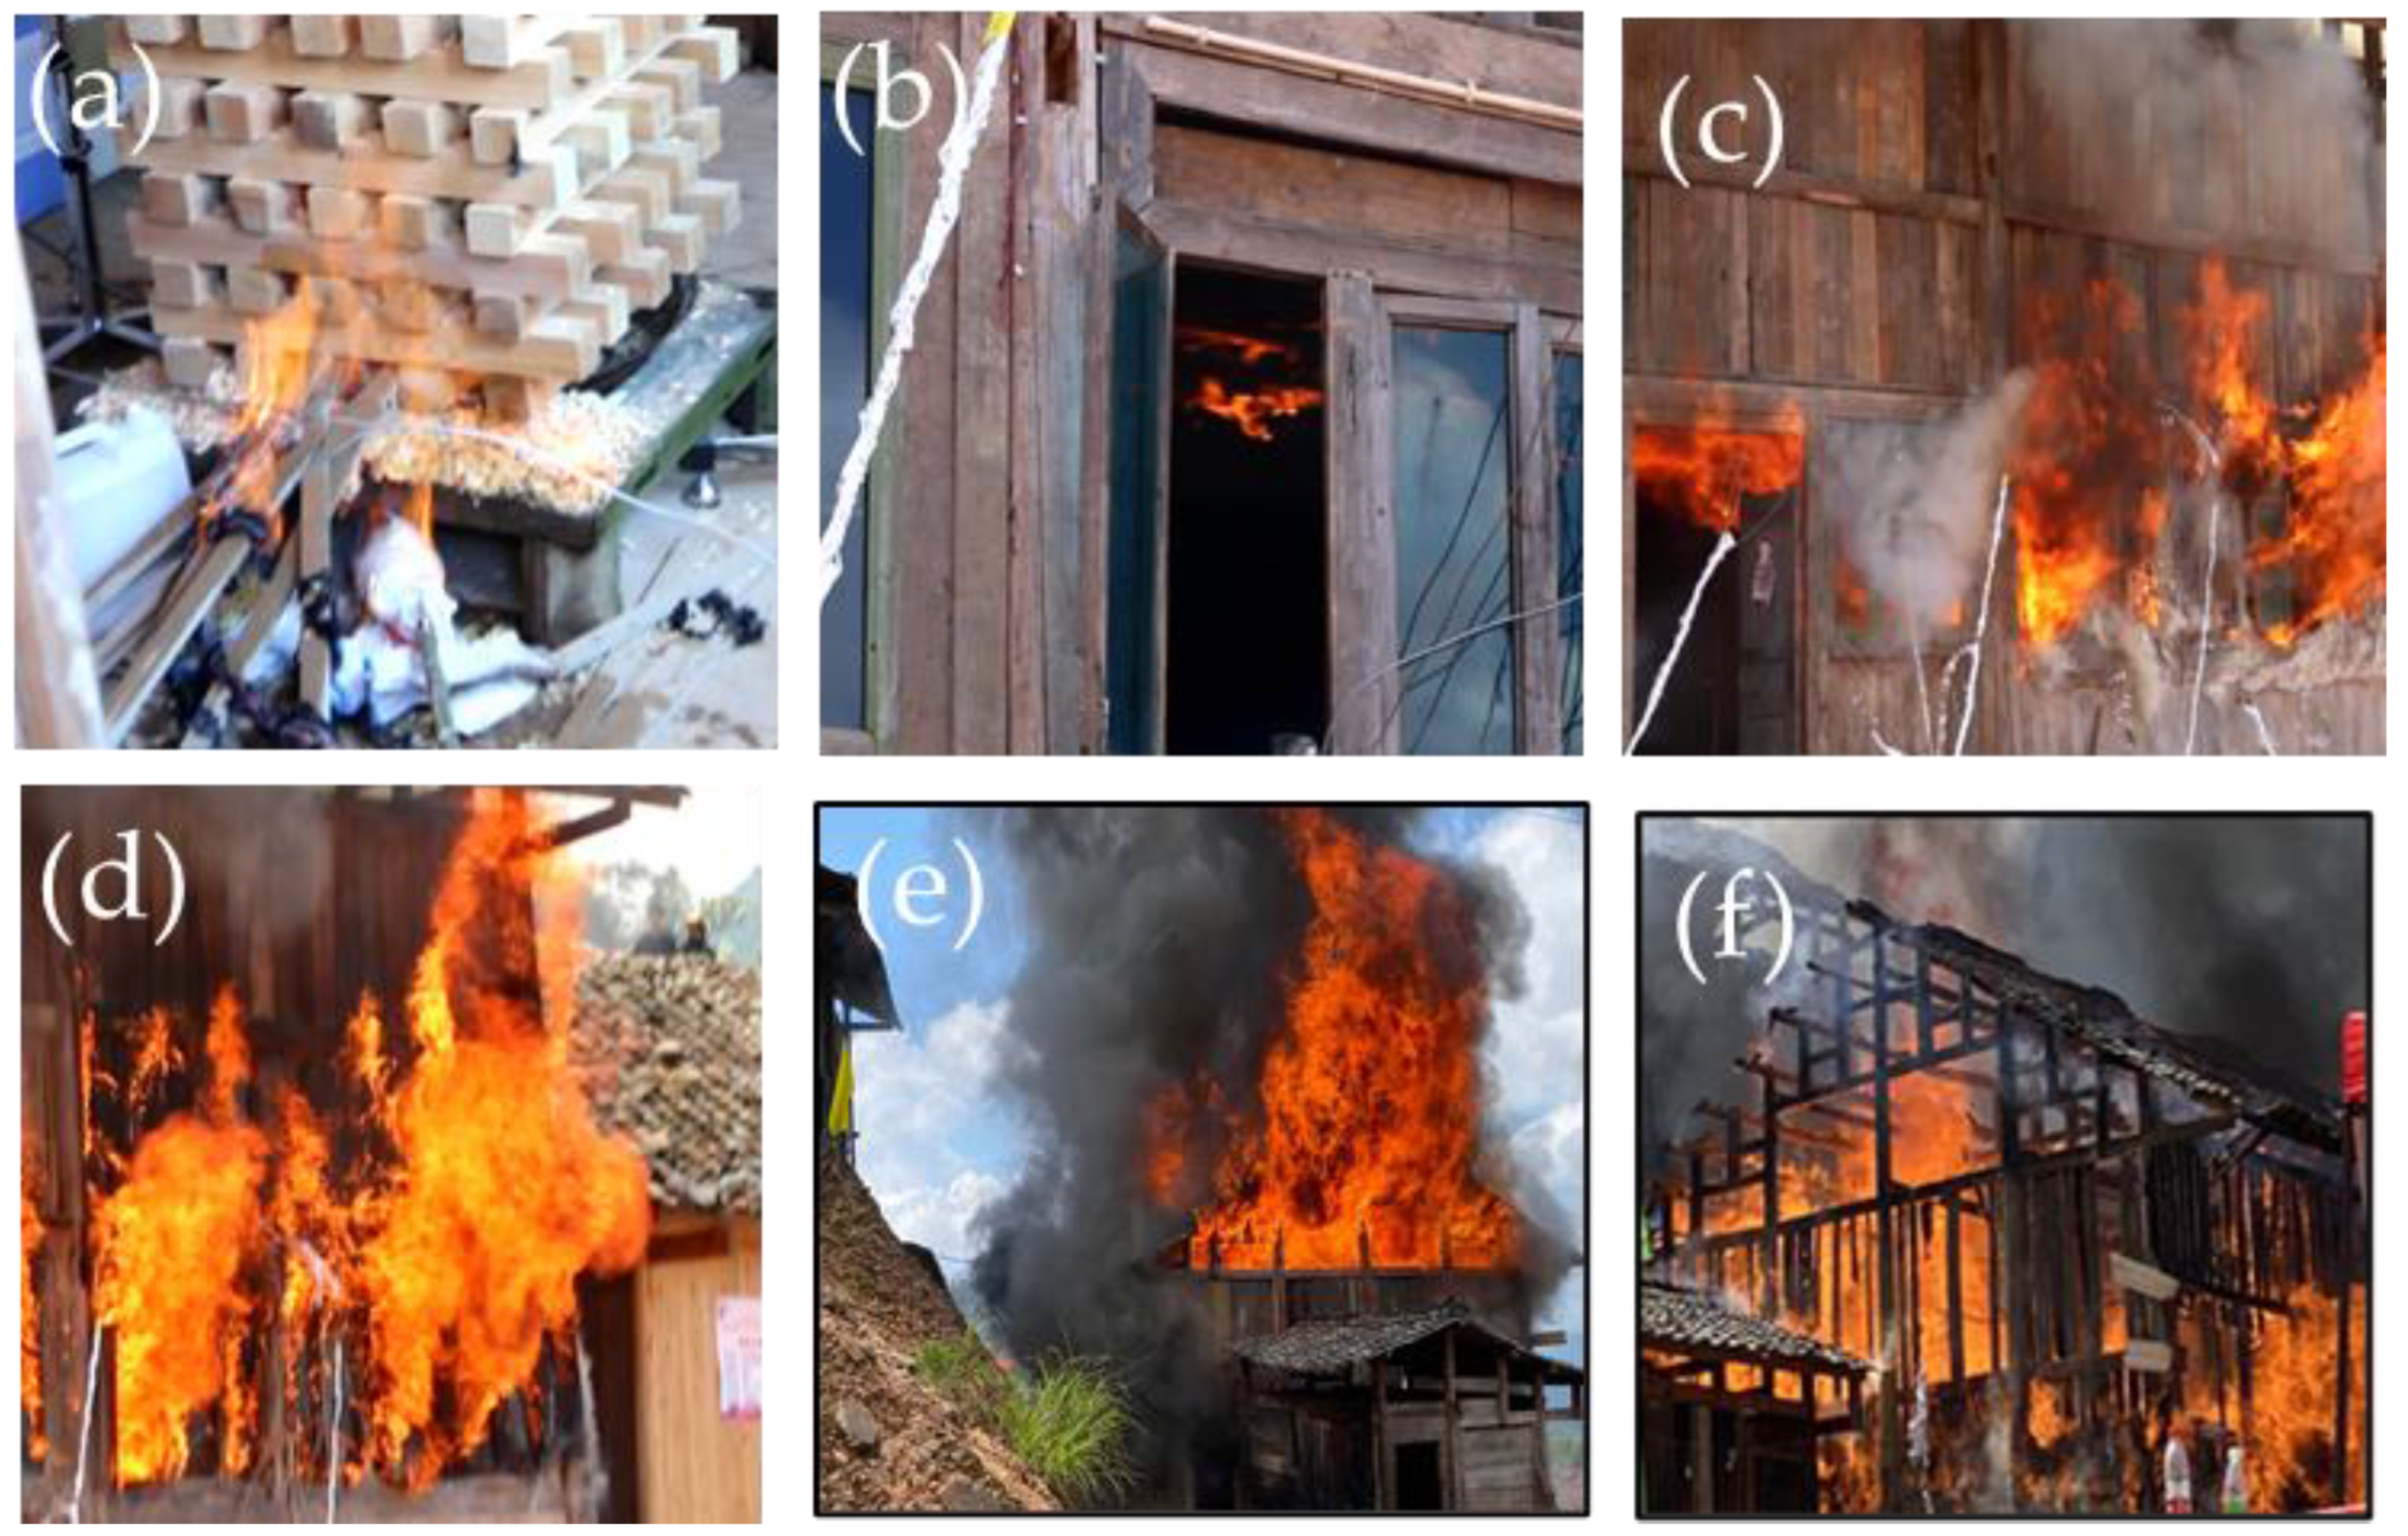
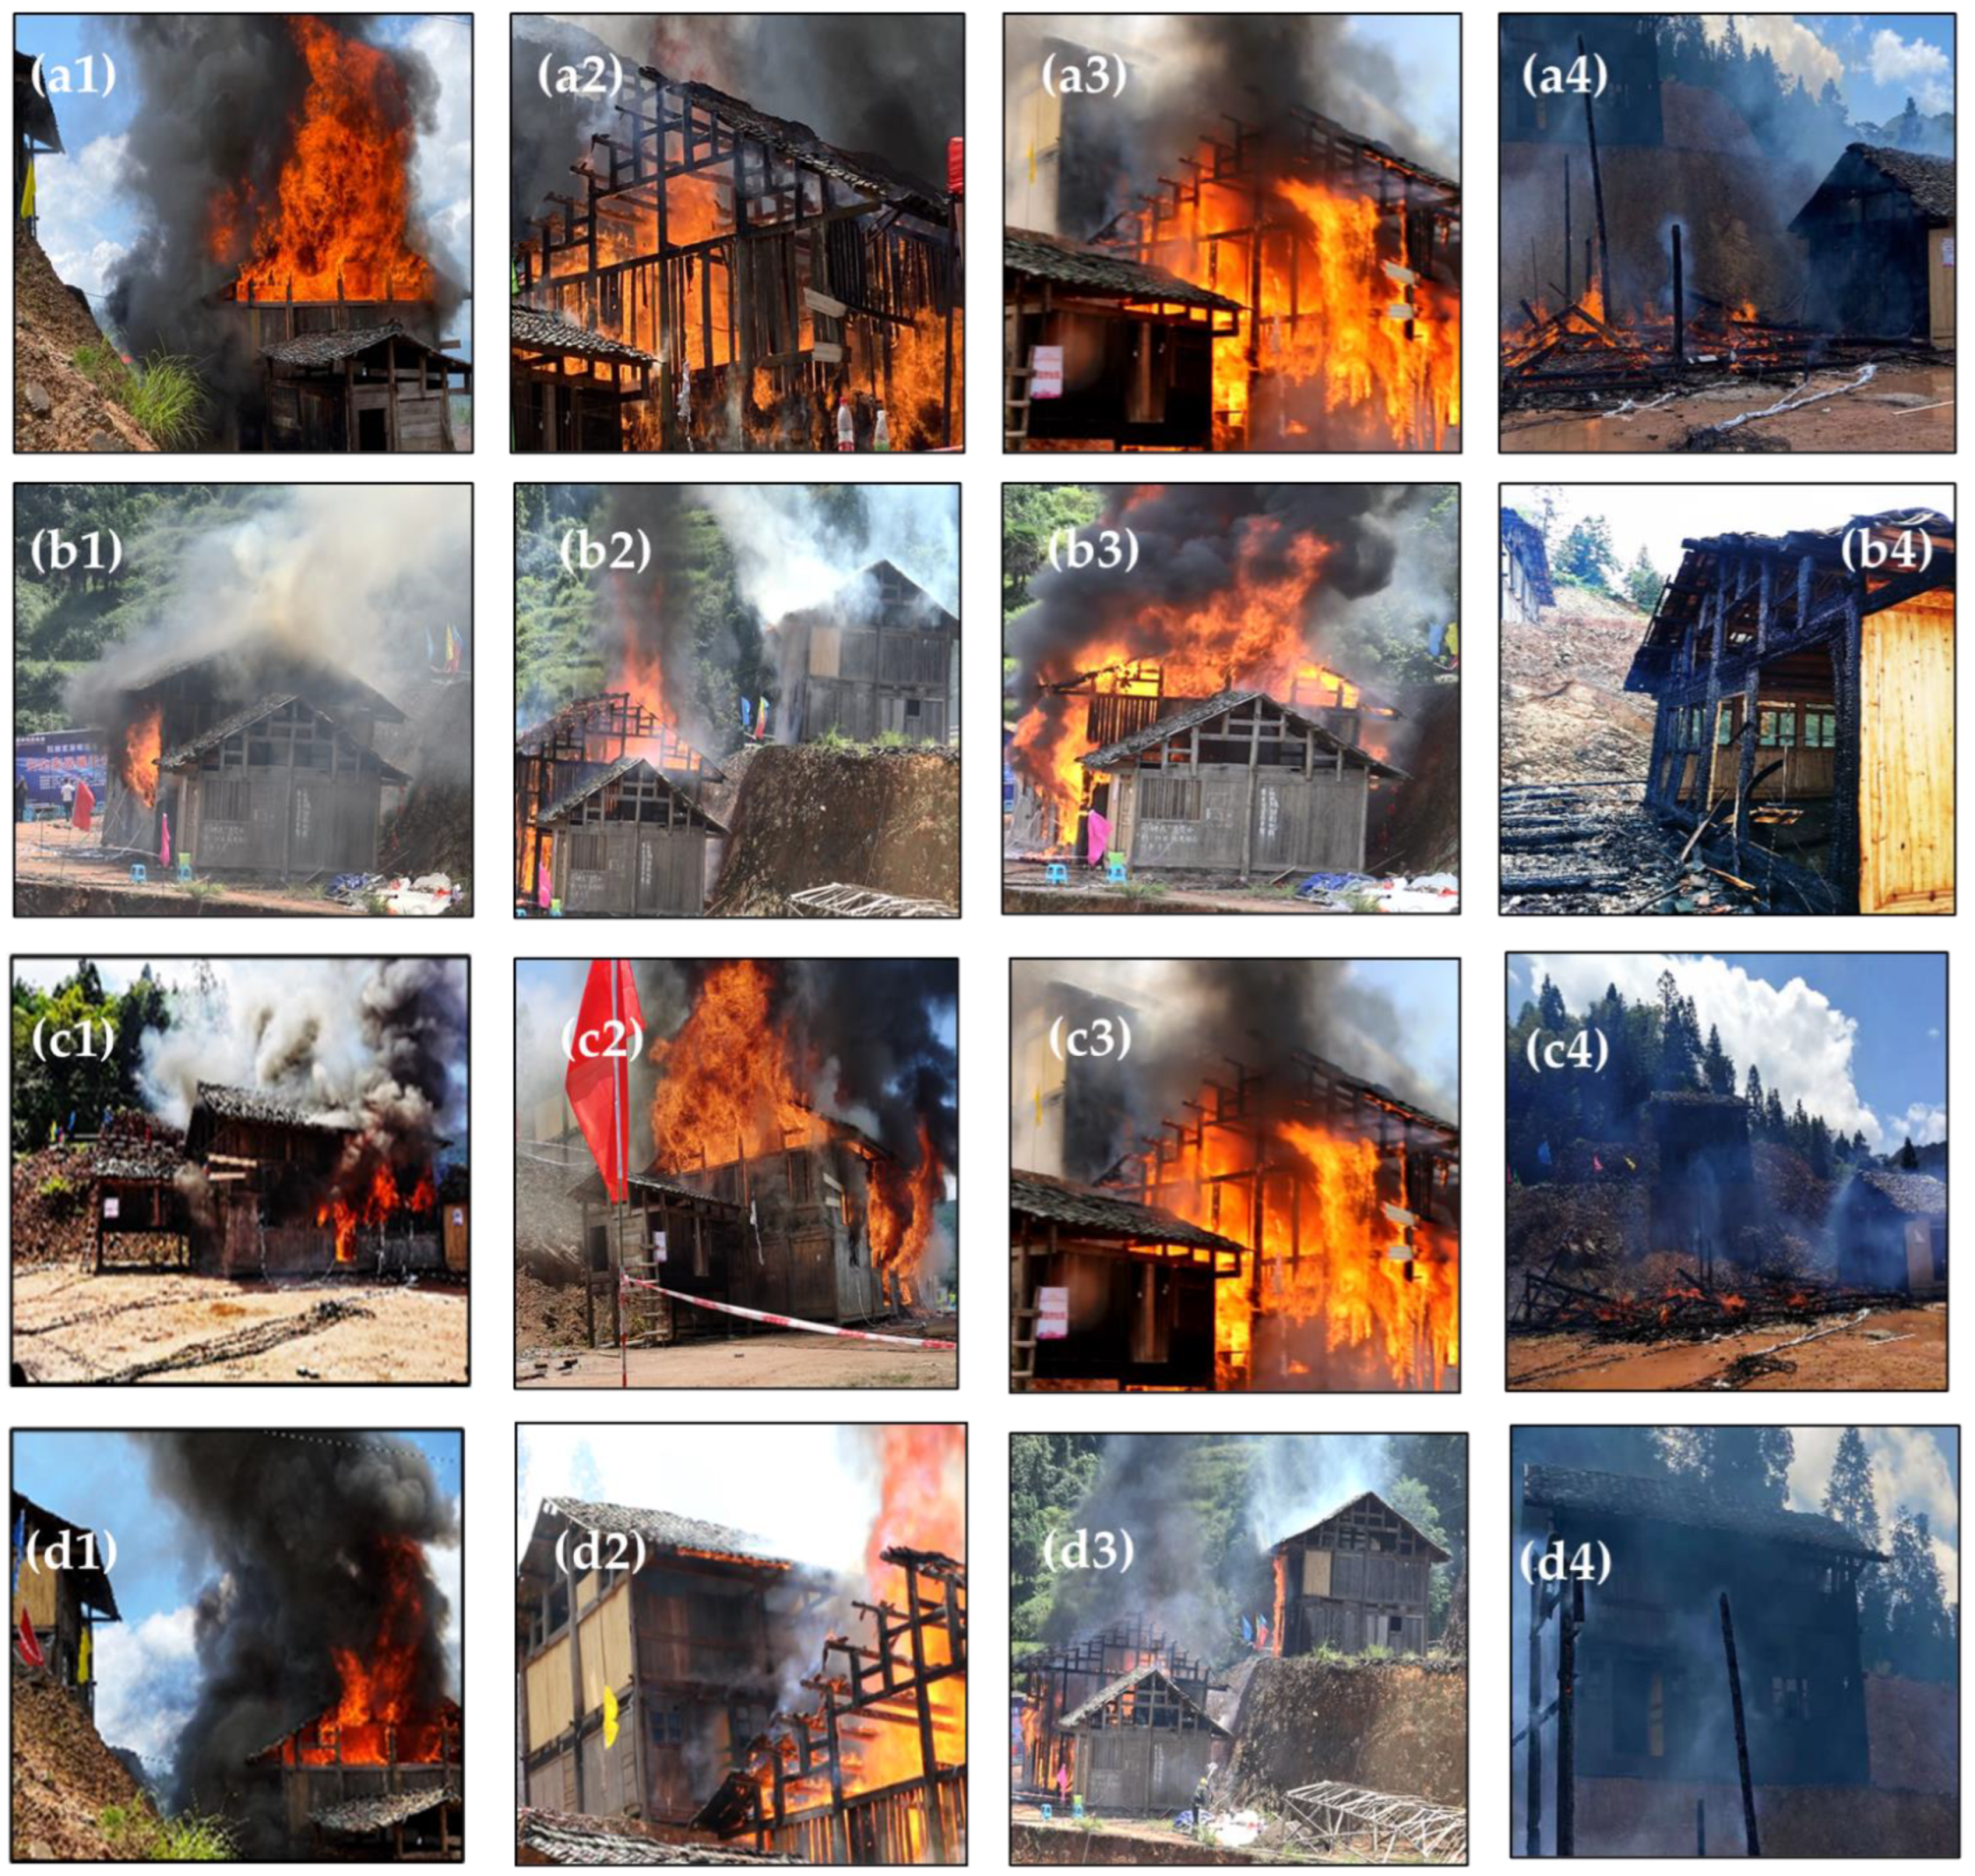
3.1.1. Analysis of the Visual Characteristics

Figure 5 shows a series of photos taken from outside House 1 during the test. Fire ignition occurred at 0 min in room 1-1. At 3.1 min, smoke began to overflow from room 1-1. At 6.6 min, the floor of the room floor was lit, and the fire burned on the room’s inner walls. At 8.9 min, a small amount of open fire spilled out of the window. At 10.2 min, a large number of open flames came out of the window and gradually went through the window to the second floor. At 10.8 min, the ceiling of room 1-1 collapsed, the fire quickly reached the second floor, and the beams were burned. At 12.3 min, the roof of House 1 was completely burned, and a large amount of smoke was produced. At 12.7 min, the foundation of the house (near room 1-1) was burned. At 16 min, only the main frame of House 1 was left. At 23 min, the house completely collapsed, and the walls and floors were completely consumed by the fire.

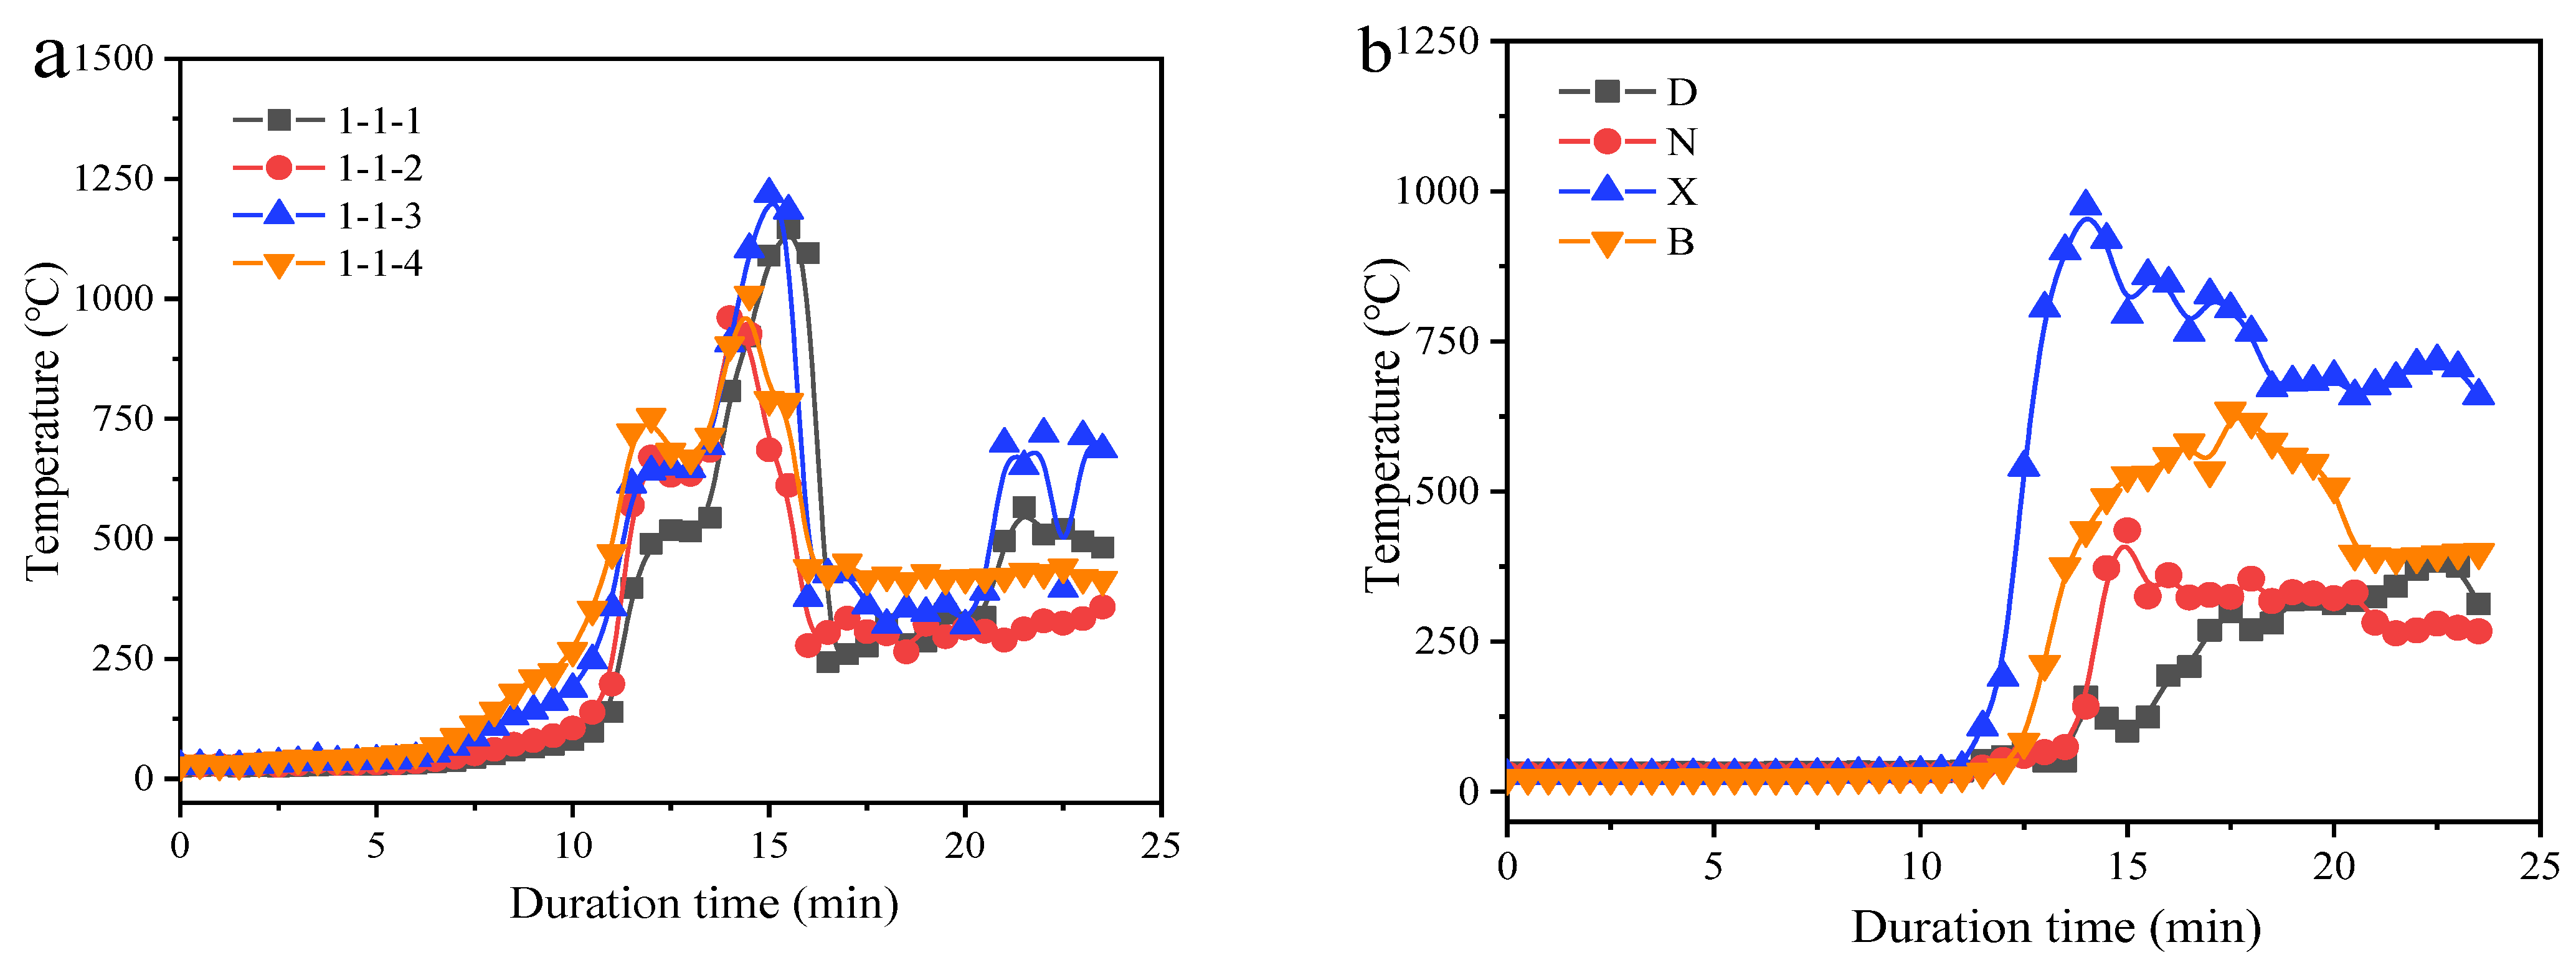
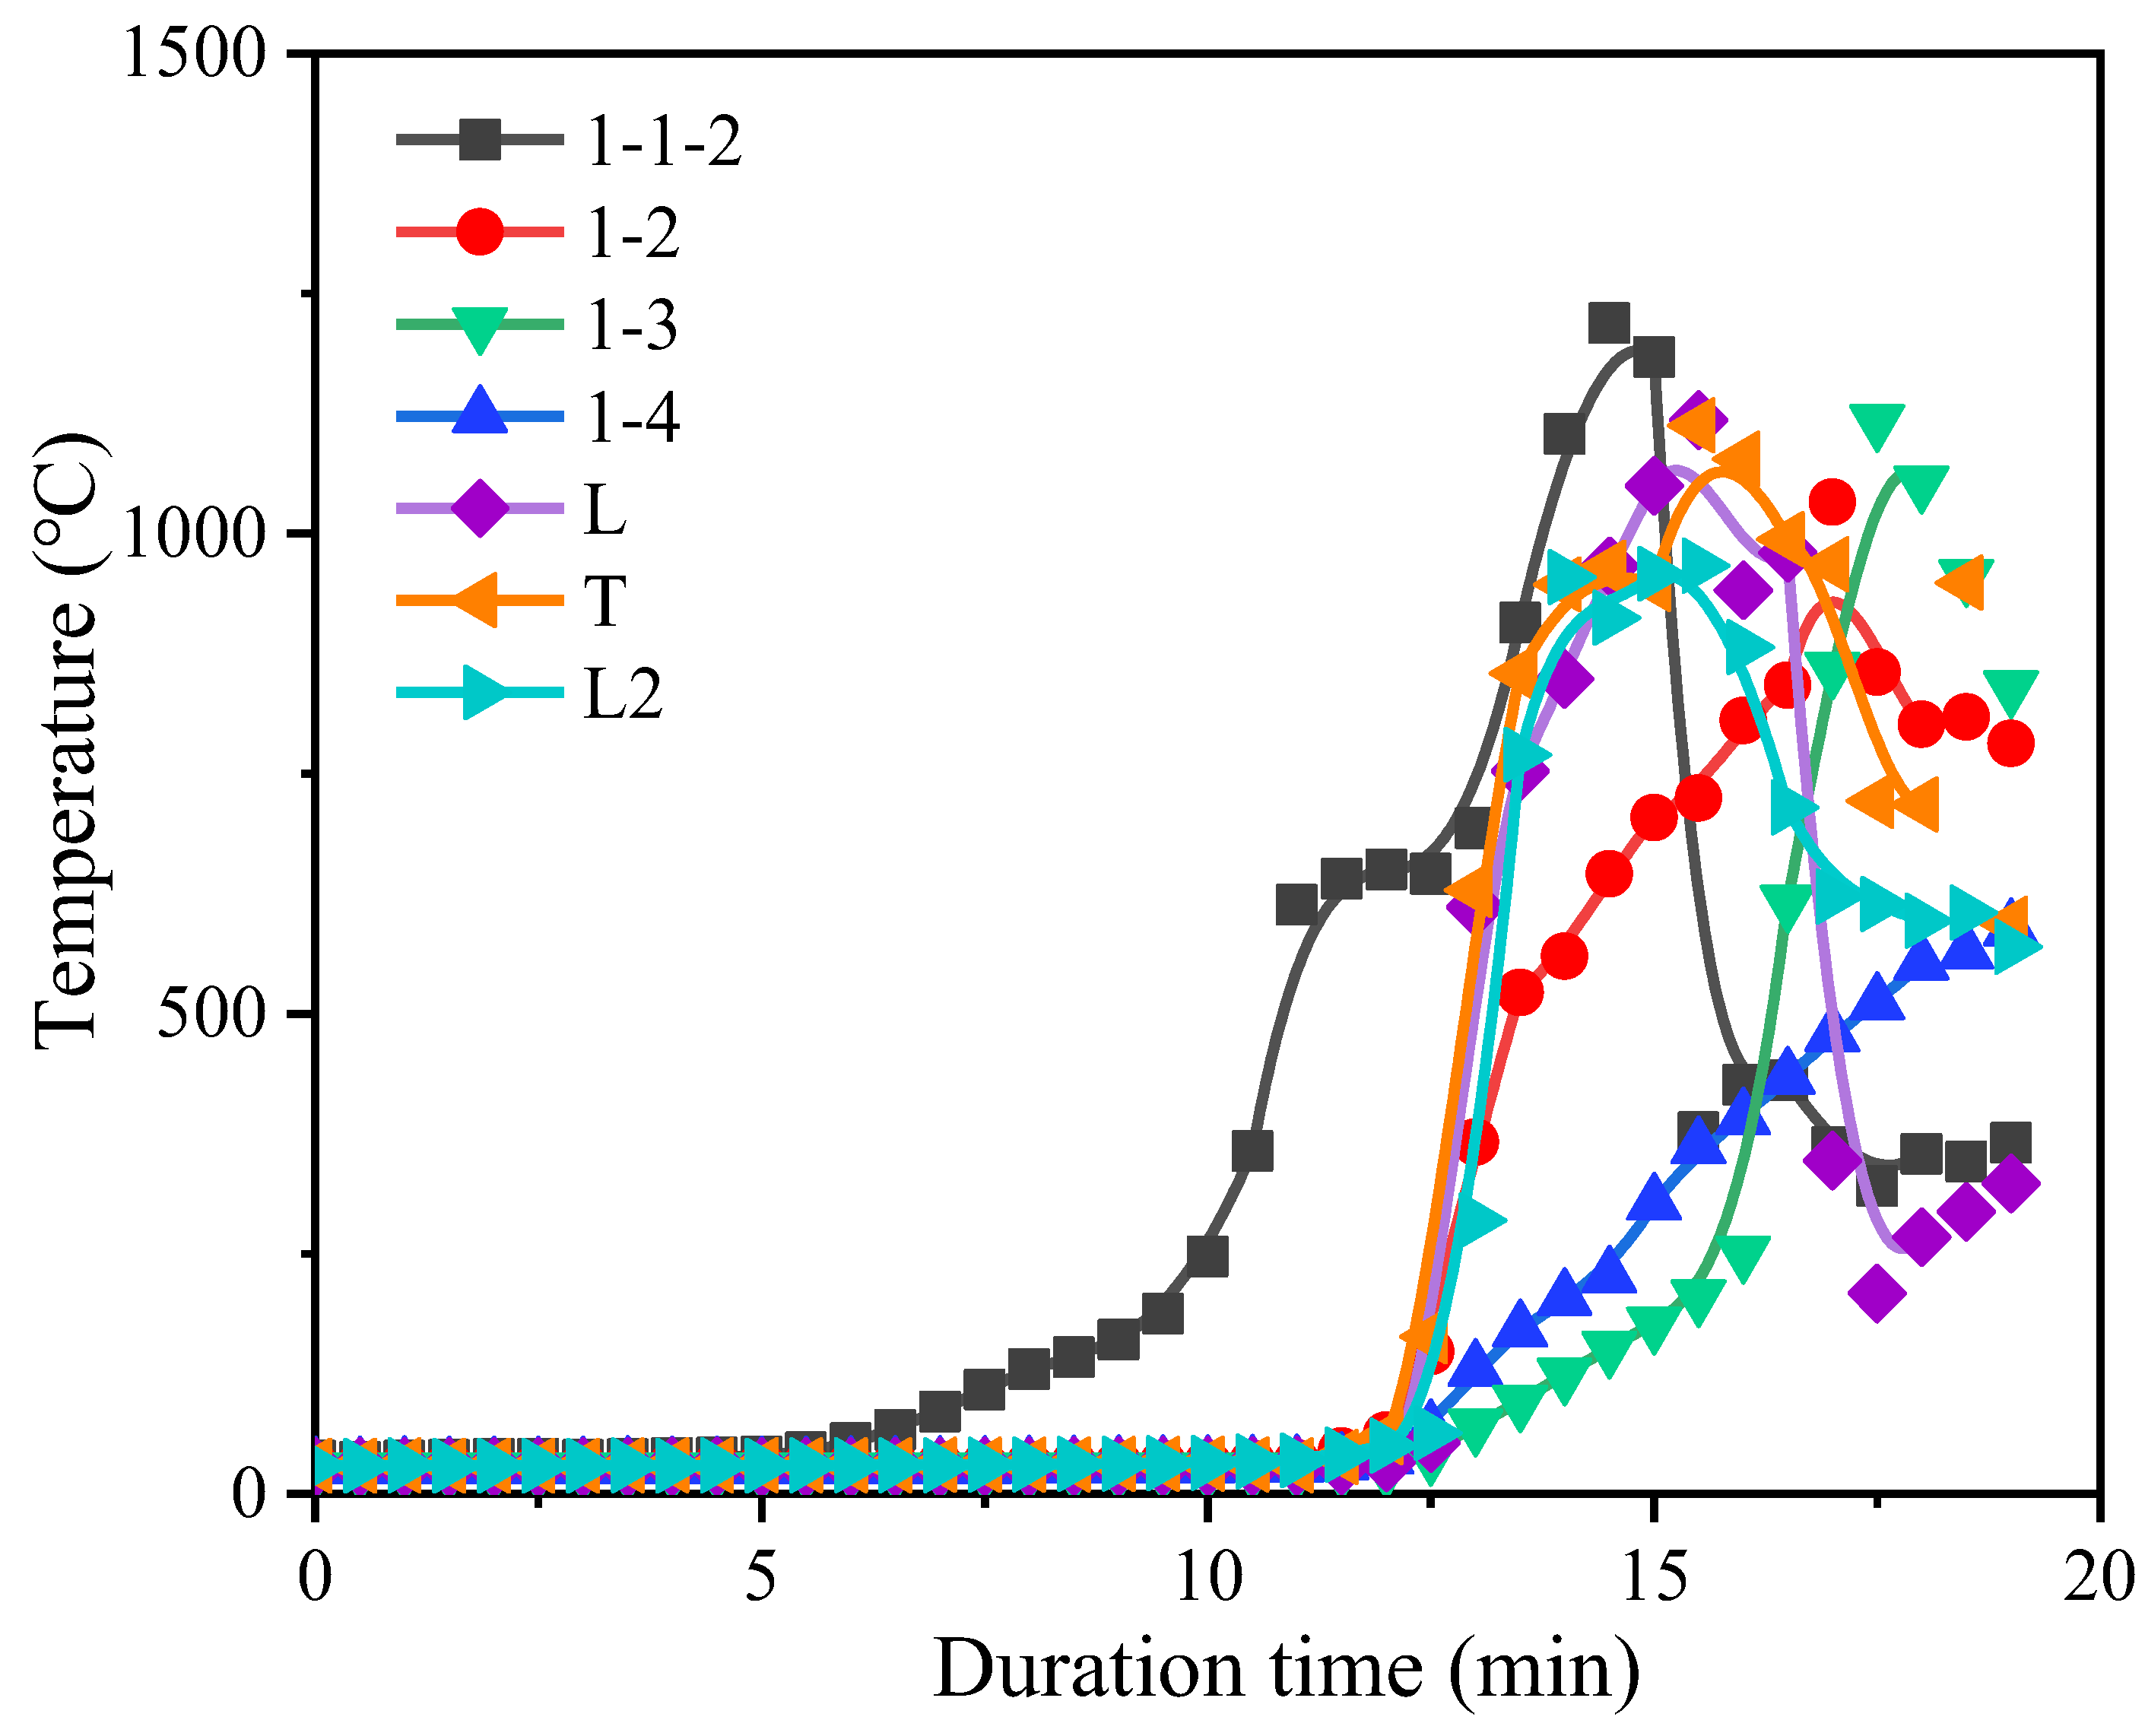
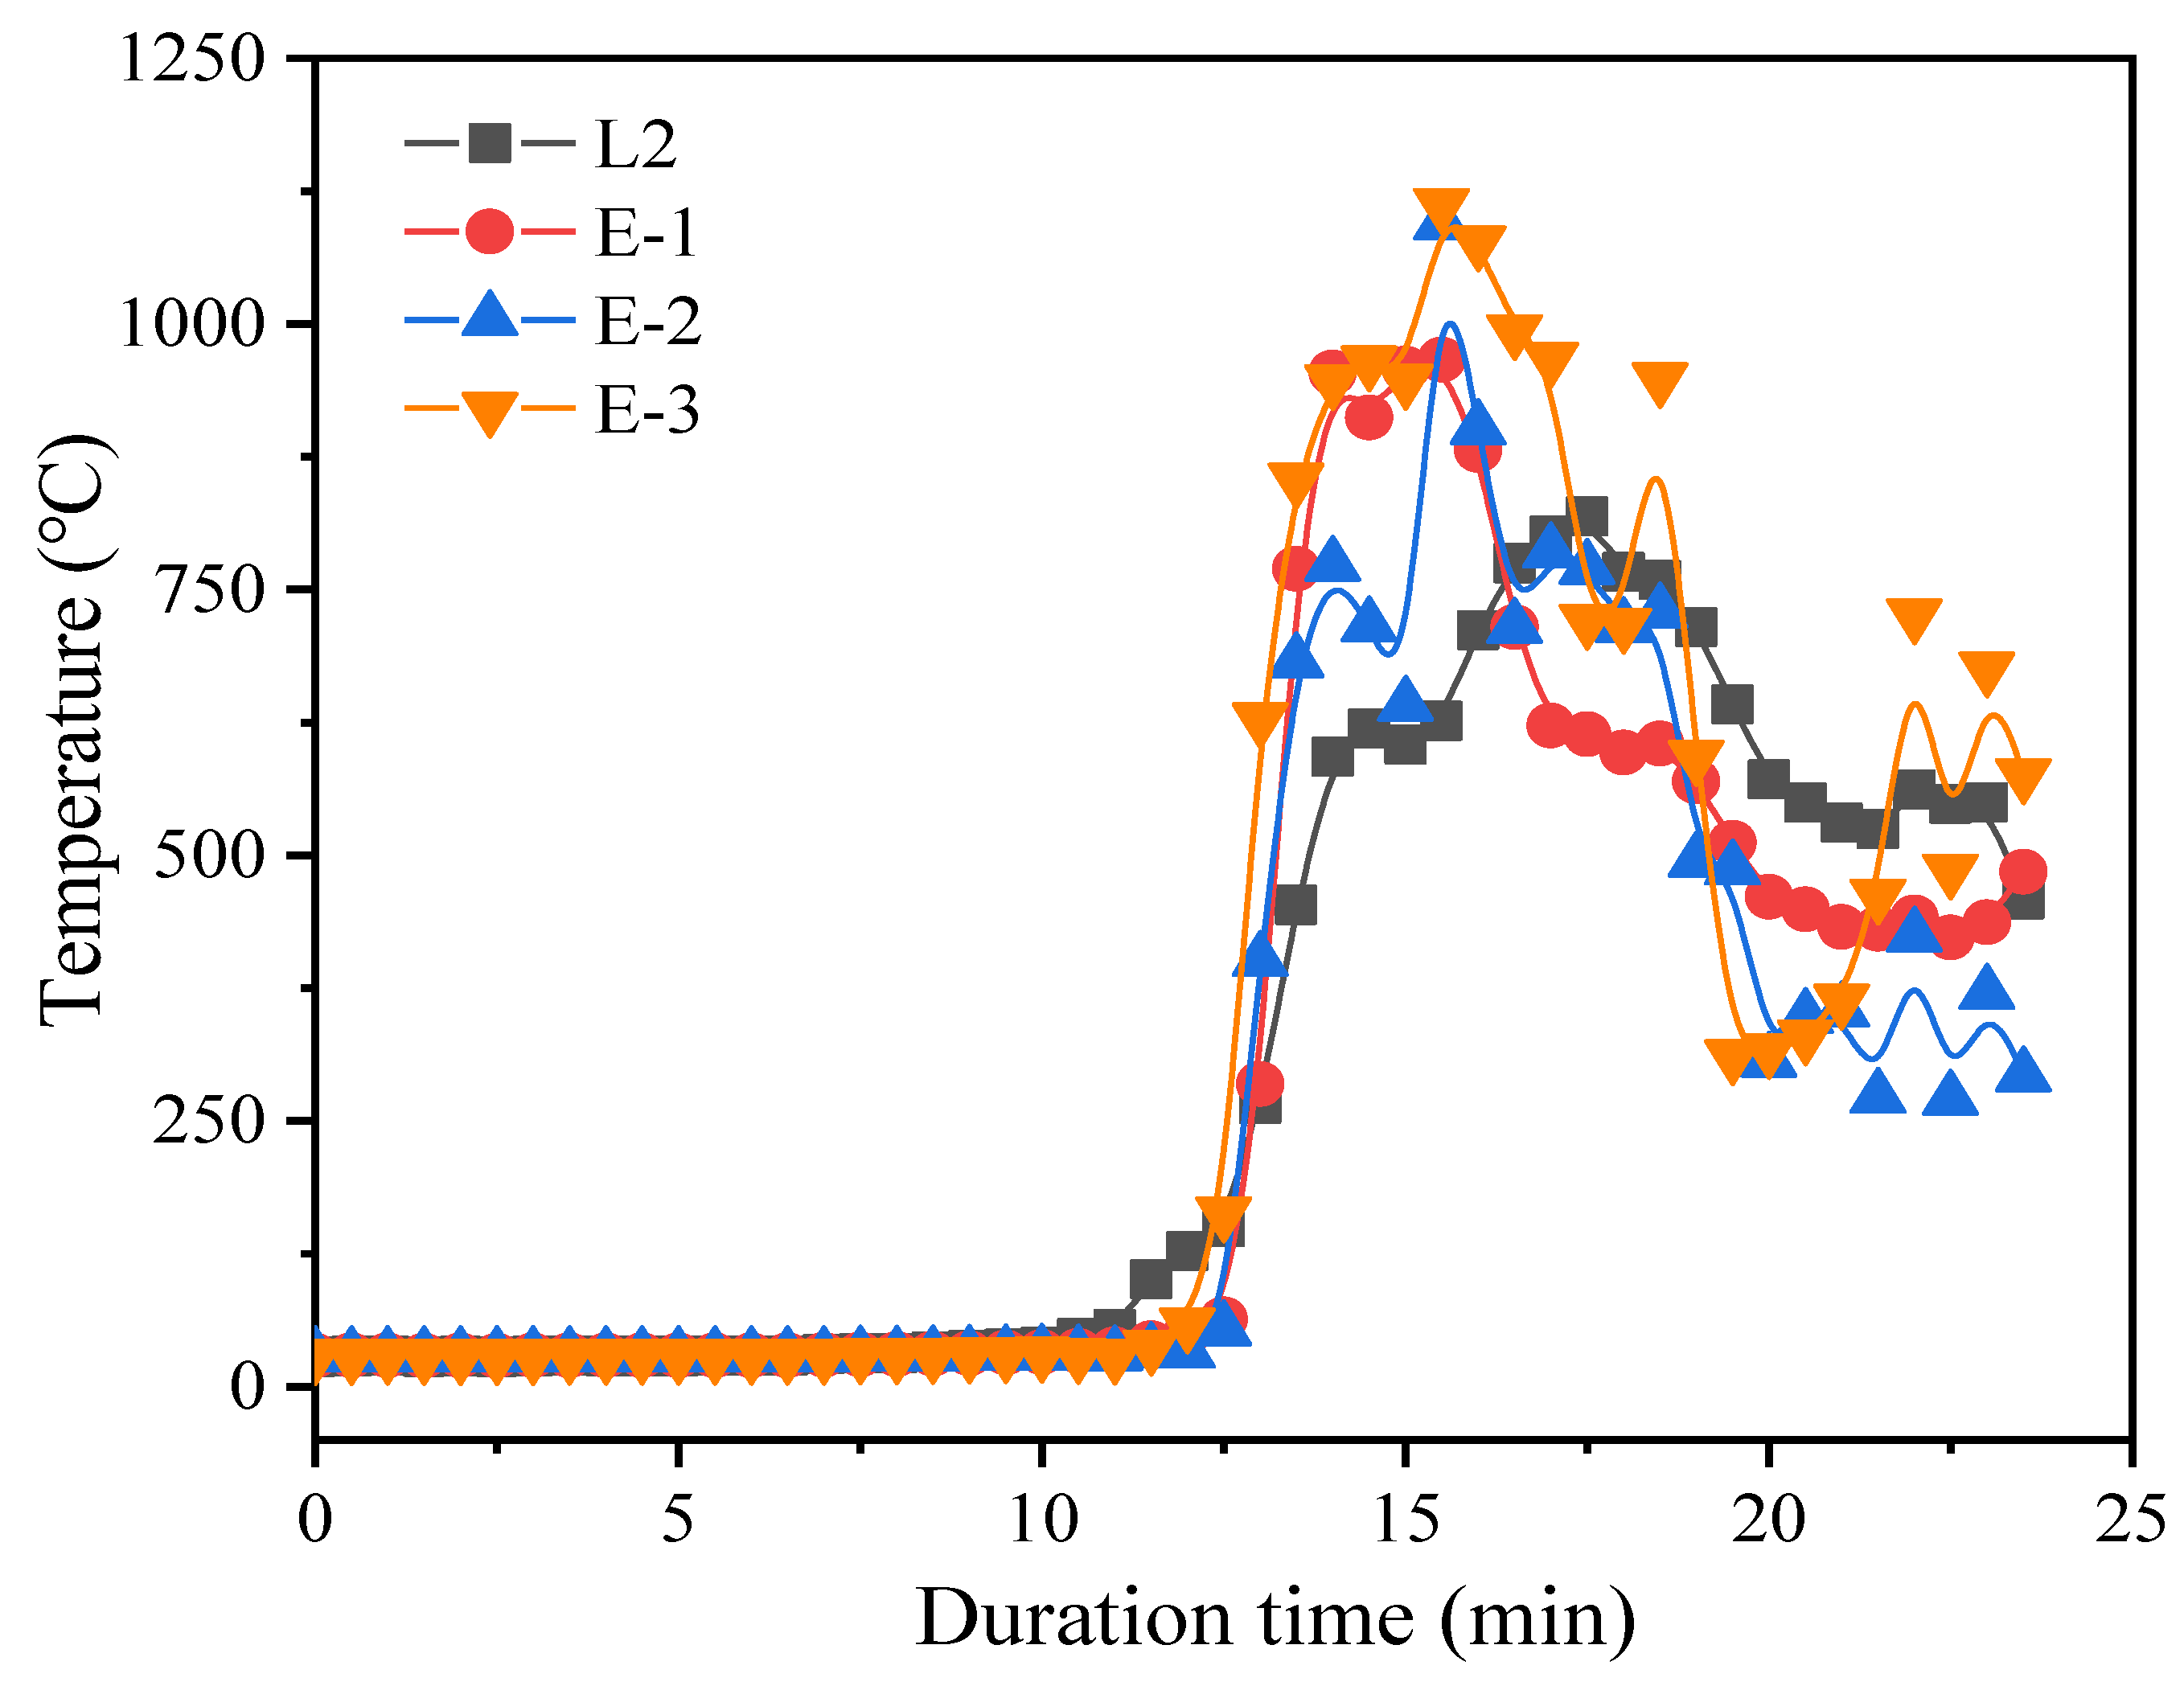
3.1.2. Temperature Changing Rule

Figure 6 shows the temperature of each test point in room 1. Figure 6a shows how, before 10.00 min, the detection height and the room temperature were significantly correlated, and the highest temperature was registered at point 1-1-4. Between 10–12.5 min, the temperature increased rapidly at all 4 detection points in room 1. At 12.5 min, the temperature at points 1-1-2, 1-1-3, and 1-1-4 was similar and slightly higher than that at point 1-1-1; the correlation between height and room temperature decreased (in accordance with the observations reported by Huang et al. [46]). Figure 6b shows how, before 10 min, the temperature at the measurement points on all 4 walls of room 1 showed gentle change. At 10 to 11 min, the temperature of all points increased significantly, showing the room had reached flashover. This phenomenon may be due to the amount of oxygen provided by the vacancy structure of lofts in ancient wooden buildings; a similar phenomenon could be found in a previous study [15]. The temperature began to rise at 12.5 min at point B and at 14 min at points N and D. After 15 min, all 4 points reached a stable temperature; the highest values were measured at point X (west wall), followed by point B (north wall) and points N and D (south and east walls, respectively). Compared with the other three walls, the west wall showed the earliest temperature rise and the highest final temperature; in comparison, the north wall showed a slightly later temperature rise and a slightly lower final temperature. This difference was related to the non-completely confined nature of the experimental wood-frame building space. The outdoor east-southeast wind will, in fact, enter the interior of a non-completely confined building, affecting the fire spread direction. In our test, after 10 min from fire ignition, the ventilation direction significantly affected the fire spread direction.
Figure 7 shows the temperatures registered at the height of 1.0 m from the floor in each room of House 1 during the fire spread. The increase in temperatures followed the order of 1-1-2 (room 1) > T (hall) = L (stairs) = L2 (floor) = 1-2 (room 2) > 1-4 > 1-3. Specifically, the point 1-1-2 increased rapidly at 9.5 min, and T, L, L2, and 1-2 increased at 11.5 min, while 1-4 and 1-3 increased at 12 min and 12.5 min. The staircase was at a certain distance from room 1, and it heated up at the same time as the hall, possibly because the staircase was connected to the second floor and had sufficient air (not a completely airtight loft). After 11 min, the fire spread phenomenon was influenced by the direction of the wind coming from outside. In addition, Room 3 was located northwest of the burning room and intercepted the wind; here, the fire spread and heated up rapidly. Finally, in Room 4 (to the west of the burning room), the fire spread and heated up slowly. It showed that the order of room heating was similar to the ventilation direction. However, the order of increased temperature could not verify this assumption; thus, the measured temperatures were analyzed using SPSS.

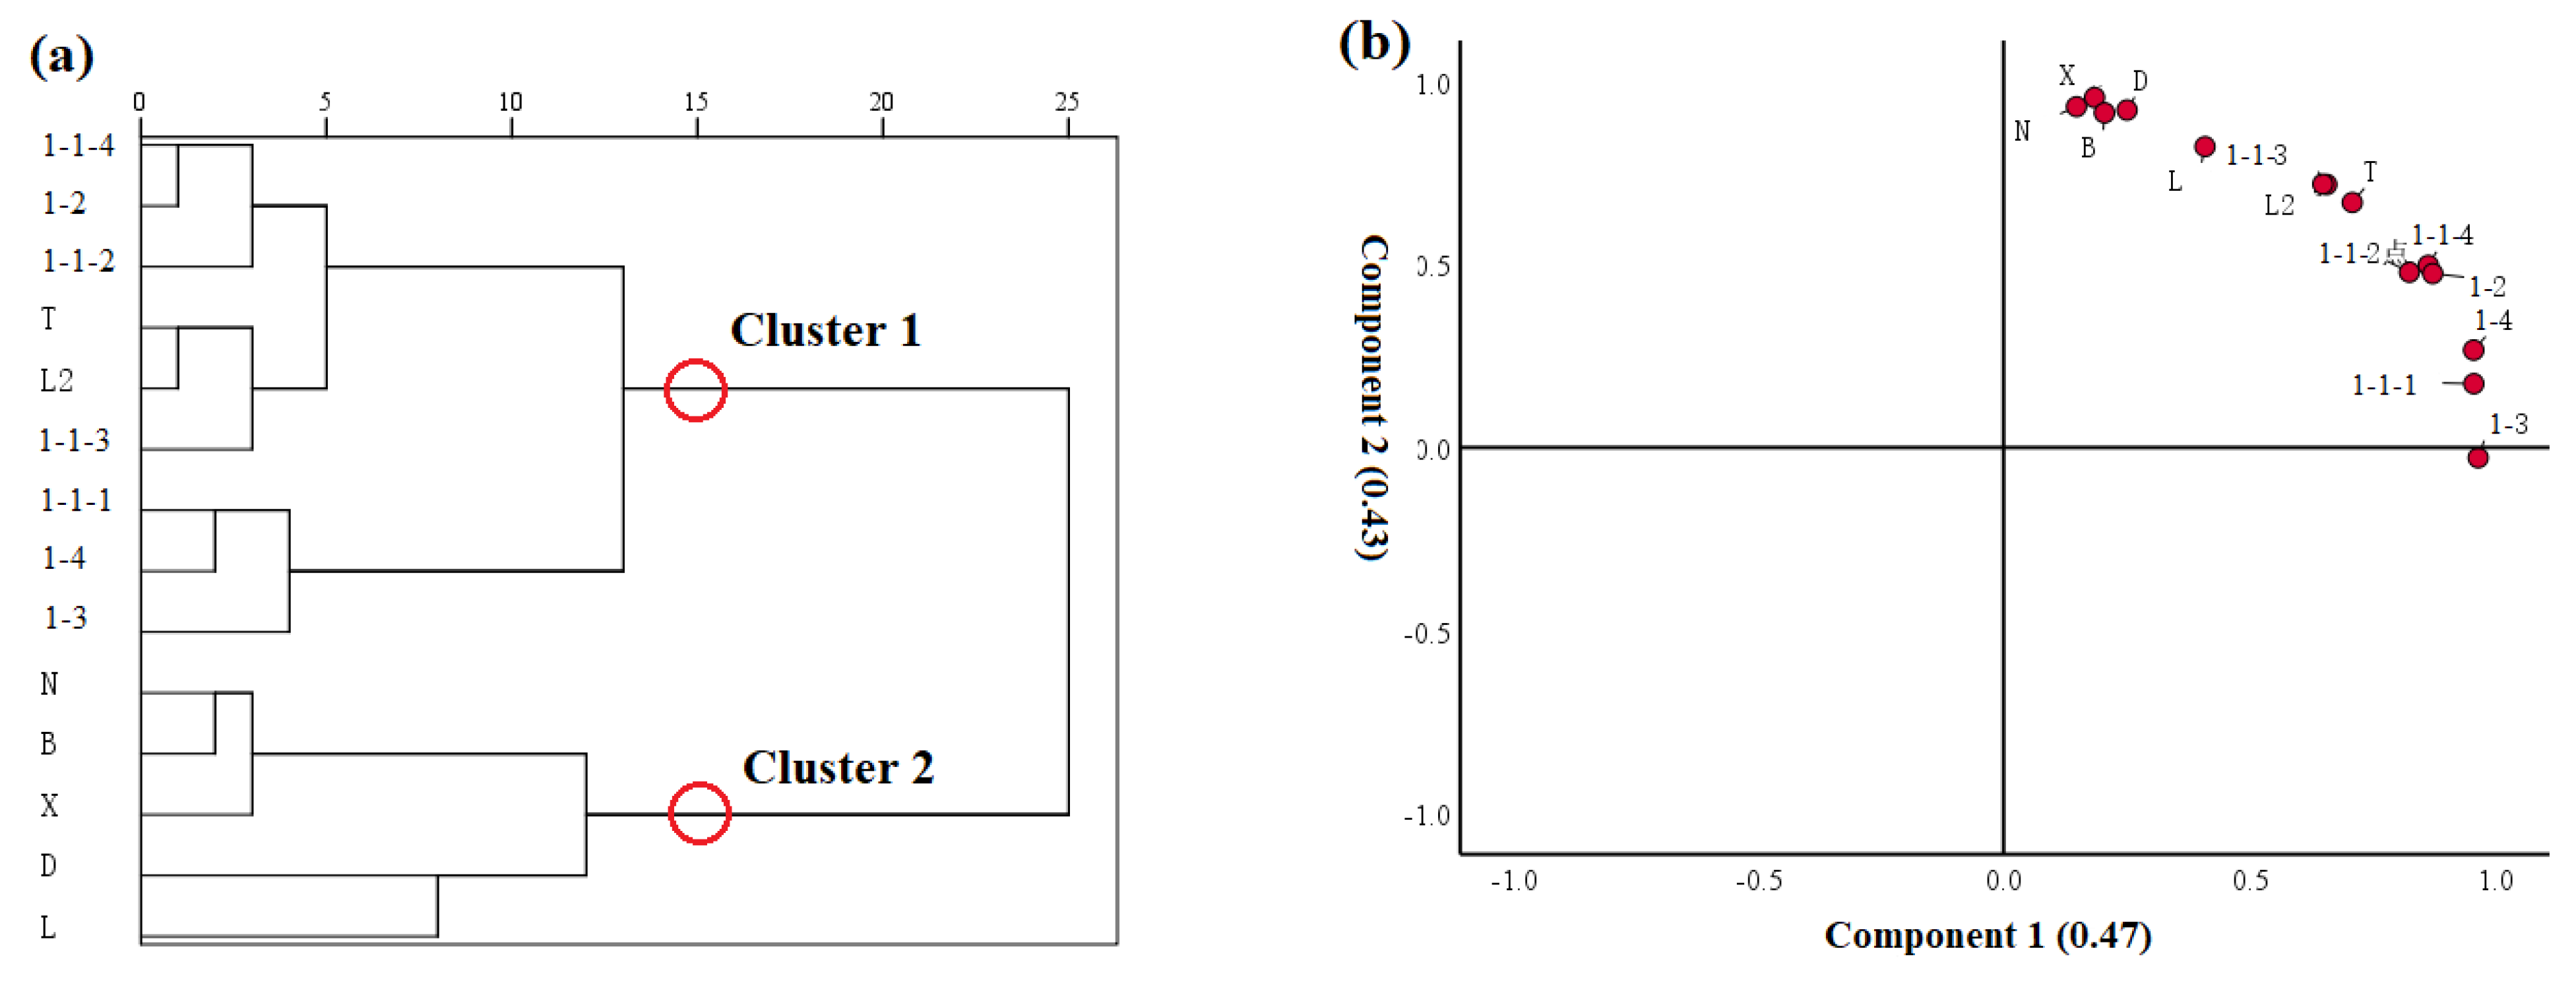
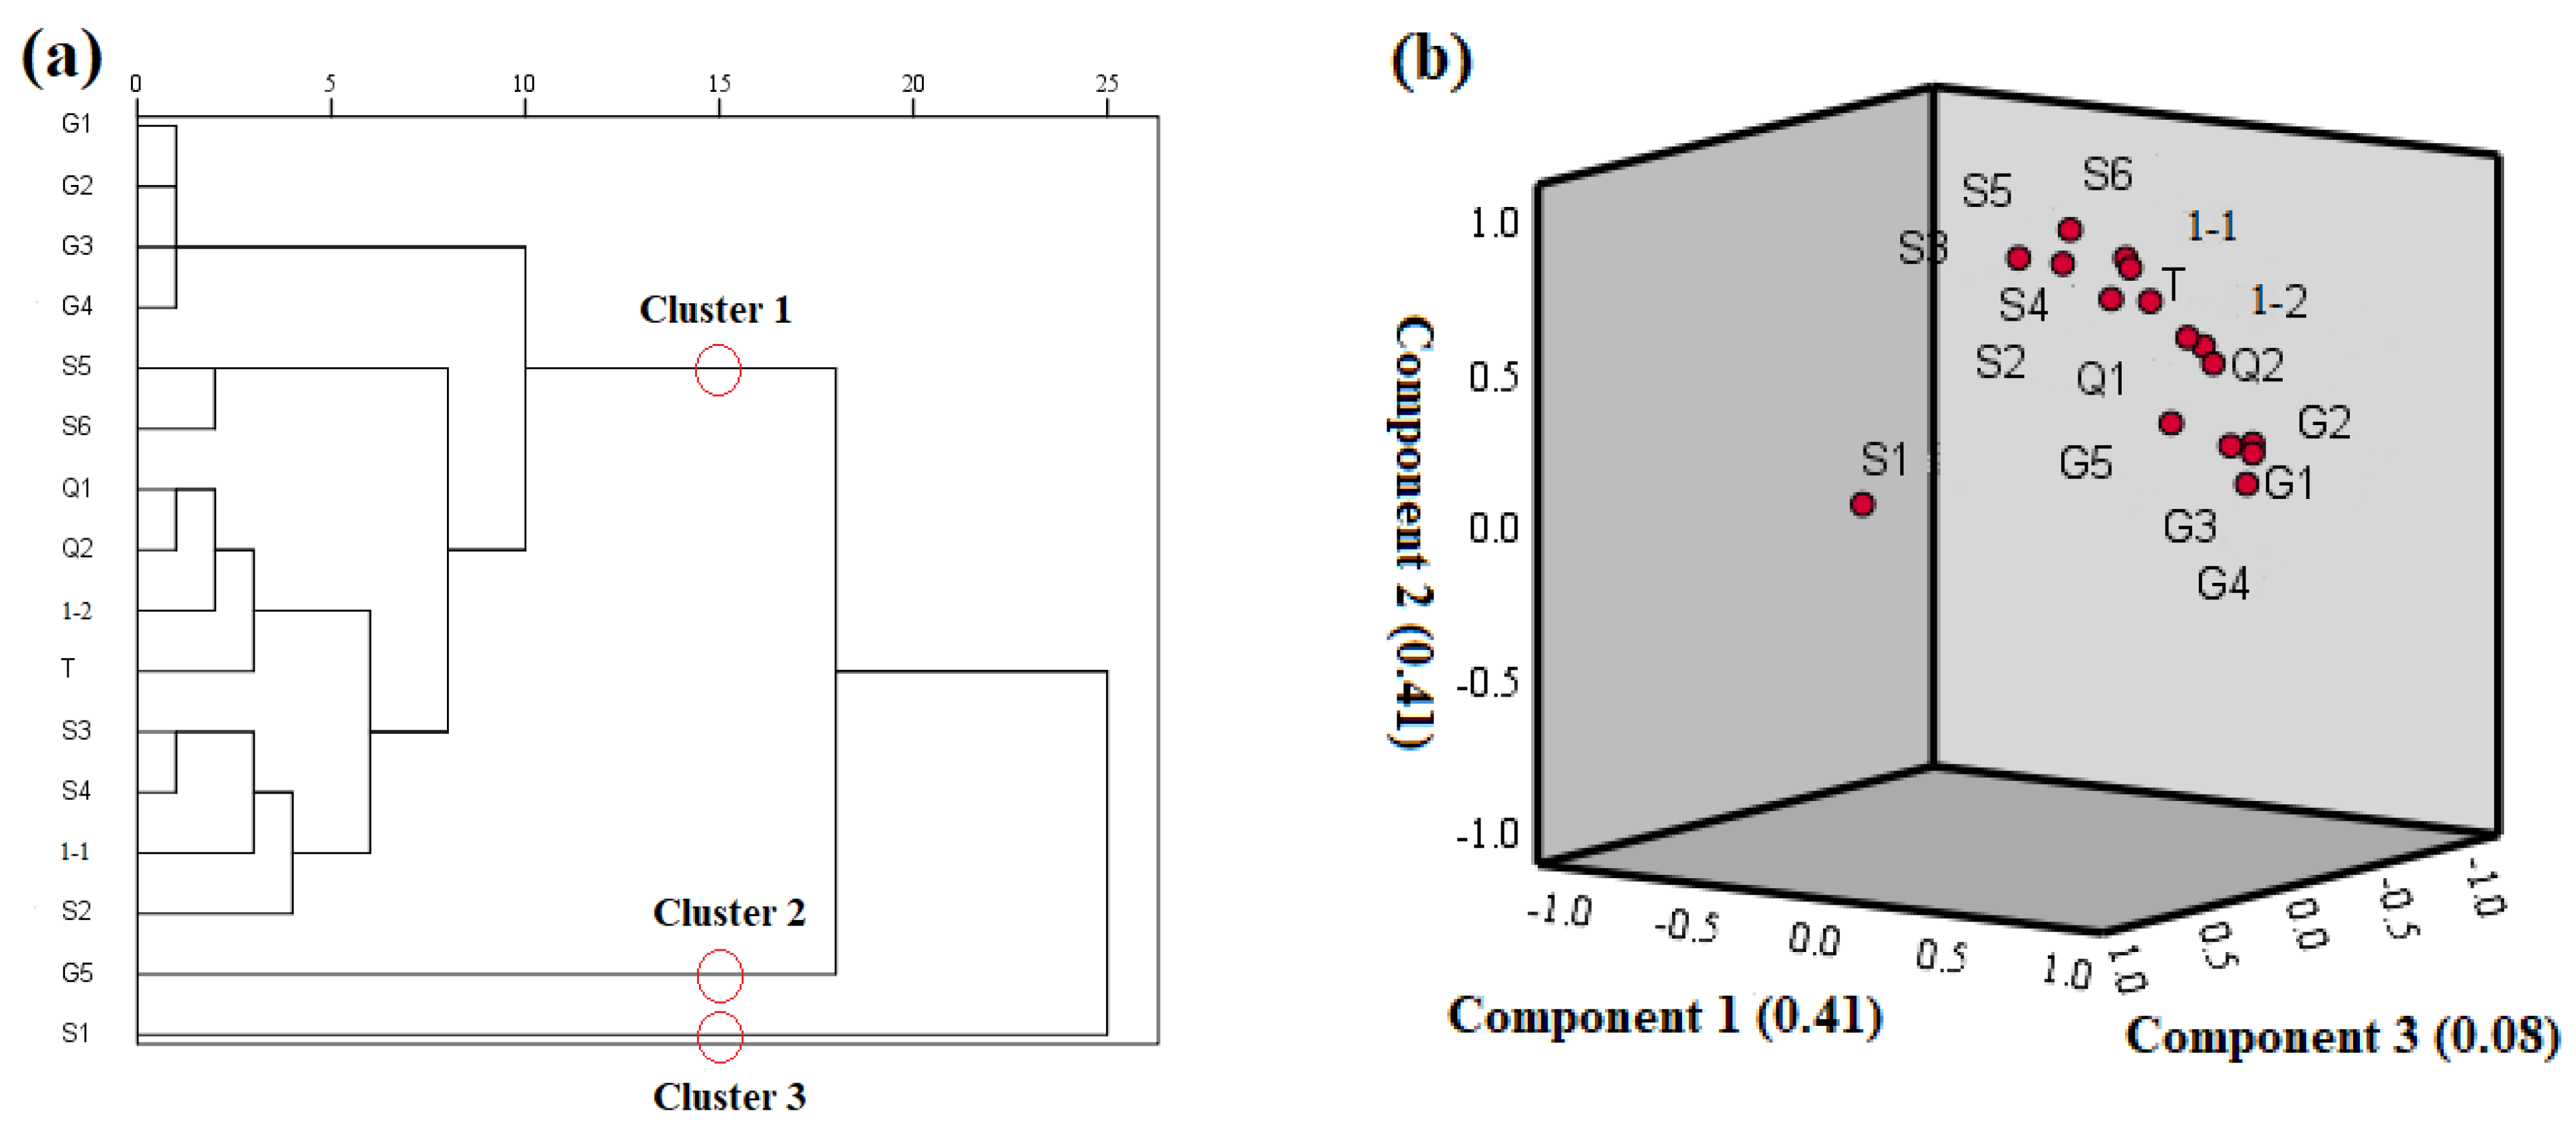
3.1.3. Principal Component Analysis and Validation

Figure 8 and Table 1 show the correlation of the temperatures during the whole experimental process at each detection point in the building where the fire started. The confidence intervals of measured temperatures are listed in Table A2. In particular, Figure 8a shows that the detection points on the first floor of the ignition building can be classified into two clusters; inside the ignition building, fire spread was mainly influenced by two factors. These two factors were further analyzed (Figure 8b and Table 1). Component 1 (Factor 1) and Component 2 (Factor 2) likely represented the wind direction (influence weight = 0.47) and the relative height (influence weight = 0.43), respectively. Combining this information with that in Figure 6, Figure 7 and Figure 8, it was speculated that the relative height and the wind direction significantly influenced both the fire spread phenomenon and the temperature change in the burning building. Similar studies have investigated fire spread in forests and found that 76% of fire behavior is linked to wind direction, wind speed, altitude (height), and other factors [46]. Specifically, before the fire started (at 12 min), the correlation between fire spread and the relative height was greater than that between the wind direction and the spread direction, and relative height and spread rate increased together; however, after the fire started (11 min), the correlation between the wind direction and the spread direction was greater than that between fire spread and the relative height.
Figure 9 shows the temperature results obtained at the measurement points on the second floor of House 1. The point points E-1 (directly above room 1) and E-2 (directly above the hall) almost simultaneously rose. Compared with E1, E2 was far away from the fire source, which was supposed to warm up early. The simultaneous warming indicated that both the wind direction and height strongly influenced the fire spread.
The above results show that fireproofing measures need to be taken on the ceilings of wooden buildings to reduce the influence of relative height. In addition, placing windows in the area of the perennial prevailing wind direction should be limited.

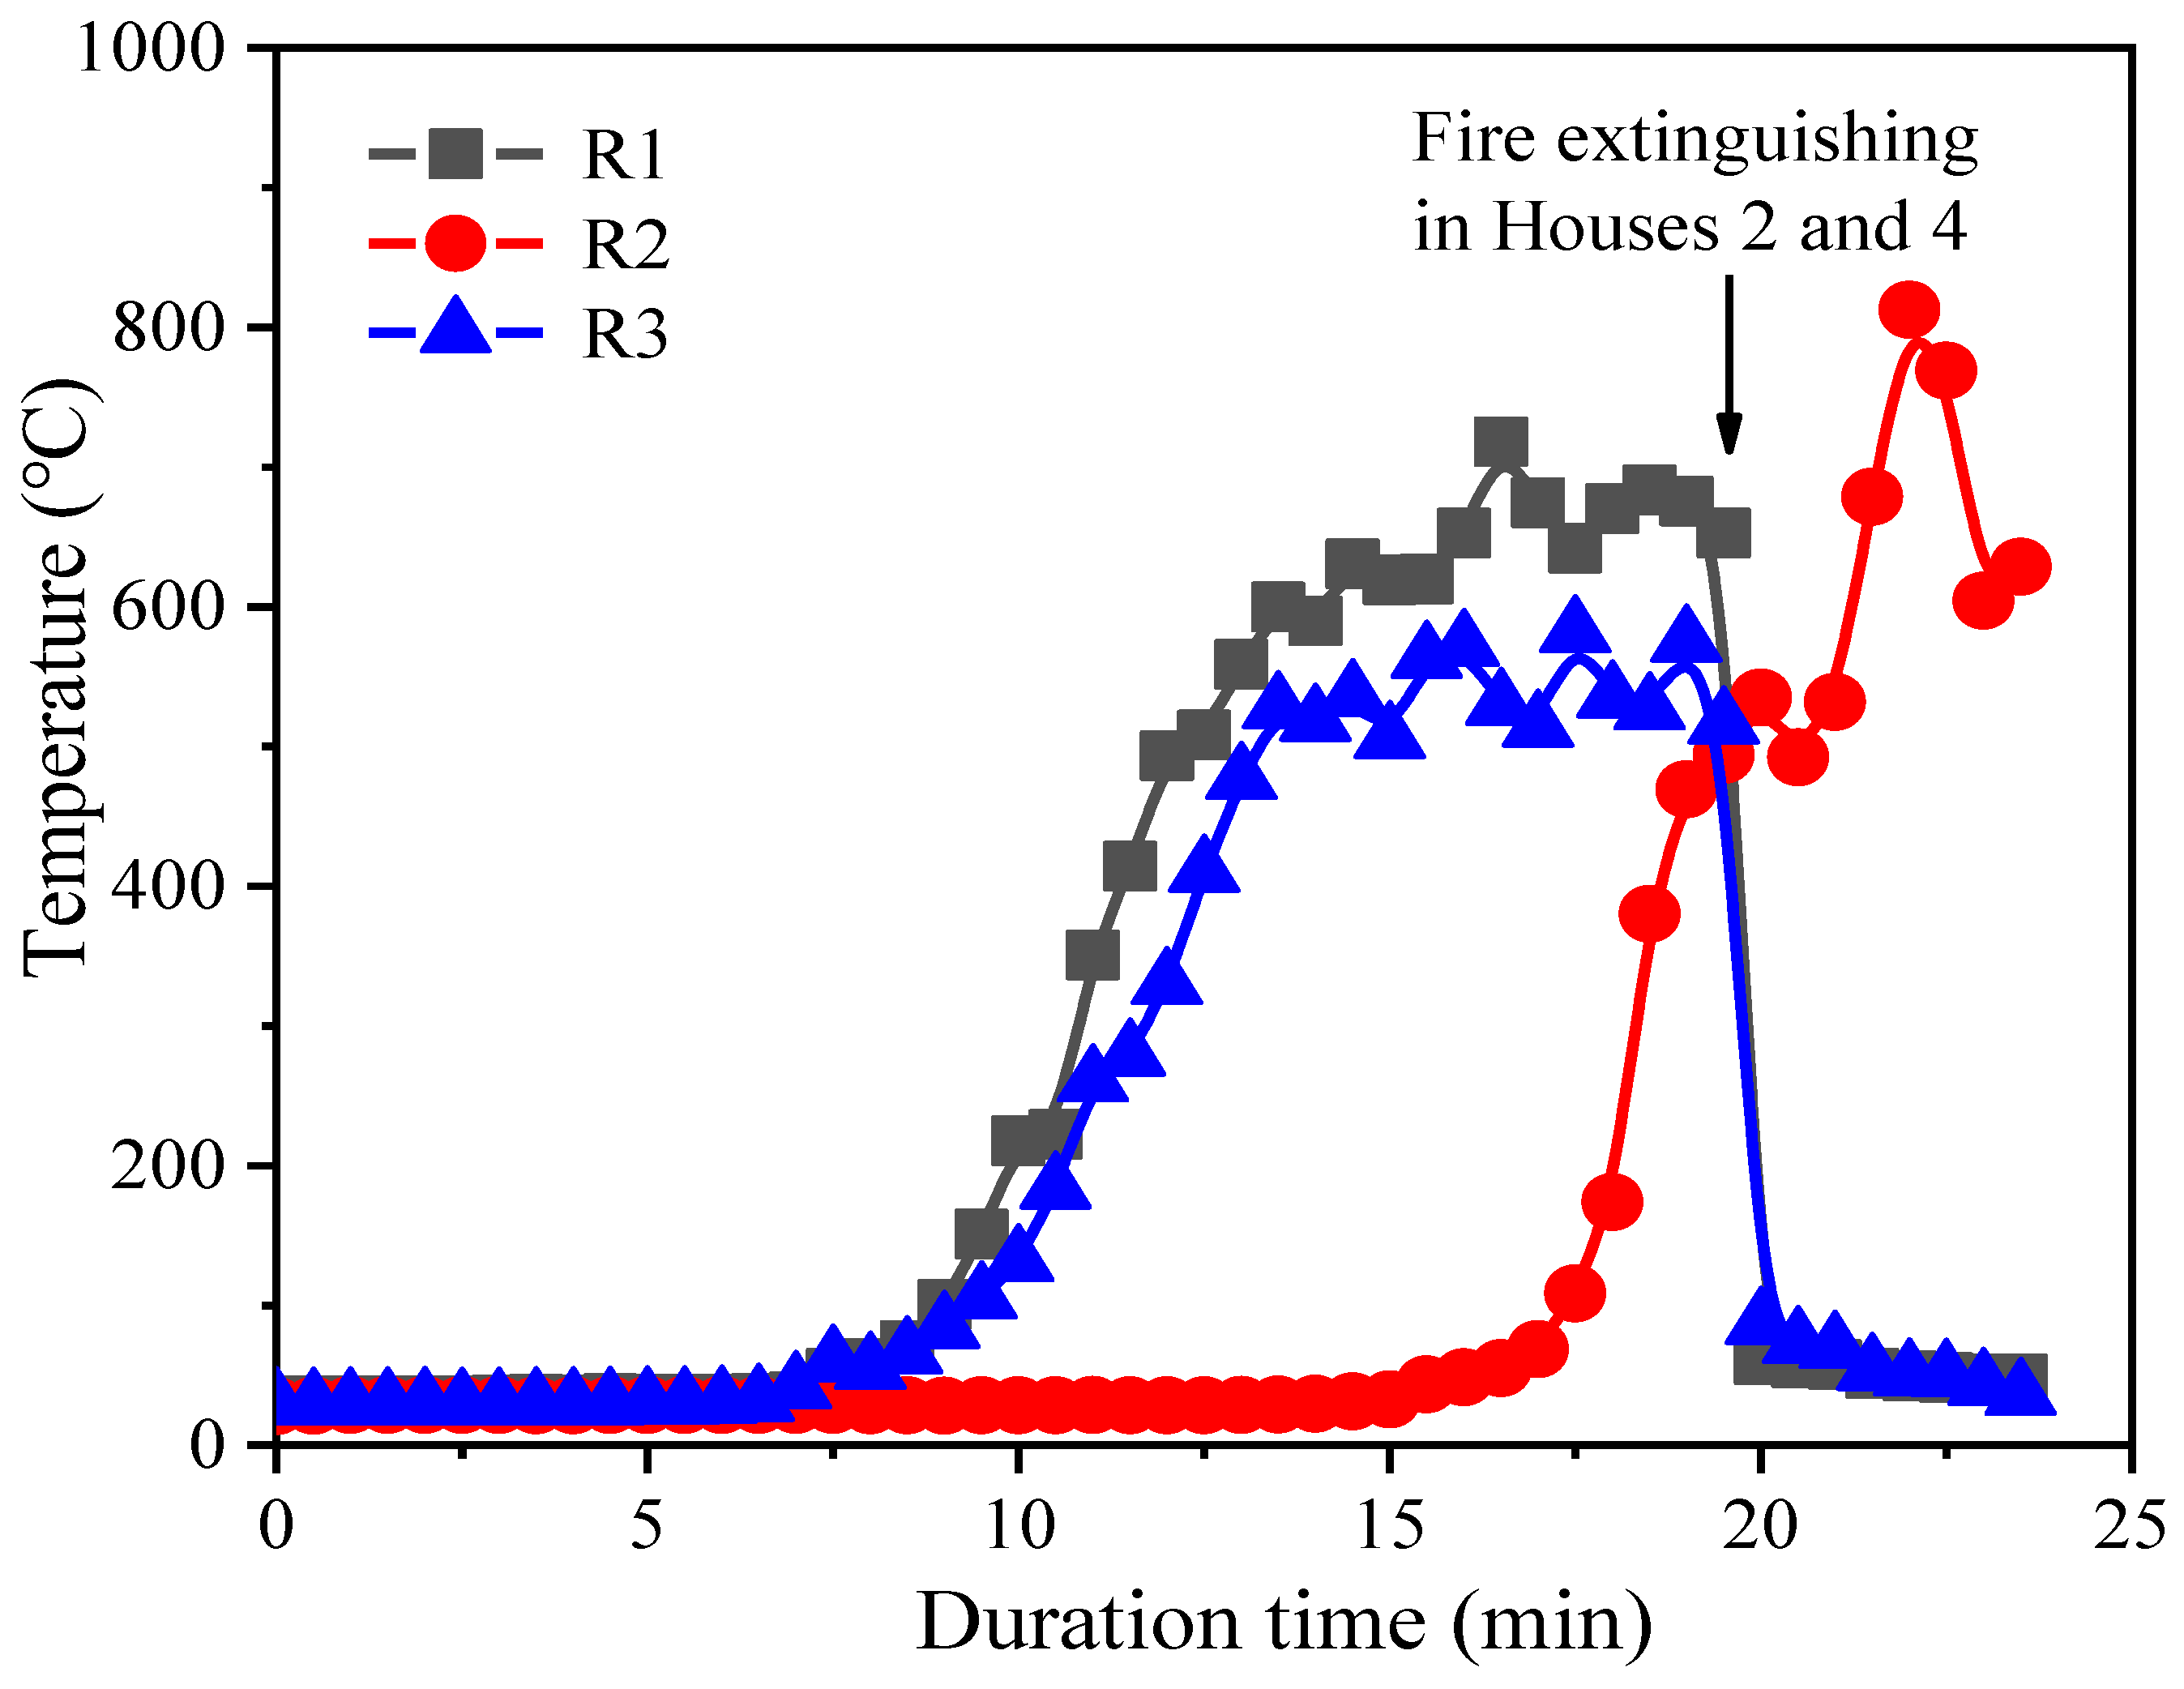
3.2. Analysis of Fire Spread Rule in Wooden Houses

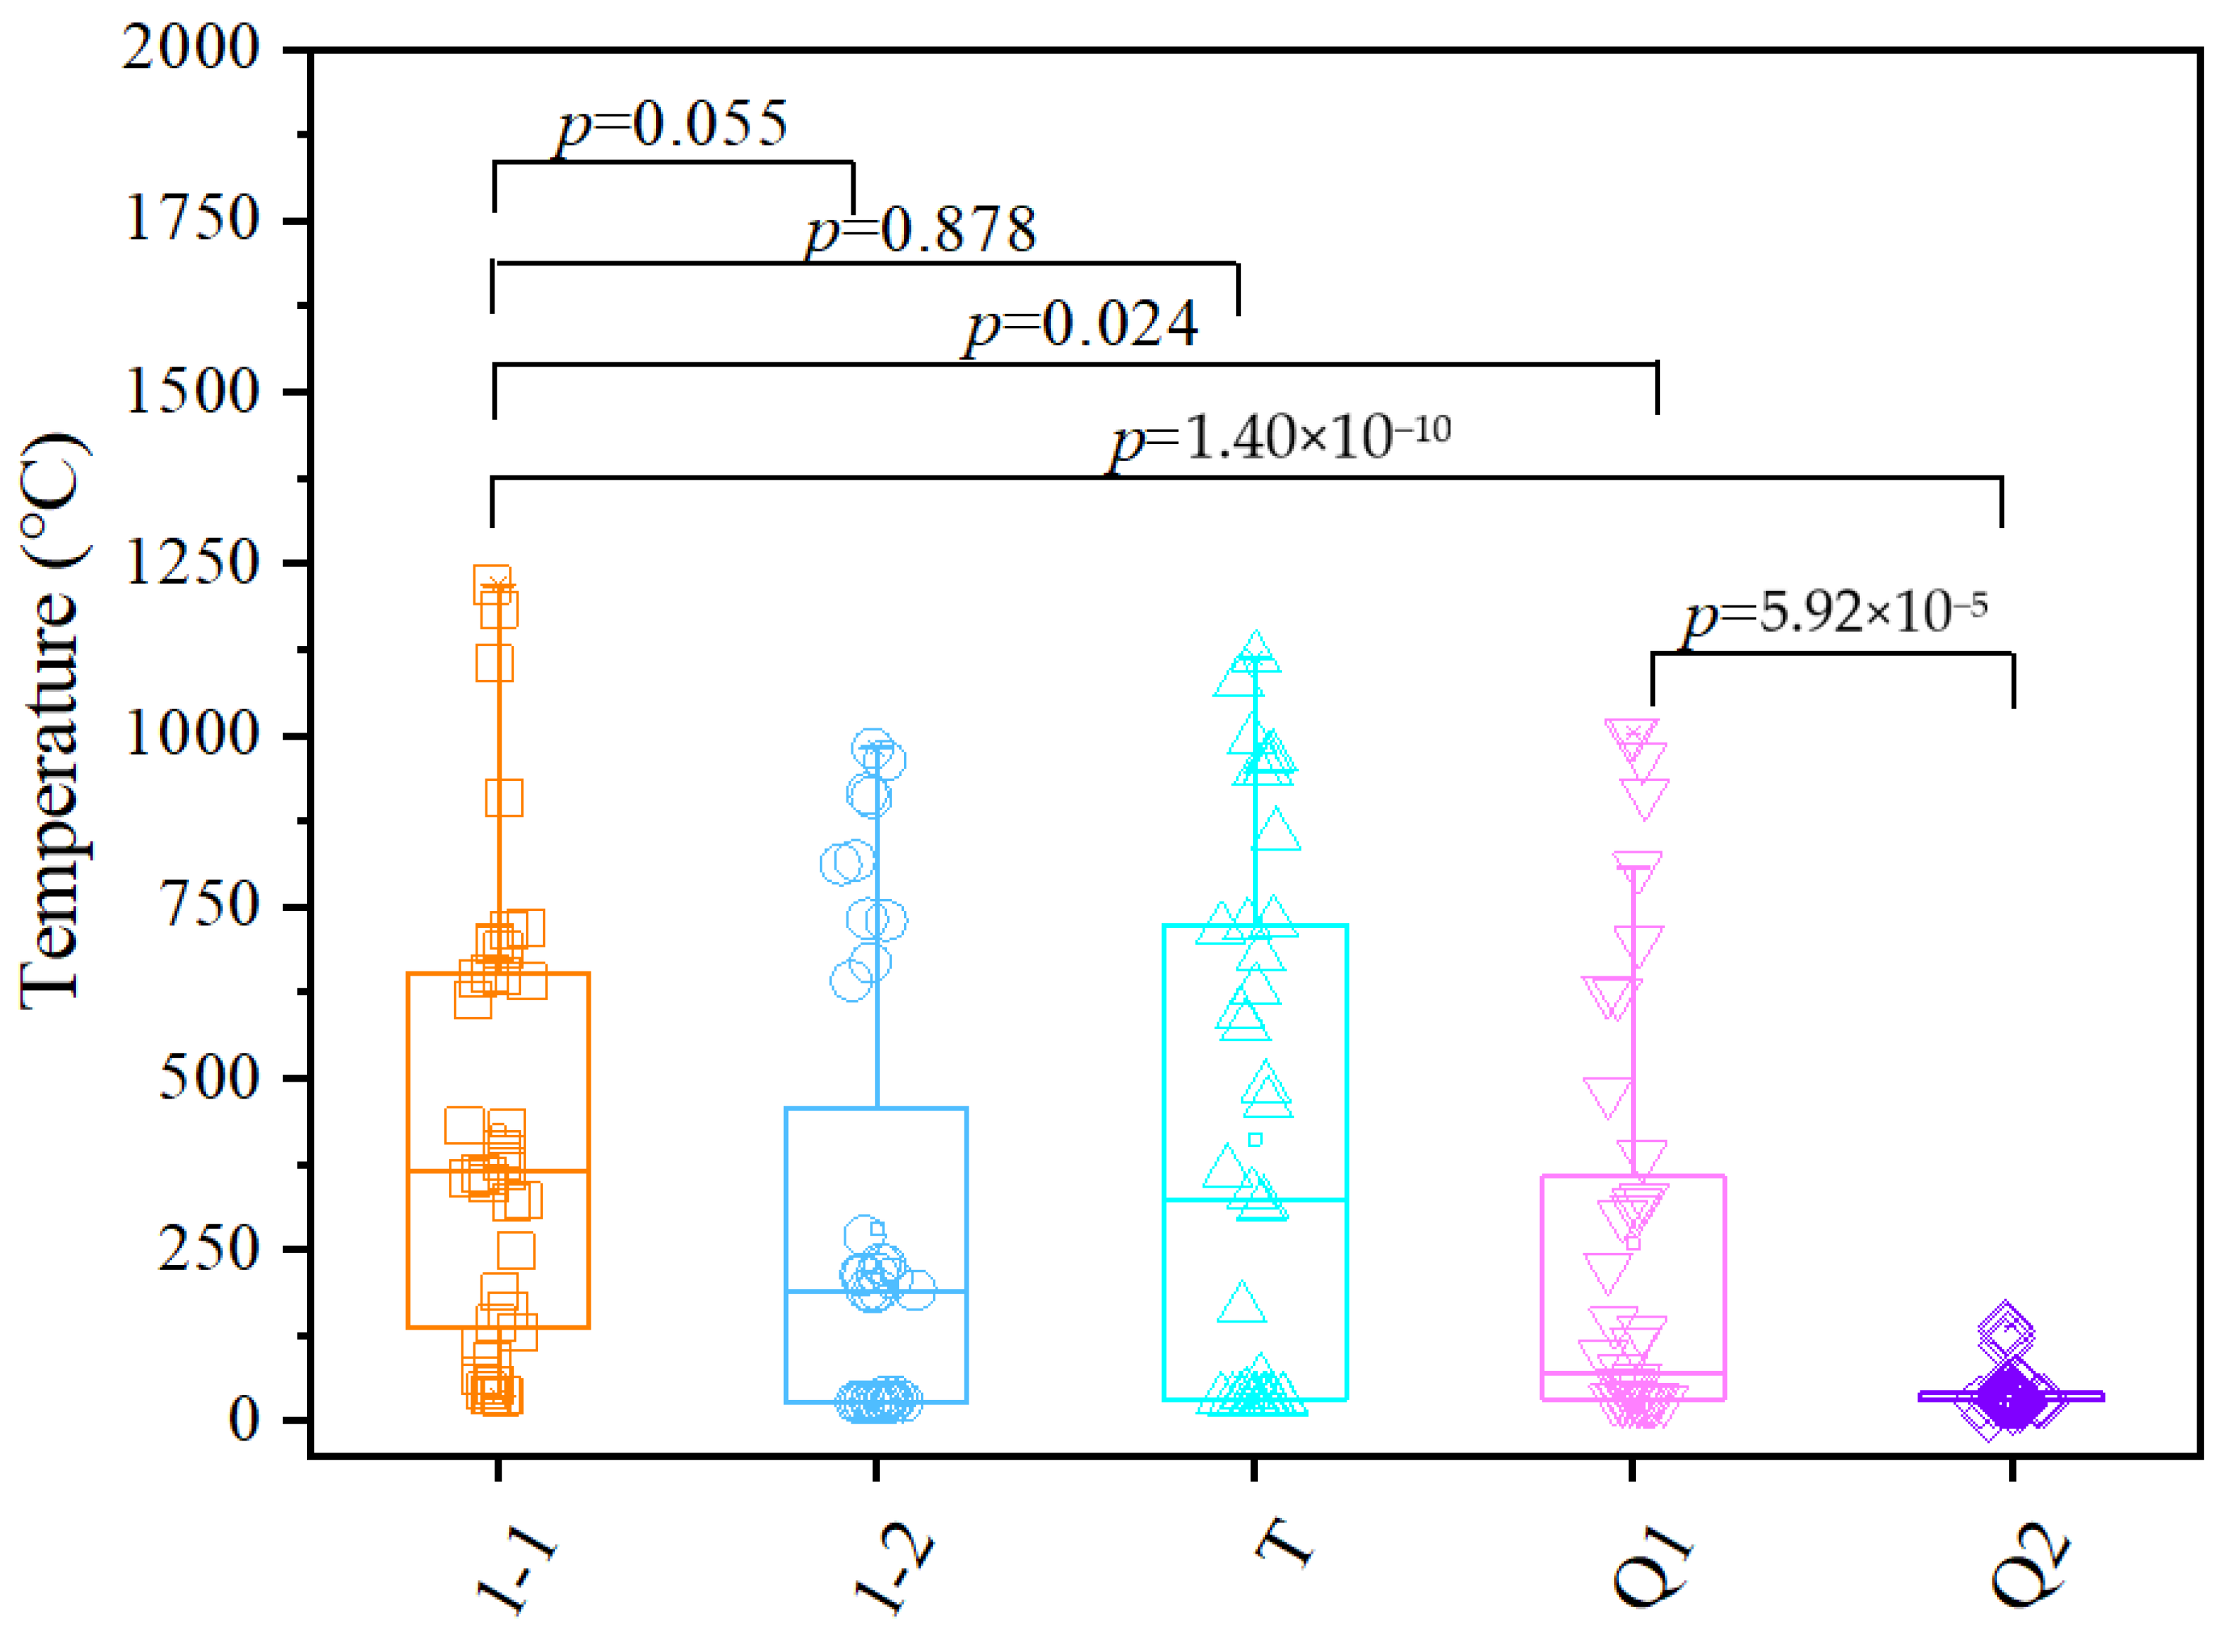
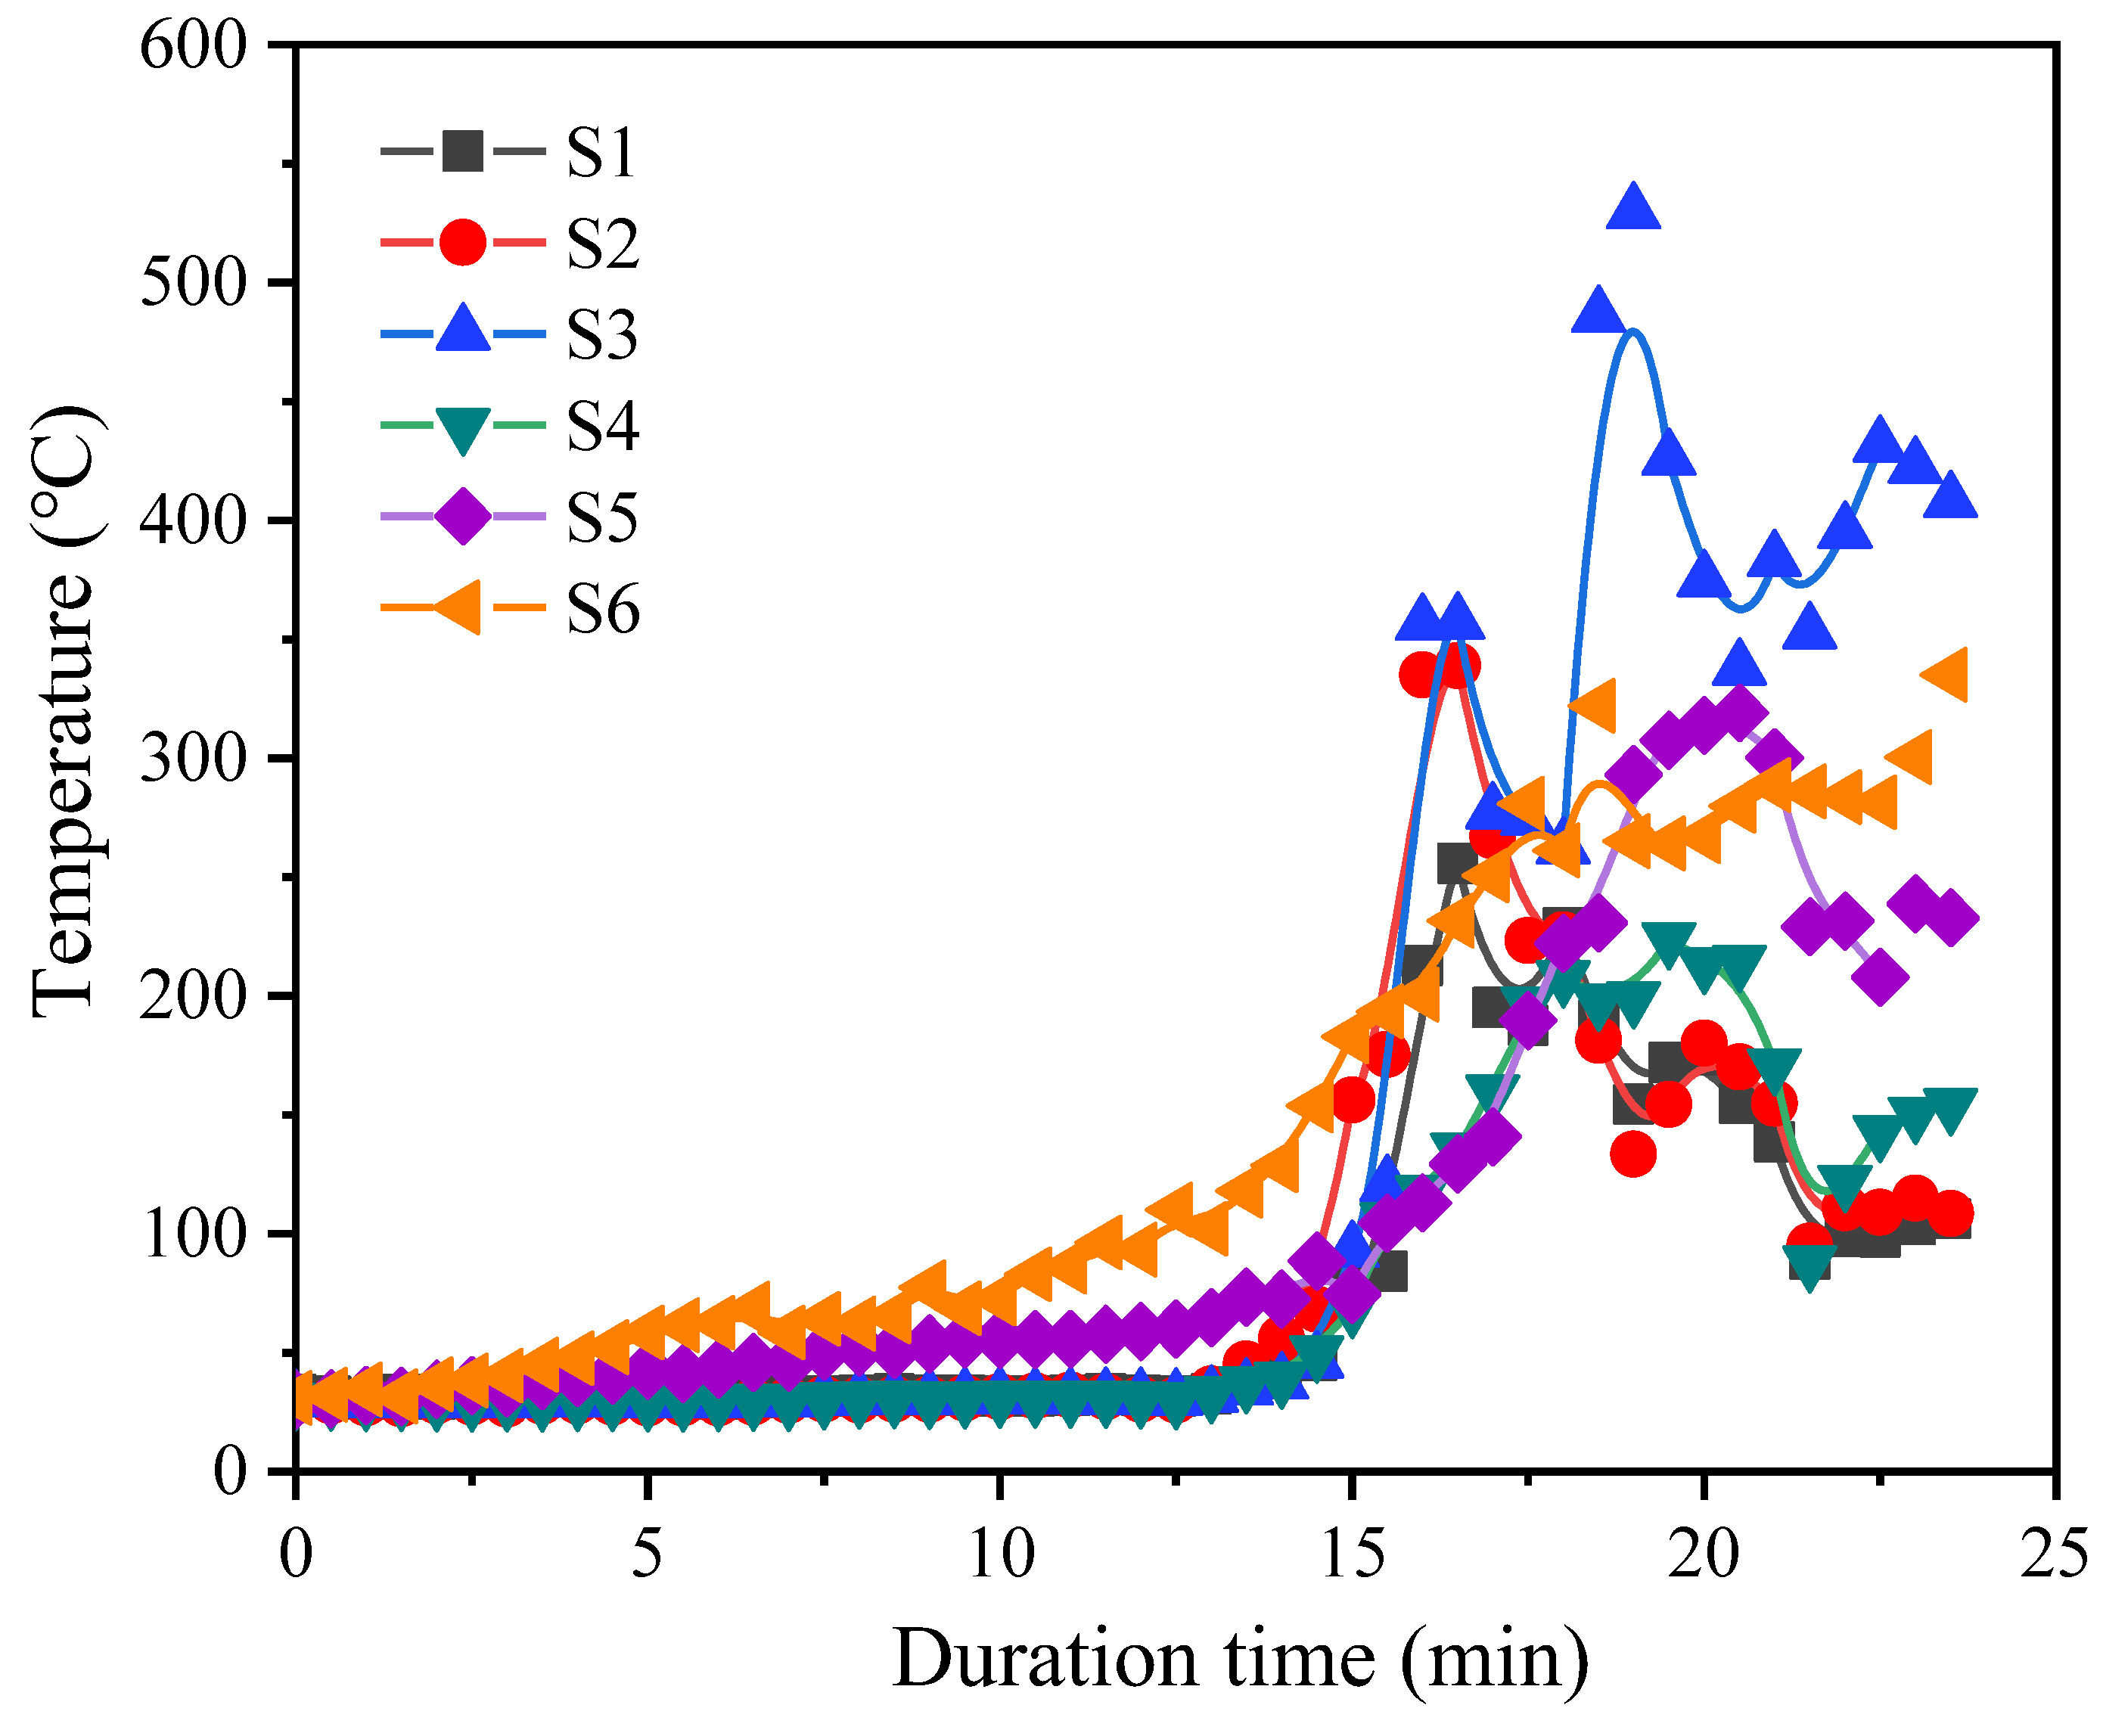
3.2.1. Analysis of the Visual Characteristics

Figure 10 contains photos taken from outside the buildings during the fire spread. Between 10 and 12 min, House 1 was burning in its entirety (large amounts of fire and smoke were visible from the outside), while Houses 2–4 showed no signs of ignition.
At 16 min, only the foundation structure of House 1 was left; moreover, the west eaves of House 2 and the south eaves of House 4 had ignited. At 19 min, the foundation of House 1 was burning, the west eaves of House 2 were burning, the east eaves of House 3 had ignited, and the south exterior wall and eaves of House 4 were burning. At 20 min, firefighting operations were carried out on Houses 2 and 4. In the final part of the test (between 23 and 33 min), Houses 1 and 3 completely collapsed, the exterior walls and eaves of House 2 were completely burned (with no obvious changes in the interior), and the south exterior wall and eaves of House 4 were completely burned.

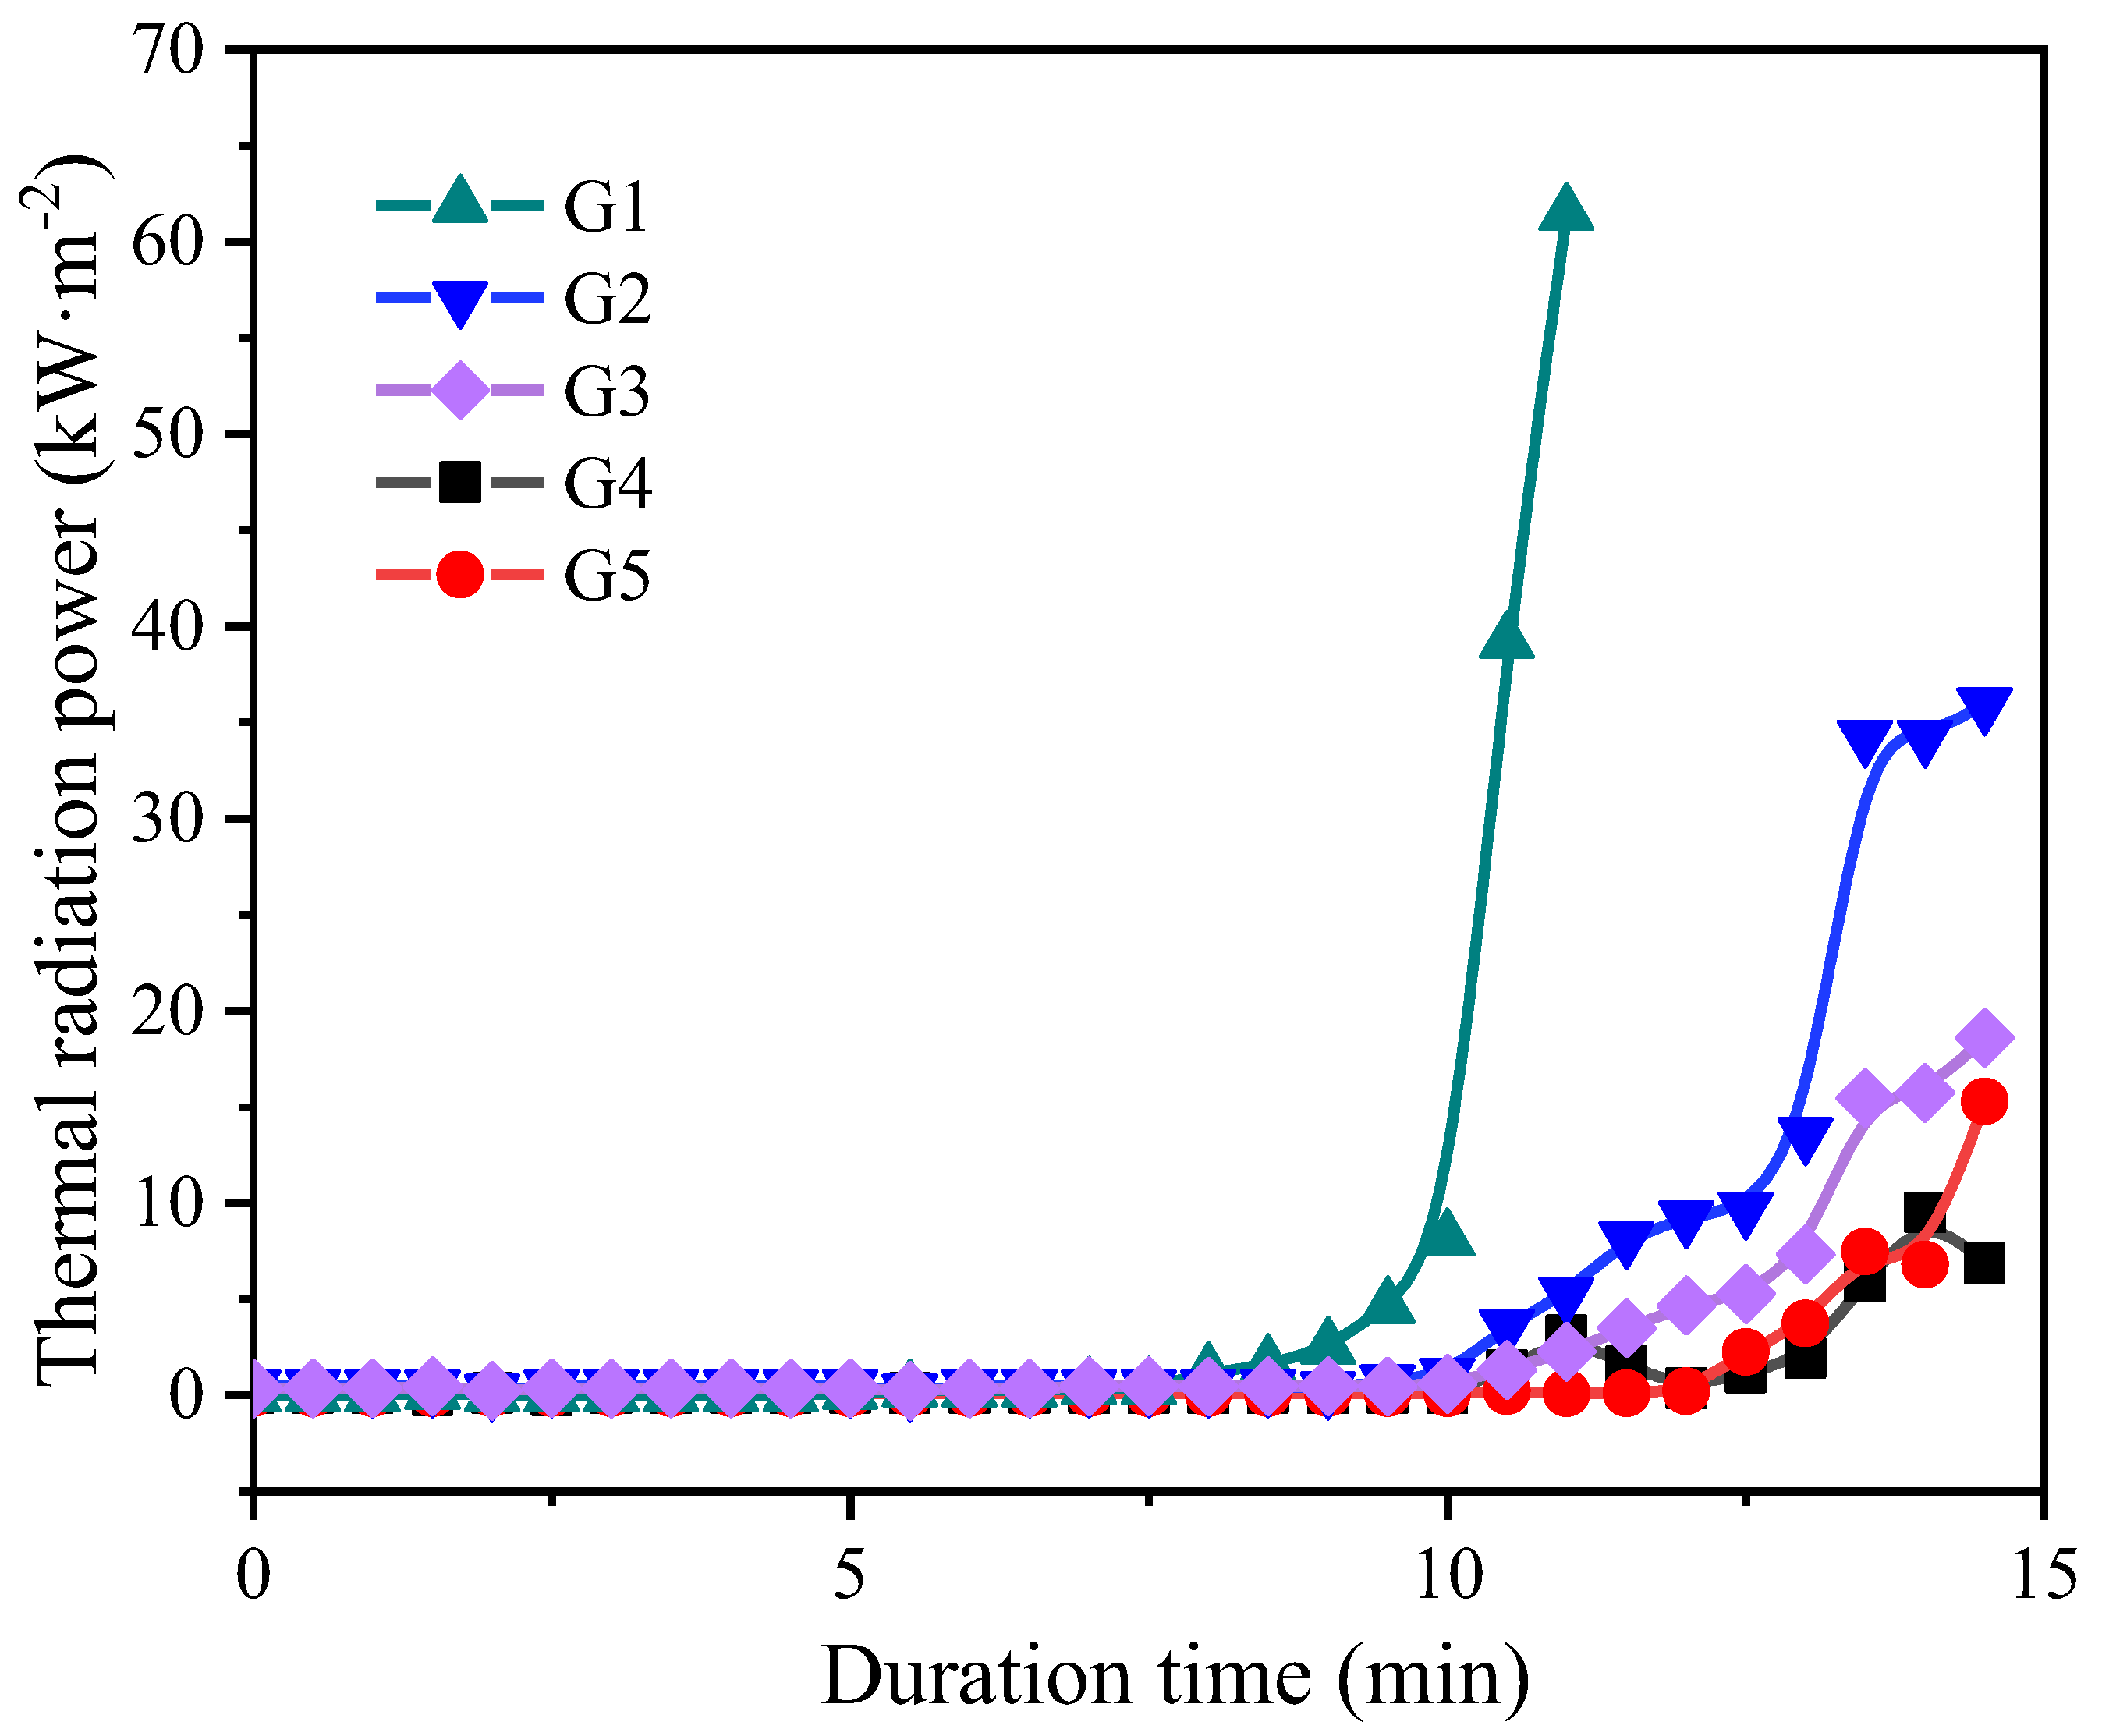
3.2.2. Effect of Fireproof Materials

The correlations between temperatures at points 1-1 (room 1), 1-2 (room 2), T (hall) (House 1), Q1 (exterior wall), and Q2 (interior wall) (1 m above the floor in House 2) are shown in Figure 11. In the case of House 1, the p-value between the temperatures of room 1 and room 2 (or the hall) was >0.05. Notably, there was a low significant relationship between the temperatures of the 2 tested points and the external wall of House 2 (0.01 < p < 0.05). The p-value between the temperature of room 1 (or the internal wall of House 2) and the internal wall of House 2 was instead <0.01. The above results proved that the fireproof paint sprayed on the inner wall of House 2 had a good fireproof effect, effectively slowing down the heating rate and the spread of fire.

3.2.3. Effect of Slope

The temperatures measured at points S1–S6 (along the slope between House 1 and House 4) are shown in Figure 12. At points 1–4, the temperature did not significantly change between 0 and 14 min; however, it started to rise from 14 min onwards. At points 5–6, the temperature gradually increased between 0 and 14 min, but it was higher at point 6; then, from 14 min onwards, it rose faster. The calculation followed Equations (1) and (2) and showed that F and R were 1.79 and 0.23 km/h, respectively. Thus, the rate of forward spread of fire on level to undulating ground was 0.233 km/h. The above results indicate that the slope had the greatest effect on fire spread. Before the fire spreads, a large amount of fire and smoke spread upward along the slope due to thermal pressure and the wall-hugging effect. This explains why the highest points (5 and 6) warmed up first.
F = 2.0 × e ( 23.6 + 5.01 × ln ( C ) + 0.0281 × T 0.226 H + 0.633 V )
R = 0.13 × F
where F was the fire danger index; C was the degree of curing (percent), 89%; T was the air temperature (°C), 24.5 °C; H was the relative humidity (percent), 91%; V was the average wind velocity in the open at the height of 10 m (km/h), 14.04 km/h; R was the rate of forward spread of fire on level to undulating ground.

3.2.4. Effect of Distance

The thermal radiation results obtained from points G1–G5 are shown in Figure 13. At point G1, thermal radiation started to increase at 8 min; then, from 10 min, it increased exponentially. Boom combustion occurred due to the non-completely confined configuration of the space fueling the combustion. Meanwhile, thermal radiation began to rise also at G2 and G3; however, the amount of thermal radiation at G2 was twice as high as that at G3. These results are consistent with those of Nishino et al. [47]; thermal radiation decreased as the distance between the monitoring point and the heat center increased. At G4 and G5, thermal radiation started to increase at 12 min and reached its maximum (9.53 kW m−2 and 15.29 kW m−2, respectively) at 14 min. The low thermal radiation of House 2 was related to the relative height and slope compared to House 4.

3.2.5. Principal Component Analysis Results and Validation

Figure 14 and Table 2 show the temperatures registered in Houses 1, 2, 3, and 4 and elaborated using the SPSS software, and the confidence intervals of measured temperatures are listed in Table A3. Figure 15a shows that the test points could be classified into three clusters, indicating that the fire spread phenomenon in the wooden houses was mainly influenced by three factors.
These three factors were further analyzed (Figure 15b and Table 1). Component 1 (Factor 1, identified as the slope) had an influence weight of 0.41, Component 2 (Factor 2, identified as the distance) had an influence weight of 0.41, and Component 3 (Factor 3, identified as the wind direction) had an influence weight of 0.08. Thus, distance and slope had the same influence weights on fire spread in the wooden houses, but thermal radiation was lower at G5 (where the slope was high) than at G3 (where the slope was low) (Figure 13). This indicates that, despite the high correlation between slope and distance, these two parameters influenced fire spread in different ways. In the fire risk assessment of wooden houses, safety analyses and calibrations of both distance and slope are required. Fireproofing materials achieve fire protection by slowing down heat radiation (Figure 11). Compared to slope and distance, wind direction had a lower influence weight in the test. This may have been due to the absence of adjacent buildings to the northwest (downwind side) of the burning building.
Since floors 2, 3, and 4 were first lit in correspondence with the eaves, we monitored the temperature at these locations (Figure 15). The temperatures of both R2 (eaves of House 2) and R4 (eaves of House 4) started to increase rapidly from 7.5 min; then, between 13 and 20 min, they remained relatively stable (averages of 650 and 550 °C, respectively). Finally, they started to decrease after 20 min due to fire extinguishing.
The temperature at R3 (eaves of House 3) started to rise at 15 min, reaching an average value of 800 °C at 21.5 min. Notably, R2 was ignited earlier due to its closer proximity to the fire source and the higher heat radiation compared to R4. Additionally, R4 was ignited earlier than R3 due to the higher slope of Houses 2 and 4. R2 and R4 were ignited almost simultaneously, indicating that distance and slope had a similar influence weight on fire spread. The temperatures shown in Figure 14 confirmed that distance and slope were the main factors influencing fire spread in the wooden houses, which was consistent with previous studies [48].
Therefore, while fire safety and cost should be simultaneously considered in a project, the fire damper and fireproof coating were preferentially chosen since the main factors are distance and slope. Additionally, further expansion of fire prevention space needs to be considered in rural planning due to the coupling effect of multi-factors.

4. Conclusions

The following conclusions were inferred from our experimental study.
(1) Fire spread was significantly correlated with relative height and wind direction. Before the fire started at 12 min, the correlation between height and fire spread was great (influence weight of 0.42); the higher the relative height, the greater the spread rate. At 11 min after the fire started, the correlation between wind direction and fire spread was great (influence weight of 0.47); the wind direction influenced the spread direction.
(2) The fire spread between adjacent buildings was mainly influenced by the distance, wind direction, and slope; specifically, the rate of forward spread of fire increased to 0.06 m/s when at the slope of 80°.
(3) When fire risk assessments are conducted, the relative slope and the distance between buildings need to be calibrated and analyzed separately.
(4) In this study, the findings provide a theoretical foundation for understanding the fire spread characteristics of wooden buildings. Further experiments should set varied wind velocities and directions to compare the influence weights of slope, distance, and wind properties.

Author Contributions

S.Y. and Y.L. were responsible for the experimental work, K.X., F.Y. and X.S. supervised the laboratory work, Q.L. and P.D. led the research. All authors have read and agreed to the published version of the manuscript.

Funding

This research and APC was funded by the National Key R&D Program Project [2018YFD1100403], and Key Technology Research on Fire Inspection for Construction Project Completion and Acceptance [2021-K-029].

Conflicts of Interest

The authors declare no conflict of interest.

Appendix A

Appendix A.1. Previous Fire Spread Tests for Fireproof Paint

Appendix A.1.1. In the Treatment of Chinese Fir Board (Nominal Density of 500 kg/m3, Nominal Density of 15 mm)

The dose of brushing the paint was 70 kg/m3 or 350 g/m2. After brushing, the pressure of 1 bar on board lasted for 10 min, followed by 12–14 bar for 150 min. After fire spread test, the woods with the paint brushing had a better property of fireproof than that without brushing. In addition, the board after painting had the corrosion protein.

Appendix A.1.2. In the Treatment of Other Materials

The dose of brushing the paint when the materials:
  • Bafta: 0.15 g paint per gram
  • Wool fabric: 0.12 g paint per gram
  • Polyamide: 0.12 g paint per gram
  • Polyester: 0.27 g paint per gram
  • Paper: 0.06 g paint per gram
Table A1. Description of site of measured thermocouple.
LocationNumber of ThermocouplesSum
Inside the House 1Room 1D, N, X, B, 1-1-1, 1-1-2, 1-1-3, 1-1-48
Room 21-21
Room 31-31
Room 41-41
HallT1
StaircaseL1
Second floorL2, E1, E2, E34
Outside the House 1 and House 4 S-1, S-2, S-3, S-4, S-5, S-66
Inside the House 2 Q2, 2-1, R13
On the wall of House 2 Q11
Inside the House 3 3-1, R22
Inside the House 4 4-1, R32
Total numbers 31

Appendix A.2. Principal Component Analysis and Validation

Table A2. Sample description a.
PointsStatisticsDeviationStandard ErrorInferior LimitUpper Limit
R112Average356.630.5675.71212.80507.03
Standard deviation371.01−11.0653.512240.99457.53
Case number23002323
R12Average value132.050.9846.1747.68232.26
Standard deviation225.76−10.8954.8761.47299.22
Case number23002323
TAverage value219.851.4071.7386.43375.76
Standard deviation355.68−11.5161.94195.57434.16
Case number23002323
1Average value44.790.074.6936.6554.88
Standard deviation22.84−1.145.499.7531.69
Case number23002323
Q2Average value30.060.010.2929.5530.72
Standard deviation1.43−0.080.390.442.01
Case number23002323
G4Average value0.290.010.140.100.61
Standard deviation0.67<−0.100.310.031.06
Case number23002323
G5Average value0.120.010.010.110.13
Standard deviation0.02<−0.010.0100.04
Case number23002323
G1Average value5.240.053.030.5612.21
Standard deviation14.74−1.525.751.0822.58
Case number23002323
G2Average value0.84<0.010.240.471.40
Standard deviation1.18−0.120.450.101.80
Case number23002323
G3Average value0.52<0.010.090.390.73
Standard deviation0.44−0.050.170.070.68
Case number23002323
S1Average value31.72−0.010.1531.4132.00
Standard deviation0.72−0.020.100.500.88
Case number23002323
S2Average value29.79<0.010.2029.4330.21
Standard deviation0.99−0.030.140.641.22
Case number23002323
S3Average value30.08<−0.010.1429.8030.37
Standard deviation0.70−0.020.070.520.80
Case number23002323
S4Average value30.25<0.010.1230.0230.50
Standard deviation0.57−0.010.060.420.66
Case number23002323
S5Average value43.40<0.011.8139.8247.07
Standard deviation8.93−0.220.827.0610.28
Case number23002323
S6Average value55.53<0.013.4248.8362.24
Standard deviation16.97−0.451.8012.8019.92
Case number23002323
R1Average value74.480.1517.0244.37111.60
Standard deviation83.25−4.9922.0028.67115.98
Case number23002323
R2Average value28.62<0.010.0428.5328.70
Standard deviation0.21−0.010.050.120.28
Case number23002323
R3Average value60.510.1312.1139.2287.05
Standard deviation59.00−3.5916.1620.7784.62
Case number23002323
a. Unless otherwise noted, Self-help sampling results were based on 1000 samples, and the confident interval was 95%.

Appendix A.3. Principal Component Analysis and Validation

Table A3. Sample description a.
PointsStatisticsDeviationStandard ErrorInferior LimitUpper Limit
DAverage262.31−2.6553.74165.11368.37
Standard deviation335.60−10.6150.20220.97408.14
Case number39003939
NAverage value250.54−2.2844.26166.79339.38
Standard deviation279.74−7.9933.04201.12330.23
Case number39003939
XAverage value314.05−2.7754.76210.00427.83
Standard deviation344.22−11.1047.37235.27415.66
Case number39003939
BAverage value324.40−2.0347.03230.22418.31
Standard deviation297.74−7.3827.38230.42339.12
Case number39003939
R111Average value86.48−0.3414.3359.12114.66
Standard deviation90.44−2.2012.4660.02109.63
Case number39003939
R112Average value117.78−1.0022.4875.21162.56
Standard deviation139.10−3.2314.52101.41158.28
Case number39003939
R113Average value310.65−2.7559.01196.78429.91
Standard deviation375.38−6.9823.74311.73404.59
Case number39003939
R114Average value187.86−1.6138.05114.45259.38
Standard deviation239.63−4.3419.48189.59264.50
Case number39003939
R12Average value266.33−2.0454.68163.47370.59
Standard deviation344.25−6.0930.72267.89387.57
Case number39003939
R14Average value145.88−0.9729.9389.22203.47
Standard deviation188.68−4.2722.72132.36221.88
Case number39003939
R13Average value184.71−0.7851.8690.33294.16
Standard deviation323.33−9.9757.55184.45413.93
Case number39003939
LAverage value243.00−2.8855.53134.22358.23
Standard deviation360.46−9.1246.43249.06426.73
Case number39003939
TAverage value318.63−3.3464.80194.88446.98
Standard deviation415.31−7.9332.63335.43461.11
Case number39003939
L2Average value264.16−3.0555.37157.41377.83
Standard deviation350.73−7.8933.36268.41396.39
Case number39003939
a. Unless otherwise noted, Self-help sampling results were based on 1000 self-help samples, and the confident interval was 95%.

References

  1. Chen, L.; Tang, F.; Pang, H. Ceiling heat flux and downward received radiation heat flux induced by weak and relative strong fire plume in ventilation tunnels. Appl. Therm. Eng. 2020, 169, 114924. [Google Scholar] [CrossRef]
  2. Bedon, C.; Fragiacomo, M. Fire Resistance of In-Plane Compressed Log-House Timber Walls with Partial Thermal Insulation. Buildings 2018, 8, 131. [Google Scholar] [CrossRef] [Green Version]
  3. Khidmat, R.P.; Fukuda, H. Kustiani Design Optimization of Hyperboloid Wooden House Concerning Structural, Cost, and Daylight Performance. Buildings 2022, 12, 110. [Google Scholar] [CrossRef]
  4. Chorlton, B.; Gales, J. Fire performance of cultural heritage and contemporary timbers. Eng. Struct. 2019, 201, 109739. [Google Scholar] [CrossRef]
  5. Lange, D.; Boström, L.; Schmid, J.; Albrektsson, J. The Reduced Cross Section Method Applied to Glulam Timber Exposed to Non-standard Fire Curves. Fire Technol. 2015, 51, 1311–1340. [Google Scholar] [CrossRef]
  6. Allaire, F.; Mallet, V.; Filippi, J.-B. Novel method for a posteriori uncertainty quantification in wildland fire spread simulation. Appl. Math. Model. 2021, 90, 527–546. [Google Scholar] [CrossRef]
  7. Zhao, S. GisFFE—An integrated software system for the dynamic simulation of fires following an earthquake based on GIS. Fire Saf. J. 2010, 45, 83–97. [Google Scholar] [CrossRef]
  8. Huang, X.; Sun, J.; Ji, J.; Zhang, Y.; Wang, Q.; Zhang, Y. Flame spread over the surface of thermal insulation materials in different environments. Chin. Sci. Bull. 2011, 56, 1617–1622. [Google Scholar] [CrossRef] [Green Version]
  9. Johnson, M.C.; Kennedy, M.C.; Harrison, S.C.; Churchill, D.; Pass, J.; Fischer, P.W. Effects of post-fire management on dead woody fuel dynamics and stand structure in a severely burned mixed-conifer forest, in northeastern Washington State, USA. For. Ecol. Manag. 2020, 470, 118190. [Google Scholar] [CrossRef]
  10. Jones, N.; Peck, G.; McKenna, S.T.; Glockling, J.L.D.; Harbottle, J.; Stec, A.A.; Hull, T.R. Burning behaviour of rainscreen façades. J. Hazard. Mater. 2021, 403, 123894. [Google Scholar] [CrossRef] [PubMed]
  11. Kristoffersen, M.; Log, T. Experience gained from 15 years of fire protection plans for Nordic wooden towns in Norway. Saf. Sci. 2021, 146, 105535. [Google Scholar] [CrossRef]
  12. Martín-Garín, A.; Millán-García, J.A.; Terés-Zubiaga, J.; Oregi, X.; Rodríguez-Vidal, I.; Baïri, A. Improving Energy Performance of Historic Buildings through Hygrothermal Assessment of the Envelope. Buildings 2021, 11, 410. [Google Scholar] [CrossRef]
  13. Himoto, K.; Suzuki, K. Computational framework for assessing the fire resilience of buildings using the multi-layer zone model. Reliab. Eng. Syst. Saf. 2021, 216, 108023. [Google Scholar] [CrossRef]
  14. Cicione, A.; Walls, R.; Sander, Z.; Flores, N.; Narayanan, V.; Stevens, S.; Rush, D. The Effect of Separation Distance Between Informal Dwellings on Fire Spread Rates Based on Experimental Data and Analytical Equations. Fire Technol. 2021, 57, 873–909. [Google Scholar] [CrossRef]
  15. Cicione, A.; Walls, R.; Kahanji, C. Experimental study of fire spread between multiple full scale informal settlement dwellings. Fire Saf. J. 2019, 105, 19–27. [Google Scholar] [CrossRef]
  16. Friedlander, S.K. Smoke, Dust and Haze: Fundamentals of Aerosol Behavior; Wiley-Interscience: New York, NY, USA, 1977; p. 317. [Google Scholar]
  17. Hasemi, Y. Full-Scale Burn Test of Wooden Three-Story Apartment Building. Fire Sci. Technol. 1997, 17, 78–92. [Google Scholar] [CrossRef] [Green Version]
  18. Slocum, M.G.; Beckage, B.; Platt, W.J.; Orzell, S.L.; Taylor, W. Effect of Climate on Wildfire Size: A Cross-Scale Analysis. Ecosystems 2010, 13, 828–840. [Google Scholar] [CrossRef]
  19. Zhang, J.; Wang, Y.; Li, L.; Xu, Q. Thermo-mechanical behaviour of dovetail timber joints under fire exposure. Fire Saf. J. 2019, 107, 75–88. [Google Scholar] [CrossRef]
  20. Li, M.; Hasemi, Y.; Nozoe, Y.; Nagasawa, M. Study on strategy for fire safety planning based on local resident cooperation in a preserved historical mountain village in Japan. Int. J. Disaster Risk Reduct. 2021, 56, 102081. [Google Scholar] [CrossRef]
  21. Maraveas, C.; Miamis, K.; Matthaiou, C.E. Performance of Timber Connections Exposed to Fire: A Review. Fire Technol. 2013, 51, 1401–1432. [Google Scholar] [CrossRef]
  22. Stubbs, D.C.; Humphreys, L.H.; Goldman, A.; Childtree, A.M.; Kush, J.S.; Scarborough, D.E. An experimental investigation into the wildland fire burning characteristics of loblolly pine needles. Fire Saf. J. 2021, 126, 103471. [Google Scholar] [CrossRef]
  23. Zekri, N.; Zekri, L.; Lallemand, C.; Pizzo, Y.; Kaiss, A.; Clerc, J.; Porterie, B. Fire spread and percolation in polydisperse com-partment structures. J. Phys. Conf. Ser. 2012, 395, 12010. [Google Scholar] [CrossRef]
  24. Bilyaz, S.; Buffington, T.; Ezekoye, O.A. The effect of fire location and the reverse stack on fire smoke transport in high-rise buildings. Fire Saf. J. 2021, 126, 103446. [Google Scholar] [CrossRef]
  25. Gerzhova, N.; Blanchet, P.; Dagenais, C.; Côté, J.; Ménard, S. Heat Transfer Behavior of Green Roof Systems Under Fire Condition: A Nu-merical Study. Buildings 2019, 9, 206. [Google Scholar] [CrossRef] [Green Version]
  26. Suzuki, S.; Manzello, S.L. Understanding structure ignition vulnerabilities using mock-up sections of attached wood fencing assemblies. Fire Mater. 2019, 43, 675–684. [Google Scholar] [CrossRef]
  27. Zhang, X.; Hu, L.; Sun, X. Temperature profile of thermal flow underneath an inclined ceiling induced by a wall-attached fire. Int. J. Therm. Sci. 2019, 141, 133–140. [Google Scholar] [CrossRef]
  28. Zhang, X.; Tao, H.; Zhang, Z.; Liu, J.; Liu, A.; Xu, W.; Liu, X. Flame extension area of unconfined thermal ceiling jets induced by rectangular-source jet fire impingement. Appl. Therm. Eng. 2018, 132, 801–807. [Google Scholar] [CrossRef]
  29. Anderson, K.; Reuter, G.; Flannigan, M.D. Fire-growth modelling using meteorological data with random and systematic per-turbations. Int. J. Wildland Fire 2007, 16, 174. [Google Scholar] [CrossRef]
  30. Anderson, K. A climatologically based long-range fire growth model. Int. J. Wildland Fire 2010, 19, 879–894. [Google Scholar] [CrossRef]
  31. Ding, L.; Ji, J.; Khan, F.; Li, X.; Wan, S. Quantitative fire risk assessment of cotton storage and a criticality analysis of risk control strategies. Fire Mater. 2020, 44, 165–179. [Google Scholar] [CrossRef]
  32. Lönnermark, A.; Ingason, H. Fire Spread and Flame Length in Large-Scale Tunnel Fires. Fire Technol. 2006, 42, 283–302. [Google Scholar] [CrossRef]
  33. Ciri, U.; Garimella, M.M.; Bernardoni, F.; Bennett, R.L.; Leonardi, S. Uncertainty quantification of forecast error in coupled fire–atmosphere wildfire spread simulations: Sensitivity to the spatial resolution. Int. J. Wildland Fire 2021, 30, 790. [Google Scholar] [CrossRef]
  34. Raposo, J.R.; Viegas, D.X.; Xie, X.; Almeida, M.; Figueiredo, A.R.; Porto, L.; Sharples, J. Analysis of the physical processes associated with junction fires at laboratory and field scales. Int. J. Wildland Fire 2018, 27, 52–68. [Google Scholar] [CrossRef]
  35. Schulz, J.; Kent, D.; Crimi, T.; Glockling, J.L.D.; Hull, T.R. A Critical Appraisal of the UK’s Regulatory Regime for Combustible Façades. Fire Technol. 2021, 57, 261–290. [Google Scholar] [CrossRef]
  36. Borodinecs, A.; Geikins, A.; Barone, E.; Jacnevs, V.; Prozuments, A. Solution of Bullet Proof Wooden Frame Construction Panel with a Built-In Air Duct. Buildings 2021, 12, 30. [Google Scholar] [CrossRef]
  37. De Koker, N.; Walls, R.S.; Cicione, A.; Sander, Z.R.; Löffel, S.; Claasen, J.J.; Fourie, S.J.; Croukamp, L.; Rush, D. 20 Dwelling Large-Scale Experiment of Fire Spread in Informal Settlements. Fire Technol. 2020, 56, 1599–1620. [Google Scholar] [CrossRef]
  38. Rossa, C.G.; Fernandes, P.M. Empirical Modeling of Fire Spread Rate in No-Wind and No-Slope Conditions. For. Sci. 2018, 64, 358–370. [Google Scholar] [CrossRef]
  39. Suh, H.-W.; Im, S.-M.; Park, T.-H.; Kim, H.-J.; Kim, H.-S.; Choi, H.-K.; Chung, J.-H.; Bae, S.-C. Fire Spread of Thermal Insulation Materials in the Ceiling of Piloti-Type Structure: Comparison of Numerical Simulation and Experimental Fire Tests Using Small- and Real-Scale Models. Sustainability 2019, 11, 3389. [Google Scholar] [CrossRef] [Green Version]
  40. Gamba, A.; Charlier, M.; Franssen, J.-M. Propagation tests with uniformly distributed cellulosic fire load. Fire Saf. J. 2020, 117, 103213. [Google Scholar] [CrossRef]
  41. Spearpoint, M.; Quintiere, J. Predicting the piloted ignition of wood in the cone calorimeter using an integral model—Effect of species, grain orientation and heat flux. Fire Saf. J. 2001, 36, 391–415. [Google Scholar] [CrossRef]
  42. Rackauskaite, E.; Bonner, M.; Restuccia, F.; Anez, N.F.; Christensen, E.G.; Roenner, N.; Wegrzynski, W.; Turkowski, P.; Tofilo, P.; Heidari, M.; et al. Fire Experiment Inside a Very Large and Open-Plan Compartment: X-ONE. Fire Technol. 2021, 58, 905–939. [Google Scholar] [CrossRef]
  43. Nishino, T.; Tanaka, T.; Hokugo, A. An evaluation method for the urban post-earthquake fire risk considering multiple scenarios of fire spread and evacuation. Fire Saf. J. 2012, 54, 167–180. [Google Scholar] [CrossRef]
  44. Poulsen, A.; Bwalya, A.; Jomaas, G. Evaluation of the Onset of Flashover in Room Fire Experiments. Fire Technol. 2013, 49, 891–905. [Google Scholar] [CrossRef]
  45. Daşdemir, O.; Aydın, F.; Ertuğrul, M. Factors Affecting the Behavior of Large Forest Fires in Turkey. Environ. Manag. 2021, 67, 162–175. [Google Scholar] [CrossRef]
  46. Huang, X.; Zhu, H.; Peng, L.; Zheng, Z.; Zeng, W.; Bi, K.; Cheng, C.; Chow, W. Thermal Characteristics of Vertically Spreading Cable Fires in Confined Compartments. Fire Technol. 2019, 55, 1849–1875. [Google Scholar] [CrossRef]
  47. Nishino, T.; Kagiya, K. A multi-layer zone model including flame spread over linings for simulation of room-corner fire behavior in timber-lined rooms. Fire Saf. J. 2019, 110, 102906. [Google Scholar] [CrossRef]
  48. Viegas, D.X. Slope and wind effects on fire propagation. Int. J. Wildland Fire 2004, 13, 143–156. [Google Scholar] [CrossRef]
Figure 1. Model of an ancient wooden building in southwest China.
Buildings 12 00575 g001
Figure 2. Construction process of the wooden houses and construction profile of the buildings. (a) Situation of test platform, (b) Prepared test wood, (c) Construction of buildings, (d) Completion of buildings, (e) Cross-section of the buildings’ structure.
Buildings 12 00575 g002aBuildings 12 00575 g002b
Figure 3. Plan of wooden houses, showing the test point locations.
Buildings 12 00575 g003
Figure 4. Diagram of the experimental model.
Buildings 12 00575 g004
Figure 5. Visual observation of the fire spread phenomenon (House 1), at times of (a) 0 min, (b) 6.6 min, (c) 10.2 min, (d) 10.8 min, (e) 12.3 min, and (f) 16 min.
Buildings 12 00575 g005
Figure 6. Correlation among (a) relative height, (b) direction, and temperature in room 1 of House 1. (a) Temperatures measured at the height of 0.5–2.0 m from the room floor, (b) Temperatures measured on the four walls of the room.
Buildings 12 00575 g006
Figure 7. Variation of temperature at the test points on the first floor of House 1.
Buildings 12 00575 g007
Figure 8. Statistical correlation between the temperatures at different test points in House 1. (a) Cluster analysis, (b) Dimension reduction analysis.
Buildings 12 00575 g008
Figure 9. Variations of temperature at the test points on the second floor of House 1.
Buildings 12 00575 g009
Figure 10. Fire spread among the Houses 1-4 (a,b), of which (a1,b1,c1,d1) were during the time of 10–12 min, (a2,b2,c2,d2) were at the time of 16 min, (a3,b3,c3,d3) were at the time of 19 min, and (a4,b4,c4,d4) were during the time of 23–33 min.
Buildings 12 00575 g010
Figure 11. Correlations between temperatures registered in Houses 1 and 2.
Buildings 12 00575 g011
Figure 12. Temperatures registered at different test points along the slope.
Buildings 12 00575 g012
Figure 13. Thermal radiation at the test points.
Buildings 12 00575 g013
Figure 14. Building eaves temperature of House 2–4.
Buildings 12 00575 g014
Figure 15. Results of the statistical correlations between temperature and thermal radiation at the whole test points. (a) Cluster analysis, (b) Dimension reduction analysis.
Buildings 12 00575 g015
Table 1. Dimension reduction analysis of temperature at the test points in House 1 during the whole experiment process.
Point NumberPrincipal Component 1Principal Component 2
1-30.966
1-1-10.957
1-40.956
1-20.8730.475
1-1-40.8640.497
1-1-20.8250.478
T0.7090.669
X 0.955
N 0.930
D 0.921
B 0.914
L0.4080.821
L20.6480.719
1-1-30.6570.718
Note: The principal component matrix converged after three iterations by rotation.
Table 2. Dimension reduction analysis results for temperature and thermal radiation at the test points.
Point NumberPrincipal Component 1Principal Component 2Principal Component 3
G20.952
G40.947
G10.9450.315
G30.9200.320
Q20.8060.567
Q10.7390.653
1-20.7230.606
G50.456
S5 0.932
S3 0.8930.324
S40.3330.871
1-10.4960.852
S60.3210.834
S20.5060.769
T0.5400.741
S1 0.944
Note: The principal component matrix converged after five iterations by rotation.
Publisher’s Note: MDPI stays neutral with regard to jurisdictional claims in published maps and institutional affiliations.

