
Investigation of Thermal Bridges of a New High-Performance Window Installation Using 2-D and 3-D Methodology


 ,
, 

Abstract
:1. Introduction
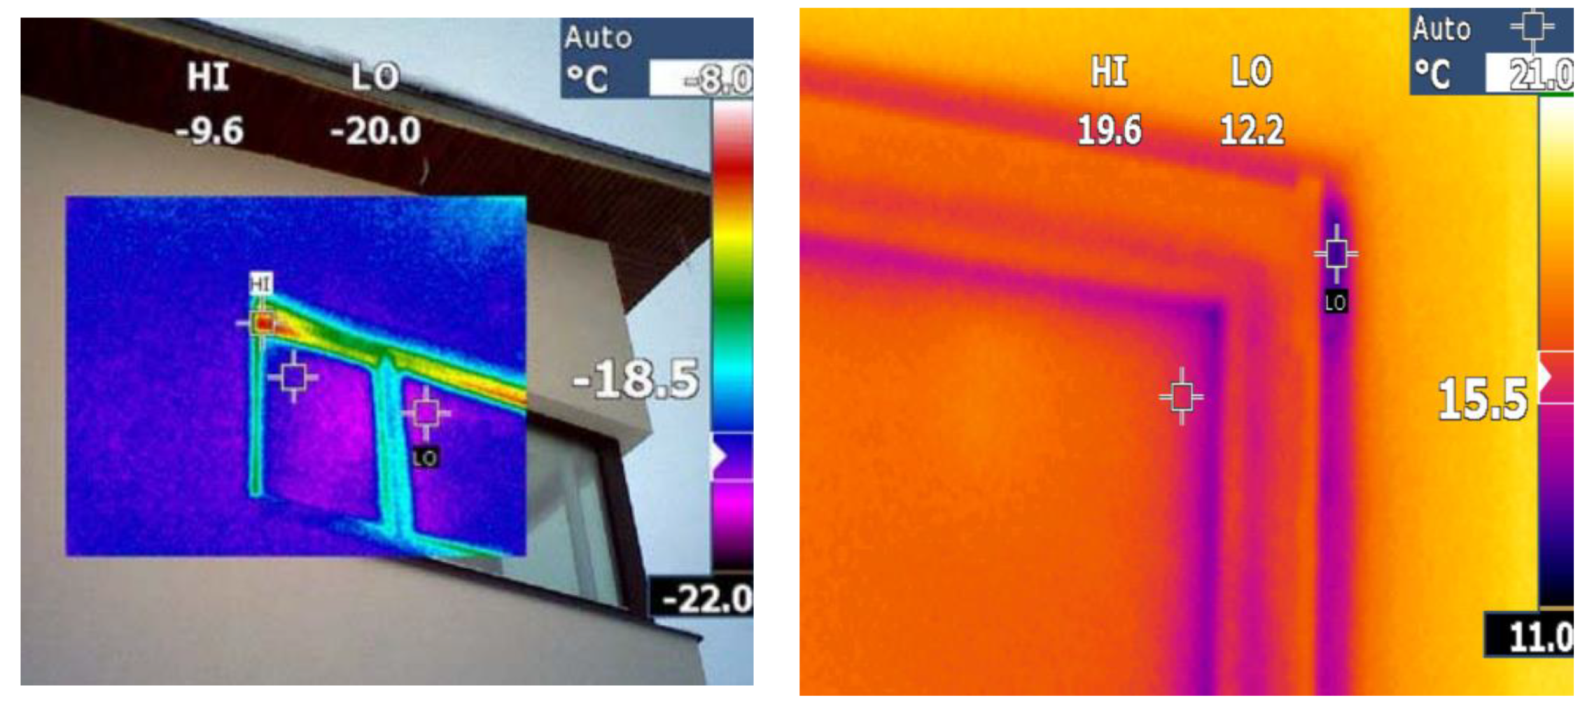
1.1. Thermal Bridge
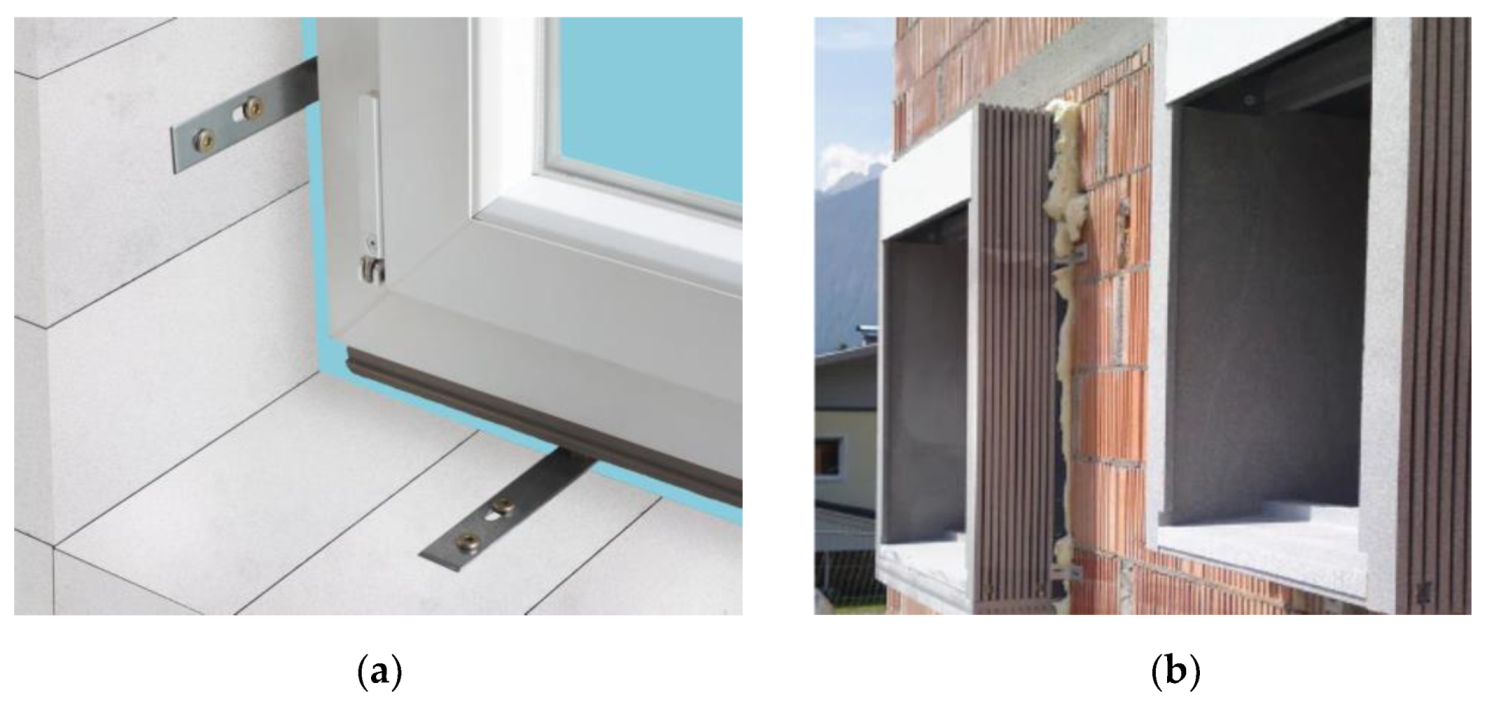
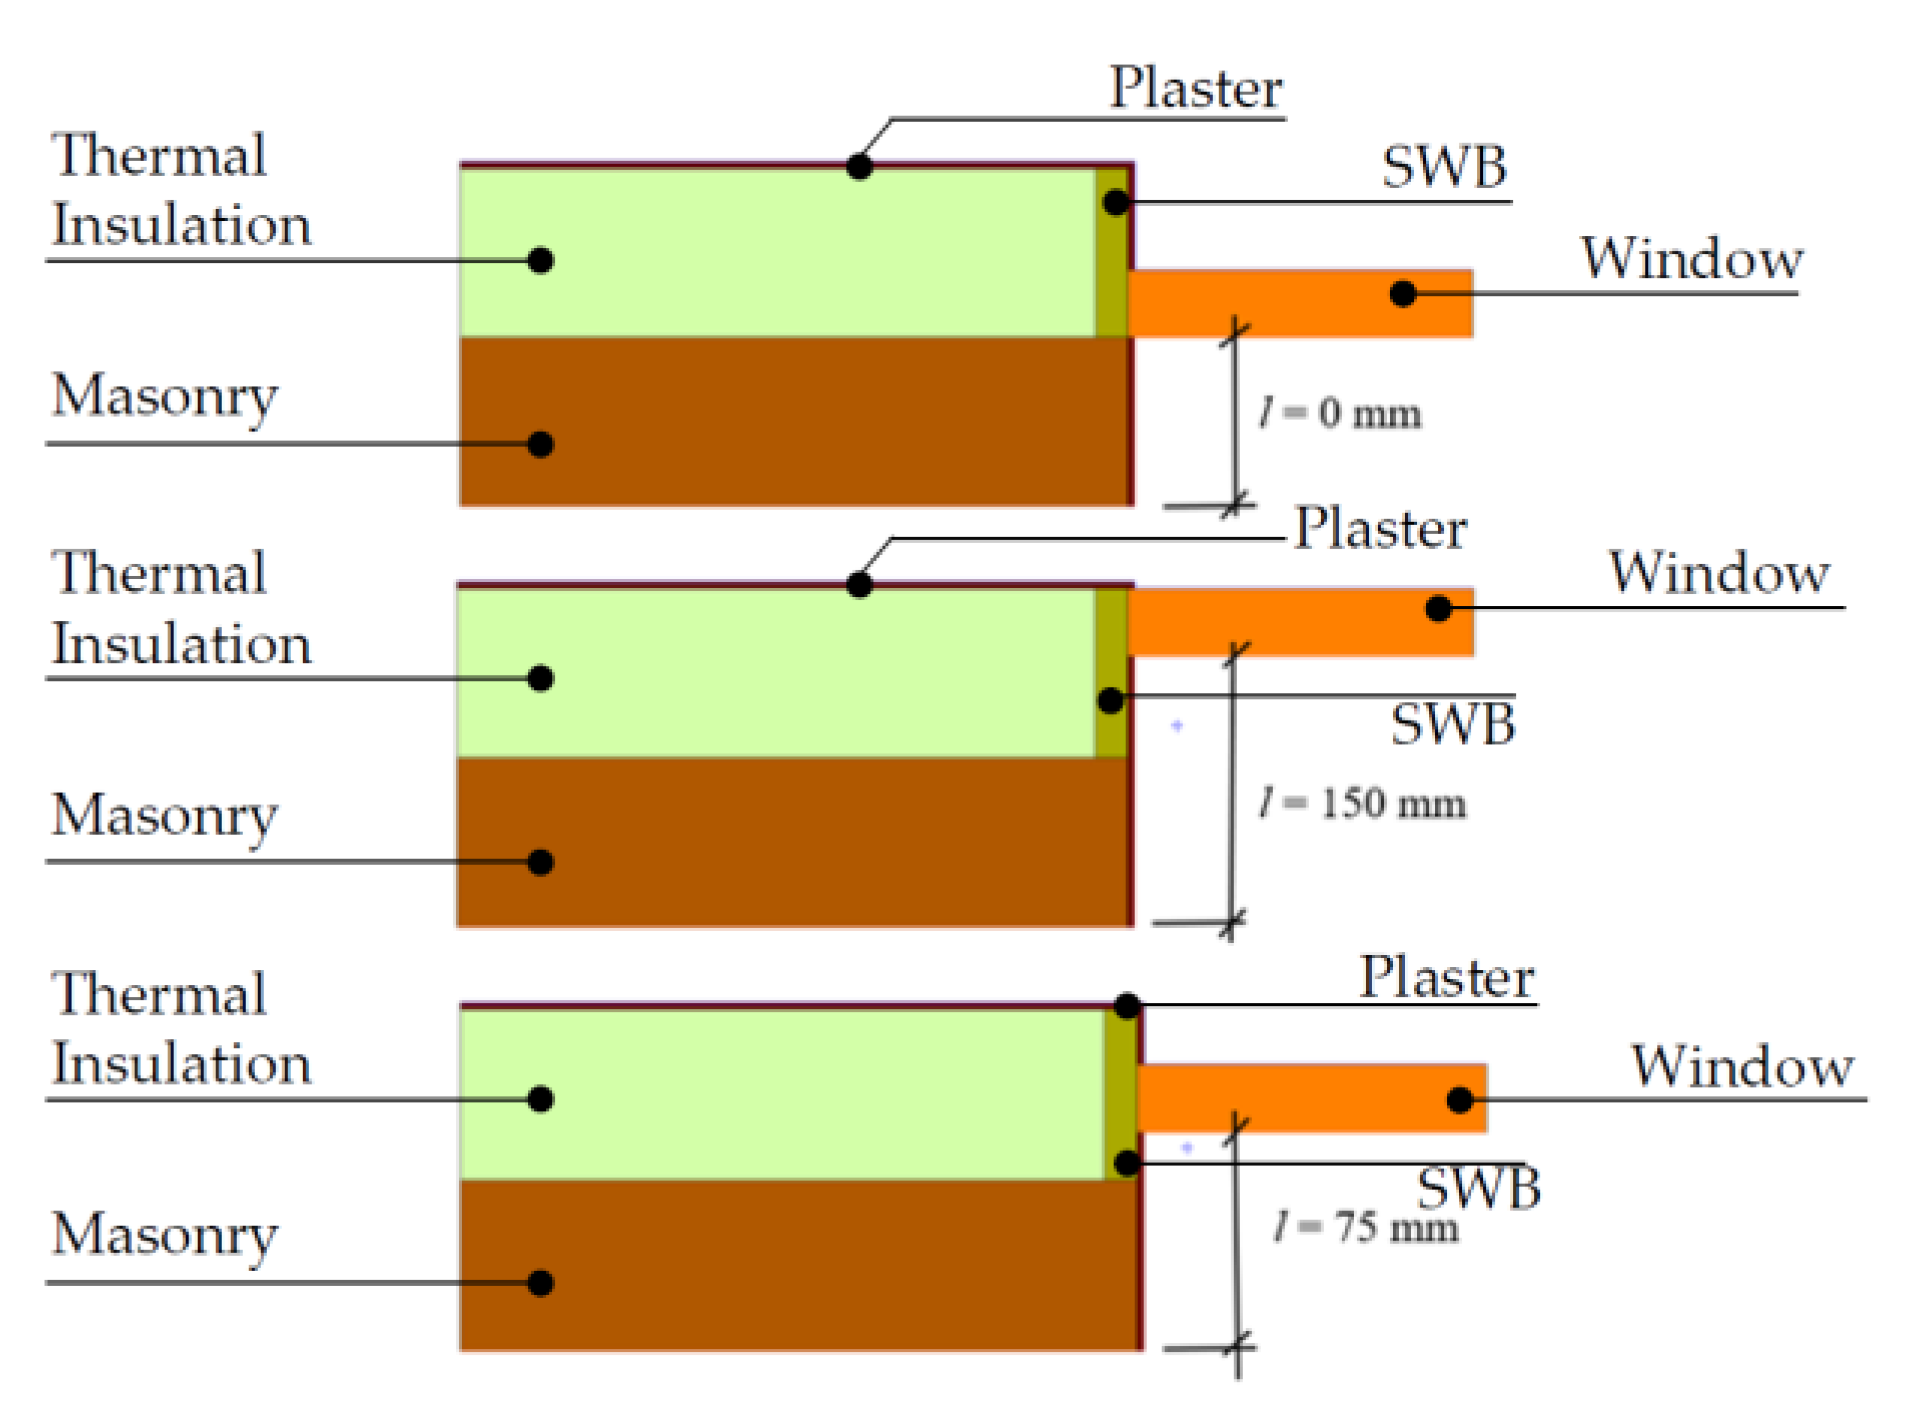
1.2. A New High-Performance Window Installation
2. Methodology
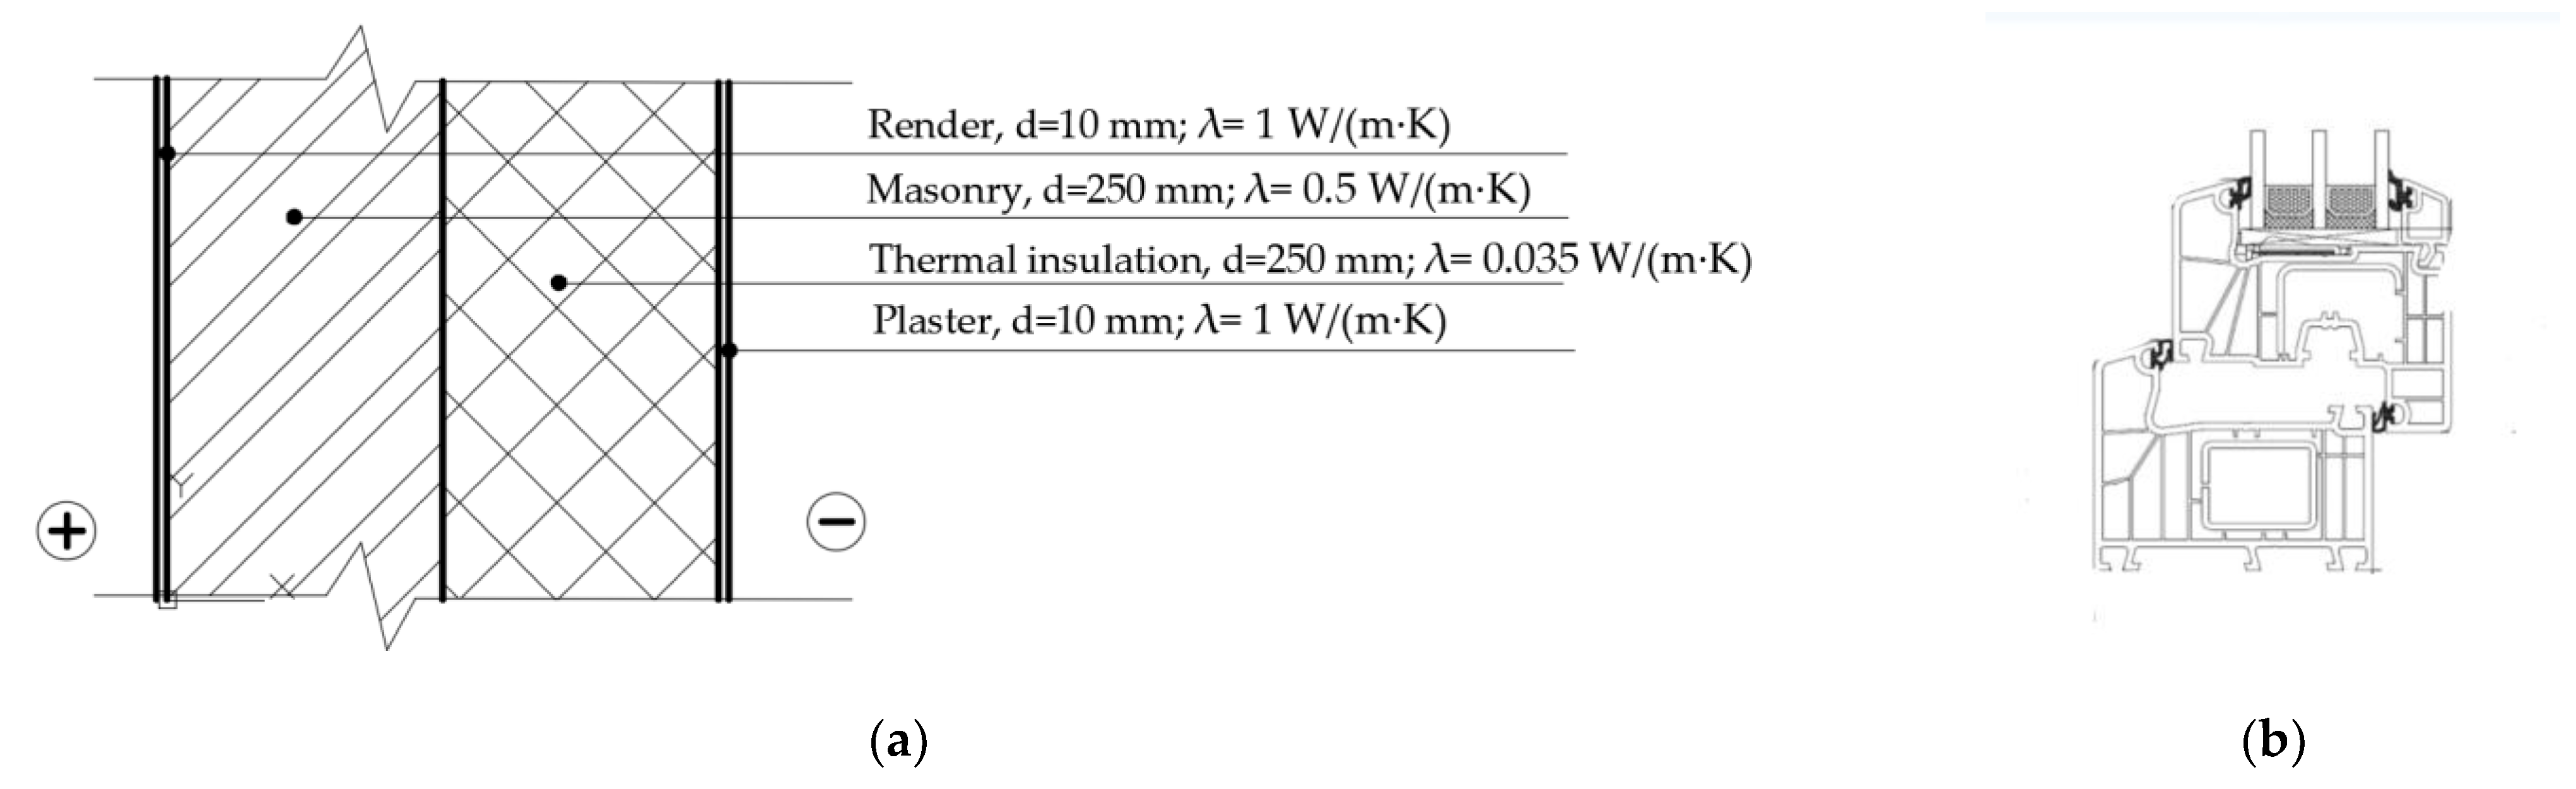
2.1. Research Object
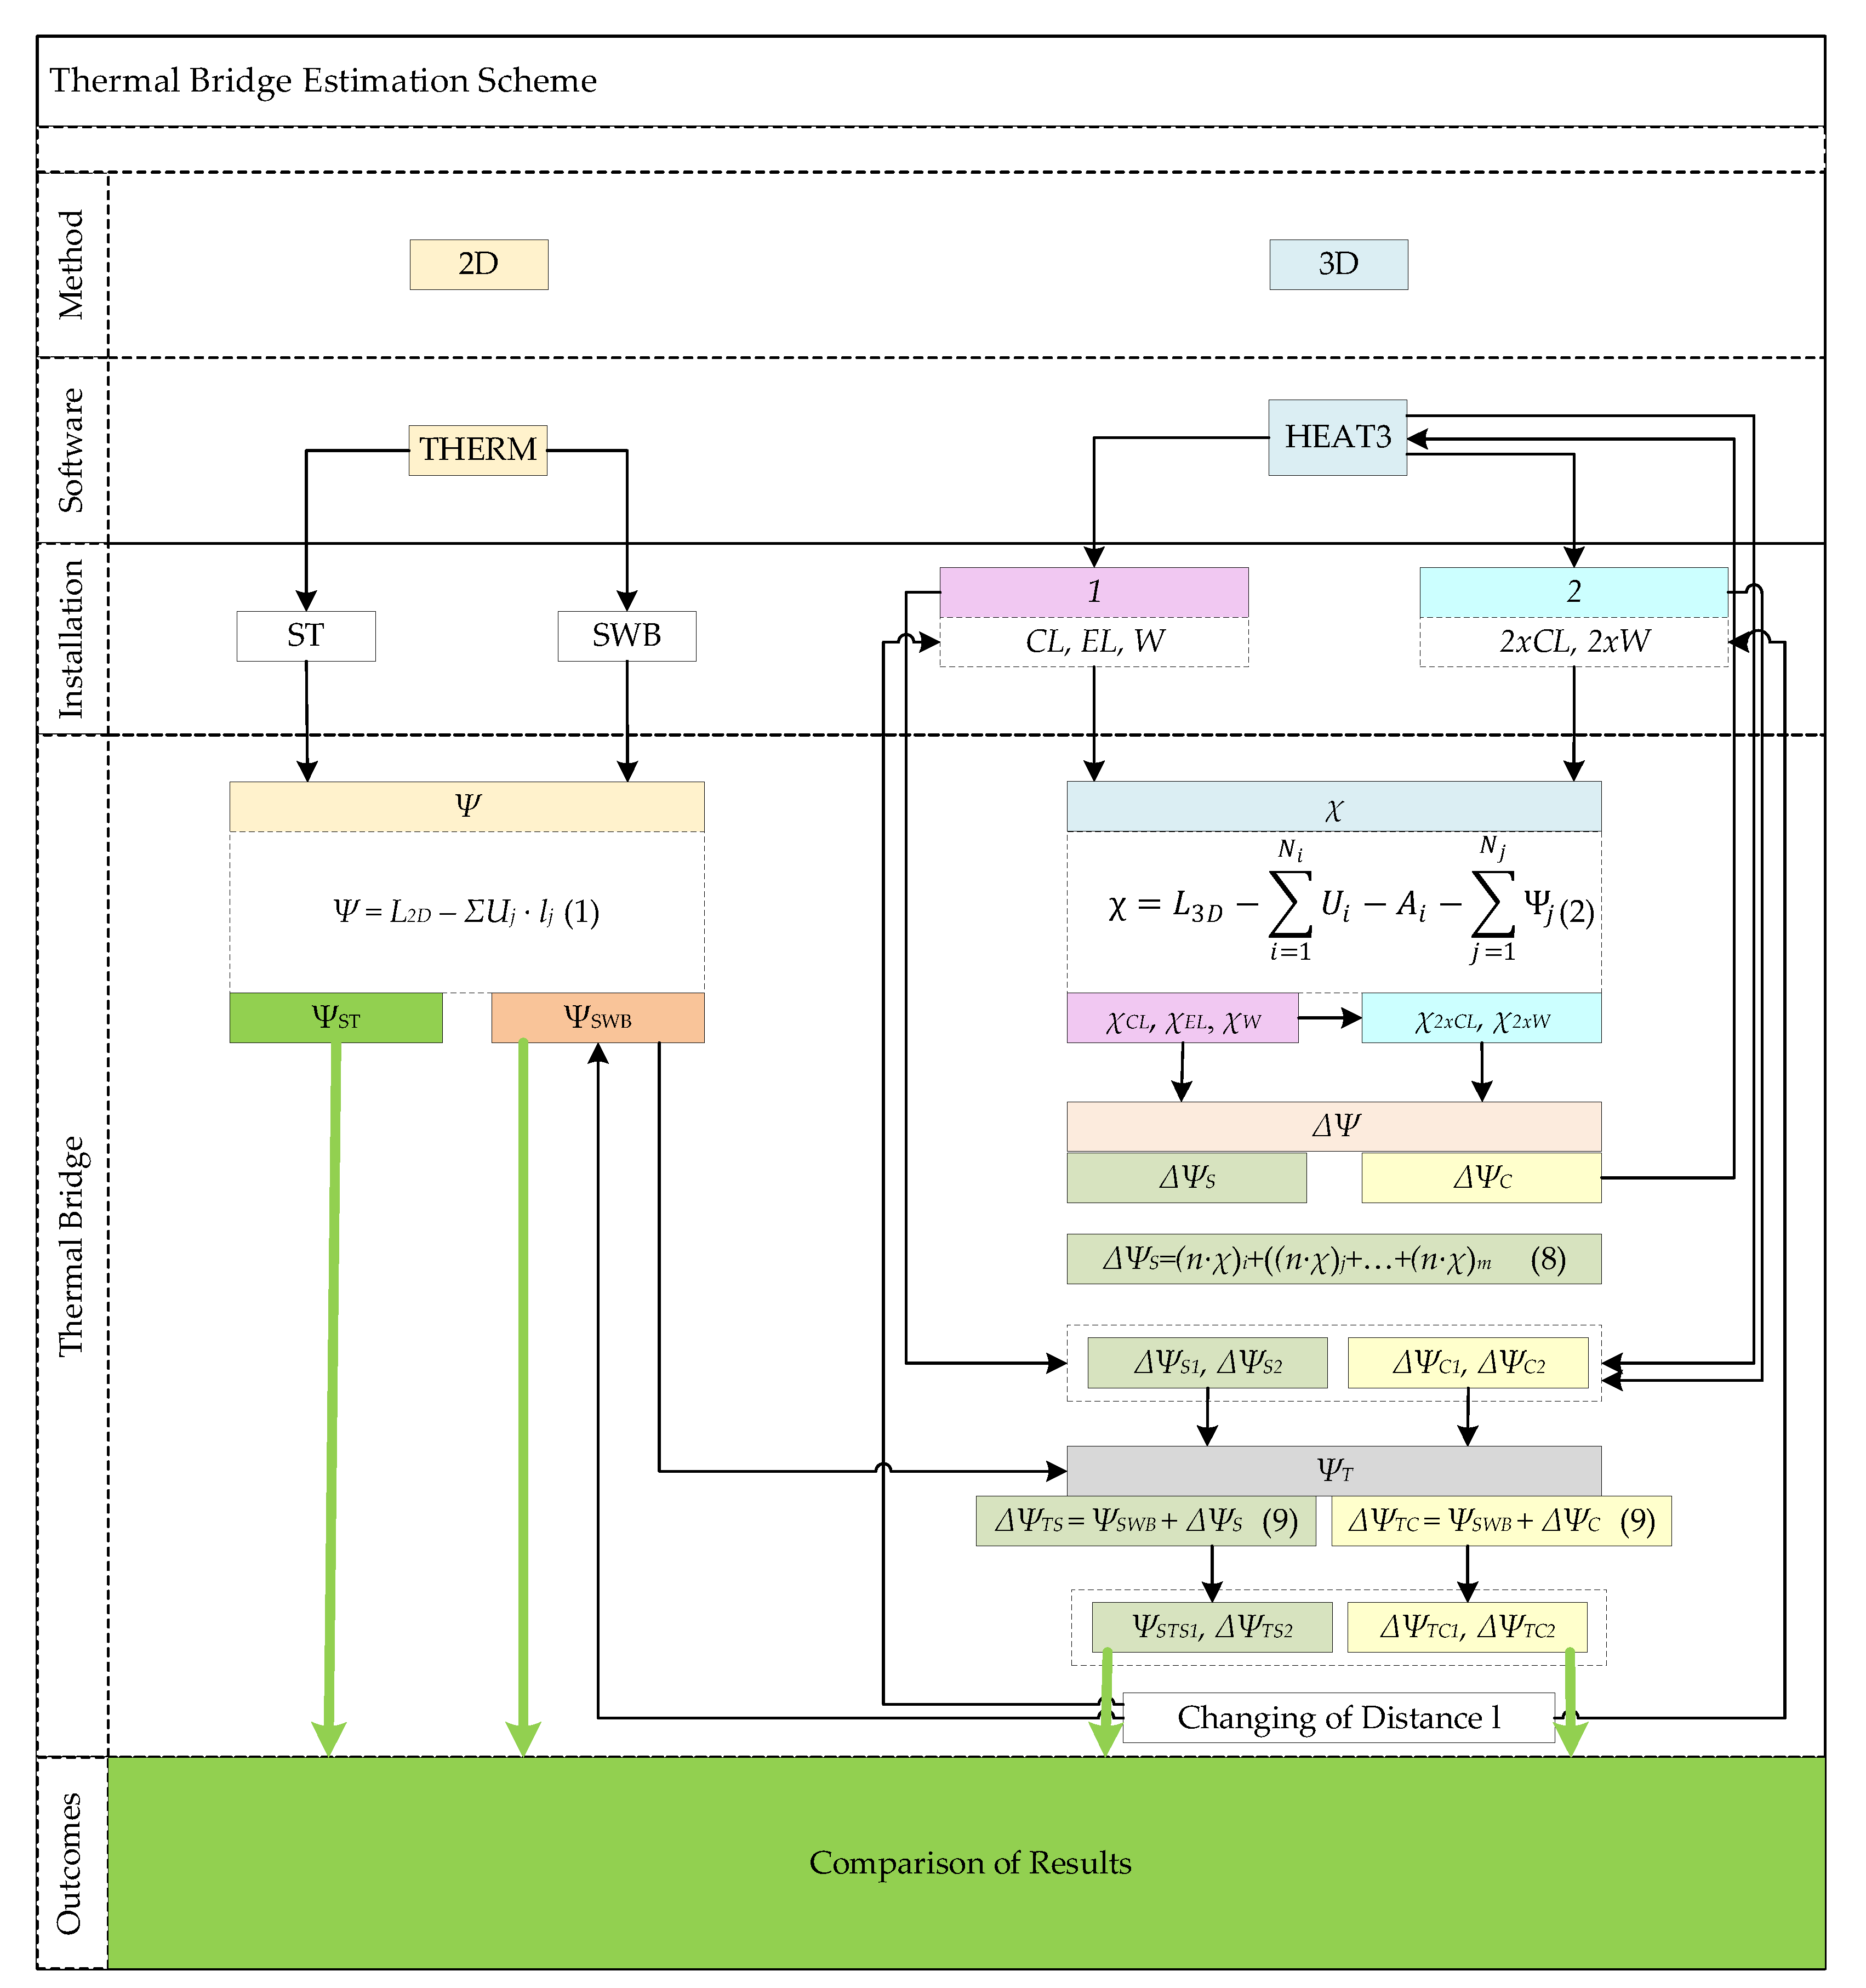
2.2. Thermal Bridge Evaluation Methodology
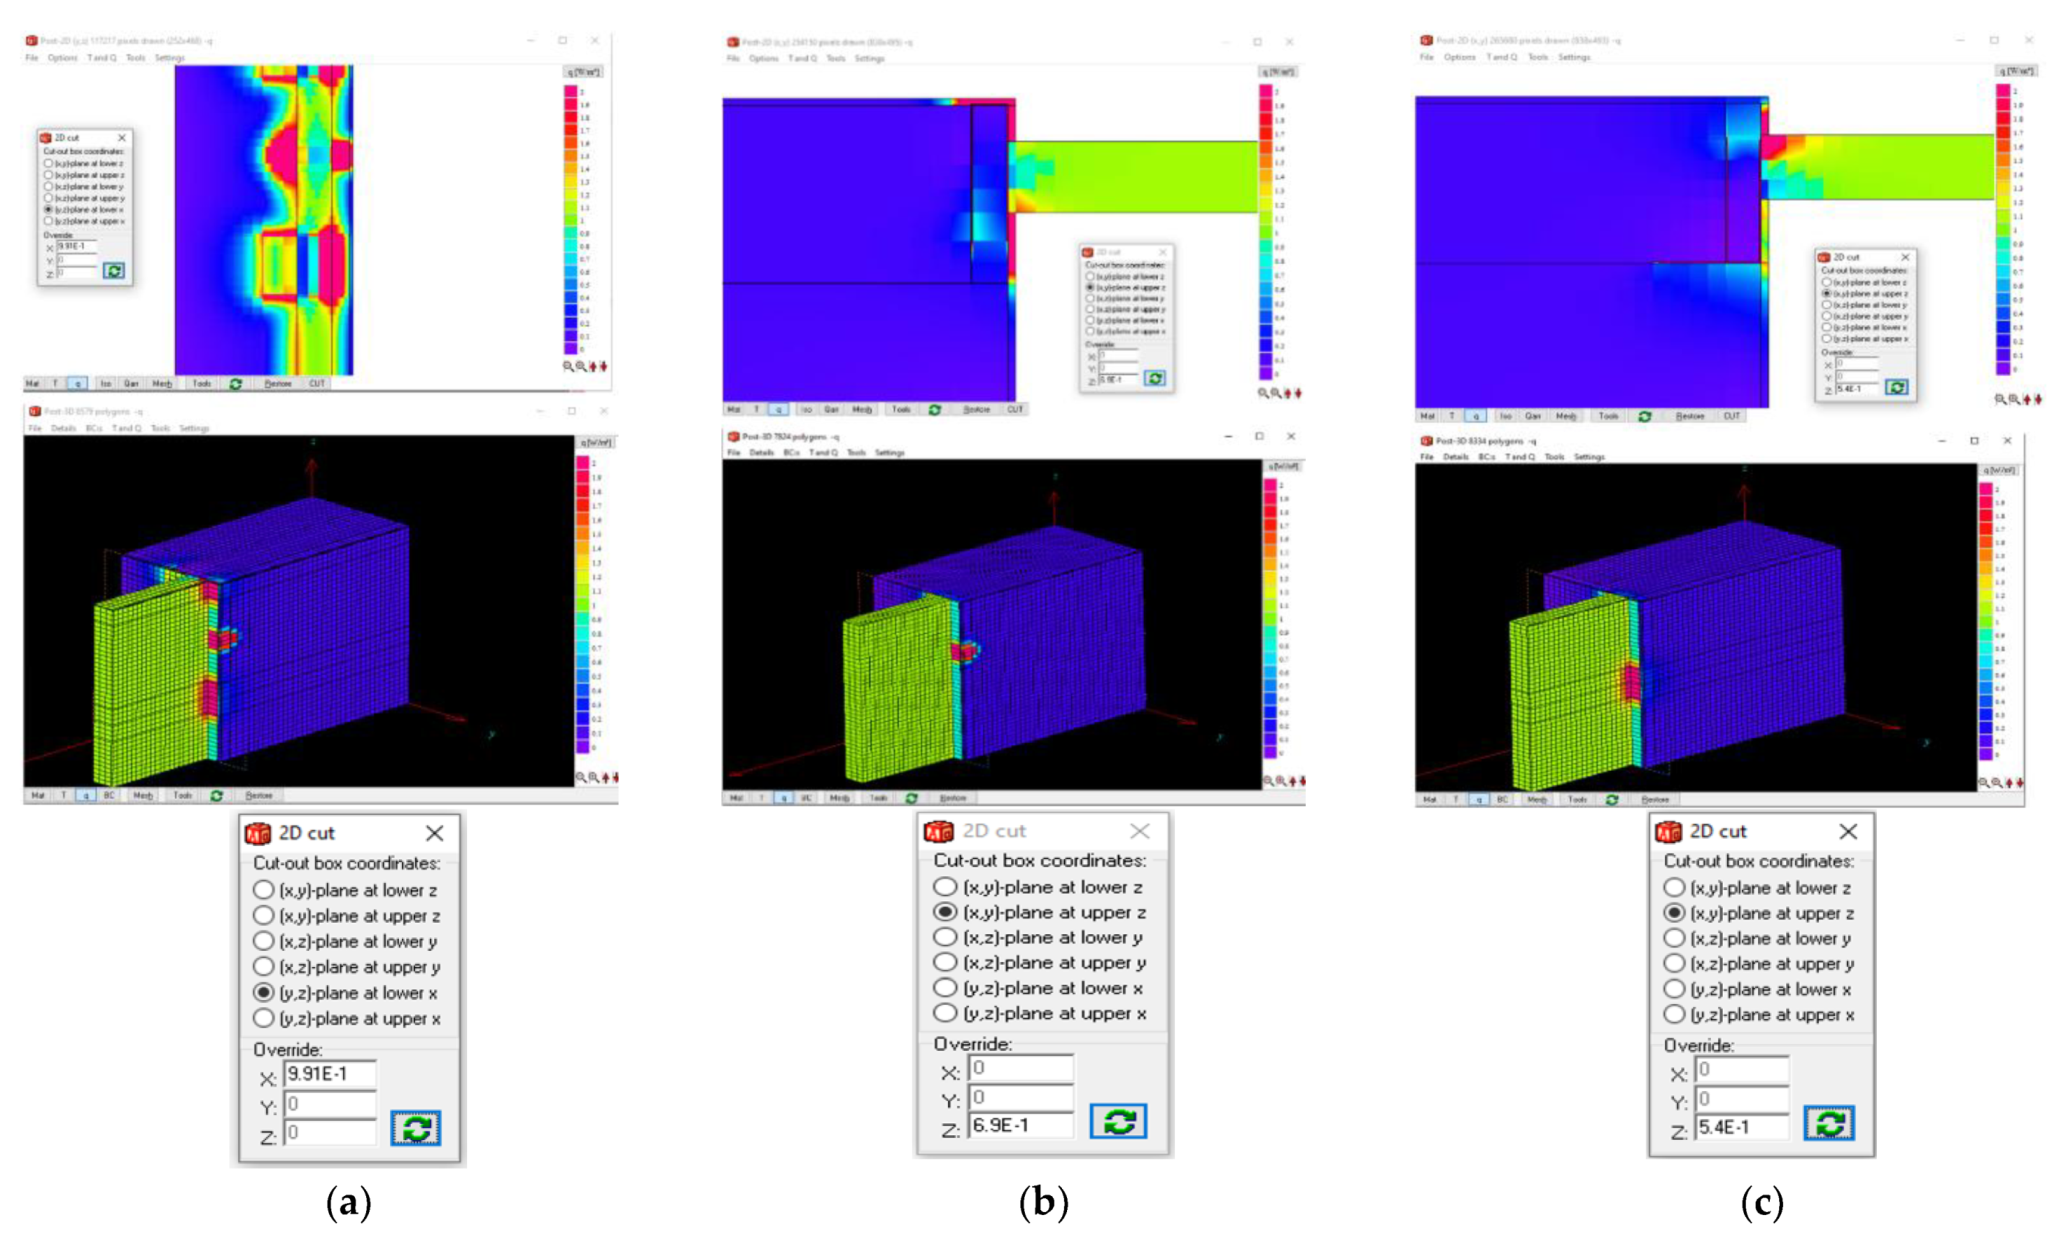
- Numerical simulation (3-D);
- Choosing from catalogues and atlases;
- Calculation under steady-state conditions (2-D).
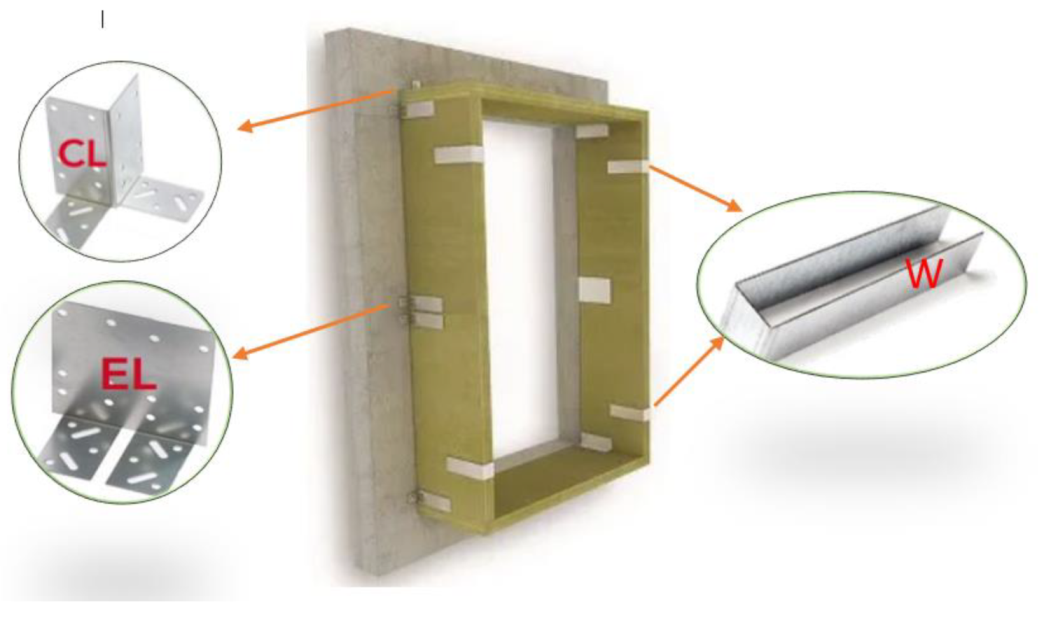
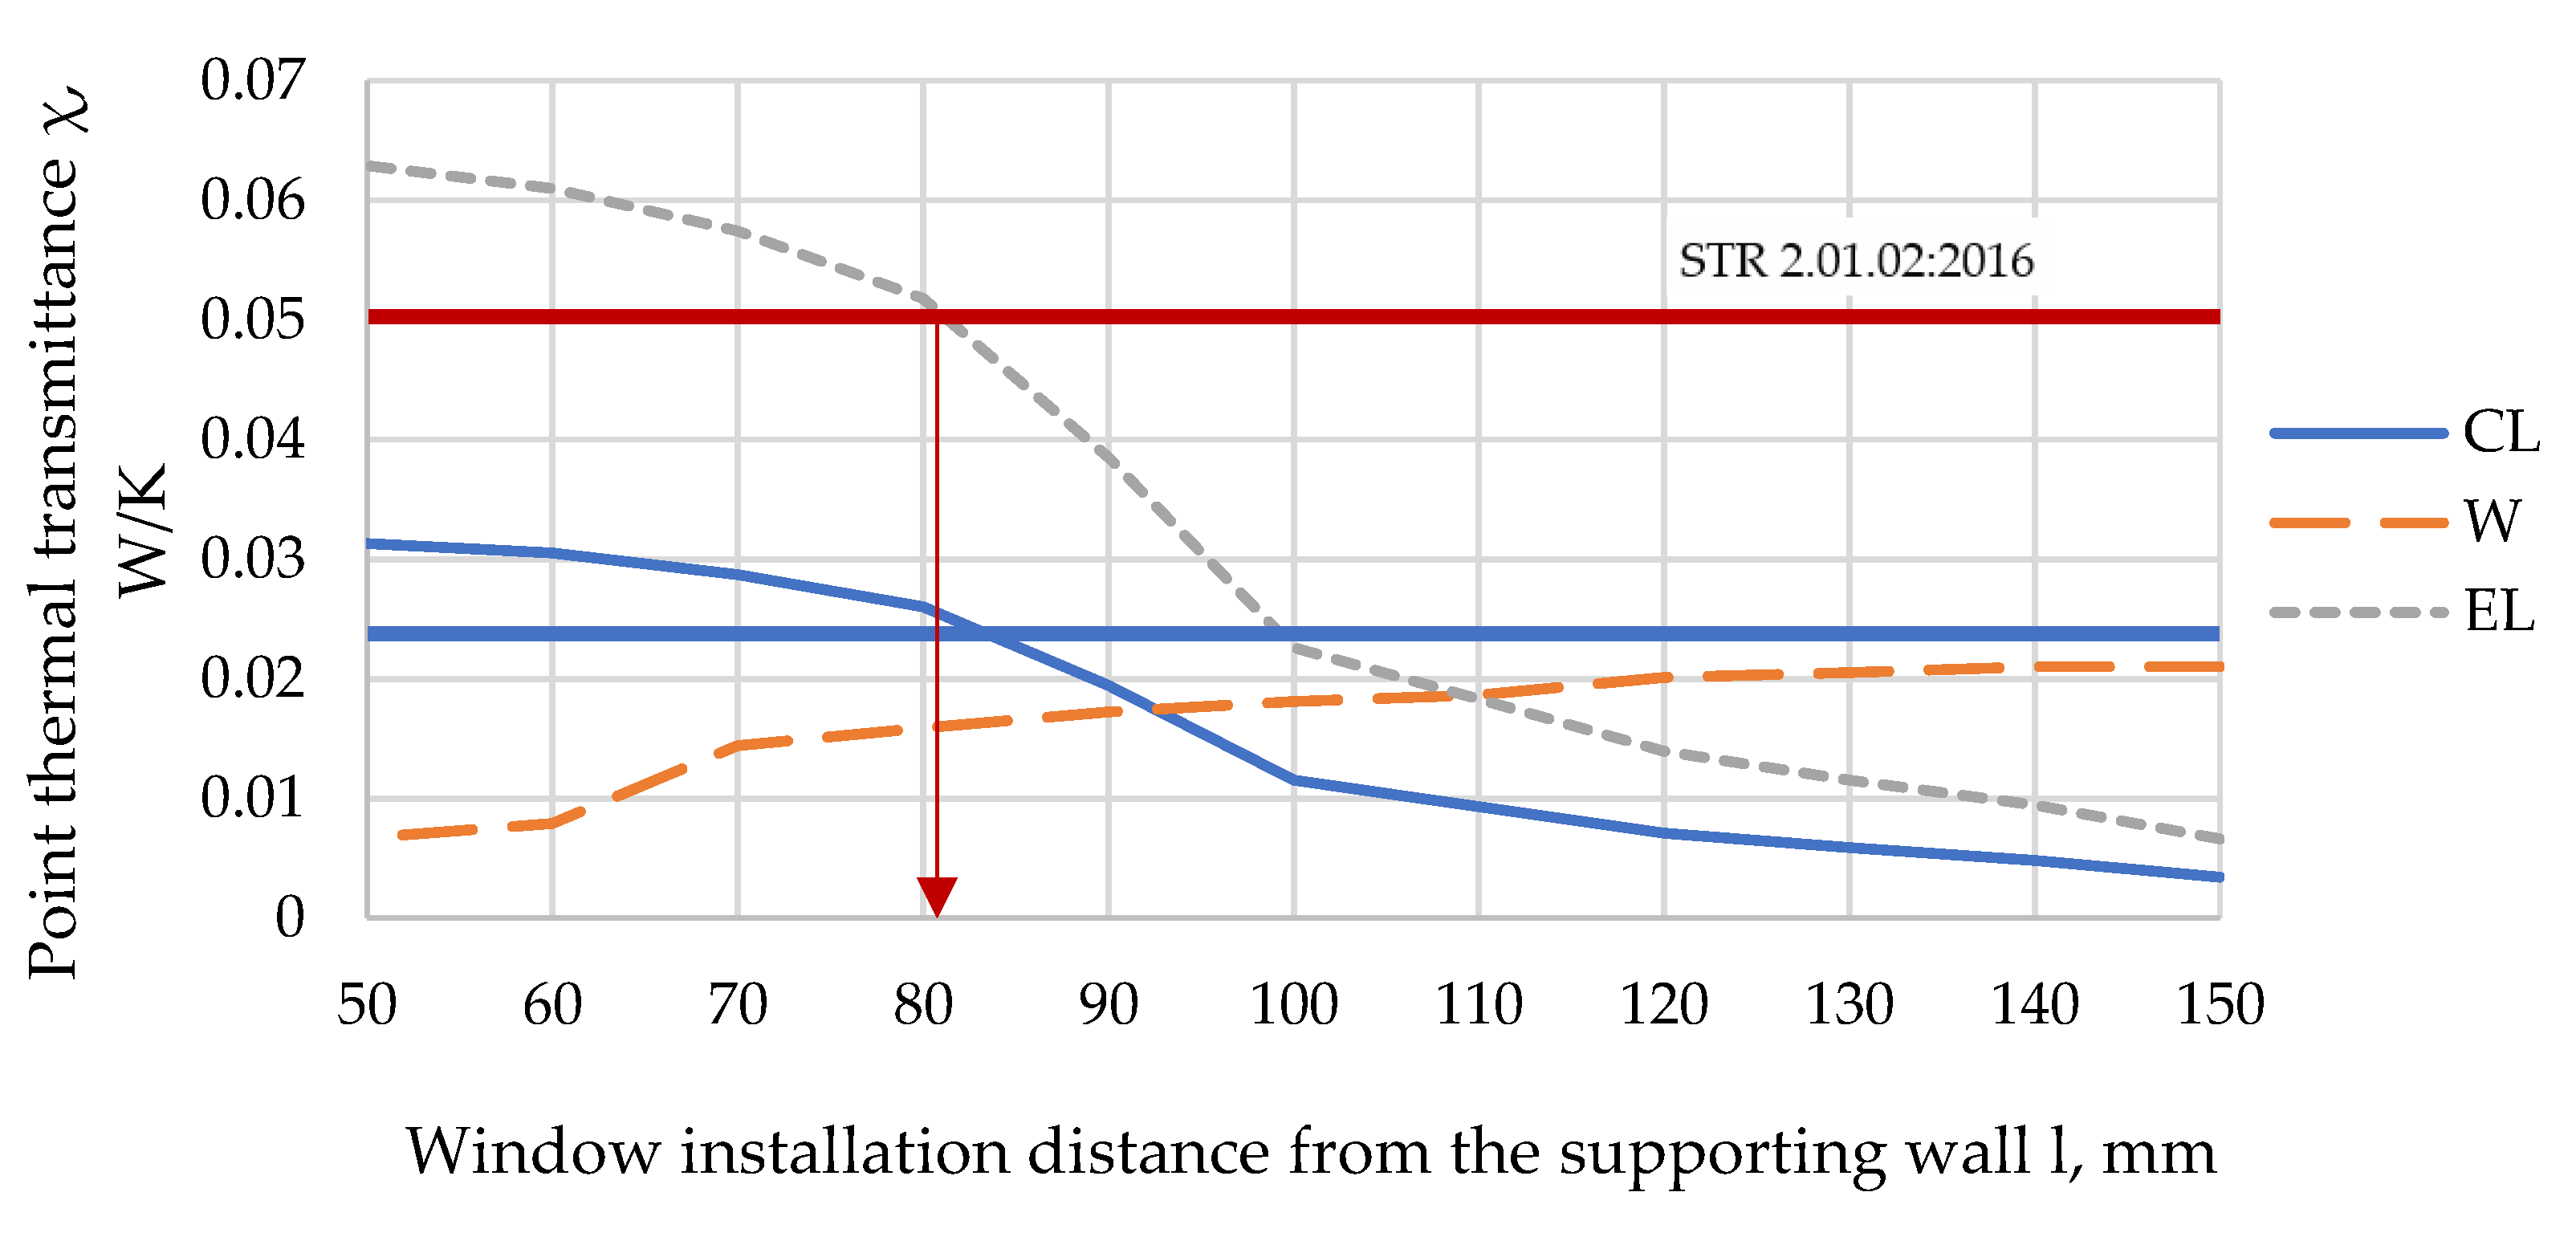
- A part of the wall 1 m high and with three fasteners: corner fastener CL, interconnect fastener EL, and window fastener W (Figure 4). The values χCL, χEL, χW4 were determined;
- A part of the wall 1 m high and with two corner fasteners CL and two window fasteners W (Figure 4). The values χ2xCL, χ2xW were determined.
3. Results
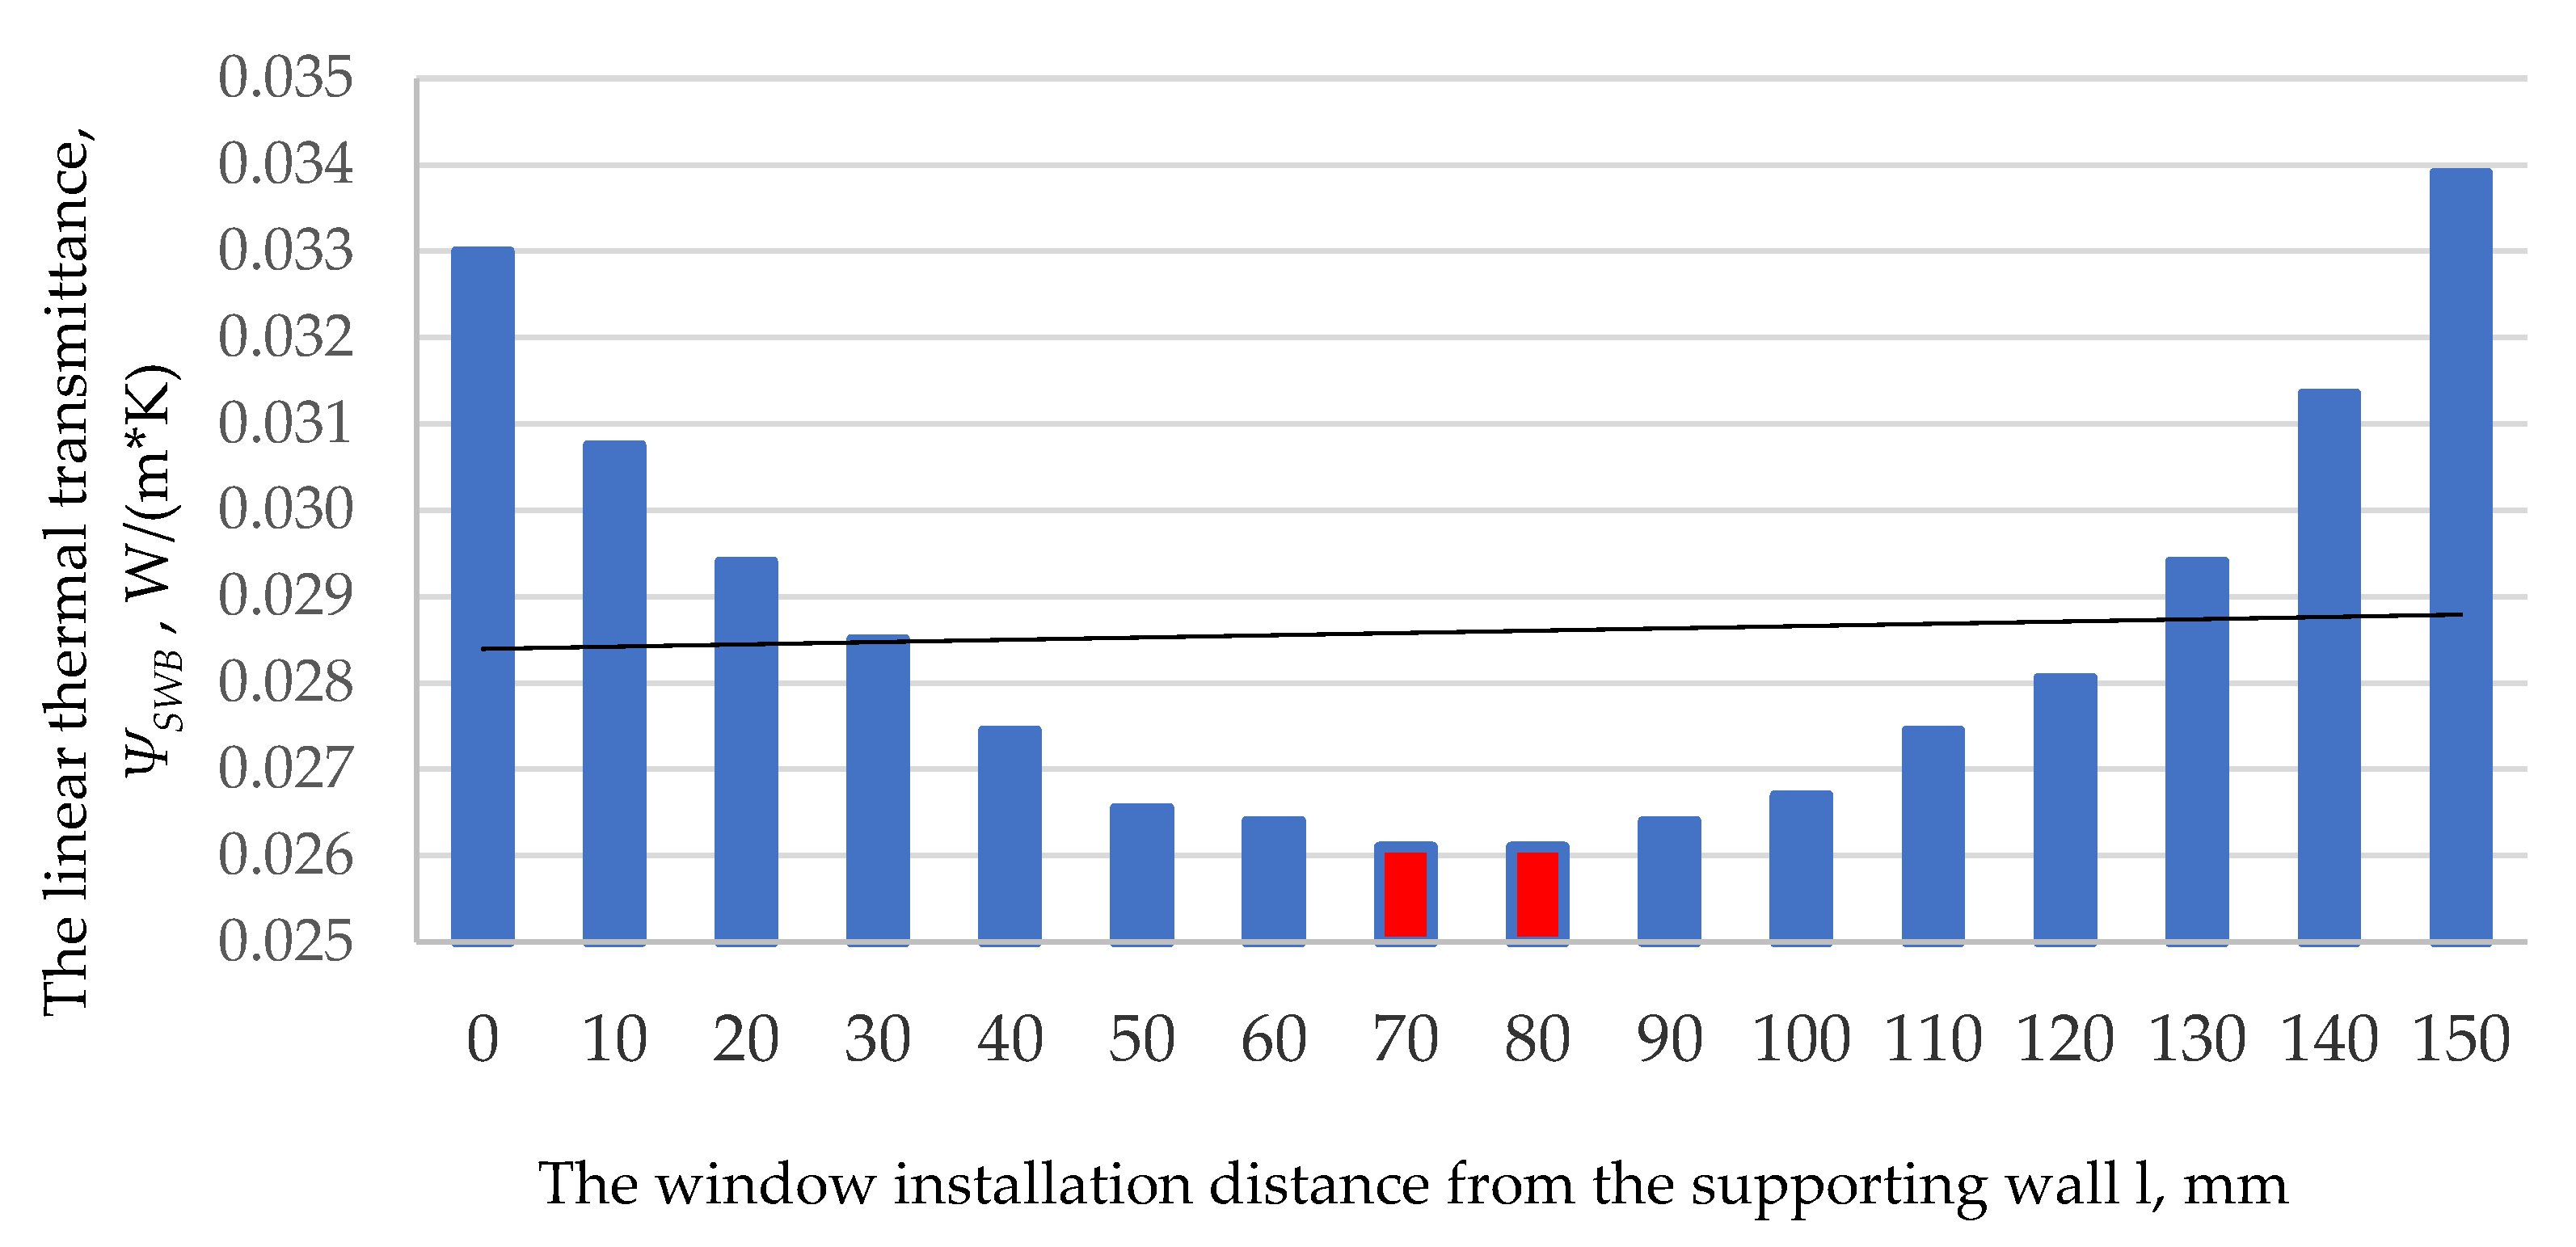
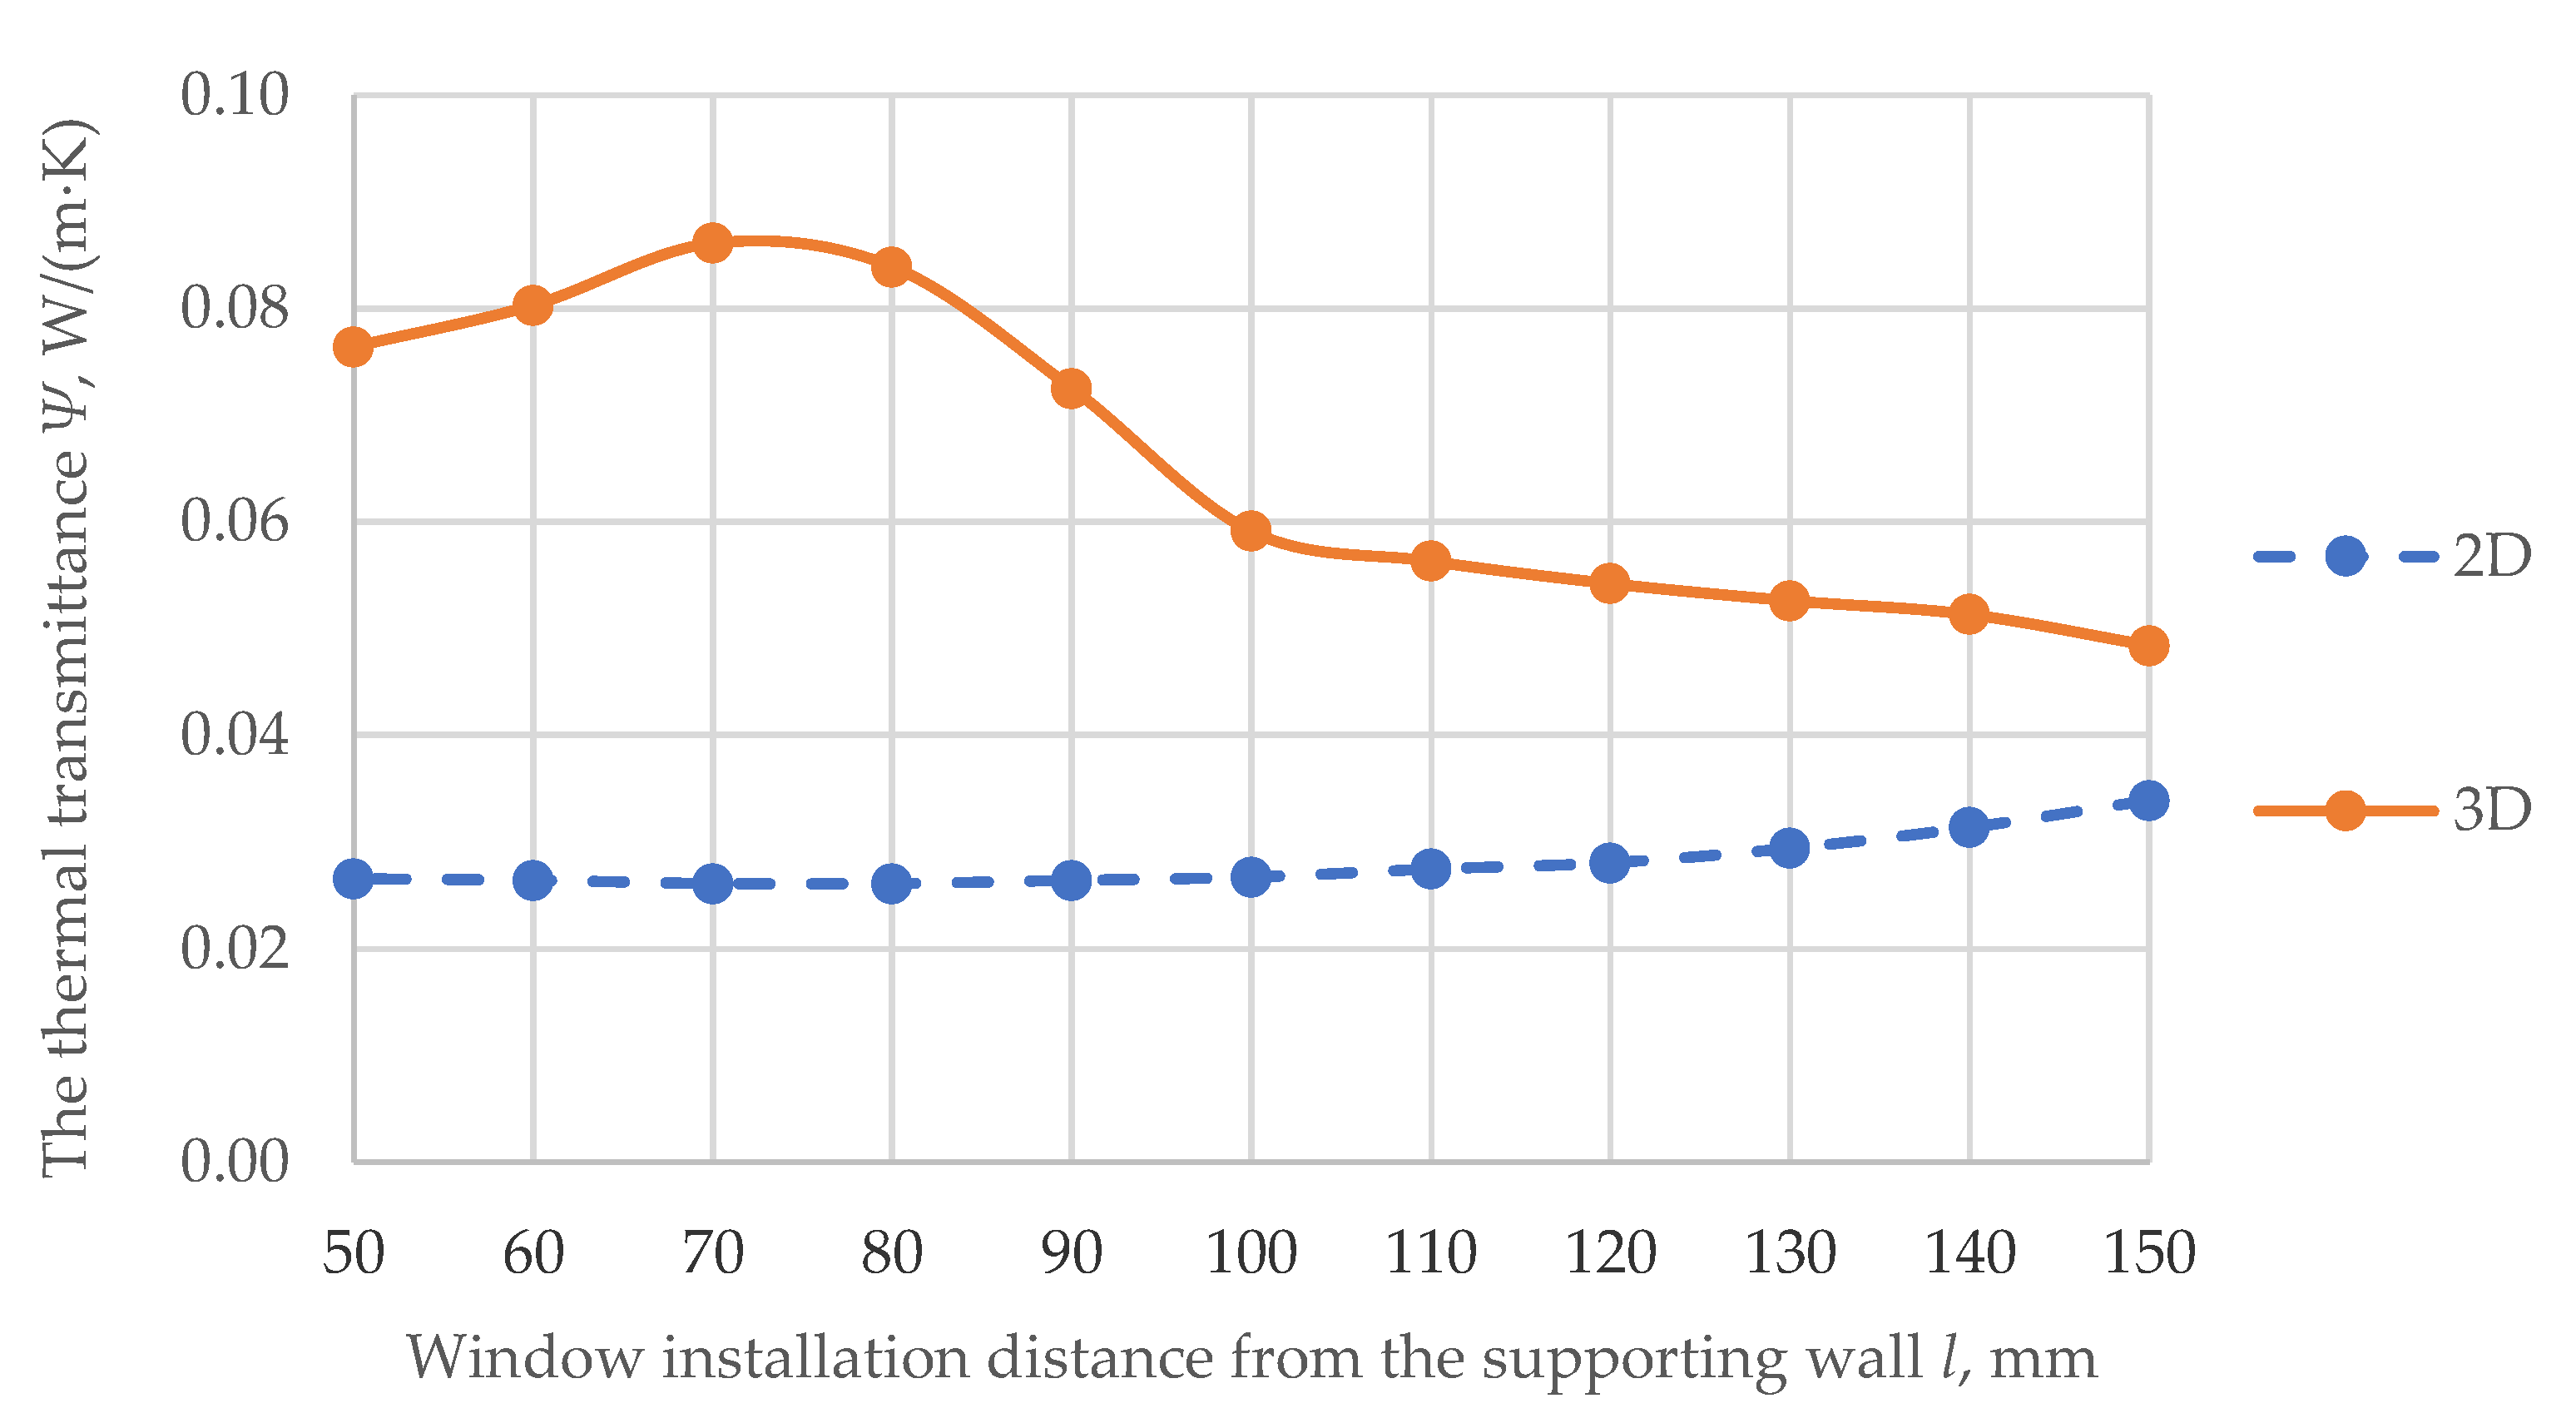
3.1. Linear Thermal Bridges at Window Openings without Considering the Influence of Metal Fasteners
3.2. Thermal Bridges by Assessing the Influence of Metal Fasteners
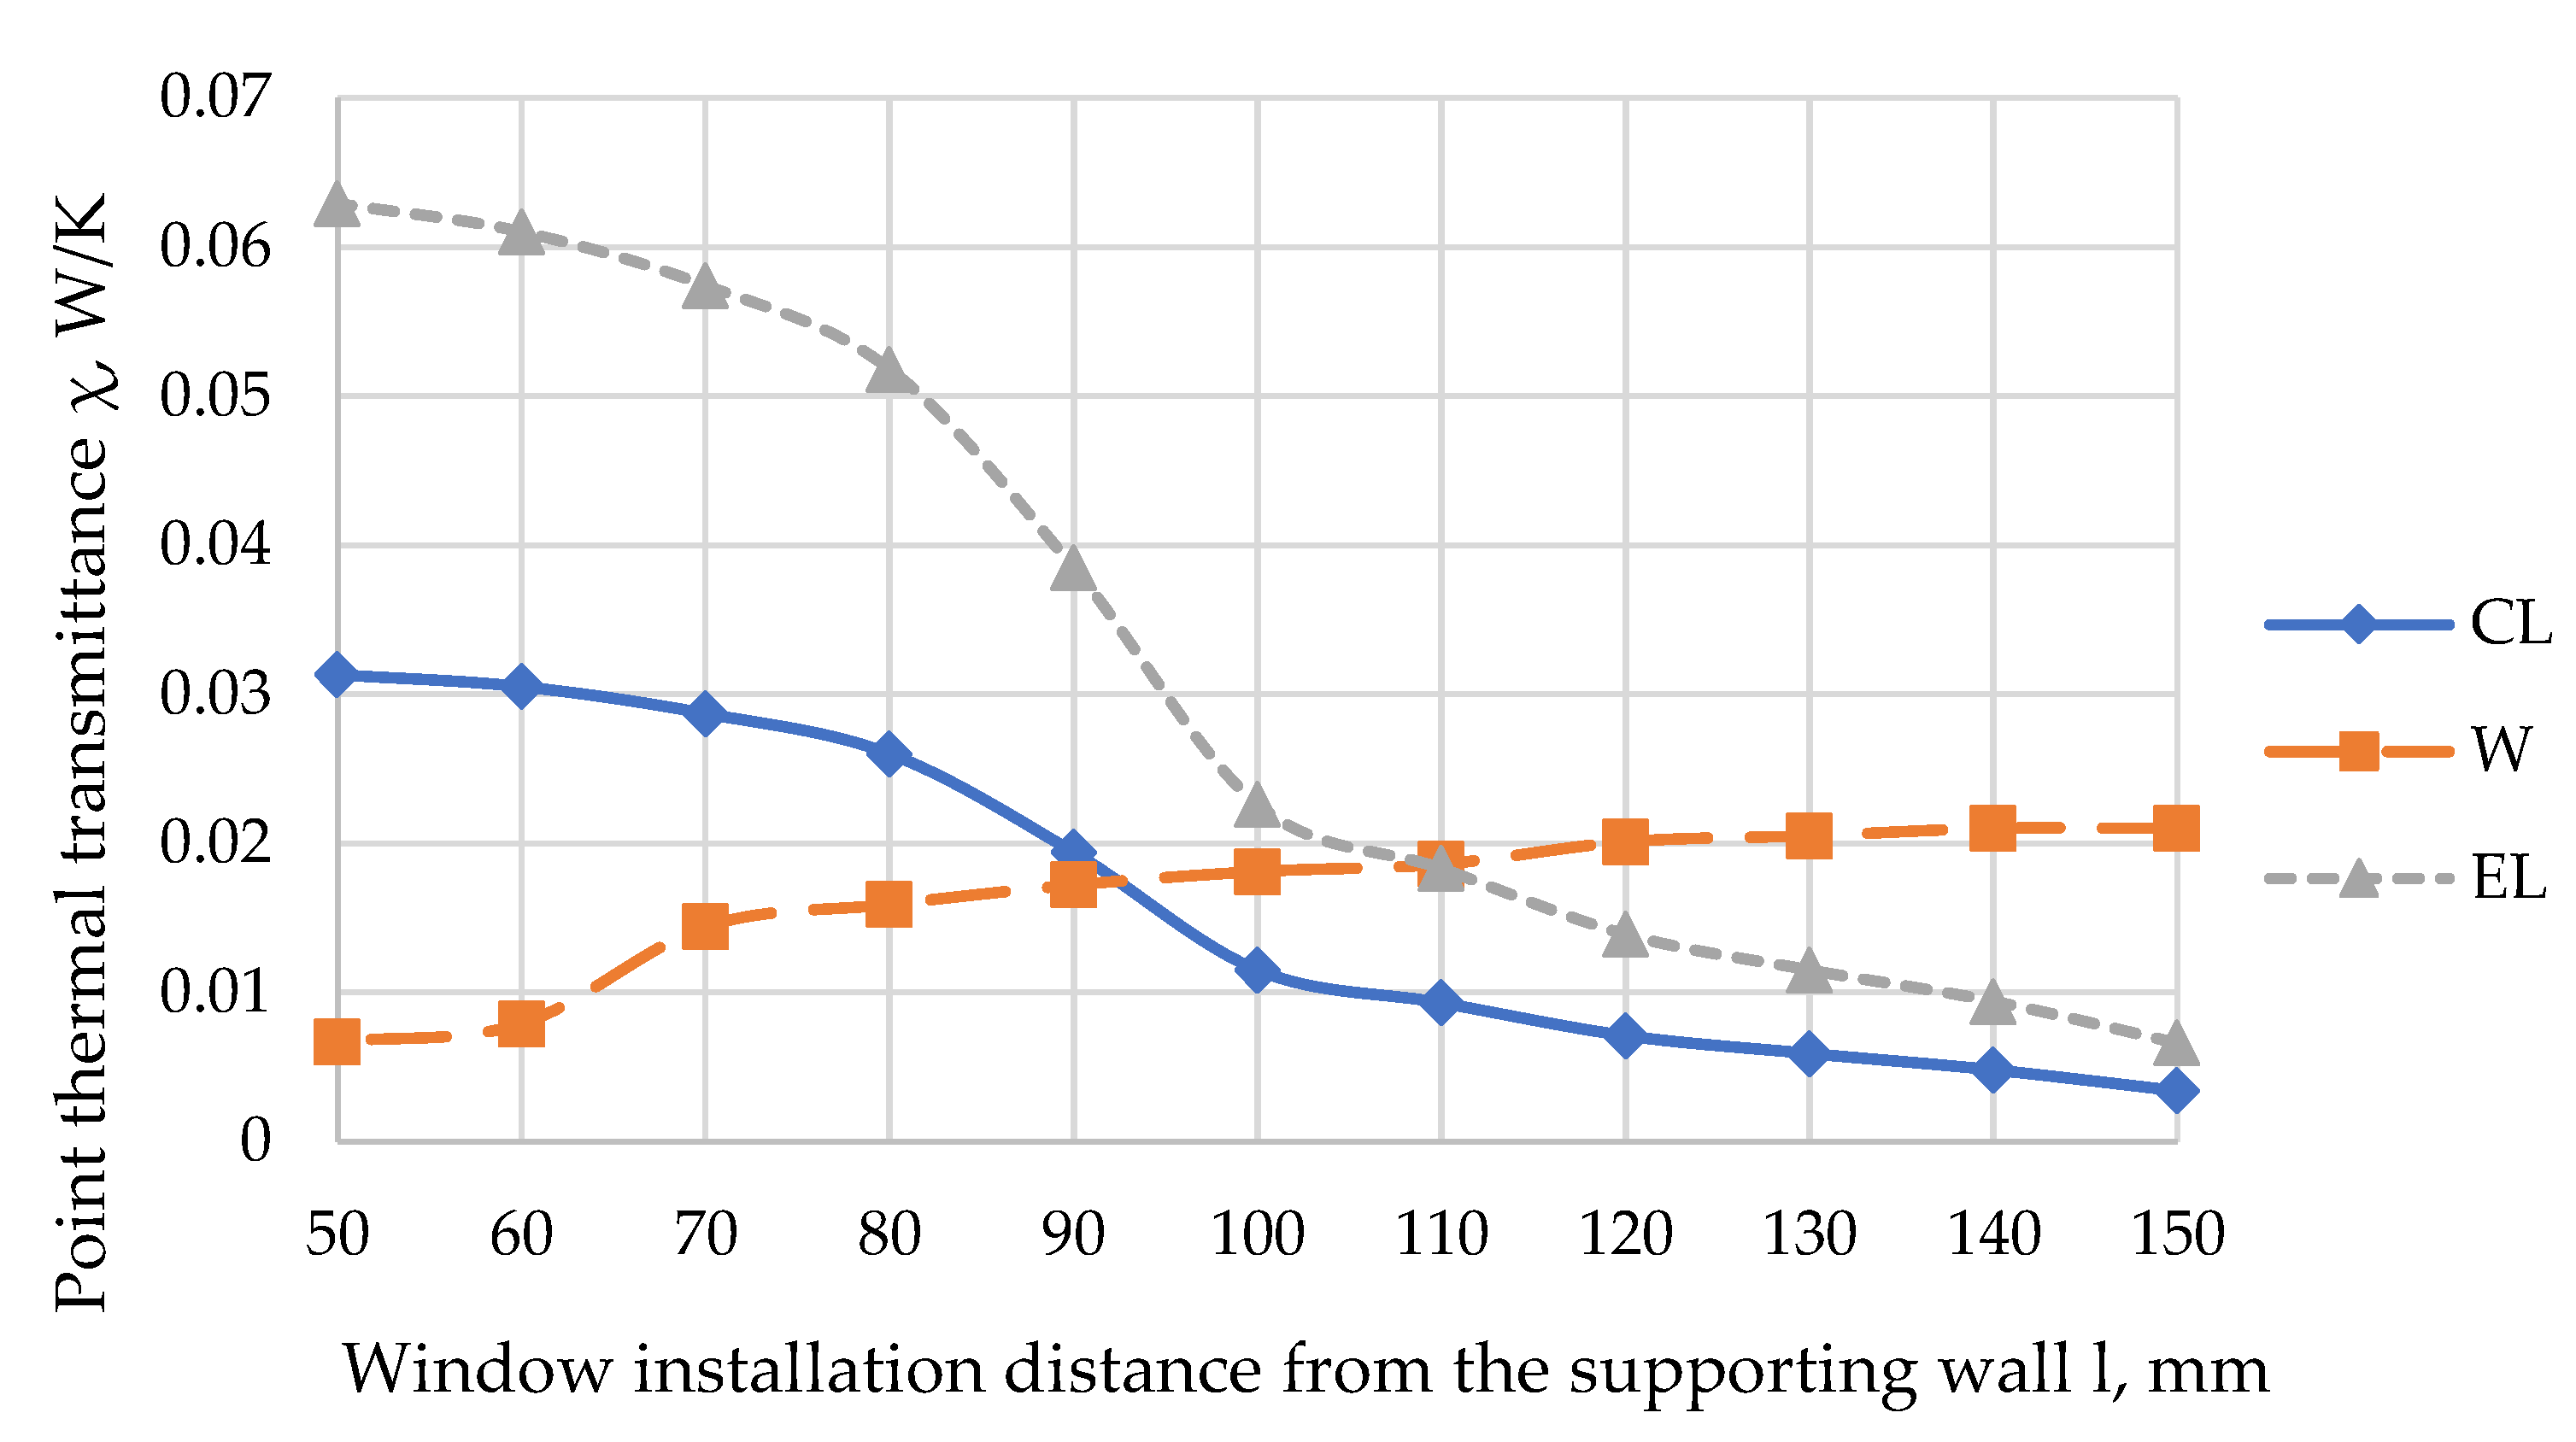
3.2.1. Point Thermal Bridges
3.2.2. The Supplement of the Linear Thermal Bridges
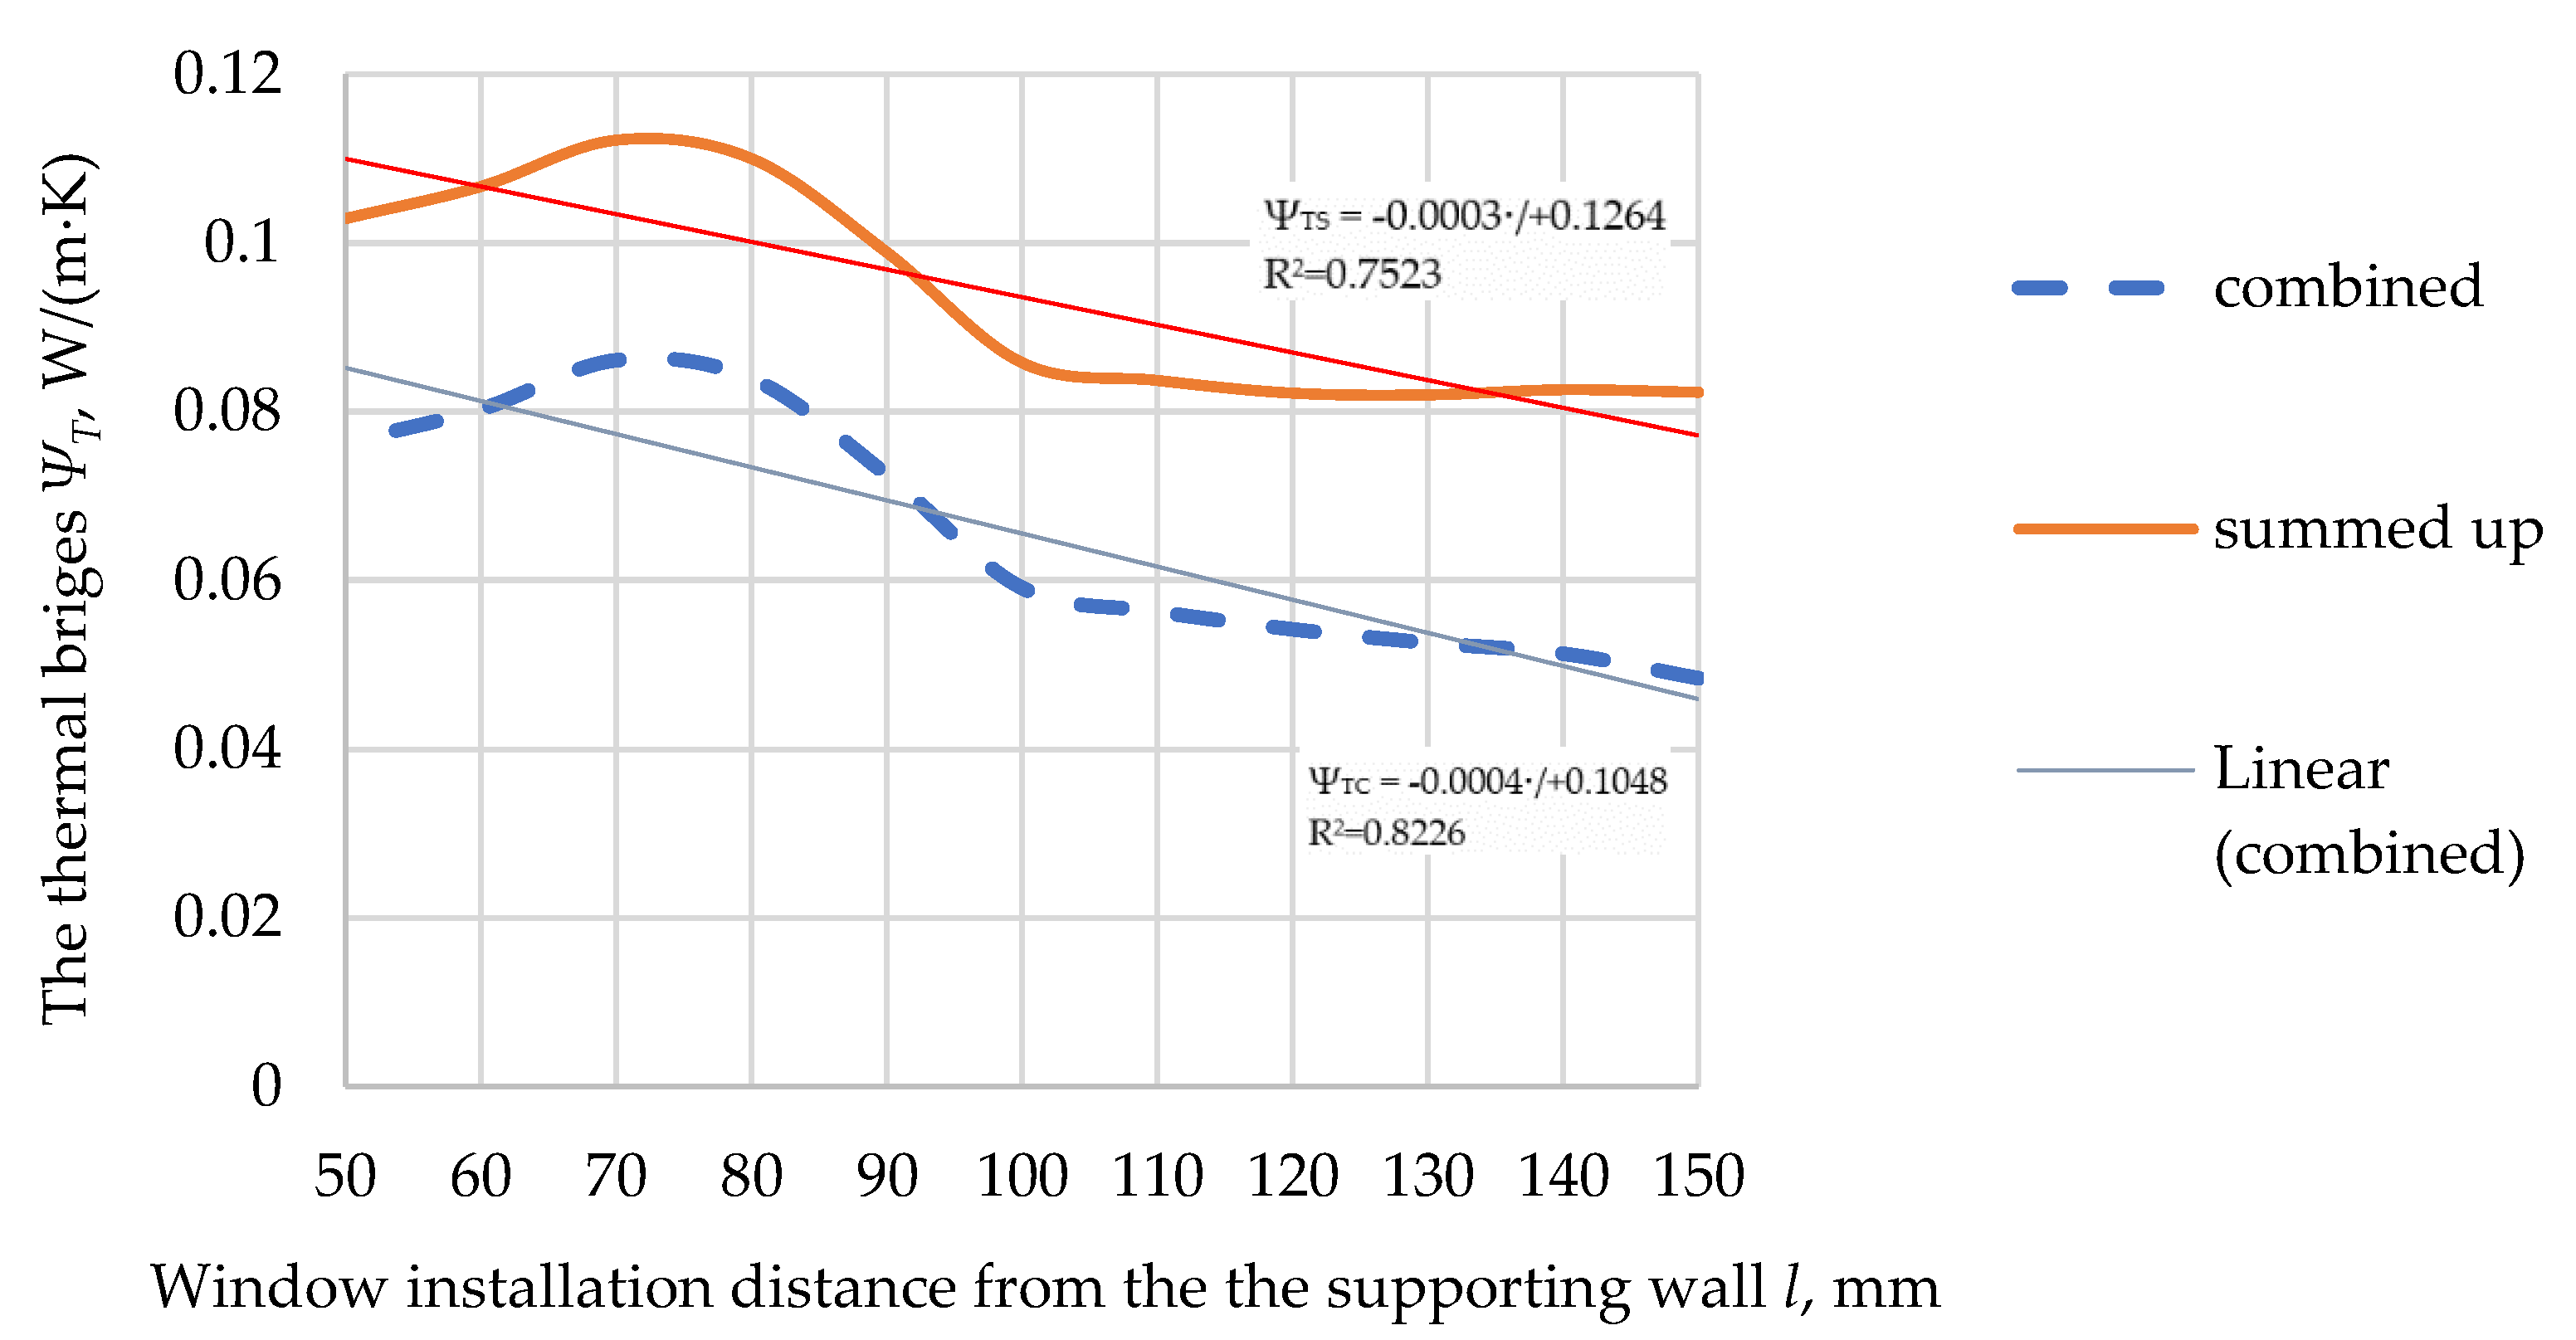
3.2.3. Total Linear Thermal Bridge
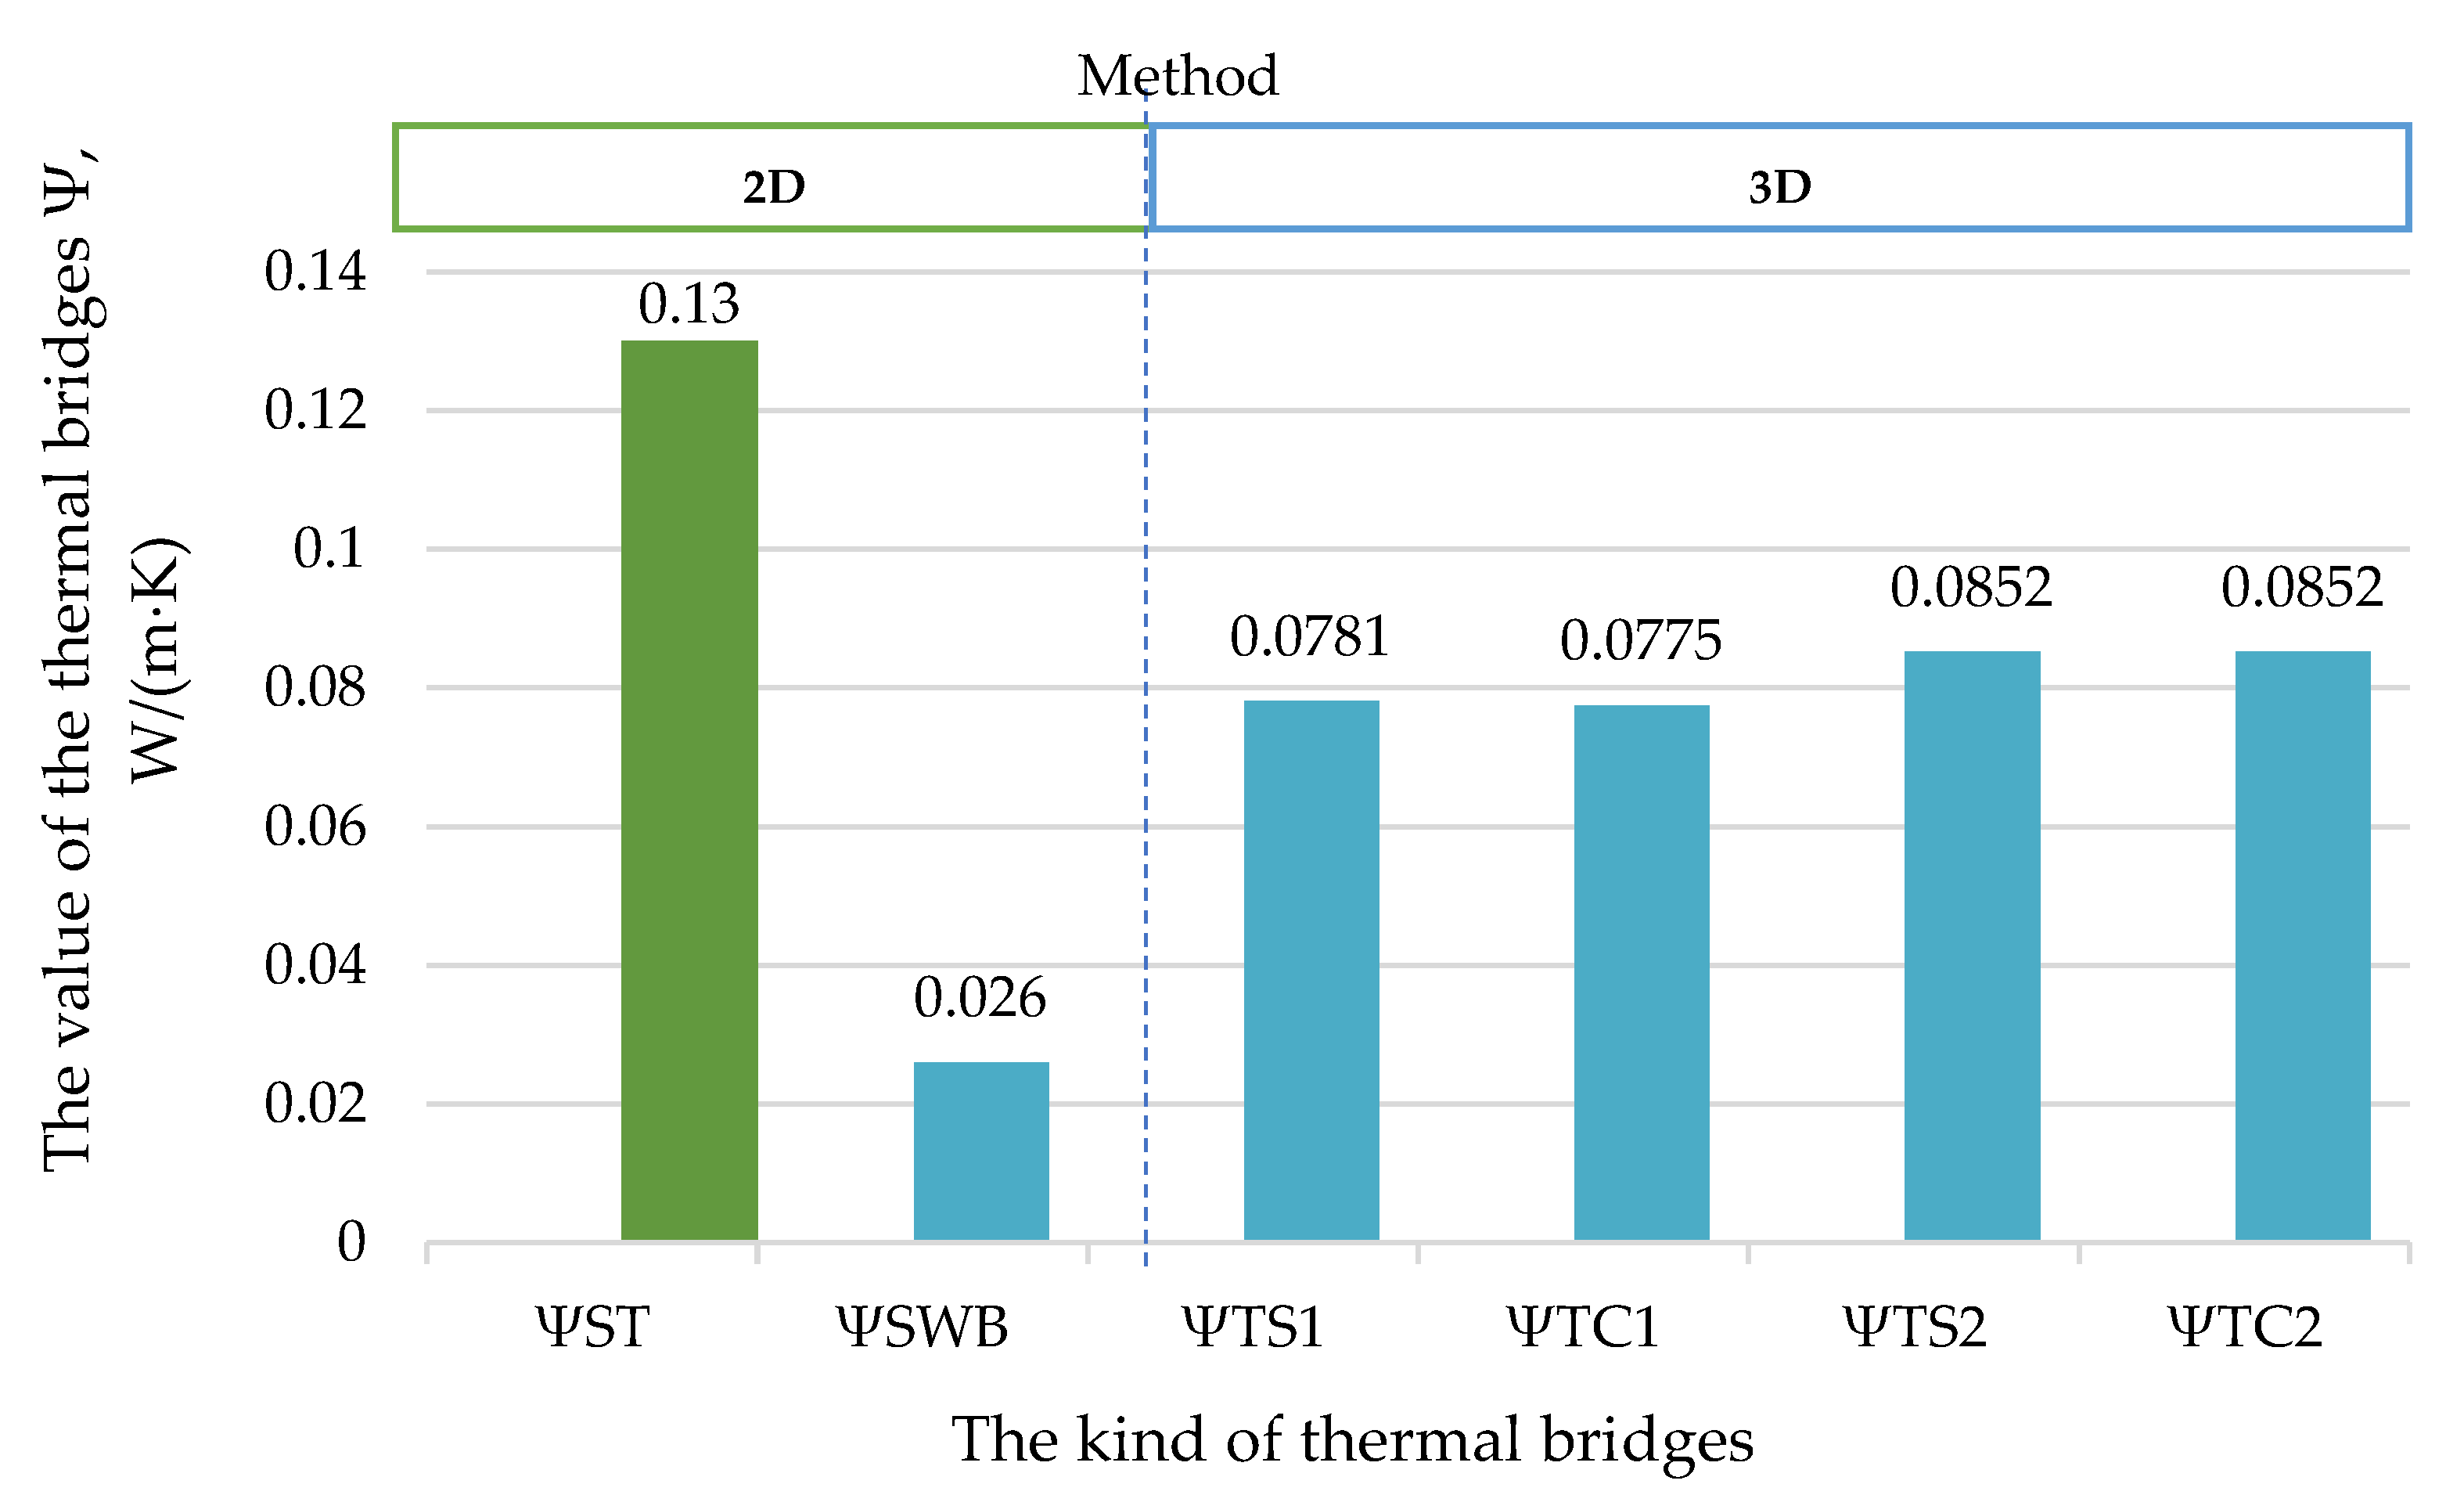
3.3. Comparison of the Values of Thermal Bridges Analyzed by Different Calculation Methods
4. Discussion
5. Conclusions
Author Contributions
Funding
Acknowledgments
Conflicts of Interest
References
- National Energy and Climate Plans (NECPs). European Commission. Available online: https://ec.europa.eu/energy/topics/energy-strategy/national-energy-climate-plans_en (accessed on 27 July 2021).
- Building Performance Institute Europe (BPIE). Renovation Strategies of Selected EU Countries. A Status Report on Compliance with Article 4 of the Energy Efficiency Directive; BPIE: Brussels, Belgium, 2014; Available online: Renovation-Strategies-EU-BPIE-2014.pdf (accessed on 1 March 2022).
- EN. Directive (EU) 2018/844 of the European Parliament and of the Council of 30 May 2018 amending Directive 2010/31/EU on the energy performance of buildings and Directive 2012/27/EU on energy efficiency; the European Parliament and the Council of the European Union. Off. J. Eur. Union 2018, 35, L156–L175. [Google Scholar]
- Building Performance Institute Europe (BPIE). Future-Proof Buildings for All Europeans; BPIE: Brussels, Belgium, 2019; Available online: https://globalabc.org/resources/publications/bpie-future-proof-buildings-all-europeans (accessed on 1 March 2022).
- COM/2020/562 Final. Investing in a Climate-Neutral Future for the Benefit of Our People. Communication from the Commission to the European Parliament, the Council, the European Economic and Social Committee and the Committee of the Regions. Stepping up Europe’s 2030 Climate Ambition Brussels. Available online: https://eur-lex.europa.eu/legal-content/EN/TXT/?uri=CELEX%3A52020DC0562 (accessed on 1 March 2022).
- Renovation Wave|Energy. Available online: https://ec.europa.eu/energy/topics/energy-efficiency/energy-efficient-buildings/renovation-wave_en (accessed on 1 March 2022).
- Bergero, S.; Cavalletti, P.; Chiari, A. Energy refurbishment in existing buildings: Thermal bridge correction according to DM 26/06/2015 limit values. Energy Procedia 2017, 140, 127–140. [Google Scholar] [CrossRef]
- O’Grady, M.; Lechowska, A.A.; Harte, A.M. Application of infrared thermography technique to the thermal assessment of multiple thermal bridges and windows. Energy Build. 2018, 168, 347–362. [Google Scholar] [CrossRef] [Green Version]
- ISO. EN ISO 10211:2017; Thermal Bridges in Building Construction—Heat Flows and Surface Temperatures—Detailed Calculations. CEN Committee ISO/TC 163/SC; International Organization for Standardization: Geneva, Switzerland, 2017.
- Theodosiou, T.; Tsikaloudaki, K.; Bikas, D.; Aravantinos, D.; Kontoleon, K.N. Assessing the use of simplilied and analytical methods for approaching thermal bridges with regard to their impact on the thermal performance of the building envelope. In Proceedings of the World SB 14 Conference on the Sustainable Building: Result, Barcelona, Spain, 28–30 October 2014; Available online: http://wsb14barcelona.org/programme/pdf_poster/P-059.pdf (accessed on 1 March 2022).
- Theodosiou, T.G.; Papadopoulos, A.M. The impact of thermal bridges on the energy demand of buildings with double brick wall constructions. Energy Build. 2008, 40, 2083–2089. [Google Scholar] [CrossRef]
- Citterio, M.; Cocco, M.; Erhorn-Klutting, H. Thermal bridges in the EPBD context: Overview on MS approaches in regulations. In ASIEPI Information Paper. 2008. Available online: https://www.buildup.eu/sites/default/files/P064_EN_ASIEPI_WP4_IP1_p3073.pdf (accessed on 1 March 2022).
- Evola, G.; Margani, G.; Marletta, L. Energy and cost evaluation of thermal bridge correction in Mediterranean climate. Energy Build. 2011, 43, 2385–2393. [Google Scholar] [CrossRef]
- Martin, K.; Escudero, C.; Erkoreka, A.; Flores, I.; Sala, J.M. Equivalent wall method for dynamic characterization of thermal bridges. Energy Build. 2012, 55, 704–714. [Google Scholar] [CrossRef]
- Gao, Y.; Roux, J.J.; Zhao, L.H.; Jiang, Y. Dinamical building simulation: A low order model for thermal bridges losses. Energy Build. 2008, 40, 2236–2243. [Google Scholar] [CrossRef]
- Tadeu, A.; Simoes, I.; Simoes, N.; Prata, J. Simulation of dynamic liner thermal bridges using a boundary element method model in the frequency domain. Energy Build. 2011, 43, 3685–3695. [Google Scholar] [CrossRef]
- Berggren, B.; Wall, M. Calculation of thermal bridges in (Nordic) building envelopes—Risk of performance failure due to inconsistent use of methodology. Energy Build. 2013, 65, 331–339. [Google Scholar] [CrossRef]
- Ascione, F.; Bianco, N.; de Rossi, F.; Turni, G.; Vanoli, G.P. Different metchods for the modeling of thermal bridges into energy simulation programs: Comparisons of accuracy for flat heterogeneous roofs in Italian climates. Appl. Energy 2012, 97, 405–418. [Google Scholar] [CrossRef]
- Capozzoli, A.; Gorrino, A.; Corrado, V. A building thermal bridges sensitivity analysis. Appl. Energy 2013, 107, 229–243. [Google Scholar] [CrossRef]
- Construction Technical Regulation STR 2.01.02: 2016; Design and Certification of Energy Performance of Buildings; Ministry of Environment: Vilnius, Lithuania, 2020.
- Cerneckiene, J.; Zdankus, T.; Valancius, R.; Fokaides, P.A. Numerical Investigation of the impact of longitudinal thermal bridging on energy efficient buildings under humid continental climate conditions: The Case of Lithuania. In IOP Conference Series: Earth and Environmental Science; IOP Publishing: Bristol, UK, 2020; Volume 410, p. 012105. [Google Scholar]
- Fokaides, P.A.; Apanaviciene, R.; Černeckiene, J.; Jurelionis, A.; Klumbyte, E.; Kriauciunaite-Neklejonoviene, V.; Pupeikis, D.; Rekus, D.; Sadauskiene, J.; Seduikyte, L.; et al. Research Challenges and Advancements in the field of Sustainable Energy Technologies in the Built Environment. Sustainability 2020, 12, 8417. [Google Scholar] [CrossRef]
- De Angelis, E.; Serra, E. Light steel-frame walls: Thermal insulation performances and thermal bridges. Energy Procedia 2014, 45, 362–371. [Google Scholar] [CrossRef] [Green Version]
- Grudzińska, M.; Brzyski, P. The Occurrence of Thermal Bridges in Hemp-lime Construction Junctions. Period. Polytech. Civ. Eng. 2019, 63, 377–387. [Google Scholar] [CrossRef]
- Udrea, I.; Popa, R.T.; Mladin, E.C.; Georgescu, M.S.; Ochinciuc, C.V. Thermal bridges evaluation for a Passive House building in Romanian Southern climate. In Proceedings of the 2017 8th International Conference on Energy and Environment (CIEM), Bucharest, Romania, 19–20 October 2017; Proceedings Paper: International Conference on Energy and Environment. pp. 456–459. [Google Scholar]
- Sadauskiene, J.; Ramanauskas, J.; Seduikyte, L.; Dauksys, M.; Vasylius, A. A simplified methodology for evaluating the impact of point thermal bridges on the high-energy performance of a passive house. Sustainability 2015, 7, 16687–16702. [Google Scholar] [CrossRef] [Green Version]
- Rruumala. Available online: https://www.ruumala.com/lt/metaliniai-ankeriai/ploksti-kronsteinai/ (accessed on 1 March 2022).
- Lithuanian Passive House. Available online: https://www.pasyvusnamas.lt/langu-montavimas-siltinimo-sluoksnyje/langu-dezes (accessed on 1 March 2022).
- Hallik, J.; Kalamees, T. A new method to estimate point thermal transmittance based on combined two-dimensional heat flow calculation. In Proceedings of the 12th Nordic Symposium on Building Physics (nsb 2020), E3SWeb of Conferences, Tallinn, Estonia, 6–9 September 2020; Volume 172, p. 08005. [Google Scholar] [CrossRef]
- Tsukamoto, Y.; Tomikawa, Y.; Sakagami, K.; Okuzono, T.; Maikawa, H.; Komoto, Y. Experimental assessment of sound insulation performance of a double window with porous absorbent materials its cavity perimeter. Appl. Acoust. 2020, 165, 107317. [Google Scholar] [CrossRef]
- Tang, S.K. A review on natural ventilation-enabling façade noise control devices for congested high-rise cities. Appl. Sci. 2017, 7, 175. [Google Scholar] [CrossRef] [Green Version]
- Huang, H.; Qiu, X.; Kang, J. Active noise attenuation in ventilation windows. J. Acoust. Soc. Am. 2011, 130, 176–188. [Google Scholar] [CrossRef] [Green Version]
- Rockwool. Available online: https://docplayer.me/3412936-Redair-tm-link-monteringsanvisning.html (accessed on 1 March 2022).
- ISO. EN ISO 14683:2017; Thermal Bridges in Building Construction—Linear Thermal Transmittance—Simplified Methods and Default Values. International Organization for Standardization: Geneva, Switzerland, 2017.
- Terentjevas, J.; Šadauskaitė, M.; Šadauskienė, J.; Ramanauskas, J.; Buska, A.; Fokaides, P.A. Numerical investigation of buildings point thermal bridges observed on window-thermal insulation interface. Case Stud. Constr. Mater. 2021, 15, e00768. [Google Scholar] [CrossRef]
- Lawrence Berkeley National Laboratory (LBNL). THERM—Two-Dimensional Building Heat-Transfer Modeling. 2021. Available online: https://windows.lbl.gov/software/therm (accessed on 1 March 2022).
- Blocon, A.B. HEAT3—Heat Transfer in Three Dimensions. 2021. Available online: https://buildingphysics.com/heat3–3/ (accessed on 1 March 2022).
- Claesson, J. Dynamic thermal networks: A methodology to account for time-dependent heat conduction. In Proceedings of the 2nd International Conference on Research in Building Physics, Leuven, Belgium, 14–18 September 2003; pp. 407–415. [Google Scholar]
- Krawczyk, D.A. Optimization of Energy Consumption while Maintaining Recommended Indoor Air Quality in a Lecture Hall- A case study. In Proceedings of the 16th International Conference on the Sustainable Energy Technologies, Bolonia, Italy, 17–20 July 2017. [Google Scholar]
- Nait, N.; Bourbia, F.; Bauchahm, Y. Effect of thermal insulation on energy efficiency of the building envelope-semi dry climates. In Proceedings of the Advances on Sustainable Cities and Building Development, Sb–Lab 2017, Porto, Portugal, 15–17 November 2017. [Google Scholar]
- Misiopecki, C.; Bouquin, M.; Gustavsen, A.; Jelle, B.P. Thermal Modeling and Investigation of the Most Energy-Efficient Window Position. Energy Build. 2018, 158, 1079–1086. [Google Scholar] [CrossRef]
- Ascione, F.; Bianco, N.; De Masi, R.F.; Mauro, G.M.; Musto, M.; Vanoli, G.P. Experimental validation of a numerical code by thin film heat flux sensors for the resolution of thermal bridges in dynamic conditions. Appl. Energy 2014, 124, 213–222. [Google Scholar] [CrossRef]
- Šadauskiene, J.; Ramanauskas, J.; Vasylius, A. Impact of point thermal bridges on thermal properties of building envelopes. Therm. Sci. 2020, 24, 2181–2188. [Google Scholar] [CrossRef] [Green Version]
- Ilomets, S.; Kuusk, K.; Paap, L.; Arumagi, E.; Kalamees, T. Impact of linear thermal bridges on thermal transmittance of renovated apartment buildings. J. Civ. Eng. Manag. 2016, 23, 96–104. [Google Scholar] [CrossRef]


Publisher’s Note: MDPI stays neutral with regard to jurisdictional claims in published maps and institutional affiliations. |
© 2022 by the authors. Licensee MDPI, Basel, Switzerland. This article is an open access article distributed under the terms and conditions of the Creative Commons Attribution (CC BY) license (https://creativecommons.org/licenses/by/4.0/).
Share and Cite
Šadauskienė, J.; Ramanauskas, J.; Krawczyk, D.A.; Klumbytė, E.; Fokaides, P.A. Investigation of Thermal Bridges of a New High-Performance Window Installation Using 2-D and 3-D Methodology. Buildings 2022, 12, 572. https://doi.org/10.3390/buildings12050572
Šadauskienė J, Ramanauskas J, Krawczyk DA, Klumbytė E, Fokaides PA. Investigation of Thermal Bridges of a New High-Performance Window Installation Using 2-D and 3-D Methodology. Buildings. 2022; 12(5):572. https://doi.org/10.3390/buildings12050572
Chicago/Turabian StyleŠadauskienė, Jolanta, Juozas Ramanauskas, Dorota Anna Krawczyk, Eglė Klumbytė, and Paris A. Fokaides. 2022. "Investigation of Thermal Bridges of a New High-Performance Window Installation Using 2-D and 3-D Methodology" Buildings 12, no. 5: 572. https://doi.org/10.3390/buildings12050572