Article

The Impacts of Greenery Systems on Indoor Thermal Environments in Transition Seasons: An Experimental Investigation

1
College of Civil Engineering, Hunan University of Science and Technology, Xiangtan 411201, China
2
Hunan Engineering Research Center for Intelligently Prefabricated Passive House, Hunan University of Science and Technology, Xiangtan 411201, China
3
School of Environment and Architecture, University of Shanghai for Science and Technology, Shanghai 200093, China
*
Authors to whom correspondence should be addressed.
Buildings 2022, 12(5), 506; https://doi.org/10.3390/buildings12050506
Submission received: 5 March 2022 / Revised: 13 April 2022 / Accepted: 16 April 2022 / Published: 19 April 2022
(This article belongs to the Topic Building Energy and Environment)

Abstract

:
The impacts of greenery systems (GSs) on microclimate conditions and building energy performance have been frequently investigated using experiments and simulations during the past decades, especially in summer and winter. However, few studies have focused on the performance of GSs in transition seasons. The ambient weather conditions vary with great fluctuations during transition seasons, which may result in severe oscillations in indoor environments. To investigate the impacts of GSs on indoor environments, an experiment was conducted using a contrastive test platform, which consisted of two experimental rooms, one equipped with a GS and the other without, from 1 April 2019 to 31 May 2019 in Hunan, China. Both rooms were free-running. The experimental results showed that the GS had the ability to reduce the oscillations in the indoor environment. The oscillations in indoor dry-bulb temperature (DBT) and relative humidity (RH) were reduced by 39.3% and 28.8%, respectively. The maximum daily DBT and RH ranges were, respectively, cut down by 3.5 °C and 12.4%. The maximum reductions in external and internal surface temperatures were 29.5 °C and 9.4 °C, respectively, for the GS, while the average reductions were 1.6~4.1 °C and 0.2~1.3 °C, respectively, depending on the orientation of the surfaces. The operative temperature (OT) during the daytime on sunny days was also lowered by the GS. The differences in OT between the two rooms ranged from −1.8 °C to 8.2 °C, with an average of 1.0 °C. The GS can improve the indoor thermal comfort during transition seasons. The thermal dissatisfaction was decreased by 7.9%. This lengthened the thermal comfort time by 15% across the whole day and by 28% during the daytime. This indicates reductions in air-conditioning system operating times, leading to energy savings.

1. Introduction

The latest report from the Intergovernmental Panel on Climate Change (IPCC) [1] shows that the global surface temperature was 1.09 °C higher in 2011–2020 than in 1850–1900. It is an unequivocal fact that the global climate is warming due to pollution emissions from human activities. It is quite urgent for humans to take measures to mitigate global climate change. The rapid process of urbanization and urban densification is responsible for global climate warming [2]. According to statistics from the United Nations [3], 60–80% of energy consumption and 75% of carbon emissions in the world are from cities at present, although the area of land occupied by cities is only 3% of that of the earth. Furthermore, it is predicted that the proportion of the urban population around the world population will increase from 54% in 2014 to 66% by 2050 [4]. More fossil energy will be consumed and more pollution will be released by cities if sustainable strategies are not adopted in the future.
To accommodate for this population growth, a large amount of buildings and structures have been built in cities, resulting in large amounts of permeable land, such as bare soil and vegetation, being replaced by impervious concrete surfaces [5,6]. Increases in impervious land cause higher urban temperatures than in the surrounding rural areas. This phenomenon is called the urban heat island (UHI) effect [7]. The UHI can lead to many socio-economic problems, such as increasing the incidence of heat-related mortality and the cooling energy consumption in summer [8,9]. Therefore, strategies for mitigating the UHI effect are needed to achieve the goal of sustainable development.
Tian et al. [10] reviewed mitigation strategies for dealing with the UHI effect. Among these strategies, the construction of green infrastructure was considered a feasible approach to mitigate the UHI effect and global climate warming, as well as other problems. Green infrastructure can be classified into urban green spaces (UGS), green roofs (GR), and green walls (GW) [10]. UGS include the green spaces provided by urban roads, urban parks, residences, and workplaces. However, in crowded urban areas, the land is very precious and the UGS is very limited. Green roofs, also called as eco-roofs, vegetated roofs, or living roofs, contain plants vegetation on in areas that are usually idle. However, green wall plants and green vegetation on the vertical surfaces of buildings, such as the walls, façades, and blind walls, are also called vertical greening systems (VGS) [11]. Due to the occupation of urban land, GR and GW have wider application potential as strategies to mitigate the UHI and global warming compared with UGS. Both GW and GR can be classified as greenery systems (GSs) in buildings [12].
The environmental benefits [13] provided by GW and GR include improvements in indoor and outdoor thermal comfort and air quality [14,15,16,17,18]; reductions in energy consumption via enhancing building thermal performance [19,20,21,22,23,24,25,26,27]; the mitigation of the UHI effect and global climate change by cooling the urban area and lessening of GHG emissions [28,29,30,31,32,33,34,35]; decreased urban noise pollution [36,37]; relief of urban drainage pressures via storm water management, which is mainly provided by GR (the role of GW on storm water management is limited) [38,39]; and the promotion of biodiversity in urban environment [40,41]. In addition, GW and GR can also bring about many social benefits, such as improving a city’s image [42], enhancing the well-being of citizens [43], and increasing property values [44].
Due to the significant environmental and social benefits of GW and GF, much research has been focused on this topic, especially regarding the impacts on microclimate conditions and building energy consumption [45]. Experimental and simulation methods have been adopted in previous studies [46,47]. A systematic review on the influence of GW and GF on building environments and energy was presented by Seyam [48]. He found that six parameters, including solar radiation, ambient/indoor dry-bulb temperatures (DBT), ambient relative humidity (RH), and internal/external surface temperatures of walls and roofs, were frequently measured, while the indoor RH received little attention.
The impacts of GS on temperature reductions (TR) of external and internal surfaces [48], which are defined as temperature differences between external and internal surfaces of bare and vegetated walls and roofs, were most frequently investigated. The magnitude of the TRs of external and internal surfaces varied depending on the building envelope, the installation location of the GS, the outdoor climate conditions, and the design of the GS. Human occupancy also has a significant impact on the TRs of external and internal surfaces [49,50]. For a given GS, the TR value may be positive or negative, depending on the time of the day, season, and solar radiation intensity [48].
The reductions in temperature differences of external and internal surfaces between envelopes with and without GS have often been the focus, because these are closely associated with heat flux reductions through walls or roofs, thereby affecting the energy savings achieved by GSs. In most studies, the energy consumption was reduced via the use of a GS, while the energy saving rates varied across a wide range, depending on the vegetation coverage, outdoor climate conditions, and GS design [48].
Compared with TR values of external and internal surfaces and the energy savings achieved by GSs, the impacts on indoor building environments have been less investigated. For an air-conditioned space, the indoor DBT and RH are controlled by the air-conditioning system and are almost unaffected by the GS. However, the experimental results from Hao et al. [51] showed that the GS can reduce the indoor operative temperature (OT) of air-conditioned spaces by 0.4 °C on average and 2.1 °C in summer. In addition, it can also reduce the oscillations in indoor OT by 1.1 °C. According to the four seasons (spring, summer, autumn, and winter), experiments by Mangone et al. [52] with indoor plants improved the thermal comfort of an air-conditioned office by 12% compared to an office with an identical indoor temperature set-point but without plants. Lately, research results have revealed that small indoor green walls can help relieve the mental stress of the occupants [53].
The impacts of GSs on indoor thermal environments in non-air-conditioned spaces are more significant compared with air-conditioned spaces. The experimental results from Olivieri et al. [49] showed that a vegetation layer reduced the indoor DBT by 4 °C on average in a continental Mediterranean climate zone under summer conditions, while a lower OT in a chamber with vegetation was achieved compared with a chamber without vegetation due to a 5 °C lower internal surface temperature. To investigate the thermal performance of a living wall system (LWS) in a hot and humid climate, Chen et al. [54] constructed two experimental chambers of identical size, materials, and structure, except that one contained the LWS and the other did not. The experimental results for the two chambers revealed that the indoor DBT of the chamber with the LWS was reduced by 1.1 °C in summer. An LWS was applied on a school building in a hot and arid climate zone and the indoor DBT in the unconditioned school was measured in the peak summer month of July by Haggag et al. [55]. It was found that the indoor DBT with the LWS was always lower than that without the LWS, with reductions ranging from 2 °C at night to 6 °C during the daytime. Yang et al. [56] investigated the impact of a vertical GS on an indoor thermal environment in summer without the operation of an air-conditioning system. A double-skin green façade (DSGF) was added to a campus building and the indoor thermal environmental parameters were recorded. The experimental data indicated that the indoor DBT values were reduced on average by 0.6–1.2 °C, while the indoor OT values were lowered on average by 0.6–1.1 °C and 1.9–2.7 °C at maximum owing to the installation of the DSGF.
The transition seasons, which are between winter and summer, show different climatic condition compared with winter and summer, during which the impact of the outdoor environment on the indoor environment has its own features. To create a more comfortable indoor environment, Long et al. [57] performed an experimental investigation on the natural ventilation performance of a solar chimney system with an earth-to-air heat exchanger during the transition seasons. Cao et al. [58] investigated the window opening behavior of infant families during transition seasons. Yu et al. [59] experimentally and numerically analyzed the soil temperatures using a ground heat exchanger in transition seasons. However, there are few studies on the impacts of GSs on indoor environments during the transition seasons.
A literature review showed that less attention has been paid to the impacts of GSs on indoor environments compared with those on energy performance. However, this subject deserves particular attention because humans are spending more time indoors, especially following the coronavirus disease outbreak in 2019. Indoor environments have effects not only on indoor thermal comfort and resident health, but also on energy consumption. In addition, most of the existing studies have been conducted in summer or winter [48], while few have been conducted in transition seasons, during either spring or autumn. However, the weather fluctuates a lot in transition seasons, which could lead to severe oscillations in indoor environments, causing human discomfort, short-cycling of air-conditioning systems, and switching between heating and cooling demands. These factors not only increase a building’s energy consumption, but also shorten the service life of the air-conditioning system. Thus, technologies that can reduce the oscillations in indoor environments and decrease the energy consumption in transition seasons are preferred. The aim of this paper is to investigate the effects of a GS on an indoor environment and energy consumption in transition seasons through experimentation.

2. Materials and Methods

In order to investigate the influence of GS on indoor thermal environments and building energy performance, an experimental test platform, which consisted of two experiment rooms, both with sensors for environmental parameter measurements and a data collection and recording system, was set up on the top of an office building on the campus of Hunan University of Science and Technology, as shown in Figure 1. The size, structure, and materials of the walls and roof, as well as the orientations of the two experiment rooms, were identical, except that one room was equipped with GS while the other one was not. The room equipped with GS was called the VGRoom. The other room was used as a reference and was referred to as the RefRoom. The experimental setup had been used to investigate the effects of GS on indoor environments and energy savings in summer and winter [19,51]. In this paper, it was used to investigate the performance of GS during transition seasons.
The experimental room measured 3 m × 2.5 m with a height of 3 m. It had lightweight walls and a roof, with an overall heat transfer coefficient of 1.09 W/(m2·K). Two windows measuring 0.9 m × 1.2 m and an insulated door measuring 0.9 m × 2 m were installed in each room. The U-values of the windows and doors were, respectively, 4.1 W/(m2·K) and 2.1 W/(m2·K). A VGS with a living wall structure and GR with modular trays were installed on the VGRoom. Schefflera octophylla (Lour.) Harms and Sedum linear plants were selected for the green walls and roofs, respectively. These are evergreen plants with the characteristics of light favorability, drought tolerance, and easy maintenance.
To record the indoor and outdoor environmental parameters during the experiment, many sensors were installed. Two self-recording sensors (accuracy levels of ±0.5 °C for temperature and ±3% for RH) were used to record the indoor DBT and RH values. The temperatures of interior and exterior wall and roof surfaces of each room were measured using twenty T-type thermocouples, with an accuracy level of ±0.5 °C. The indoor black-globe temperature (BGT) values were measured using two black-globe thermometers, with a globe probe diameter of 150 mm. The accuracy of the black-globe thermometer was ±0.4 °C. The solar radiation was measured using a pyranometer, with an accuracy level of ±5%. The instrument used for measuring outdoor DBT and RH values was the same as that used for indoor measurements. The accuracy levels, measurement ranges, and sampling intervals for all abovementioned instruments are listed in Table 1. Figure 2 shows the locations where the sensors were installed in detail. An Agilent data collector was used to automatically collect the experimental data expect for the indoor and outdoor DBT and RH and the BGT, which were automatically recorded by the measuring instruments themselves. More details about the experimental setup can be found in the references [19,51].
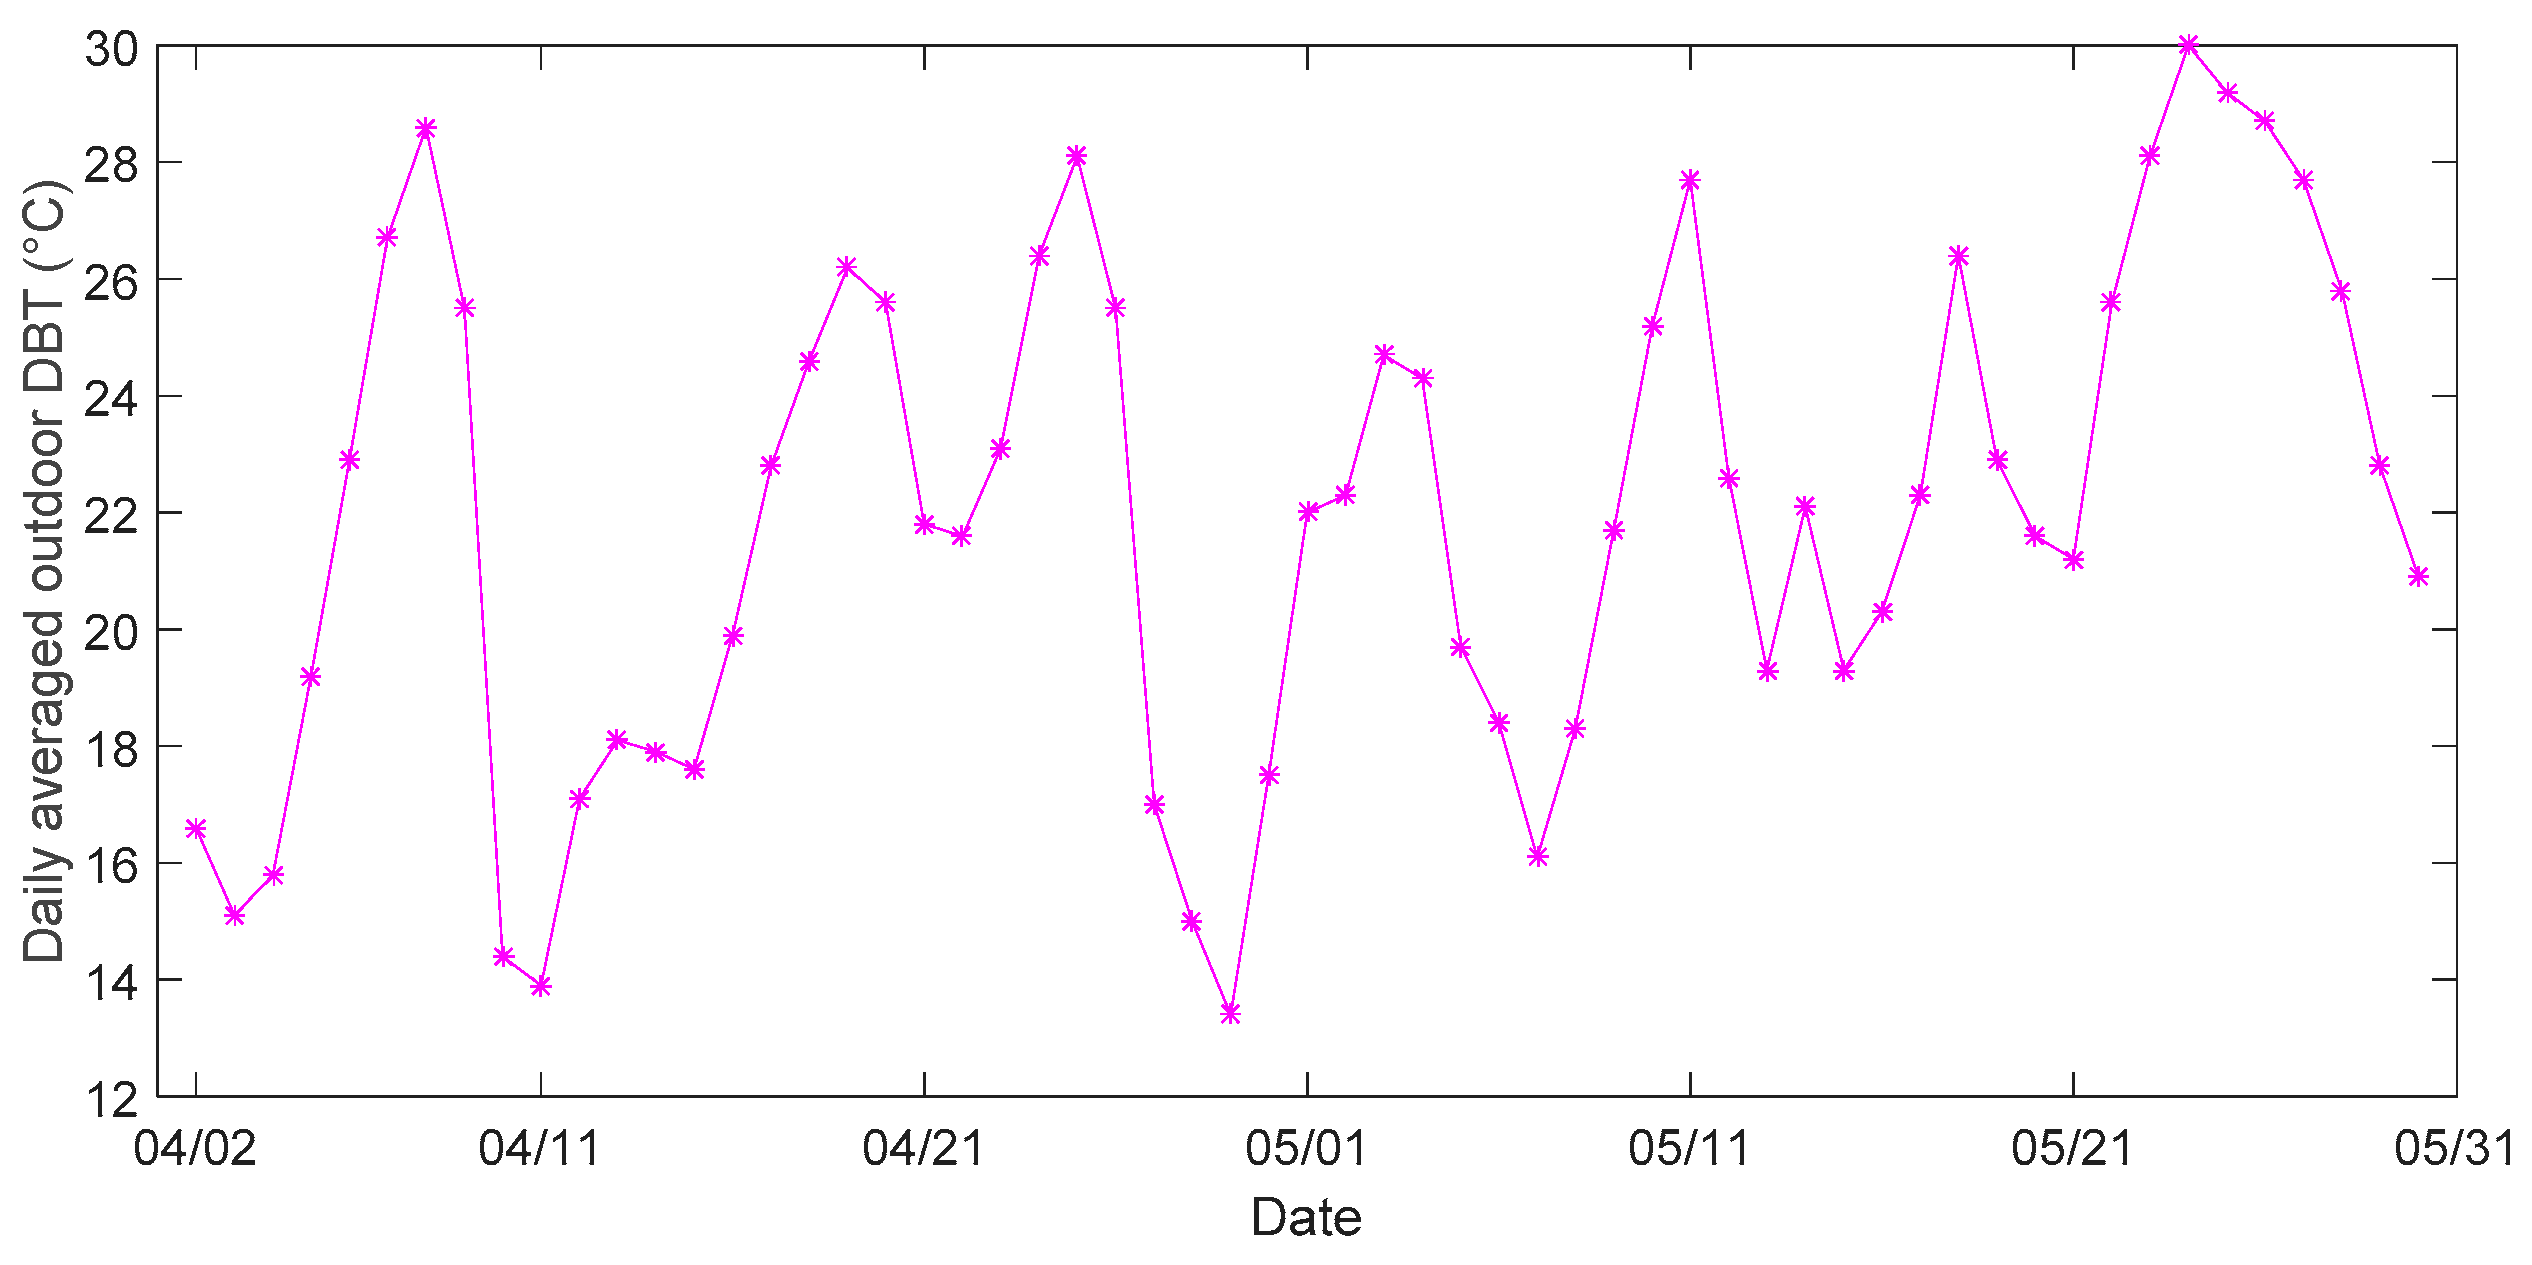
The experiment was carried out in Xiangtan, a city in Hunan Province in China at 28° N latitude and 112° E longitude. It features typical hot summer and cold winter weather conditions with four distinct seasons. The rainfall in Xiangtan is abundant, especially in spring and summer. It belongs to the Cfa category according to the Köppen–Geiger climate classification [60]. The transition seasons in Xiangtan are quite long and include two segments, spring (from March to May) and autumn (from October to November). The daily averaged outdoor temperatures in the transition seasons usually range from 12 °C to 26 °C. The experiment was conducted from 1 April 2019 to 31 May 2019. All data were automatically recorded at intervals of 10 min. The recorded data were hourly-averaged and were used for analysis.
During the experiment, both rooms were kept under free-running mode and no air-conditioner or heater was used. The rooms remained closed and unoccupied, except occasionally people entered the rooms to collect experimental data in order to avoid the influence of occupants.
The indoor environment is significantly affected by the outdoor climatic conditions on free-running mode. In the transition seasons, the indoor environment fluctuates a lot due to large fluctuations in the outdoor weather conditions. Measures to mitigate the oscillations of the indoor environment without running an air-conditioning system are preferred, as this leads to energy savings. To evaluate the effects of GS on reducing indoor environment oscillations, two indices, the DBT oscillation weakening rate (TOWR) and RH oscillation weakening rate (HOWR), were defined as:
T O W R = A D S D T R e f A D S D T V G A D S D T R e f × 100 %
H O W R = A D S D H R e f A D S D H V G A D S D H R e f × 100 %  
where A D S D T and A D S D H are, respectively, the average daily standard deviations (SD) of DBT (in °C) and RH (in %). The subscripts R e f and V G denote the RefRoom and VGRoom, respectively. The A D S D T and A D S D H for RefRoom and VGRoom during the experiment will be analyzed and compared in the Discussion.
For the indoor thermal environmental evaluation, OT, which combines the effects of both convective and radiative heat transfers, is a more reasonable indicator than the DBT. It can be calculated using Equation (3):
t op = h c o n t a i r + h r a d t ¯ r a d h c o n + h r a d
where t op is the operative temperature in °C; h con and h rad are, respectively, the convective and linear radiative heat transfer coefficients in W/(m2·°C); t a i r is the indoor DBT in °C. t ¯ r a d is the mean radiant temperature (MRT) in °C; t ¯ r a d can be determined using Equation (4) [61].:
t ¯ r a d = t b g + 273 4 + 0.4 × 10 8 t b g t a i r 1 / 4 × t b g t a i r 1 / 4 273
where t b g is the indoor BGT in °C. With the experiment data for indoor DBT and BGT, the MRT and OT can be determined using Equations (3) and (4). According to the suggestions from ASHRAE [62], values of 3.1 and 4.5 W/(m2·K) were adopted for h con and h rad , respectively. The impacts of GS on indoor OT will be discussed later.

3. Results

3.1. Outdoor Weather Conditions

The experiment data were collected from 4:00 p.m. on April 1 to 7:00 a.m. on 31 May and lasted for 1432 h. The data were recorded every ten minutes and then hourly-averaged. Figure 3 shows the variations in hourly-averaged outdoor DBT, RH, and solar radiation values during the experiment. Table 2 presents the statistical values for outdoor environmental parameters. Figure 3 and Table 2 show significant fluctuations in DBT and RH in outdoor air during the experiment. The outdoor DBT values ranged from 12.5 °C to 36.3 °C, covering the heating and cooling periods. The average outdoor DBT was 21.9 °C, which is a thermally comfortable temperature. The outdoor air RH values fluctuated between 36.6% and 96.8%, with an average value of 78%. This illustrated the humid climate in Xiangtan in spring. During the experiment, the maximum solar radiation intensity was 901.9 W/m2, with an average value of merely 112.7 W/m2. It was mostly rainy or cloudy during the experiment, with low solar radiation intensity, low outdoor DBT, and high outdoor RH values. It can also be seen from Figure 3 that a high outdoor DBT was usually accompanied by high solar radiation intensity.
Figure 4 displays the daily averaged outdoor DBT values during the experiment. The daily averaged DBT is the arithmetic mean of the 24-haveraged DBT. Most of the daily averaged outdoor temperatures were between 12 °C and 26 °C, except for a few days. According to the Chinese standard for climatic division [63], the transition seasons (spring and autumn) are when the daily average outdoor temperature is between 10 °C and 22 °C. Summer arrives if the daily average outdoor temperatures for five consecutive days are all higher than 22 °C. From Figure 4, it can be seen that the date for switching from spring to summer in meteorological terms was 22 May in 2019, which was close to the normal switching date of May 19 in Xiangtan. Therefore, the period from 1 April 2019 to 22 May 2019 was the spring transition season. However, there were 21 days in which the daily average temperature was higher than 22 °C, temperatures at which cooling may be required to maintain thermal comfort.

3.2. Indoor DBT

The indoor DBT values for the two experimental rooms are shown in Figure 5, along with the outdoor DBT values. The statistical results for the indoor DBT and RH are presented in Table 3. Due to the drastic changes in outdoor climatic conditions during the experiment, large indoor DBT oscillations were observed, especially in the RefRoom. The maximum, minimum, and averaged indoor DBTs of the RefRoom during the experiment were 37.8 °C, 11.9 °C and 23.0 °C, respectively. The maximum daily temperature range (MDTR), which is defined as the maximum difference between daily maximum and minimum DBTs, was 18 °C in the RefRoom. In contrast, the indoor DBT of the VGRoom showed less oscillation than that of the RefRoom. The maximum, minimum, and averaged indoor DBTs for the VGRoom were 32.5 °C, 13.0 °C, and 22.1 °C, respectively, and the MDTR of the VGRoom was 14.5 °C during the experiment. The indoor DBT oscillation was reduced by 3.5 °C with the GS, although the averaged DBT was reduced by only 0.9 °C. This indicates that the VGRoom achieved a more stable indoor thermal environment than the RefRoom in the transition season. During the experiment, the hourly indoor DBT difference between the RefRoom and VGRoom ranged from –1.8 °C to 7.9 °C, with an average of 0.9 °C.
To investigate the daily variations in indoor DBT in detail, two typical days, 7 April and 14 April, were selected as the representatives of two kinds of weather conditions in spring in Xiangtan. April 7 is a typical sunny day with averaged outdoor DBT and RH values of 26.7 °C and 64.2%, respectively. The averaged and maximum solar radiation intensities were 256.3 W/m2 and 851.6 W/m2, respectively. The indoor DBT values of the experimental rooms on April 7 are shown in Figure 6a. It can be observed that the indoor and outdoor DBT variations are notable and share similar variation trends. The DBTs rose in the morning and dropped off in the afternoon. However, the magnitudes of temperature oscillations were different. The indoor DBT oscillation for the RefRoom was much higher than that of the VGRoom. The indoor DBT of the RefRoom was obviously higher than that outdoors, while the indoor DBT of the VGRoom was lower than that outdoors during daytime. However, at night the indoor DBT of the VGRoom was higher than that of the RefRoom. Figure 6b shows the indoor and outdoor DBT variations on 14 April, which was a typical cloudy day. During the day, the averaged outdoor DBT, RH, and solar radiation intensity values were, respectively, 17.9 °C, 84.7%, and 15.8 W/m2, while the maximum solar radiation intensity was only 111.8 W/m2. Compared with sunny days, the temperature oscillation on cloudy day was small. The indoor DBT of the VGRoom was always slightly higher than those of the RefRoom and the outdoor DBT on cloudy days. In general, the temperature difference between indoor and outdoor environments was small. The indoor DBT of the VGRoom was almost the same as that of the outdoor. It can be found from Figure 6 that the solar radiation had a great impact on indoor DBT values during the transition season, while the GS mitigated this impact significantly.

3.3. Indoor RH

Figure 7 shows the indoor RH of the two experimental rooms during the experiment. The oscillations in RH were also drastic. Table 3 presents the statistical results for the indoor RH. The RH of the VGRoom during the experiment ranged from 42.8% to 93.2%, with an average of 77.7%, while for the RefRoom the values from 34.7% to 93.3%, with an average of 75.7%. The maximum daily RH ranges (MDRHRs), defined as the maximum difference between the daily maximum and minimum relative humidity, were 50.5% and 38.1% in the RefRoom and VGRoom, respectively. Similar to the indoor DBT, the oscillations in indoor RH for the VGRoom were also less noticeable than for the RefRoom. The smaller oscillations in RH in the VGRoom may be due to the smaller indoor DBT oscillations. During the experiment, the hourly indoor RH differences between the RefRoom and VGRoom ranged from −16.5% to 8.3%, with an average of −2.0%.

3.4. Indoor BGT

The BGTs for both experimental rooms are shown in Figure 8. It can be seen that the indoor BGT values for RefRoom were significantly higher for the VGRoom during the daytime, especially on sunny days. During the experiment, the BGT values in the RefRoom ranged from 11.9 °C to 37.3 °C, while in the VGRoom the values from 12.7 °C to 32.6 °C. The BGT variation range in the VGRoom was obviously smaller than that in the RefRoom. The average BGT values in VGRoom and RefRoom were, respectively, 22.0 °C and 23.1 °C, while a 1.1 °C reduction was achieved due to the GS. Figure 9 shows the BGT values over two typical days. The variation trend for BGT values on typical days is similar to that for DBT values shown in Figure 6. On sunny days, the BGT values in the RefRoom were much higher than in the VGRoom during the daytime, while the values were slightly lower late at night. On cloudy days, the VGRoom showed slightly higher BGT values most of the time, except for a short period in the afternoon. In general, the two rooms show similar indoor BGT values on cloudy days, without notable differences.

3.5. Internal and External Surface Temperatures of Building Walls and Roofs

The surface temperatures of the west wall are shown in Figure 10. The variation trends for the other walls and roofs are similar as for the west wall. Table 4 summarizes the variation ranges of surface temperatures for all walls and roofs during the experiment. From Figure 10, it can be seen that the external surface temperatures of the walls of the RefRoom were very high during daytime and much higher than that of the VGRoom. This verified that the shading effect of the GS can help to reduce the external wall and roof surface temperatures significantly during the daytime. However, the external surface temperatures of the RefRoom were slightly lower than for the VGRoom at night. This was due to the blockage of the GS in terms of radiative heat transfer between the external wall surfaces and the cold night sky, leading to lower heat loss at night. Benefiting from lower external surface temperatures during the daytime and higher external surface temperatures at night, the internal surface temperatures of the VGRoom were more stable than those of the RefRoom. This trend can also be seen in Table 4. During the experiment, the maximum and averaged surface temperatures for all walls and the roof of the RefRoom were higher than those of the VGRoom, while the minimum surface temperatures for all the walls and the roof were even lower. The external surface temperatures of the RefRoom and VGRoom were, respectively, in the ranges of 7.6~68.1 °C and 9.1~38.6 °C, while the internal surface temperatures varied across ranges of 10.7~43.2 °C and 11.8~34.1 °C, respectively. Both the temperature ranges of internal and external surfaces of the VGRoom were narrower than those of the RefRoom. Due to the smaller oscillations for external surfaces, the variations in indoor BGT values for the VGRoom were smaller, as shown in Figure 8. Compared with the RefRoom, the external and internal surface temperatures of the VGRoom were reduced by 1.6~4.1 °C and 0.2~1.3 °C on average, respectively. The maximum temperature reductions were 29.5 °C and 9.4 °C for external and internal surfaces, respectively. Among the walls and the roof, the maximum surface temperature of the roof and west wall were higher than the others. The maximum surface temperatures of the roof and west wall were, respectively, 68.1 °C and 63.8 °C for the RefRoom and 38.6 °C and 34.7 °C for the VGRoom.

4. Discussion

4.1. Impacts of GS on Indoor DBT and RH

Figure 11 shows the effects of the outdoor environment on the indoor environment in the two experiment rooms. It can be seen from Figure 11 that both the indoor DBT and RH vary linearly with the outdoor DBT and RH. Table 5 presents the results of the linear fitting process. The coefficients p1 and p2 are the slope and intercept of the linear fitting, respectively. The statistic R2 for all fits has a value close 1, which indicates the high fitness. It can be seen from Table 5 that the slopes of fitting curves for VGRoom are lower than for the RefRoom. A smaller slope indicates less influence from the outdoor environment. It was verified that GS can reduce the impacts of outdoor DBT and RH on the indoor climate.
Figure 12 shows the daily averaged indoor DBT values and the SD for the two rooms. It can be seen that the daily averaged indoor DBT for the RefRoom is higher than that of the VGRoom most of the time, except for some cloudy or rainy days. The SD of indoor DBT for the VGRoom is always lower than that of the RefRoom. Differing from the indoor DBT values, the daily averaged indoor air RH of the VGRoom is higher than that of the RefRoom, as shown in Figure 13a. However, Figure 13b shows a lower SD for the indoor air RH in the VGRoom than in the RefRoom. SD is a statistic characterizing the degree of variation in data, whereby a larger SD indicates a greater variation in data. The lower SD of the DBT and RH values in the VGRoom indicates less oscillation in indoor DBT and RH values during experiment. This also verified that GS had a good effect on reducing the oscillation of the indoor environment in the transition season. To investigate the role of GS on reducing the oscillation in indoor environments in the transition season, the experiment results of the two rooms were statistically analyzed. From the statistical results, the A D S D T and A D S D H for the RefRoom and VGRoom were, respectively, 2.8 °C and 7.3%, 1.7 °C and 5.2%. Therefore, T O W R and H O W R were, respectively, 39.3% and 28.8%. This means that the indoor DBT and RH oscillations were, respectively, decreased by 39.3% and 28.8% due to the use of GS, and a more stable indoor environment was achieved in the VGRoom in the transition season.

4.2. Impacts of GS on Indoor OT

The OT was calculated using Equation (3), and Figure 14 shows the indoor OT values for the two rooms. During the experiment, the OT values in RefRoom varied from 11.9 °C to 37.4 °C with an average of 23 °Cm while the values in VGRoom ranged from 12.8 °C to 32.6 °C with an average of 22 °C. It can be seen from Figure 14 that the OT values in the RefRoom were much higher than in the VGRoom during daytime on sunny days. However, the OTs during nighttime and on cloudy or rainy days were about the same. The differences in OT values between the RefRoom and VGRoom ranged from –1.8 °C to 8.2 °C with an average of 1.0 °C. This verified that the GS can significantly reduce the indoor OT fluctuations in the transition season. The difference was larger than that obtained by Yang et al. [56] and Hao et al. [51]. Yang et al. [56] found maximum and average reductions in the indoor OT of 1.9–2.7 °C and 0.6–1.1 °C, respectively, for a free-running room in summer (August). The experimental results from Hao et al. [51] for air-conditioned rooms showed an averaged reduction of 0.4 °C and a maximum reduction of 2.1 °C in indoor OT in summer. The reason could be due to the greater fluctuations in outdoor climatic conditions in the transition season. This also illustrates that the regulating effect of GS on indoor thermal environment is affected by the outdoor climate conditions and the air-conditioning system.

4.3. Impacts of GS on Indoor Thermal Comfort

The hourly indoor climate data for the experimental rooms during the experiment are presented in Figure 15, with the comfort zone marked in the figure. The comfort zone was determined with the method provided by ASHRAE Standard 55-2017 [64]. In the calculation, the metabolic rate of a person with sedentary activity in an office, which is 1.2 met (70 W/m2), was adopted. The thermal insulation of clothing was set at 0.75 clo. for the transition season, representing the mean of the thermal insulation levels of clothing for summer (cooling season, 0.5 clo.) and winter (heating season, 1.0 clo.), as suggested by ISO 7730 [65]. The air velocities measured were lower than 0.1 m/s in both rooms because the doors and windows were closed during the experiment and there was no rapid indoor air movement. The predicted mean vote (PMV) was set in the range of −0.7~+0.7. From Figure 15, it can be seen that there is a longer time period during which the indoor climate conditions were within the comfort zone in the VGRoom than in the RefRoom. The indoor DBT and RH oscillations of the VGRoom were also smaller than in the RefRoom.
The PMV and the predicted percentage dissatisfied (PPD) recommended by the international standard ISO 7730 [65] are often used for predicting the thermal sensation and the degree of thermal dissatisfaction of people in a thermal environment. From the measured data, the PMV and PPD were calculated for the two experimental rooms. A computer program provided by ISO 7730 was used to calculate the PMV and PPD of the two rooms during the experiment, and the results are shown in Figure 16 and Figure 17.
From Figure 16 and Figure 17, it can be seen that both the PMV and PPD values of the two rooms varied over a wide range, although smaller oscillations in PMV and PPD were observed in the VGRoom than in the RefRoom. This illustrates that the thermal comfortable condition was not met for some of the time. According to ISO 7730 [65], three categories of indoor environment criteria, A, B, and C, were defined for the indoor thermal environmental design. Each category prescribes the range of PMV and the maximum PPD that should be achieved in the indoor thermal environment. For category C, the indoor PMV should be in the range of −0.7 to +0.7 and the PPD should be no higher than 15%. The experimental result showed that there were 676 h in which the category C criterion was met during the 1432 h of experiment in the VGRoom, and the average PPD was 27.5%. However, for the RefRoom, there were only 587 h that the requirements for category C criterion were met, and the average PPD was 35.4%. This indicates that the GS can lengthen the period of indoor thermal comfort without the need for air-conditioning by 15% and can decrease the thermal dissatisfaction by 7.9% in the transition season. During the daytime (from 7:00 a.m. to 7:00 p.m.), there were 342 h for the VGRoom and 267 h for the RefRoom in which the indoor thermal comfort criterion was met. The GS improved the thermal comfort during the daytime by 28%. This shows the notable effect of the GS on improving indoor thermal comfort in the transition season, especially during the daytime. If air-conditioning systems are used to maintain the indoor thermal comfort, the GS can decrease the operation time of air-conditioning system by 15% for a whole-day-occupied building or 28% for a daytime-occupied building, meaning energy savings can be achieved.

4.4. Impacts of GS on Heat Transfer through the Walls or Roof

To investigate the direction of heat transfer through the walls, the surface temperatures of all walls were examined. Figure 18 shows the average temperature differences between the external and internal surfaces (Det_Ts) of all walls and the roof. It reveals a negative temperature gradient from external surfaces to internal surfaces for all walls and the roof of the VGRoom. This phenomenon was also found by Yang et al. [56]. Therefore, heat transfer through the walls and roof occurred from inside to outside during the whole day for the VGRoom. The cooling load through opaque walls and roofs can be estimated using the temperature difference between the external and internal surfaces. Thus, it indicates a cooling effect of the GS and significant energy saving potential on warm days. However, for the RefRoom, the average envelope temperature differences between the surfaces of east and west walls and the roof were positive, while for the south and north walls they were slightly less than zero. In addition, the temperature differences during the daytime were much higher than for the whole day. This indicates a higher cooling load during the daytime than at night. Compared to the RefRoom, discrepancies and temperature differences in the VGRoom were lower during the whole day and daytime. Among the walls and the roof, the largest temperature difference occurred for the roof, followed by the west wall. The smallest temperature difference was observed for the north wall.

5. Conclusions

In this study, the effects of GS on the indoor thermal environment and building energy performance during transitional seasons were explored via experimentation. The experiment was conducted in Xiangtan in China, which has a long transition season between the cold winter and hot summer. The experiment lasted for two months in the spring of 2019. The experimental results for two rooms, one with the GS and the other without the GS, were compared and analyzed. During the experiment, no air-conditioning system was run in either room. The findings are summarized below.
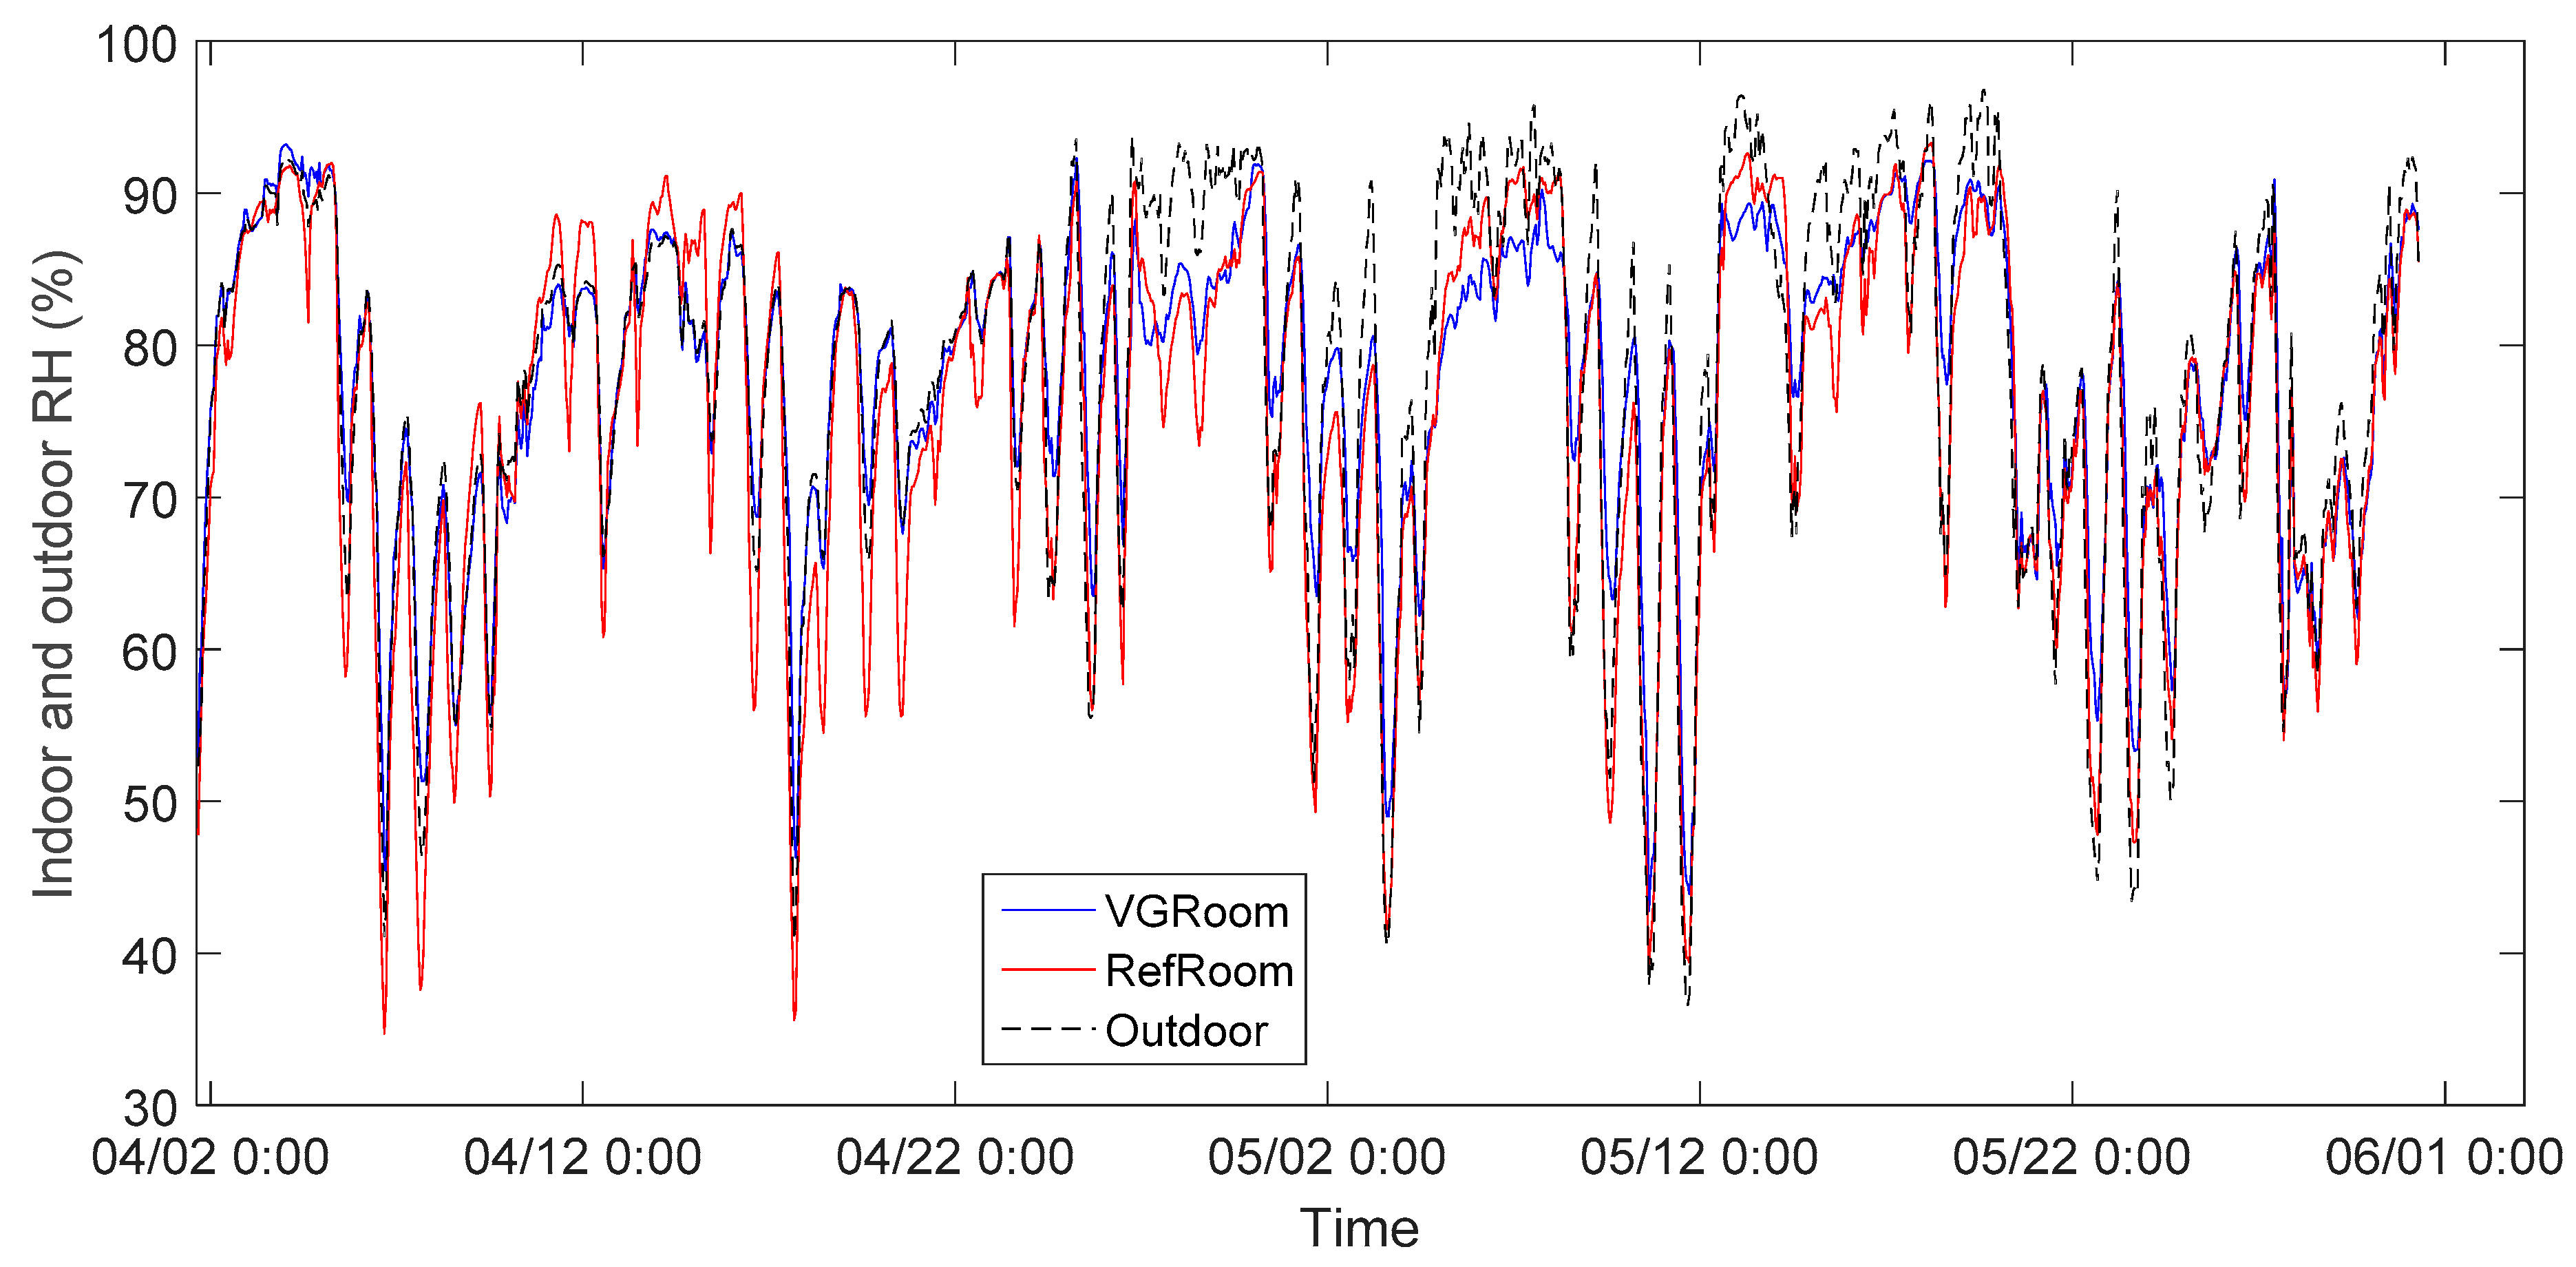
The indoor DBT and RH values of both rooms oscillated significantly in the transition season due to great fluctuations in outdoor climatic conditions when the air-conditioning system was not operated. The experimental results indicate an obvious effect of the GS in reducing the oscillation of the indoor environment in the transition season. The maximum daily DBT and RH variations were, respectively, depressed by 3.5 °C and 12.4% due to the application of the GS, although the average values during the experiment were only reduced by 0.9 °C and –2.0%. Two indices, TOWR and HOWR, were defined for evaluating the effects of GS on reducing indoor environment oscillation. The TOWR and HOWR results showed 39.3% and 28.8% oscillation reductions in indoor DBT and RH with the GS. This verified the ability of the GS to maintain a more stable indoor environment.
For various orientations, the external and internal surfaces temperatures were reduced by 1.6~4.1 °C and 0.2~1.3 °C on average by the GS, respectively. The maximum reductions in external and internal surface temperatures were 29.5 °C and 9.4 °C, respectively. For the room with the GS, the average internal surface temperatures of all walls and the roof were higher than for the corresponding external surfaces, indicating an outgoing heat flux throughout the whole day. However, the average temperature differences of external and internal surfaces for the RefRoom were either positive or negative, depending on the orientation of the wall. The temperature difference during the daytime was much higher than that throughout the whole day.
The OT for the room with the GS was lower than that without the GS during the daytime on sunny days. However, almost identical OT values were observed at night and on cloudy or rainy days. The differences in OT between the two rooms ranged from −1.8 °C to 8.2 °C, with an average of 1.0 °C. This differences were higher than those found by Yang et al. [56] for a non-air-conditioned room and by Hao et al. [51] for an air-conditioned room in summer. This reveals that the regulating effect of the GS is affected by the outdoor climate conditions and the air-conditioning system.
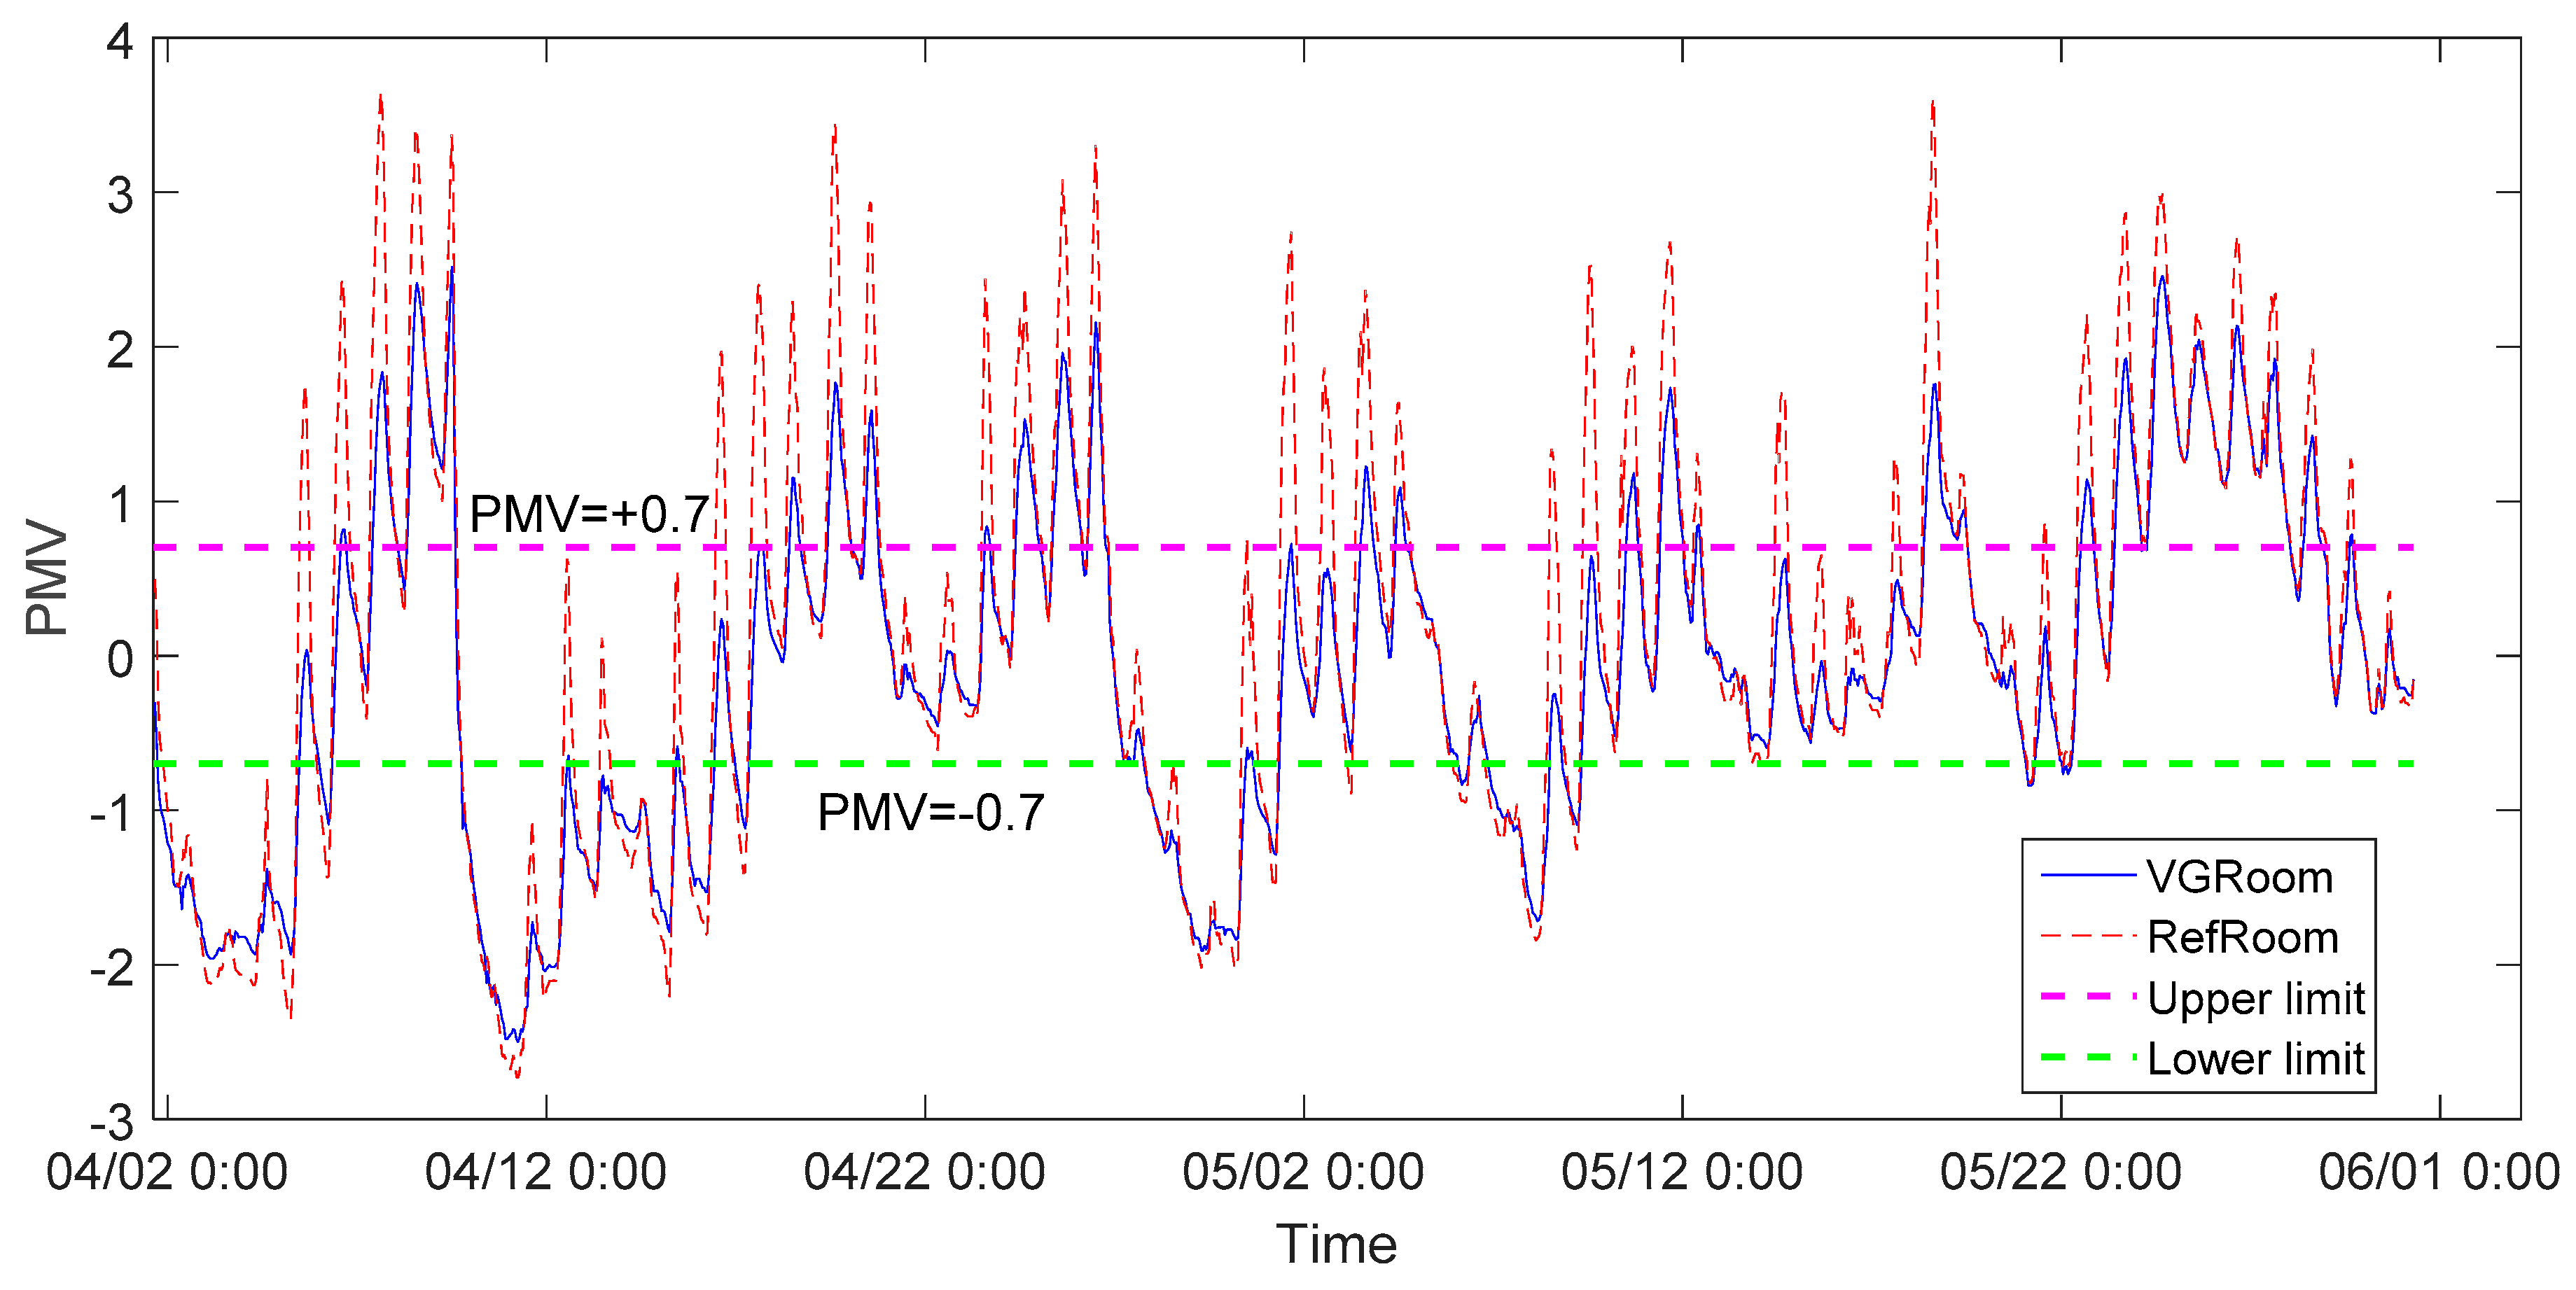
The experimental result showed that the GS can improve the indoor thermal comfort and decrease the thermal dissatisfaction by 7.9% in the transition season. A 15% longer time that the indoor conditions can meet the thermal comfort criterion was achieved by the VGRoom. The role of the GS in improving indoor thermal comfort was more significant in the daytime. The time that the indoor conditions satisfied the thermal comfort criterion was lengthened by 28% during the daytime. This indicates a reduction in air-conditioning operating time and that energy savings can be achieved.
In this paper, we presented the results of research on the impacts of the GS on an indoor microclimate. It will be helpful for designers and building owners to learn about the role of the GS in improving indoor environments and reducing energy consumption. However, the influence of a building’s dynamic properties, such as the thermal capacity of the outer envelope and the air tightness, was not considered in this paper. For future research, an investigation on the dynamic properties of the test object and a comparison and comparative analysis of CO2 concentrations in the tested rooms and the external environment shall be included.

Abbreviation

BGTBlack-globe temperature (°C)
DBTDry-bulb temperature (°C)
DSGFDouble-skin green façade
GHGGreenhouse gas
GRGreen roof
GSGreenery system
GWGreen wall
HOWRRelative humidity oscillation weakening rate (%)
IPCCIntergovernmental Panel on Climate Change
LWSLiving wall system
MDRHRMaximum daily relative humidity ranges (%)
MDTRMaximum daily dry-bulb temperature range (°C)
MRTMean radiant temperature (°C)
OTOperative temperature (°C)
PMVPredicted mean vote
PPDPredicted percentage dissatisfied (%)
RHRelative humidity (%)
RefRoomExperimental room without greenery system
SDStandard deviations
TOWRDry-bulb temperature oscillation weakening rate (%)
TRTemperature reductions (°C)
UGSUrban green spaces
UHIUrban heat island
VGRoomExperimental room equipped greenery system
VGSVertical greening systems

Author Contributions

X.H. and Y.L. contributed to the conception of the study and the development of the methodology. Investigation, L.L., H.T. and J.H.; Writing—review and editing, X.H., W.Y. and Y.L. All authors have read and agreed to the published version of the manuscript.

Funding

This work is financially supported by scientific research fund of Hunan Provincial Education Department (Funding Numbers: 19A180 and 21B0460).

Institutional Review Board Statement

Not applicable.

Informed Consent Statement

Not applicable.

Data Availability Statement

Not applicable.

Conflicts of Interest

The authors declare no conflict of interest.

References

  1. IPCC. Summary for Policymakers. In Climate Change 2021: The Physical Science Basis. Contribution of Working Group I to the Sixth Assessment Report of the Intergovernmental Panel on Climate Change; Cambridge University Press: Cambridge, UK, 2021. [Google Scholar]
  2. Meulen, S.H.V.D. Costs and benefits of green roof types for cities and building owners. J. Sustain. Dev. Energy Water Environ. Syst. 2019, 7, 57–71. [Google Scholar] [CrossRef]
  3. U.N. Sustainable Development Goal 11: Sustainable Cities and Communities, Make Cities and Human Settlements Inclusive, Safe, Resilient and Sustainable. Available online: https://armenia.un.org/index.php/en/sdgs/11 (accessed on 1 March 2022).
  4. Morakinyo, T.E.; Lai, A.; Lau, K.K.-L.; Ng, E.Y.Y. Thermal benefits of vertical greening in a high-density city: Case study of Hong Kong. Urban For. Urban Green. 2019, 37, 42–55. [Google Scholar] [CrossRef]
  5. Mathew, A.; Khandelwal, S.; Kaul, N. Spatial and temporal variations of urban heat island effect and the effect of percentage impervious surface area and elevation on land surface temperature: Study of Chandigarh city, India. Sustain. Cities Soc. 2016, 26, 264–277. [Google Scholar] [CrossRef]
  6. Dutta, D.; Rahman, A.; Paul, S.; Kundu, A. Impervious surface growth and its inter-relationship with vegetation cover and land surface temperature in peri-urban areas of Delhi. Urban Clim. 2021, 37, 100799. [Google Scholar] [CrossRef]
  7. Oke, T.R. City size and the urban heat island. Atmos. Environ. 1973, 7, 769–779. [Google Scholar] [CrossRef]
  8. Tan, C.L.; Wong, N.H.; Jusuf, S.K. Outdoor mean radiant temperature estimation in the tropical urban environment. Build. Environ. 2013, 64, 118–129. [Google Scholar] [CrossRef]
  9. Kim, S.W.; Brown, R.D. Urban heat island (UHI) variations within a city boundary: A systematic literature review. Renew. Sustain. Energy Rev. 2021, 148, 111256. [Google Scholar] [CrossRef]
  10. Tian, L.; Li, Y.; Lu, J.; Wang, J. Review on Urban Heat Island in China: Methods, Its Impact on Buildings Energy Demand and Mitigation Strategies. Sustainability 2021, 13, 762. [Google Scholar] [CrossRef]
  11. Manso, M.; Teot’onio, I.; Silva, C.M.; Cruz, C.O. Green roof and green wall benefits and costs: A review of the quantitative evidence. Renew. Sustain. Energy Rev. 2021, 135, 110111. [Google Scholar] [CrossRef]
  12. Besir, A.B.; Cuce, E. Green roofs and facades: A comprehensive review. Renew. Sustain. Energy Rev. 2018, 82, 915–939. [Google Scholar] [CrossRef]
  13. Daemei, A.B.; Shafiee, E.; Chitgar, A.A.; Asadi, S. Investigating the thermal performance of green wall: Experimental analysis, deep learning model, and simulation studies in a humid climate. Build. Environ. 2021, 205, 108201. [Google Scholar] [CrossRef]
  14. Charoenkit, S.; Yiemwattana, S. Living walls and their contribution to improved thermal comfort and carbon emission reduction: A review. Build. Environ. 2016, 105, 82–94. [Google Scholar] [CrossRef]
  15. Perini, K.; Ottel’e, M.; Haas, E.M.; Raiteri, R. Vertical greening systems, a process tree for green façades and living walls. Urban Ecosyst. 2013, 16, 265–277. [Google Scholar] [CrossRef]
  16. Weerakkody, U.; Dover, J.W.; Mitchell, P.; Reiling, K. Particulate matter pollution capture by leaves of seventeen living wall species with special reference to rail-traffic at a metropolitan station. Urban For. Urban Green. 2017, 27, 173–186. [Google Scholar] [CrossRef]
  17. Pugh, T.A.M.; MacKenzie, A.R.; Whyatt, J.D.; Hewitt, C.N. Effectiveness of Green Infrastructure for Improvement of Air Quality in Urban Street Canyons. Environ. Sci. Technol. 2012, 46, 7692–7699. [Google Scholar] [CrossRef] [Green Version]
  18. Ottelé, M.; van Bohemen, H.D.; Fraaij, A.L. Quantifying the deposition of particulate matter on climber vegetation on living walls. Ecol. Eng. 2010, 36, 154–162. [Google Scholar] [CrossRef]
  19. Xing, Q.; Hao, X.; Lin, Y.; Tan, H.; Yang, K. Experimental investigation on the thermal performance of a vertical greening system with green roof in wet and cold climates during winter. Energy Build. 2018, 183, 105–117. [Google Scholar] [CrossRef]
  20. Yuan, S.; Rim, D. Cooling energy saving associated with exterior GSs for three US Department of Energy (DOE) standard reference buildings. Build. Simul. 2018, 11, 625–631. [Google Scholar] [CrossRef]
  21. Kalani, K.W.D.; Dahanayake, C.; Chow, L. Studying the potential of energy saving through vertical greenery systems: Using EnergyPlus simulation program. Energy Build. 2017, 138, 47–59. [Google Scholar]
  22. Foustalieraki, M.; Assimakopoulos, M.; Santamouris, M.; Pangalou, H. Energy performance of a medium scale green roof system installed on a commercial building using numerical and experimental data recorded during the cold period of the year. Energy Build. 2017, 135, 33–38. [Google Scholar] [CrossRef]
  23. Coma, J.; Pérez, G.; de Gracia, A.; Burés, S.; Urrestarazu, M.; Cabeza, L.F. Vertical greenery systems for energy savings in buildings: A comparative study between green walls and green facades. Build. Environ. 2017, 111, 228–237. [Google Scholar] [CrossRef] [Green Version]
  24. Perini, K.; Bazzocchi, F.; Croci, L.; Magliocco, A.; Cattaneo, E. The use of vertical greening systems to reduce the energy demand for air conditioning. Field monitoring in Mediterranean climate. Energy Build. 2017, 143, 35–42. [Google Scholar] [CrossRef]
  25. Pérez, G.; Coma, J.; Sol, S.; Cabeza, L.F. Green facade for energy savings in buildings: The influence of leaf area index and facade orientation on the shadow effect. Appl. Energy 2017, 187, 424–437. [Google Scholar] [CrossRef] [Green Version]
  26. Ran, J.; Tang, M. Passive cooling of the green roofs combined with night-time ventilation and walls insulation in hot and humid regions. Sustain. Cities Soc. 2018, 38, 466–475. [Google Scholar] [CrossRef]
  27. Tan, H.; Hao, X.; Long, P.; Xing, Q.; Lin, Y.; Hu, J. Building envelope integrated green plants for energy saving. Energy Explor. Exploit. 2019, 38, 222–234. [Google Scholar] [CrossRef]
  28. Shafiee, E.; Faizi, M.; Yazdanfar, S.-A.; Khanmohammadi, M.-A. Assessment of the effect of living wall systems on the improvement of the urban heat island phenomenon. Build. Environ. 2020, 181, 106923. [Google Scholar] [CrossRef]
  29. Andric, I.; Kamal, A.; Al-Ghamdi, S.G. Efficiency of green roofs and green walls as climate change mitigation measures in extremely hot and dry climate: Case study of Qatar. Energy Rep. 2020, 6, 2476–2489. [Google Scholar] [CrossRef]
  30. Sierra-P´erez, J.; Rodríguez-Soria, B.; Boschmonart-Rives, J.; Gabarrell, X. Integrated life cycle assessment and thermodynamic simulation of a public building’s envelope renovation: Conventional vs. Passivhaus proposal. Appl. Energy 2018, 212, 1510–1521. [Google Scholar] [CrossRef] [Green Version]
  31. Daemei, A.B.; Azmoodeh, M.; Zamani, Z.; Khotbehsara, E.M. Experimental and simulation studies on the thermal behavior of vertical greenery system for temperature mitigation in urban spaces. J. Build. Eng. 2018, 20, 277–284. [Google Scholar] [CrossRef]
  32. Battista, G.; Evangelisti, L.; Guattari, C.; Vollaro, E.D.L.; Vollaro, R.D.L.; Asdrubali, F. Urban heat Island mitigation strategies: Experimental and numerical analysis of a university campus in Rome (Italy). Sustainability 2020, 12, 7971. [Google Scholar] [CrossRef]
  33. Mutani, G.; Todeschi, V. The Effects of Green Roofs on Outdoor Thermal Comfort, Urban Heat Island Mitigation and Energy Savings. Atmosphere 2020, 11, 123. [Google Scholar] [CrossRef] [Green Version]
  34. Guattari, C.; Evangelisti, L.; Asdrubali, F.; Vollaro, R.D.L. Experimental Evaluation and Numerical Simulation of the Thermal Performance of a Green Roof. Appl. Sci. 2020, 10, 1767. [Google Scholar] [CrossRef] [Green Version]
  35. Todeschi, V.; Mutani, G.; Baima, L.; Nigra, M.; Robiglio, M. Smart Solutions for Sustainable Cities—The Re-Coding Experience for Harnessing the Potential of Urban Rooftops. Appl. Sci. 2020, 10, 7112. [Google Scholar] [CrossRef]
  36. Wong, N.H.; Kwang Tan, A.Y.; Tan, P.Y.; Chiang, K.; Wong, N.C. Acoustics evaluation of vertical GSs for building walls. Build. Environ. 2010, 45, 411–420. [Google Scholar] [CrossRef]
  37. Pérez, G.; Coma, J.; Barreneche, C.; de Gracia, A.; Urrestarazu, M.; Burés, S.; Cabeza, L.F. Acoustic insulation capacity of Vertical Greenery Systems for buildings. Appl. Acoust. 2016, 110, 218–226. [Google Scholar] [CrossRef] [Green Version]
  38. Sims, A.W.; Robinson, C.E.; Smart, C.C.; O’Carroll, D.M. Mechanisms controlling green roof peak flow rate attenuation. J. Hydrol. 2019, 577, 123972. [Google Scholar] [CrossRef]
  39. Liu, W.; Wei, W.; Chen, W.; Deo, R.C.; Si, J.; Xi, H.; Li, B.; Feng, Q. The impacts of substrate and vegetation on storm water runoff quality from extensive green roofs. J. Hydrol. 2019, 576, 575–582. [Google Scholar] [CrossRef]
  40. Madre, F.; Clergeau, P.; Machon, N.; Vergnes, A. Building biodiversity: Vegetated façades as habitats for spider and beetle assemblages. Glob. Ecol. Conserv. 2015, 3, 222–233. [Google Scholar] [CrossRef] [Green Version]
  41. Chiquet, C.; Dover, J.W.; Mitchell, P. Birds and the urban environment: The value of green walls. Urban Ecosyst. 2012, 16, 453–462. [Google Scholar] [CrossRef]
  42. Theodoridou, I.; Karteris, M.; Mallinis, G.; Papadopoulos, A.; Hegger, M. Assessment of retrofitting measures and solar systems’ potential in urban areas using Geographical Information Systems: Application to a Mediterranean city. Renew. Sustain. Energy Rev. 2012, 16, 6239–6261. [Google Scholar] [CrossRef]
  43. Magliocco, A.; Perini, K. The perception of green integrated into architecture: Installation of a green facade in Genoa, Italy. AIMS Environ. Sci. 2015, 2, 899–909. [Google Scholar] [CrossRef]
  44. Ichihara, K.; Cohen, J.P. New York City property values: What is the impact of green roofs on rental pricing? Lett. Spat. Resour. Sci. 2010, 4, 21–30. [Google Scholar] [CrossRef]
  45. Bustami, R.A.; Belusko, M.; Ward, J.; Beecham, S. Vertical greenery systems: A systematic review of research trends. Build. Environ. 2018, 146, 226–237. [Google Scholar] [CrossRef]
  46. Abdo, P.; Huynh, B.P. An experimental investigation of green wall bio-filter towards air temperature and humidity variation. J. Build. Eng. 2021, 39, 102244. [Google Scholar] [CrossRef]
  47. Kenai, M.-A.; Libessart, L.; Lassue, S.; Defer, D. Impact of green walls occultation on energy balance: Development of a TRNSYS model on a brick masonry house. J. Build. Eng. 2021, 44, 102634. [Google Scholar] [CrossRef]
  48. Seyam, S. The impact of greenery systems on building energy: Systematic review. J. Build. Eng. 2019, 26, 100887. [Google Scholar] [CrossRef]
  49. Olivieri, F.; Neila, J. Experimental study of the thermal-energy performance of an insulated vegetal façade under summer conditions in a continental mediterranean climate. Build. Environ. 2014, 77, 61–76. [Google Scholar] [CrossRef]
  50. Tseng, Y.-C.; Lee, D.-S.; Lin, C.-F.; Chang, C.-Y. A Novel Sensor Platform Matching the Improved Version of IPMVP Option C for Measuring Energy Savings. Sensors 2013, 13, 6811–6831. [Google Scholar] [CrossRef] [Green Version]
  51. Hao, X.; Xing, Q.; Long, P.; Lin, Y.; Hu, J.; Tan, H. Influence of vertical GSs and green roofs on the indoor operative temperature of air-conditioned rooms. J. Build. Eng. 2020, 31, 101373. [Google Scholar] [CrossRef]
  52. Mangone, G.; Kurvers, S.; Luscuere, P. Constructing thermal comfort: Investigating the effect of vegetation on indoor thermal comfort through a four season thermal comfort quasi-experiment. Build. Environ. 2014, 81, 410–426. [Google Scholar] [CrossRef]
  53. Yeom, S.; Kim, H.; Hong, T. Psychological and physiological effects of a green wall on occupants: A cross-over study in virtual reality. Build. Environ. 2021, 204, 108134. [Google Scholar] [CrossRef]
  54. Chen, Q.; Li, B.; Liu, X. An experimental evaluation of the living wall system in hot and humid climate. Energy Build. 2013, 61, 298–307. [Google Scholar] [CrossRef]
  55. Haggag, M.; Hassan, A.; Elmasry, S. Experimental study on reduced heat gain through green façades in a high heat load climate. Energy Build. 2014, 82, 668–674. [Google Scholar] [CrossRef]
  56. Yang, F.; Yuan, F.; Qian, F.; Zhuang, Z.; Yao, J. Summertime thermal and energy performance of a double-skin green facade: A case study in Shanghai. Sustain. Cities Soc. 2018, 39, 43–51. [Google Scholar] [CrossRef]
  57. Long, T.; Zhao, N.; Li, W.; Wei, S.; Li, Y.; Lu, J.; Huang, S.; Qiao, Z. Natural ventilation performance of solar chimney with and without earth-air heat exchanger during transition seasons. Energy 2022, 250, 123818. [Google Scholar] [CrossRef]
  58. Cao, Y.; Pan, S.; Liu, Y.; Yu, H.; Wang, X.; Chang, L.; Ni, M.; Liu, H. The window opening behavior of infant families: A case study during transition season in the cold region of China. Energy Build. 2021, 254, 111588. [Google Scholar] [CrossRef]
  59. Yu, T.; Wang, D.; Zhao, X.; Liu, J.; Kim, M.K. Experimental and Numerical Study of an Active Solar Heating System with Soil Heat Storage for Greenhouses in Cold Climate Zones. Buildings 2022, 12, 405. [Google Scholar] [CrossRef]
  60. Kottek, M.; Grieser, J.; Beck, C.; Rudolf, B.; Rubel, F. World map of the Köppen-Geiger climate classification updated. Meteorol. Z. 2006, 15, 259–263. [Google Scholar] [CrossRef]
  61. ISO 7726:1998; Ergonomics of the Thermal Environment—Instruments for Measuring Physical Quantities. ISO: Geneva, Switzerland, 1998.
  62. American Society of Heating. Refrigerating and Air-Conditioning Engineers (ASHRAE). In ASHRAE Handbook-Fundamentals; ASHRAE: Atlanta, GA, USA, 2009. [Google Scholar]
  63. QX/T 152:2012; China Meteorological Administration. Standard for Division of Climatic. Meteorological Press: Beijing, China, 2012.
  64. ASHRAE Standard 55:2017; Thermal Environmental Conditions for Human Occupancy. ASHRAE: Atlanta, GA, USA, 2017.
  65. ISO 7730:2005; Ergonomics of the Thermal Environment—Analytical Determination and Interpretation of Thermal Comfort Using Calculation of the PMV and PPD Indices and Local Thermal Comfort Criteria. ISO: Geneva, Switzerland, 2005.
Figure 1. Location on the map (a) and photograph (b) of the experimental setup.
Buildings 12 00506 g001
Figure 2. Installation locations of sensors: (a) plan and (b) cross-section 1-1 (the unit of dimensions is mm).
Buildings 12 00506 g002
Figure 3. Outdoor DBT (a), RH (b), and solar radiation (c) values during the experiment.
Buildings 12 00506 g003
Figure 4. Daily averaged outdoor DBT values during the experiment.
Buildings 12 00506 g004
Figure 5. Indoor DBT values for the experimental rooms and the outdoor DBT.
Buildings 12 00506 g005
Figure 6. Indoor DBT values for the experimental rooms and the outdoor DBT. (a) The indoor DBT values on April 7. (b) The indoor and outdoor DBT variations on 14 April.
Buildings 12 00506 g006
Figure 7. Indoor RH values for the experimental rooms and the outdoor RH.
Buildings 12 00506 g007
Figure 8. Indoor BGT values in the experimental rooms.
Buildings 12 00506 g008
Figure 9. Indoor BGT variations over two typical days.
Buildings 12 00506 g009
Figure 10. Internal and external surface temperatures of the west walls of the two experimental rooms.
Buildings 12 00506 g010
Figure 11. Relationships between (a) indoor and outdoor DBT and (b) indoor and outdoor RH values.
Buildings 12 00506 g011
Figure 12. Daily averaged indoor DBT values (a) and their daily SD (b) during the experiment.
Buildings 12 00506 g012
Figure 13. Daily averaged indoor air RH values (a) and their daily SD (b) during the experiment.
Buildings 12 00506 g013
Figure 14. Indoor OTs for two experiment rooms and the differences.
Buildings 12 00506 g014
Figure 15. Hourly indoor climate data shown as a psychrometric chart of moist air.
Buildings 12 00506 g015
Figure 16. PMV values during the experiment.
Buildings 12 00506 g016
Figure 17. PPD values during the experiment.
Buildings 12 00506 g017
Figure 18. Average temperature differences of external and internal surfaces of the walls and roof.
Buildings 12 00506 g018
Table 1. Monitoring data and instrumentation.
ParameterSampling IntervalMeasuring DeviceMeasuring RangeAccuracy
Air temperature (°C)1 minTemp self-recording meter−40~100 °C±0.5 °C
Relative humidity (%)1 minRH self-recording meter0~100%±3%
Black globe temperature (°C)1 minBGT self-recording meter−20 °C~+80 °C±0.4 °C
Surface temperature of wall (°C)1 minT-type thermocouple−200 °C~300 °C±0.5 °C
Solar radiation intensity (W/m2)1 minPyranometer0~2000 W/m2±5%
Table 2. Environmental parameters during the experiment.
MaximumMinimumAverage
Outdoor DBT (°C)36.312.521.9
Outdoor RH (%)96.836.678.0
Solar radiation (W/m2)901.90112.7
Table 3. Statistical results for the indoor DBT and RH.
DBT (°C)RH (%)
MaximumMinimumAverageMDTRMaximumMinimumAverageMDRHR
VGRoom32.513.022.114.593.242.877.738.1
RefRoom37.811.923.018.093.334.775.750.5
Table 4. Summary of internal and external surface temperatures of walls and roofs (°C).
East WallWest WallSouth WallNorth WallRoof
Int. surf.Ext. surf.Int. surf.Ext. surf.Int. surf.Ext. surf.Int. surf.Ext. surf.Int. surf.Ext. surf.
VGRoomMaxi.33.632.833.534.734.132.833.534.033.838.6
Mini.11.89.611.99.412.89.811.89.412.09.1
Aver.21.720.621.720.722.320.721.620.721.619.9
RefRoomMaxi.38.654.141.463.839.046.039.340.943.268.1
Mini.11.19.111.28.710.99.110.98.910.77.6
Aver.22.722.922.723.122.522.322.622.322.924.0
Table 5. Results of the linear fitting.
DBTRH
p1p2R2p1p2R2
VGrRoom0.79424.6660.92150.749219.280.8822
RefRoom0.98591.3380.91410.93922.4140.8970
Publisher’s Note: MDPI stays neutral with regard to jurisdictional claims in published maps and institutional affiliations.

