Article

Seismic Fragility of a Multi-Frame Box-Girder Bridge Influenced by Seismic Excitation Angles and Column Height Layouts

1
School of Electronic Engineering, Heilongjiang University, Harbin 150080, China
2
School of Civil Engineering, Heilongjiang University, Harbin 150080, China
3
China Academy of Aerospace Standardization and Product Assurance, Beijing 100071, China
4
Liaoning Provincial Transportation Planning & Design Institute Co., Ltd., Shenyang 110166, China
*
Author to whom correspondence should be addressed.
Buildings 2022, 12(3), 387; https://doi.org/10.3390/buildings12030387
Submission received: 3 February 2022 / Revised: 10 March 2022 / Accepted: 14 March 2022 / Published: 21 March 2022
(This article belongs to the Topic Advances in Dynamics of Building Structures)

Abstract

:
Curved multi-frame box-girder bridges with hinges are widely used in the United States due to the large spanning capacity, construction simplification and construction cost economy. This type of bridge frequently has the characteristics of column height asymmetry, adjacent bridge frames vibrating discrepancy. The combination of curved shape and random seismic excitation angles could aggravate the irregularity of the structural seismic response. In this study, an OpenSees model is established for an example bridge, and the hinge is taken as a key component to observe. The impacts of seismic excitation angles and column height layouts on fragility are investigated through the comparison of the fragility curves. The conclusions list the most unfavorable seismic excitation angles corresponding to the fragilities of bridge system, plug-type concrete elements in hinges, hinge restrainers, columns, abutment bearings as well as the secondary components, respectively. The symmetrical column height layout is proved to be beneficial to mitigate the damage risks of restrainers in intermediate hinges and reduce the fragility of the bridge system. This study can provide a reference for the rapid assessment of the fragile position and damage degree of bridges through structural configuration and shape, as well as the seismic excitation angle.

1. Introduction

A multi-frame box-girder bridge is a prevalent type of bridge in both the urban overpass system and highway system around the United States because of advantages such as low construction cost, proven construction technique, simple maintenance, little adverse effect on the structure caused by concrete shrinkage and creep, as well as prestressed tension, and high structural stability [1]. Generally, multi-frame box-girder bridges have a large span capacity and high columns, while the columns are consolidated with the girders [2]. Considering the traffic demand, this type of bridge was often designed to curve [3]. In order to cross irregular valleys or rivers, the column height layouts were often asymmetrical [4]. The combination of these structural characteristics increases the complexity of this type of bridge, especially on the seismic dynamic calculation.
The hinges in the span have the function of transferring shearing force, reducing bending moment and connecting two adjacent frames to vibrate. The hinge has a complicated structural form, which is similar to a plug type or an insert type, shown in Figure 1a. Considering construction demand, the local concrete cross-sections in the hinge reduce, which causes the cross-section stiffness above is less than the standard girder cross- section. However, due to transferring the shearing force, the local reducing cross sections have to withstand the large vertical reaction force from elastomeric bearings in the hinge, which could cause bending failure, as proved by Wu and Sun [5]. Meanwhile, a host of limiting devices in hinges, which increase the complexity of their dynamic response, were installed vertically, transversely and longitudinally to limit the collisions, transfer the internal forces and alleviate the internal forces.
Seismic fragility analysis can evaluate the damage failure probabilities of local and overall structure under seismic loads. It has become an effective method for seismic damage prediction and is extensively used in the pre-earthquake assessment and post-earthquake reconstruction in nuclear power plants [6,7], dams [8,9,10], bridges [11,12,13], tunnels [14,15], roads [16,17], buildings [18,19,20] and other structures [21,22]. Meanwhile, fragility analysis is a key link to establish the resilient city because it can develop capability curves of disaster prevention and mitigation for the same type of structure.
Fragility analysis can unify the uncertainty of seismic loads and the uncertainty of structural parameters through a probability statistics approach, but only the intensity measures (IM) of seismic loads are fitted into the probabilistic seismic demand model, the directivities of seismic loads are rarely considered separately. Particularly on complicated types of bridges, because of the complexity, the structural asymmetry and the reaction of various limiting devices, the influence of different seismic excitation angles on the structural damage is uncatchable. For curved bridges, the inherent coupling effect of curve bending and torsion increases the uncertainty and the asymmetry of the bridges, which makes the seismic fragilities of curved bridges more complex than that of straight bridges, and more sensitive to the impact of seismic excitation angles.
In order to accommodate the slope of the riverbed and the topography of the riverbank, the heights of columns were often designed to be unequal, which increases the randomness of vibration in the bridge. Nevertheless, previous studies of fragility analysis paid attention to bridges having the same column heights in order to obtain the regular conclusion, which reduced the complexity of bridge structure to a certain extent [23]. By reason of nonlinear behavior of the columns considerably affecting dynamic performance of the whole bridge [24,25,26], the fragilities toward bridges having unequal column heights need to be further assessed.
In the study of Yang et al. [27], the seismic excitation angle was taken as a random parameter to participate in the fragility analyses of skewed bridges. This type of analysis method is beneficial to the output of fragility results, but it is not helpful to develop the relationship between the bridge damages and the seismic excitation angles.
The geometric parameter sensitivity analyses of two curved multi-frame concrete box girder bridges with in-span hinges in California were performed by Jeon et al. [28]. The effect of geometric parameters on bridge fragility curves was subsequently obtained through variations in curved curvatures, abutment skew angles, and column heights. In this study, the impact of seismic excitation angles on the curved bridge fragilities had not been paid attention to. In the dynamic calculation, the longitudinal and transverse seismic ground motions were input respectively in the global coordinate system.
Jeon et al. [3] used the Bayesian parameter estimation method to develop the fragility assessment of the curved multi-frame concrete box-girder bridges. The fragility analysis method was excellently modified. Meanwhile, the excitation angle of seismic ground motion was not considered as a determined parameter during the assessment, and the elaborate hinge simulation still needed to be improved.
A new seismic isolation system proposed from the study of Furinghetti et al. [29,30] can greatly help bridges in reducing damage and optimize bridge vibrational systems, while lowering bridge fragility.
Pahlavan et al. [31] presented the influence of retrofitting strategies on the seismic response of the curved multi-frame RC box-girder bridges under different damage states through fragility analysis. However, in this study, the elastic modeling of a girder may cause the omission of the potential damage of the hinge structure.
Mehr and Zaghi [32] compared the seismic response between multi-frame bridges and single-frame bridges, and developed the seismic demands on the column, abutment and hinge. The impacts of the number of frames, substructure system, unequal column height, soil type, ground motion intensity, and capacity-to-demand ratio on the seismic response of the bridge were investigated. During the modeling process, elastic elements were used to simulate the hinge, which could enhance the inaccuracy of the hinge response, giving rise to ignore the potential damage in this position.
Aboutorabian et al. [33] investigated how in-span hinges impacted the seismic response of irregular multi-frame reinforced concrete bridges, different classes of multi-frame bridges and single-frame bridges were considered, the adjacent frame lateral stiffness ratio (AFSR) was defined to obtain the optimal position of in-span hinges. The study focused on the impact of hinge position on the seismic response of columns and the unseating of bridges. However, the impact on hinge response generated by seismic ground motion in different excitation angles has not been mentioned.
To sum up, taking seismic excitation angles as a single nonrandom variable involved in bridge fragility analysis has not been widely addressed, and the relationship between seismic excitation angles and curved bridge fragilities also needs further investigation. Moreover, the elastic elements were always used to simulate the hinges, which gave rise to the neglect of the potential nonlinear seismic damage in hinges. During the affecting analysis of geometric parameters, the column heights were often set as the same, which could underestimate the uncertainty and irregularity of the structure.
In this study, a nonlinear dynamic model of a curved multi-frame box-girder bridge with hinges is established and the refined simulation of the hinge is focused on. Through a considerable amount of time history analyses, the seismic fragility curves are developed. Moreover, through changing seismic excitation angles, a variation rule of fragility correlated with seismic excitation angles is presented. Thus, the most vulnerable position and the damage state of the bridge could be evaluated immediately and accurately as long as the seismic excitation angle is monitored. Furthermore, through establishing a contrastive model with a symmetric column height layout, the influence of column height layouts on the failure exceedance probability of the bridge is obtained. The conclusion indicates that the bridge system exhibits the least seismic failure probability at the excitation angle of 30 degrees, and the largest at the excitation angle of 90 degrees. The symmetric column height layout is beneficial to reduce fragility.

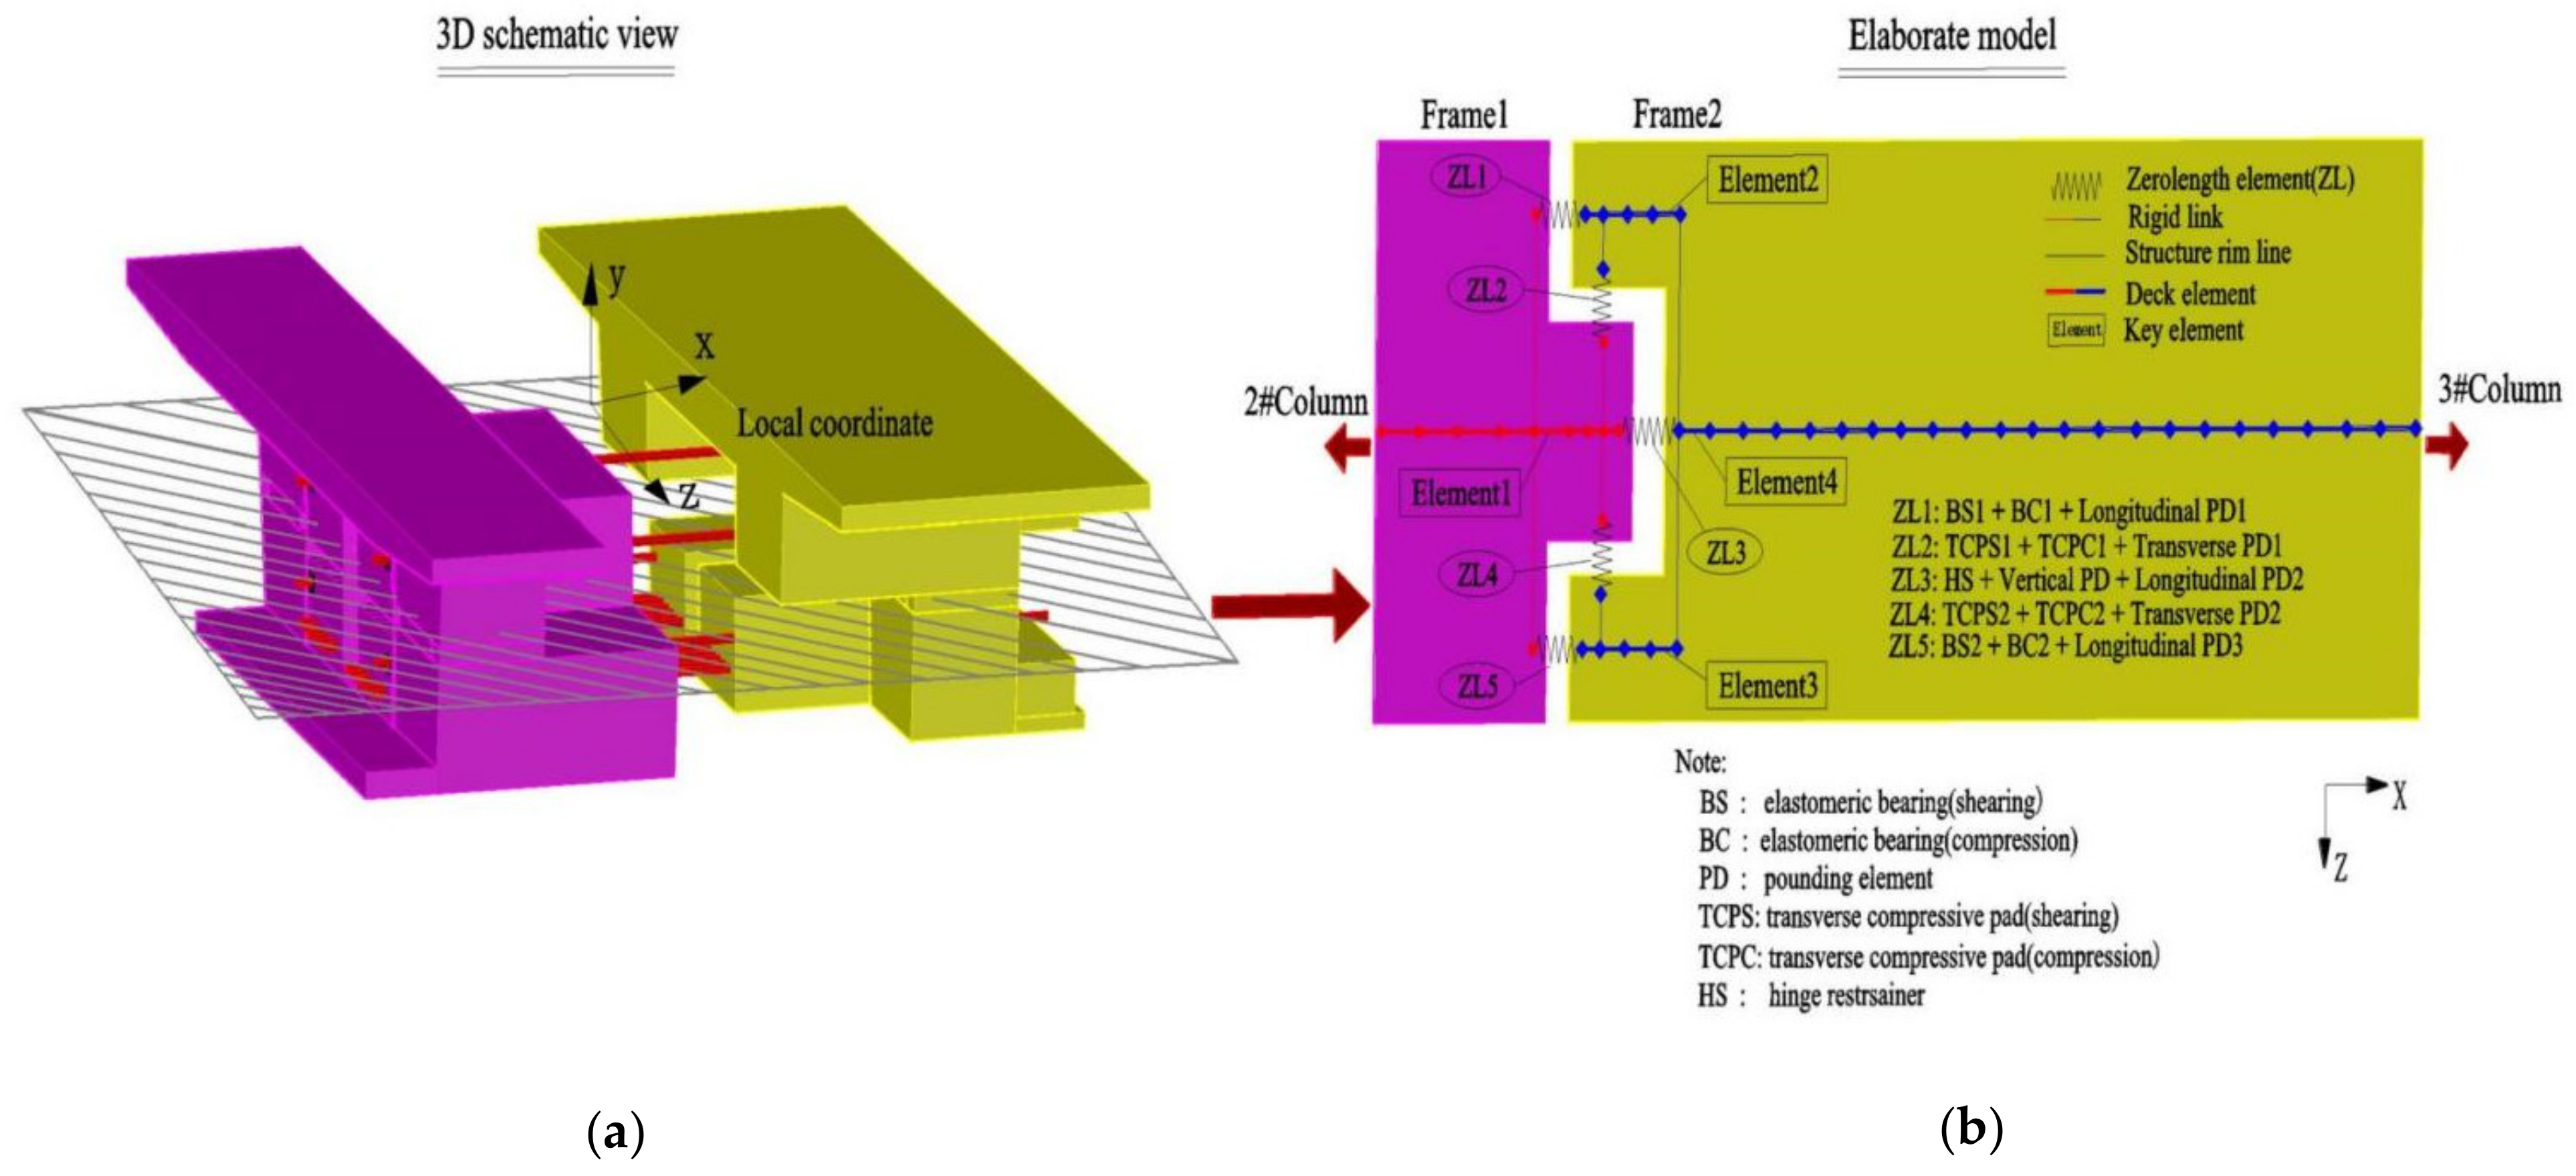
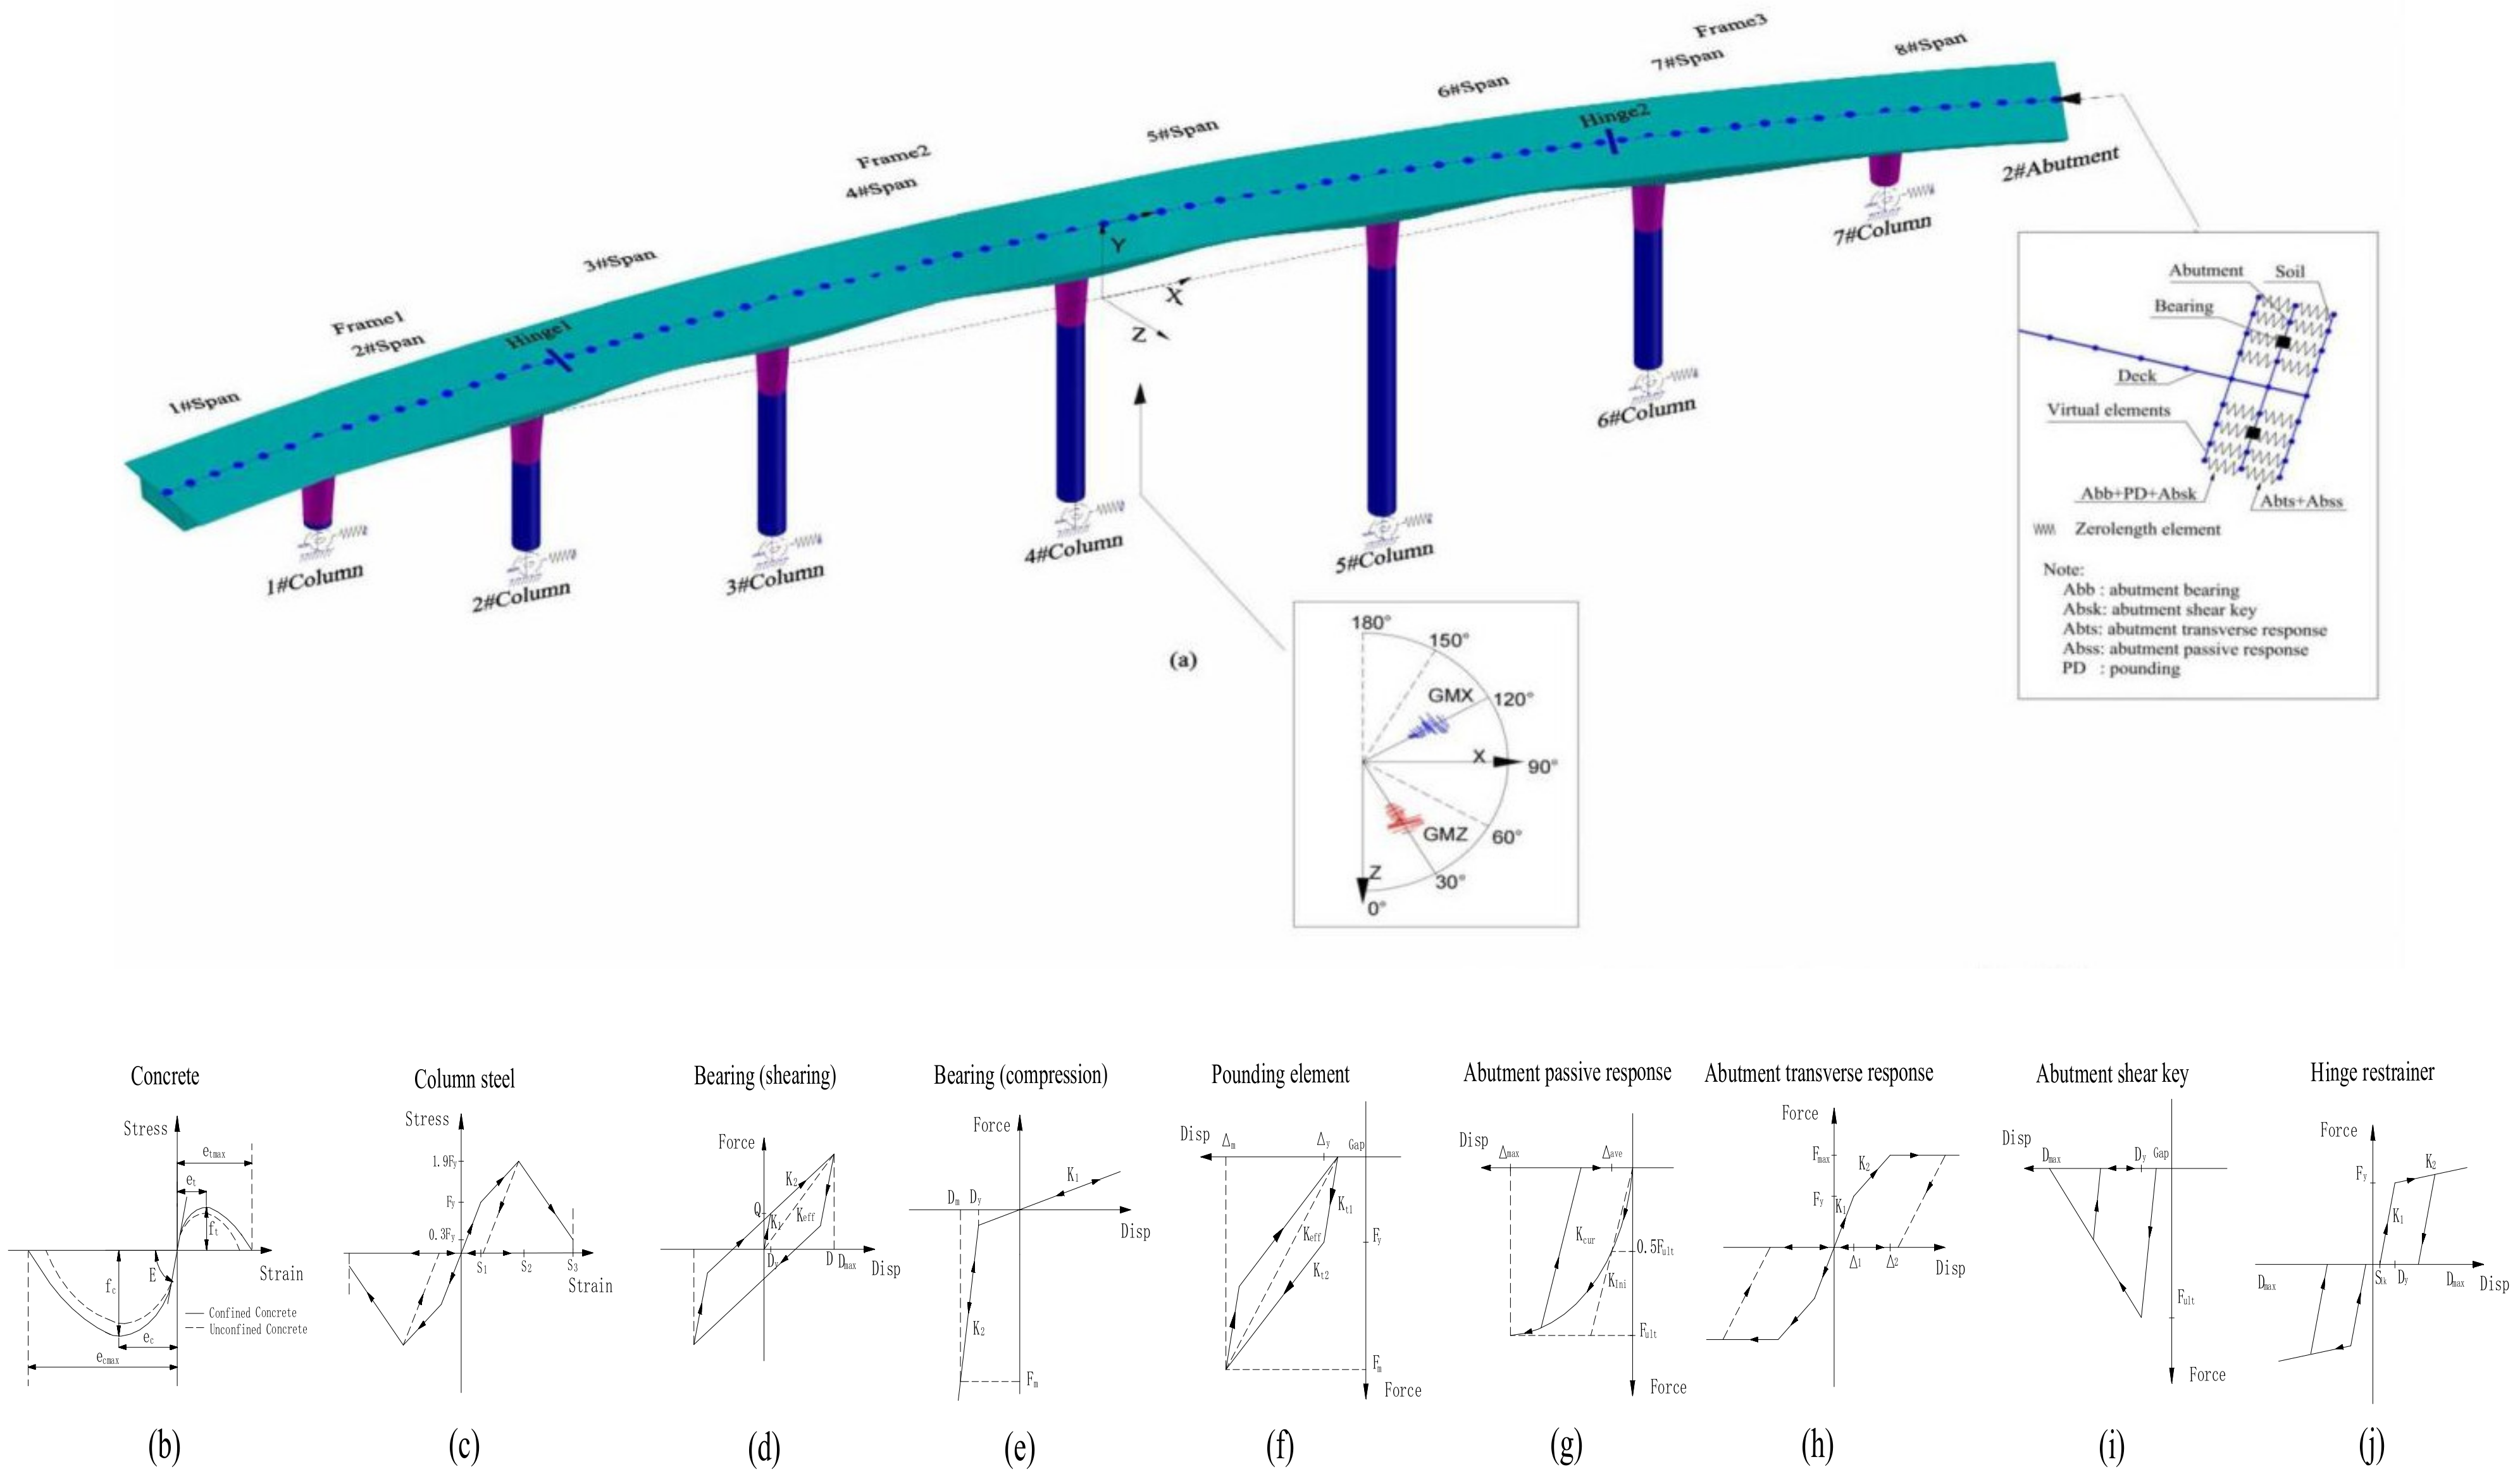
2. Description and Modeling of the Example Bridge

The example bridge, located in the western United States, has a total length of 542 m and a span combination of 49 m + 64 m + 4 × 79 m + 64 m + 49 m. The single cell box girder used a variable cross-section with heights changing from 2.6 m at the midspan to 3.8 m at the supporting point through the parabola. The pre-stress was loaded during the girder construction. Taking account of the road alignment, the bridge was designed as a curved shape with a radius of 914 m and a center angle of 34°.
Due to the terrain demand, seven columns, adopting a circular cross section with the diameter of 3.05 m, were asymmetrically designed, while the heights of columns are 12 m, 23 m, 28 m, 34 m, 43 m, 27 m, 8.5 m, respectively. The girder and seven columns were consolidated together, while two hinges were designed and constructed in the 3# span and 6# span to release the degree of freedom. Each seat type abutment has a rectangular shallow footing underneath [34], two exterior shear keys on both sides and two elastomeric bearings supporting the girder. The girder, prestressing tendons, hinges, columns, abutments of the example bridge are simulated elaborately through the OpenSees platform. The detailed configurations and simulation of the bridge are provided in the study of Wu et al. [35].
Concrete 07, illustrated in Figure 2b, developed by Chang and Mander [36] is used to simulate the confined and unconfined concrete material, not only for columns, but also for the girder and hinges. The parameters of a hysteretic material are extracted through matching the experiment of a column, Lehman 415S [37] by pushover and the final hysteretic material is used to represent the steel material in columns, indicated in Figure 2c. Steel02 material in OpenSees is selected to simulate the material of prestressed reinforcement which could consider the initial stress value of tendons. A displacement-based beam-column element is used to simulate the elements of columns, girders and hinges. Although the fiber elements enlarge the amount of calculation, it could obtain more precise seismic response in hinges. The shearing response of elastomeric bearings located at abutments and hinges is simulated by Muthukumar’s proposed model [38], illustrated in Figure 2d. The compression of elastomeric bearings and elastomeric pads in hinges are simulated referring to the experimental report, “Nonlinear Finite Element Analysis of Elastomers” [39], see Figure 2e. The bilinear model for pounding between gaps is proposed by Muthukumar [38] and DesRoches et al. [40], listed in Figure 2f. The components in abutments, including passive performance, shallow footing transverse response and shear keys, are simulated referring to the studies of Shamsabadi et al. [41], Gadre and Dobry [42] and Megally et al. [43,44] separately. Component models have been illustrated in Figure 2g–i separately. The restrainers in hinges, which having an initial slack between cables, are simulated according to the study of Ramanathan [34], shown in Figure 2j.
The finite element model of the entire bridge and the local hinge model are illustrated in Figure 1b and Figure 2a separately, where the limiting devices in the hinges, including longitudinal restrainers, transverse compression pads and vertical bearings, and pounding elements, are all simulated. In addition, elastic-plastic simulation of element 1–4 of hinge is focused on, because the potential seismic damage could happen at the root of element 2 and element 3, proven in Wu and Sun’s study [5].

3. Fragility Analysis Methodology and Functions

3.1. Component Fragility and the Probabilistic Seismic Demand Model (PSDM)

The methodology of fragility analysis is based on the method of structural seismic disaster risk assessment proposed by Nielson et al. [45] and Abbasi et al. [46]. The core of this methodology is to obtain the probabilities of the structural seismic response exceeding the presupposed damage states under the seismic loads having different intensity measures (IM) through probability statistics. The structural seismic response, called the seismic demand, can be obtained through the suite of nonlinear time history analyses that applies a series of seismic loads to the structural model. The presupposed damage states, called the seismic capacity, can be summarized by experimental data and empirical data. During probability analyses, both seismic demand and seismic capacity are assumed to follow log-normal distribution [27,34], meanwhile peak ground acceleration (PGA) was chosen as the IM of ground motions in this study [17,27,47]. The fragilities of structural components can be obtained by Equation (1).
P [ D E D P > L s | P G A ] = Φ ln ( S D / S L s ) β D | P G A 2 + β L s 2 .
In Equation (1), DEDP and Ls represent the seismic demand and seismic capacity respectively, SD and SLS represent the median value of the seismic demand and seismic capacity, βD|PGA and βLs represent the logarithmic standard deviation of the seismic demand and seismic capacity. Φ[.] is representative of the standard normal cumulative distribution function.
The relationship between the seismic demand and seismic intensity measures (PGA) results from a linear regression analysis under the log-normal transformation space, like Equation (2), where a and b are regression coefficients. βD|PGA is derived through Equation (3), where Di represents the maximum seismic response of the component during ith linear time history analysis, N represents the analysis number.
S D = a ( P G A ) b
β D | P G A 1 N 2 i = 1 N [ ln ( D i ) ln ( S D ) ] 2
To sum up, the fragility of any structural component can be calculated through transforming from the standard normal cumulative distribution function of seismic demand and seismic capacity to a probability distribution function of IM, expressed as probabilistic seismic demand model (PSDM).

3.2. System Fragility, the Joint Probabilistic Seismic Demand Model (JPSDM), Monte Carlo Simulation

After determining the component fragilities, the structural system fragility can be developed by the joint probabilistic seismic demand Model (JPSDM) [28,45,46], taking account of a certain correlation between the seismic demands of different components under seismic loads, addressed below.
It is assumed that P = (P1, P2, P3,…,Pn) represents the seismic demand vectors, Pi, corresponding to the ith component, while the vector, Q = ln(P) represents the seismic demand vector of the component under the lognormal transformation space. The transformed demand vector Qi obeys normal distribution because of the demand vector Pi obeying lognormal distribution. The vector of means μQ and the covariance matrix σQ are incorporated to formulate the JPDM in the transformation space.
Through the result of the nonlinear time history analyses, the correlation coefficients between the component demands are obtained and then correlation matrix is developed. Subsequently, Monte Carlo simulation is introduced to calculate the exceedance probabilities of limit states for components through comparing the JPSDM and the component capacity (also called limit state models) [48,49]. The form of assembling the median value and dispersion value is used to define the structural system fragility according to regression analysis. The process above is repeated corresponding to the different levels of IM in different limit states, so the failure probabilities of the structural system corresponding to different levels of IM in different limit states can be developed. More detailed derivation process of system fragility can be obtained in the references below [50,51].

3.3. Limit State Models

A limit state model is a comparative benchmark for determining the seismic failure exceedance probability during fragility analysis. In order to determine the values of limit states as accurately as possible, a large number of experimental data comparisons and criterion selections are needed. The primary components, including columns, abutment bearings, hinge restrainers, element 2, 3 at the root of hinges and the secondary components, including abutment passive performance, abutment transverse response, abutment shear keys, as well as the corresponding limit state median values and dispersion values, are screened out and listed in Table 1, proposed by Wu et al. [35].
It is worth noting that the limit state indexes of hinge element 2 and element 3, shown in Figure 1b, are represented by curvature ductility on account of the potential seismic damage and the median values of the indexes are determined by moment-curvature analysis using Xtract finite element software, built by University of California, Berkeley, which used to be called Ucfyber [52]. Curvature ductility in local coordinate Z and local coordinate Y are abbreviated as HmcZ and HmcY, respectively.

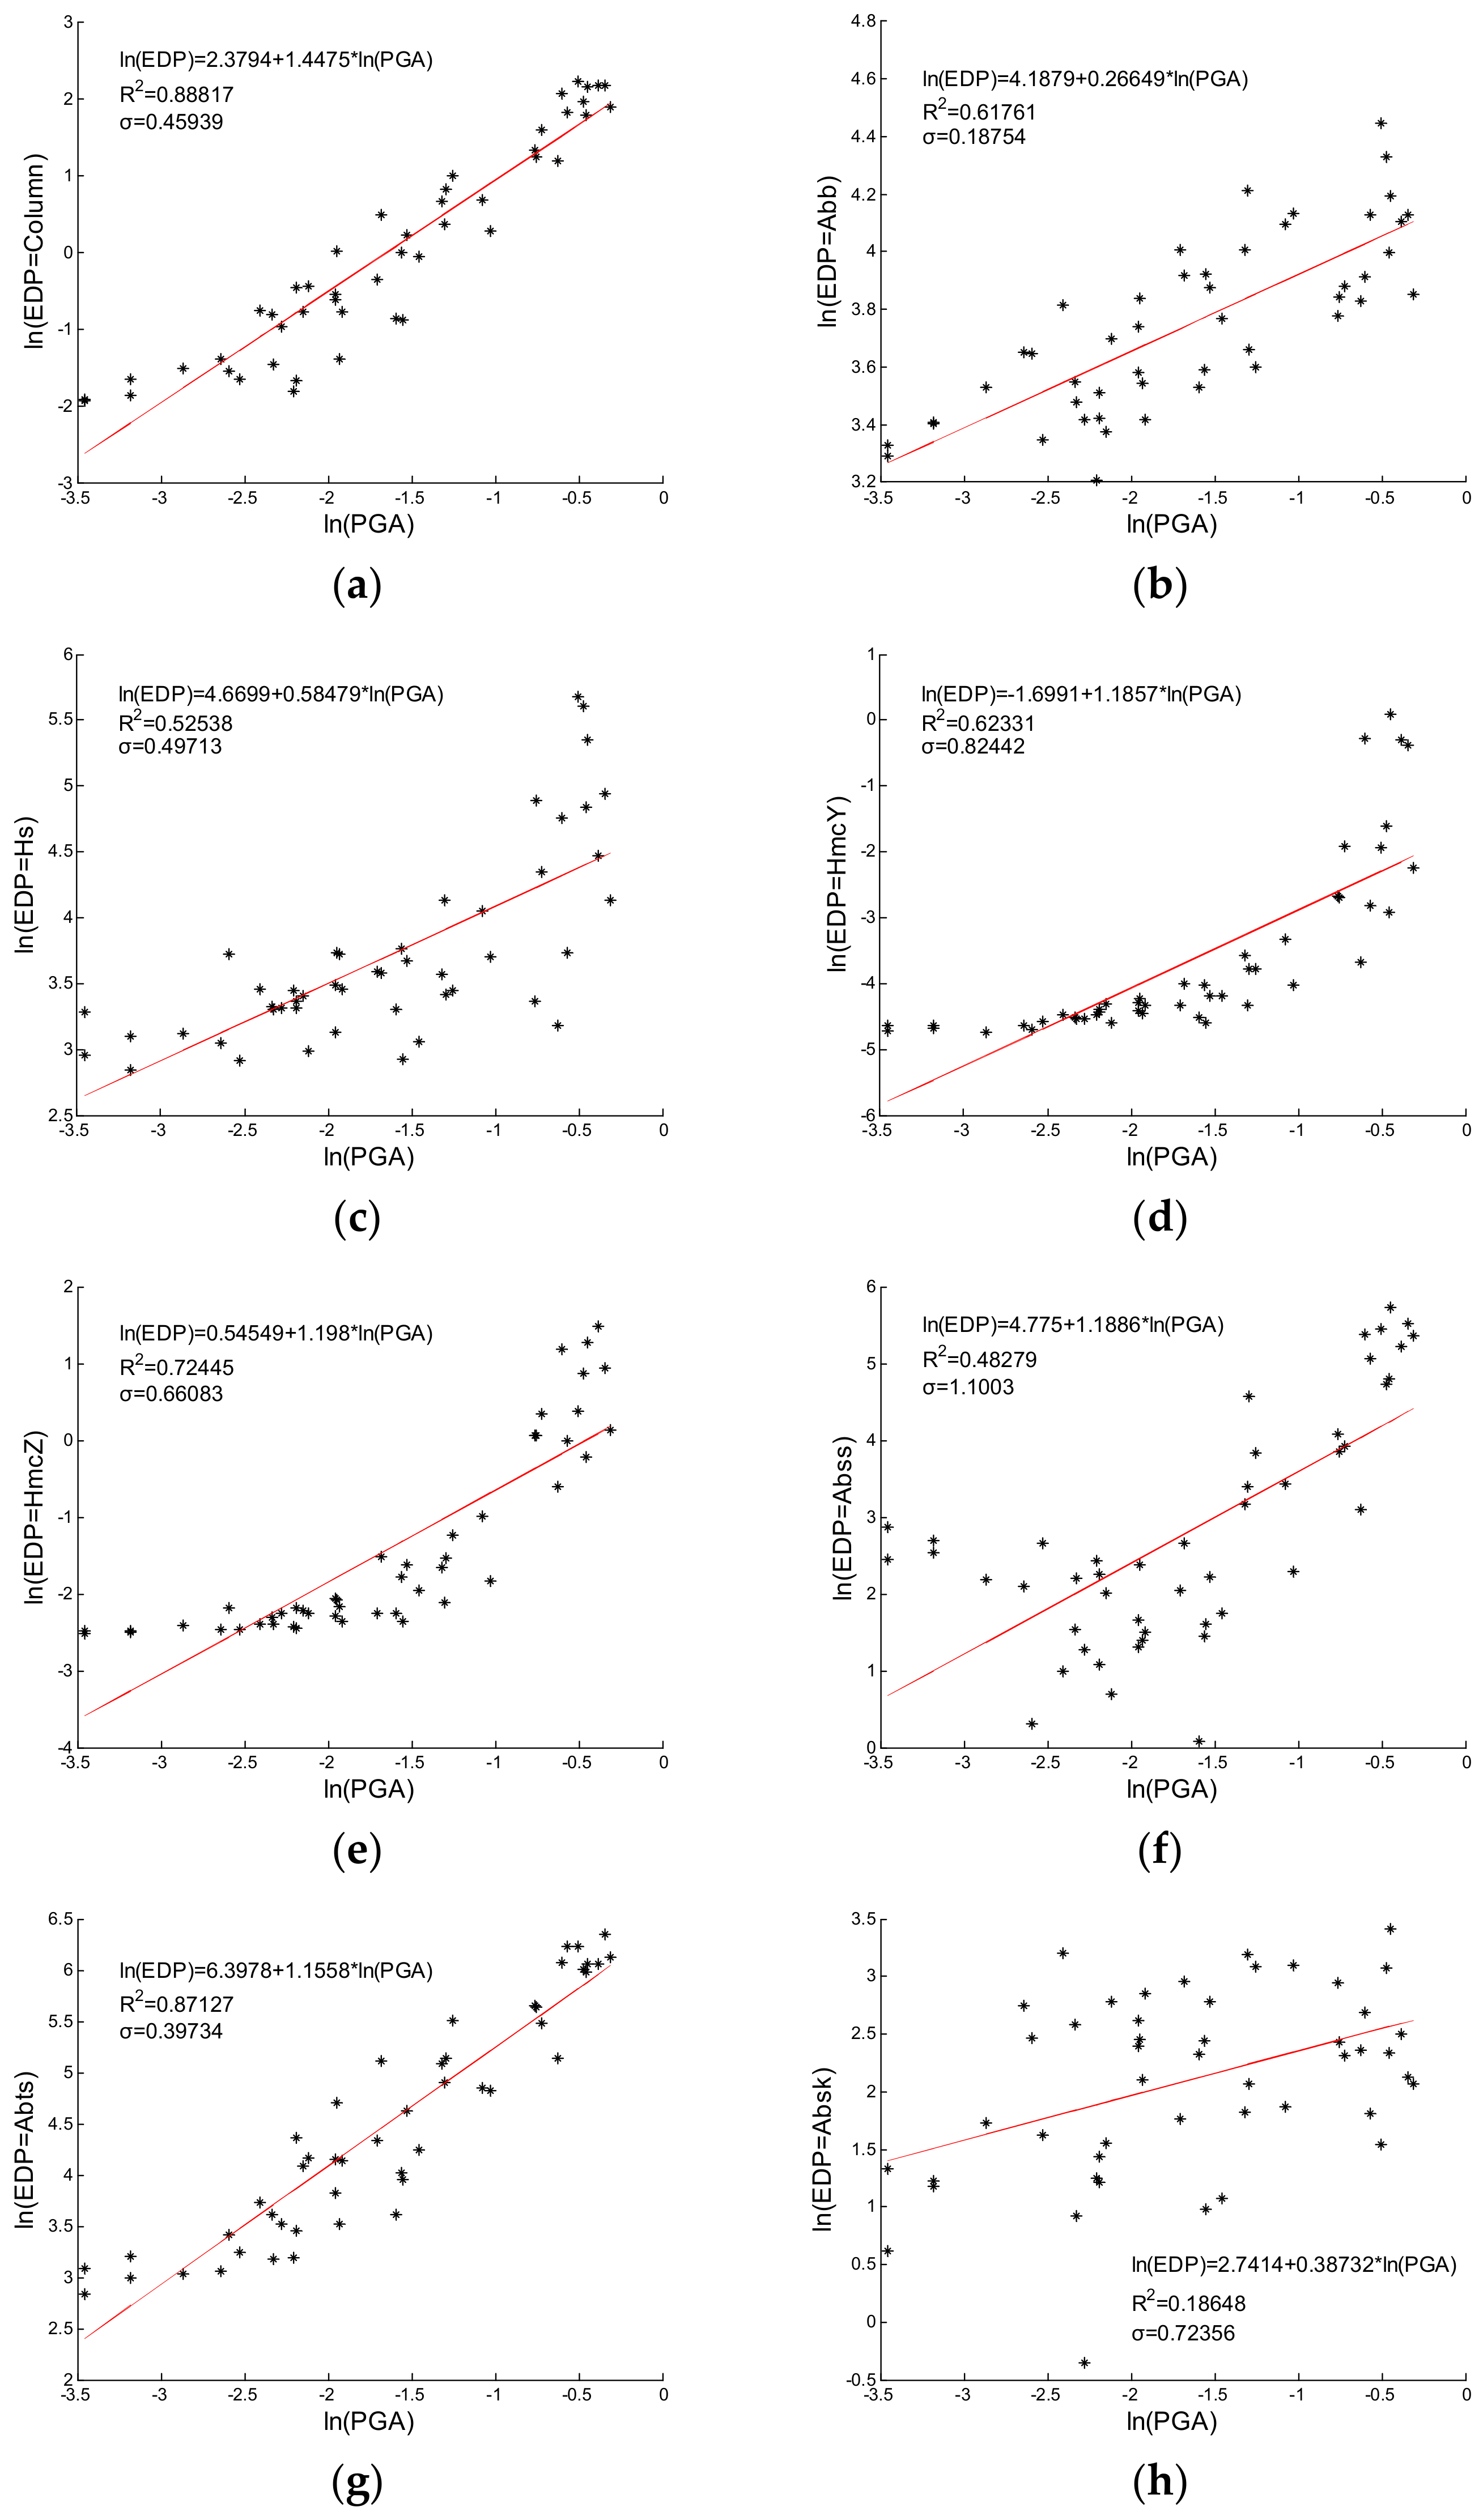
4. Regression Analyses for Seismic Demands

A suite of 48 artificial ground motions [53,54], was selected to be the dynamic loads during fragility analyses. Figure 3 shows the histogram of PGAs for the suit of ground motions. Nonlinear time-history analysis of the bridge model was performed subjected to each ground motion, and the probabilistic seismic demand parameters, including regression coefficients a and b, dispersion σ, regression accuracy coefficient R2, illustrated in Table 2, can be acquired through regression analyses. Regression analysis diagrams of eight components are illustrated in Figure 4.
The higher R2 value signifies the stronger linear relationship and the lower dispersion between the variables of interest [23]. Consequently, obviously seen in Table 2, the linear relationships between the engineering demand parameter (EDP) of components including Column, Abb, HmcY, HmcZ, Abts and the ground motion intensity PGA in logarithmic space are strong, and the dispersion are low. The minimum R2 value corresponding to the component of Absk, with the value of 0.187, is acceptable compared with the minimum R2 value of 0.18 from the study of DesRoches et al. [55].

5. Fragility Analyses of the Bridge Subjected to Different Excitation Angles

Before the earthquake, the seismic excitation angle is frequently random and unpredictable, whereas the angle above can be monitored through a seismic monitoring system after the earthquake. As a matter of course, the most vulnerable parts, and the overall damage state of the bridge, can be assessed immediately through seismic monitoring data on the condition that the relationship between seismic fragilities and excitation angles can be established, and the most unfavorable excitation angles can be acquired. In order to obtain the above relationship and the most unfavorable excitation angles, the seismic loads, having the excitation angles ranging from 0 to 180 degrees as the interval of 30 degrees, are applied to the bridge model, shown in Figure 2a. Subsequently, 48-time history analyses are performed under every excitation angle, and a total of 336 analyses are performed under seven excitation angles. The fragility curves for components and the bridge system are shown in Figure 5, Figure 6, Figure 7, Figure 8, Figure 9, Figure 10, Figure 11, Figure 12 and Figure 13. For the sake of enhancing stereo perception, the three-dimensional fragility surfaces, used to describe the relationships between seismic excitation angles and fragility curves, are illustrated in Appendix A.

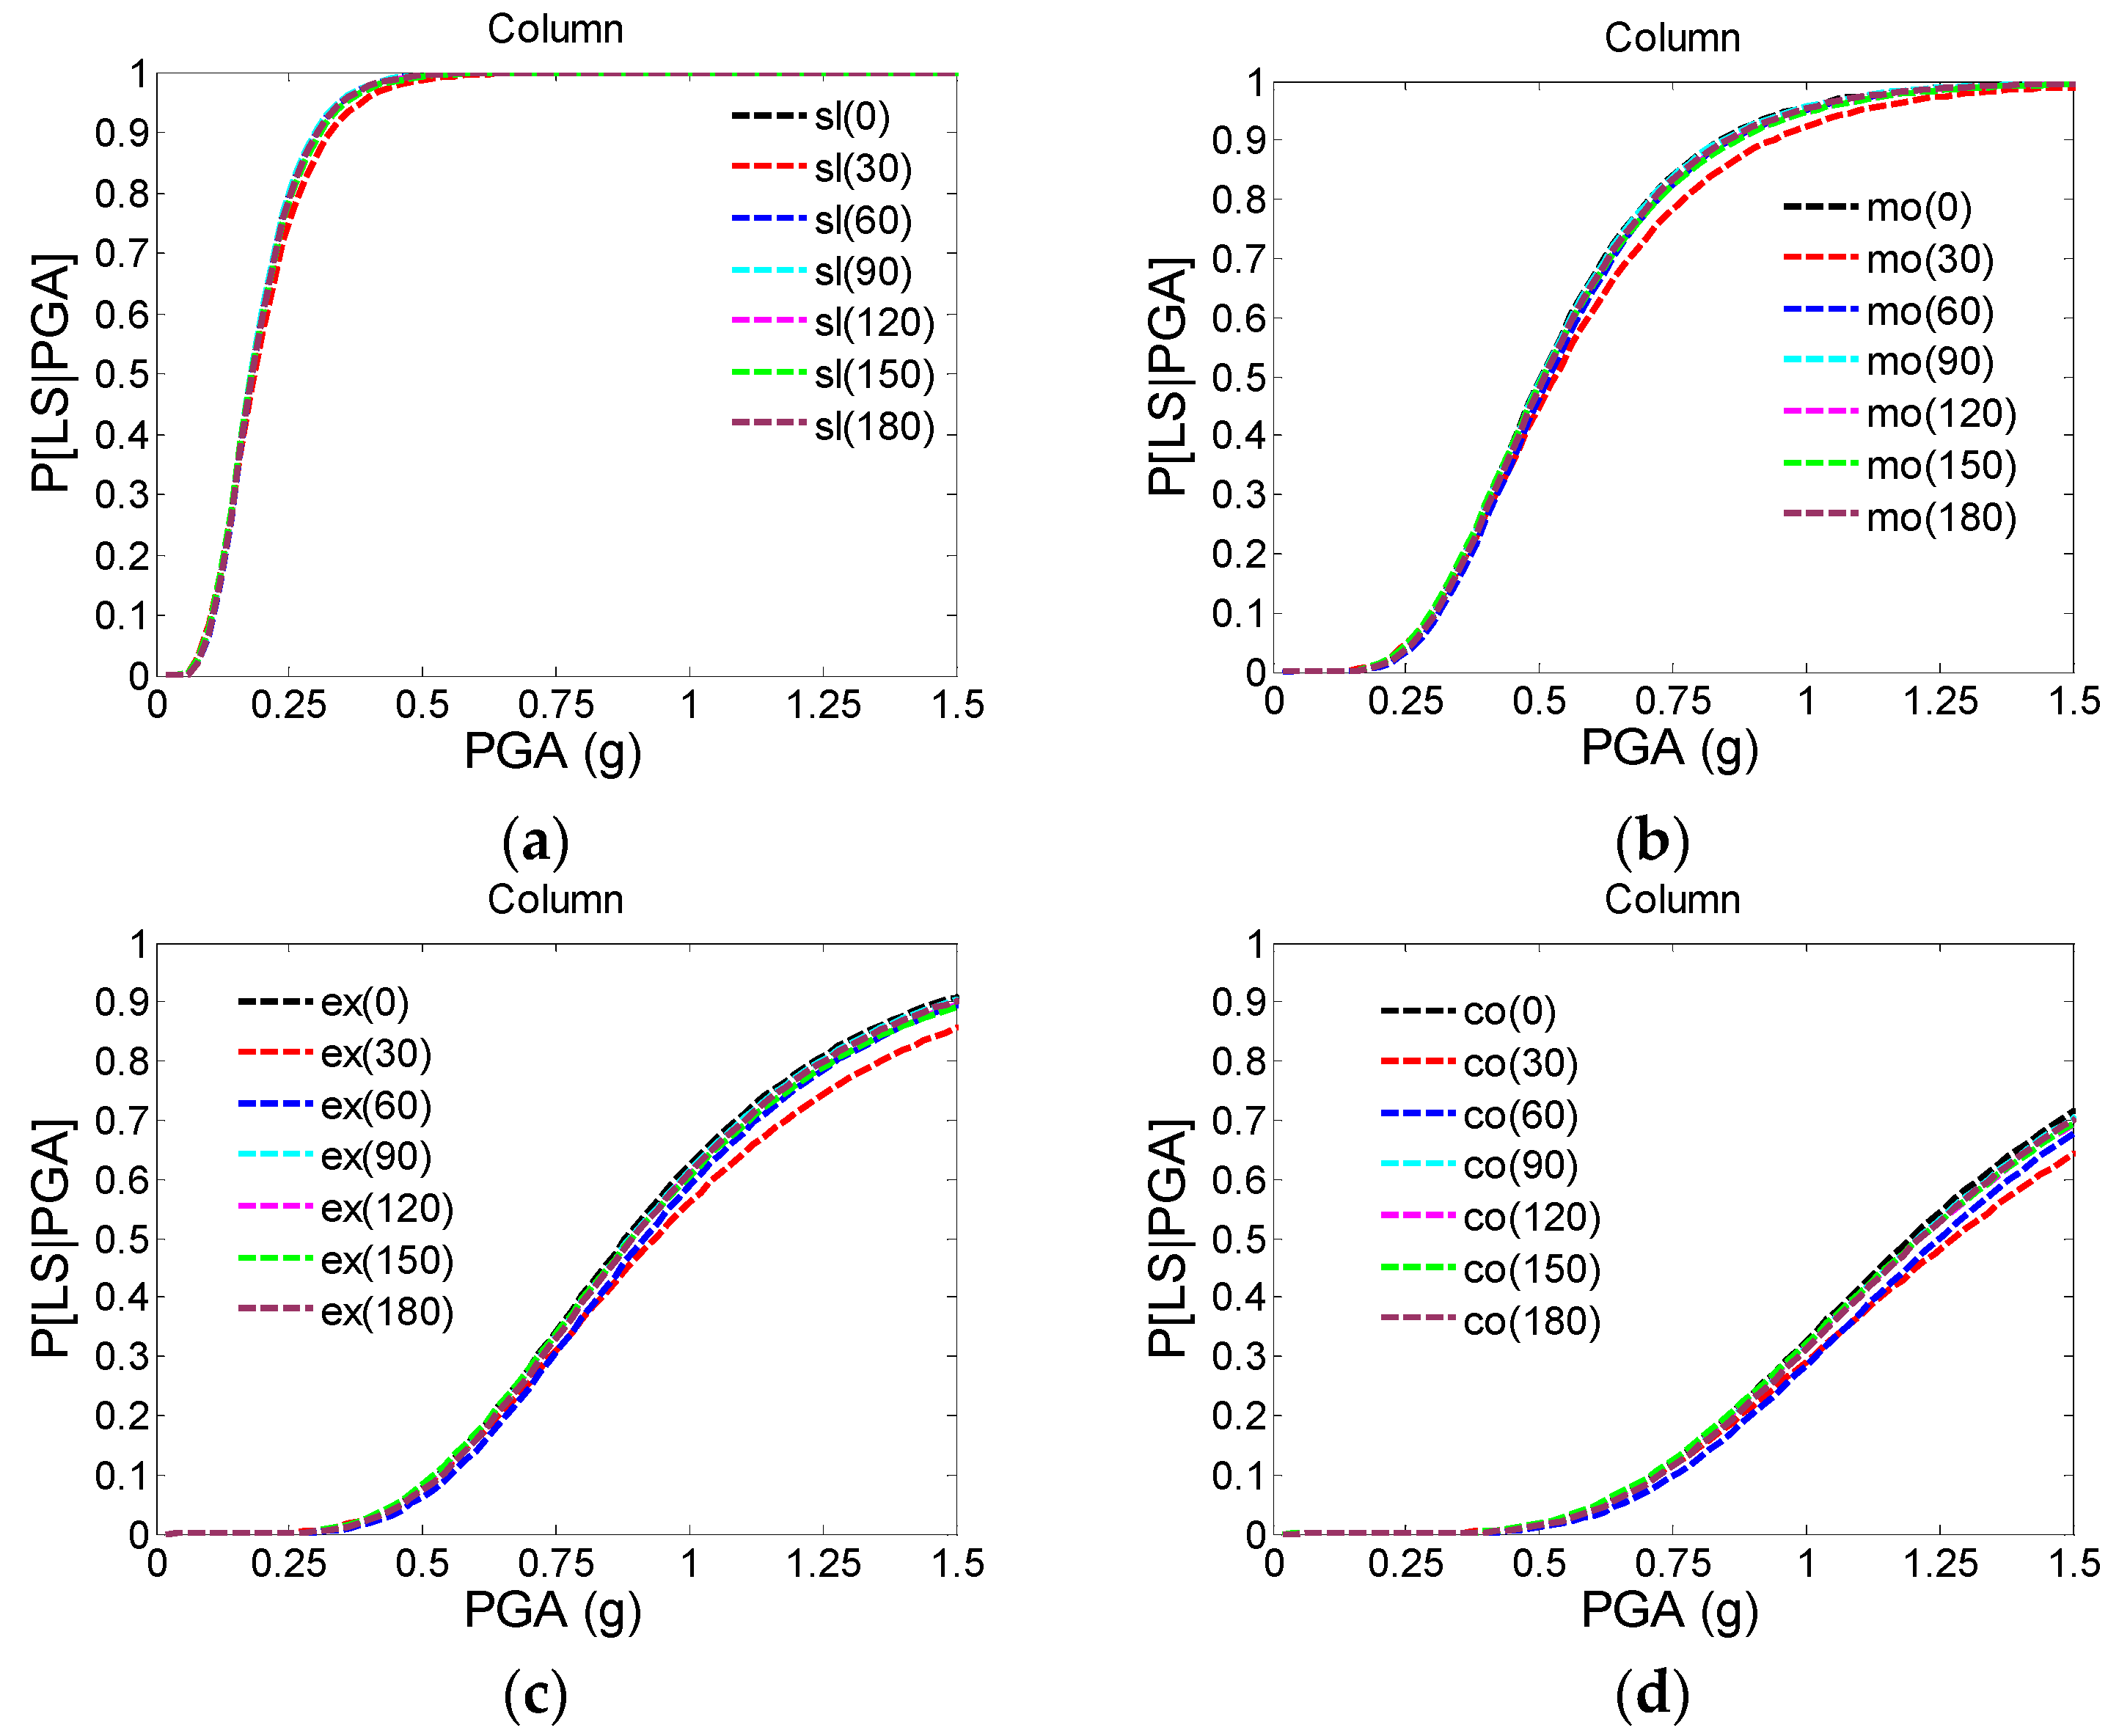
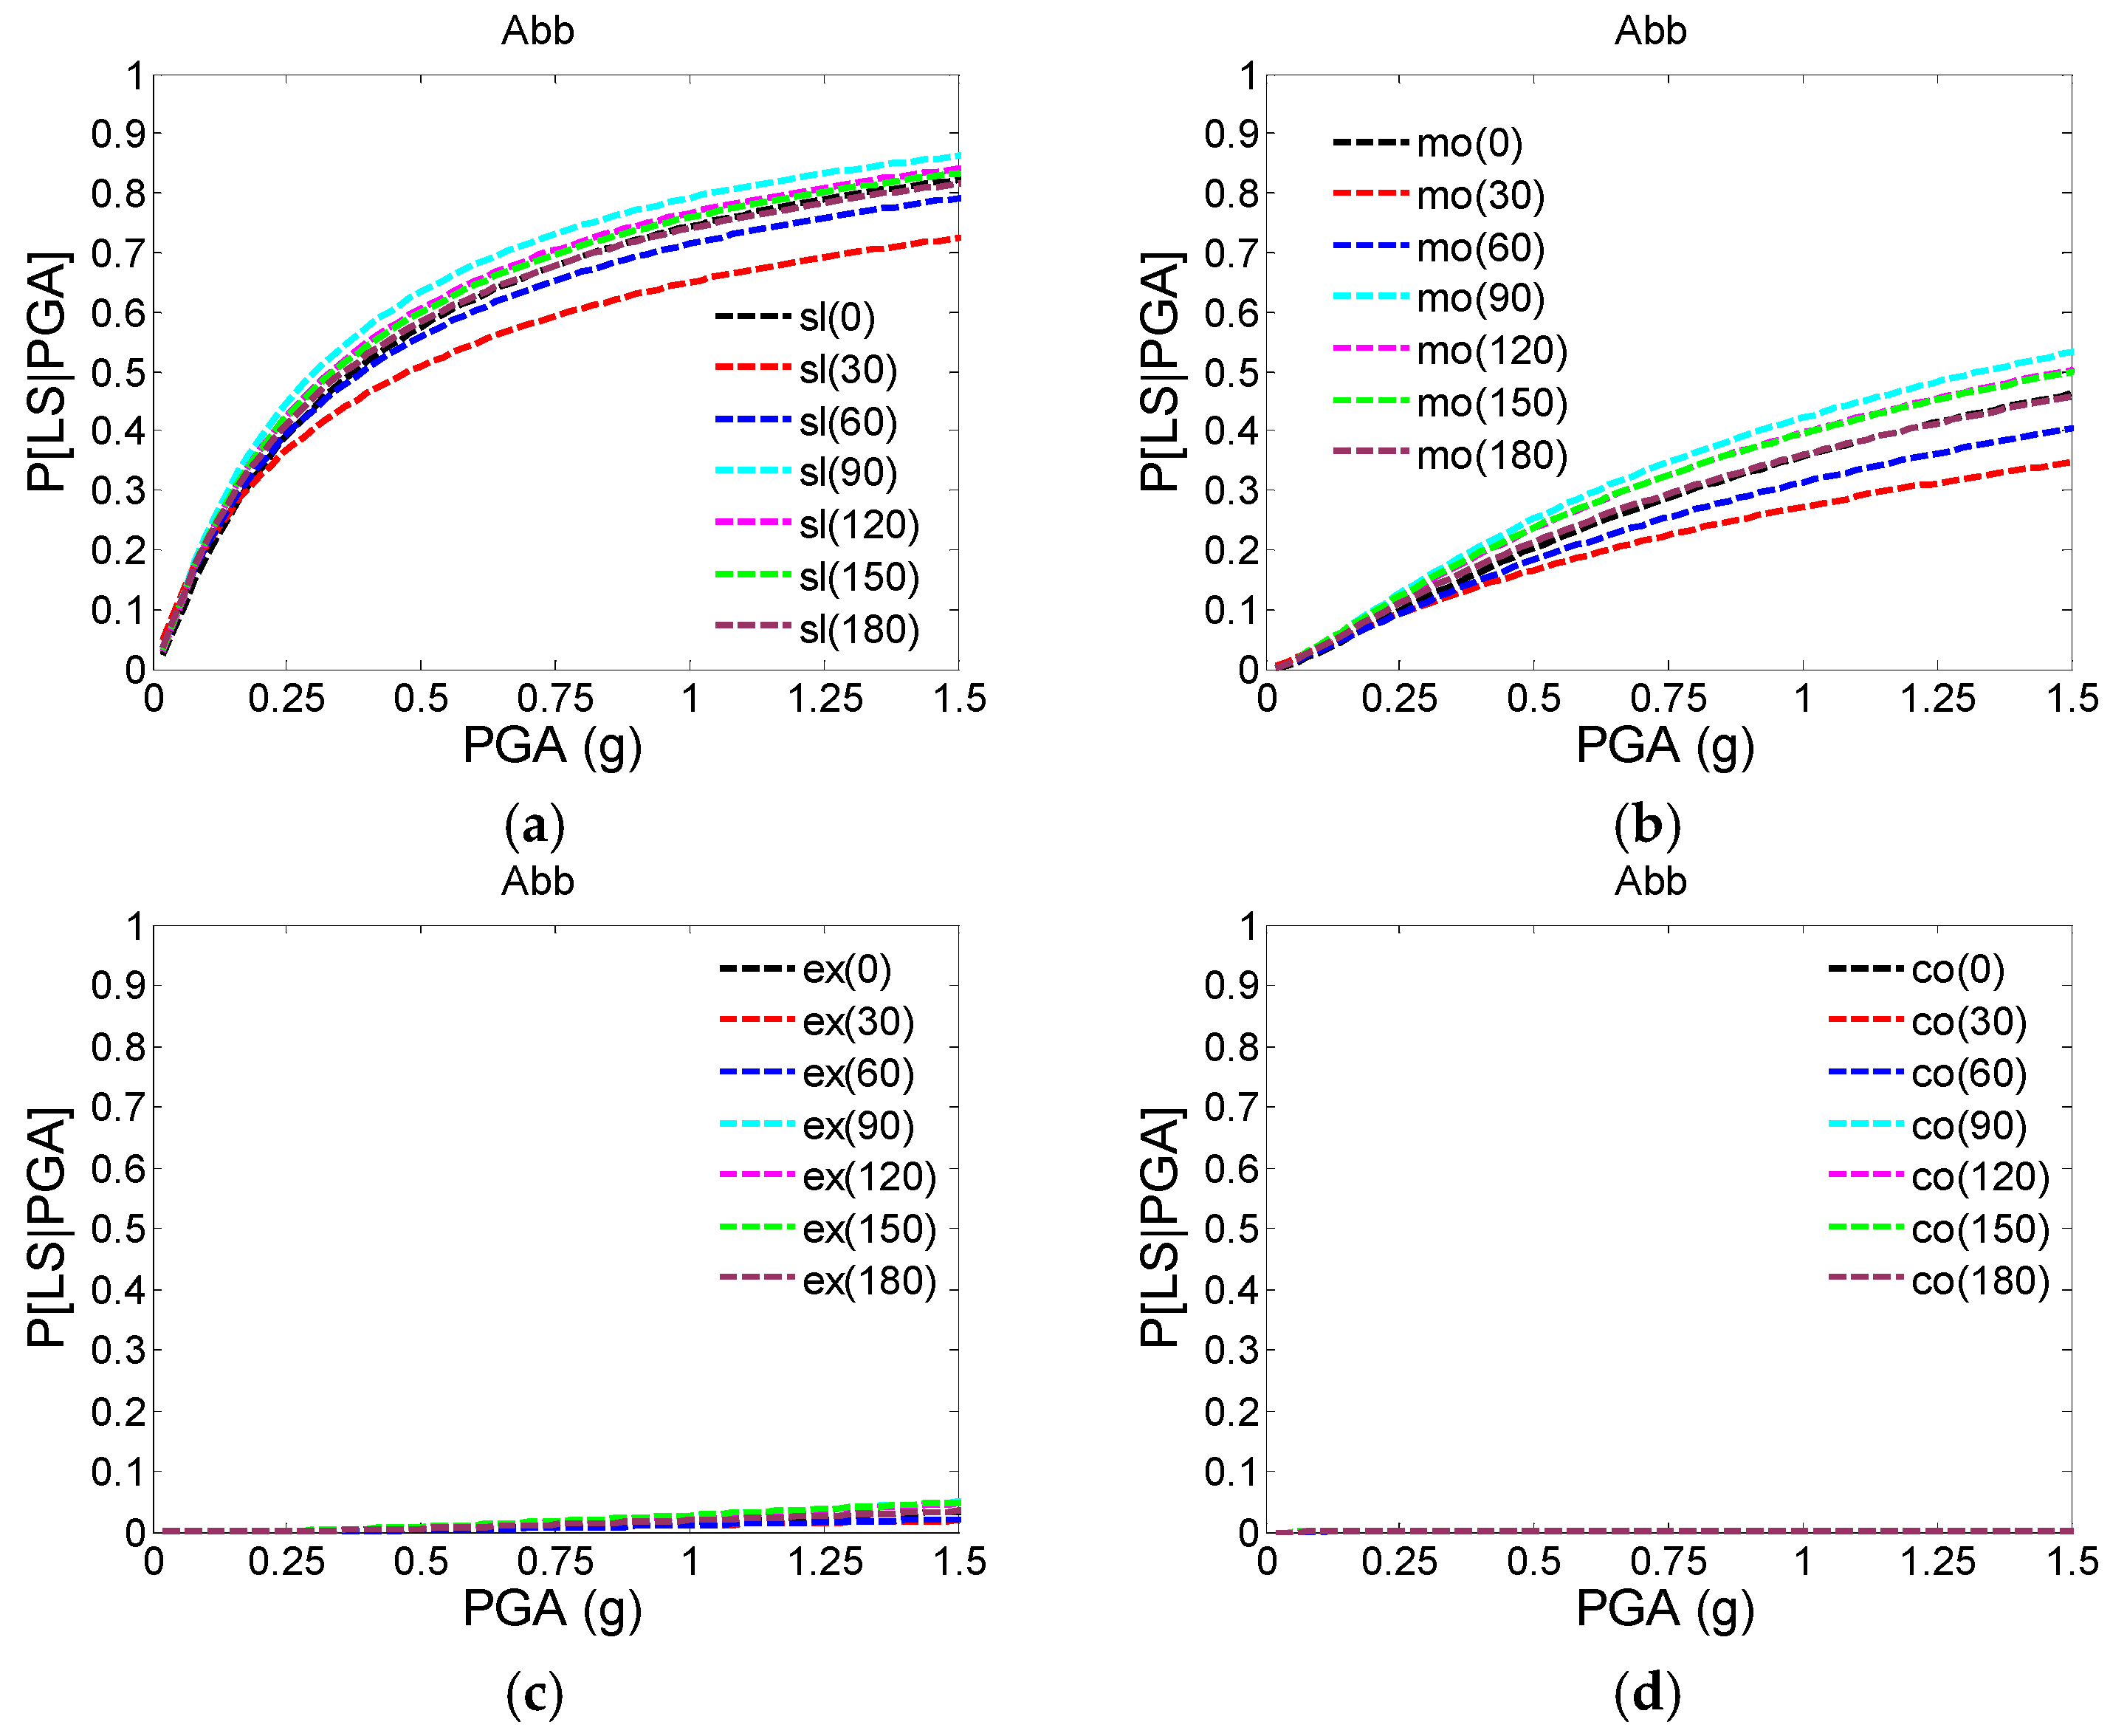
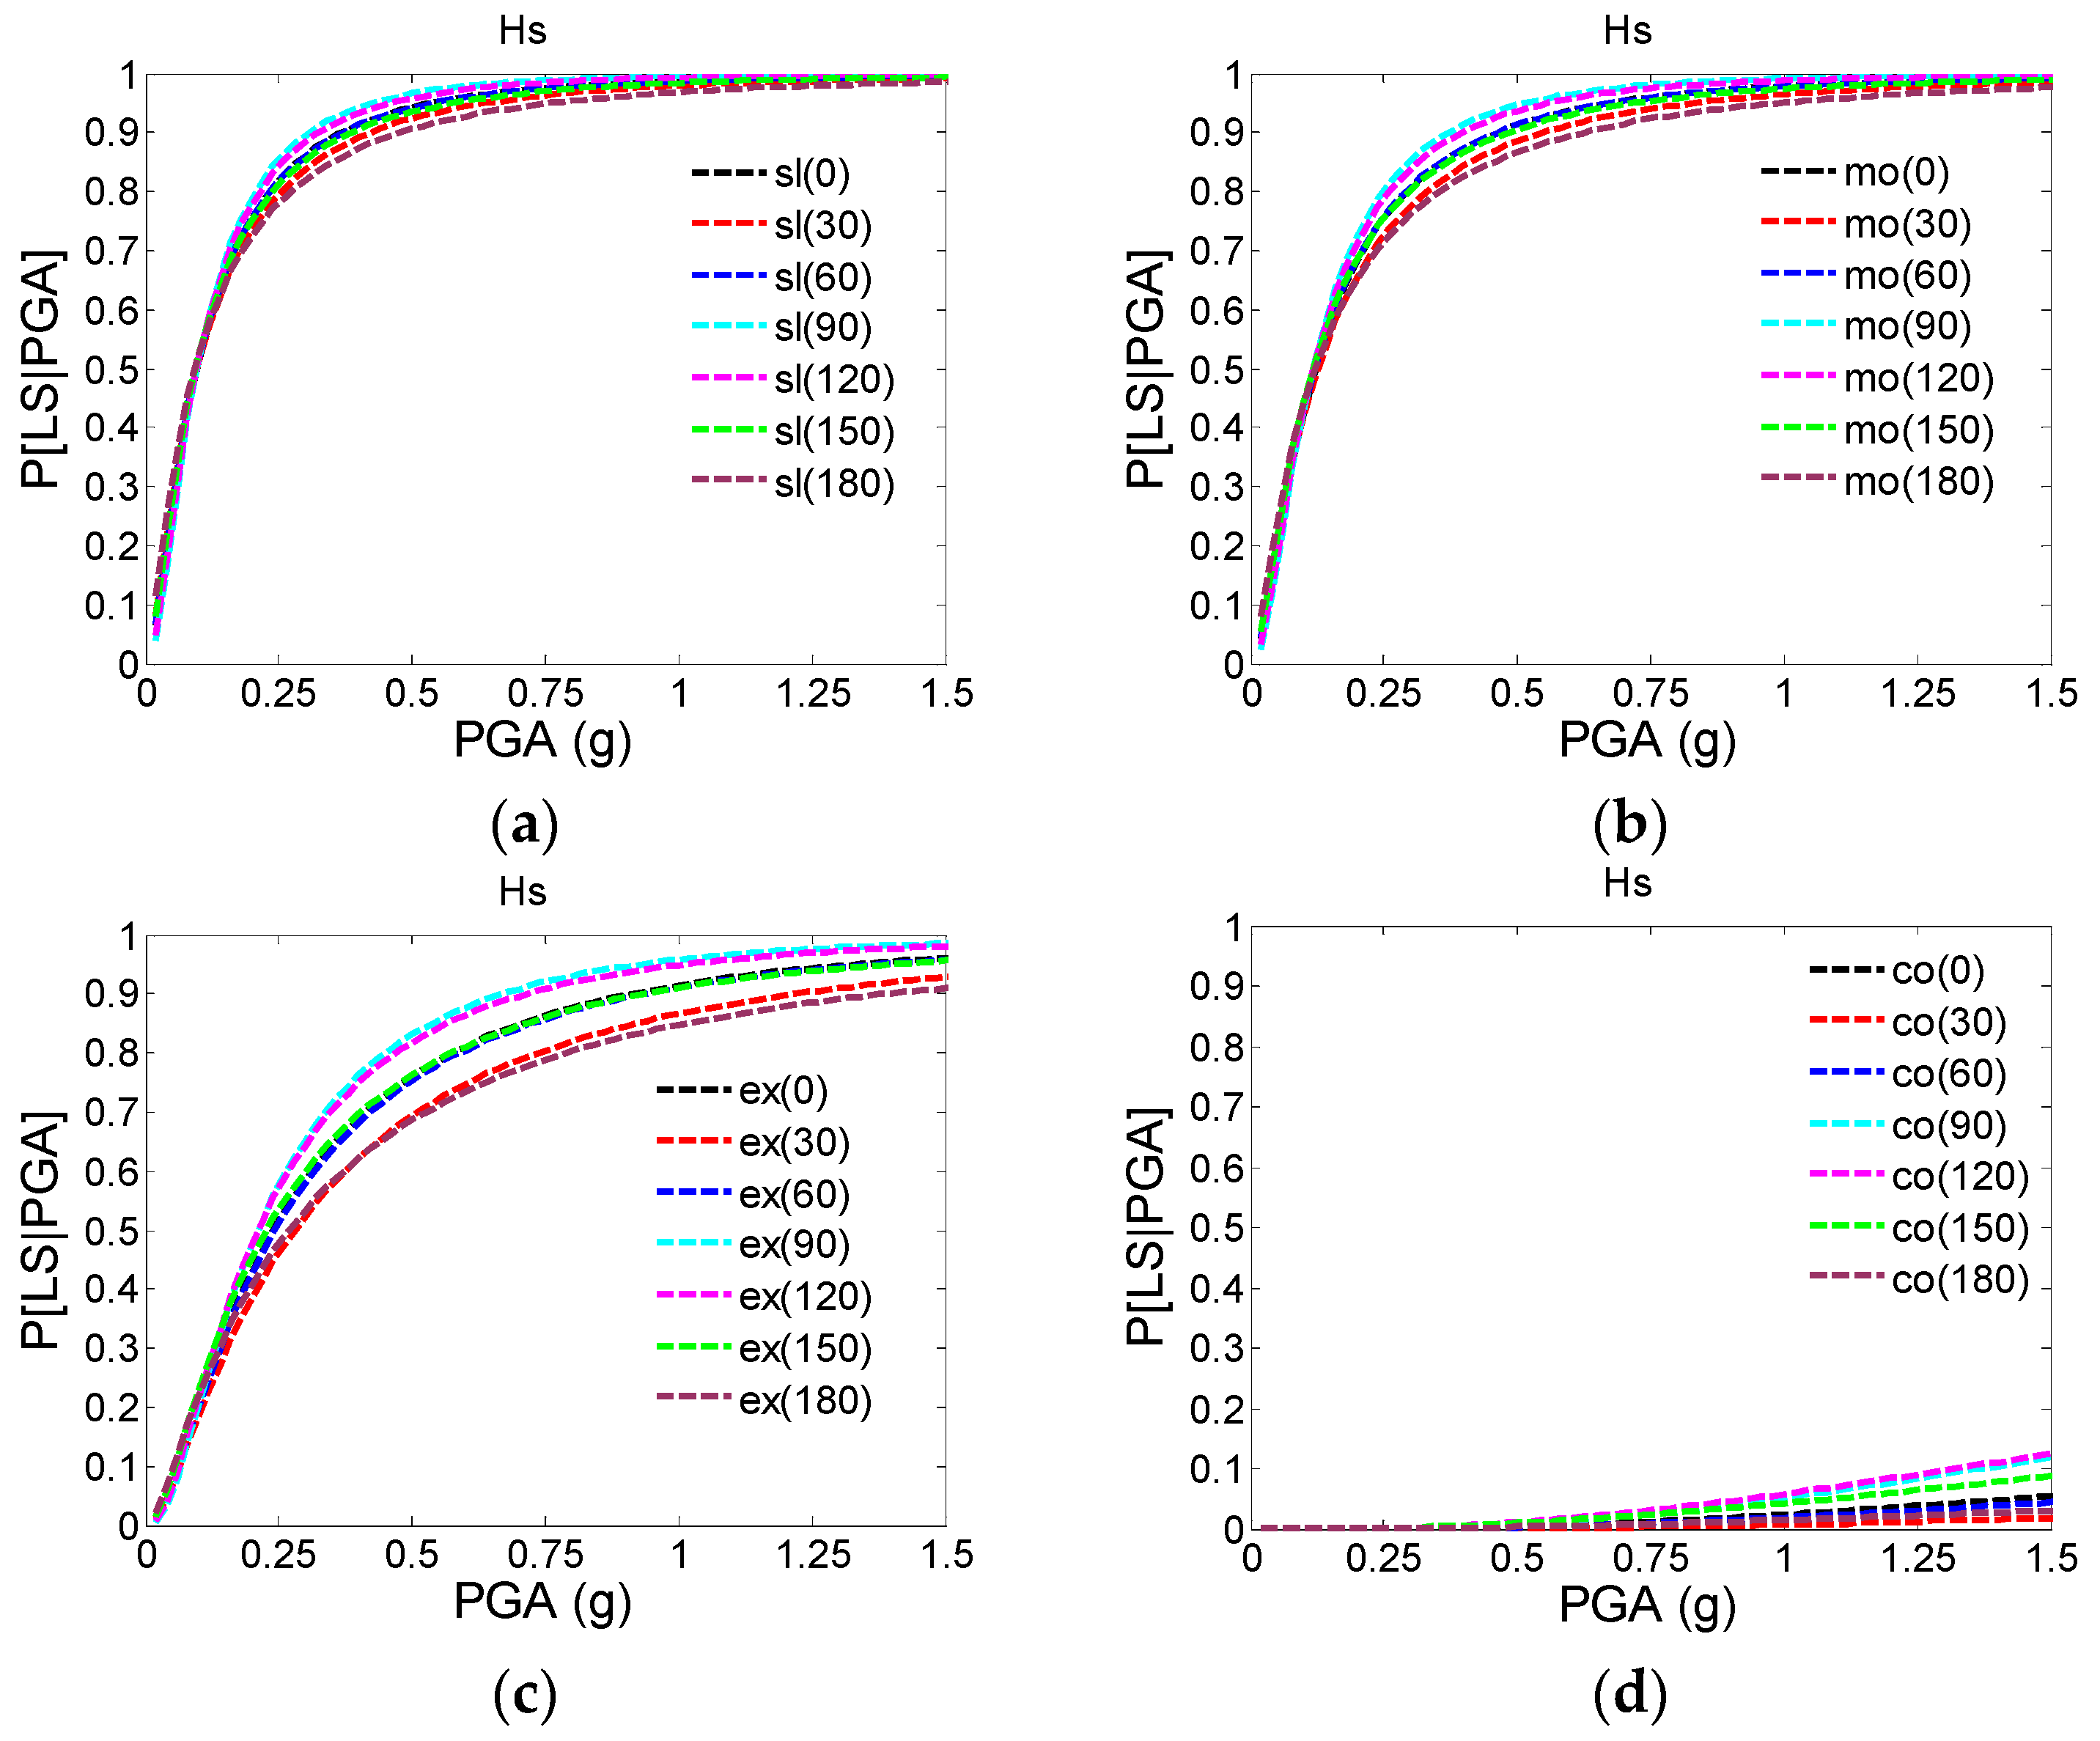
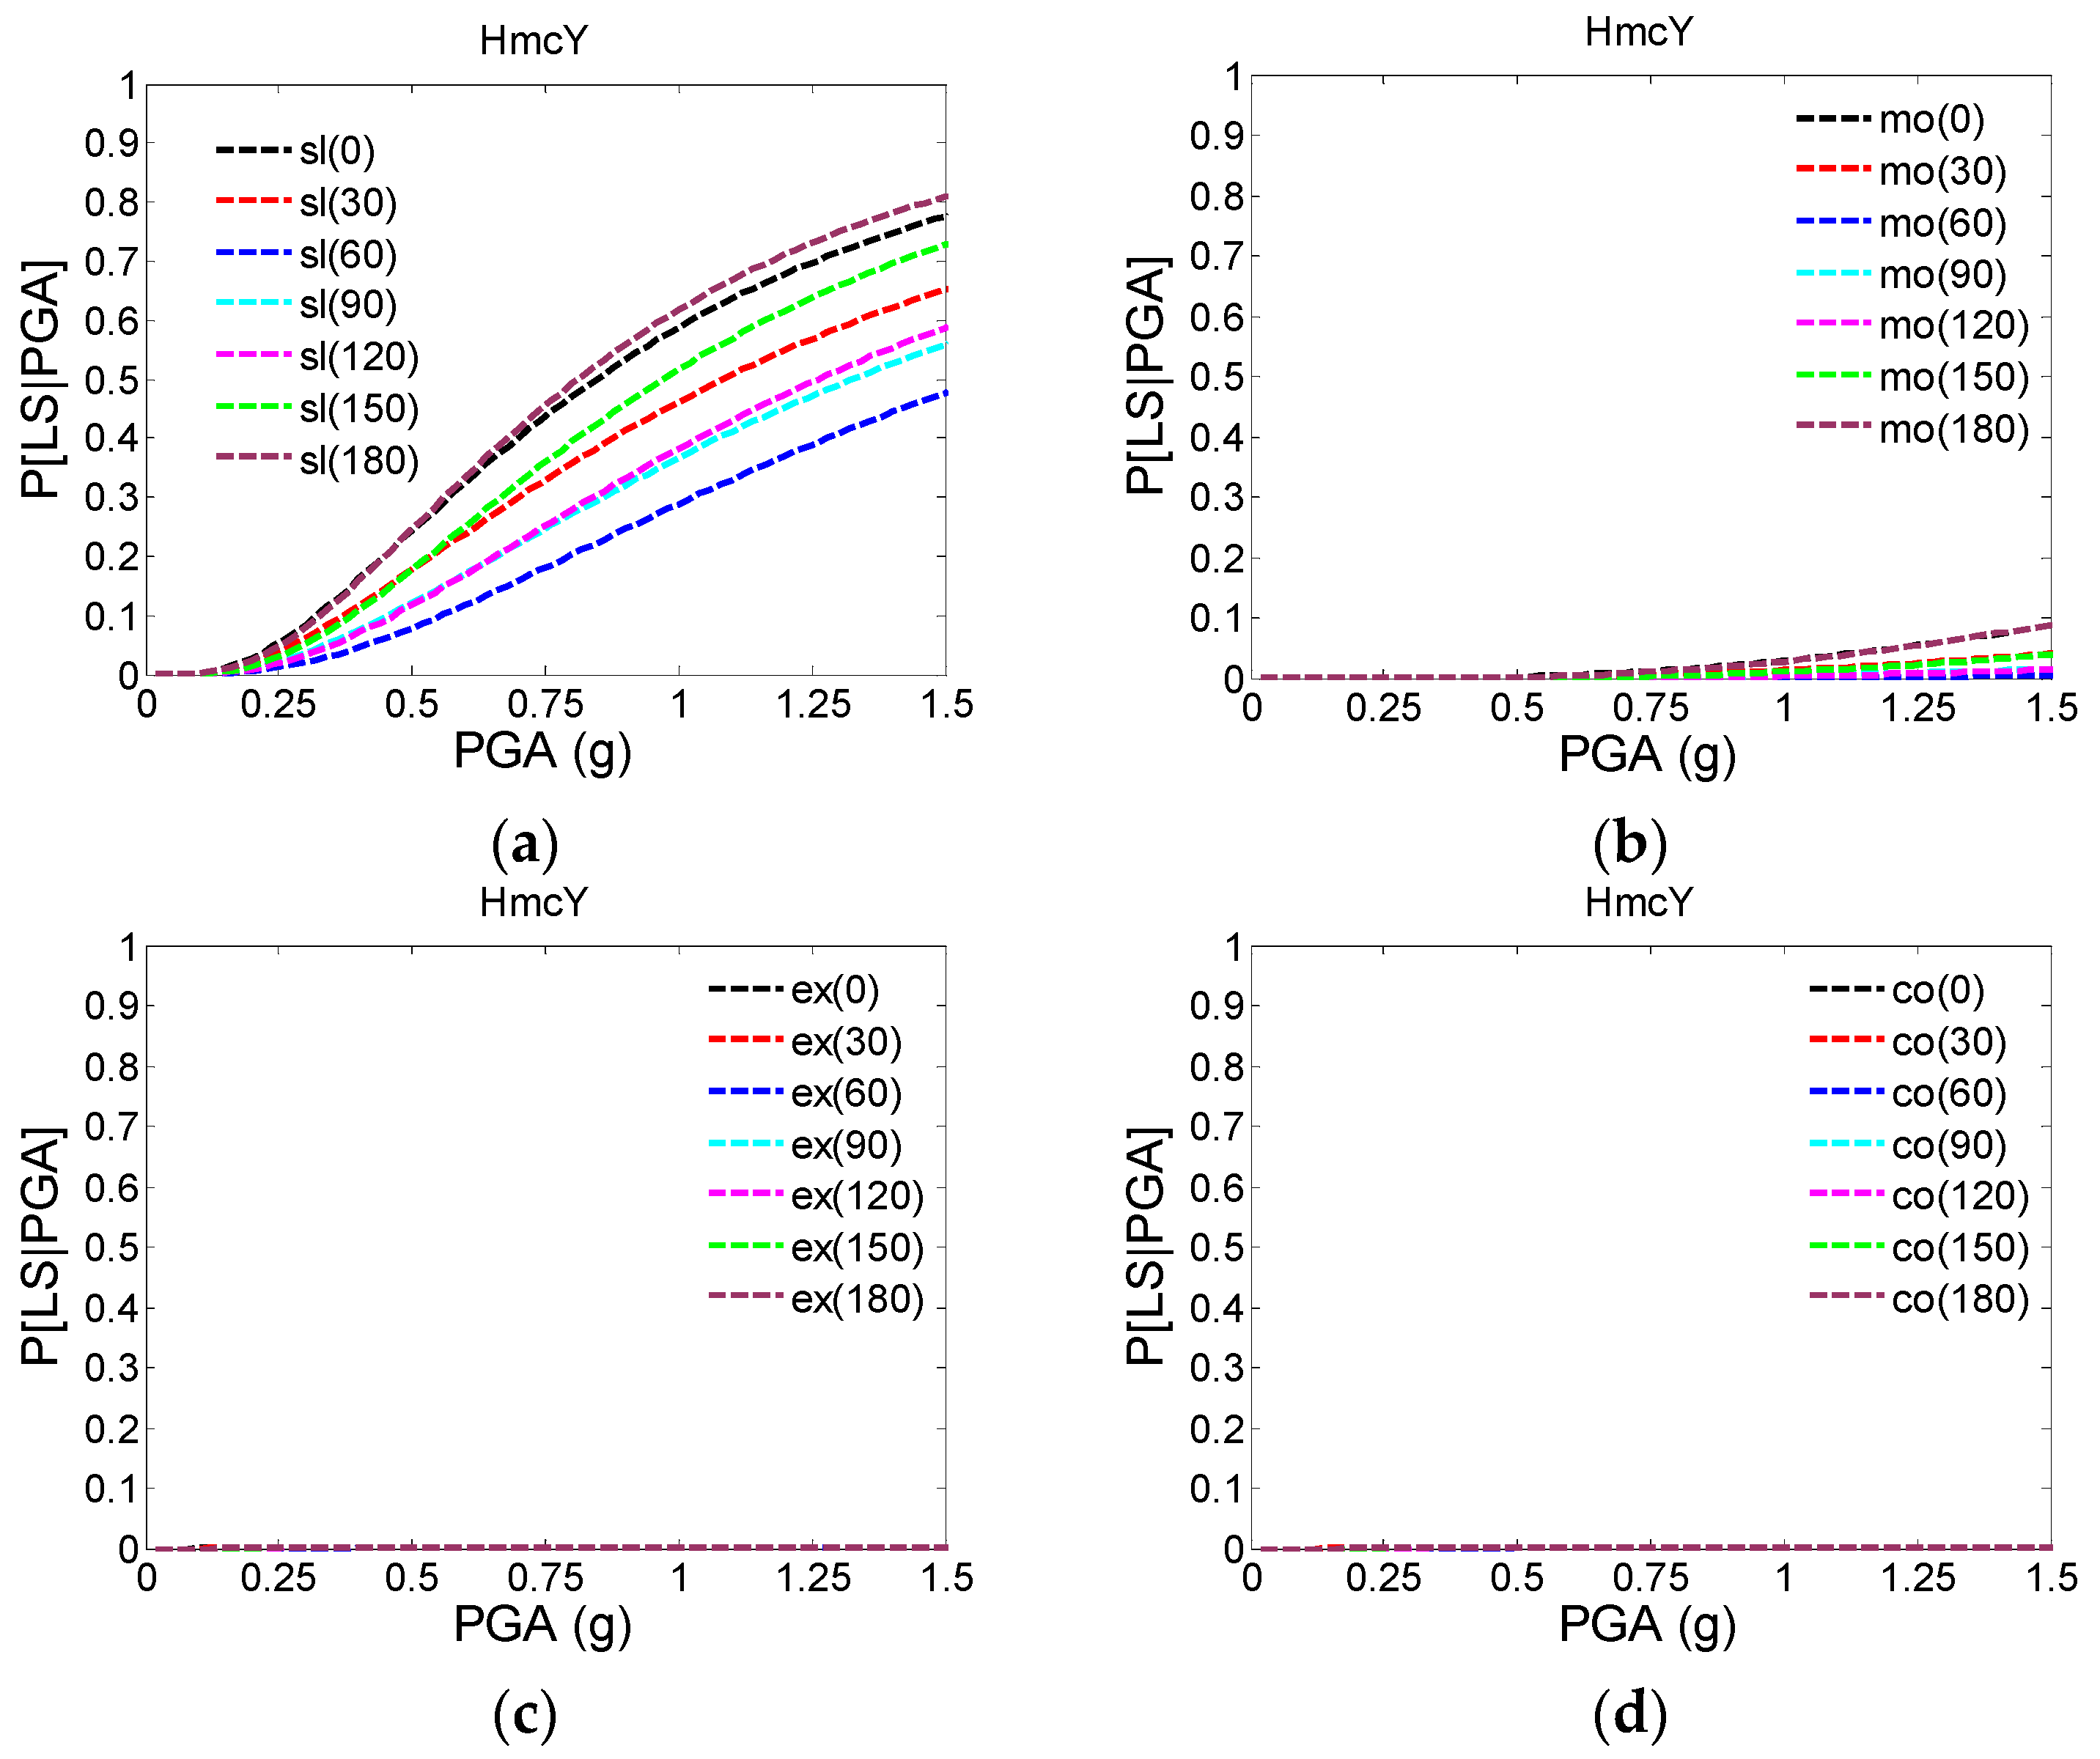
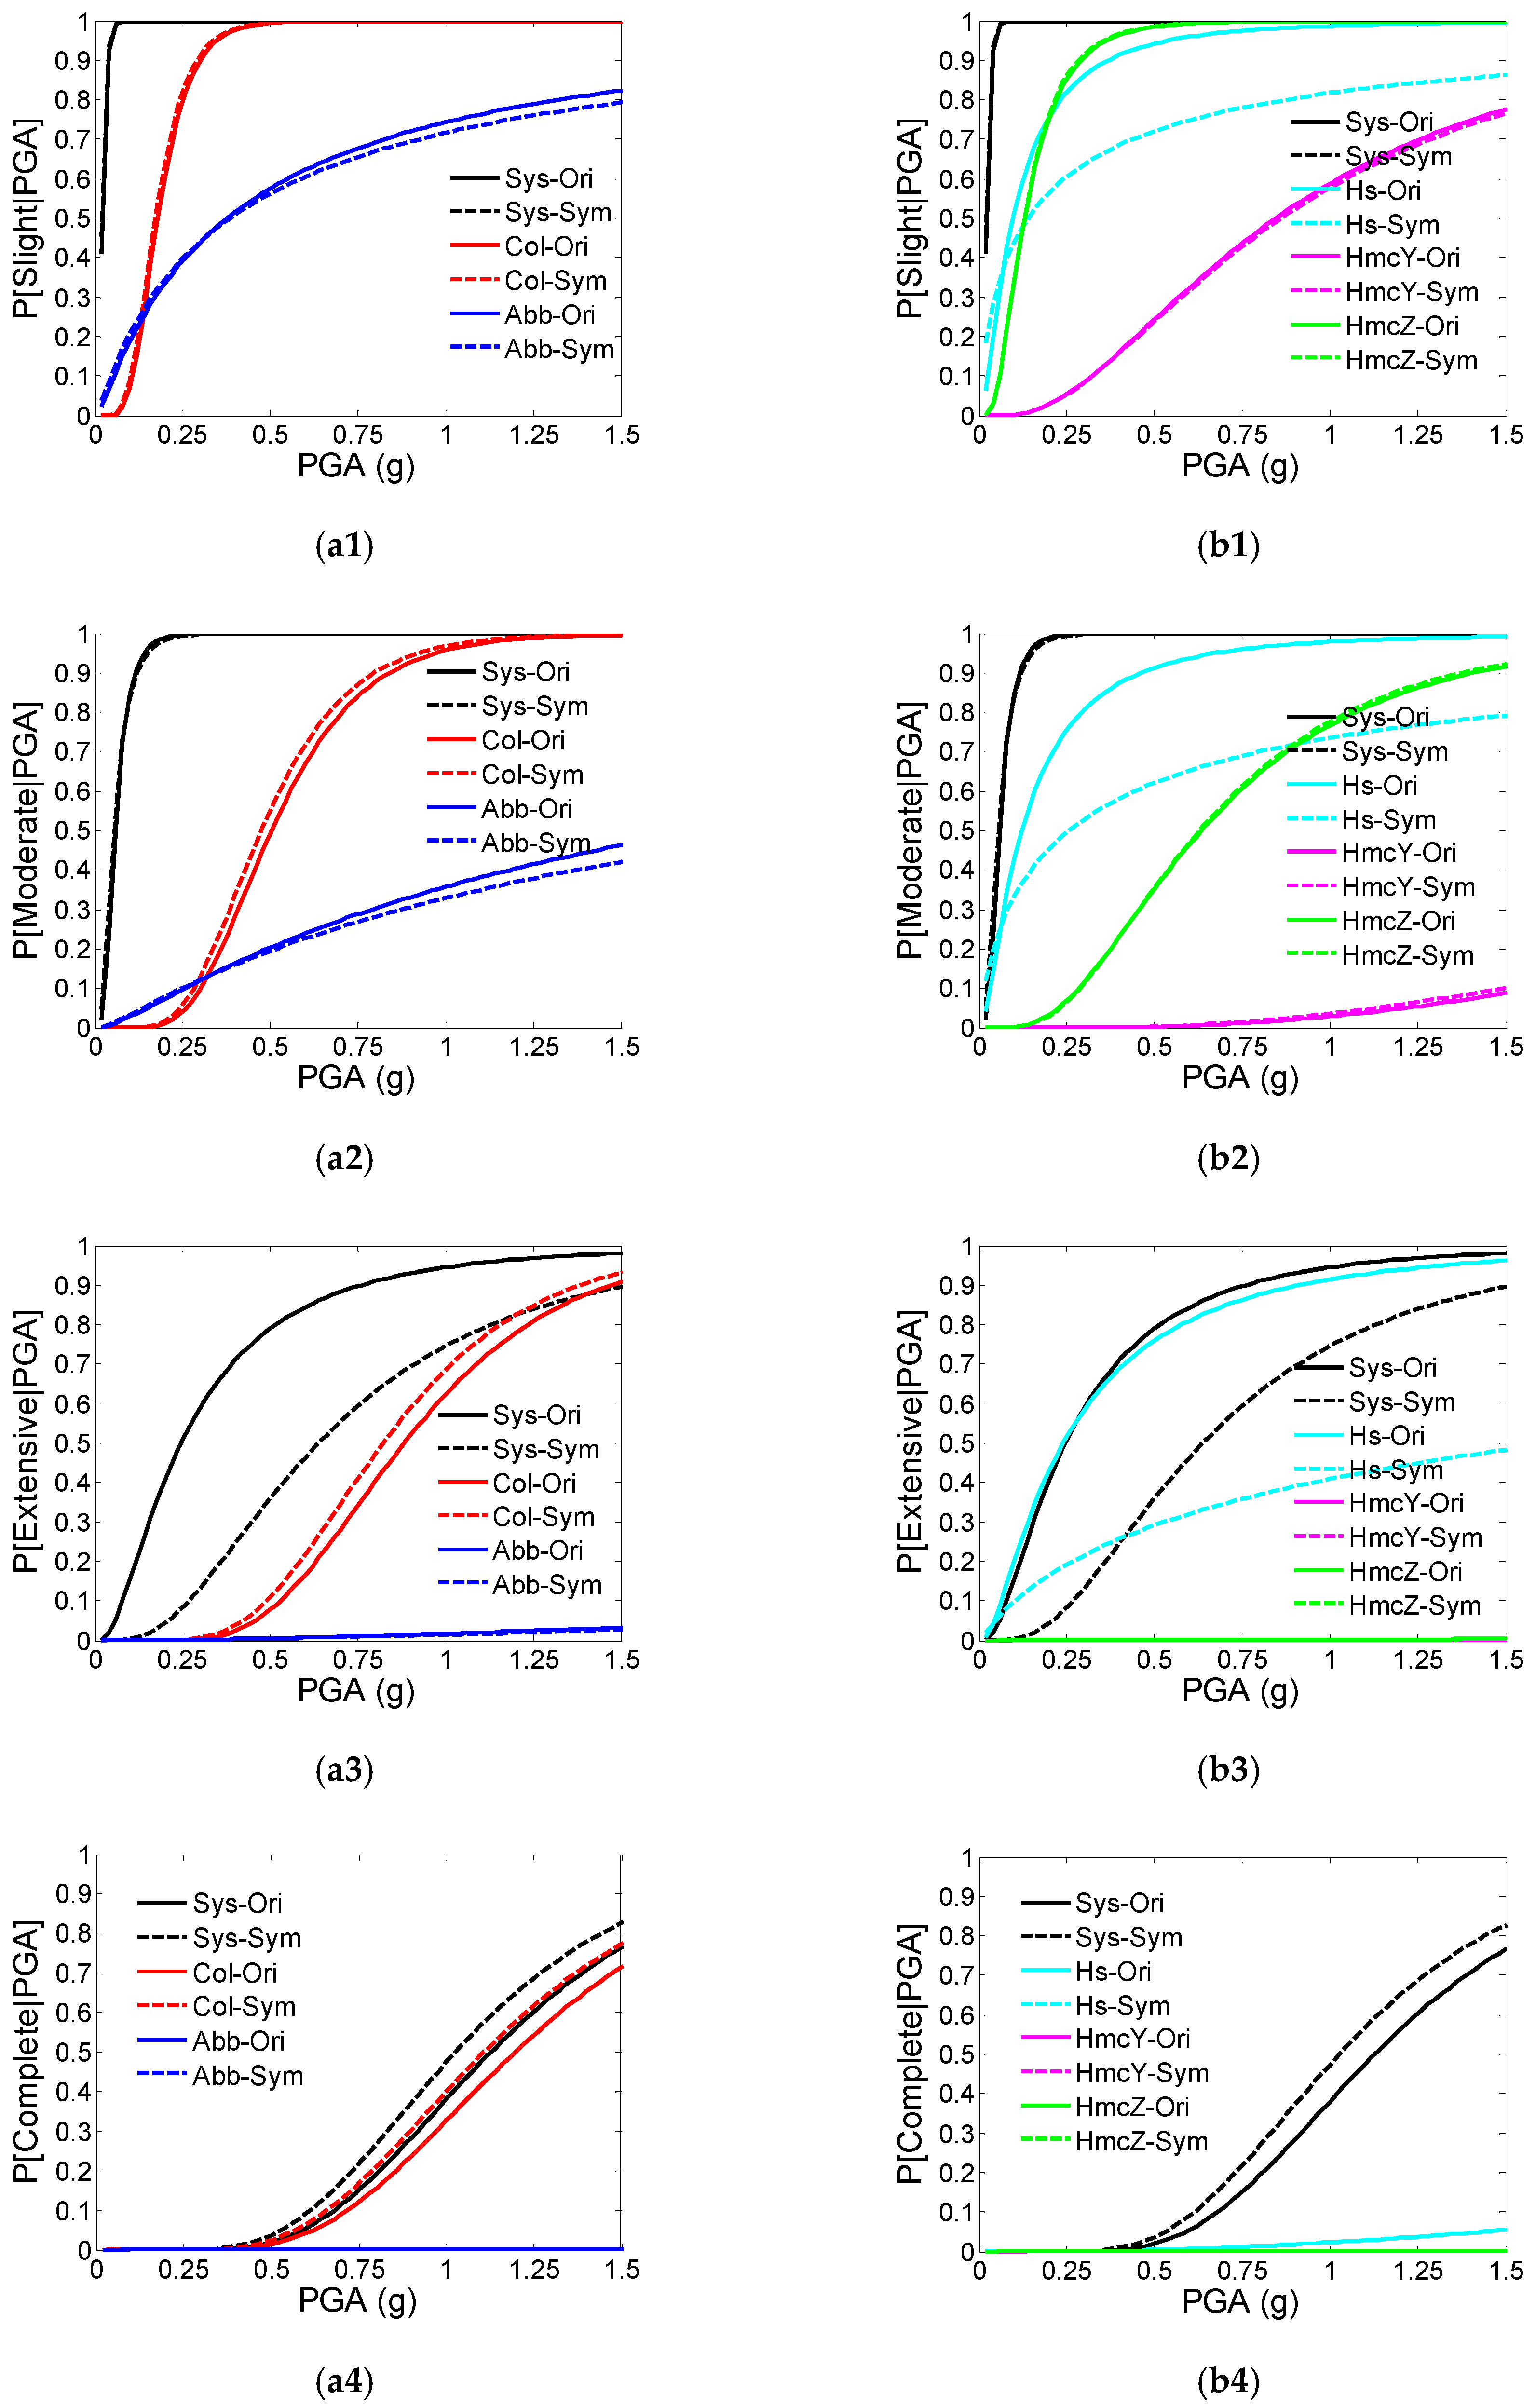
5.1. Primary Component Fragility Curves Subjected to Different Excitation Angles

Figure 5 demonstrates that the fragility of the column reaches a minimum when the excitation angle is 30 degrees, whereas fragility curves are essentially coincident when subjected to any other angles. Figure 6 indicates the fragility of Abb is lowest when the excitation angle is 30 degrees, nevertheless the fragility is highest when the excitation angle is 90 degrees. Figure 7a–c shows the fragility of Hs reaches a minimum when subjected to 180 degrees, whereas fragility reaches a maximum when subjected to 90 degrees. Figure 8a,b and Figure 9a,b indicates HmcY and HmcZ features the minimum fragility when subjected to 60 degrees, whereas it features the maximum fragility when subjected to 180 degrees.

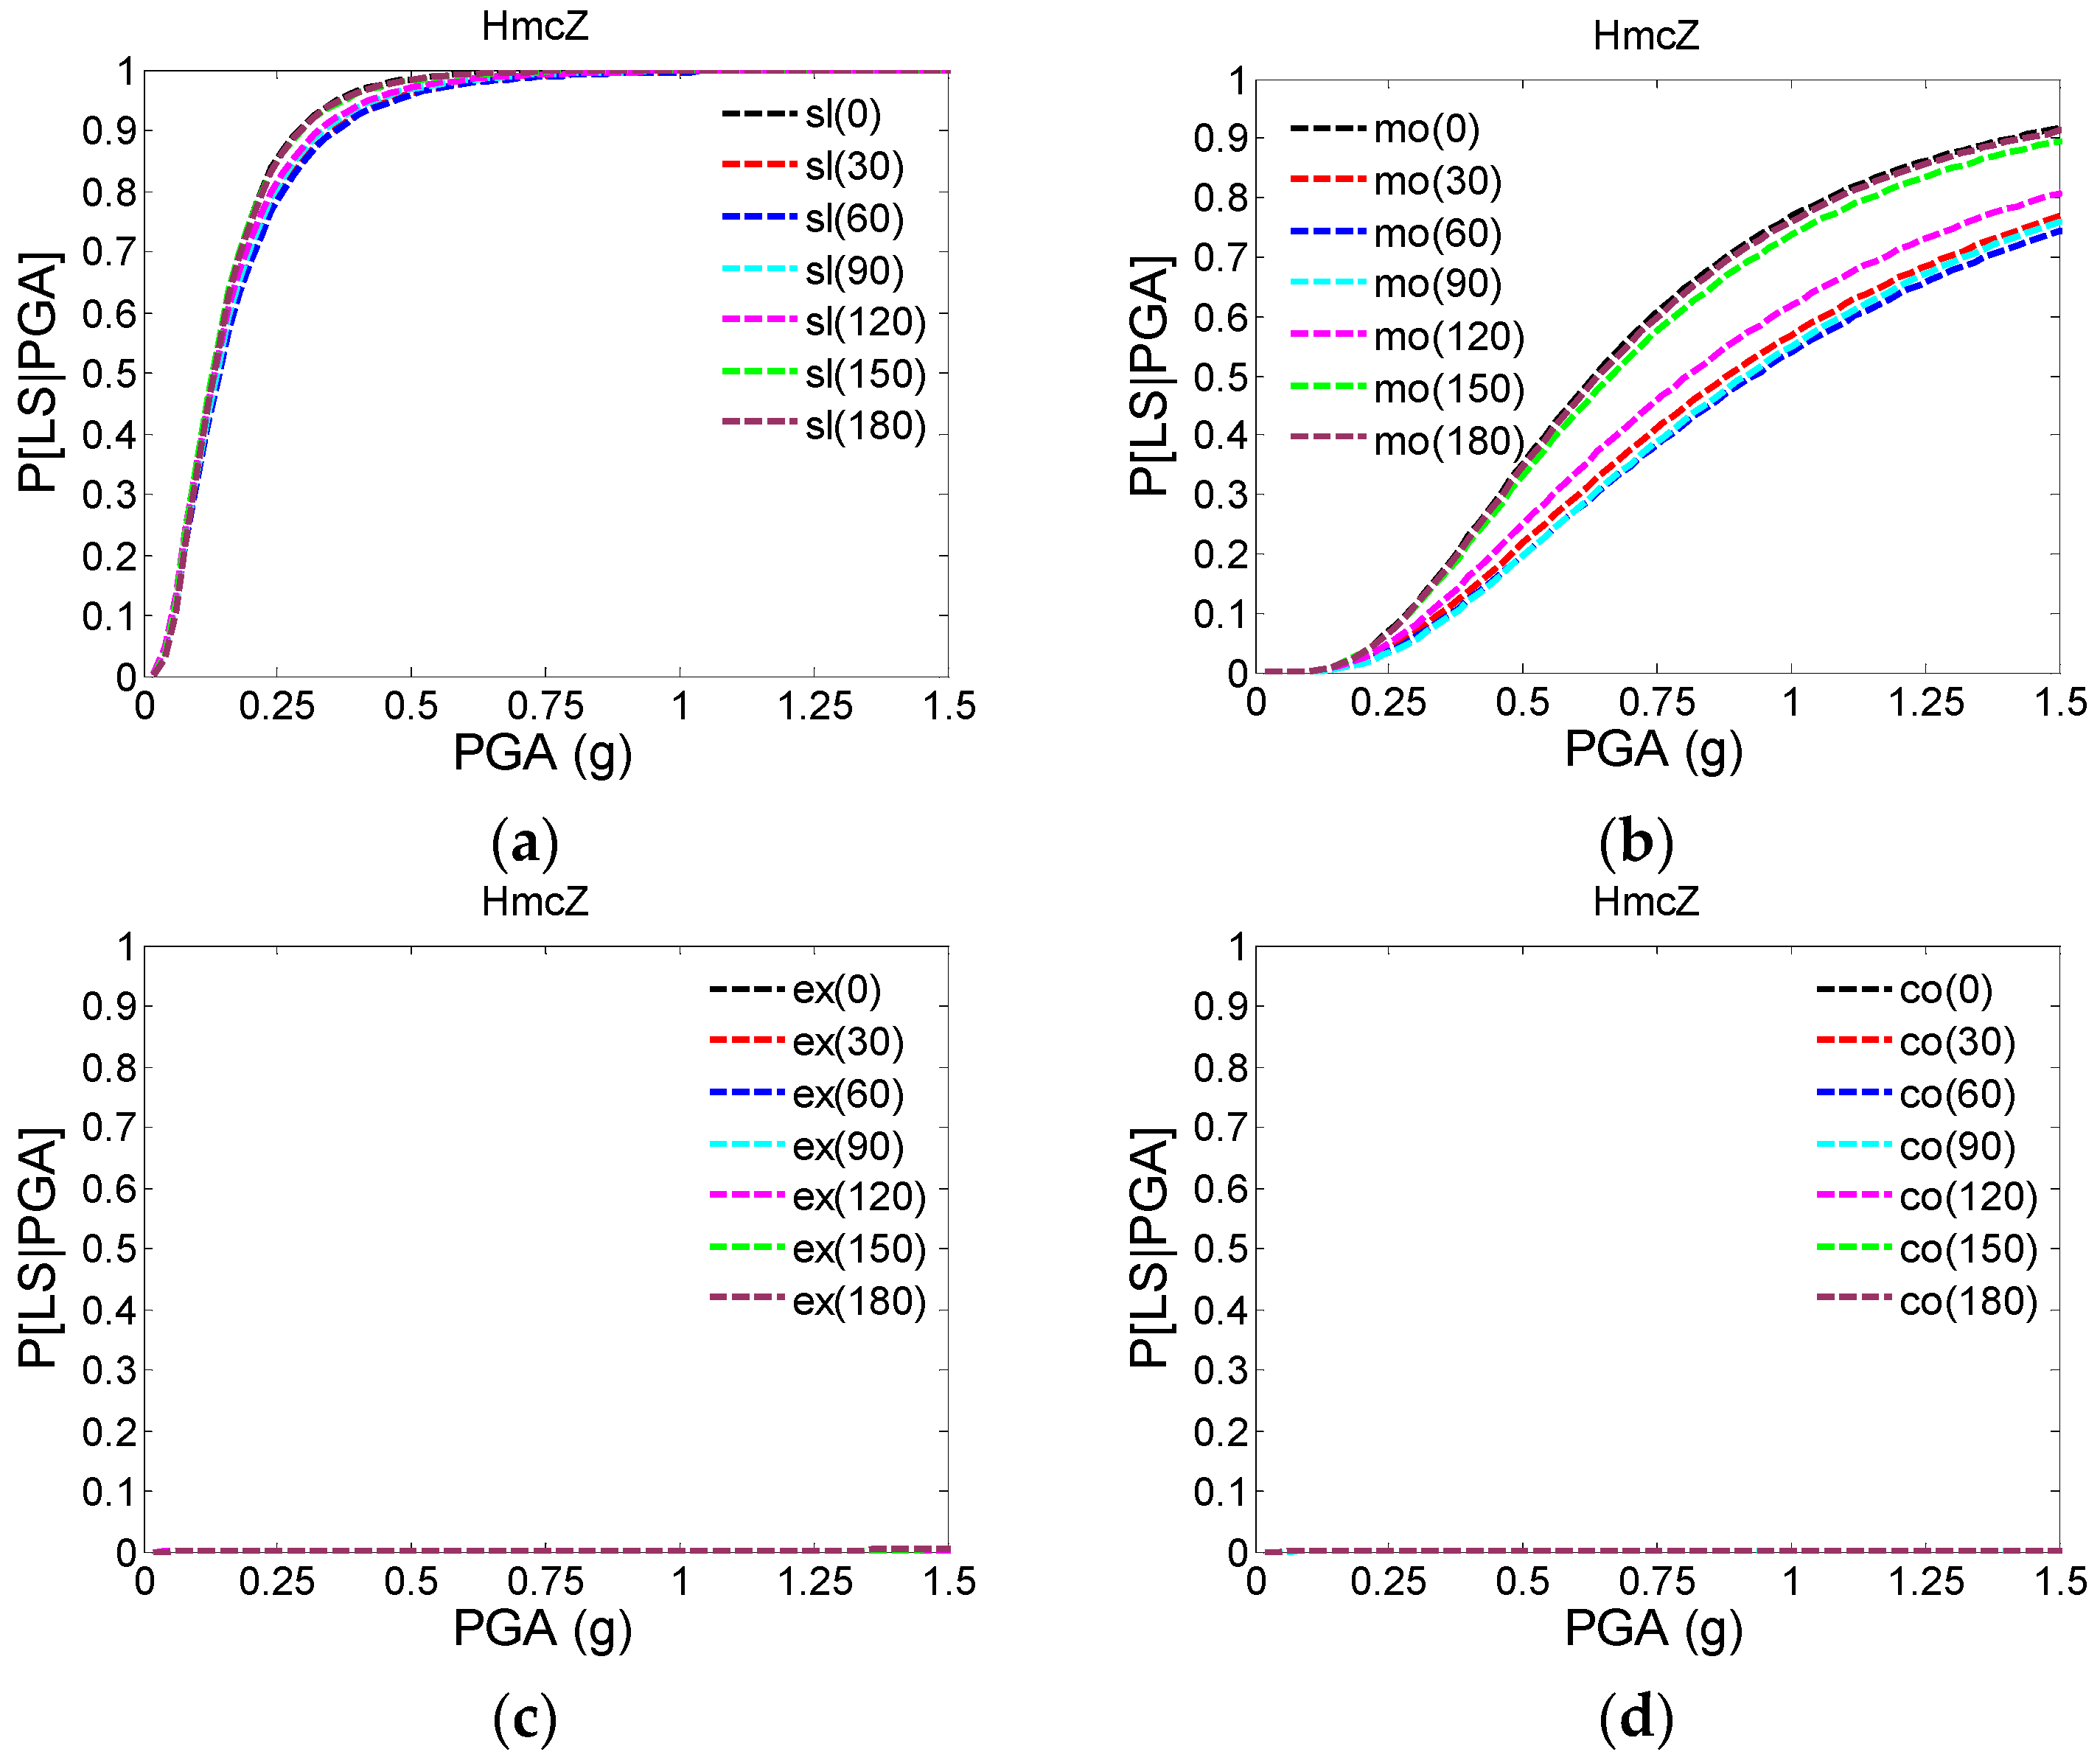
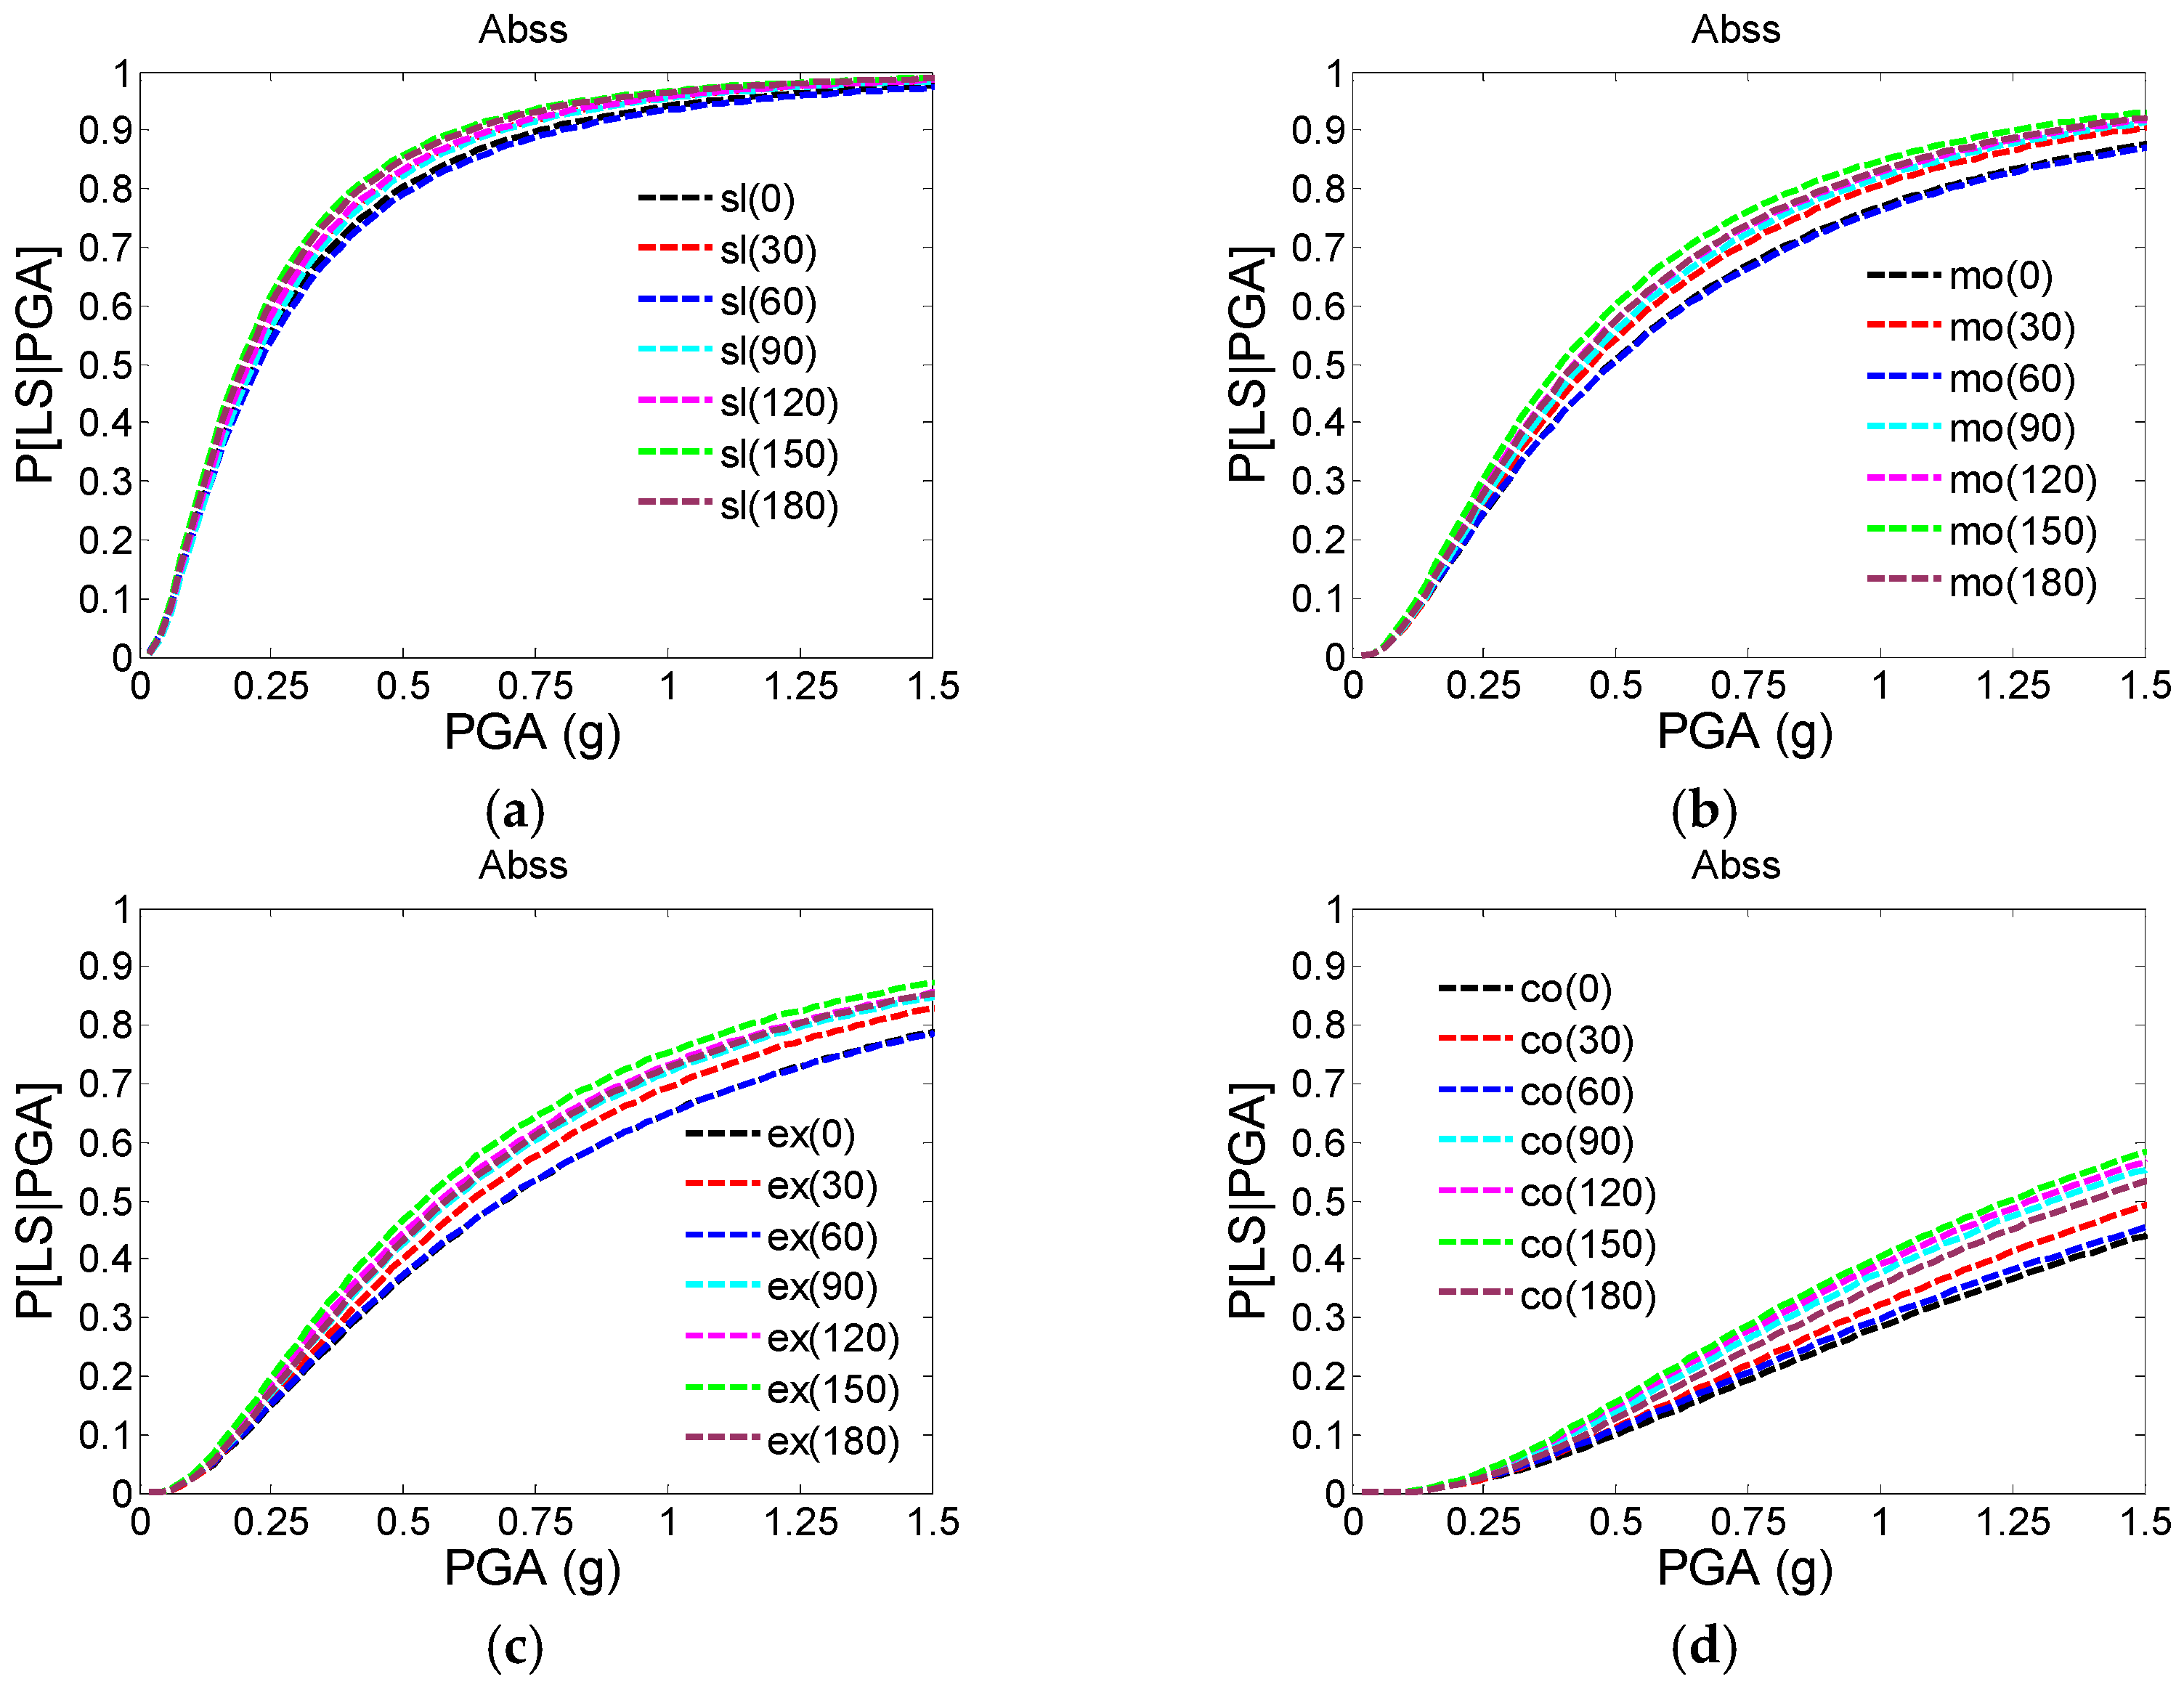
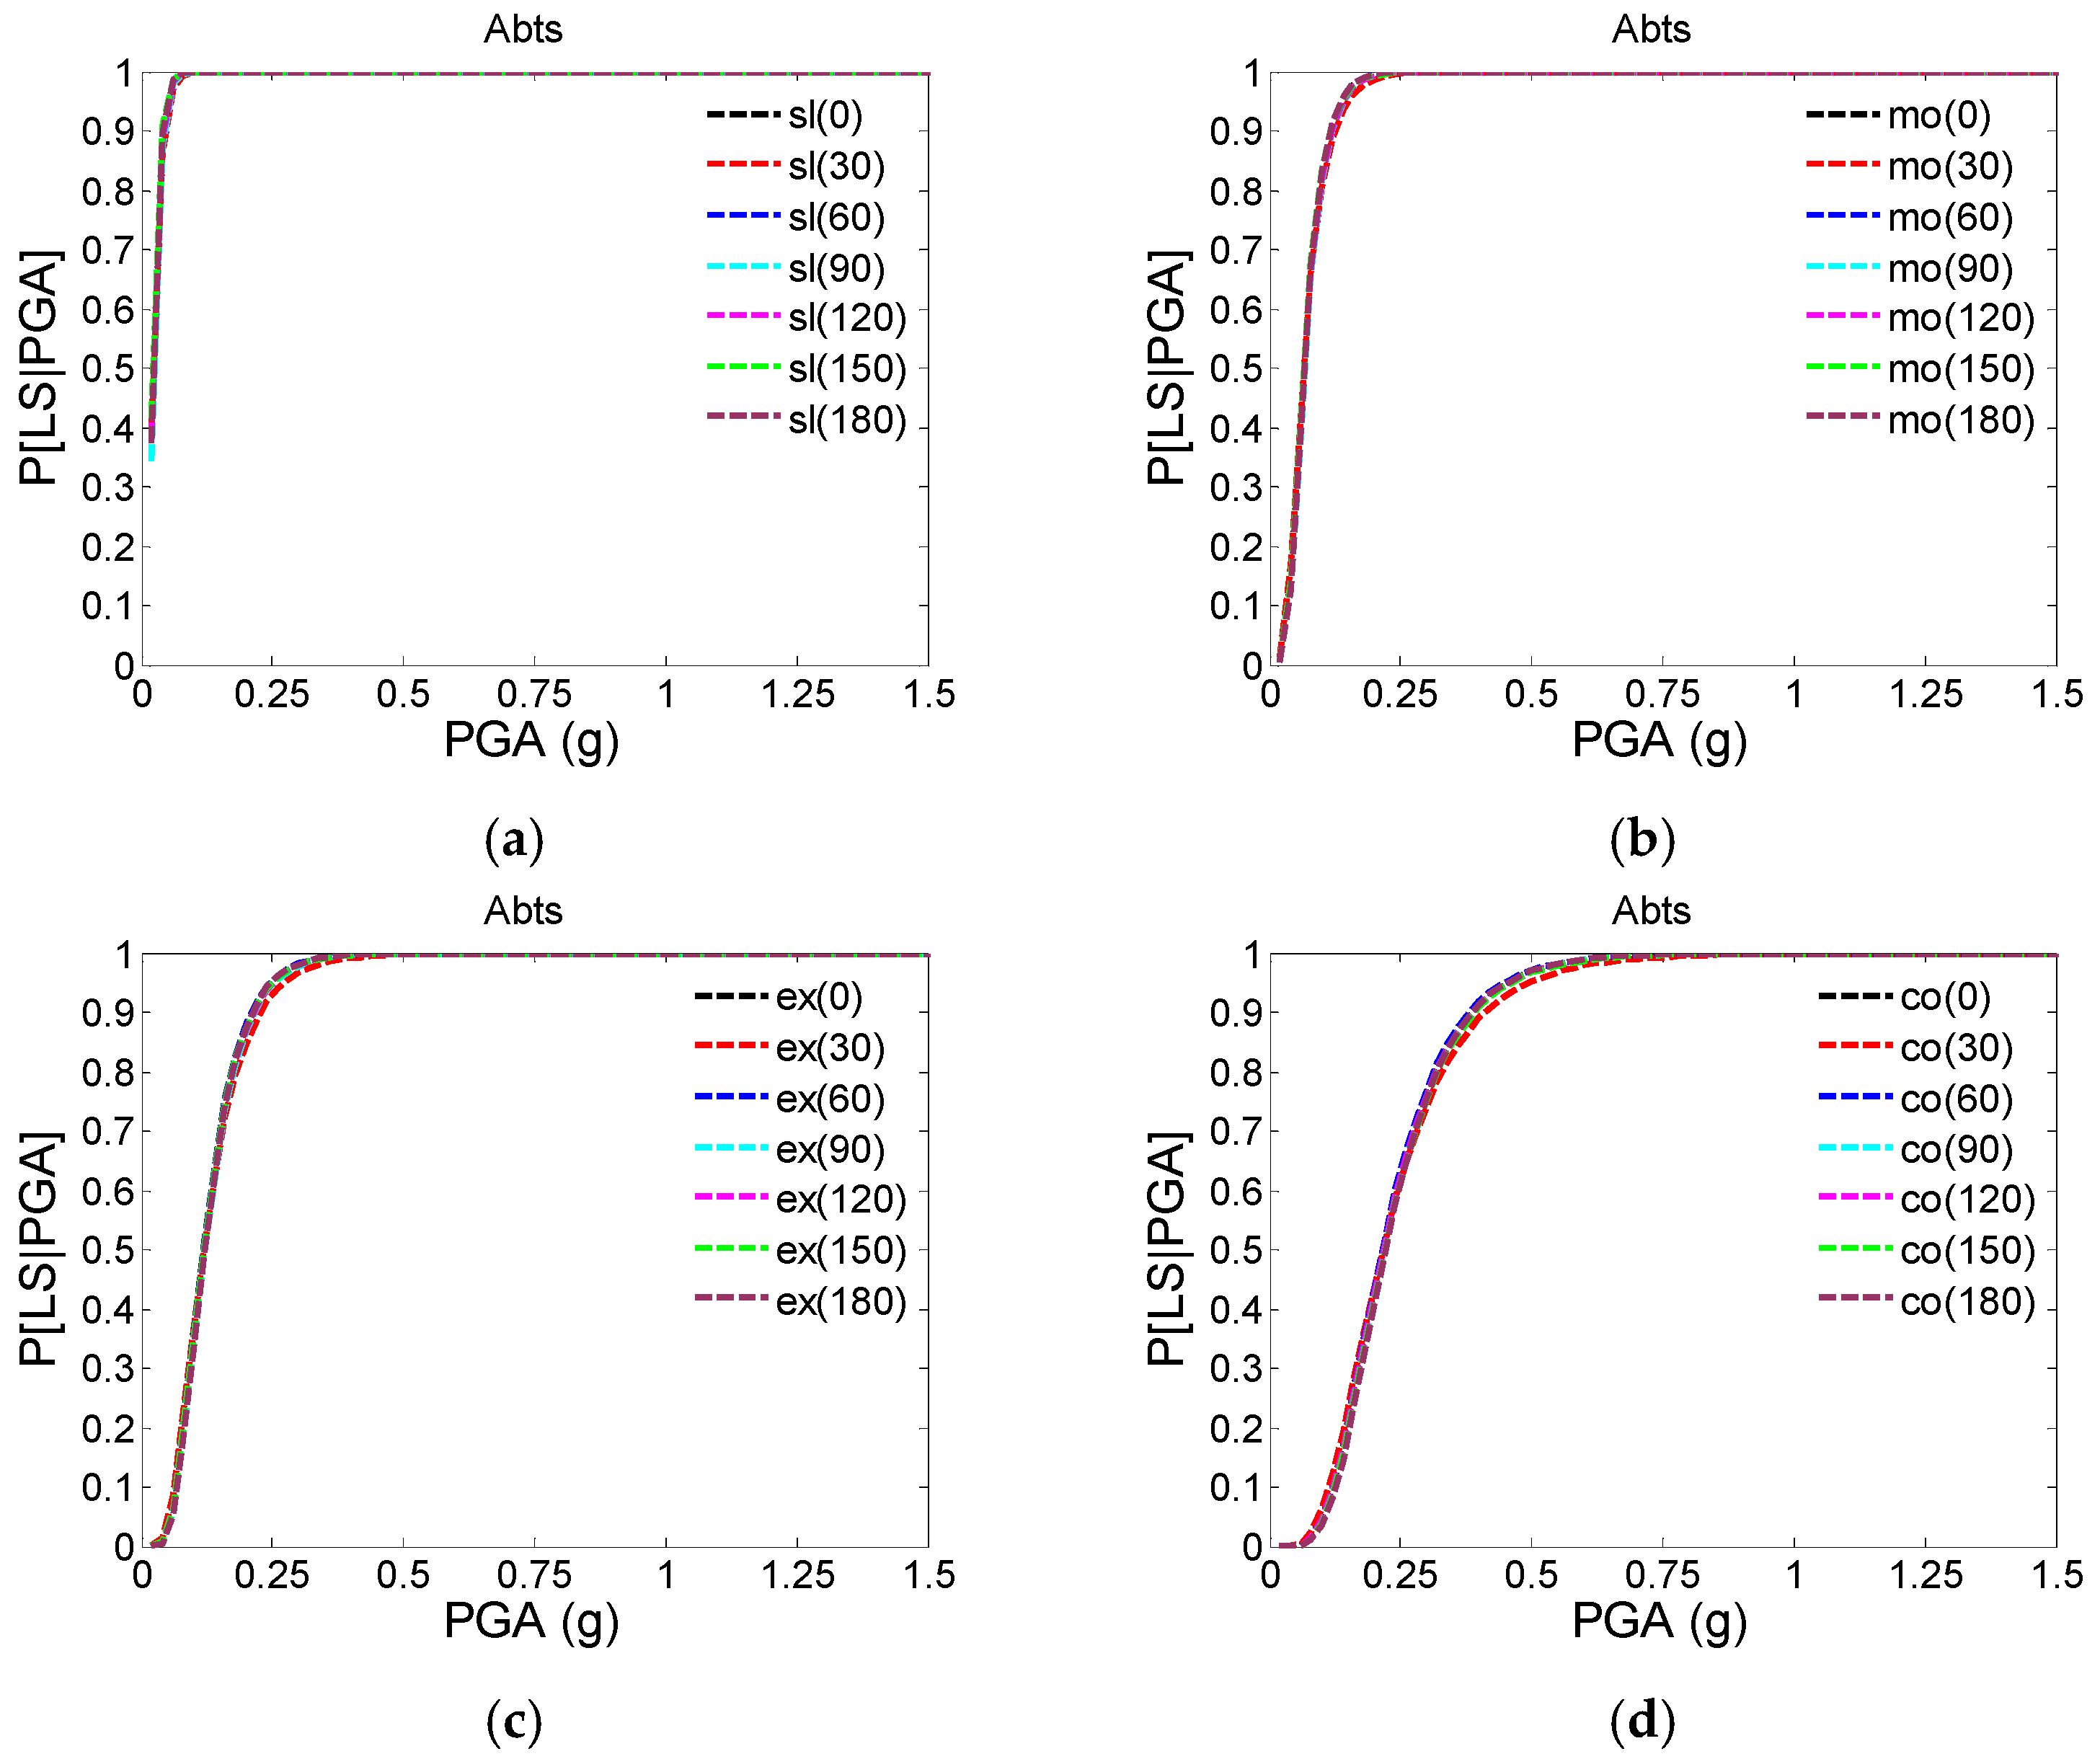
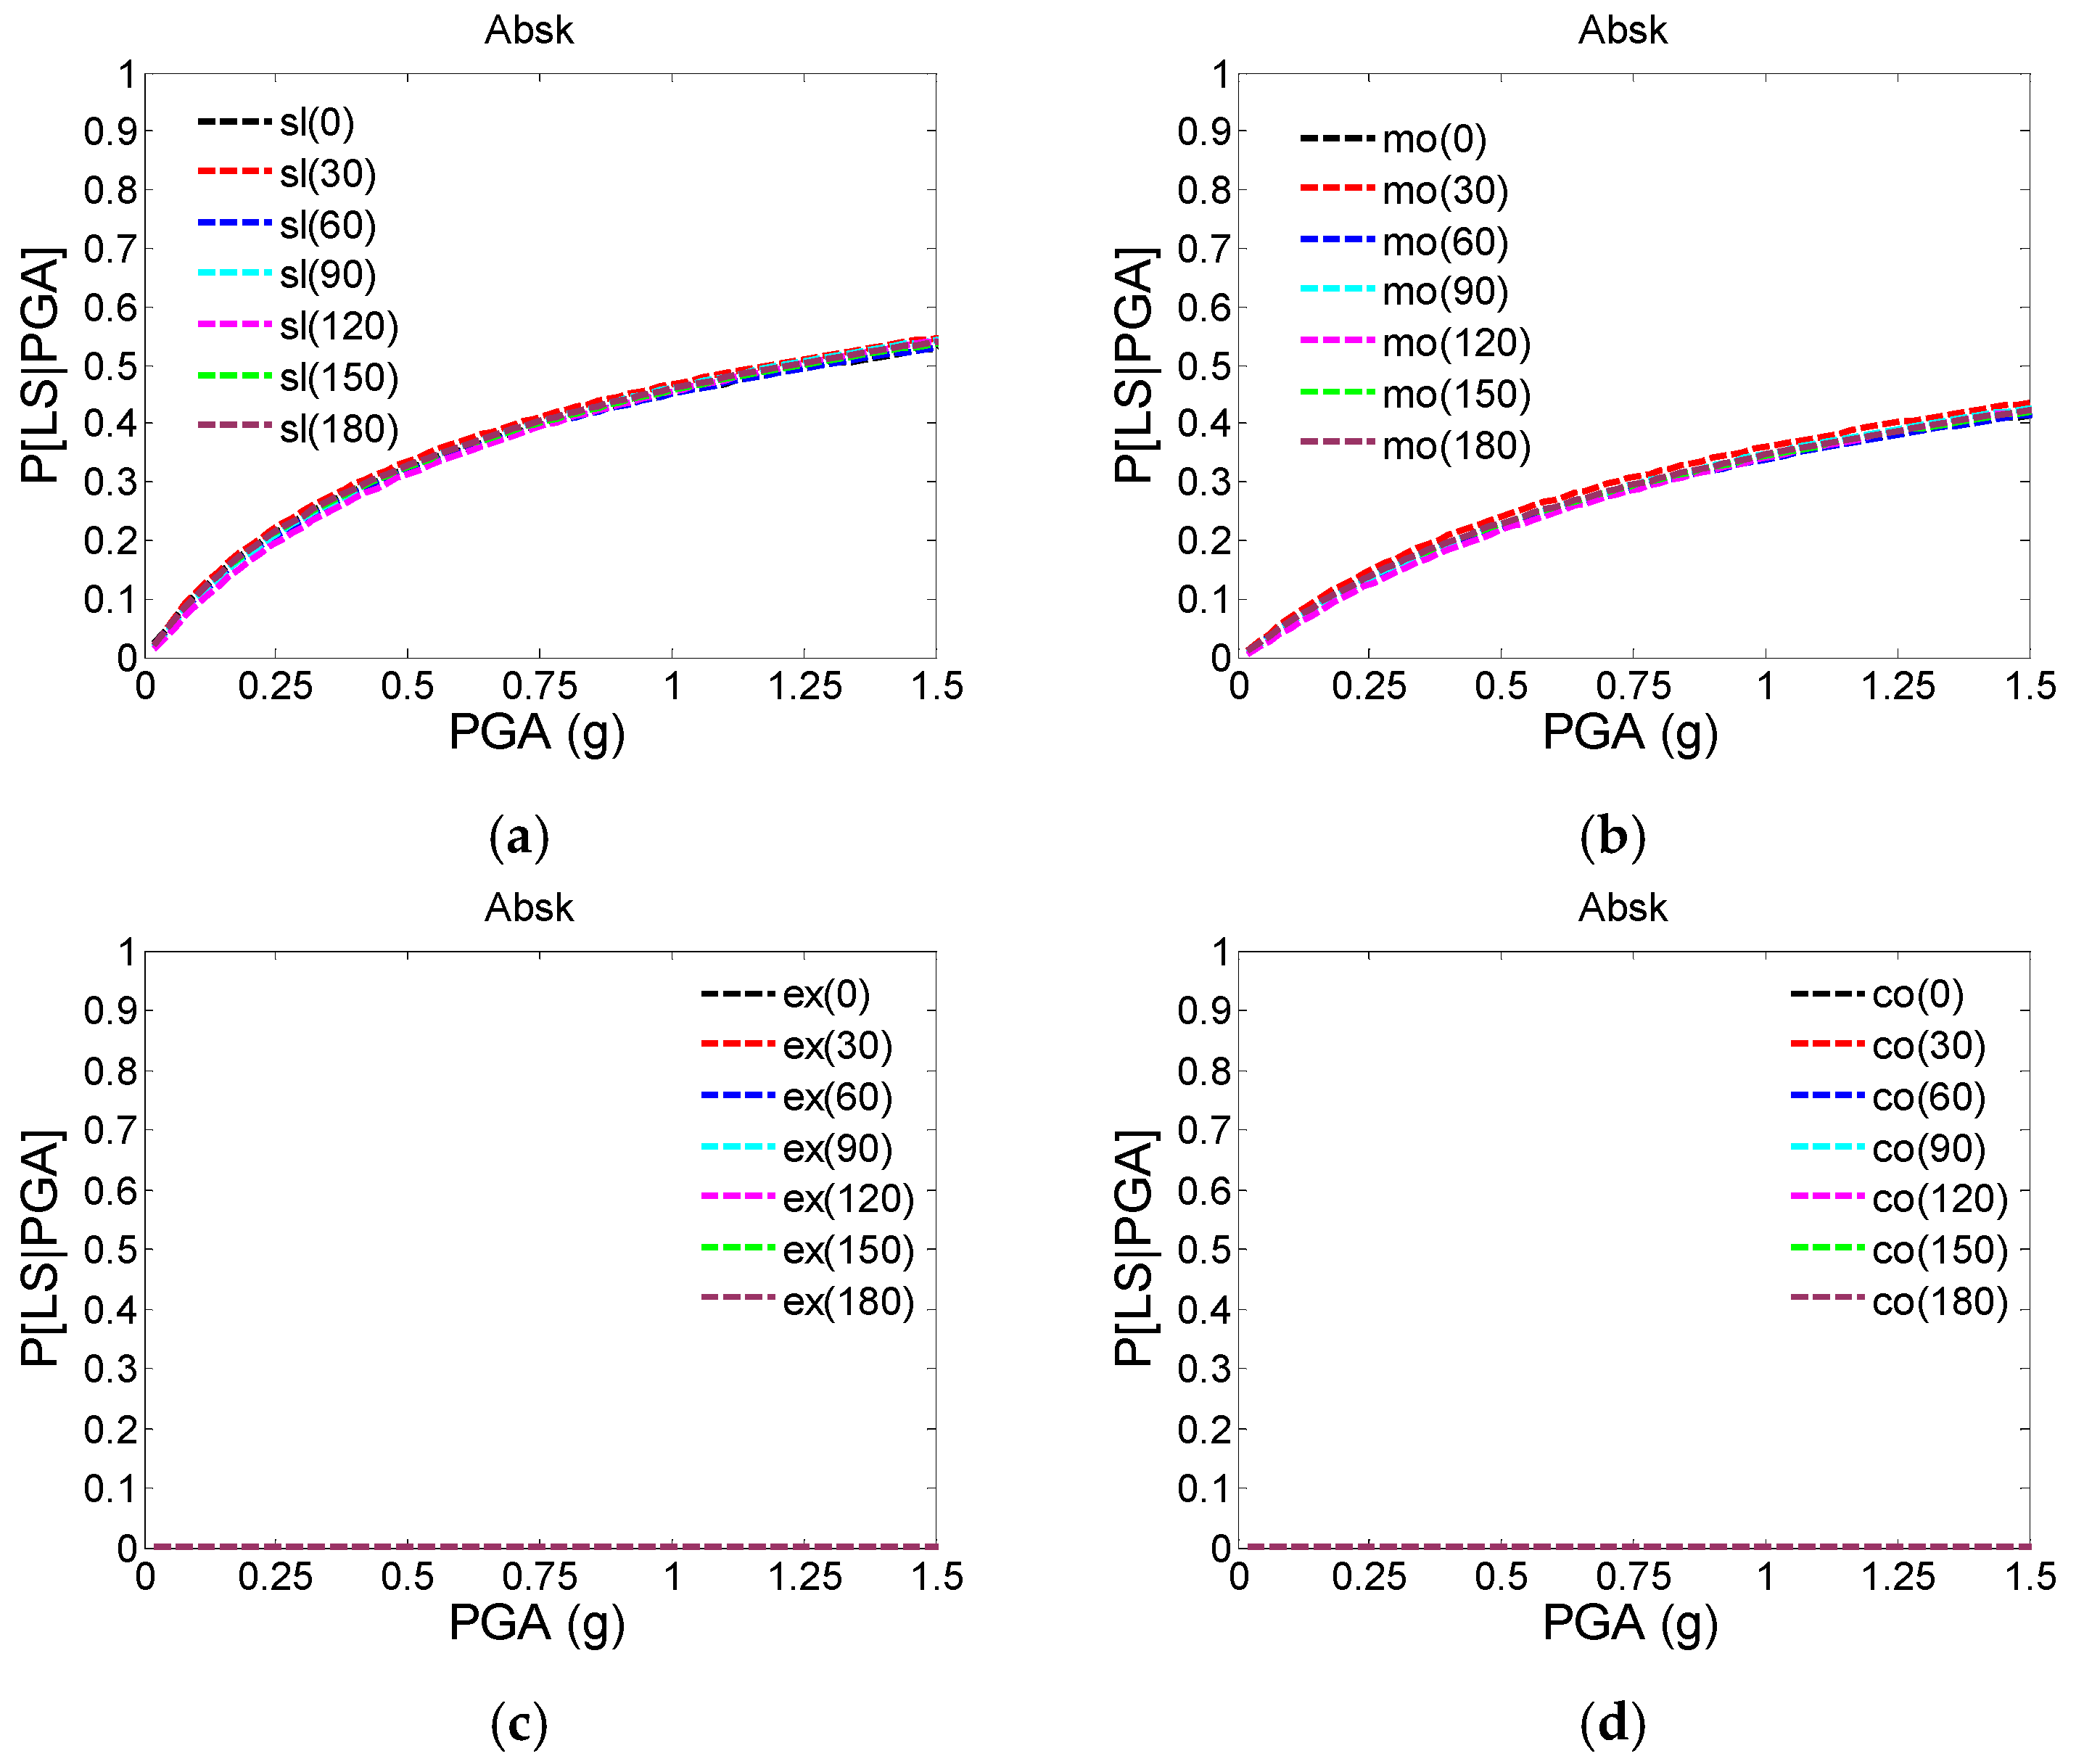
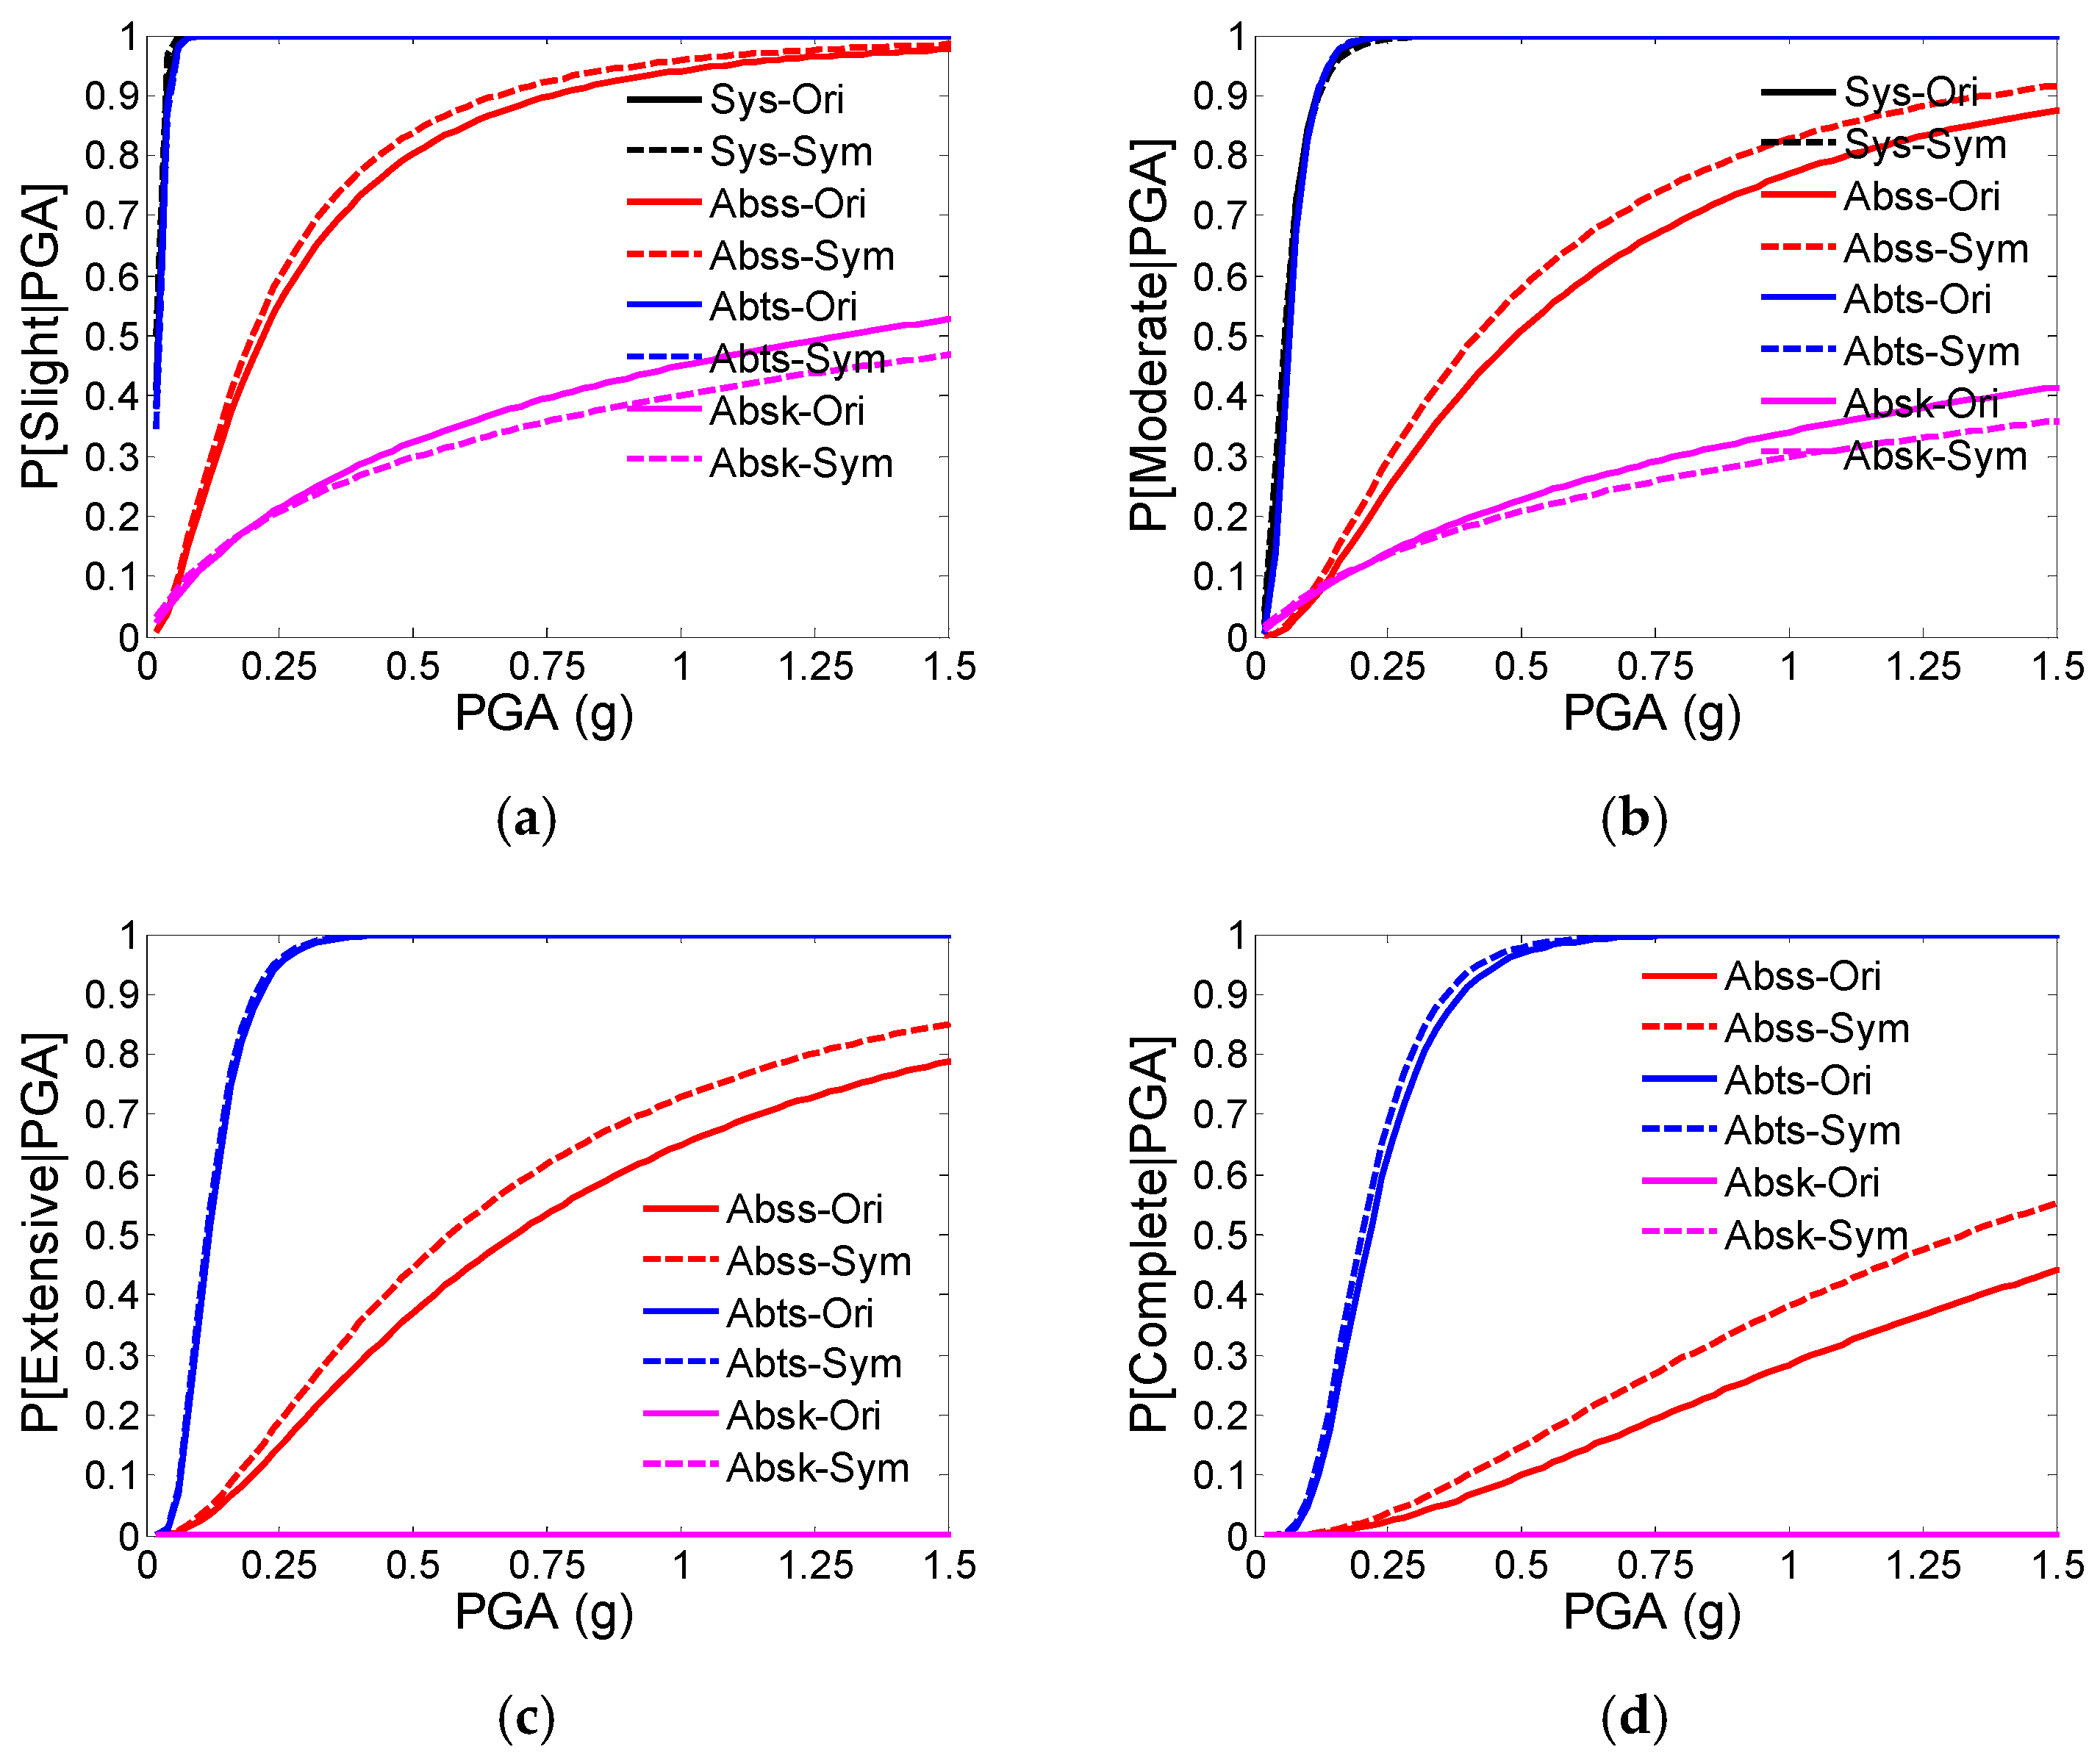
5.2. Secondary Component Fragility Curves Subjected to Different Excitation Angles

Figure 10 demonstrates Abss features the lowest fragility when subjected to 0 degree or 60 degrees, nevertheless it features the highest fragility when subjected to 150 degrees. As shown in Figure 11, the fragility of Abts is relatively a little lower at the excitation angle of 30 degrees as compared with other excitation angles. All of the curves subjected to seven excitation angles are basically coincident, which demonstrates that seismic excitation angles have little influence on the fragility of abutment transverse response. Similarly, coincident fragility curves from different angles indicates the seismic excitation angles have little influence on the fragility of Absk as shown in Figure 12.

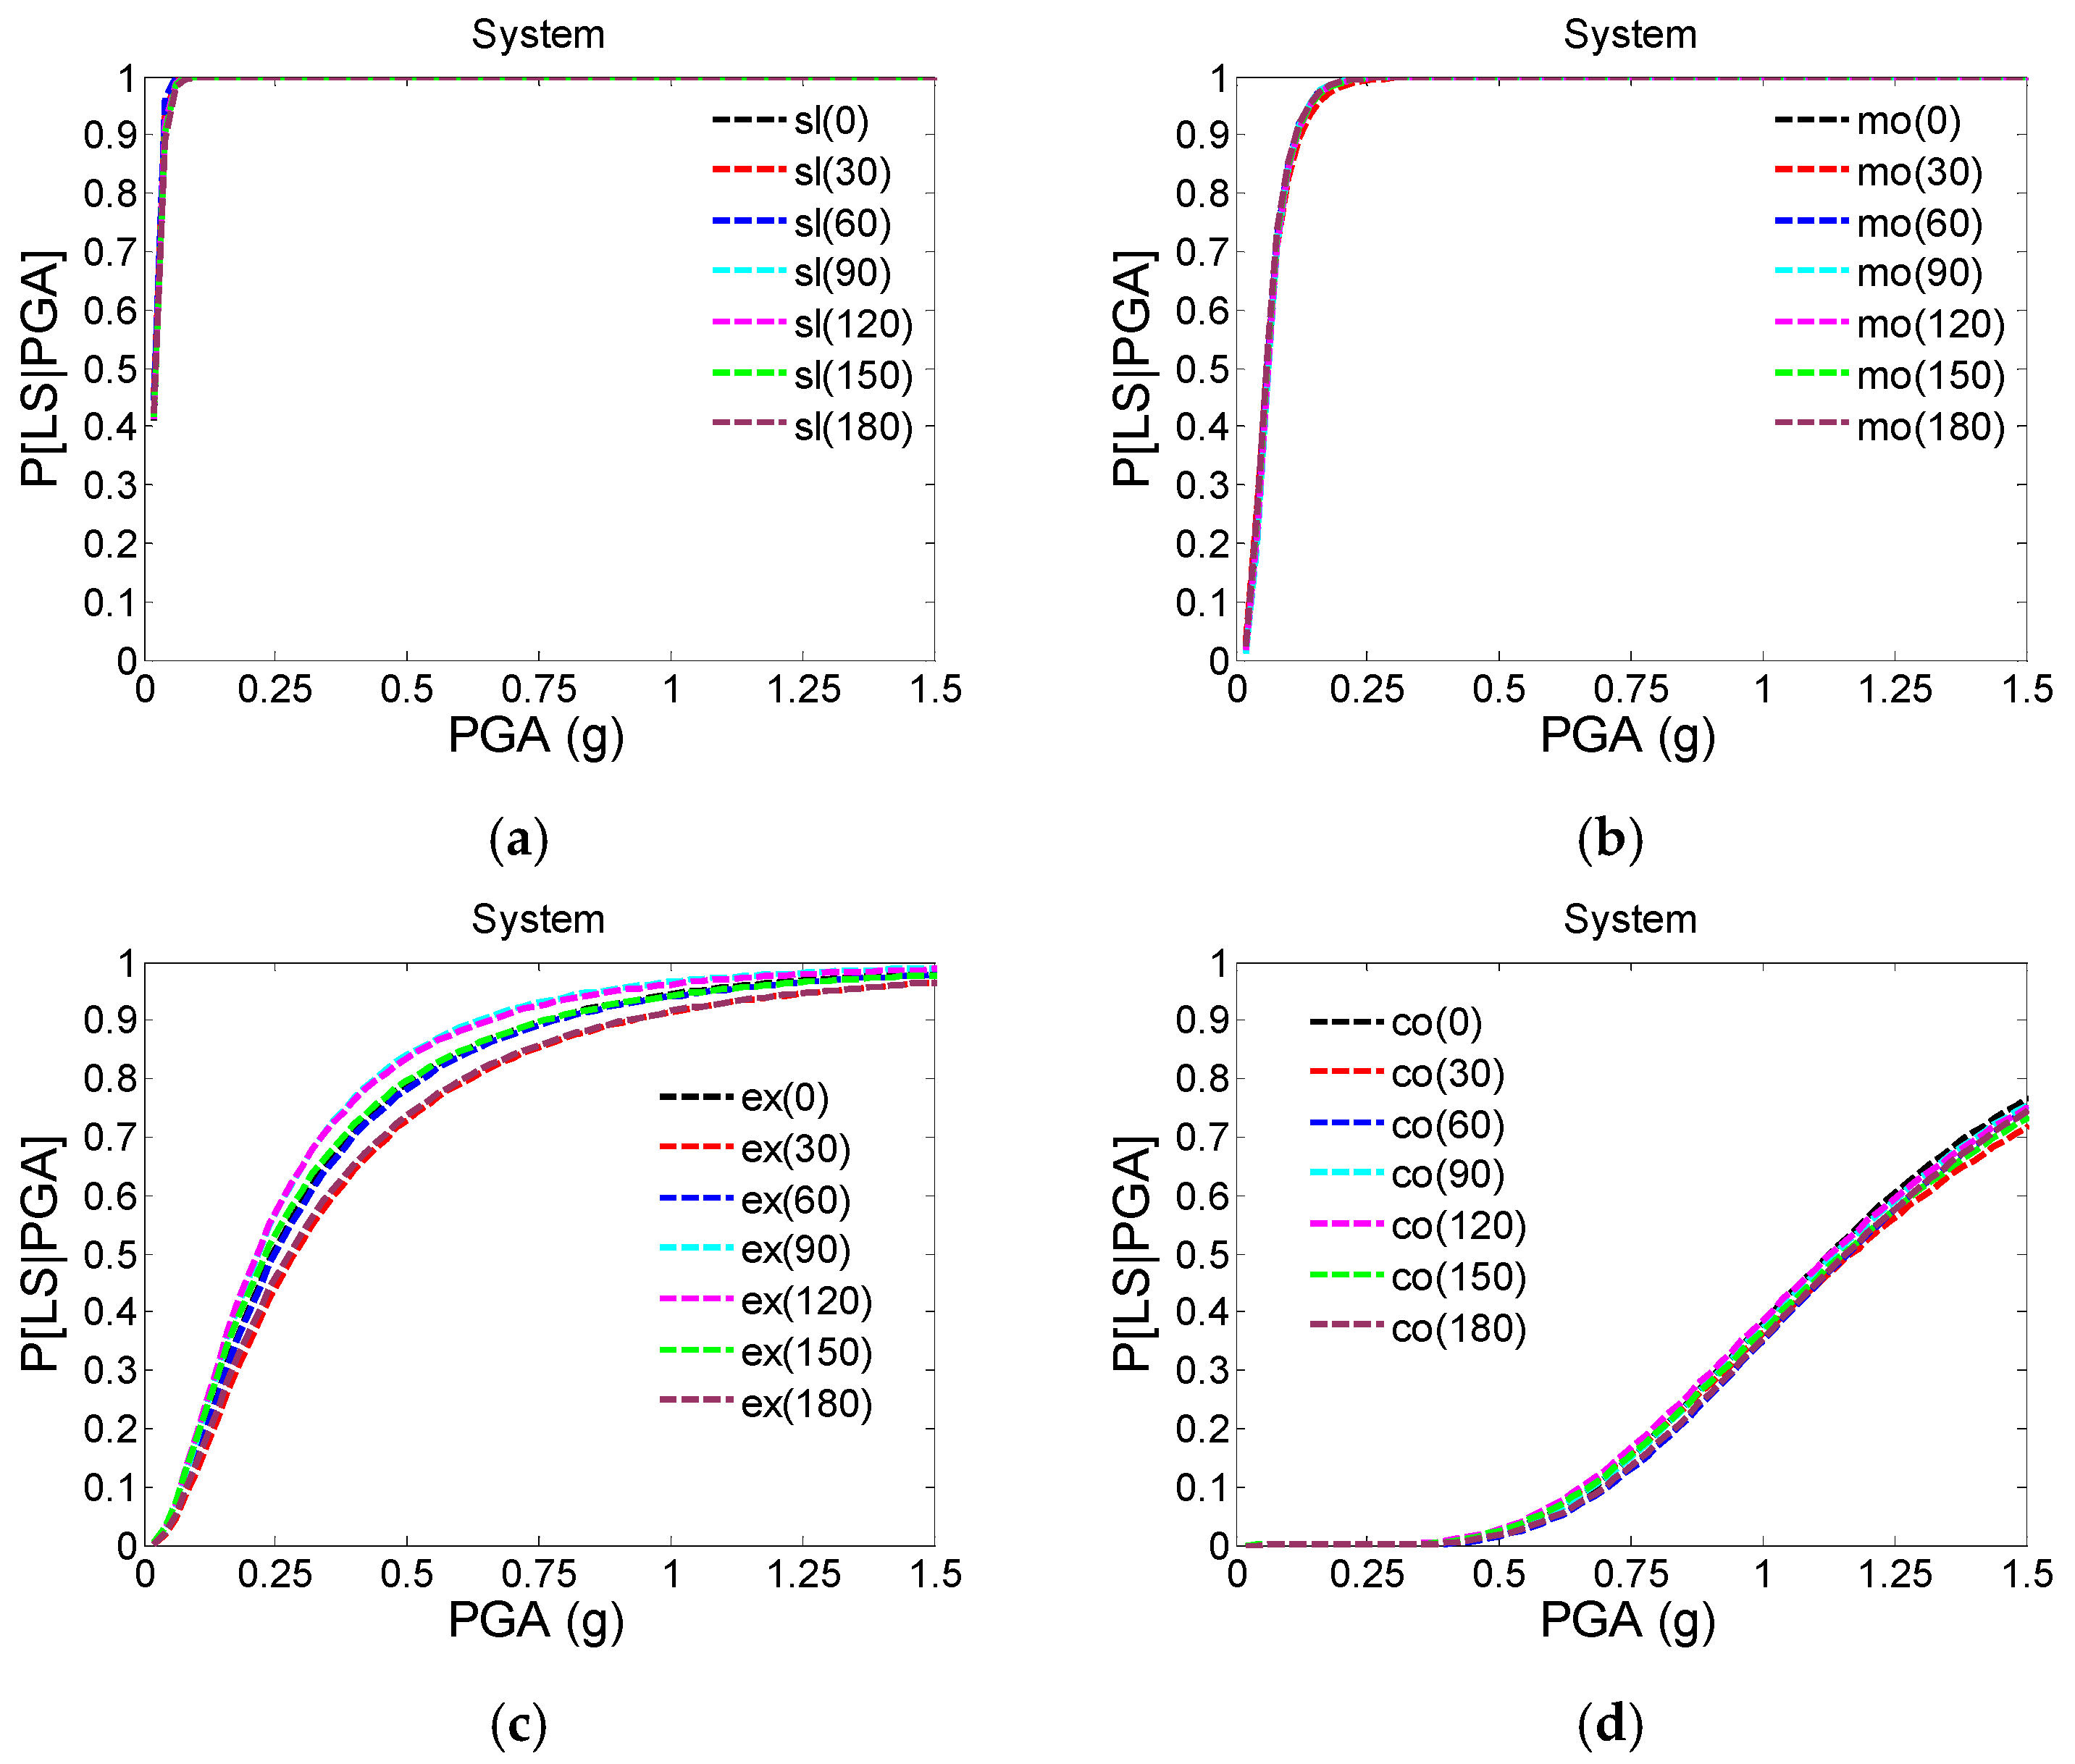
5.3. System Fragility Curves Subjected to Different Excitation Angles

As shown in Figure 13, in the slight and moderate limit states, the fragility curves of the bridge system are substantially coincident when subjected to all angles. While in the extensive and complete limit states, the bridge system has the lowest probabilities of exceeding the limit states at the excitation angle of 30 degrees, nevertheless the highest at the excitation angle of 90 degrees.

6. Fragility Comparison between Symmetric and Asymmetric Column Height Layouts

A comparison group, containing the original model with an asymmetric column height layout and an adjusted model with a symmetric column height layout, illustrated in Table 3, was created in order to investigate how the layouts of column height impact on the fragilities of the bridge system and bridge components. The modified symmetric model was performed through the same operation above. The comparative fragility analyses of the asymmetric and symmetric models subject to the excitation angle of 0 degree are discussed in the section below.
According to Figure 14a1,b1,a2,b2, the fragility curves of the bridge system for the two models basically overlap in the slight and moderate limit states. As shown in Figure 14b1–b3, the fragility curves of Hs for two models have a large difference, and the fragility for the symmetric model is far less than that for the asymmetric model.
As indicated in Figure 14a2–a4, in the moderate, extensive and complete limit states, the fragility of the column for the symmetrical model is higher than that for the asymmetric model. This is because the symmetrical model, having shorter columns, exhibits greater seismic response of columns and then leads to the higher damage risk to columns.
Based on Figure 14a3,b3, in the extensive limit state, not only is the fragility of Hs for the symmetric model far less than that for the asymmetric model, but also the fragility of the bridge system for the symmetric model is obviously less than that for the asymmetric model.
It is noteworthy from Figure 14a4,b4 that in the complete limit state, the fragility of the bridge system for the symmetrical model is higher than that for the asymmetric model, which is opposite to the extensive limit state. The reason for this phenomenon is that the impact of Hs on the fragility of the bridge system can be neglected due to the little probability of exceeding the complete limit state of Hs, so that the impact of the column on the fragility of the bridge system is dominant.
As shown in Figure 15, compared with the original model, the higher fragility of the column in the symmetric model explained above, indicates the longitudinal reinforcements in columns for symmetric model have more probabilities to yield, which causes the degradation of longitudinal stiffness of the bridge sequentially aggravates the longitudinal damage of abutment, consequently gives rise to the higher fragility of Abss for the symmetric model.

7. Conclusions

The fragility of a common type of bridge in the United States—the multi-frame box-girder bridge—is addressed in this study. The problems that have not been studied extensively, including the relationship between seismic excitation angles and bridge fragilities, as well as the relationship between column height layouts and bridge fragilities, are investigated further. The refined example bridge model is established, meanwhile the hinges and the internal limiting devices are simulated through the elastic-plastic materials and elements. The most favorable excitation angle and the most unfavorable excitation angle to bridge fragilities are extracted, and the symmetric column height layout is advised in design to reduce fragilities. The conclusion can be used to rapidly judge the potential damage position and damage degree of bridge components after monitoring the seismic excitation angle.
A suite of 48 artificial ground motions, along with seven different seismic excitation angles, are input to develop corresponding fragility curves to components and bridge system so that a total of 336 time history analyses have been carried out. Through fragility analyses, further conclusions are summarized as follows: columns feature the least seismic failure probabilities at the excitation angle of 30 degrees. Abutment bearings feature the least seismic failure probabilities at the excitation angle of 30 degrees, whereas the largest at the excitation angle of 90 degrees. Hinge restrainers exhibit the least seismic failure probabilities at the excitation angle of 180 degrees, whereas the largest at the excitation angle of 90 degrees. Plug-type concrete elements in hinge exhibit the least seismic failure probabilities at the excitation angle of 60 degrees, whereas the largest at the excitation angle of 180 degrees. Abutment passive performance exhibits the least seismic failure probability at the excitation angle of 0 and 60 degrees, whereas the largest at the excitation angle of 150 degrees. Abutment transverse response features the least seismic failure probability at the excitation angle of 30 degrees. Overall, the bridge system exhibits the least seismic failure probability at the excitation angle of 30 degrees, whereas the largest at the excitation angle of 90 degrees.
Through the comparison of fragility analyses between the models having asymmetric column height layout and symmetric column height layout, key findings can be summarized as follows: Across all four limit states, the bridge having a symmetric column height layout exhibits intensely low fragilities on hinge restrainers as compared with the asymmetric one, which demonstrates symmetric column height layout can intensely reduce the failure probabilities of hinge restrainers and improve the anti-seismic ability for the whole bridge. During bridge design, the symmetric shape of structure should be selected as far as possible to reduce the damage of hinge joints as long as the terrain condition is satisfied.
The maximum damage of bridge components corresponding to different excitation angles is investigated in this study. Subsequently, the local most vulnerable direction to each component subjected to the unfavorable seismic excitation angle should be investigated further. The local retrofit design to components could be carried out according to the local most vulnerable direction in order to reduce the probability of local damage to bridge components under specific seismic excitation angles, as well as lower the fragility of new designed bridges.

Author Contributions

Conceptualization, T.W. and L.Z.; methodology, T.W. and L.Z.; software, T.W. and L.W.; validation, T.W., L.Y. and S.L.; formal analysis, T.W. and G.F.; investigation, T.W. and J.W.; resources, T.W. and S.Z.; writing—original draft preparation, T.W.; writing—review and editing, T.W. and S.L.; visualization, T.W. and S.L.; supervision, S.L.; project administration, T.W. and S.L.; funding acquisition, S.L. All authors have read and agreed to the published version of the manuscript.

Funding

This research was funded by (1) the Basic Research Expense Project of Heilongjiang Provincial Universities (Grant no. 2020-KYYWF-1039); (2) Heilongjiang Provincial Natural Science Foundation of China (No. TD2021F001); (3) Heilongjiang Provincial Key Research and Development Projects of China (No. GZ20210029) and (4) National Natural Science Foundation of China (Nos. 11774081 and 12104114).

Institutional Review Board Statement

Not applicable.

Informed Consent Statement

Not applicable.

Data Availability Statement:

The data used to support the findings of this study are available from the corresponding author upon request.

Conflicts of Interest

The authors declare no conflict of interest.

Appendix A. Fragility Surfaces

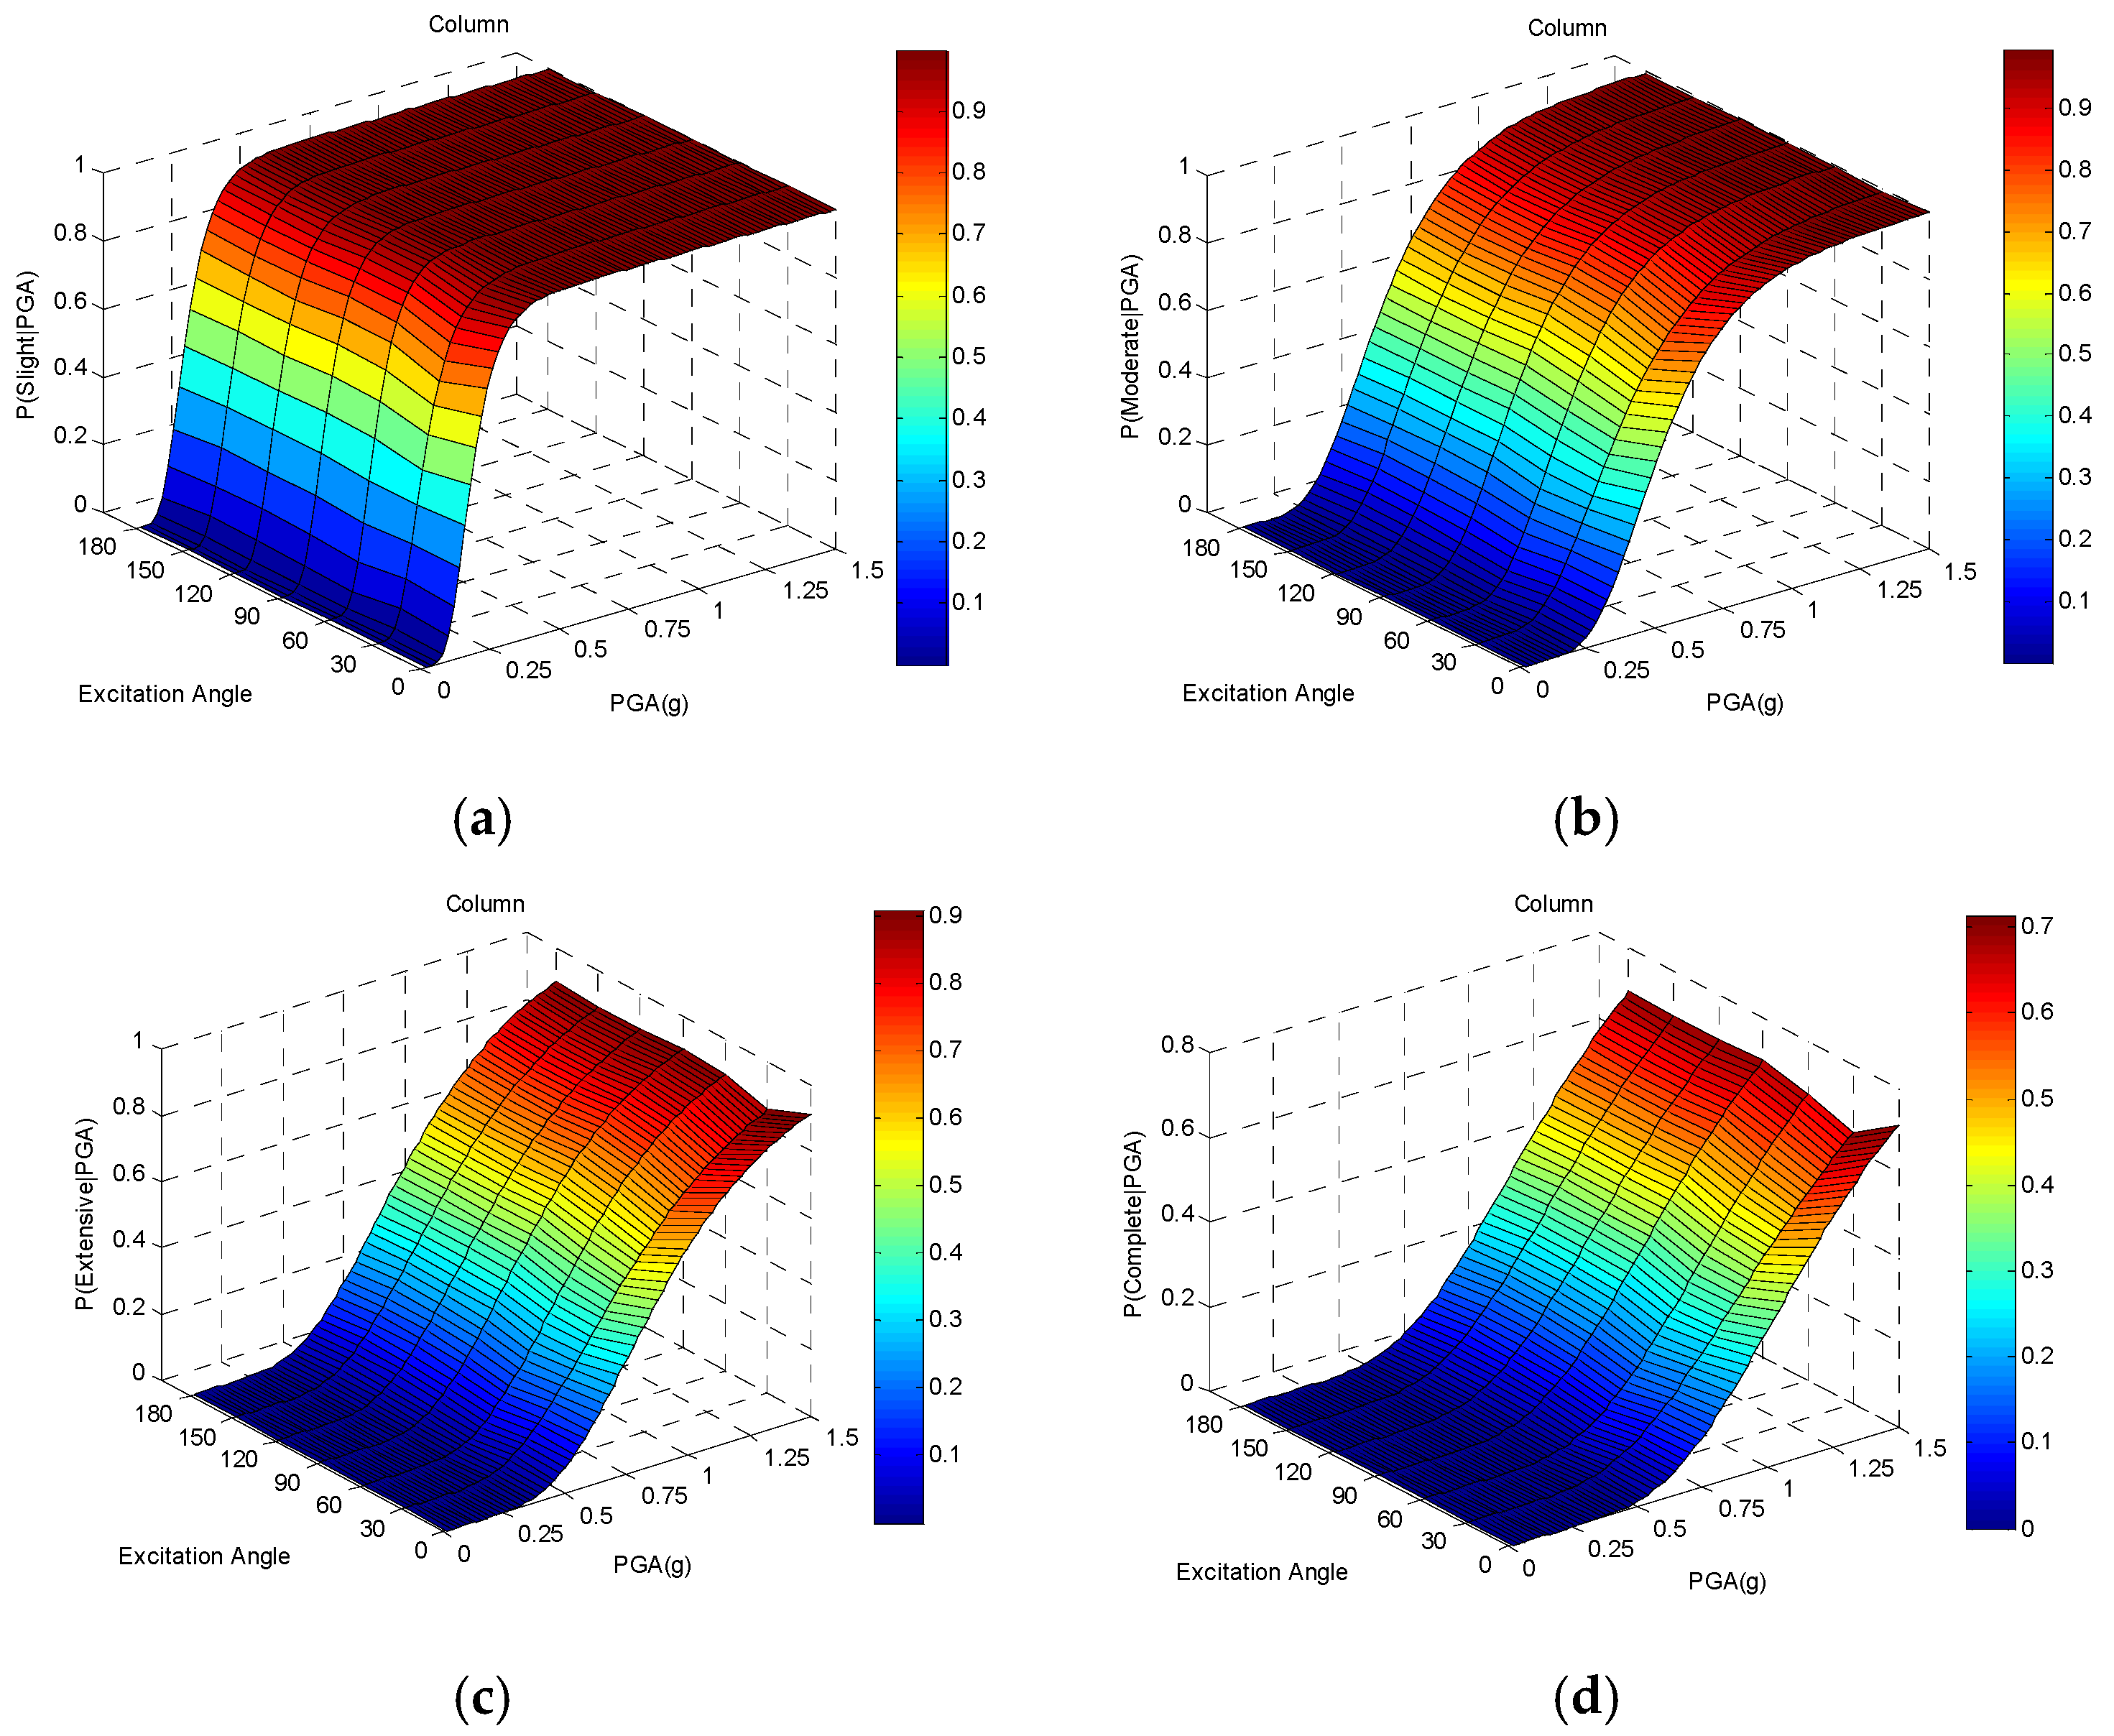
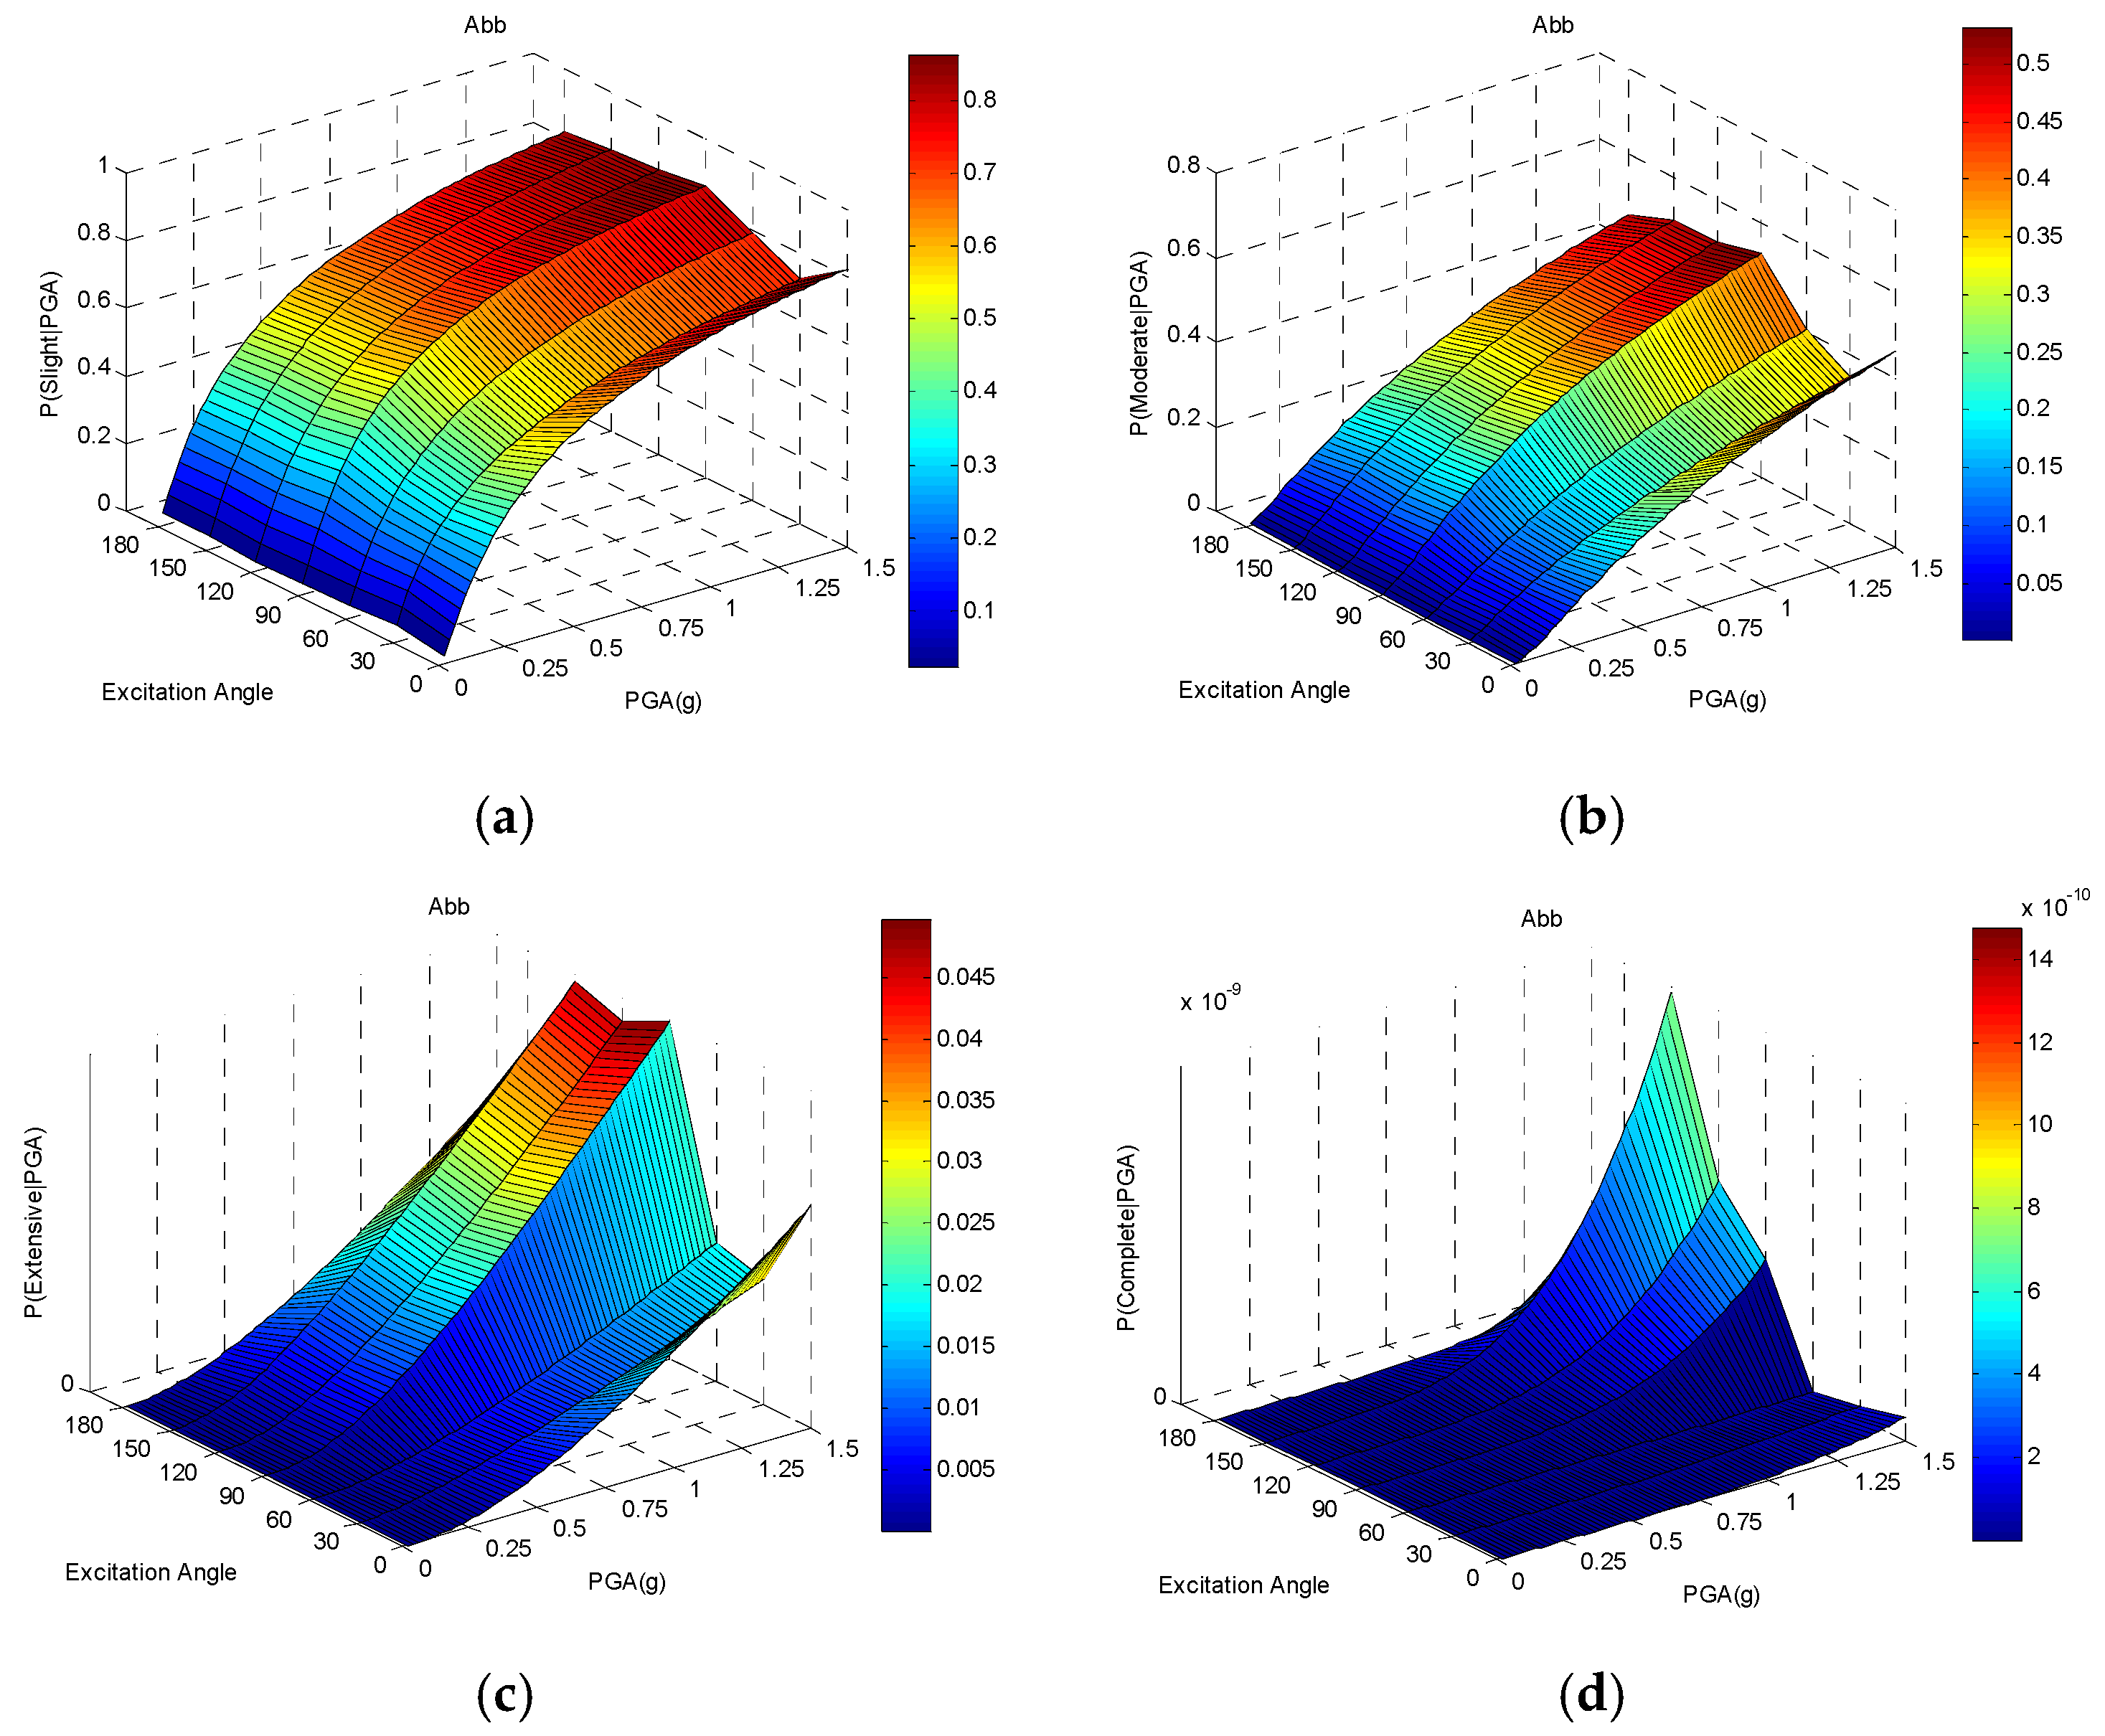
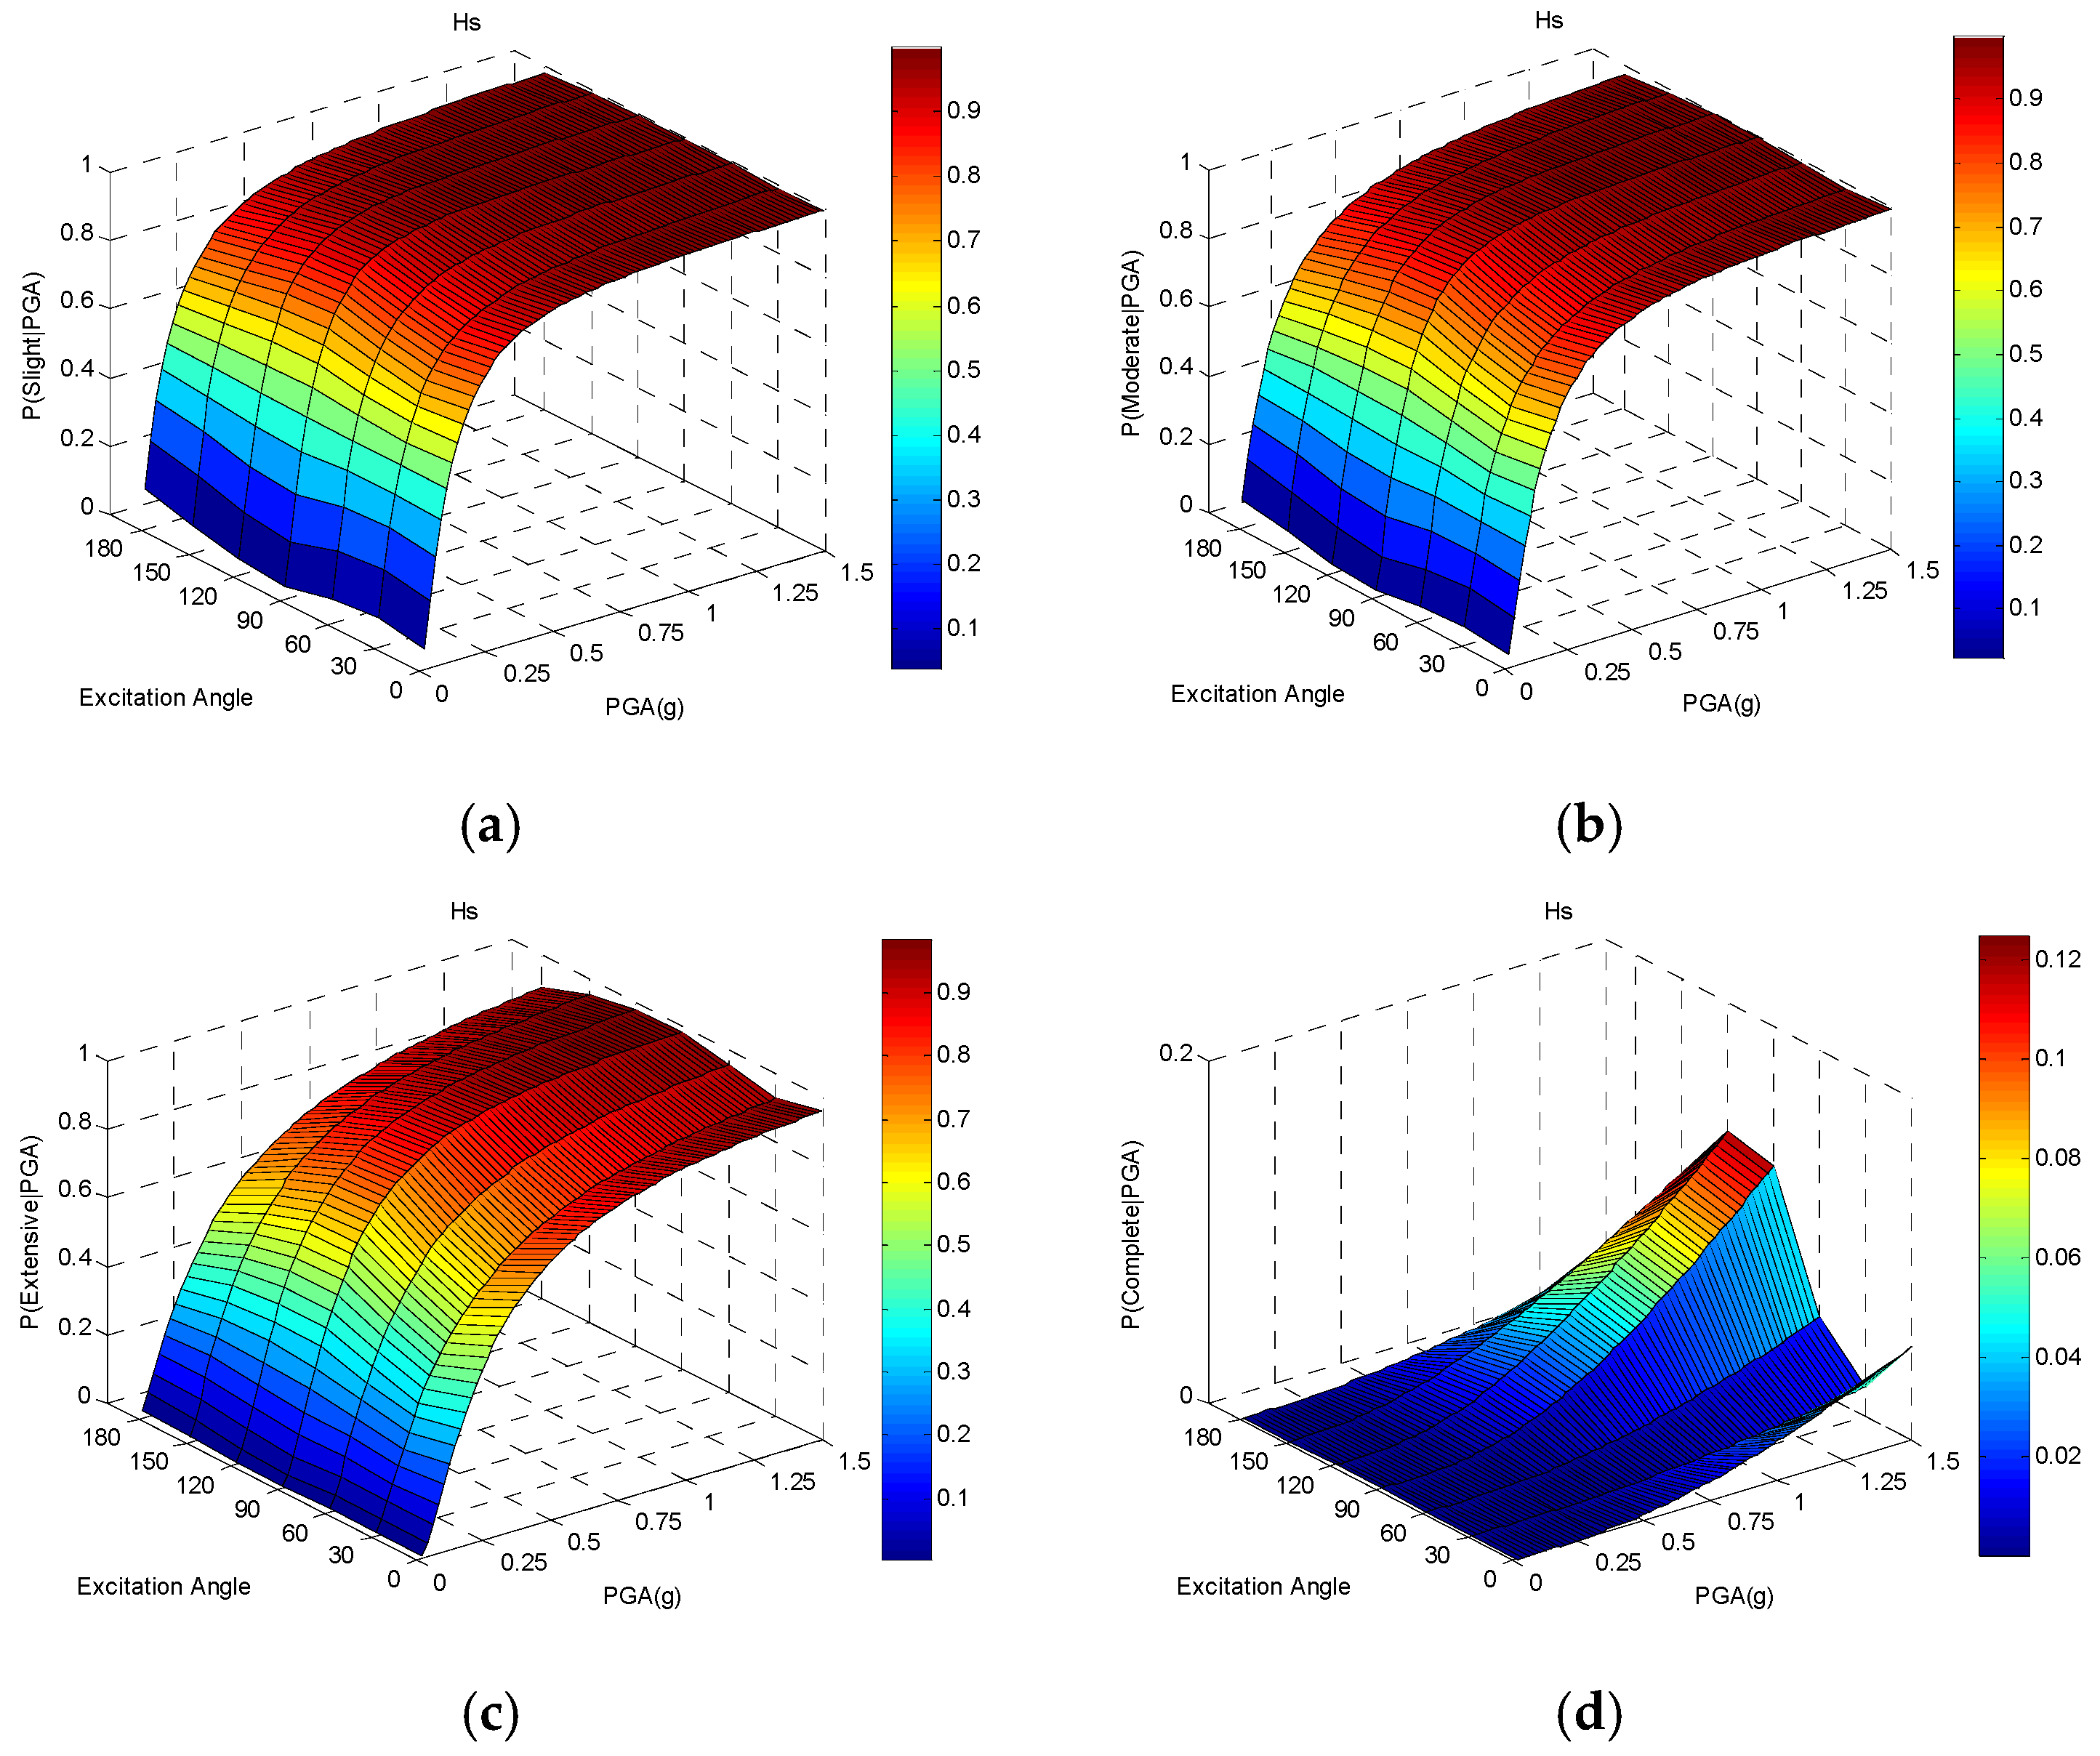
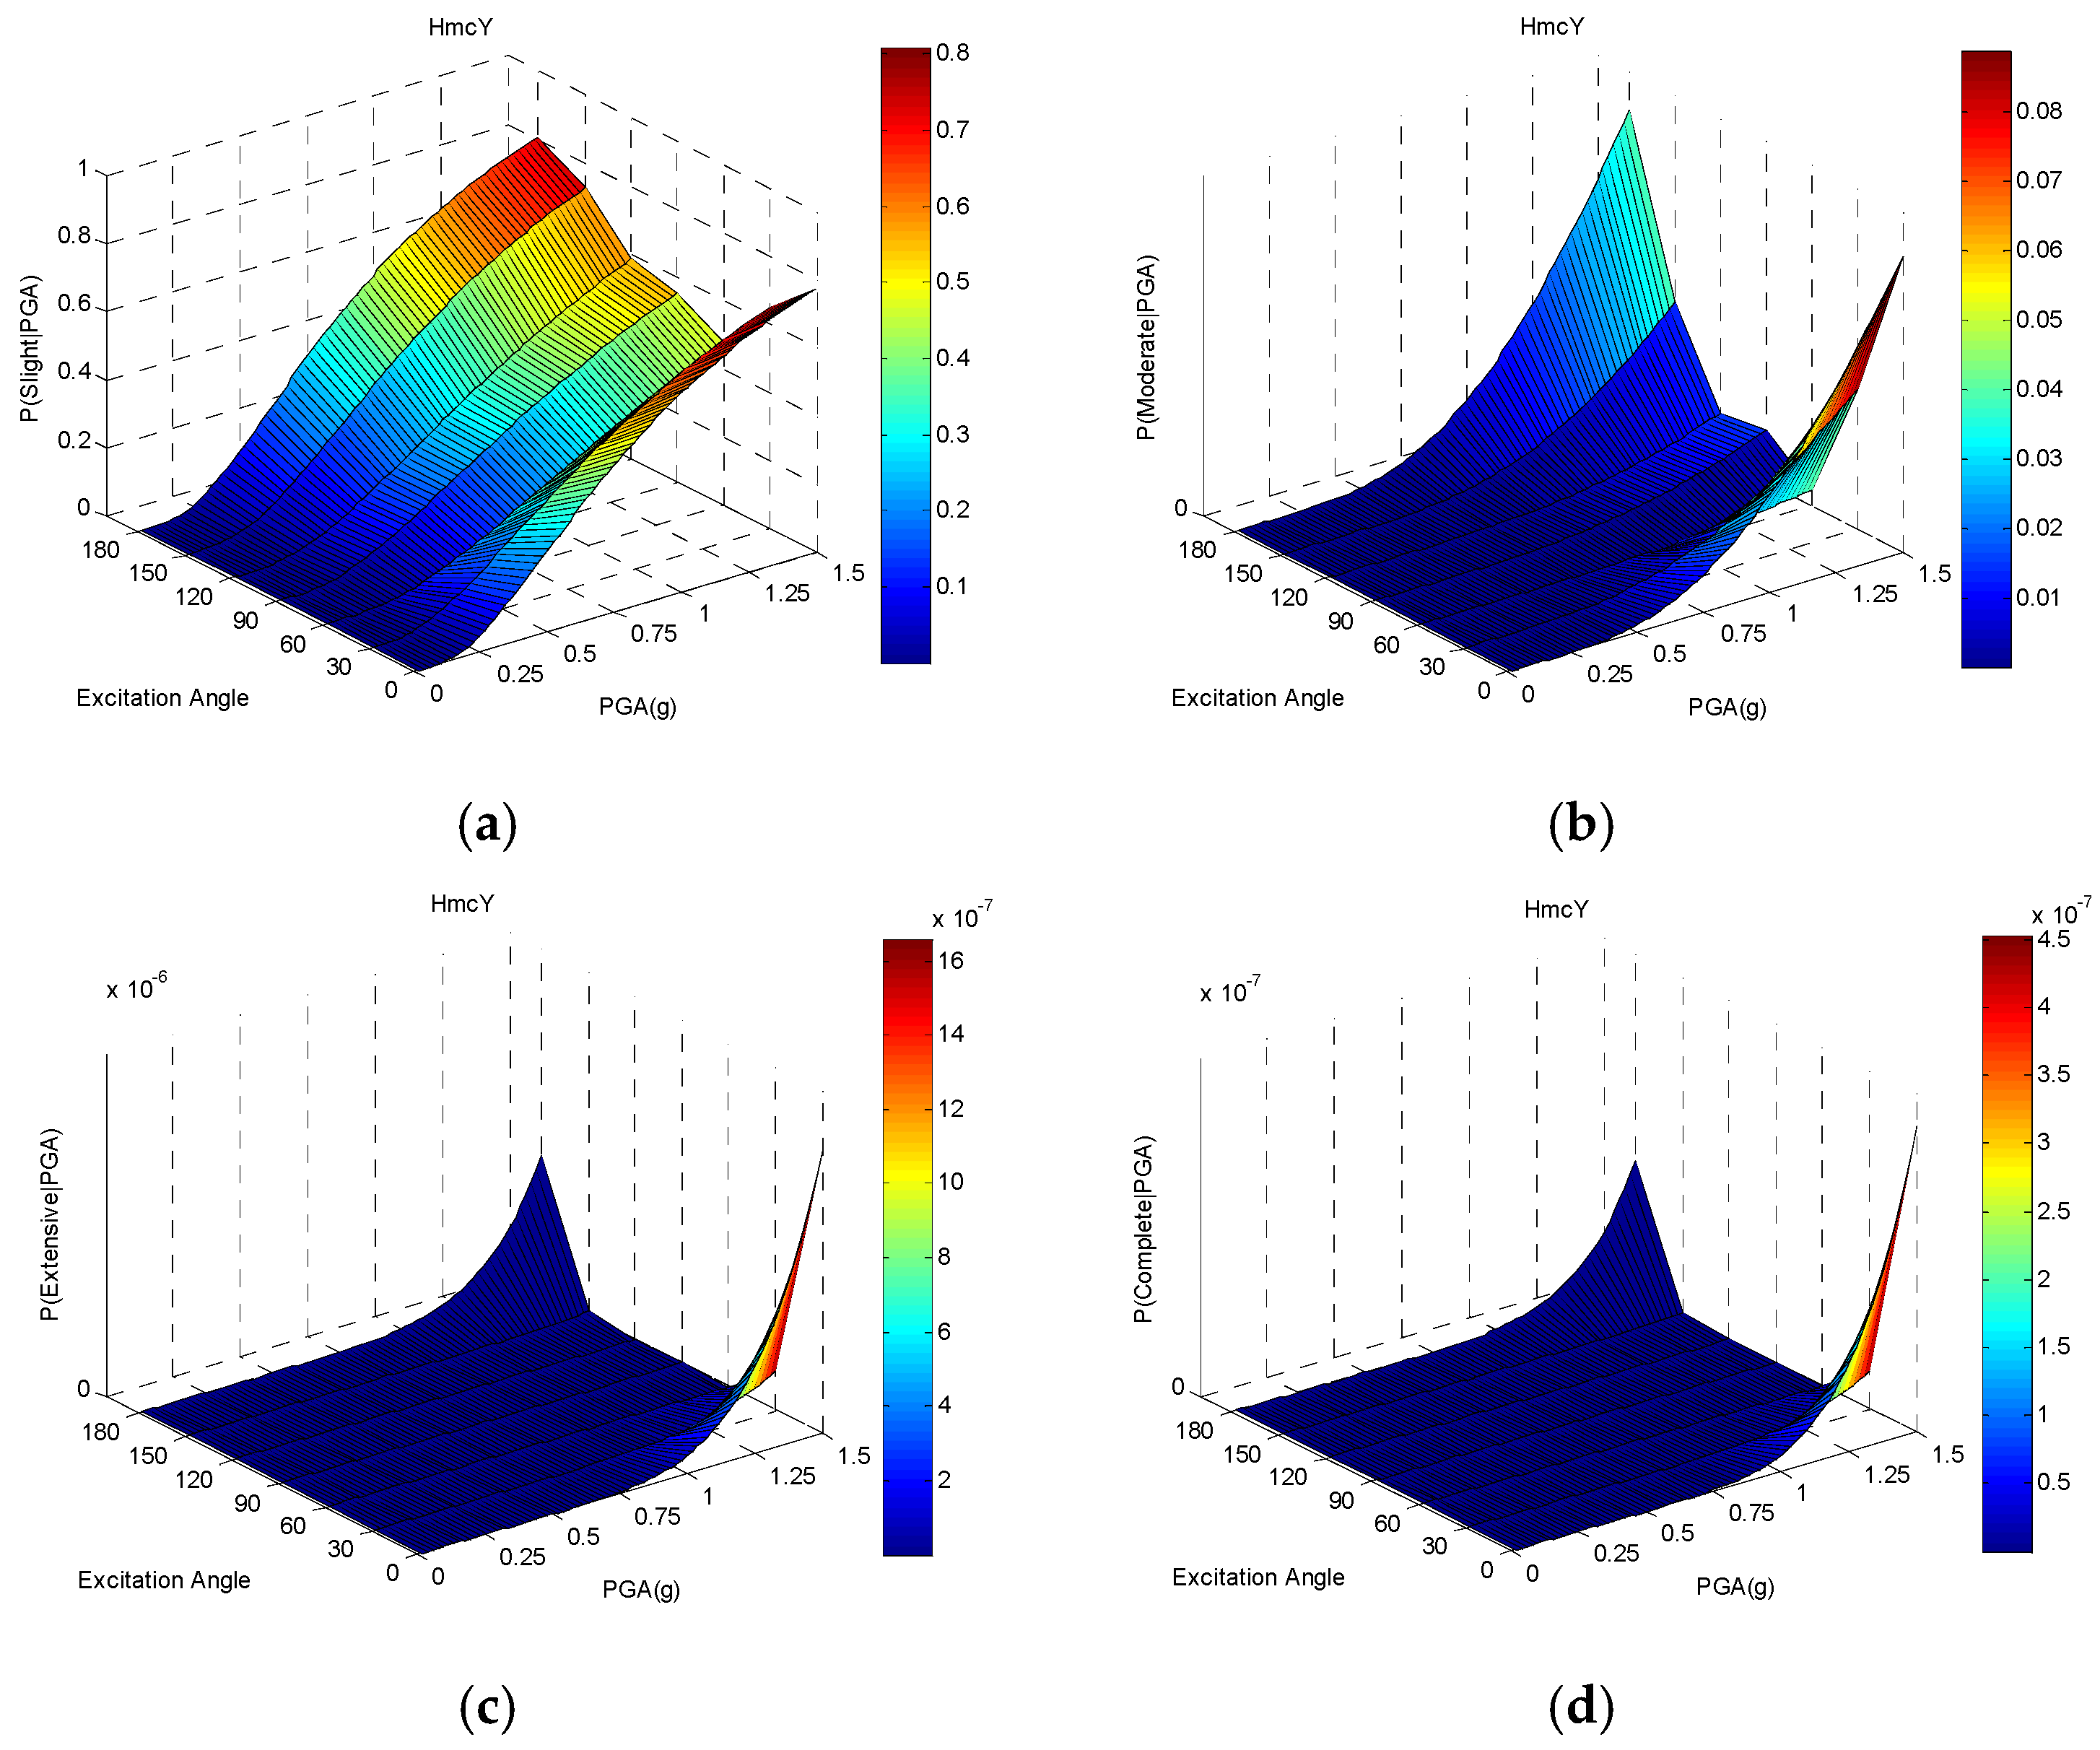
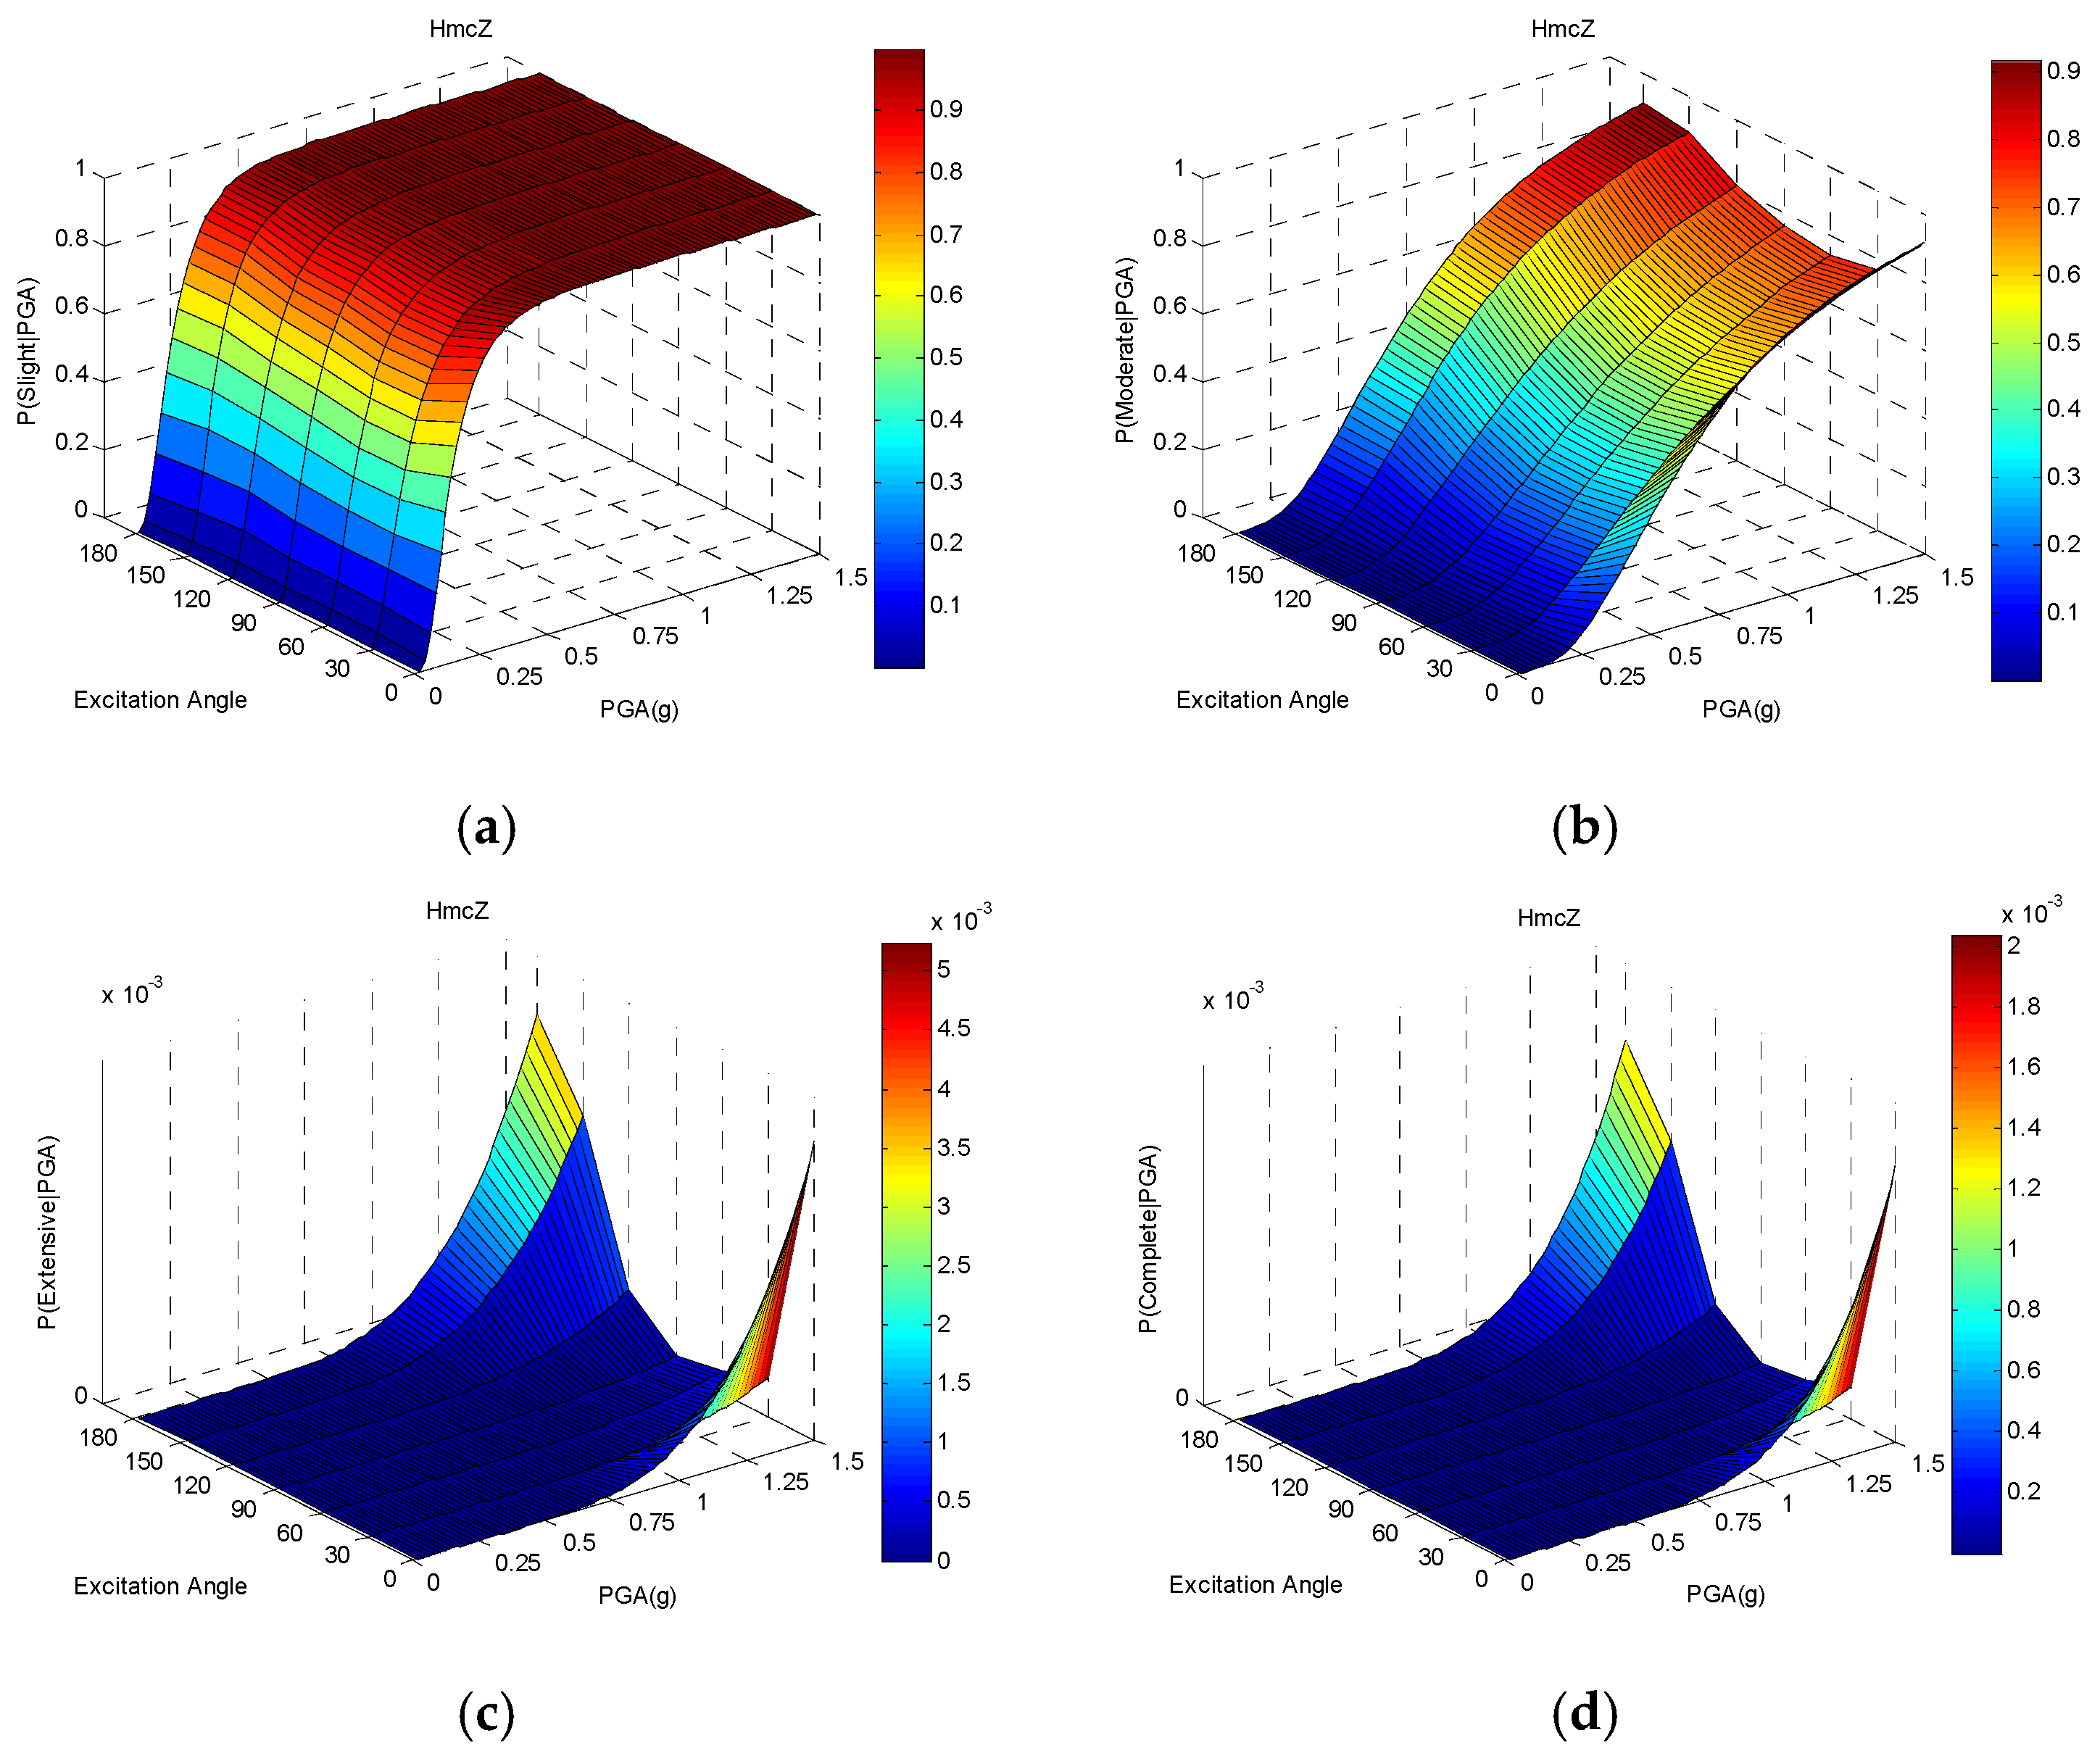
Appendix A.1. Primary Component Fragility Surfaces Subjected to Different Excitation Angles

Figure A1. Seismic fragility surfaces of Column subjected to different excitation angles in the (a) slight; (b) moderate; (c) extensive; and (d) complete limit states.
Buildings 12 00387 g0a1
Figure A2. Seismic fragility surfaces of Abb subjected to different excitation angles in the (a) slight; (b) moderate; (c) extensive; and (d) complete limit states.
Buildings 12 00387 g0a2
Figure A3. Seismic fragility surfaces of Hs subjected to different excitation angles in the (a) slight; (b) moderate; (c) extensive; and (d) complete limit states.
Buildings 12 00387 g0a3
Figure A4. Seismic fragility surfaces of HmcY subjected to different excitation angles in the (a) slight; (b) moderate; (c) extensive; and (d) complete limit states.
Buildings 12 00387 g0a4
Figure A5. Seismic fragility surfaces of HmcZ subjected to different excitation angles in the (a)slight; (b) moderate; (c) extensive; and (d) complete limit states.
Buildings 12 00387 g0a5

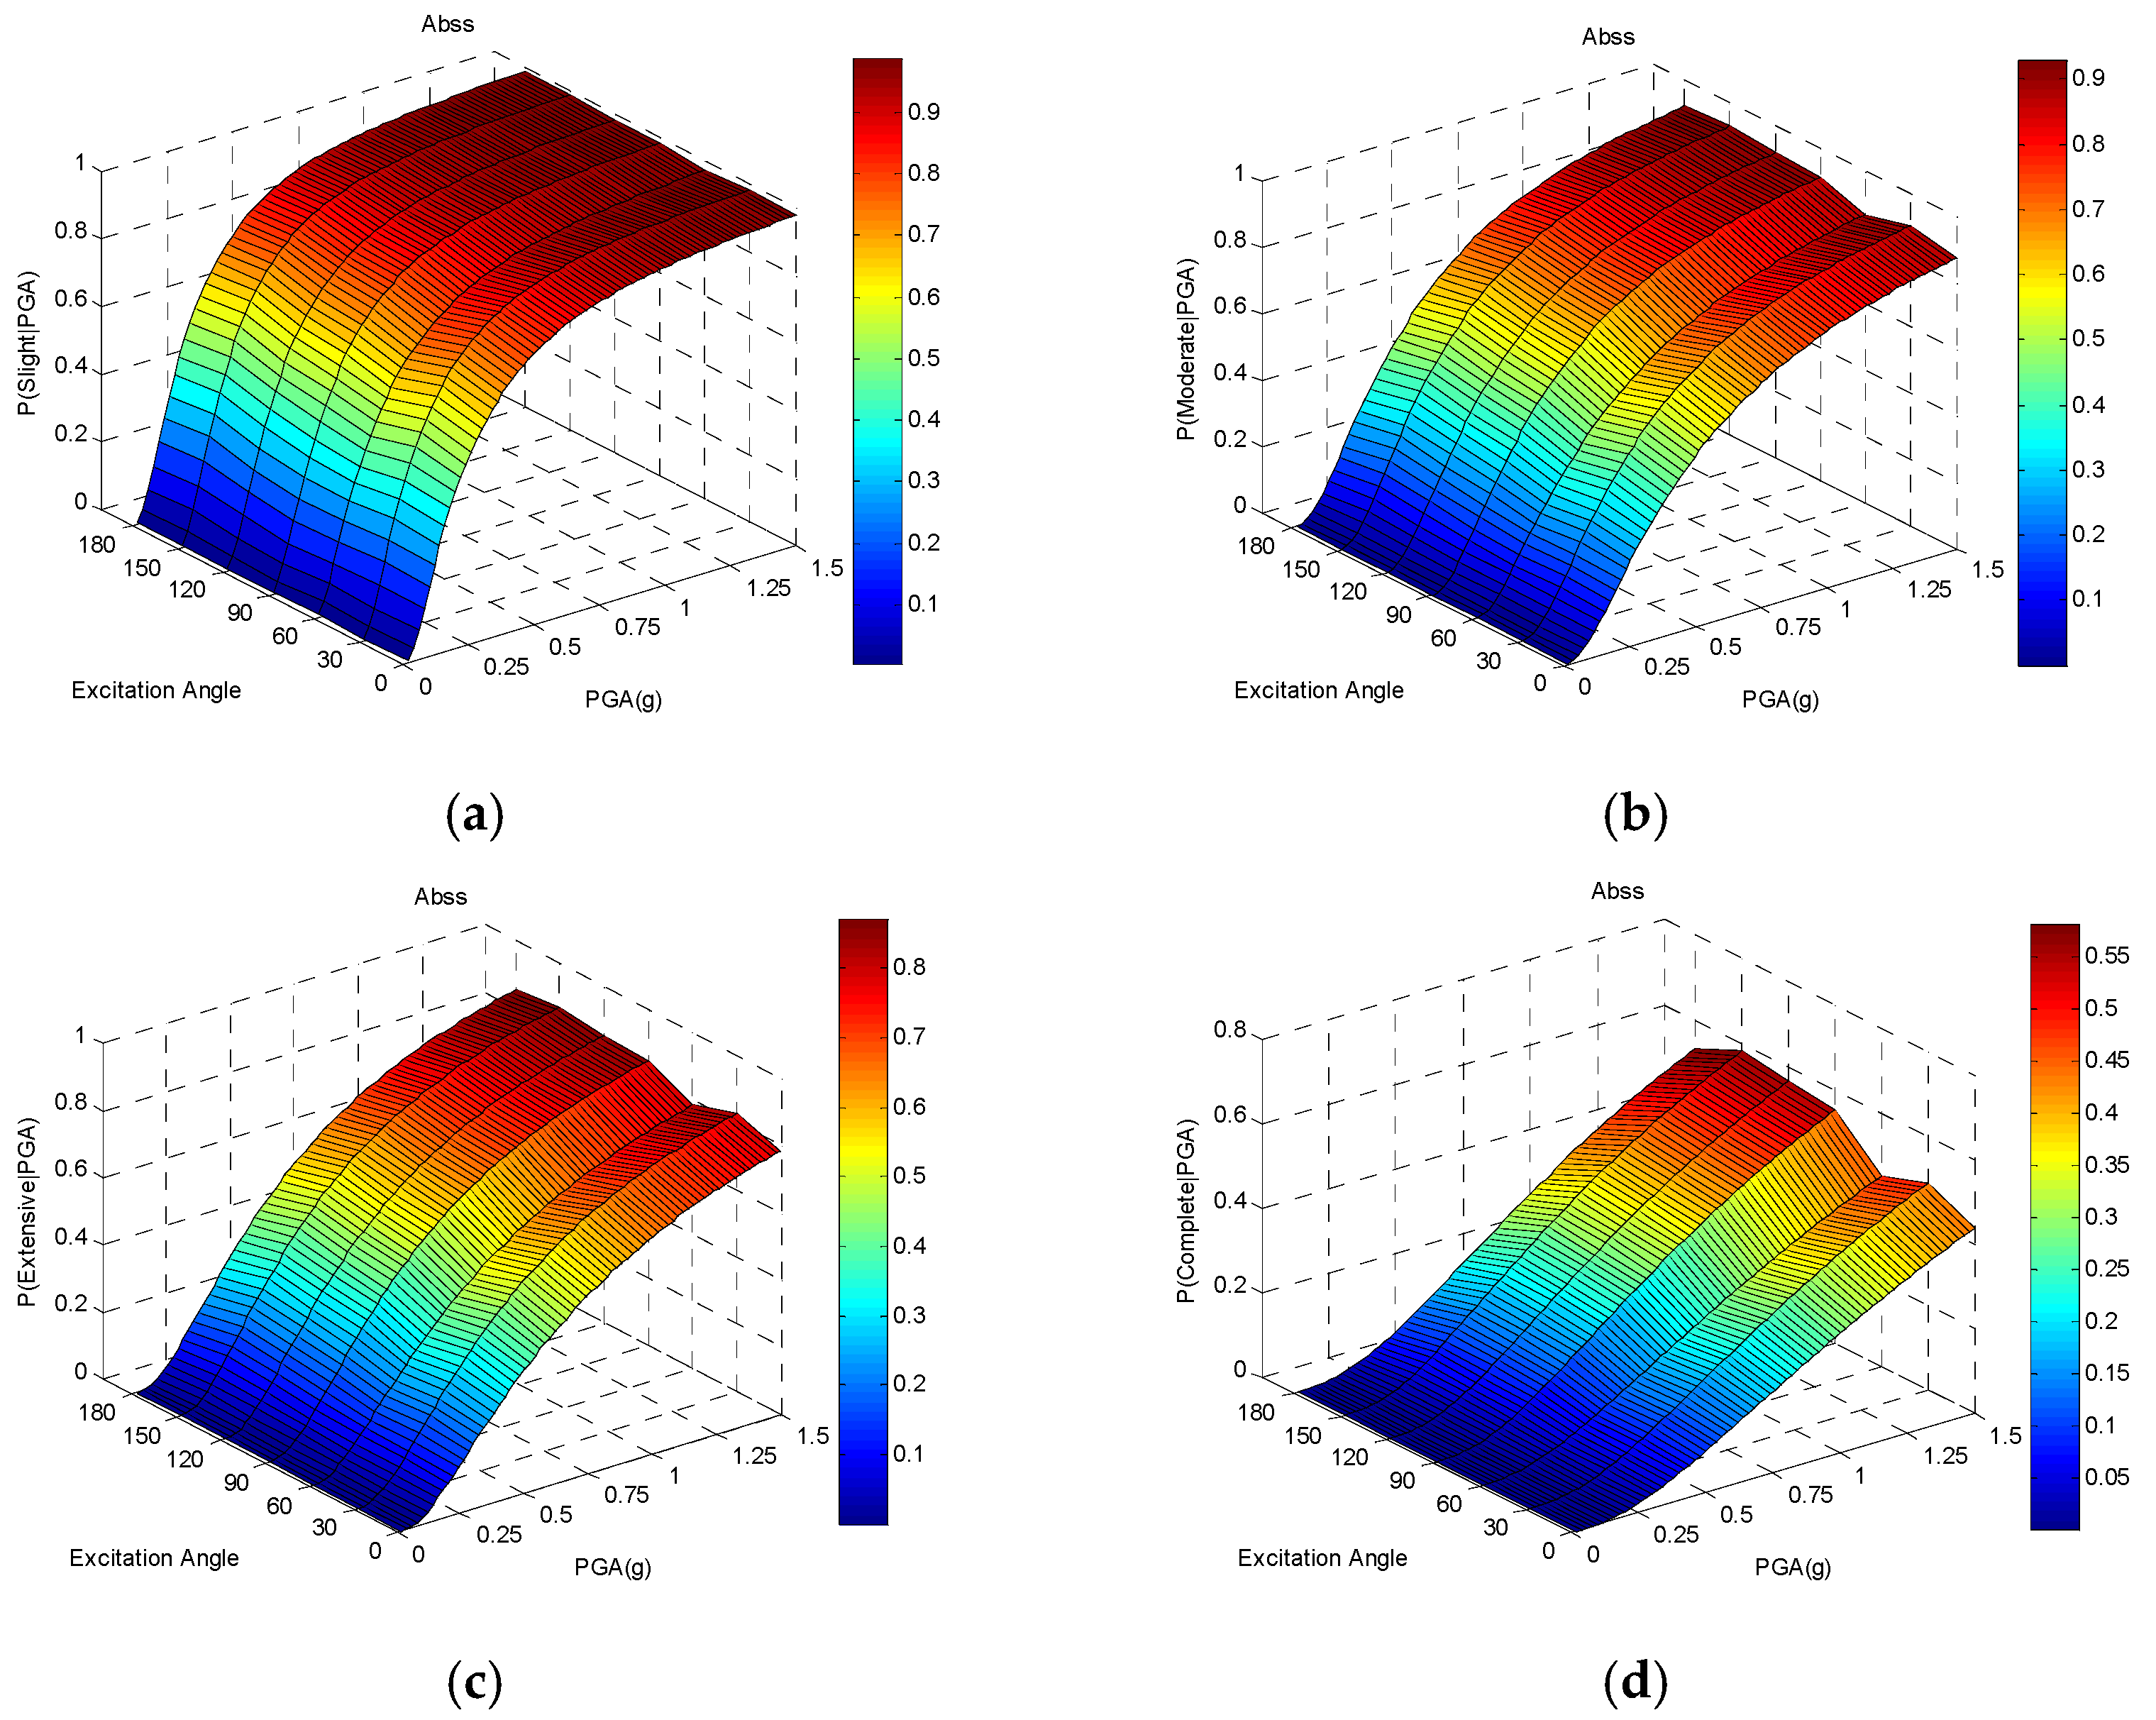
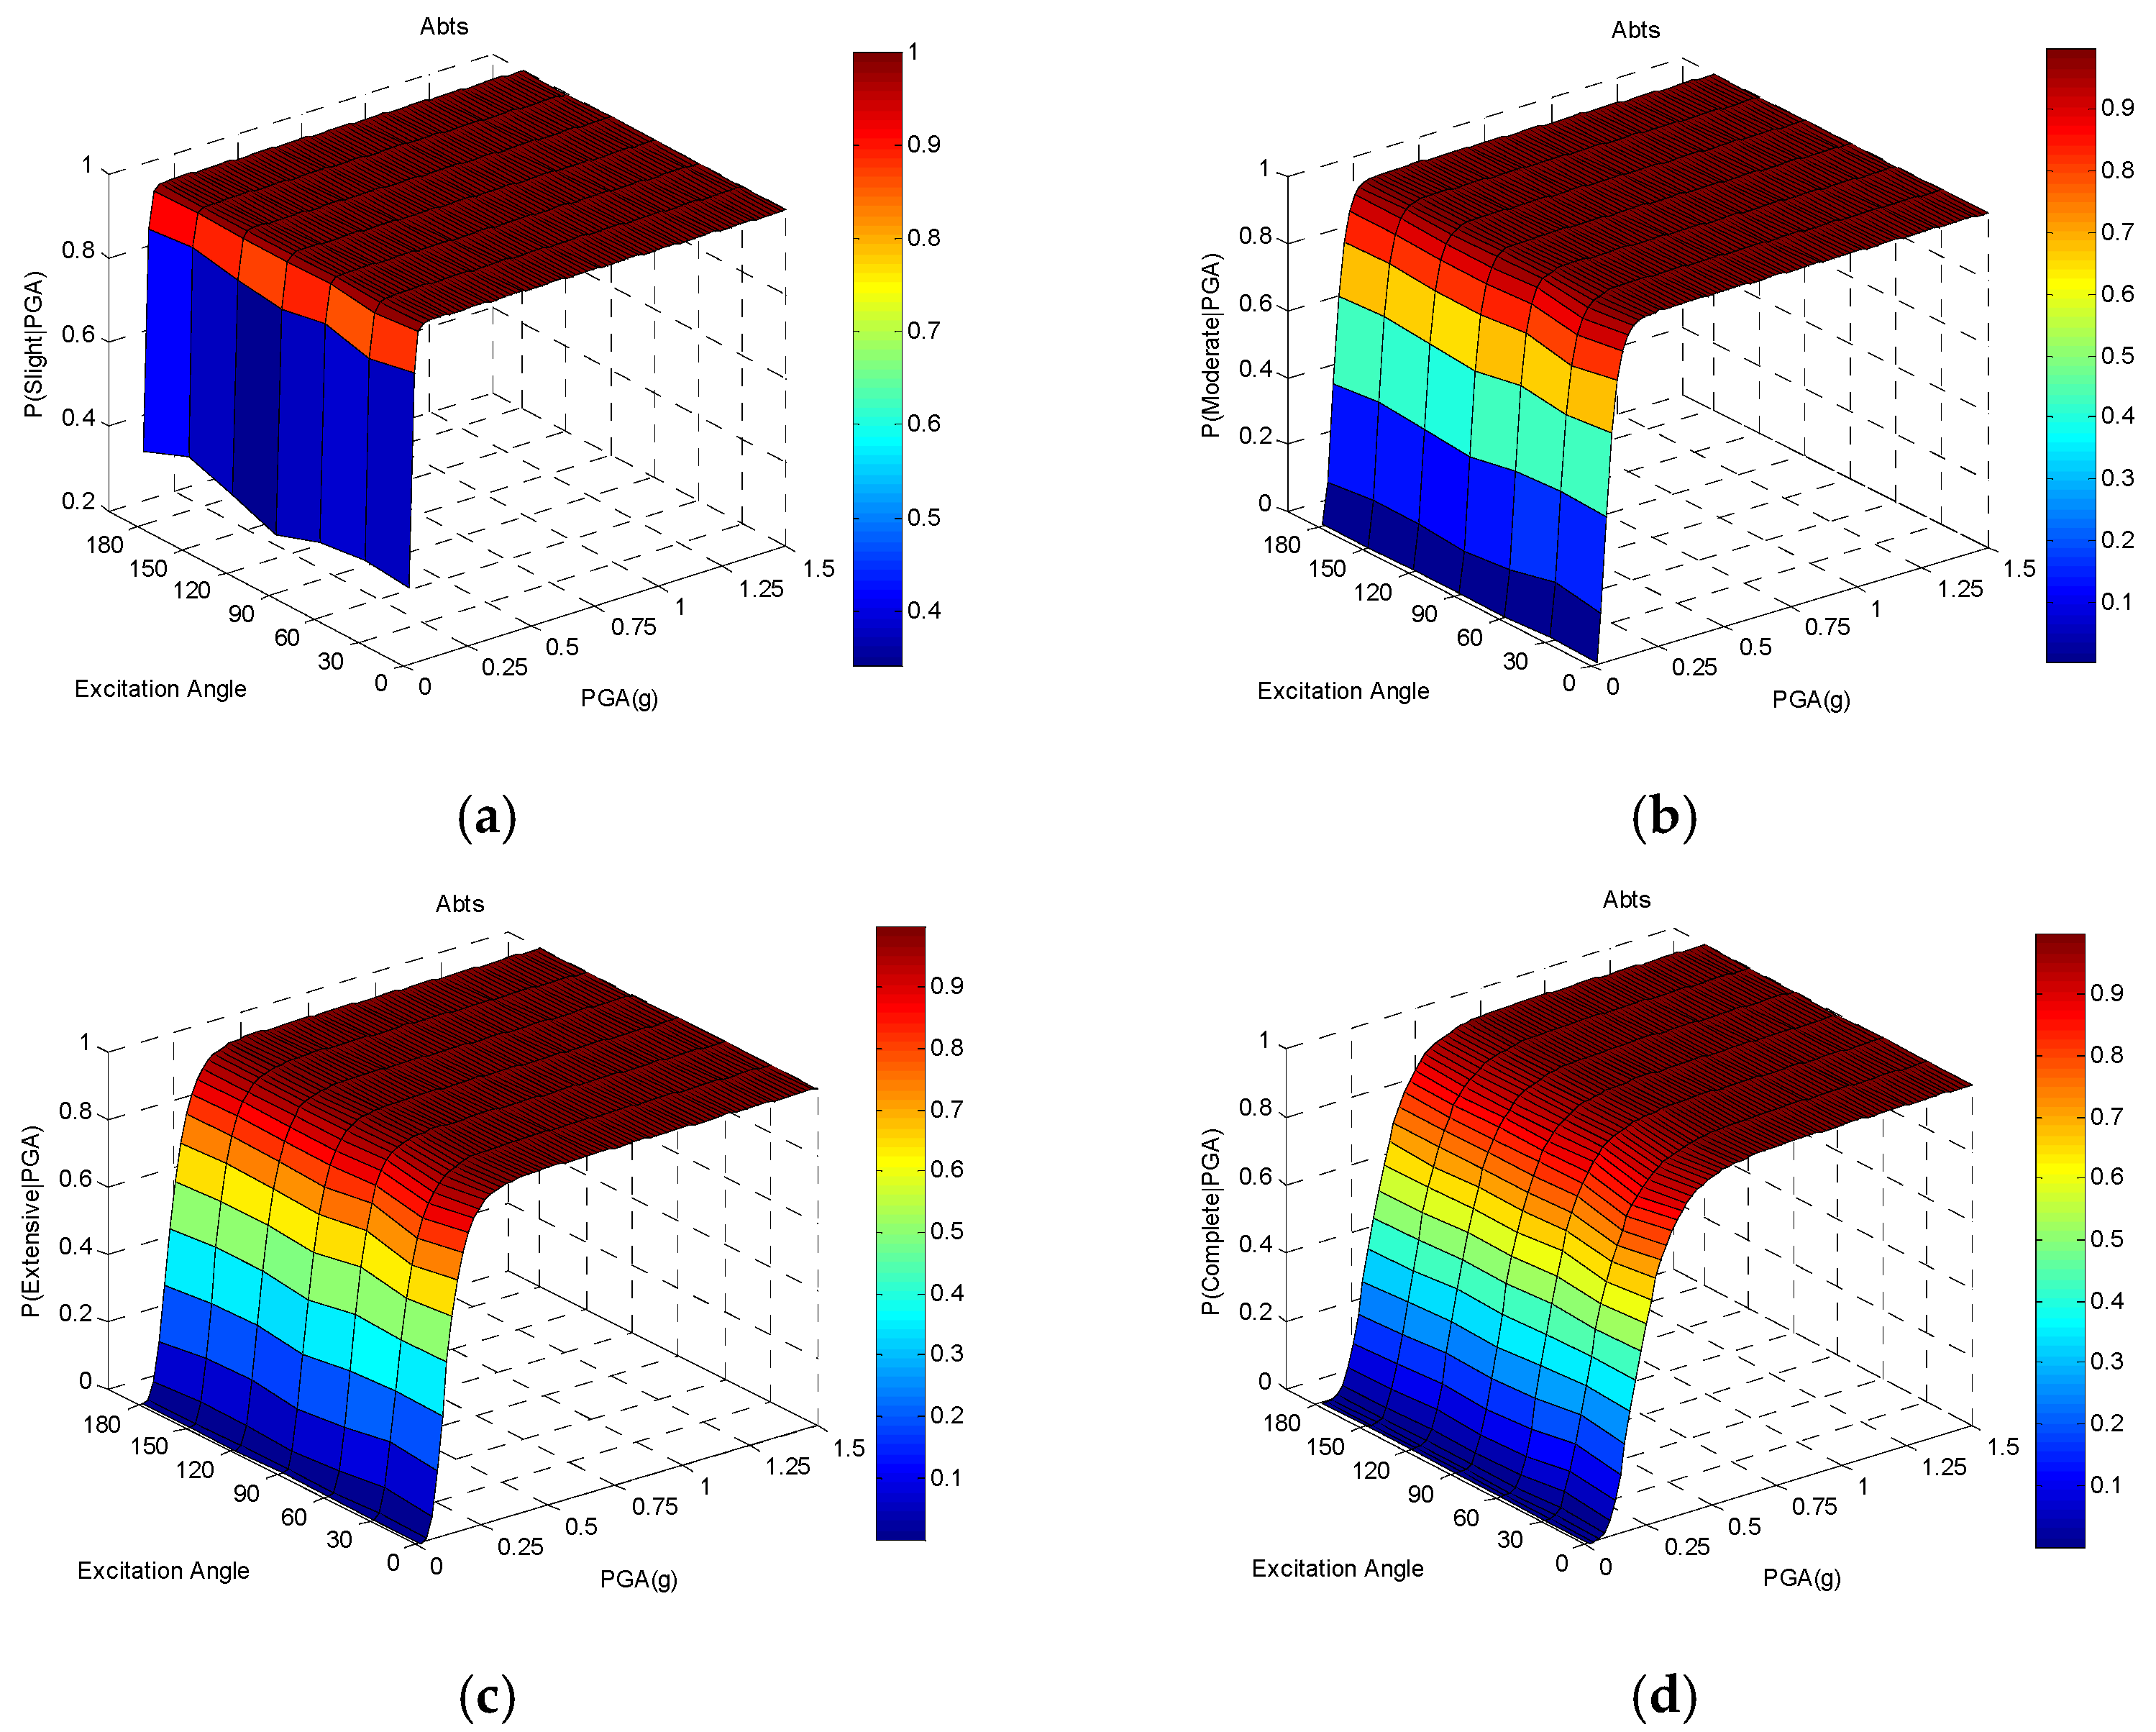
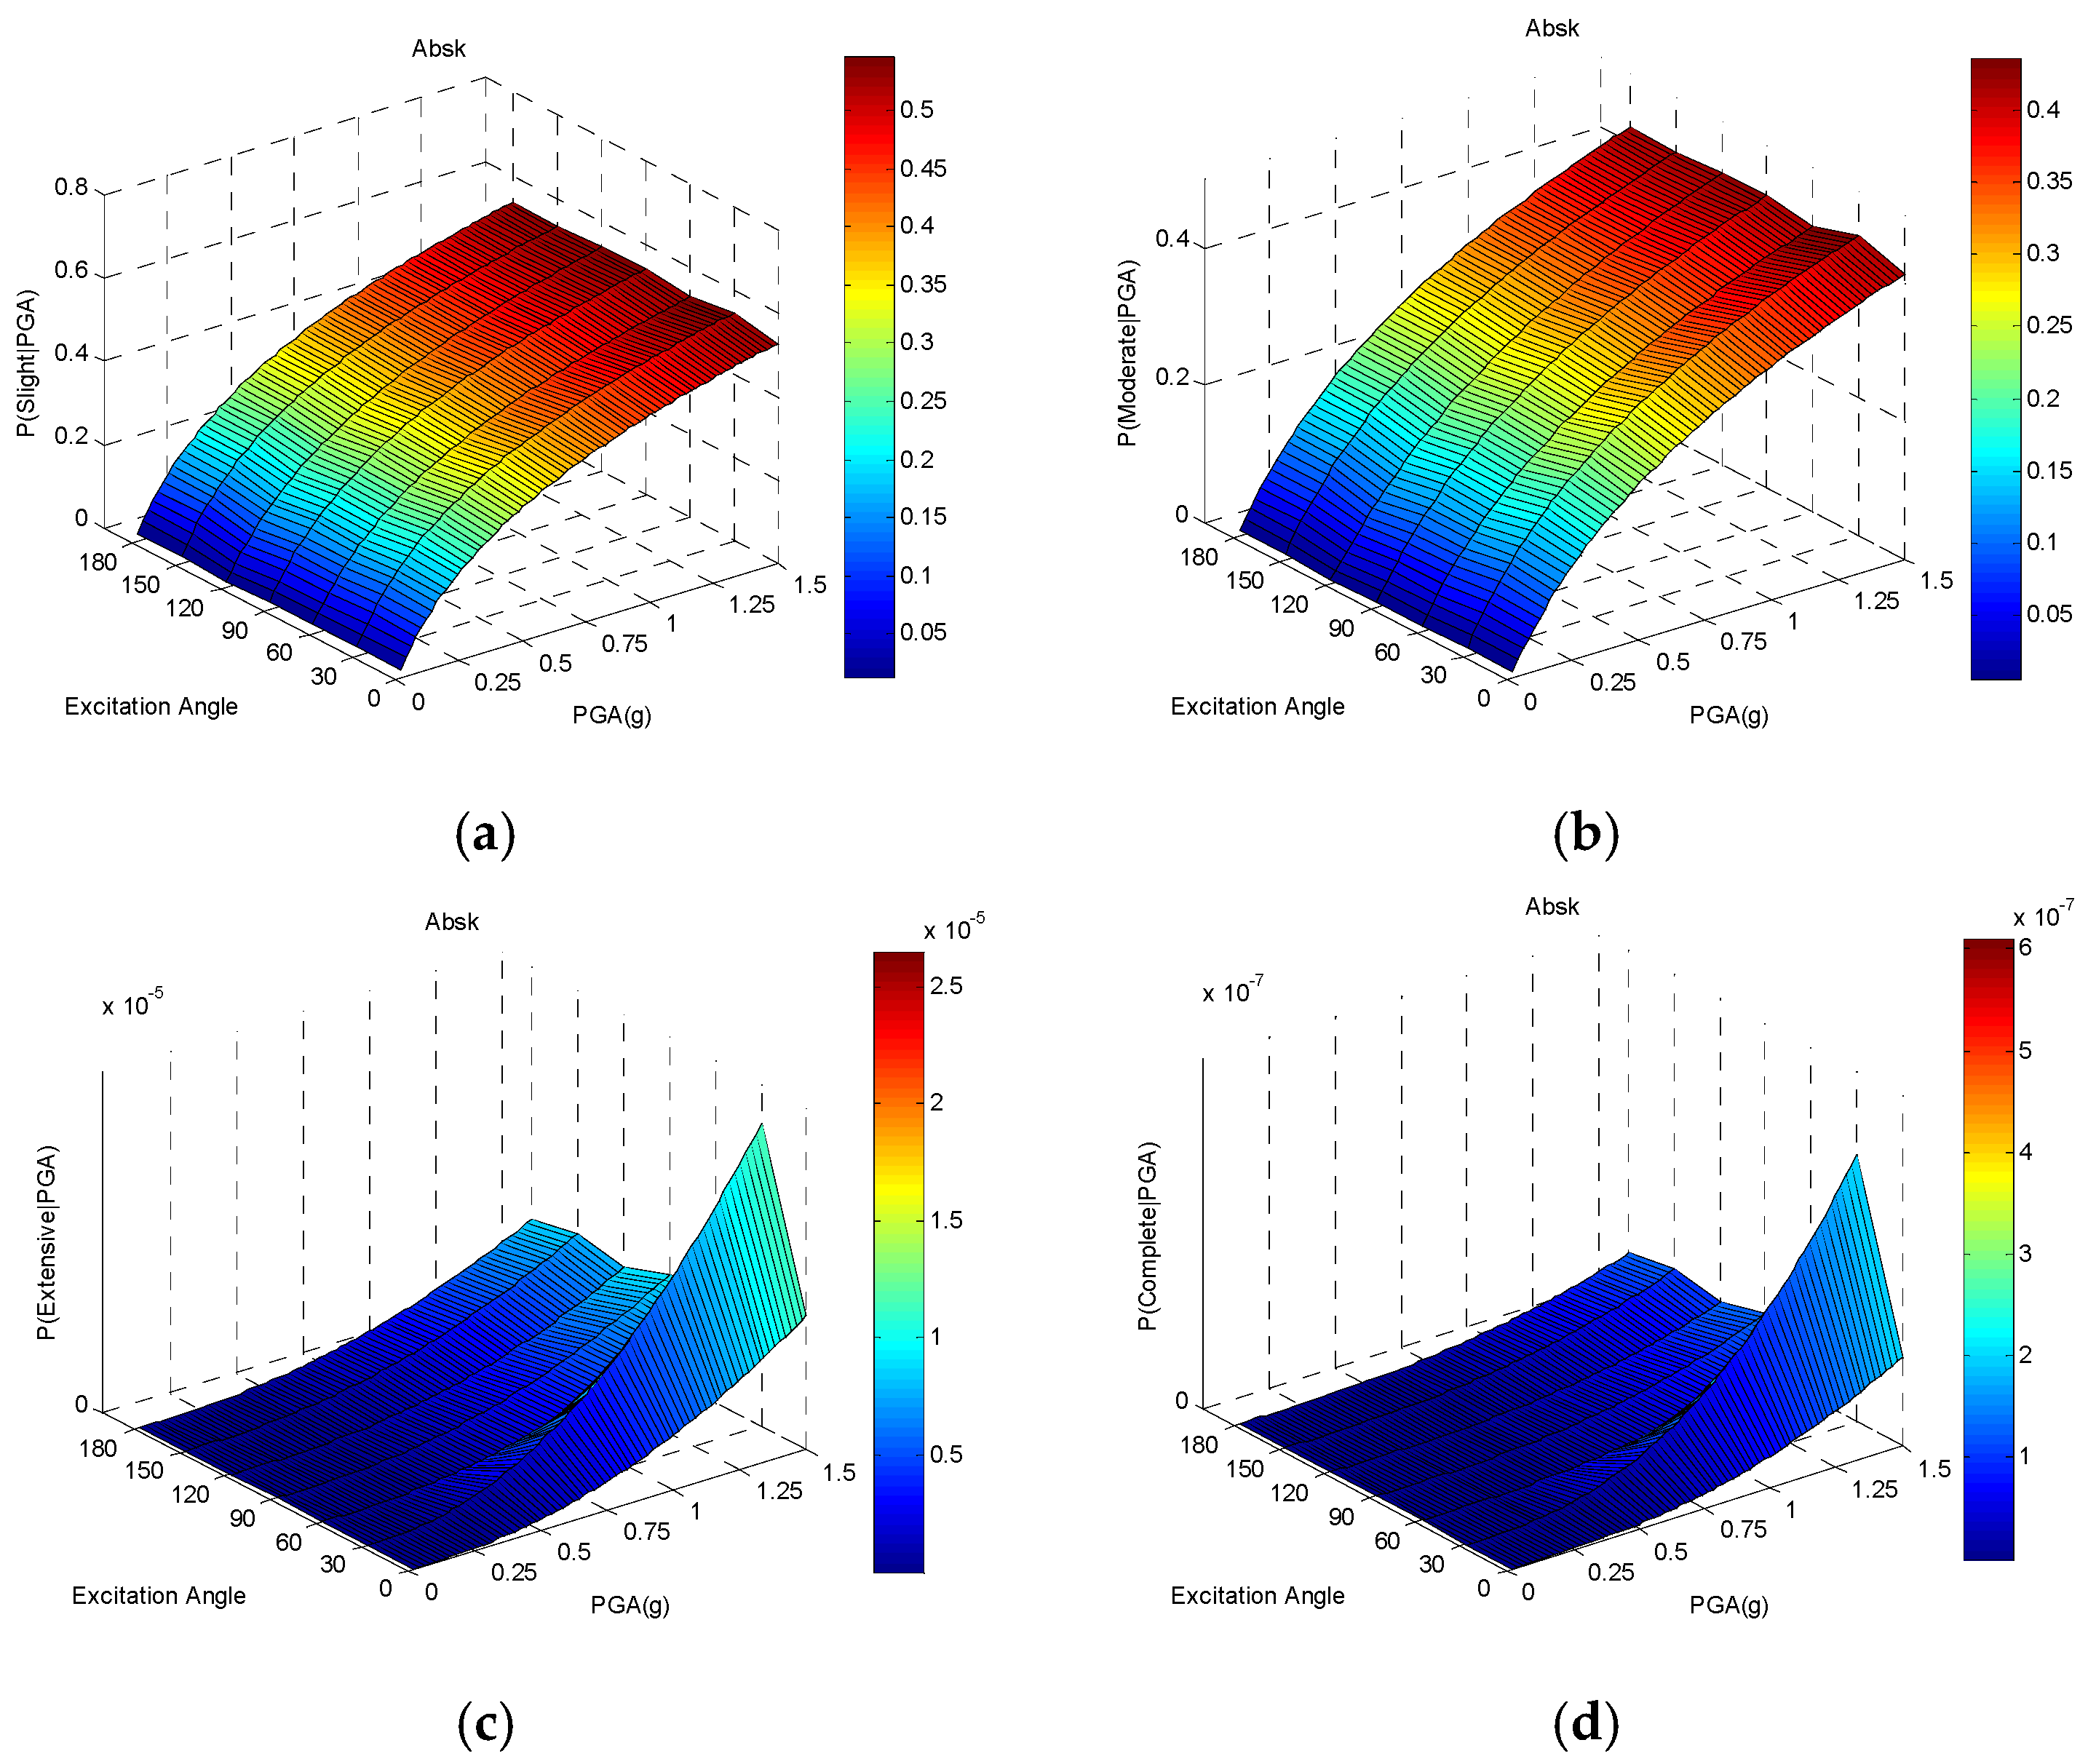
Appendix A.2. Secondary Component Fragility Surfaces Subjected to Different Excitation Angles

Figure A6. Seismic fragility surfaces of Abss subjected to different excitation angles in the (a) slight; (b) moderate; (c) extensive; and (d) complete limit states.
Buildings 12 00387 g0a6
Figure A7. Seismic fragility surfaces of Abts subjected to different excitation angles in the (a) slight; (b) moderate; (c) extensive; and (d) complete limit states.
Buildings 12 00387 g0a7
Figure A8. Seismic fragility surfaces of Absk subjected to different excitation angles in the (a) slight; (b) moderate; (c) extensive; and (d) complete limit states.
Buildings 12 00387 g0a8

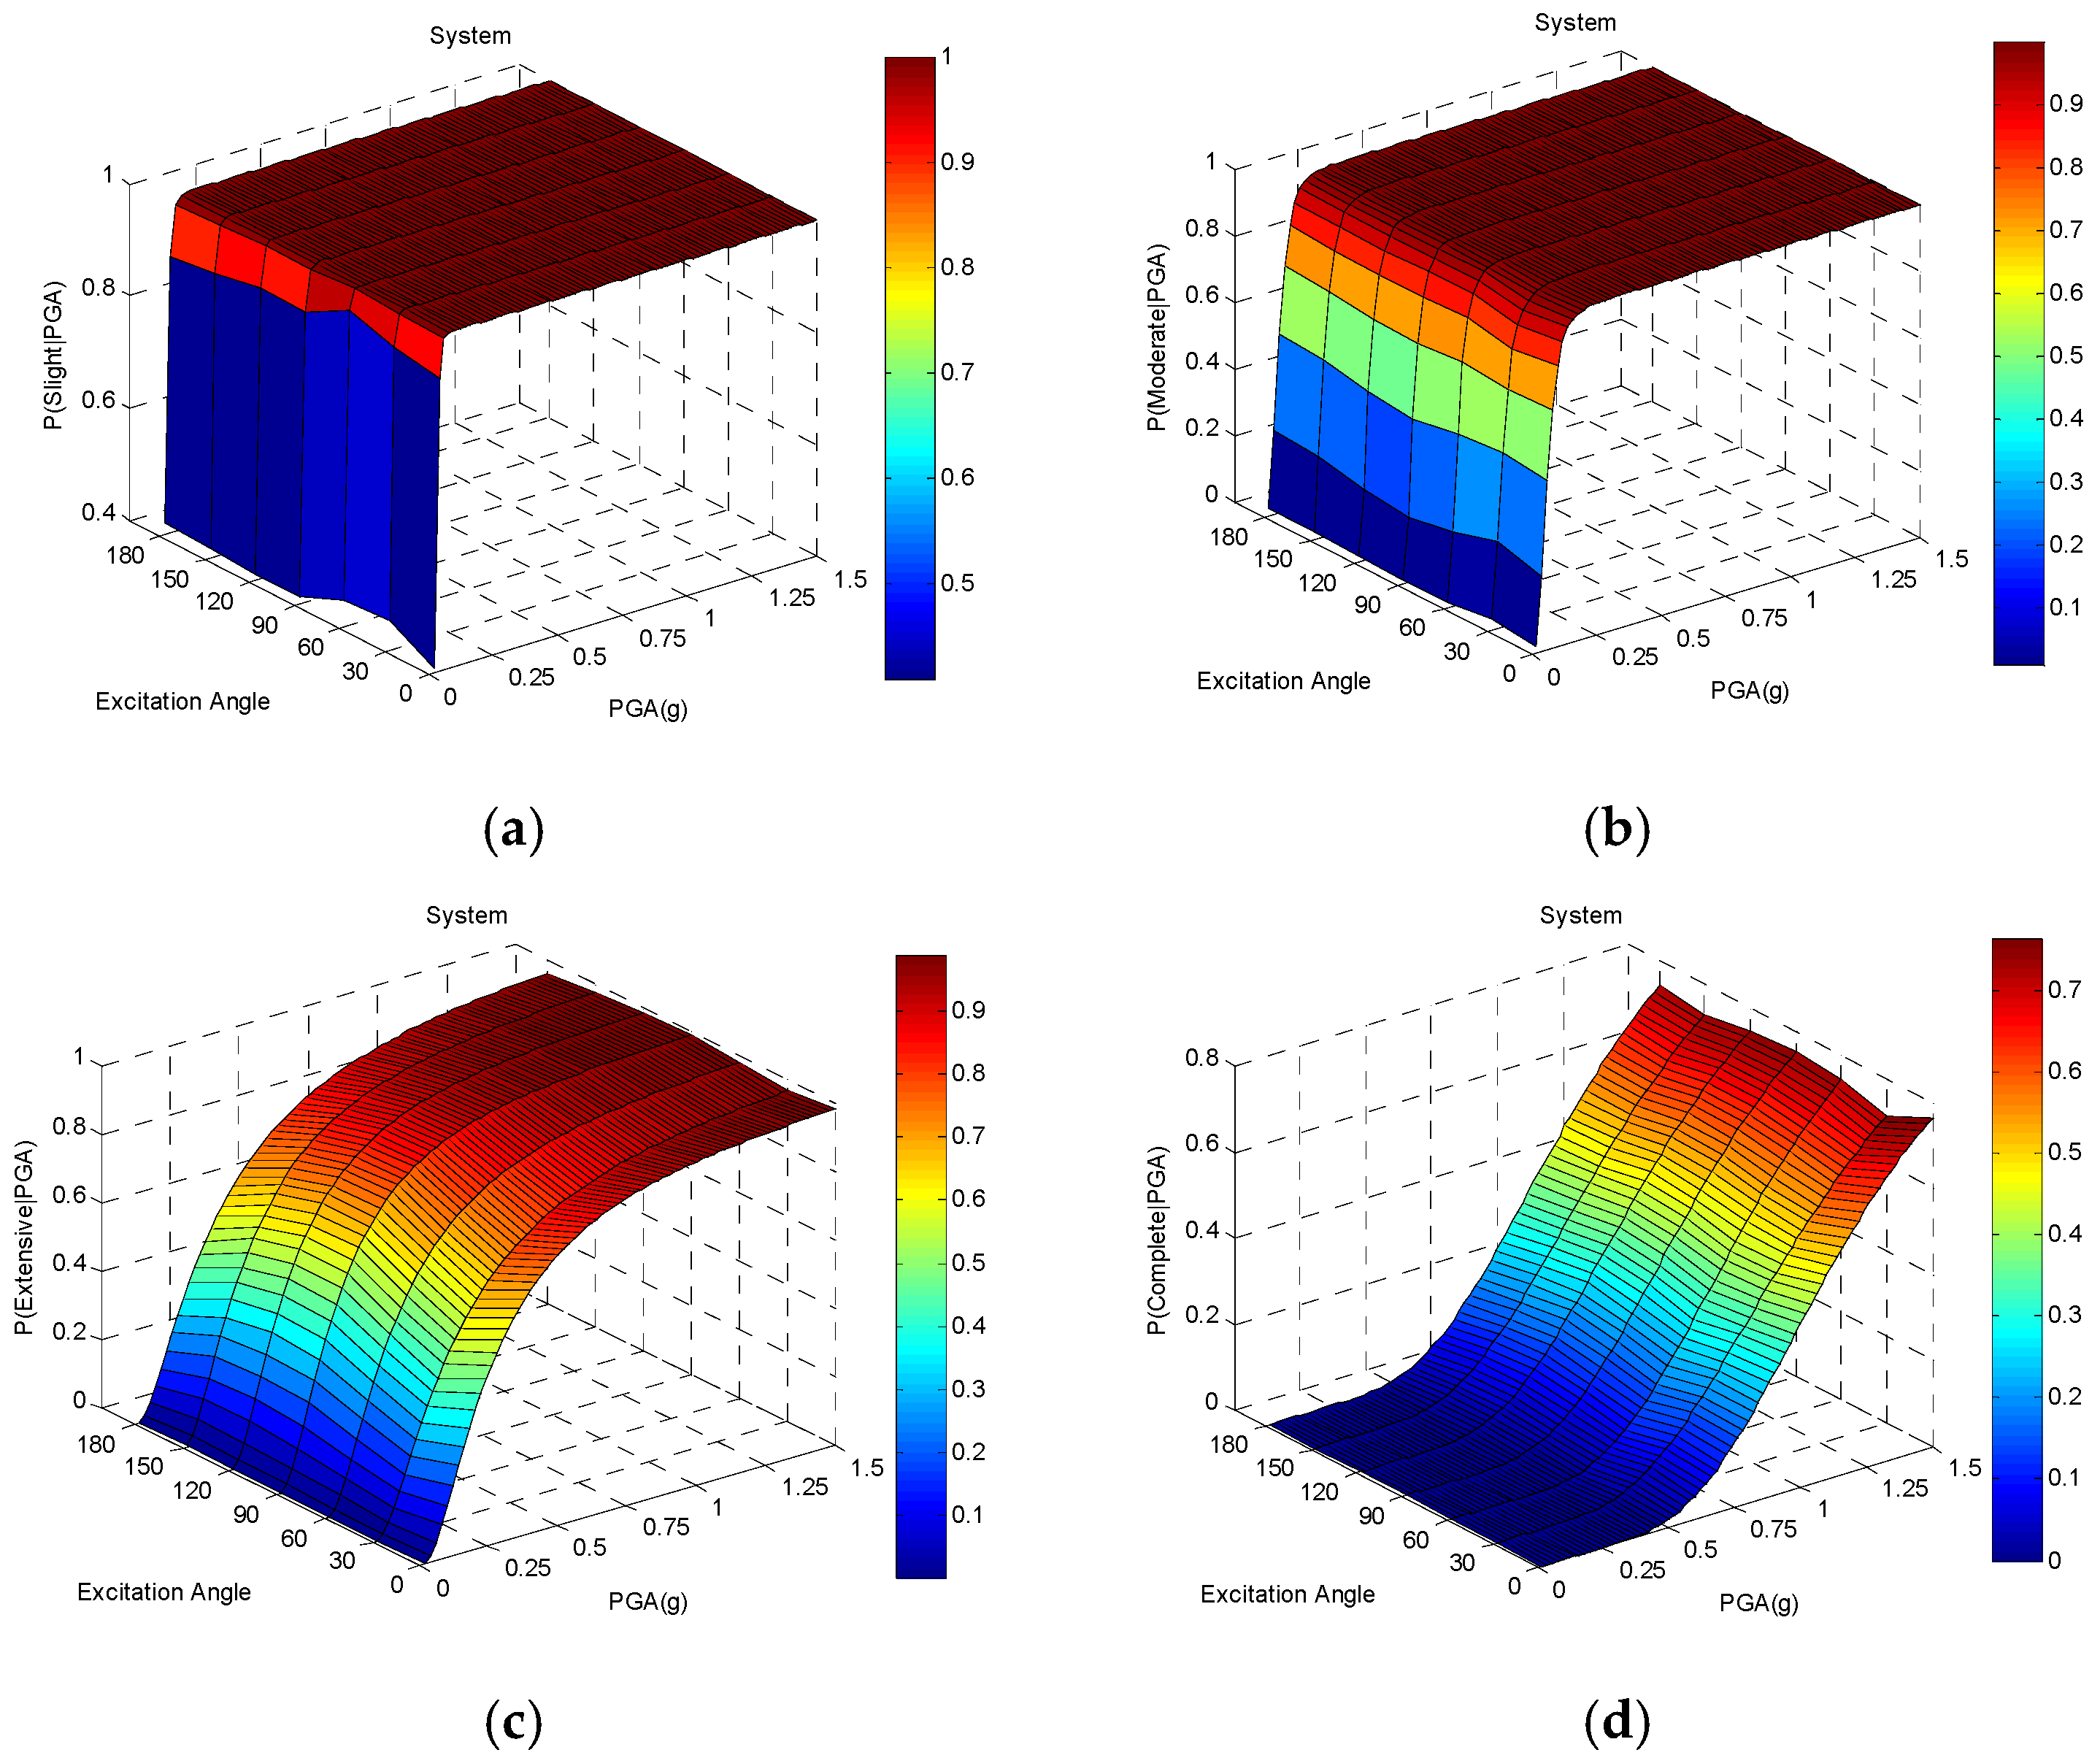
Appendix A.3. System Fragility Surfaces Subjected to Different Excitation Angles

Figure A9. Seismic fragility surfaces of the bridge system subjected to different excitation angles in the (a) slight; (b) moderate; (c) extensive; and (d) complete limit states.
Buildings 12 00387 g0a9

References

  1. Mehr, M.; Zaghi, A.E. Modified elastic dynamic analysis (EDA)for seismic demand on in-span hinge shear keys in multi-frame bridges. Transp. Res. Rec. 2018, 2672, 75–86. [Google Scholar] [CrossRef]
  2. Jeon, J.S.; Shafieezadeh, A.; DesRoches, R. Component fragility assessment of a long, curved multi-frame bridge: Uniform excitation versus spatially correlated ground motions. Struct. Eng. Mech. 2018, 65, 633–644. [Google Scholar] [CrossRef]
  3. Jeon, J.S.; Mangalathu, S.; Song, J.H.; Desroches, R. Parameterized seismic fragility curves for curved multi-frame concrete box-girder bridges using bayesian parameter estimation. J. Earthq. Eng. 2019, 23, 954–979. [Google Scholar] [CrossRef]
  4. Wu, T.; Sun, Q.S. Seismic Damage study of asymmetric continuous rigid frame bridge based on nonlinear time history analysis. Open Civ. Eng. J. 2015, 9, 489–494. [Google Scholar] [CrossRef]
  5. Wu, T.; Sun, Q.S. Study and analysis for seismic response of hinge in frame-style curved girder bridge. Eng. Mech. 2016, 33, 155–163. (In Chinese) [Google Scholar] [CrossRef]
  6. Kwag, S.; Hahm, D. Multi-objective-based seismic fragility relocation for a Korean nuclear power plant. Nat. Hazards 2020, 103, 3633–3659. [Google Scholar] [CrossRef]
  7. Pisharady, A.S.; Basu, P.C. Methods to derive seismic fragility of NPP components: A summary. Nucl. Eng. Des. 2010, 240, 3878–3887. [Google Scholar] [CrossRef]
  8. Gavabar, S.G.; Alembagheri, M. Structural Demand Hazard Analysis of Jointed Gravity Dam in View of Earthquake Uncertainty. KSCE J. Civ. Eng. 2018, 22, 3972–3979. [Google Scholar] [CrossRef]
  9. Gavabar, S.G.; Alembagheri, M. A Study on Seismic Performance and Fragility of Gravity Dams with Various Monolith Shapes Using Nonlinear IDA. Geotech. Geol. Eng. 2020, 38, 1133–1150. [Google Scholar] [CrossRef]
  10. Hurtado-Lopez, G.; Mayoral-Villa, J.M. Fragility curves for hardfill dams under seismic loading. Tecnolog. Y Cienc. Del Agua 2020, 11, 132–168. [Google Scholar] [CrossRef] [Green Version]
  11. Misra, S.; Padgett, J.E. Seismic Fragility of Railway Bridge Classes: Methods, Models, and Comparison with the State of the Art. J. Bridge Eng. 2019, 24, 04019116. [Google Scholar] [CrossRef]
  12. Zhang, C.; Lu, J.B.; Zhou, Z.G.; Yan, X.Y.; Xu, L.; Lin, J.J. Lateral Seismic Fragility Assessment of Cable-Stayed Bridge with Diamond-Shaped Concrete Pylons. Shock. Vib. 2021, 2021, 2847603. Available online: https://www.hindawi.com/journals/sv/2021/2847603/ (accessed on 17 August 2021).
  13. Ren, L.P.; Zhang, G.; Zhang, Y.F.; He, S.H. Seismic Fragility Analysis of V-Shaped Continuous Girder Bridges. KSCE J. Civ. Eng. 2020, 24, 835–846. [Google Scholar] [CrossRef]
  14. Argyroudis, S.; Tsinidis, G.; Gatti, F.; Pitilakis, K. Effects of SSI and lining corrosion on the seismic vulnerability of shallow circular tunnels. Soil Dyn. Earthq. Eng. 2017, 98, 244–256. [Google Scholar] [CrossRef]
  15. Nguyen, D.D.; Park, D.; Shamsher, S.; Nguyen, V.Q.; Lee, T.H. Seismic vulnerability assessment of rectangular cut-and-cover subway tunnels. Tunn. Undergr. Space Technol. 2019, 86, 247–261. [Google Scholar] [CrossRef]
  16. Wang, D.; Wang, X.W.; Xu, J.; Feng, D.C.; Xu, S. Framework for calculating seismic fragility function of urban road networks: A case study on Tangshan City, China. Struct. Infrastruct. Eng. 2020, 17, 1508–1522. [Google Scholar] [CrossRef]
  17. Che, F.; Yin, C.; Zhou, J.L.; Hu, Z.N.; Zhao, X.K.; Sheng, L.; Zhang, Q.; Cheng, X.Y.; Tang, G.T.; Zhang, H.; et al. Embankment Seismic Fragility Assessment under the Near-Fault Pulse-like Ground Motions by Applying the Response Surface Method. Shock. Vib. 2021, 2021, 8849043. Available online: https://www.hindawi.com/journals/sv/2021/8849043/ (accessed on 25 March 2021).
  18. Folic, R.; Cokic, M. Fragility and Vulnerability Analysis of an RC Building with the Application of Nonlinear Analysis. Buildings 2021, 11, 390. [Google Scholar] [CrossRef]
  19. Pnevmatikos, N.G.; Papagiannopoulos, G.A.; Papavasileiou, G.S. Fragility curves for mixed concrete/steel frames subjected to seismic excitation. Soil Dyn. Earthq. Eng. 2019, 116, 709–713. [Google Scholar] [CrossRef]
  20. Adhikari, R.; Rupakhety, R.; Giri, P.; Baruwal, R.; Subedi, R.; Gautam, R.; Gautam, D. Seismic Fragility Analysis of Low-Rise RC Buildings with Brick Infifills in High Seismic Region with Alluvial Deposits. Buildings 2022, 12, 72. [Google Scholar] [CrossRef]
  21. Soltani, M.; Amirabadi, R. Seismic Vulnerability Assessment of Pile-Supported Wharves Using Fragility Surfaces. J. Earthq. Eng. 2021, 1–16. [Google Scholar] [CrossRef]
  22. Zhao, Z.; Lu, X.W.; Guo, Y.; Zhao, X.F. Seismic Fragility Assessment of Base-Isolated Steel Water Storage Tank. Shock. Vib. 2020, 2020, 8835943. [Google Scholar] [CrossRef]
  23. Abbasi, M.; Moustafa, M.A. Time-dependent seismic fragilities of older and newly designed multi-frame reinforced concrete box-girder bridges in California. Earthq. Spectra 2019, 35, 233–266. [Google Scholar] [CrossRef]
  24. Sajed, M.; Tehrani, P. Effects of column and superstructure irregularity on the seismic response of four-span RC bridges. Structures 2020, 28, 1400–1412. [Google Scholar] [CrossRef]
  25. Li, X.; Chen, K.D.; Hu, P.; He, W.; Xiao, L.; Zhang, R. Effect of ECC jackets for enhancing the lateral cyclic behavior of RC bridge columns. Eng. Struct. 2020, 219, 110714. [Google Scholar] [CrossRef]
  26. Wu, T.; Sun, Q.S. Analysis of Seismic Damage to Multiple-Frame Style Curved Girder Bridges. J. Vib. Shock. 2016, 35, 111–118. (In Chinese) [Google Scholar] [CrossRef]
  27. Yang, C.S.W.; Werner, S.D.; DesRoches, R. Seismic fragility analysis of skewed bridges in the central southeastern United States. Eng. Struct. 2015, 83, 116–128. [Google Scholar] [CrossRef]
  28. Jeon, J.S.; DesRoches, R.; Kim, T.; Choi, E. Geometric parameters affecting seismic fragilities of curved multi-frame concrete box-girder bridges with integral abutments. Eng. Struct. 2016, 122, 121–143. [Google Scholar] [CrossRef]
  29. Furinghetti, M.; Pavese, A. Definition of a Simplified Design Procedure of Seismic Isolation Systems for Bridges. Struct. Eng. Int. 2020, 30, 381–386. [Google Scholar] [CrossRef]
  30. Ponzo, C.F.; Di Cesare, A.; Telesca, A.; Pavese, A.; Furinghetti, M. Advanced Modelling and Risk Analysis of RC Buildings with Sliding Isolation Systems Designed by the Italian Seismic Code. Appl. Sci. 2021, 11, 1938. [Google Scholar] [CrossRef]
  31. Pahlavan, H.; Zakeri, B.; Amiri, G.G. Probabilistic Performance Assessment of Retrofitted Horizontally Curved Multi-Frame RC Box-Girder Bridges. J. Earthq. Tsunami 2017, 11, 1750010. [Google Scholar] [CrossRef]
  32. Mehr, M.; Zaghi, A.E. Seismic response of multi-frame bridge. Bull. Earthq. Eng. 2016, 14, 1219–1243. [Google Scholar] [CrossRef]
  33. Aboutorabian, E.; Dehkordi, M.R. Numerical study of seismic response of irregular multi-frame reinforced concrete bridges. Proc. Inst. Civ. Eng.—Struct. Build. 2020, 173, 783–798. [Google Scholar] [CrossRef]
  34. Ramanathan, K.N. Next Generation Seismic Fragility Curves for California Bridges Incorporating the Evolution in Seismic Design Philosophy. Ph.D. Thesis, Georgia Institute of Technology, Atlanta, GA, USA, 2012. [Google Scholar]
  35. Wu, T.; Li, Z.; Liu, S.C. Elaborate modeling and fragility assessment of a multi-frame PC box-girder bridge with intermediate hinges in California. Shock. Vib. 2021, 2021, 6046209. [Google Scholar] [CrossRef]
  36. Chang, G.A.; Mander, J.B. Seismic Energy Based Fatigue Damage Analysis of Bridge Columns: Part I—Evaluation of Seismic Capacity; Technical Report 94-0006; NCEER: Buffalo, NY, USA, 1994. [Google Scholar]
  37. Lehman, D.; Moehle, J.; Mahin, S.; Calderone, A.; Henry, L. Experimental evaluation of the seismic performance of reinforced concrete bridge columns. J. Struct. Eng. 2004, 130, 869–879. [Google Scholar] [CrossRef]
  38. Muthukumar, S. A contact element approach with hysteresis damping for the analysis and design of pounding in bridges. Ph.D. Thesis, Georgia Institute of Technology, Atlanta, GA, USA, 2003. [Google Scholar]
  39. MSC Software Corporation. Nonlinear Finite Element Analysis of Elastomers. Available online: http://axelproducts.com/downloads/WP_Nonlinear_FEA-Elastomers.pdf (accessed on 30 November 2010).
  40. DesRoches, R.; Muthukumar, S. Implications of seismic pounding on the longitudinal response of multi-span bridges an analytical perspective. Earthq. Eng. Eng. Vib. 2004, 3, 57–65. [Google Scholar] [CrossRef]
  41. Shamsabadi, A.; Rollins, K.M.; Kapuskar, M. Nonlinear soil–abutment–bridge structure interaction for seismic performance-based design. J. Geotech. Geoenviron. Eng. 2007, 133, 707–720. [Google Scholar] [CrossRef]
  42. Gadre, A.; Dobry, R. Lateral cyclic loading centrifuge tests on square embedded footing. J. Geotech. Geoenvironmental Eng. 1998, 124, 1128–1138. [Google Scholar] [CrossRef]
  43. Megally, S.; Silva, P.F.; Seible, F. Seismic Response of Sacrificial Shear Keys in Bridge Abutments; Structural Systems Research Project, Report No. SSRR-2001/23; University of California: San Diego, CA, USA, 2002. [Google Scholar]
  44. Bozorgzadeh, A.; Megally, S.; Restrepo, J.I.; Ashford, S.A. Capacity evaluation of exterior sacrificial shear keys of bridge abutments. J. Bridge Eng. 2006, 11, 555–565. [Google Scholar] [CrossRef] [Green Version]
  45. Nielson, B.G.; DesRoches, R. Seismic fragility methodology for highway bridges using a component level approach. Earthq. Eng. Struct. Dyn. 2007, 36, 823–839. [Google Scholar] [CrossRef]
  46. Abbasi, M.; Moustafa, M.A. Probabilistic seismic assessment of as-built and retrofitted old and newly designed skewed multi-frame bridges. Soil Dyn. Earthq. Eng. 2019, 119, 170–186. [Google Scholar] [CrossRef]
  47. Song, Z.P.; Mao, J.C.; Tian, X.X.; Zhang, Y.W.; Wang, J.B. Optimization Analysis of Controlled Blasting for Passing through Houses at Close Range in Super-Large Section Tunnels. Shock. Vib. 2019, 2019, 1941436. [Google Scholar] [CrossRef] [Green Version]
  48. Hoang, P.H.; Phan, H.N.; Nguyen, D.T.; Paolacci, F. Kriging Metamodel-Based Seismic Fragility Analysis of Single-Bent Reinforced Concrete Highway Bridges. Buildings 2021, 11, 238. [Google Scholar] [CrossRef]
  49. Koniorczyk, M.; Grymin, W. Influence of the Thermal Conductivity and Ambient Temperature Uncertainty on the Heat Losses through the External Wall. Buildings 2021, 11, 84. [Google Scholar] [CrossRef]
  50. Ramanathan, K.N.; Padgett, J.E.; DesRoches, R. Temporal evolution of seismic fragility curves for concrete box-girder bridges in California. Eng. Struct. 2015, 97, 29–46. [Google Scholar] [CrossRef]
  51. Padgett, J.E.; DesRoches, R. Methodology for the development of analytical fragility curves for retrofitted bridges. Earthq. Eng. Struct. Dyn. 2008, 37, 1157–1174. [Google Scholar] [CrossRef]
  52. Shi, Q.X.; Ma, L.C.; Wang, Q.W.; Wang, B.; Yang, K. Seismic performance of square concrete columns reinforced with grade 600 Mpa longitudinal and transverse reinforcement steel under high axial load. Structures 2021, 32, 1955–1970. [Google Scholar] [CrossRef]
  53. Romero, S.; Rix, G.J. Regional Variations in Near-Surface Shear Wave Velocity in the Greater Memphis Area. Eng. Geol. 2001, 62, 137–158. [Google Scholar] [CrossRef]
  54. Rix, G.J.; Hebeler, G.L.; Orozco, M.C. Near-Surface Vs Profiling in the New Madrid Seismic Zone Using Surface Wave Methods. Seismol. Res. Lett. 2002, 73, 380–392. [Google Scholar] [CrossRef]
  55. DesRoches, R. Feasibility Studies for Improving Caltrans Bridge Fragility Relationships; Final Report No. CA12-1775; Division of Research, Innovation and System Information, California Department of Transportation: Sacramento, CA, USA, 2012. [Google Scholar]
Figure 1. Plug-type hinge: (a) 3D schematic view and (b) numerical model.
Buildings 12 00387 g001
Figure 2. Numerical model: (a) entire bridge; (b) confined and unconfined concrete; (c) longitudinal reinforcement in column; (d) bearing (shearing direction); (e) bearing (compression direction); (f) pounding; (g) abutment passive performance; (h) abutment transverse response; (i) shear key; (j) hinge longitudinal restrainer.
Buildings 12 00387 g002
Figure 3. Histogram of ground motion PGAs.
Buildings 12 00387 g003
Figure 4. Regression analyses of seismic demands for (a) Column; (b) Abb; (c) Hs; (d) HmcY; (e) HmcZ; (f) Abss; (g) Abts; (h) Absk.
Buildings 12 00387 g004
Figure 5. Seismic fragility curves of the column subjected to different excitation angles in the (a) slight; (b) moderate; (c) extensive; and (d) complete limit states.
Buildings 12 00387 g005
Figure 6. Seismic fragility curves of Abb subjected to different excitation angles in the (a) slight; (b) moderate; (c) extensive; and (d) complete limit states.
Buildings 12 00387 g006
Figure 7. Seismic fragility curves of Hs subjected to different excitation angles in the (a) slight; (b) moderate; (c) extensive; and (d) complete limit states.
Buildings 12 00387 g007
Figure 8. Seismic fragility curves of HmcY subjected to different excitation angles in the (a) slight; (b) moderate; (c) extensive; and (d) complete limit states.
Buildings 12 00387 g008
Figure 9. Seismic fragility curves of HmcZ subjected to different excitation angles in the (a) slight; (b) moderate; (c) extensive; and (d) complete limit states.
Buildings 12 00387 g009
Figure 10. Seismic fragility curves of Abss subjected to different excitation angles in the (a) slight; (b) moderate; (c) extensive; and (d) complete limit states.
Buildings 12 00387 g010
Figure 11. Seismic fragility curves of Abts subjected to different excitation angles in the (a) slight; (b) moderate; (c) extensive; and (d) complete limit states.
Buildings 12 00387 g011
Figure 12. Seismic fragility curves of Absk subjected to different excitation angles in the (a) slight; (b) moderate; (c) extensive; and (d) complete limit states.
Buildings 12 00387 g012
Figure 13. Seismic fragility curves of the bridge system subjected to different excitation angles in the (a) slight; (b) moderate; (c) extensive; and (d) complete limit states.
Buildings 12 00387 g013
Figure 14. Seismic fragility curves of the bridge system and primary components for the original model and symmetric model:(a) System; Column; Abb (b) System; Hs; HmcY; HmcZ in the (1) slight; (2) moderate; (3) extensive; and (4) complete limit states.
Buildings 12 00387 g014
Figure 15. Seismic fragility curves of the bridge system and secondary components for the original model and symmetric model: Abss; Abts; Absk in the (a) slight; (b) moderate; (c) extensive; and (d) complete limit states.
Buildings 12 00387 g015
Table 1. Limit state models for the bridge components.
ComponentsAbbreviationUnitsSlightModerateExtensiveComplete
MedDispMedDispMedDispMedDisp
PrimaryColumnColumnμ0.900.354.00.359.00.3514.00.35
Abutment bearingAbbmm51.00.3576.50.35153.00.35914.40.35
Hinge restrainerHsmm27.30.3531.10.3546.40.35358.80.35
Hinge (2,3) cur-duct YHmcYμ0.150.351.00.3519.00.3524.00.35
Hinge (2,3) cur-duct ZHmcZμ0.150.351.00.3519.00.3524.00.35
SecondaryAbutment-passiveAbssmm19.50.3550.80.3576.2
(1000)
0.35228.6
(1000)
0.35
Abutment-transAbtsmm7.60.3525.40.3550.8
(1000)
0.35101.6
(1000)
0.35
Abutment
shear key
Abskmm17.20.3521.60.35542.3
(1000)
0.351063.00.35
(Note: The values inside brackets are used for bridge component fragility analysis, the values outside brackets are used for bridge system fragility analysis).
Table 2. Probabilistic seismic demand parameters.
ComponentsabR2σ
Column2.3791.4480.8880.459
Abb4.1880.2670.6180.188
Hs4.6700.5850.5250.497
HmcY−1.6991.1860.6230.824
HmcZ0.5461.1980.7250.661
Abss4.7751.1890.4831.100
Abts6.3981.1560.8710.397
Absk2.7410.3870.1870.724
Table 3. Original and symmetric column height layouts (unit: m).
Columns1#2#3#4#5#6#7#
Original height layout
(Symmetric height layout)
12.19
(same)
23.16
(same)
28.04
(same)
34.14
(same)
42.67
(28.04)
26.82
(23.16)
8.53
(12.19)
Publisher’s Note: MDPI stays neutral with regard to jurisdictional claims in published maps and institutional affiliations.

