Article

Operational Challenges of Modern Demand-Control Ventilation Systems: A Field Study

1
Department of Mechanical Engineering, Aalto University, 02150 Espoo, Finland
2
College of Urban Construction, Nanjing Tech University, Nanjing 211816, China
*
Author to whom correspondence should be addressed.
Buildings 2022, 12(3), 378; https://doi.org/10.3390/buildings12030378
Submission received: 21 February 2022 / Revised: 15 March 2022 / Accepted: 17 March 2022 / Published: 18 March 2022
(This article belongs to the Section Building Energy, Physics, Environment, and Systems)

Abstract

:
To maintain proper indoor air quality and increase energy efficiency, a demand-control ventilation (DCV) system has become a popular solution. This paper reports the findings of a field study conducted on the performance of the DCV systems in eight public buildings in southern Finland. We conducted the measurements in two stages. In the first stage, we made a site visit and measured the airflow rates in the design operation conditions of the chosen space. For the second stage, we left temperature/humidity data loggers to monitor the thermal conditions during the normal operation mode of the space. The results indicate that, out of the eight studied spaces, only one DCV system was performing according to design specifications. While the systems were operating in a suboptimal way, the flaws in functionality were mostly minor, and none of the sites had perceived indoor-air-quality- and/or thermal-condition-related problems during the time of measurement. Nonetheless, this result shows that the potential benefits of DCV were partially lost due to malfunctioning systems. Additionally, by only monitoring room air temperature (or IAQ) without airflow rate measurements in different operation modes, it is not possible to conclude whether the DCV system works properly or not.

1. Introduction

Buildings account for approximately 40% of the world’s energy usage and 36% of global greenhouse gas emissions in the European Union [1]. Hence, they are a major contributor to global warming [2]. To address this, nowadays, all new buildings constructed within the EU must be nearly zero-energy buildings. Furthermore, EU directive 2018/844 requires that all building stock in the Union must be carbon-free by 2050 [3].
Ventilation typically accounts for a large share of the total energy consumption of a building. In Nordic countries, this share is between 35–50% in the existing office buildings [4]. Thus, improving the performance of ventilation systems is a key measure to reach the EU energy use and emission targets.
However, it must not be forgotten that the main purpose of ventilation is to provide a healthy and comfortable indoor climate for the people inside the building. People spend up to 90% of their time indoors [5], and the quality of the indoor climate has a large effect on an individual’s health, productivity/performance and comfort [6,7,8].
Only variable-air-volume (VAV) systems, where the airflow rate varies continuously according to the actual demand, are considered as demand-control ventilation (DCV) systems. DCV systems are controlled by adjusting the position of the damper according to the desired airflow rate. DCV systems are designed to vary the supply airflow rate to meet the demand caused by the changing heat levels, actual occupancy and indoor pollutants in the conditioned space [9,10,11]. In this way, they can reduce outdoor airflow rates when the actual occupancy of zones served by the air-handling system goes below the designed value. Utilizing variable-air-volume ventilation (VAV) has become a popular strategy to improve building energy efficiency without sacrificing indoor air quality (IAQ) [12].
A simplified ON/OFF control strategy to control the airflow rate has also been introduced. An ON/OFF DCV system is a simpler, pressure-dependent DCV system, where the dampers controlling the airflow are either only fully opened or closed, not proportional. Typically, with the ON/OFF control strategy, the room has two supply air and exhaust air damper pairs, which control the airflow in two stages: minimum airflow and maximum airflow.
Demand-controlled ventilation can be used in both all-air and air–water systems (e.g., chilled beams, fan-coils and radiant panels cooling). In the all-air system, the maximum cooling load is covered with ventilation. Thus, with all-air systems, there are, typically, two sensors installed: room air temperature for heat-gain control and CO2 for air-quality control. In the air–water systems, the main cooling load is covered by the water side, and the ventilation is controlled based on the air quality.
When DCV systems are introduced with a chilled beam, the maximum airflow rate operates at a much lower level than the all-air system. Thus, the chilled beam has energy-saving potential compared with the VAV system because of the reduced air-handling unit (AHU) fan capacity [13].
DCV is especially efficient for office buildings where the actual occupancy ratio is typically low (30–50%) [14]. In such buildings, ventilation can be reduced for room spaces with partial occupancy, leading to significant energy savings. A recent study showed that a DCV system with CO2-concentration control can save more than 50% of energy use compared to a CAV system [15].
While DCV systems offer a lot of benefits over traditional constant-air-volume (CAV) systems, their technique is more complex than that used in CAV systems. This means that, to ensure the proper operation of a DCV system, attention needs to be paid at all stages (design, commissioning, operation and maintenance) of the system’s lifecycle. According to the previous studies [4,16,17], there are not enough knowledge and skills to manage the systems as required, and possible system faults lead to poor performance and lower energy efficiency and insufficient IAQ. In addition, the location of sensors should be carefully designed. Otherwise, the ventilation system is not able to correctly react to the varied occupancy and heat gains.
Faults in DCV air-conditioning systems may occur at various system levels: the air-handling unit, ductwork or room spaces [18]. Potential fault areas may include terminal units, components, sensors and controllers. There are published studies [19,20,21] where implementing a fault detection and diagnosis (FDD) algorithm enabled the air-conditioning system to run optimally.
Faults can be defined as unfortunate/unexpected conditions which lead to system malfunction. Some troubleshooting and corrective measures for the DCV system were introduced by Mysen et al. [17]. The imbalance between the supply and exhaust airflow rates creates a pressure difference over the building envelope [22]. Haves [23] noted that the faults can be categorized as abrupt (e.g., a sudden failure of the sensor) or degradation faults, which develop over a period of time. Wang et al. [20] suggested that faults can also be classified as soft and hard faults, depending on whether their occurrence is abrupt or gradual. A hard fault means that the operation of the system is abruptly halted, e.g., due to equipment damage or sensor failure. A soft fault, on the other hand, means that the performance of components decreases slowly over time and only eventually prevents system operation if not addressed. Examples of soft faults are fouling of coils, dirtiness of measurement devices, air leakage and sporadic sensor measurement faults. It is difficult to detect soft faults in ventilation systems, but they may still affect the thermal environment and system performance in the long term [21].
Faults found in DCV systems are mostly caused by improper system design, commissioning, operation or maintenance [24]. In the previous study, it was noted that the DCV systems were not working as designed [21]. The problems associated with DCV systems are often due to improper design, e.g., too small duct size and asymmetric ductwork. Furthermore, other faults in the DCV systems may occur during the operational phase. Component faults can lead to bad indoor conditions or unnecessary energy usage [25].
Fault detection and diagnosis (FDD) systems are tools that help with timely detection of faults and diagnosing their possible causes, enabling correction before additional damage occurs to the system [25]. Usually, faults can be detected via comparison of measured and set-point values. FDD methods can be classified as quantitative-model-based, qualitative-model-based and process-history-based. In practice, soft landings and commissioning management processes are applied to determine the performance risks [26].
Measured and collected data from previous fault scenarios can be used to find the causal relationship between faults and symptoms. This knowledge can then be applied in diagnosing faults, e.g., qualitative reasoning and fault tree analysis. It is important that automatic controls and the building management system make it possible to detect faults in the future. Scholars have studied fault detection and diagnosis methods: Wang and Chen [27] developed a data-driven model to diagnose the measurement faults of outdoor and supply airflow sensors. Moreover, they presented an efficient and robust FDD strategy for multiple faults occurring in air-handling units. Furthermore, the validity of this diagnosis strategy was proved by the operating data from real VAV air-conditioning systems involving multiple, artificial faults [28]. Comstock et al. identified faults in chiller performance with relatively low-cost sensors and evaluated the impacts of the faults on cooling capacity and the coefficient of performance [29].
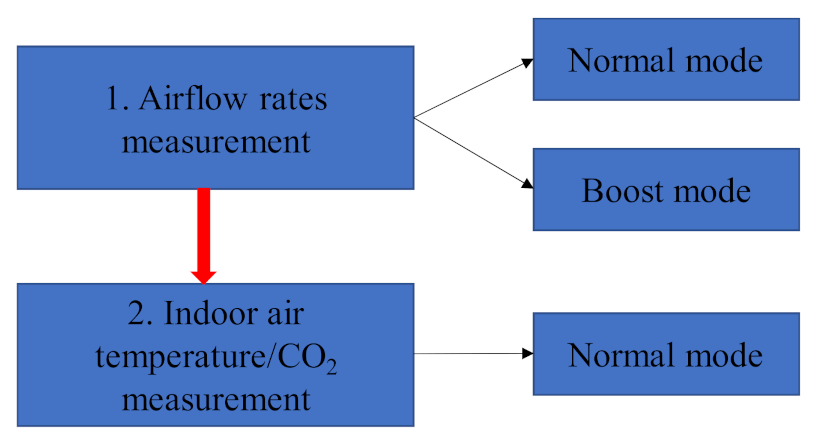
Because of the need to save energy, DCV is implemented in several all-air and air–water systems, and there are many different variations of DCV systems on the market. However, there is a lack of practical knowledge of how the modern DCV system performs in new buildings and the existing building stock. In this study, we conducted field measurements to assess the operation of typical DCV systems in eight public buildings located in southern Finland in winter 2018–2019. Before the measurements, none of the buildings was previously reported to have any problems with IAQ or HVAC system operation. For the performance analysis, we chose one representative space from each building for the field measurements. All buildings had a DCV system where the air-handling unit maintained the constant static pressure in the ductworks regardless of room terminal unit damper positions. The dampers were the simple ON/OFF type in three sites and proportionally controlled in the other five. The objective of the study was to determine whether the DCV systems performed as designed. The method was to address functionality by measuring supply/exhaust airflow rates and performance in different operation modes and comparing them to the design values and targets.
The novelty of this study is the analysis of the actual performance of typical DCV systems in public buildings. The comparison between ON/OFF control and proportional control, all-air ventilation systems and air–water ventilation systems and educational space and office space was made.

2. Methodology

2.1. Analyzed Buildings and Spaces

We performed the field measurements in eight public buildings in southern Finland during winter 2018–2019, as shown in Table 1. None of the selected buildings had any reported problems with HVAC systems operation and/or indoor climate. All studied ventilation systems were dedicated outdoor air systems. We chose one representative space for monitoring from each building, and these spaces consisted of meeting rooms (1, 6 and 8), offices (2, 5 and 7) and classrooms (3 and 4).
In all the studied spaces, airflows were measured both in the normal and in boost modes. Normal mode is defined as the operation during occupancy hours when there is no need for additional ventilation. The boost mode, on the other hand, means that ventilation rates are increased due to space demands. Some spaces also had a third “unoccupied” mode for unoccupied times during the normal operation hours, and this was also measured. These measurement results were compared to the designed airflow values. Based on the ventilation design and control strategy, the eight ventilated spaces were classified into 4 types, as shown in Table 2.
Type 1—Spaces 1, 2, 3 and 4: all-air system and two operation modes (normal and boost modes).
Type 2—Space 5: all-air system and three operation modes (minimum, normal and boost modes).
Type 3—Spaces 6 and 7: air–water system and two operation modes (normal and boost modes).
Type 4—Space 8: both all-air and air–water systems and two operation modes (normal and boost modes).
Each space had DCV-based ventilation; three spaces were equipped with ON/OFF dampers, and the rest had proportionally controlled ones, as shown in Table 2. ON/OFF dampers can either be fully open or fully closed to control the airflow rate. Proportionally controlled dampers enable the continuous modulation of airflow rate. In the eight studied spaces, the airflow rate was controlled either by occupancy, room air temperature or CO2 concentration. The supply air temperature was dependent on exhaust air temperature or outdoor temperature. The control strategies and control parameters in the eight spaces are summarized in Table 3, Table 4, Table 5 and Table 6. Drawings of the ventilation systems in the studied spaces are shown in Figure 1 and Figure 2.

2.2. Testing Process

The measurements were conducted in two stages, as shown in Figure 3. In the first stage, we measured airflow rates in the normal and boost modes, with the latter corresponding to a scenario where additional ventilation is needed due to either high temperature, CO2 concentration or occupancy. To activate the boost mode quickly, we either exhaled directly onto a CO2 sensor or heated the temperature sensor up with a heat gun. In the second stage, indoor air temperatures were monitored during the normal operation mode of the space for one week. Indoor air temperatures were measured at the height of 1.1 m in each studied space, and CO2 concentration was measured only in Space 2.
Relation between the ventilation modes and damper position is shown in Figure 4. The control systems modulate airflow rate based on the demand. The ON/OFF damper is fully open with boost mode, and the proportional damper modulates the airflow rate between normal and boost modes.

2.3. Measurement Equipment

To measure airflow rates in the first stage, we used a Swema 3000 manometer (±0.3% with resolution 0.1 Pa) for supply and exhaust units equipped with pressure measurement tubes (as shown in Figure 5a) and three different anemometers: TSI Airflow LCA 6000 (±0.2% with resolution 0.01 m/s), Testo 435 (±1.5% with resolution 0.1 m/s) and TSI Velocicalc 8388 (±0.3% with resolution 0.01 m/s) in conjunction with airflow horns for units without pressure measurement possibilities, such as exhaust valves (Figure 5b). In the second stage, Sensirion SDP816-125 Pa (±3% with resolution 0.1 Pa) was used to measure pressure differences in Space 4. For the room air temperature logging, we used Tinytag 2 plus TGP4500 (±3% with resolution 0.01 °C) sensors. Swema had a valid factory calibration, and the other sensors were cross-calibrated in the laboratory with calibrated sensors to confirm the validity of their readings.

3. Results

3.1. Analysis of Airflow Rate

The measured airflow rates and control strategies of each space are shown in Table 7, Table 8, Table 9 and Table 10. In Space 1 with the normal mode (Table 7), the measured supply airflow was more than double the designed airflow, and it was 3.6 times higher than the exhaust airflow. In the boost mode, however, the airflow rate was lower than in the normal mode. In addition, the supply airflow was 3.4 times greater than the exhaust airflow. Hence, the measured airflows did not match the design values at all, and the ventilation system did not work properly in Space 1. This behavior indicates that the damper pair was open in the normal mode but closed in the boost mode. Therefore, the damper pair was operating in the opposite way to intended. The dampers should be closed in the normal mode and open in the boost mode. The fault was likely due to an incorrect setting in the installation phase.
Figure 6 shows the indoor temperature trend in Space 1, which had the worst offset (supply/exhaust ratio was biggest) in airflows compared to the design values. Despite this, the temperature was between 20.5 °C and 21.6 °C during the whole studied week, and it fulfilled the design values. This indicates that the functionality of a ventilation system cannot be defined only by analyzing the indoor conditions.
In Space 2, the supply airflows were close to the design values in both normal and boost modes. However, the measured exhaust airflow rate was much higher than the supply airflow. The low ratio between supply and exhaust airflows resulted in under-pressure in the space.
In Space 3, the design values were not available for normal mode (N/A) in the design documentation. In the boost mode, the measured airflow rates were lower than the design values. Moreover, the average, measured, specific, supplied airflow rates were 0.9 L/s/m2 and 2.3 L/s/m2 in the normal and boost modes, which did not fulfill the airflow requirements for classrooms of 3 L/s/m2 according to the National Building Code of Finland [30]. In addition, in both modes, the airflow rates were not in balance. The ratios of supply/exhaust airflows were more than one, which led to over-pressure to surrounding areas.
In Space 4, the measured supply and exhaust airflows were almost twice the design values in the normal mode. In the boost mode, the measured airflows were close to the design values. Similar to Space 3, the specific supply airflow was only 2.25 L/s/m2 in the boost mode, which is below the target value of 3 L/s/m2. In both classrooms (Spaces 3 and 4), the airflows were too low to meet the minimum requirements according to the National Building Code of Finland [30].
In Space 5 (Table 8), the airflow rates were not available in the minimum mode as they were outside the measurement range for the damper (minimum airflow rate of damper was 15 L/s). Therefore, the selected damper was not suitable to check the minimum airflow rate in Space 5. In both modes, the exhaust airflows were quite close to the design values, but the measured supply airflows were slightly higher. The ratio of the supply/exhaust airflows was over one and led to over-pressure compared to the surrounding area.
In Space 6 (Table 9), the design values in the normal mode were not available in the design documents. In the normal mode, the low ratio of supply and exhaust airflows led to under-pressure of 15.5 Pa compared to the corridor. In the boost mode, the airflows were much lower than designed and quite similar to the values in the normal mode. This means that the CO2 sensor and temperature sensor could not control the airflow rate well and the ventilation system did not work properly in the boost mode.
In Space 7, the airflows were close to the design in both normal and boost modes. Moreover, the differences between measured and design airflows were less than 10%, and the supply/exhaust ratio remained at acceptable levels. It can be concluded that the ventilation worked properly in Space 7.
In Space 8 (Table 10), all measurements were performed in the boost mode since the ventilation system was stuck in it due to a technical fault, i.e., a frozen DCV damper or malfunctioning CO2/temperature sensors. The measured exhaust airflow was close to the design value, but the supply airflow was much lower than the designed value. The low ratio of supply/exhaust airflows led to under-pressure to surrounding areas.

3.2. Monitoring during Normal Operation

The indoor air temperature was monitored for one week. The outdoor air temperature varied from −7 °C to 7 °C. The results show that the room air temperatures were within the design threshold values in all studied spaces (20–23 °C), as shown in Figure 7. In all spaces studied, the results were similar, and temperatures never fell below or rose above the acceptable values. We also analyzed building automation data (T + CO2) of winter and early spring from spaces where it was logged (1, 2, 4 and 5), which showed similar findings. This depicts that, by only monitoring room air temperature (or IAQ), it is not possible to conclude that the system is working properly. The supply/exhaust airflow rates should always be checked by an expert.

3.3. Summary of Field Study

In conclusion, the results show that only one space out of eight had DCV system performance according to design values in both normal and boost modes when a ±15% deviation is acceptable. Furthermore, Space 4 was performing well in boost mode but, in normal mode, the airflows were much larger than designed. However, the supplied airflow rates did not fulfill the minimum airflow requirements for the classroom.
All other buildings had problems with airflow rates and/or the supply/exhaust ratio in different operation modes. Even though a large number of the airflows were not equal to the design values, the supply/exhaust balance was reasonably close in most buildings. The exceptions to this were Spaces 1, 3 and 5, where the measured supply airflows were larger than the exhaust airflows.
Comparison between ON/OFF control and proportional control, all-air ventilation systems and air–water ventilation systems and educational space and office space was made, as shown in Table 11. Based on the analysis, due to the simpler ON/OFF control, the DCV system was more reliable in Space 7. However, because of the limited range of the airflow rate with ON/OFF control (minimum and maximum airflow rates), it did not give the same performance as the proportional control regarding energy efficiency and indoor conditions. With the air–water ventilation system (Spaces 6 and 7), the ratio between supply and exhaust airflows was more acceptable than that with all-air ventilation system (Spaces 1, 2, 3 and 5). In the educational spaces (3 and 4), the design and supply airflow rates were below target values even in the boost mode.

4. Discussion

Our goal was to determine whether modern DCV systems functioned according to design and in a desirable manner in the eight studied spaces. Another goal of this study was to improve the field measurement strategy. Based on the field measurements in eight spaces with DCV systems, seven ventilation systems did not work in a desirable manner. Our findings, based on the studied set of buildings, indicate that faults do not necessarily lead to perceived indoor air quality and thermal comfort problems.
The main challenge occurred when the supply and exhaust airflows did not fulfill the design airflow values. As a result, an imbalance between the supply and exhaust airflows caused pressure differences between indoor and neighbor rooms or envelopes. The possible reasons for unbalanced ventilation are:
  • Unbalanced ventilation or commissioning for control dampers;
  • Effect of occupancy change;
  • Wear and tear of the system;
  • Dirtiness of measurement device;
  • Complex ventilation system.
Due to the unbalanced ventilation, energy consumption of the fans increases and supply of air reduces, which can make the occupants feel cold draft and decreases performance. The balance between supply and exhaust airflows is important, especially in new office buildings which are designed to be very airtight. Unbalanced ventilation can create significant pressure difference over the envelope.
There are many problems related to the performance of DCV systems. In some buildings, the systems are commissioned incorrectly and not properly tested during the final inspection and/or operation phase to recognize the faults. The most common reason behind the malfunctions is improperly set/balanced supply and exhaust airflows. Differences between measured and design airflows were greater than 10% in all but one of the studied spaces. Therefore, commissioning for new buildings and retro-commissioning for renovated buildings should be deliberately performed.
During the field measurements, some other problems were noted in the studied buildings. For example, the control strategy could not be fully achieved. The necessary design documents were only available for three of the eight sites. In some cases, although the documents were accessible, these automation documents were general standard schemes, in which case, the control strategy and set-points were not clearly presented. Furthermore, building automation systems were not really utilized, i.e., trend measurements were not used (building management system, pre-design). This is because the staff did not know how to use the BMS/automation systems and did not fully understand the overall system operation. To improve the utilization of BMS, there should be a specific task during the design commissioning phase where the consulter or automation contractor makes a plan of how the BMS should be used for system monitoring.
Another problem noted was that the selected damper was not technically capable of measuring the design minimum airflow rate, and the minimum airflow rate was out of the range of the measurement device. This indicates a demand to develop new products that can cover the whole operation range of the airflow rate required.
In previous studies, other faults were observed in the DCV systems [31], including noise from ventilation, higher energy consumption than designed and users complaining, etc. Due to the complicated structure of the DCV system, too tight and asymmetrical ductwork is designed. During the installation of the system, the actuators and control sensors, e.g., the CO2 sensor or temperature sensor, are installed at the wrong place. It was even noted that, in some cases, electrical wires are not connected to the room terminal device. During the operation phase of the system, actuators are sometimes stuck. This means that it is not possible to accurately measure airflow rate if the exhaust air device is dirty.
Based on the previous and presented studies, the actions that are necessary to improve the existing situation are as follows:
  • Contract practices should be improved where there is financial sanction to put the ventilation systems in order;
  • Improvement of the (re-)commission and maintenance process;
  • Novel technology for measurement of a larger range of airflow rates;
  • Designer and maintenance training should be enhanced;
  • Industry appreciation and motivation of maintenance staff should be improved;
  • Better utilization of automation system where certain critical issues are continuously monitored;
  • Regular post-occupancy audits should be conducted to guarantee the system performance with different operation modes;
  • Utilization of AI technology, such as machine-learning, to predict faults and give advice to maintenance staff.

5. Conclusions

We assessed the performance of DCV systems in eight public buildings in southern Finland by selecting one space from each building and measuring the airflow rate in different system operation modes, as well as monitoring indoor air temperatures for a week. The results showed that only one DCV system was performing according to the designed manner. In all the others, either the airflows were wrong or the balance between supply and exhaust was off. Despite this, the indoor air temperatures stayed well within design threshold values in each space during the study period, and no complaints about IAQ or thermal comfort were reported from the space users either during or prior to the study. As a result, although the indoor comfort conditions were at acceptable level, it cannot be concluded that the DCV were working in the correct manner. In future studies, the investigation of the indoor climate should not only be focused on measurement indoors; the whole heating/cooling system needs to be checked at the same time.
Two major conclusions can be drawn from this result. Firstly, different kinds of faults seem to be very common in DCV systems. Secondly, these faults may be left undiscovered unless the system performance is thoroughly tested by a field measurement campaign. This is because, by only monitoring room air temperature (or IAQ), it is not possible to conclude that the system is working properly. To guarantee the system performance, special attention should be paid during the lifecycle (design, commissioning, operation and maintenance) management of the ventilation systems.

Author Contributions

Conceptualization, W.Z. and S.K.; methodology, W.Z., W.B. and S.K.; formal analysis, W.Z. and R.K.; writing—original draft preparation, W.Z.; writing—review and editing, S.K., S.L. and R.K.; supervision, R.K. All authors have read and agreed to the published version of the manuscript.

Funding

This research received no external funding.

Institutional Review Board Statement

Not applicable.

Informed Consent Statement

Not applicable.

Conflicts of Interest

The authors declare no conflict of interest.

References

  1. Energy Topics Energy. Available online: https://energy.ec.europa.eu/topics/energy-efficiency_en (accessed on 19 February 2022).
  2. Energy Topics Energy. Available online: https://energy.ec.europa.eu/index_en (accessed on 19 February 2022).
  3. EUR-Lex-32018L0844-EN-EUR-Lex. Available online: https://eur-lex.europa.eu/legal-content/EN/TXT/?uri=celex:32018L0844 (accessed on 20 July 2021).
  4. Mysen, M.; Schild, P.G. Requirements for Well Functioning Demand Controlled Ventilation. REHVA Eur. HVAC J. 2011, 48, 14–18. [Google Scholar]
  5. Sundell, J. On the History of Indoor Air Quality and Health. Indoor Air 2004, 14, 51–58. [Google Scholar] [CrossRef] [PubMed]
  6. Ilieș, D.C.; Marcu, F.; Caciora, T.; Indrie, L.; Ilieș, A.; Albu, A.; Costea, M.; Burtă, L.; Baias, Ș.; Ilieș, M.; et al. Inves-tigations of museum indoor microclimate and air quality. Case study from Romania. Atmosphere 2021, 12, 286. [Google Scholar] [CrossRef]
  7. Sadick, A.M.; Issa, M.H. Occupants’ Indoor Environmental Quality Satisfaction Factors as Measures of School Teachers’ Well-Being. Build. Environ. 2017, 119, 99–109. [Google Scholar] [CrossRef]
  8. Cheung, T.; Schiavon, S.; Graham, L.T.; Tham, K.W. Occupant Satisfaction with the Indoor Environment in Seven Commercial Buildings in Singapore. Build. Environ. 2021, 188, 107443. [Google Scholar] [CrossRef]
  9. Dodd, M. Comparing Energy Savings of Different VAV Systems; EnergySoft LLC: Novato, CA, USA, 2012; pp. 1–9. [Google Scholar]
  10. Mysen, M.; Berntsen, S.; Nafstad, P.; Schild, P.G. Occupancy Density and Benefits of Demand-Controlled Ventilation in Norwegian Primary Schools. Energy Build. 2005, 37, 1234–1240. [Google Scholar] [CrossRef]
  11. Hesaraki, A.; Holmberg, S. Demand-Controlled Ventilation in New Residential Buildings: Consequences on Indoor Air Quality and Energy Savings. Indoor Built Environ. 2015, 24, 162–173. [Google Scholar] [CrossRef] [Green Version]
  12. Okochi, G.S.; Yao, Y. A Review of Recent Developments and Technological Advancements of Variable-Air-Volume (VAV) Air-Conditioning Systems. Renew. Sustain. Energy Rev. 2016, 59, 784–817. [Google Scholar] [CrossRef]
  13. Yau, Y.H.; Tam, J.H. A Comparison Study for Active Chilled Beam and Variable Air Volume Systems for An Office Building. Energy Procedia 2018, 152, 378–383. [Google Scholar] [CrossRef]
  14. Maripuu, M.L. Demand controlled ventilation (DCV) for better IAQ and Energy Efficiency. REVHA J. 2011, 48, 26–30. [Google Scholar]
  15. Merema, B.; Breesch, H.; Sourbron, M.; Verplaetsen, J.; Van den Bossche, P. Demand controlled ventilation in practice: Case study. In Proceedings of the 36th AIVC Conference, Madrid, Spain, 23–24 September 2015. [Google Scholar]
  16. Yu, Y.; Liu, M.; Cho, Y.; Xu, K. Integrated Demand Controlled Ventilation for Single Duct VAV System with Conference Rooms. 2007. Available online: https://oaktrust.library.tamu.edu/bitstream/handle/1969.1/6228/ESL-IC-07-11-02.pdf;jsessionid=AF2117BB8A18F6C3F311F969A7E5C200?sequence=1 (accessed on 5 February 2022).
  17. Mysen, M.; Schild, P.; Cablé, A. Demand-Controlled Ventilation–Requirements and Commissioning. Guidebook on Well-Functioning and Energy-Optimal DCV. 2014. Available online: https://www.sintefbok.no/book/download/1028/vinfopubutgivelsersintef_fag_researchsintef_fag_nr_24_demand-controlled_ventilationnettsf_24pdf (accessed on 5 February 2022).
  18. Qin, J.; Wang, S. A fault detection and diagnosis strategy of VAV air-conditioning systems for improved energy and control performances. Energy Build. 2005, 37, 1035–1048. [Google Scholar] [CrossRef]
  19. Piette, M.A.; Kinney, S.K.; Haves, P. Analysis of an information monitoring and diagnostic system to improve building opera-tions. Energy Build. 2001, 33, 783–791. [Google Scholar] [CrossRef] [Green Version]
  20. Wang, S.; Zhou, Q.; Xiao, F. A system-level fault detection and diagnosis strategy for HVAC systems involving sensor faults. Energy Build. 2010, 42, 477–490. [Google Scholar] [CrossRef]
  21. Liang, Y.; Meng, Q.; Chang, S. Fault diagnosis and energy consumption analysis for variable air volume air conditioning system: A case study. Procedia Eng. 2017, 205, 834–841. [Google Scholar] [CrossRef]
  22. Kravchenko, I.; Kosonen, R.; Kilpeläinen, S. Performance Analysis of the Demand-Based Ventilation in a Nordic Apartment Building. Appl. Sci. 2020, 11, 176. [Google Scholar] [CrossRef]
  23. Haves, P. Fault modelling in component-based HVAC simulation. In Proceedings of the Building Simulation’97, Prague, Czech, 8–10 September 1997. [Google Scholar]
  24. Linder, R.; Dorgan, C.B. VAV systems work despite some design and application problems. ASHRAE Trans. 1997, 103, 807. [Google Scholar]
  25. Katipamula, S.; Brambley, M.R. Methods for fault detection, diagnostics, and prognostics for building systems—A review, part I. HvacR Res. 2005, 11, 3–25. [Google Scholar] [CrossRef]
  26. Soft Landings and Commissioning Management • Hydrock. Available online: https://www.hydrock.com/specialisms/soft-landings-and-commissioning-management/ (accessed on 5 February 2022).
  27. Wang, S.; Chen, Y. Fault-tolerant control for outdoor ventilation air flow rate in buildings based on neural network. Build. Environ. 2002, 37, 691–704. [Google Scholar] [CrossRef]
  28. Wang, H.; Chen, Y. A robust fault detection and diagnosis strategy for multiple faults of VAV air handling units. Energy Build. 2016, 127, 442–451. [Google Scholar] [CrossRef]
  29. Comstock, M.C.; Braun, J.E.; Groll, E.A. The sensitivity of chiller performance to common faults. HVACR Res. 2001, 7, 263–279. [Google Scholar] [CrossRef]
  30. D2 The National Building Code of Finland Indoor Climate and Ventilation of Buildings Regulations and Guidelines 2012—Google Search. Available online: http://www.puntofocal.gov.ar/notific_otros_miembros/fin41_t.pdf (accessed on 5 February 2022).
  31. Andersen, K.H.; Holøs, S.B.; Yang, A.; Thunshelle, K.; Fjellheim, Ø.; Jensen, R.L. Impact of Typical Faults Occurring in Demand-Controlled Ventilation on Energy and Indoor Environment in a Nordic Climate. In Proceedings of the E3S Web of Conferences, Tallinn, Estonia, 6–9 September 2020; EDP Sciences: Les Ulis, France, 2020; Volume 172, p. 09006. [Google Scholar]
Figure 1. The drawing of ventilation systems in Spaces 1–4.
Buildings 12 00378 g001
Figure 2. The drawing of ventilation systems in Spaces 5–8.
Buildings 12 00378 g002
Figure 3. The flowchart of measurement.
Buildings 12 00378 g003
Figure 4. Ventilation control mode: (a) ON/OFF control and (b) proportional control.
Buildings 12 00378 g004
Figure 5. (a) Terminal unit with pressure tubes which are folded on the grille for easy measurements and (b) airflow horns for units without pressure measurement possibilities.
Buildings 12 00378 g005
Figure 6. Room air temperature of Space 1 (meeting room) under the normal operation mode.
Buildings 12 00378 g006
Figure 7. Measured indoor air temperature distribution in the studied eight spaces and outdoor air temperature during the measurement period.
Buildings 12 00378 g007
Table 1. The basic information of eight studied building and their spaces.
SpaceBuilt in/Type of BuildingSpace Heating and Cooling Systems
Renovated in
1 (meeting room)/25 m21966/2017OfficeFan-coil units for heating
2 (office)/25 m21965/2015OfficeWater radiator for heating
3 (classroom)/60 m21942/2016EducationWater radiator for heating
4 (classroom)/18 m21968/2014EducationWater radiators for heating
5 (office)/10 m22018OfficeRadiant panels for heating/cooling
6 (meeting room)/20 m22012OfficeWater radiators for heating, chilled beams for cooling
7 (office)/20 m21969/2016OfficeWater radiators for heating, chilled beams for cooling
8 (meeting room)/25 m22003OfficeWater radiators for heating, chilled beams for cooling
Table 2. The control methods of the studied spaces.
SpaceControl TypeControl ParametersSupply Air Temperature Dependence
1: meeting roomON/OFFT + CO2Exhaust air temperature
2: officeON/OFFT + CO2 + boost buttonOutside air temperature
3: classroomProportionalT + CO2Outside air temperature
4: classroomProportionalT + CO2 + occupancyOutside air temperature
5: officeProportionalT + occupancyOutside air temperature
6: meeting roomProportionalT + CO2Exhaust air temperature
7: officeON/OFFT + CO2 + boost buttonExhaust air temperature
8: meeting roomProportionalT + CO2Outside air temperature
Table 3. Ventilation and air distribution design and control strategies for Type 1 spaces.
SpaceVentilation and Air Distribution DesignControl Strategy
1: meeting roomTwo supply and exhaust air devicesNormal mode: one supply and exhaust air damper open
Boost mode: second damper pair open when the CO2 > 900 ppm or/and exhaust air temperature > 24 °C
2: officeTwo supply air terminals and two exhaust air valvesNormal mode: one damper pair open while another is closed
Boost mode: two pairs of dampers open when the CO2 > 750 ppm or/and exhaust air temperature > 23 °C and occupancy button
3: classroomTwo supply nozzle ducts with a damper, three exhaust air valves with a damperNormal mode: dampers are opened at the minimum position
Boost mode: dampers fully opened. When CO2 > 700 ppm or 24 °C, the dampers start to open relatively until CO2 = 900 ppm or 26 °C.
4: classroomTwo supply air diffusers, one exhaust air device and two dampersNormal mode: 30% of maximum airflow
Boost mode: 90% of maximum airflow. When CO2 > 700 ppm or 21 °C, the dampers start to open relatively until CO2 = 900 ppm or 23 °C.
Table 4. Ventilation and air distribution design and control strategies for Type 2 space.
SpaceVentilation and Air Distribution DesignControl Strategy
5: officeOne supply air terminal, one exhaust air device and two dampersMinimum mode: unoccupied, 25% of maximum airflow
Normal mode: occupied, 66% of maximum airflow
Boost mode: maximum airflow when cooling panels are not sufficient and the room air temperature > 25 °C.
Table 5. Ventilation and air distribution design and control strategies for Type 3 spaces.
SpaceVentilation and Air Distribution DesignControl Strategy
6: meeting roomSupply air from two chilled beams with two dampers, two exhaust air valves with one damperNormal mode: dampers are opened to the minimum position
Boost mode: dampers fully opened. When CO2 > 500 ppm or 23 °C, the dampers start to open relatively until CO2 = 700 ppm or 24 °C.
7: officeSupply air from two chilled beams with two dampers, two exhaust air valves with two dampersNormal mode: one exhaust air damper and one supply air damper open
Boost mode: four dampers fully open when the CO2 > 800 ppm or/and exhaust air temperature > 25 °C and occupancy button
Table 6. Ventilation and air distribution design and control strategies for Type 4 space.
SpaceVentilation and Air Distribution DesignControl Strategy
8: meeting roomOne chilled beam (constant airflow rate), two supply air terminals with one damper, and three exhaust air valves with one damper.Normal mode: dampers are opened depend on the occupancy
Boost mode: dampers fully opened. When CO2 > 500 ppm or 23 °C, the dampers start to open relatively. The dampers are fully opened when CO2 = 700 ppm or 24 °C.
Table 7. Measured and designed airflows and control strategies for Type 1 spaces (all-air system with normal and boost modes).
SpaceModeSupply Airflow (L/s)Exhaust Airflow (L/s)Supply/Exhaust Ratio
MeasuredDesignMeasuredDesign
1 (meeting room)Normal1185033503.6
Boost81100241003.4
2 (office)Normal585076500.8
Boost1051001331000.8
3 (classroom)Normal56N/A36N/A1.6
Boost143180811801.8
4 (classroom)Normal10254117540.9
Boost1741802001800.9
Table 8. Measured and designed airflows for Type 2 space (all-air system with minimum, normal and boost modes).
SpaceModeSupply Airflow (L/s)Exhaust Airflow (L/s)Supply/Exhaust Ratio
MeasuredDesignMeasuredDesign
5 (office)MinimumN/A6N/A6N/A
Normal221716171.4
Boost302525251.2
Table 9. Measured and designed airflows for Type 3 spaces (air–water system with normal and boost modes).
SpaceModeSupply Airflow (L/s)Exhaust Airflow (L/s)Supply/Exhaust Ratio
MeasuredDesignMeasuredDesign
6 (meeting room)Normal38N/A49N/A0.8
Boost448053800.8
7 (office)Normal202022200.9
Boost384045400.9
Table 10. Measured and designed airflows for Type 4 space (both all-air and air–water systems with normal and boost modes).
SpaceModeSupply Airflow (L/s)Exhaust Airflow (L/s)Supply/Exhaust Ratio
MeasuredDesignMeasuredDesign
8 (meeting room)NormalN/AN/AN/AN/AN/A
Boost781001061000.7
Table 11. Comparison of eight DCV systems.
SpaceControl TypeCooling SystemSupply/Exhaust Ratio
1: meeting roomON/OFFall-air systemquite high
2: officeON/OFFall-air systemslight low
3: classroomProportionall-air systemquite high
4: classroomProportionall-air systemslight low
5: officeProportionall-air systemslight high
6: meeting roomProportionair-water systemslight low
7: officeON/OFFair-water systemgood
8: meeting roomProportionbothslight low
Publisher’s Note: MDPI stays neutral with regard to jurisdictional claims in published maps and institutional affiliations.

