Article

Influence of Building Density on Outdoor Thermal Environment of Residential Area in Cities with Different Climatic Zones in China—Taking Guangzhou, Wuhan, Beijing, and Harbin as Examples

1
School of Civil Engineering, Liaoning Technical University, Fuxin 123008, China
2
Faculty of Engineering, Tokyo Polytechnic University, Tokyo 164-8678, Japan
3
School of Urban Design, Wuhan University, Wuhan 430072, China
*
Author to whom correspondence should be addressed.
Buildings 2022, 12(3), 370; https://doi.org/10.3390/buildings12030370
Submission received: 24 January 2022 / Revised: 6 March 2022 / Accepted: 15 March 2022 / Published: 17 March 2022
(This article belongs to the Special Issue Building Energy-Saving Technology)

Abstract

:
Outdoor wind and thermal environments in residential areas are greatly affected by the distance between buildings. A short distance is conducive to providing shade, and a long distance can enhance ventilation between buildings. In this study, four cities with different latitudes in China (Guangzhou, Wuhan, Beijing, and Harbin) were selected to research the relationship between the distance between buildings and thermal environments of residential areas. The results show that (1) when the distance between buildings is small, it is easier for wind paths to form. Wind paths can strengthen the wind velocity. When the distance between buildings exceeds 40–50 m, the building density is small, the building’s resistance to the wind becomes smaller and smaller, and the wind speed will gradually increase. (2) When the distance is in the range of 20–50 m, the MRT (mean radiant temperature) rise rate of each city is similar. For every 10 m increase in the distance between buildings, the MRT increases by about 1.25 °C. (3) D = 50 m (D/H = 1.19) is an inflection point. When D is less than 50 m, within the range of 20–50 m, the smaller the D is, the lower the SET* (standard effective temperature) is, while when D is more than 50 m, the opposite trend is observed.

1. Introduction

In recent years, with extremely hot weather becoming common, heat-related illnesses have become a serious problem threatening public health and safety [1,2,3]. In developing countries such as China, air temperatures hit high records year by year, and deaths caused by heat stroke have also been increasing [4,5]. During summer days people feel hotter; in order to achieve thermal comfort, people use air conditioning more frequently and for longer time, and the exhaust heat from external air conditioning causes deterioration of the outdoor thermal environment of urban areas [6,7]. With the gradual depletion of traditional energy sources and the increasingly serious effects of global warming, passive climate adaptable architectural designs can have low energy consumptions, zero energy consumption, and even negative energy consumption [8]—these have attracted increasing attention from researchers. Obtaining optimal building density is an important method for achieving passive climate adaptability in the outdoor thermal environment of residential areas. Many studies have focused on optimizing the outdoor thermal environment using methods such as greenery, water features, and pavement materials [9,10,11,12,13,14,15]; other studies have focused on optimizing buildings, through the layout, height, and density [16,17,18,19,20,21,22,23]. Once a residential area is built, the building density is difficult to change; therefore, through simulation calculations, studying the optimal building density is an important method for achieving passive climate adaptation in outdoor thermal environments.
Building density has great impact on outdoor thermal environments. Kubota et al. [18] researched the relationship between the building density and the average wind velocity (V) at pedestrian level in residential neighborhoods by using wind tunnel test, and found that residential areas with low density (shallow street canyon) can enhance ventilation. Zhou et al. [24] researched the relationship between the outdoor wind environment and building density (different piloti ratio) in Wuhan. There are many studies [25,26,27] that only focus on the outdoor wind environment, but for residential streets in the daytime in summer, the influence of temperature and radiation is very large, which must be considered. Bourbia et al. [28] researched the relationship between the geometry and the microclimate (shade area and temperature) of urban street canyons. Under low latitude conditions, solar access to streets can always be decreased by increasing H/W to larger values. Johansson [29] studied the impact of urban geometry on outdoor thermal comfort in dry and hot climate, and analyzed the environment through temperature, wind speed, MRT, and PET (physiological equivalent temperature). Xuan et al. [30] studied the outdoor thermal environment (V, MRT, SET*) of residential communities with different building densities in Sendai, Japan, and Guangzhou, China, and obtained a series of quantitative simulation results. Taking Wuhan as an example, Zhou et al. [31] researched the outdoor thermal environment under different building densities (different piloti ratio), and gave the optimal range of the piloti ratio by considering various indicators, such as surface temperature, V, MRT, and SET*. The MRT can reflect the joint action results of outdoor temperature, radiation, and wind speed. The SET* takes human factors, such as human metabolic rate and clothing insulation, into account on the basis of MRT. The research on the relationship between urban building density and thermal environment in different latitudes in China is insufficient.
China has a vast territory with latitudinal values range from 3°51′ N to 53°33.5′ N. As shown in Figure 1, five climatic zones are contained in China. From south to north, the outdoor thermal environment of the hot summer and warm winter zone, the hot summer and cold winter zone, the cold zone, and the severe cold zone have various problems. In order to clarify the influence of building density on outdoor thermal environment in cities with different climatic zones in China, four Chinese cities (Figure 1) from the hot summer and warm winter zone to the severe cold zone were taken into account: Guangzhou (113°33′ E, 23°17′ N), Wuhan (114°13′ E, 30°62′ N), Beijing (116°47′ E, 39°80′ N), and Harbin (126°77′ E, 45°75′ N).
Therefore, this study will comprehensively consider the thermal environmental factors (V, T, MRT, SET*), and carry out the simulation study of building density in several cities in different climatic regions and at different latitudes in China. This study aims to clarify the relationships between outdoor thermal environment factors and building density, and the appropriate ranges of building density will be proposed.

2. The Prediction Method

2.1. The Prediction Process

To predict outdoor thermal environment with high prediction accuracy, coupling analyses of convection, conduction, and radiation [32] were carried out with a numerical analysis system by integrating STAR-CD/RADX (CD adapco Group, Melville, NY, USA; Star-CD is a commercially available computational fluid dynamics software that uses fully unstructured mesh generation techniques and finite volume methods) with additional codes. A 3D, nonlinear k-ε turbulence model proposed by Craft et al. (1996) was adopted in CFD convection analyses [33]. Figure 2 shows the flowchart of the prediction method used in this study, and the prediction method has been used in many previous studies [30,31,34,35]. Our analysis was conducted in three steps. In step 1, 3D radiation and 1D conduction were carried out in order to obtain the surface temperatures of the ground and the buildings. In step 2, we conducted a non-isothermal CFD analysis using the surface temperature result gained in step 1. In step 3, MRT was calculated according to the results of wind speed and temperature obtained in step 2, and SET* was calculated in combination with human metabolic rate and clothing insulation.

2.2. Accuracy and Validation

The predecessors of our research group have completed many comparisons and have verified the accuracy of this simulation method. Li et al. [35] simulated the outdoor wind environment using 15 turbulence models, and compared the simulation results with the wind tunnel test result provided by AIJ [36,37]. The results show that Suga cubic nonlinear k–ε model has high accuracy in solving the wind field.
All surfaces in the domain were divided into small surfaces to calculate the urban surface temperature. For each small surface, various factors were considered, including solar radiation, sky radiation, longwave radiation between the surface and other surfaces, convective heat transfer and latent heat transfer between the surface and ambient air, and conduction heat transfer through the surface. The shape factor was calculated by the Monte Carlo method [38,39] and the radiative heat transfer was calculated by Gebhart’s absorption factor [40]. Due to the different absorptivity under shortwave and longwave radiation, the values of Gebhart’s absorption factor were also different, so each surface was calculated separately. According to the former studies [34,41,42], and considering the above heat transfer, the urban surface temperature can be reproduced well.
Li et al. [43] carried out the actual measurement and numerical simulation in building blocks in Guangzhou in summer. Figure 3a shows the distribution of measuring points during actual measurement, and Figure 3b shows the analytical region in the simulation. Figure 4a shows velocity distribution and Figure 4b shows temperature distribution. Table 1 shows comparison between measurement and simulation values of velocities, and Table 2 lists the measurement and simulation values of temperatures in different points.
As seen from the above, the wind speed simulation values of all measured points are basically in agreement with the measured values except B2, B8, and B9. The maximum wind speed deviation is B9, and then B8 and B2, respectively. Measuring point 2 is located in the piloti space. Shrubs with a height of about 0.3 m are planted on the north and south sides of the piloti space to obstruct the air flow, but the grass did not sufficiently obstruct the air flow, so the wind velocity at B2 was greater than the measured value. B8 is located under tall trees with dense shade on the sidewalk, and B9 is located under the medium height trees with sparse shade at the intersection. The role of trees is neglected in the simulation, which leads to the simulation values of wind velocity at B8 and B9 being larger than the measured values. Except for B2 and B8, the simulated temperature values at all the measuring points were in good agreement with the measured values. The present simulation program is too simple to deal with the shrubs and trees, so the trees near B2 and above B8 and B9 cannot reflect the cooling effect of temperature well; as a result, the simulated temperature values at B2 and B8 are higher than the measured values. The simulated temperature at B9 is close to the measured value because the simulated wind speed is much higher than the measured wind speed. To sum up, the computer simulation method has good accuracy and can be used in case simulation calculation and research.

3. Simulation

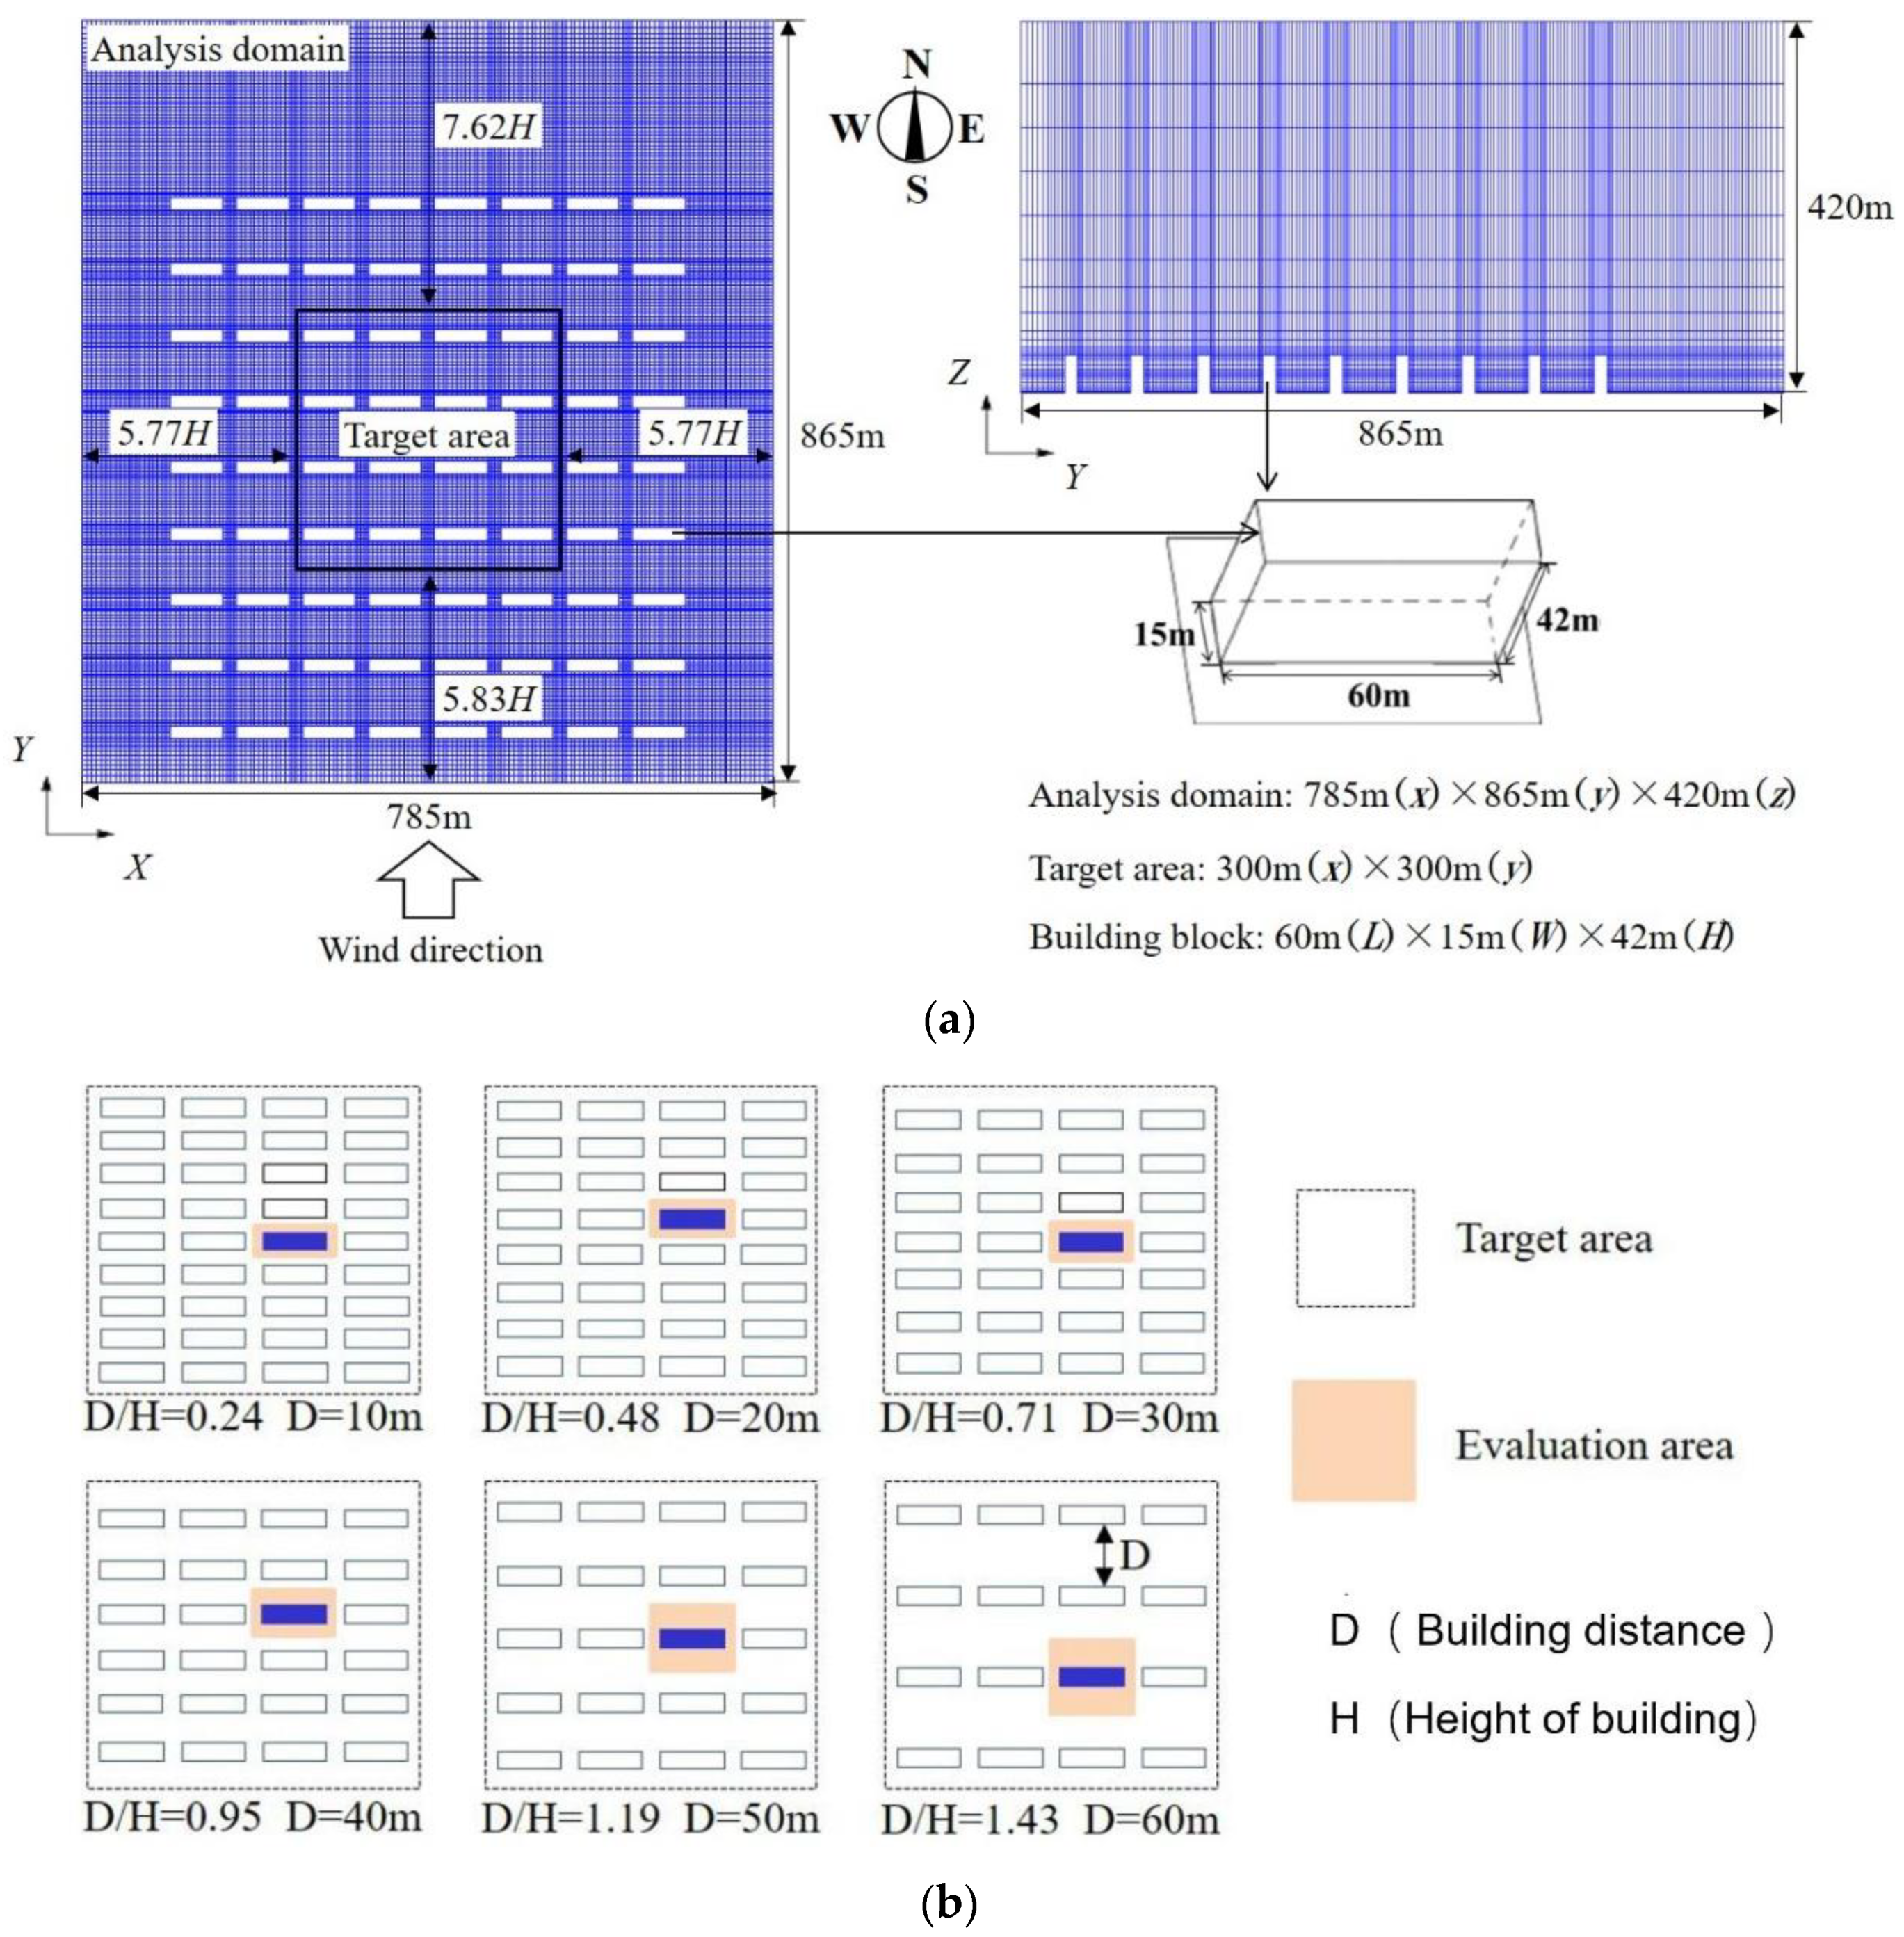
3.1. Analyses Model and Cases

Figure 5 shows the typical residential areas in Guangzhou, Wuhan, Beijing, and Harbin. It can be seen that the typical modern residential areas in China are mainly in determinant, facing from north–south. Figure 6 shows the analysis model used in this study. In Figure 6a, the size of a monomer building and the analysis domain size are listed, and the mesh number and grid partition are also shown.
According to the “Guidebook for Practical Applications of CFD to Pedestrian Wind Environment around Buildings (AIJ Guideline)” [6], published by Architectural Institute of Japan, the analyses model shown in Figure 6a was created based on the typical Chinese residential area. In order to know the effects of building arrangement on outdoor thermal environment, 6 different north–south building distances (from 10 m to 60 m) in Guangzhou, Wuhan, Beijing, and Harbin, a total of 24 cases were taken into account. The 6 building arrangements in the target area are shown in Figure 6b, and all the analyzed cases are listed in Table 3.

3.2. The Analysis Time

In our study, a weather database [44] in China was used. To compare the effect of distances between the north–south buildings on outdoor thermal environment in four different climatic cities in summer, 21 June, the summer solstice—when people in the northern hemisphere receive the most sunshine and daylight hours—was selected. Figure 7 was drawn according to the weather database, and the air temperatures on 21 June in cities of China were listed. Most people in China go to work from 8:00 to 17:00, and take a lunch break starting from 12:00. Among the three time points, Harbin, Beijing, and Wuhan have the highest temperature at 12:00, and Guangzhou has the highest temperature at 17:00. Guangzhou has low latitude, high solar radiation, and late sunset, so the temperature at 12:00 is not the highest. In order to facilitate comparison, 12:00 was selected as the analysis time.

3.3. The Analysis Conditions

The air temperatures on typical summer day (shown in Figure 7) were used as the initial air temperature data in each city. In each case, a 48 h radiation simulation was carried out including a 24 h preliminary simulation. In radiation simulation step, direct irradiance and global irradiance were considered.
CFD analyses were carried out when the sun reaches its highest position during the whole year (12:00 local solar time) in each case. The inlet wind velocities were given as 2 m/s at 10 m height, which obeyed the logarithm law with a power index of 0.3 in all the four cities. The whole analyses consist of 3 steps as shown in Figure 2. Analysis conditions in step 1 were listed in Table 4. In step 2, non-isothermal CFD analyses were carried out with the surface temperature result gain in step 1, and the analysis conditions are shown in Table 5.
In the final step, analyses were carried out based on the wind velocity and temperature results obtained in step 2. In this study, since the ground and building surfaces are covered with concrete, it is not necessary to solve the transfer equation of vapor. All the simulation area shares the same absolute humidity (0.024 kg/m3), and relative humidity was calculated based on the temperature results. MRT and human metabolic rate were carried out, and finally the SET* values in the target area were calculated.

4. Results

4.1. Surface Temperature

Figure 8 shows the distribution of surface temperature when D is between 10 m and 60 m with 10 m intervals in Guangzhou, Wuhan, Beijing, and Harbin. At 12:00, because of the high solar elevation, there are few shadows between buildings, so the surface temperature is very high. In Wuhan, Beijing, and Harbin, the lower the urban latitude is, the higher the surface temperature is. The average ground temperatures in Wuhan from WH-10 to WH-60 were 44.2 °C, 46.5 °C, 49.8 °C, 53.1 °C, 54.4 °C, and 55.6 °C, respectively. Since the air temperature at 12:00 in Guangzhou is lower than that in Wuhan (Figure 7), the surface temperature in Guangzhou is lower than that in Wuhan too.

4.2. Wind Velocity

Figure 9 shows the relationship between building distance and average wind velocity in four cities. With the distance between buildings becoming wider, the average wind velocities around the buildings in four cities decreases first and then increases. When D is small, it is easier to form wind paths. The wind path can strengthen the wind velocity. As the value of D gradually increases, the effect of the wind path decreases. When D exceeds 40–50 m, the building density is small, the building’s resistance to the wind becomes smaller and smaller, and the wind speed will gradually increase.

4.3. MRT

Figure 10a shows the distribution of MRT around the building at 1.5 m height when the sun is at its highest position. As the latitude getting lower, the average MRT at 1.5 m around the building increases. However, although the latitude of Guangzhou is lowest of the four cities, the results of average MRT in Guangzhou are lower than those cases in the other three cities. The reason is that Guangzhou city is located near the tropic of cancer, and when the sun at its highest position, the solar altitude is approximately close to 90°. When calculating the amount of radiation heat gain from the surrounding area for MRT, a smaller weight factor is assigned to the amount of radiation heat gain from upper direction than lateral direction.
Figure 10b shows the relationship between building distance and average MRT in four cities. The curve representing Wuhan is at the top and Harbin is at the bottom, which shows that from Wuhan to Harbin, with the increasing of latitude, the MRT value at 12:00 decreases. Among three key time points (8:00, 12:00, and 17:00), the temperature at 12:00 in Guangzhou is not the highest, so the MRT value is not the highest. The overall trend in Figure 10b is that MRT increases with the increasing of the distance between buildings. When the distance is in the range of 20–50 m, the MRT rise rate of each city is similar. For every 10 m increasing in the distance between buildings, the MRT increases by about 1.25 °C.

4.4. SET*

Figure 11a shows the result of SET* at 1.5 m around the building in 10 m, 30 m, and 60 m cases when the sun at 12:00 in the four selected cities. In Wuhan cases, the proportion of high SET* area is larger than the other three cities when the distance between buildings is the same. This is mainly because the Wuhan cases have higher MRT value as shown in Figure 10. In Wuhan, solar radiation reached the vertical surfaces are more than those in Guangzhou due to its relatively lower highest solar altitude, thus led to higher surface temperatures on vertical surfaces in Wuhan. On the other hand, as the latitude increases from Wuhan to Harbin, the highest solar altitude of each city decreases. This caused the proportion of building shadows in Wuhan to be less than those in Beijing and Harbin when the distances between the buildings are the same.
Figure 11b shows the relationship between building distance and mean SET* in four cities. As the distance between buildings decreases, a trend firstly increasing and then decreasing can be observed in the result of SET* around the building. For Wuhan, Beijing, and Harbin, D = 50 m (D/H = 1.19) is an inflection point. When D is less than 50 m, within the range of 20–50 m, the smaller the D is, the lower the SET* is, while D is more than 50 m, the opposite trend will be observed.

5. Discussion

The buildings in the simulation model of this study are simplified (Figure 6a), but the actual buildings have balconies, terraces, pitched rooves, and so on. In order to make the research results better applied to architectural design, it is necessary to conduct field survey on each typical residential area and compare the measured data with the simulated results so that the correction coefficient can be proposed.
On a typical meteorological day (21 June), the temperature at 12:00 in Wuhan, Beijing, and Harbin is the highest among the three key time points (8:00, 12:00, and 17:00), but the temperature in Guangzhou is the highest at 17:00. For comparison, 12:00 was selected as the analysis time. From the simulation results, the data of Guangzhou are quite different from those of the other three cities, and cannot form regular results with them. In future research, we can simulate the situation at 17:00 in Guangzhou to check whether it can achieve regularity with the simulation results of the other three cities.

6. Conclusions

Through simulation, we studied the relationships between thermal environment and building density in four different cities in China. The conclusions can be summarized as follows: for the outdoor wind environment of a residential area, when the distance between buildings is small, it is easier to form wind paths. The wind path can strengthen the wind velocity. As the value of the distance between buildings gradually increases, the effect of the wind path decreases. When the distance between buildings exceeds 40–50 m, the building density is low, the building’s resistance to the wind becomes smaller and smaller, and the wind speed will gradually increase.
The overall trend of relationship between building density and MRT is that MRT increases with the increase in the distance between buildings. When the distance is in the range of 20–50 m, the MRT rise rate of each city is similar. For every 10 m increase in the distance between buildings, the MRT increases by about 1.25 °C.
As the distance between buildings decreases, a trend firstly increasing and then decreasing can be observed in the results; for Wuhan, Beijing, and Harbin, D = 50 m (D/H = 1.19) is an inflection point. When D is less than 50 m, within the range of 20–50 m, the smaller the D is, the lower the SET* is; meanwhile, when D is more than 50 m, the opposite trend will be observed.

Author Contributions

Conceptualization, G.Y. and Z.Z.; methodology, Y.X.; software, G.Y. and Z.Z.; validation, Y.X.; data curation, G.Y. and Z.Z.; writing—original draft preparation, G.Y. and Z.Z.; writing—review and editing, Z.Z.; funding acquisition, G.Y. and Z.Z.. All authors have read and agreed to the published version of the manuscript.

Funding

This project is funded by the science and technology funds from Liaoning Education Department (Grant No. LJ2019QL007) and the National Natural Science Foundation of China (Grant No. 51808410).

Institutional Review Board Statement

Not applicable.

Informed Consent Statement

Not applicable.

Conflicts of Interest

The authors declare no conflict of interest.

References

  1. Medina-Ramón, M.; Zanobetti, A.; Cavanagh, D.P.; Schwartz, J. Extreme temperatures and mortality: Assessing effect modification by personal characteristics and specific cause of death in a multi-city case-only analysis. Environ. Health Perspect. 2006, 114, 1331–1336. [Google Scholar] [CrossRef]
  2. Founda, D.; Giannakopoulos, C. The exceptionally hot summer of 2007 in Athens, Greece—A typical summer in the future climate? Glob. Planet. Chang. 2009, 67, 227–236. [Google Scholar] [CrossRef]
  3. Harlan Sharon, L.; Ruddell Darren, M. Climate change and health in cities: Impacts of heat and air pollution and potential co-benefits from mitigation and adaptation. Curr. Opin. Environ. Sustain. 2011, 3, 126–134. [Google Scholar] [CrossRef]
  4. Wu, W.; Xiao, Y.; Li, G.; Zeng, W.; Lin, H.; Rutherford, S.; Xu, Y.; Luo, Y.; Xu, X.; Chu, C.; et al. Temperature-mortality relationship in four subtropical Chinese cities: A time-series study using a distributed lag non-linear model. Sci. Total Environ. 2013, 449, 355–362. [Google Scholar] [CrossRef]
  5. Liu, T.; Xu, Y.; Zhang, Y. Associations between risk perception, spontaneous adaptation behavior to heat waves and heatstroke in Guangdong province, China. BMC Public Health 2013, 13, 913. [Google Scholar] [CrossRef] [Green Version]
  6. Watkins, R.; Palmer, J.; Kolokotroni, M.; Littlefair, P. The balance of the annual heating and cooling demand. within the London urban heat island. Build. Serv. Eng. 2002, 23, 207–213. [Google Scholar] [CrossRef]
  7. Santamouris, M.; Papanikolaou, N.; Livada, I.; Koronakis, I.; Georgakis, C.; Argiriou, A.; Assimakopoulos, D.N. On the impact of urban climate on the energy consumption of buildings. Sol. Energy 2001, 70, 201–216. [Google Scholar] [CrossRef]
  8. Song, Q.; Yang, L.; Yin, B. Building for the Climate Change: Passive Building. Huazhong Arch. 2014, 4, 11–15. [Google Scholar]
  9. Hong, B.; Lin, B. Numerical studies of the outdoor wind environment and thermal comfort at pedestrian level in housing blocks with different building layout patterns and trees arrangement. Renew. Energy 2015, 73, 18–27. [Google Scholar] [CrossRef]
  10. Hallaab, J.M. The potential of tree planting to climate-proof high density residential areas in Manchester, UK. Landsc. Urban Plan. 2012, 104, 410–417. [Google Scholar]
  11. Pan, J.; Li, M. Impact of underlying surface structures of various urban blocks on the thermal environment by taking Lanzhou as a case study. J. Saf. Environ. 2012, 6, 140–145. [Google Scholar]
  12. Whang, S.; Jeon, M.; Lee, S.; Kim, T.; Leigh, S. The effects of ground cover and shading on an outdoor thermal environment in an apartment complex. Int. J. Sustain. Build. Technol. Urban Dev. 2012, 3, 219–228. [Google Scholar] [CrossRef]
  13. Weng, Q.; Lu, D.; Schubring, J. Estimation of land surface temperature-vegetation abundance relationship for urban heat island studies. Remote Sens. Environ. 2004, 89, 467–483. [Google Scholar] [CrossRef]
  14. Arnfield, A.J. Two decades of urban climate research: A review of turbulence, exchanges of energy and water, and the urban heat island. Int. J. Clim. 2003, 23, 1–26. [Google Scholar] [CrossRef]
  15. Santamouris, M. Cooling the cities—A review of reflective and green roof mitigation technologies to fight heat island and improve comfort in urban environments. Sol. Energy 2014, 103, 682–703. [Google Scholar] [CrossRef]
  16. Ying, X.Y.; Zhu, W.; Hokao, K. Comparative Study of the Effect on Outdoor Wind Environment by High-rise Buildings Layout Types. Sci. Geogr. Sin. 2013, 33, 1097–1103. [Google Scholar]
  17. Hsieh, C.M.; Chen, H.; Ooka, R.; Yoon, J.O.; Kato, S.; Miisho, K. Simulation analysis of site design and layout planning to mitigate thermal environment of riverside residential development. Build. Simul. 2010, 3, 51–61. [Google Scholar] [CrossRef]
  18. Kubota, T.; Miura, M.; Tominaga, Y.; Mochida, A. Wind tunnel tests on the relationship between building density and pedestrian-level wind velocity: Development of guidelines for realizing acceptable wind environment in residential neighborhoods. Build. Environ. 2008, 43, 1699–1708. [Google Scholar] [CrossRef]
  19. Ying, X.; Zhu, W.; Hokao, K.; Ge, J. Numerical research of layout effect on wind environment around high-rise buildings. Arch. Sci. Rev. 2013, 56, 272–278. [Google Scholar] [CrossRef]
  20. Ali-Toudert, F.; Mayer, H. Numerical study on the effects of aspect ratio and orientation of an urban street canyon on outdoor thermal comfort in hot and dry climate. Build. Environ. 2006, 41, 94–108. [Google Scholar] [CrossRef]
  21. Juan, A.A.; Karmele, H. A comparison of thermal comfort conditions in four urban spaces by means of measurements and modelling techniques. Build. Environ. 2015, 93, 245–257. [Google Scholar]
  22. Johansson, E.; Emmanuel, R. The influence of urban design on outdoor thermal comfort in the hot, humid city of Colombo, Sri Lanka. Int. J. Biometeorol. 2006, 51, 119–133. [Google Scholar] [CrossRef] [PubMed]
  23. Hwang, R.L.; Lin, T.P.; Matzarakis, A. Seasonal effects of urban street shading on long-term outdoor thermal comfort. Build. Environ. 2011, 46, 863–870. [Google Scholar] [CrossRef]
  24. Zhou, Z.; Deng, Q.; Mochida, A. Effect of Piloti on Wind Environment in Residential Area in a Hot and Humid City, Taking Residential Area in Wuhan as Study Case. In Proceedings of the 23rd Symposium on Wind Engineering, Tokyo, Japan, 12 December 2014; Volume 23, pp. 73–78. [Google Scholar]
  25. Yang, F.; Qian, F.; Lau, S.S.Y. Urban form and density as indicators for summertime outdoor ventilation potential: A case study on high-rise housing in Shanghai. Build. Environ. 2013, 70, 122–137. [Google Scholar] [CrossRef]
  26. Jin, H.; Liu, Z.; Jin, Y. The Effects of Residential Area Building Layout on Outdoor Wind Environment at the Pedestrian Level in Severe Cold Regions of China. Sustainability 2017, 9, 2310. [Google Scholar] [CrossRef] [Green Version]
  27. Du, Y.; Mak, C. Improving pedestrian level low wind velocity environment in high-density cities: A general framework and case study. Sustain. Cities Soc. 2018, 42, 314–324. [Google Scholar] [CrossRef] [PubMed]
  28. Bourbia, F.; Awbi, H.B. Building cluster and shading in urban canyon for hot dry climate: Part 2: Shading simulations. Renew. Energy 2004, 29, 291–301. [Google Scholar] [CrossRef]
  29. Johansson, E. Influence of urban geometry on outdoor thermal comfort in a hot dry climate: A study in Fez, Morocco. Build. Environ. 2006, 41, 1326–1338. [Google Scholar] [CrossRef]
  30. Xuan, Y.; Yang, G.; Li, Q.; Mochida, A. Outdoor thermal environment for different urban forms under summer conditions. Build. Simul. 2016, 9, 281–296. [Google Scholar] [CrossRef]
  31. Zhou, Z.; Deng, Q.; Yang, G.; Lin, Y. Quantitative Study of Using Piloti for Passive Climate Adaptability in a Hot-Summer and Cold-Winter City in China. Int. J. Environ. Res. Public Health 2018, 15, 2202. [Google Scholar] [CrossRef] [PubMed] [Green Version]
  32. Yoshida, S.; Murakami, S.; Ooka, R.; Mochida, A.; Tominaga, Y. CFD Prediction of Thermal Comfort in Microscale Wind Climate. In Proceedings of the 3rd International Symposium on Computational Wind Engineering, Tokyo, Japan, 14 January 2000; pp. 27–30. [Google Scholar]
  33. Craft, T.J.; Launder, B.E.; Suga, K. Development and application of a cubic eddy-viscosity model of turbulence. Int. J. Heat Fluid Flow 1996, 17, 108–115. [Google Scholar] [CrossRef]
  34. Chen, H.; Ooka, R.; Harayama, K.; Kato, S.; Li, X. Study on outdoor thermal environment of apartment block in Shenzhen, China with coupled simulation of convection, radiation and conduction. Energy Build. 2004, 36, 1247–1258. [Google Scholar] [CrossRef]
  35. Li, Q.; Mochida, A.; Meng, Q.; Zhao, L. Comparison of Turbulence Models for Numerical Simulation of Outdoor Wind Environment around Building. J. South China Univ. Technol. 2011, 39, 121–127. [Google Scholar]
  36. Yoshie, R.; Mochida, A.; Tominaga, Y.; Kataoka, H.; Harimoto, K.; Nozu, T.; Shirasawa, T. Cooperative project for CFD prediction of pedestrian wind environment in the Architectural Institute of Japan. J. Wind. Eng. Ind. Aerodyn. 2007, 95, 1551–1578. [Google Scholar] [CrossRef]
  37. Yoshie, R.; Mochida, A.; Tominaga, Y.; Shirasawa, T.; Tanaka, H. AIJ Cooperative project for practical applications of CFD to air ventilation, pollutant and thermal diffusion in urban areas. In Proceedings of the Seventh International Conference on Urban Climate, Yokohama, Japan, 29 June–3 July 2009. [Google Scholar]
  38. Howell, J.R.; Perlmutter, M. Monte Carlo Solution of Thermal Transfer through Radiant Media between Gray Walls. J. Heat Transf. 1964, 86, 116–122. [Google Scholar] [CrossRef]
  39. Omori, T.; Yang, J.; Kato, S.; Murakami, S. Radiative Heat Transfer Analysis Method for Coupled Simulation of Convection and Radiation in Large-Scale and Complicated Enclosures: Part 1-Accurate Radiative Heat Transfer Analysis based on Monte Carlo Method. Trans. Soc. Heat. Air-Cond. Sanit. Eng. Jpn. 2003, 28, 103–113. [Google Scholar]
  40. Gebhart, B. A New Method for Calculating Radiant Exchanges. ASHRAE Trans. 1959, 65, 321–332. [Google Scholar]
  41. Schoonhoven, C.B.; Woolley, J.L. Urban thermal environment measurements and numerical simulation for an actual complex urban area covering a large district heating and cooling system in summer. Atmos. Environ. 2005, 39, 6362–6375. [Google Scholar]
  42. Mochida, A.; Yoshino, H.; Miyauchi, S.; Mitamura, T. Total analysis of cooling effects of cross-ventilation affected by microclimate around a building. Sol. Energy 2006, 80, 371–382. [Google Scholar] [CrossRef]
  43. Li, Q. Effects of Building Clusters’ Planning and Design on Outdoor Microclimate in Hot and Humid Zone; South China University of Technology: Guangzhou, China, 2009. [Google Scholar]
  44. Nation Meteorological Information Center. China’s Special Meteorological Data Set for Thermal Environment Analysis; China Architecture & Building Press: Beijing, China, 2005. [Google Scholar]
Figure 1. Layout of five climatic zones in China and the location of target cities.
Buildings 12 00370 g001
Figure 2. The flowchart of the prediction method for the outdoor thermal environment.
Buildings 12 00370 g002
Figure 3. Measuring points and the analytical region. (a) The distribution of measuring points during the actual measurement. (b) The analytical region in the simulation.
Buildings 12 00370 g003
Figure 4. Simulation results at the height of 1.5 m above the ground (14:00, 15 August). (a) Velocity distribution. (b) Temperature distribution.
Buildings 12 00370 g004aBuildings 12 00370 g004b
Figure 5. Residential area in cities of China. (a) Guangzhou, (b) Wuhan, (c) Beijing, (d) Harbin.
Buildings 12 00370 g005
Figure 6. Analysis model used in this study. (a) Size and mesh of analysis model. (b) Different D/H and arrangement in the target area.
Buildings 12 00370 g006
Figure 7. Air temperature on 21 June.
Buildings 12 00370 g007
Figure 8. The distribution of outdoor surface temperature at 12:00.
Buildings 12 00370 g008
Figure 9. The relationship between building distance and average V in the four cities.
Buildings 12 00370 g009
Figure 10. MRT results. (a) The distribution of MRT at 1.5 m, (b) The relationship between building distance and average MRT in four cities.
Buildings 12 00370 g010
Figure 11. Results of SET*. (a) The distribution of SET* at 1.5 m. (b) Relationship between building distance and mean SET.
Buildings 12 00370 g011aBuildings 12 00370 g011b
Table 1. Comparison between measurement and simulation values of velocities at 14:00, 15 August (m/s).
Measuring PointB1B2B3B4B7B8B9
Measuring value0.700.360.670.270.270.420.58
Simulation value0.690.600.680.300.230.620.85
Difference0.01−0.24−0.01−0.030.04−0.20−0.27
Table 2. Comparison between measurement and simulation values of temperatures at 14:00, 15 August (°C).
Measuring PointB1B2B3B4B5B6B7B8B9
Measuring value34.4333.1734.0134.4333.5933.5934.4333.5934.01
Simulation value34.0333.8934.0434.4233.9033.8934.3735.0033.71
Difference0.400.720.030.01−0.31−0.300.06−1.410.30
Table 3. Analysis cases.
Case NameAnalysis Date and TimeAir Temperature (°C)Latitude (°)The Distance between Buildings D (m) Building Height H (m)D/H
GZ-106/2130.0 °C
(Noon)
Guangzhou
23°17′ N
10420.24
GZ-20200.48
GZ-30300.71
GZ-40400.95
GZ-50501.19
GZ-60601.43
WH-106/2132.2 °C
(Noon)
Wuhan
30°62′ N
10420.24
WH-20200.48
WH-30300.71
WH-40400.95
WH-50501.19
WH-60601.43
BJ-106/2129.5 °C
(Noon)
Beijing
39°80′ N
10420.24
BJ-20200.48
BJ-30300.71
BJ-40400.95
BJ-50501.19
BJ-60601.43
HRB-106/2128.0 °C
(Noon)
Harbin
45°75′ N
10420.24
HRB-20200.48
HRB-30300.71
HRB-40400.95
HRB-50501.19
HRB-60601.43
Note: GZ—Guangzhou; WH—Wuhan; BJ—Beijing; HRB—Harbin.
Table 4. Analysis conditions in step 1.
Analysis Date and Time6/20, 00:00–6/21, 24:00
Domain Size785 m (x) × 865 m (y) × 420 m (z)
Analysis TypeThree-dimensional analysis
Analysis StateUnsteady state
Turbulence ModelA cubic nonlinear k-ε model proposed by Craft et al. (1996)
Building Volume60 m (x) × 15 m (y) × 42 m (z)
TemperatureTemperature conditions in Guangzhou, Wuhan, Beijing and Harbin (Figure 6)
Convective Heat Transfer CoefficientIndoor: 5 W/m2·KOutdoor: 12 W/m2·K
Table 5. Analysis conditions in Step 2.
Analysis Date and Time6/21, 12:00
Domain Size785 m (x) × 865 m (y) × 420 m (z)
Analysis StateSteady state
Turbulence ModelSuga’s cubic nonlinear k-ε model
InflowThe wind direction: Southward
Wind speed: 2 m/s (10 m)
u〉:〈u(z)〉 = 〈us〉 (z/zs)^α
α = 0.3 ,   z s = 10   m ,   u s = 2   m / s
k : k ( z ) = ( I ( z ) u ( z ) ) 2
I ( z ) = 0.1 ( z / z G ) ( α 0.05 )
z G = 420   m
ε : ε ( z ) = C μ 1 / 2 k ( z ) u s z s α ( z z s ) ( α 1 )
C μ = 0.09
Outflow u ,   v ,   w ,   k ,   ε , T : zero gradient
Lateral and Upper Surfaces u ,   v ,   k ,   ε : zero gradient, w = 0
Ground and Building SurfacesVelocity: Logarithmic law for smooth walls
Temperature: 6/21 12:00 (True solar time)
The result of step1
Advection Term Scheme u ,   v ,   w ,   k ,   ε ,   T : M A R S
Coupling AlgorithmSIMPLE
Publisher’s Note: MDPI stays neutral with regard to jurisdictional claims in published maps and institutional affiliations.

