
Dynamic Centrifuge Test and Numerical Modelling of the Seismic Response of the Tunnel in Cohesive Soil Foundation

Abstract
:1. Introduction
2. Centrifuge Test
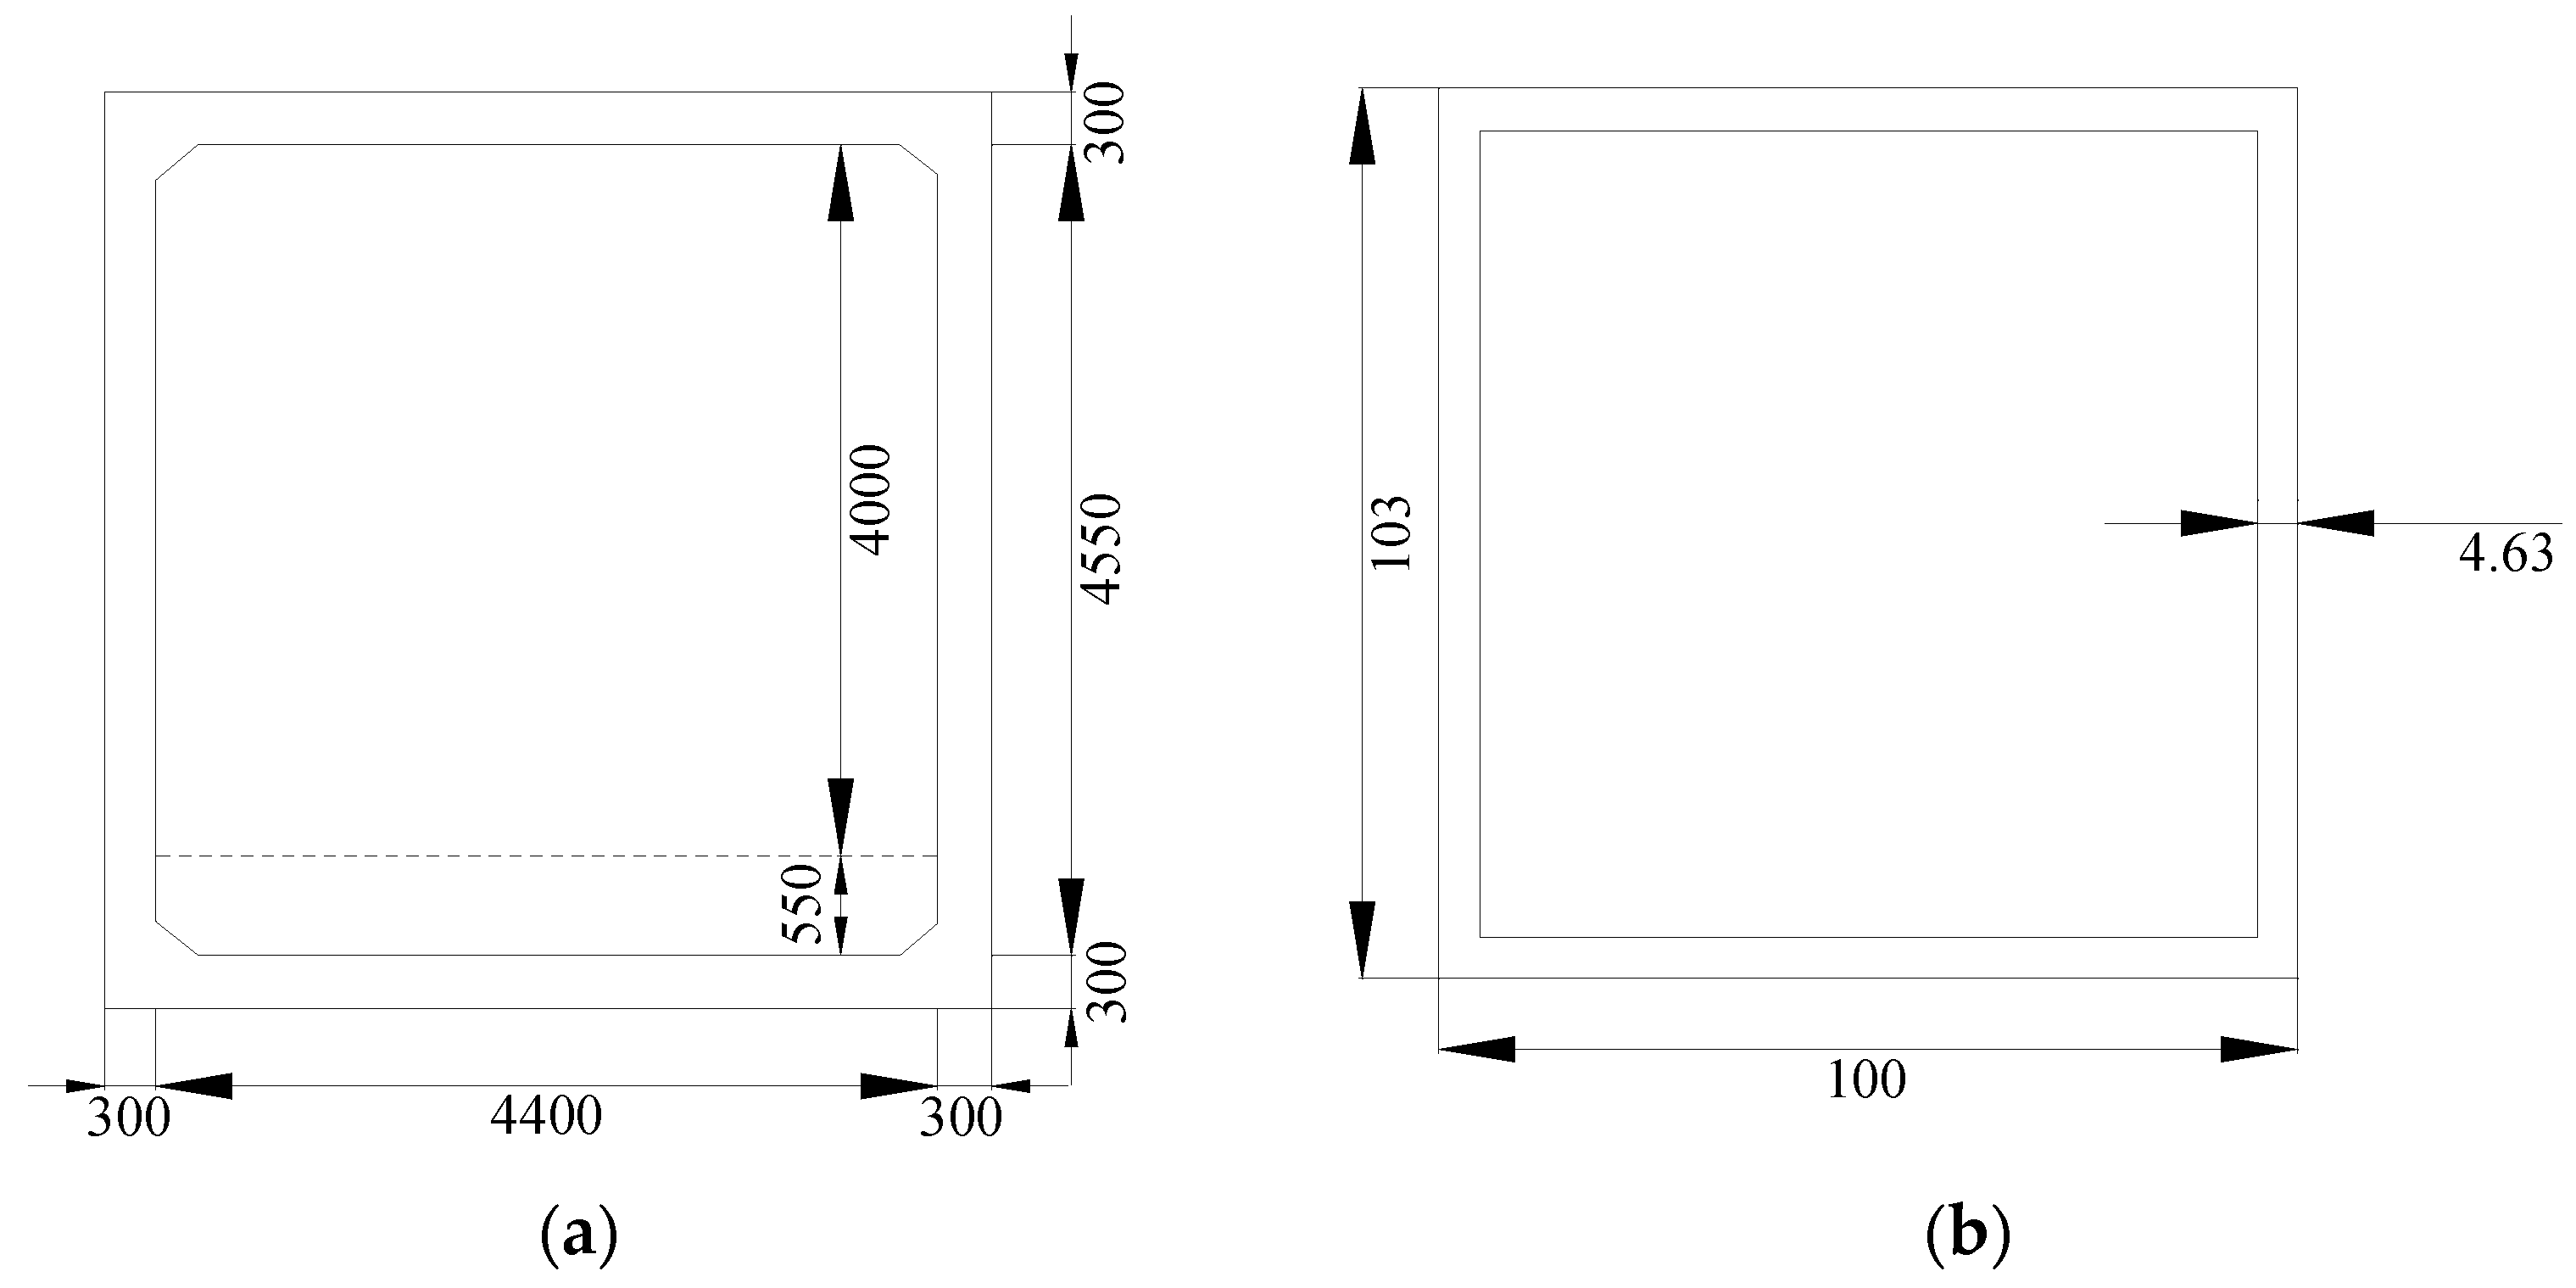
2.1. Tunnel Model
2.2. Preparation of Cohesive Soil Samples
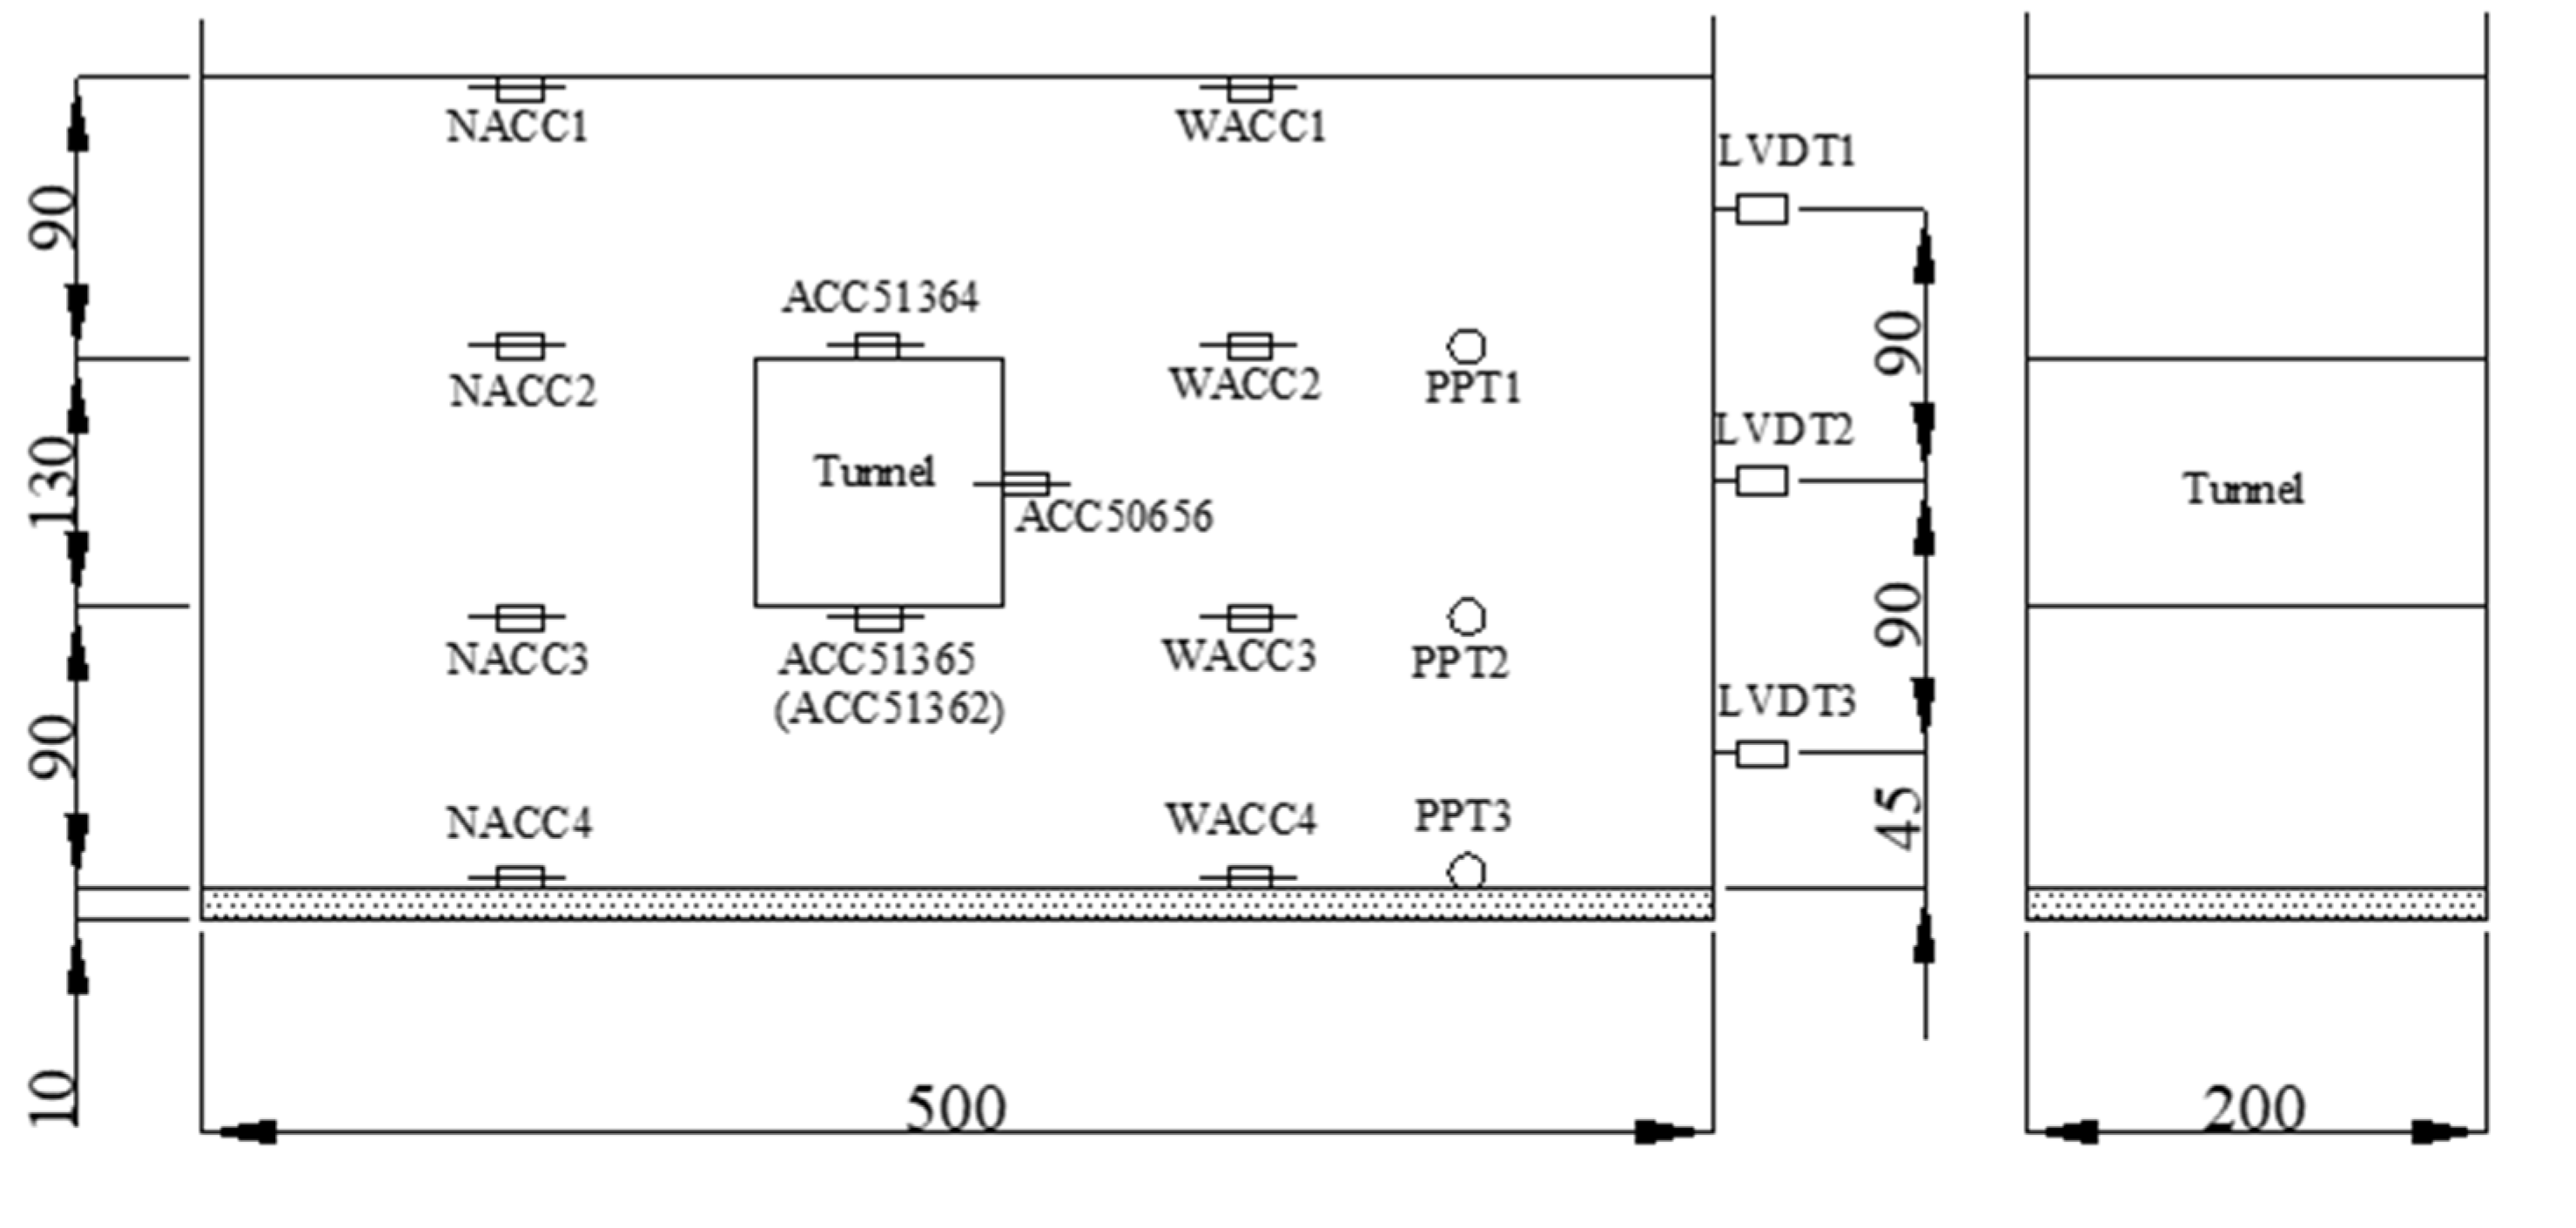
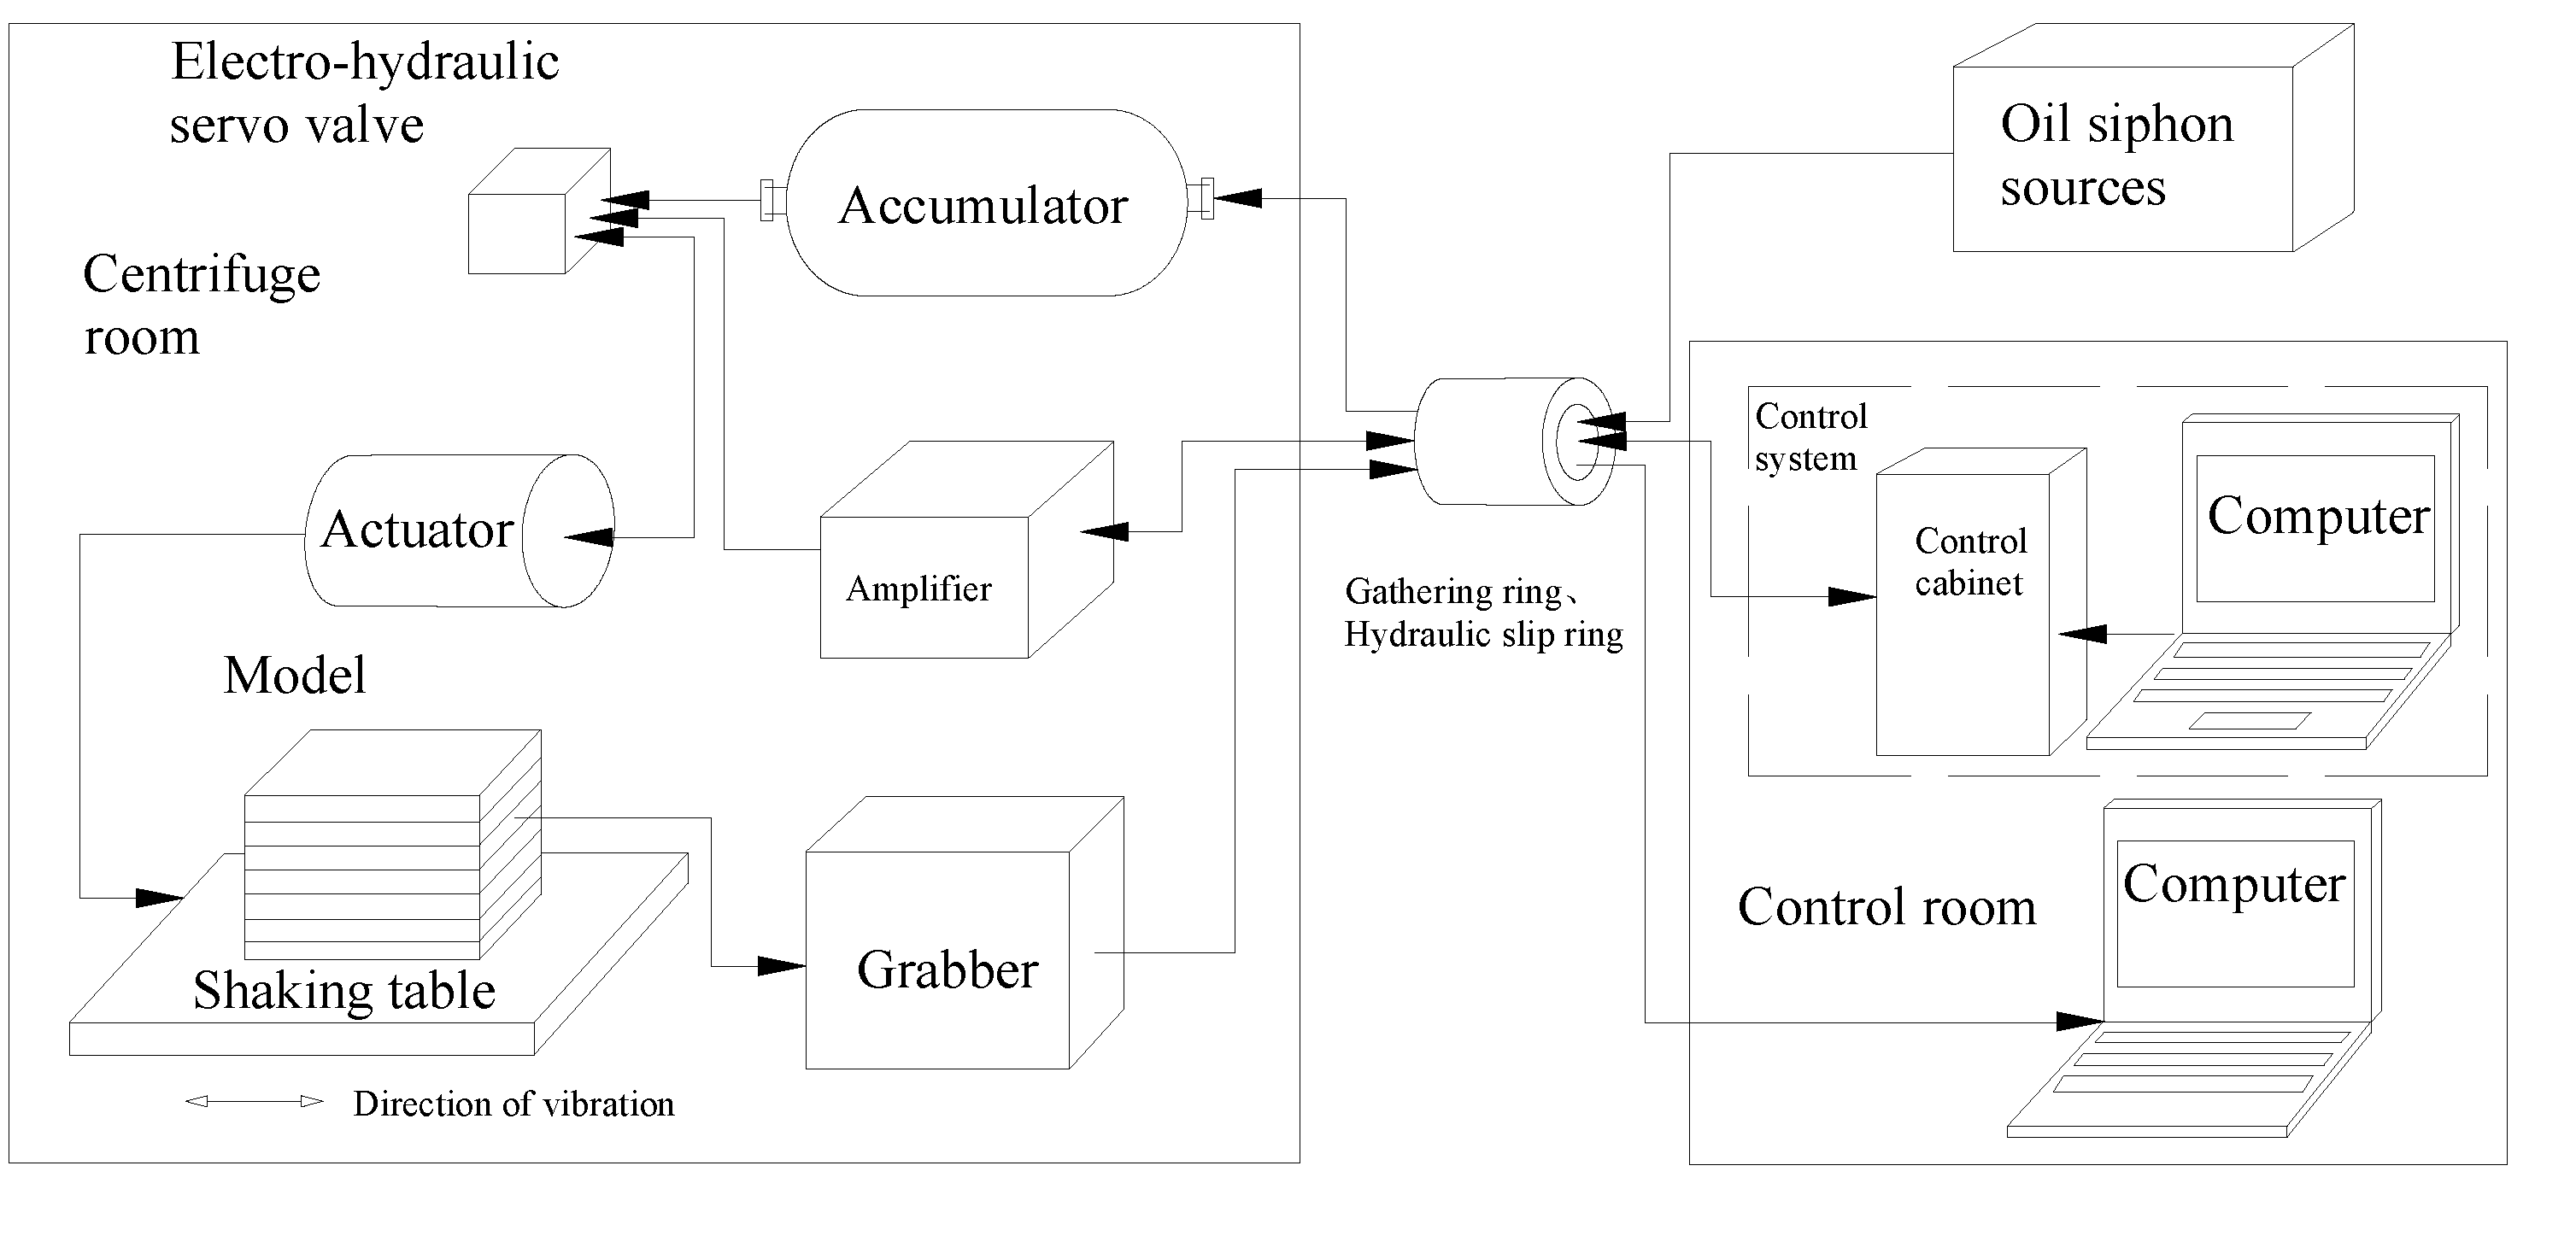
2.3. Model Device
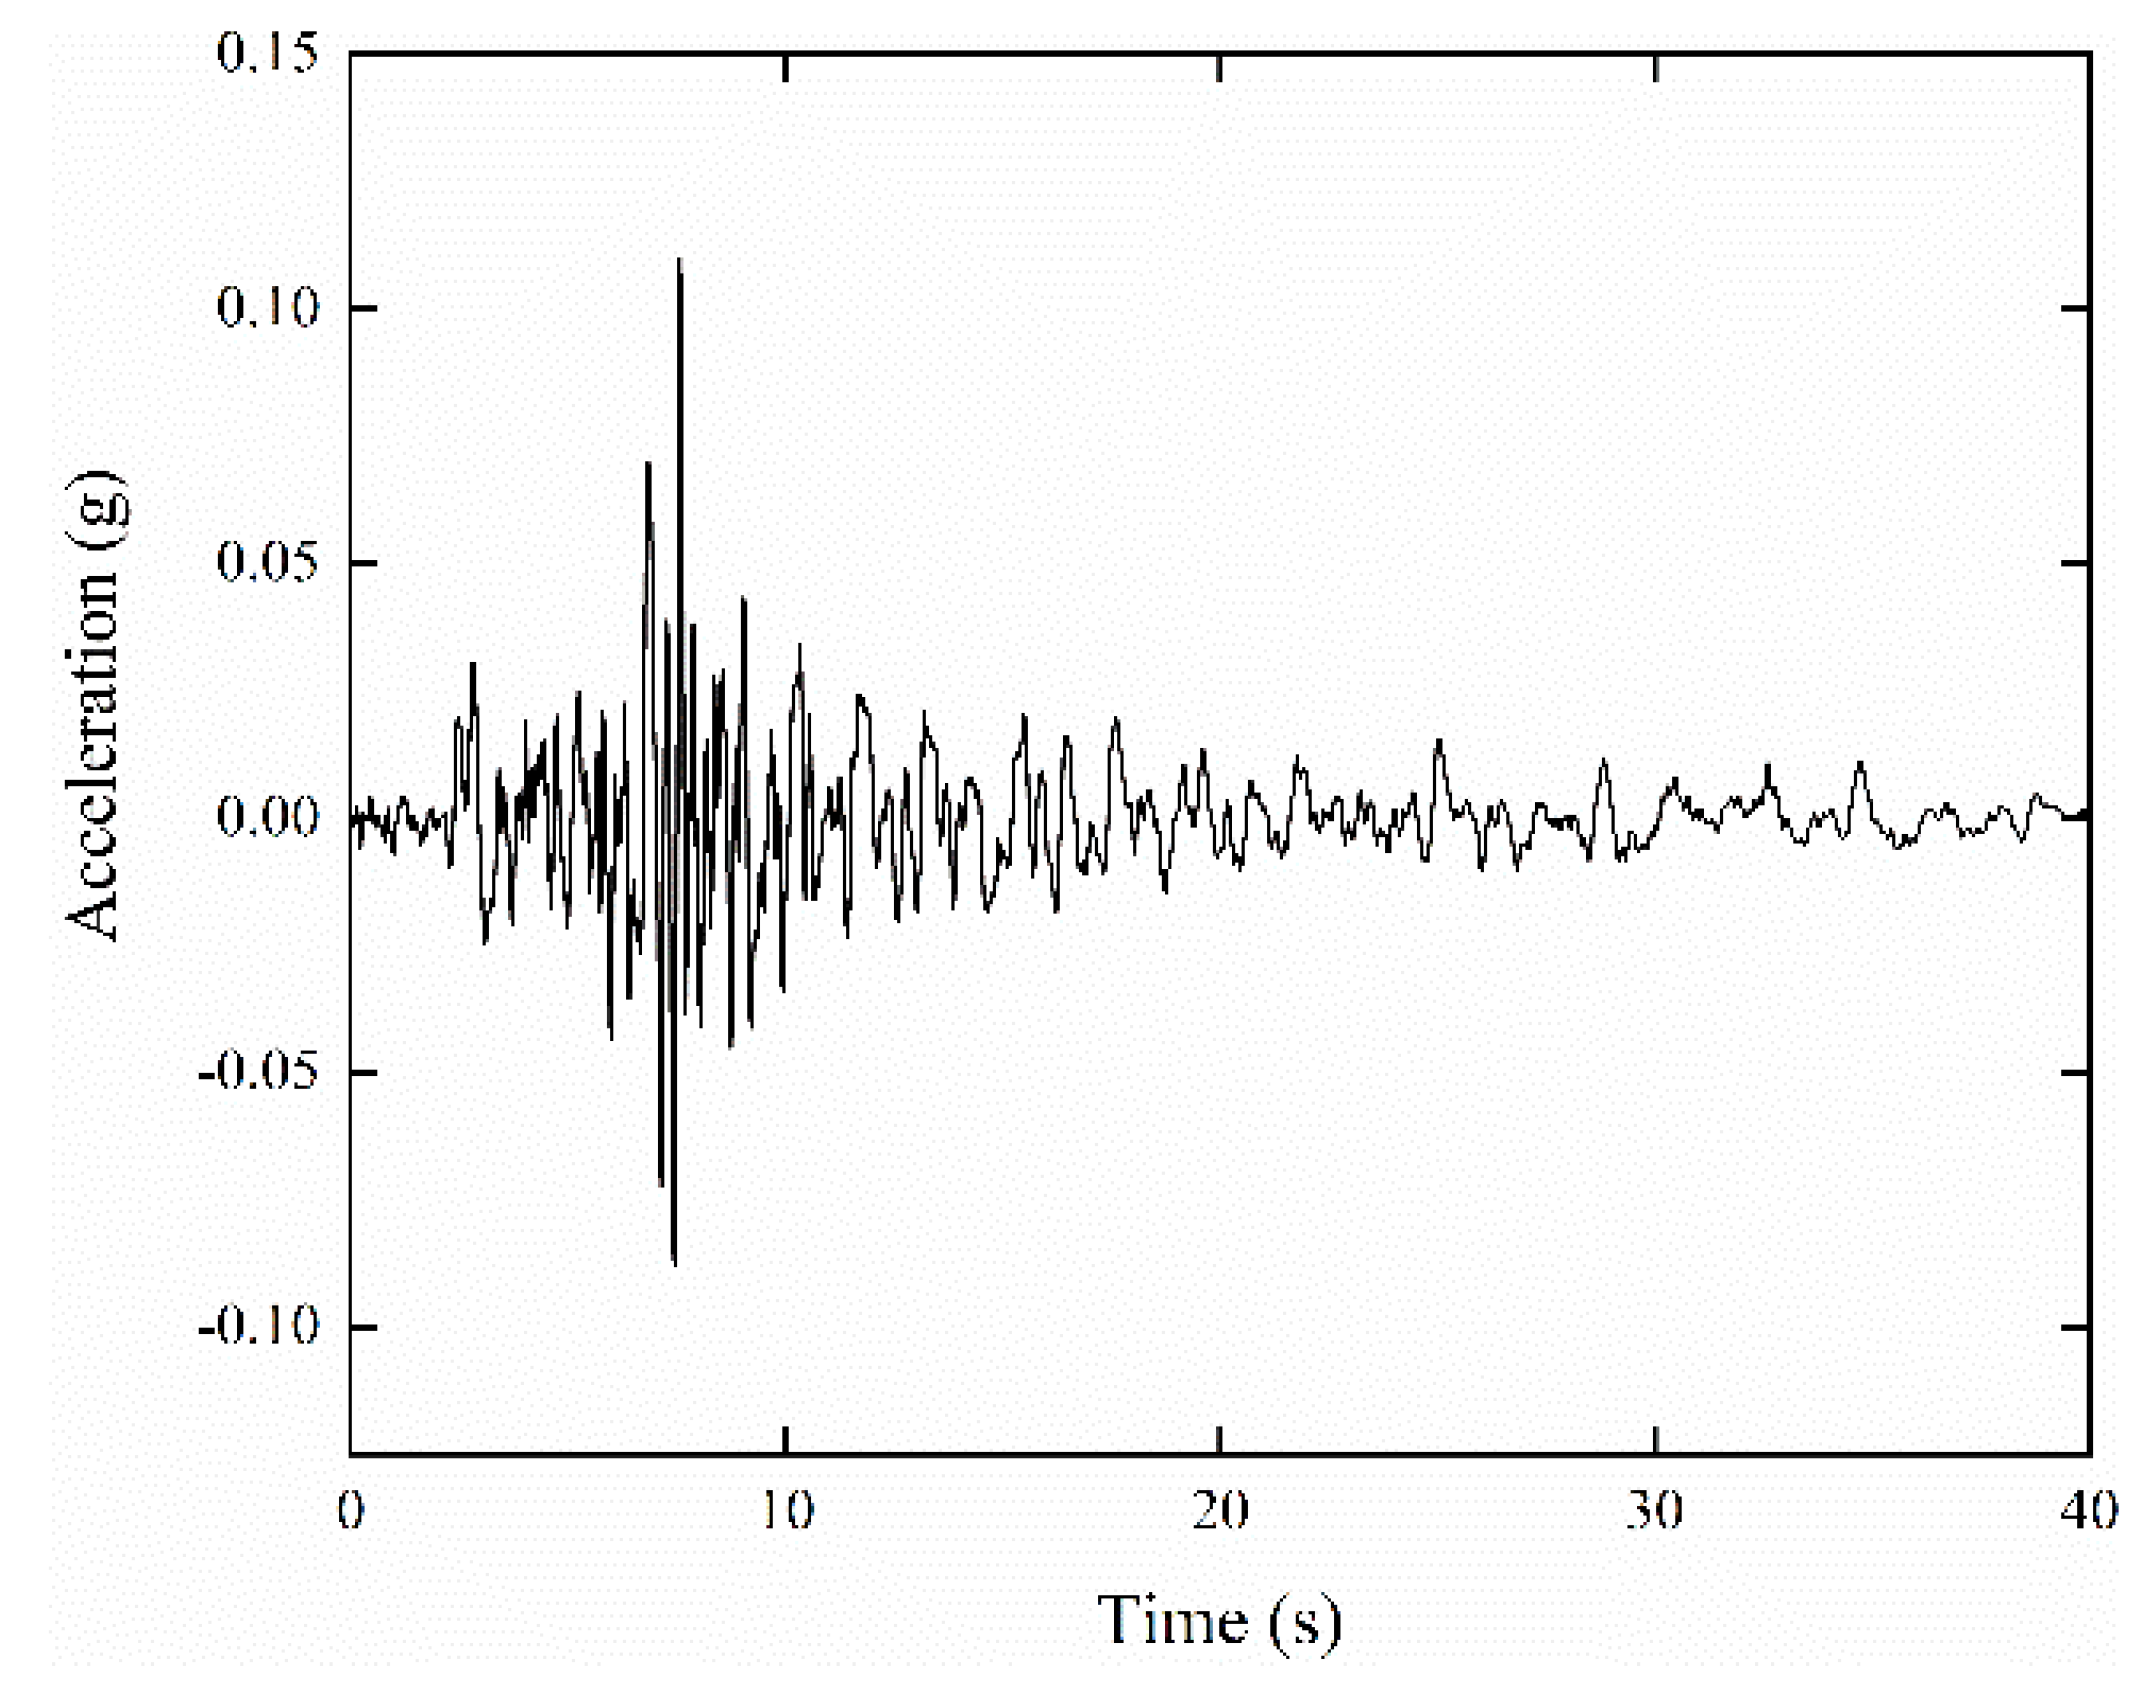
2.4. Application of Seismic Loading
3. Numerical Modelling
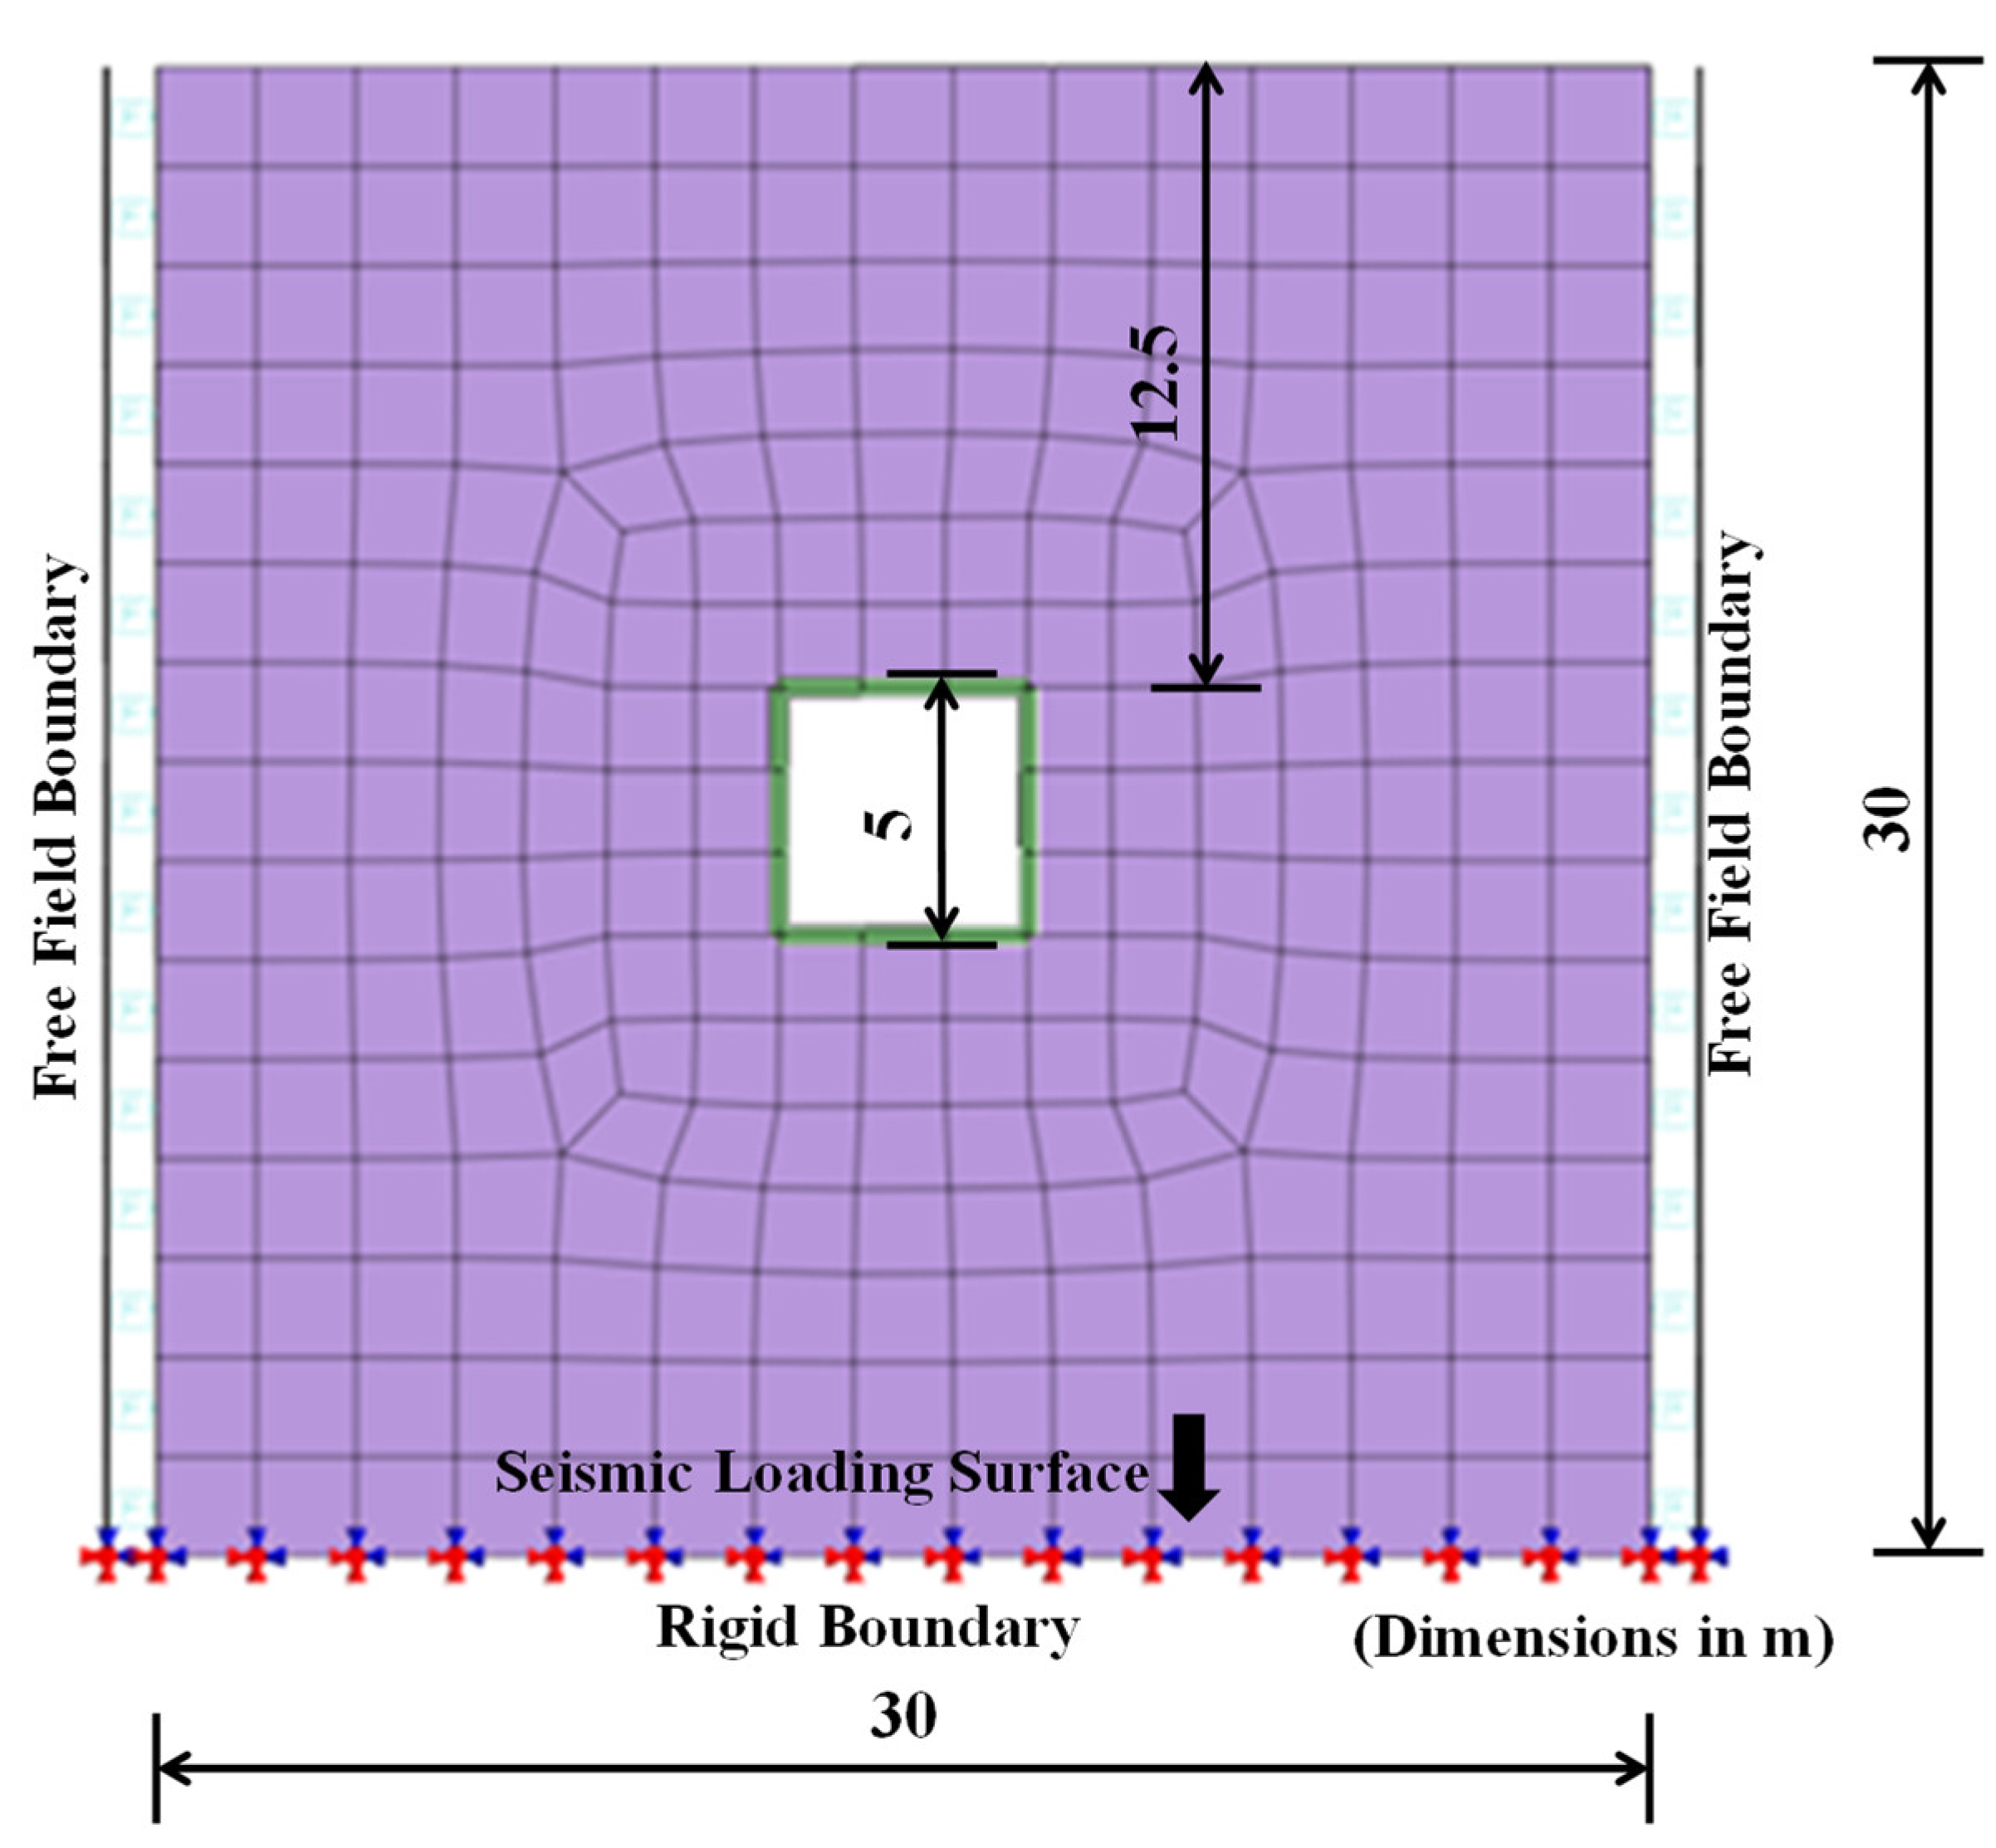
3.1. Numerical Model
3.2. Boundary Conditions
4. Results and Analysis
4.1. Acceleration Response
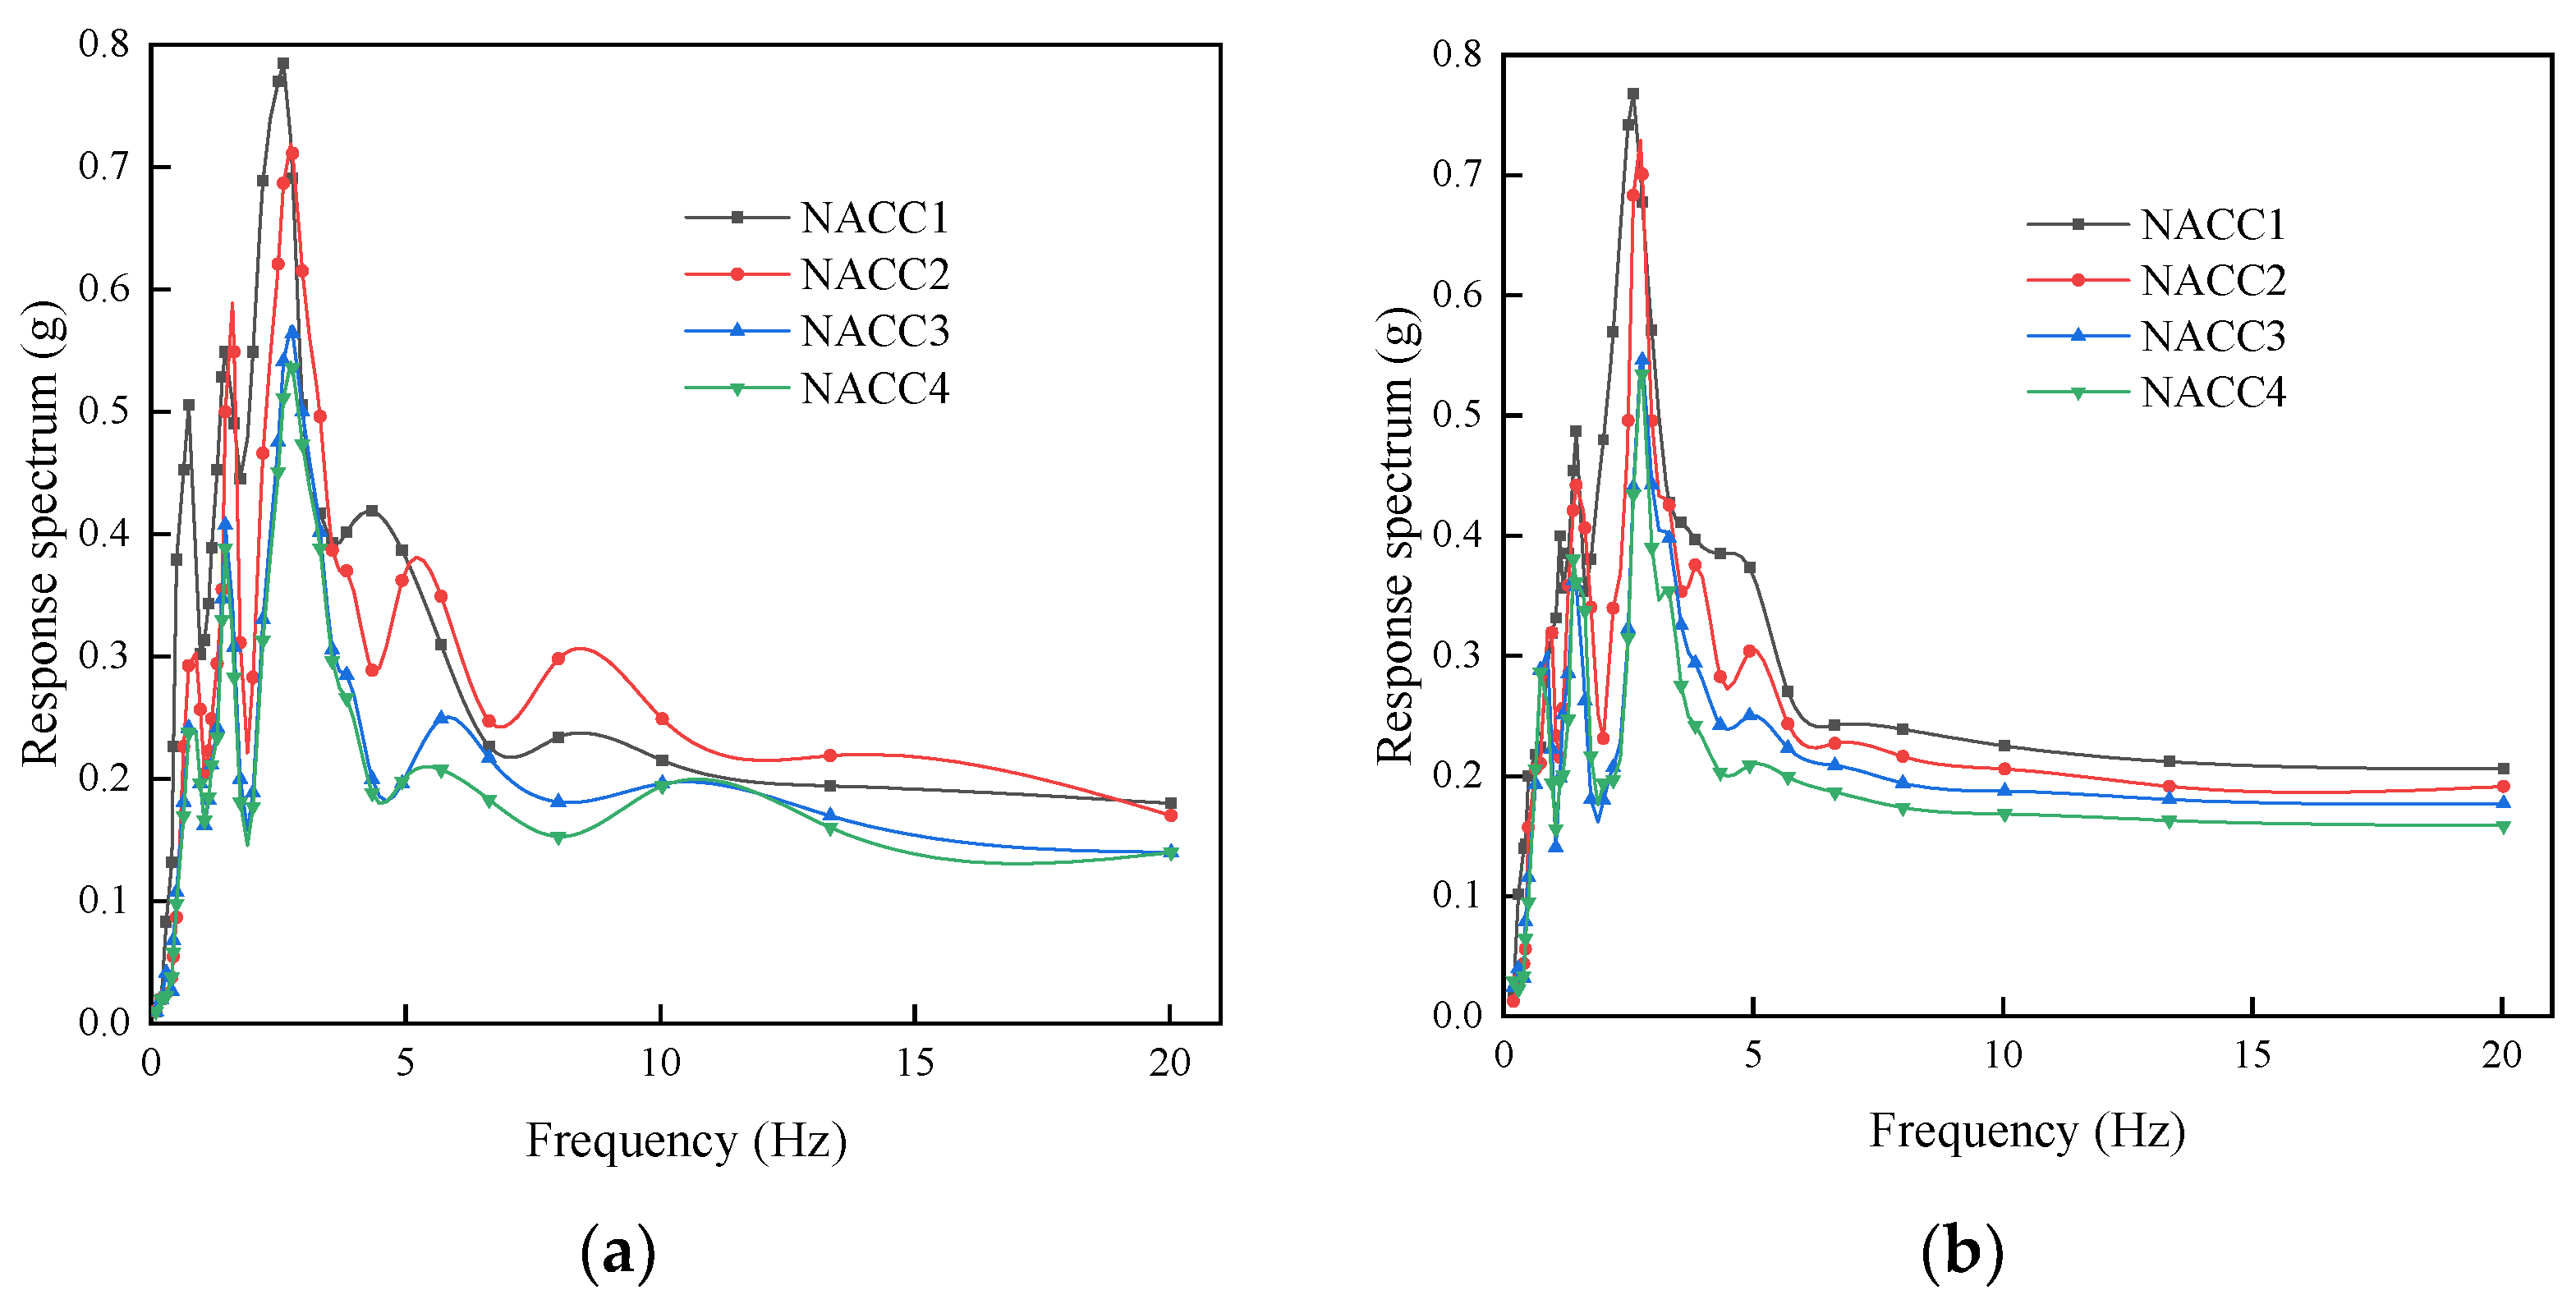
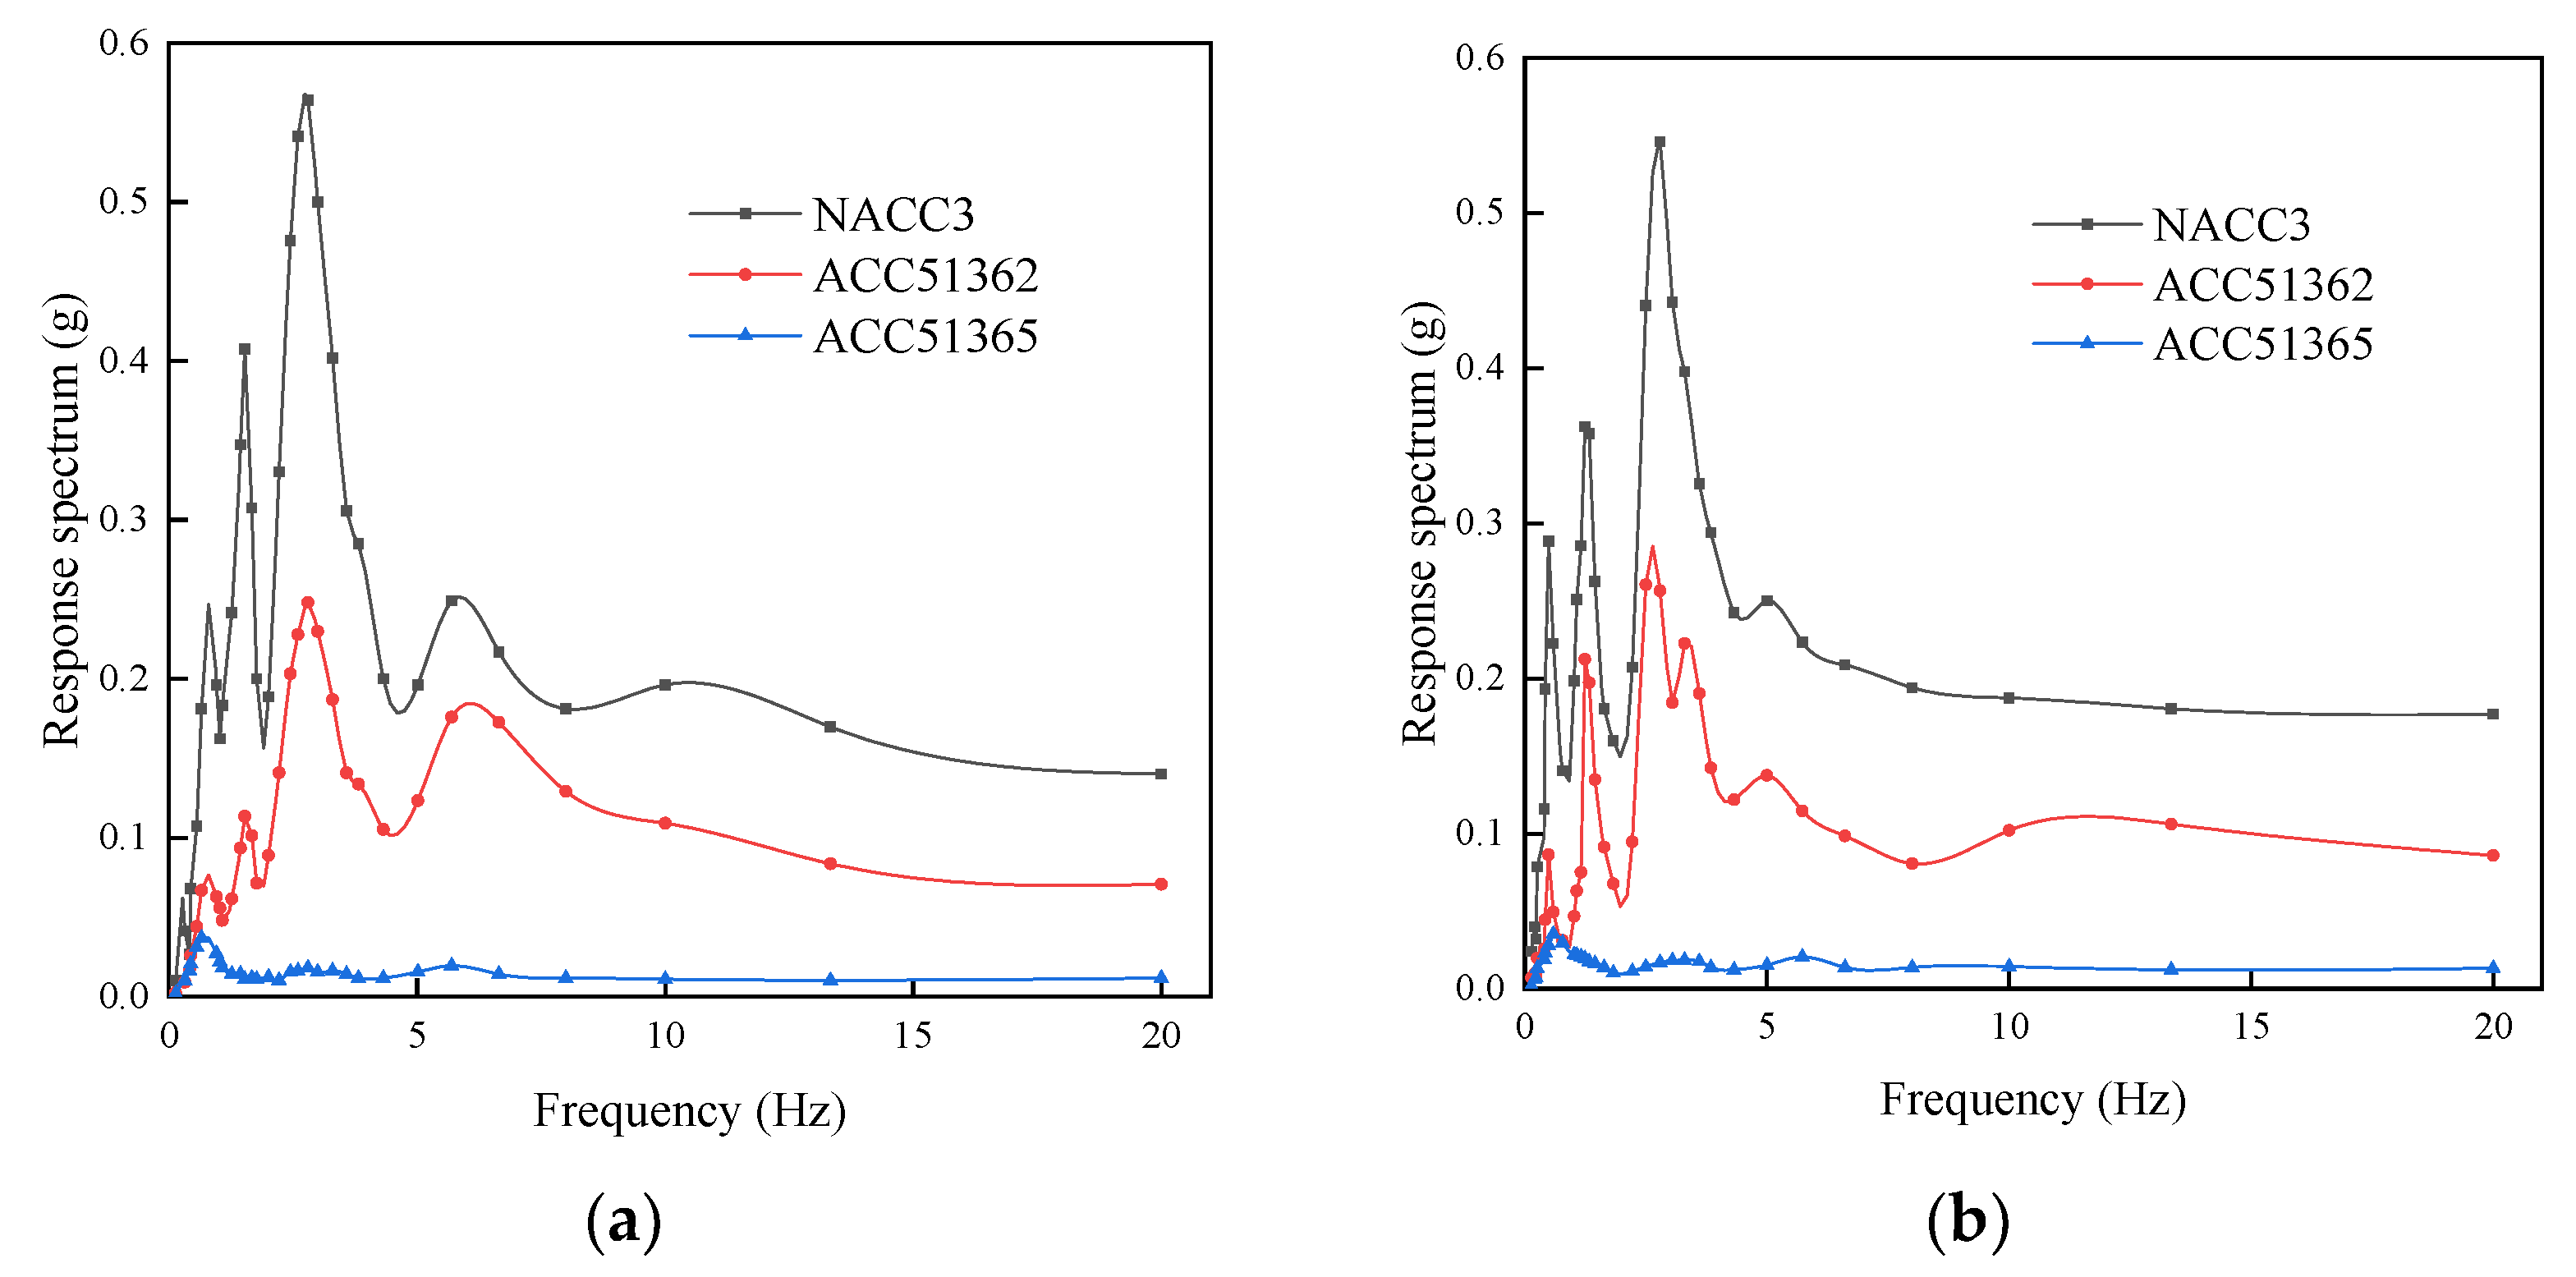
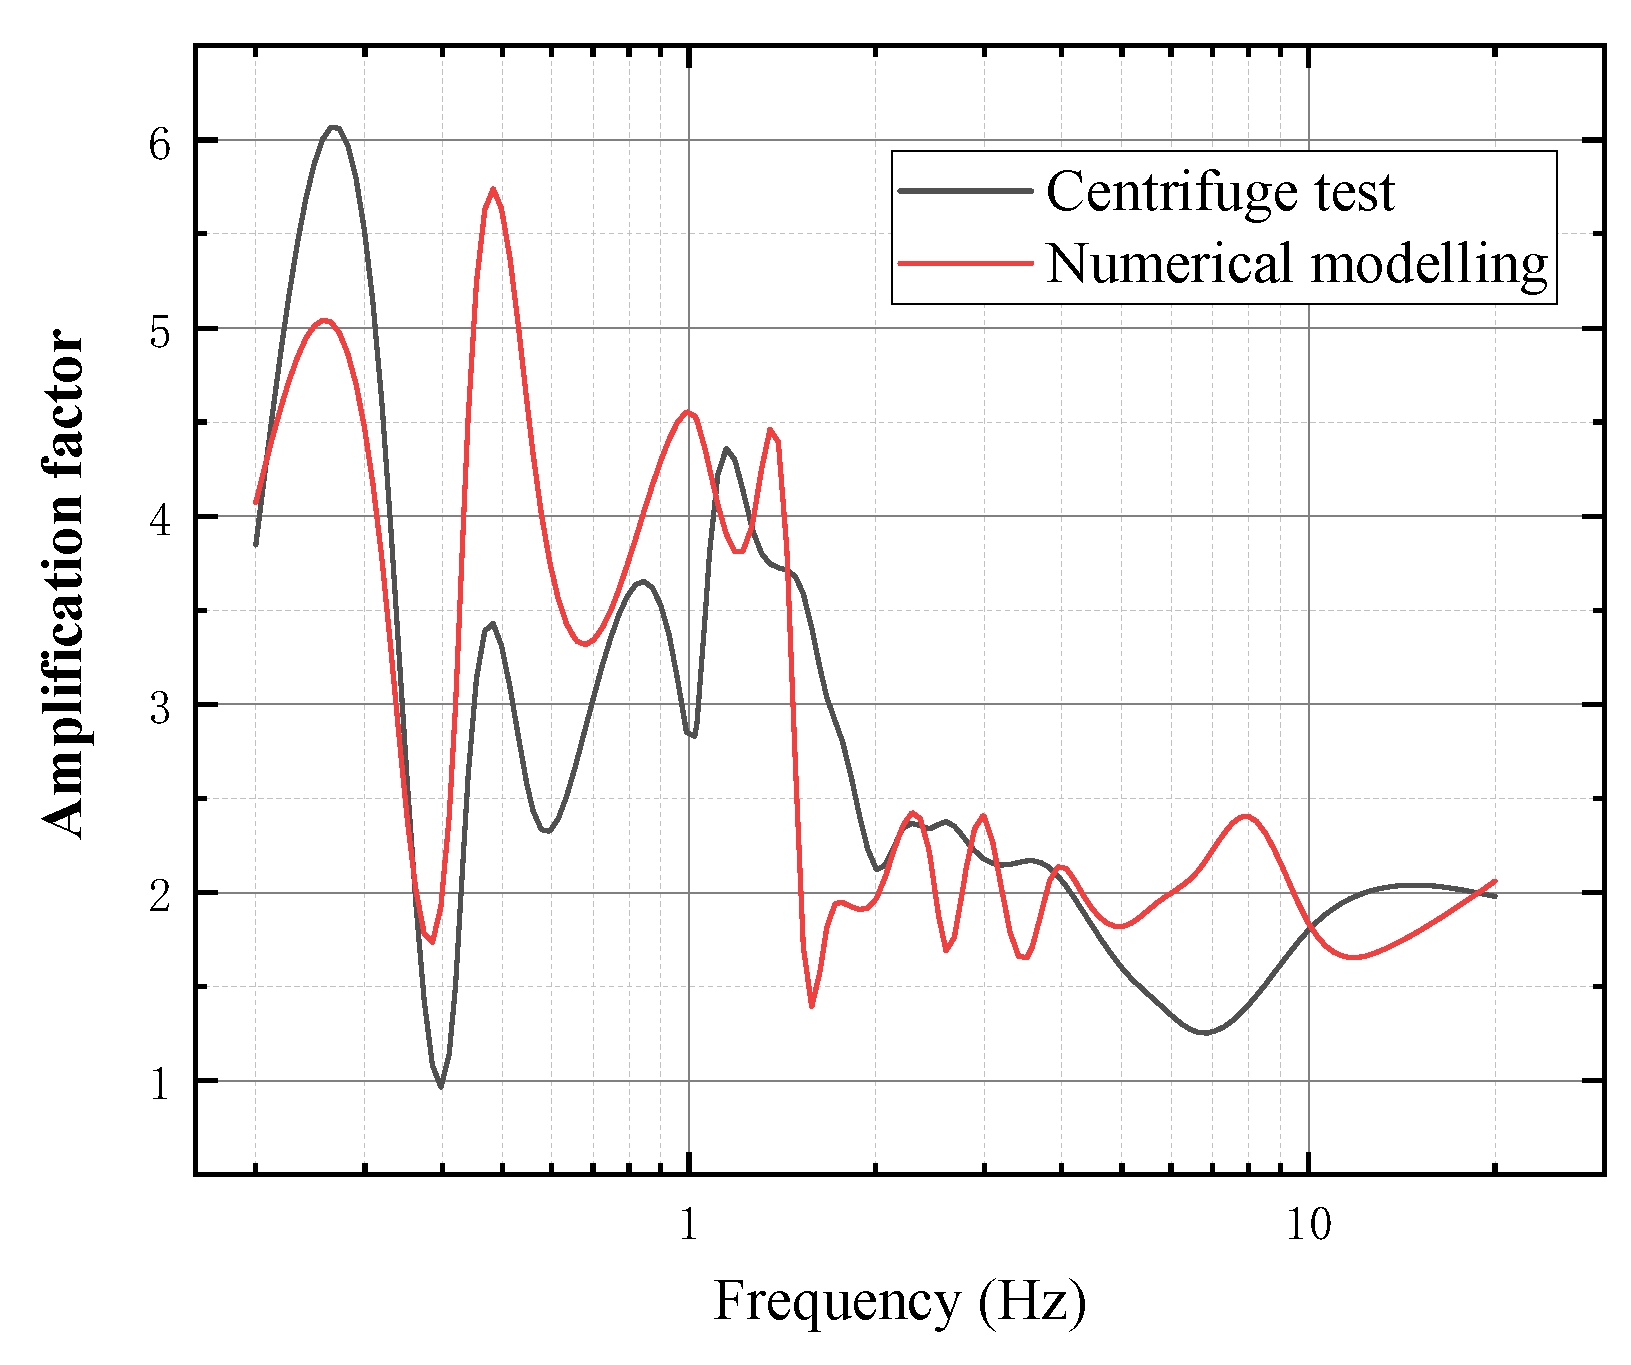
4.1.1. Acceleration Response of Cohesive Soil Foundation
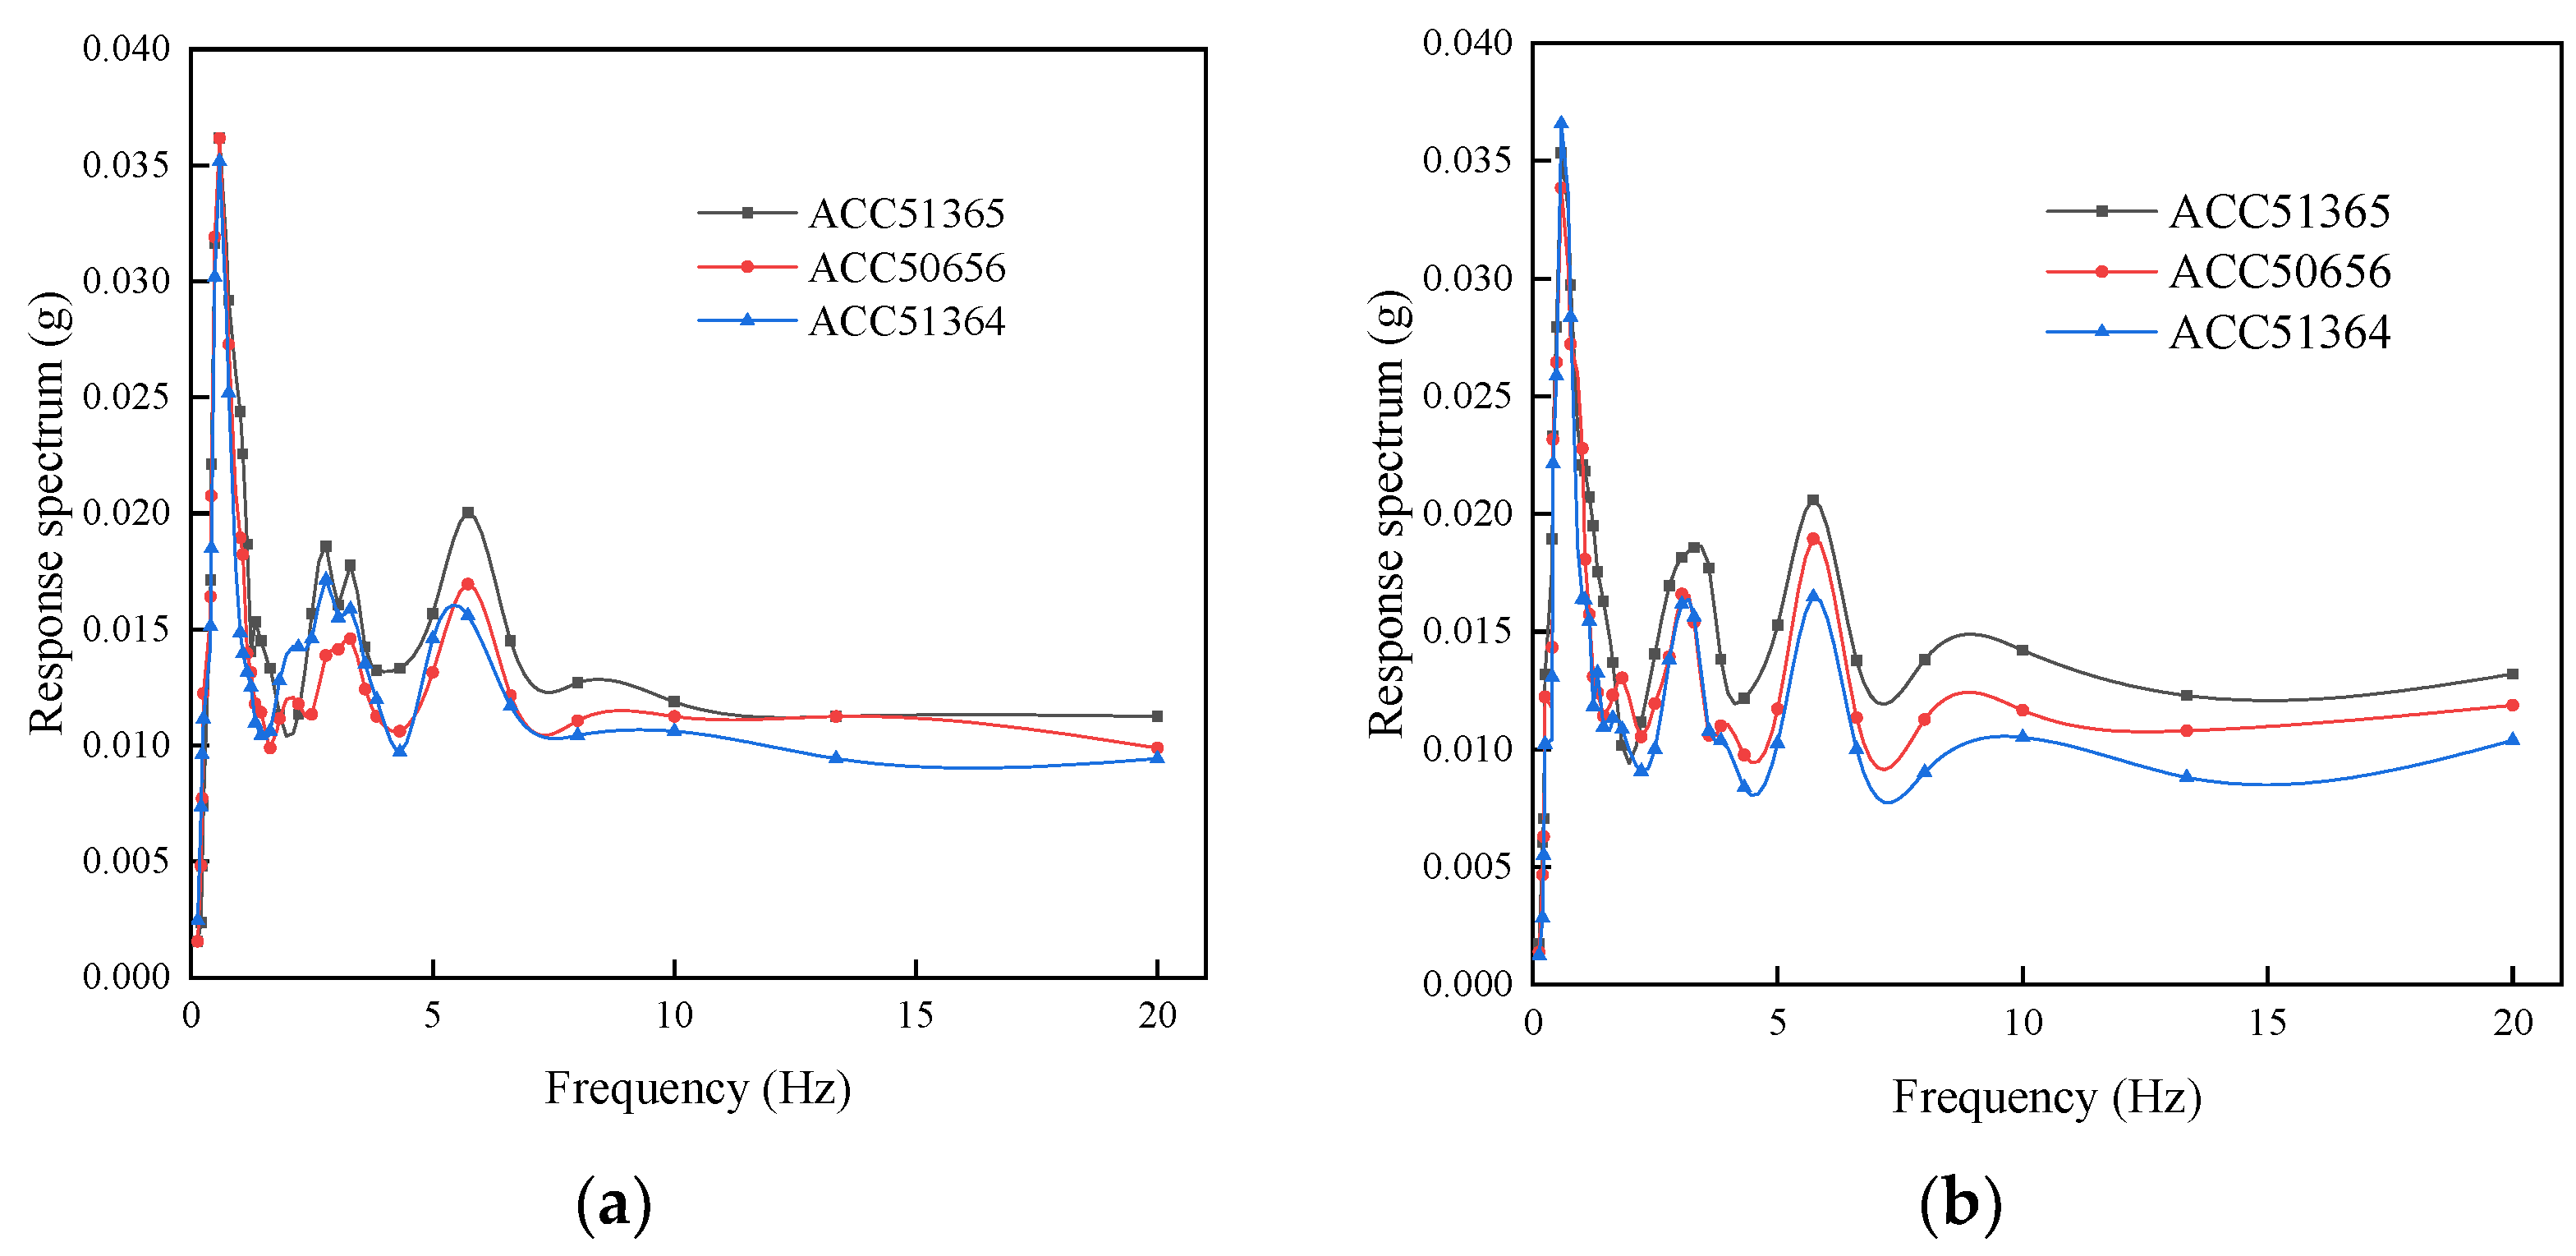
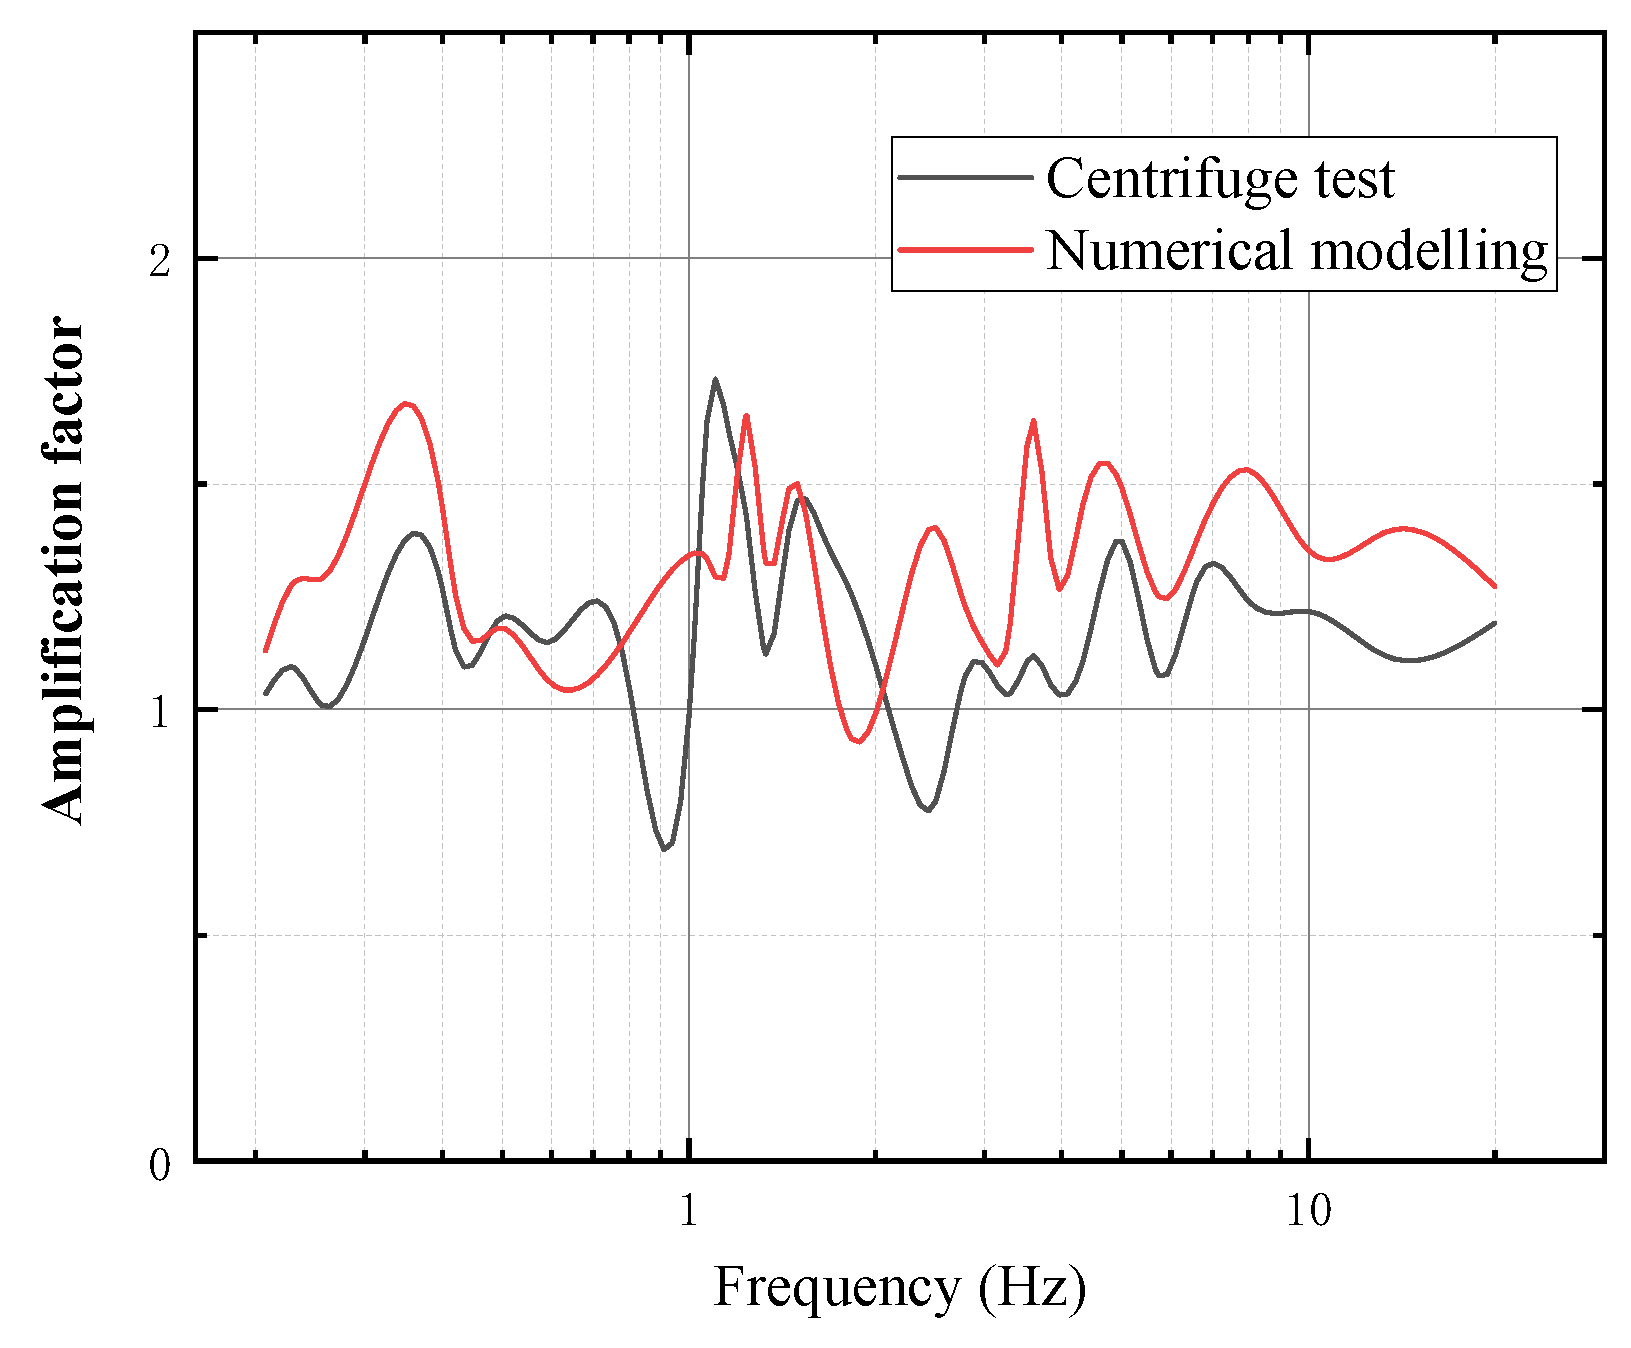
4.1.2. Acceleration Response of the Tunnel
4.1.3. Influence of Tunnel on Cohesive Soil Foundation
4.2. Internal Force Prediction of the Tunnel
4.3. Displacement and Pore Pressure
5. Conclusions
- (1)
- The cohesive soil foundation has an amplification effect on low frequency components, especially for the frequency components less than 1.0 Hz. In addition, there is almost no amplification effect on the frequency components greater than 10.0 Hz. Under the Parkfield seismic wave, the natural frequency of viscous soil ground is about 0.3 Hz, which can amplify the seismic acceleration from bottom to top.
- (2)
- The acceleration response of the tunnel is small, but the acceleration amplitude of the soil near the tunnel is between the vibration amplitude of the tunnel structure and the vibration amplitude of the free field due to the influence of the tunnel structure. The effect of seismic waves on the surrounding soil is weakened, which can be attributed to the existence of tunnels.
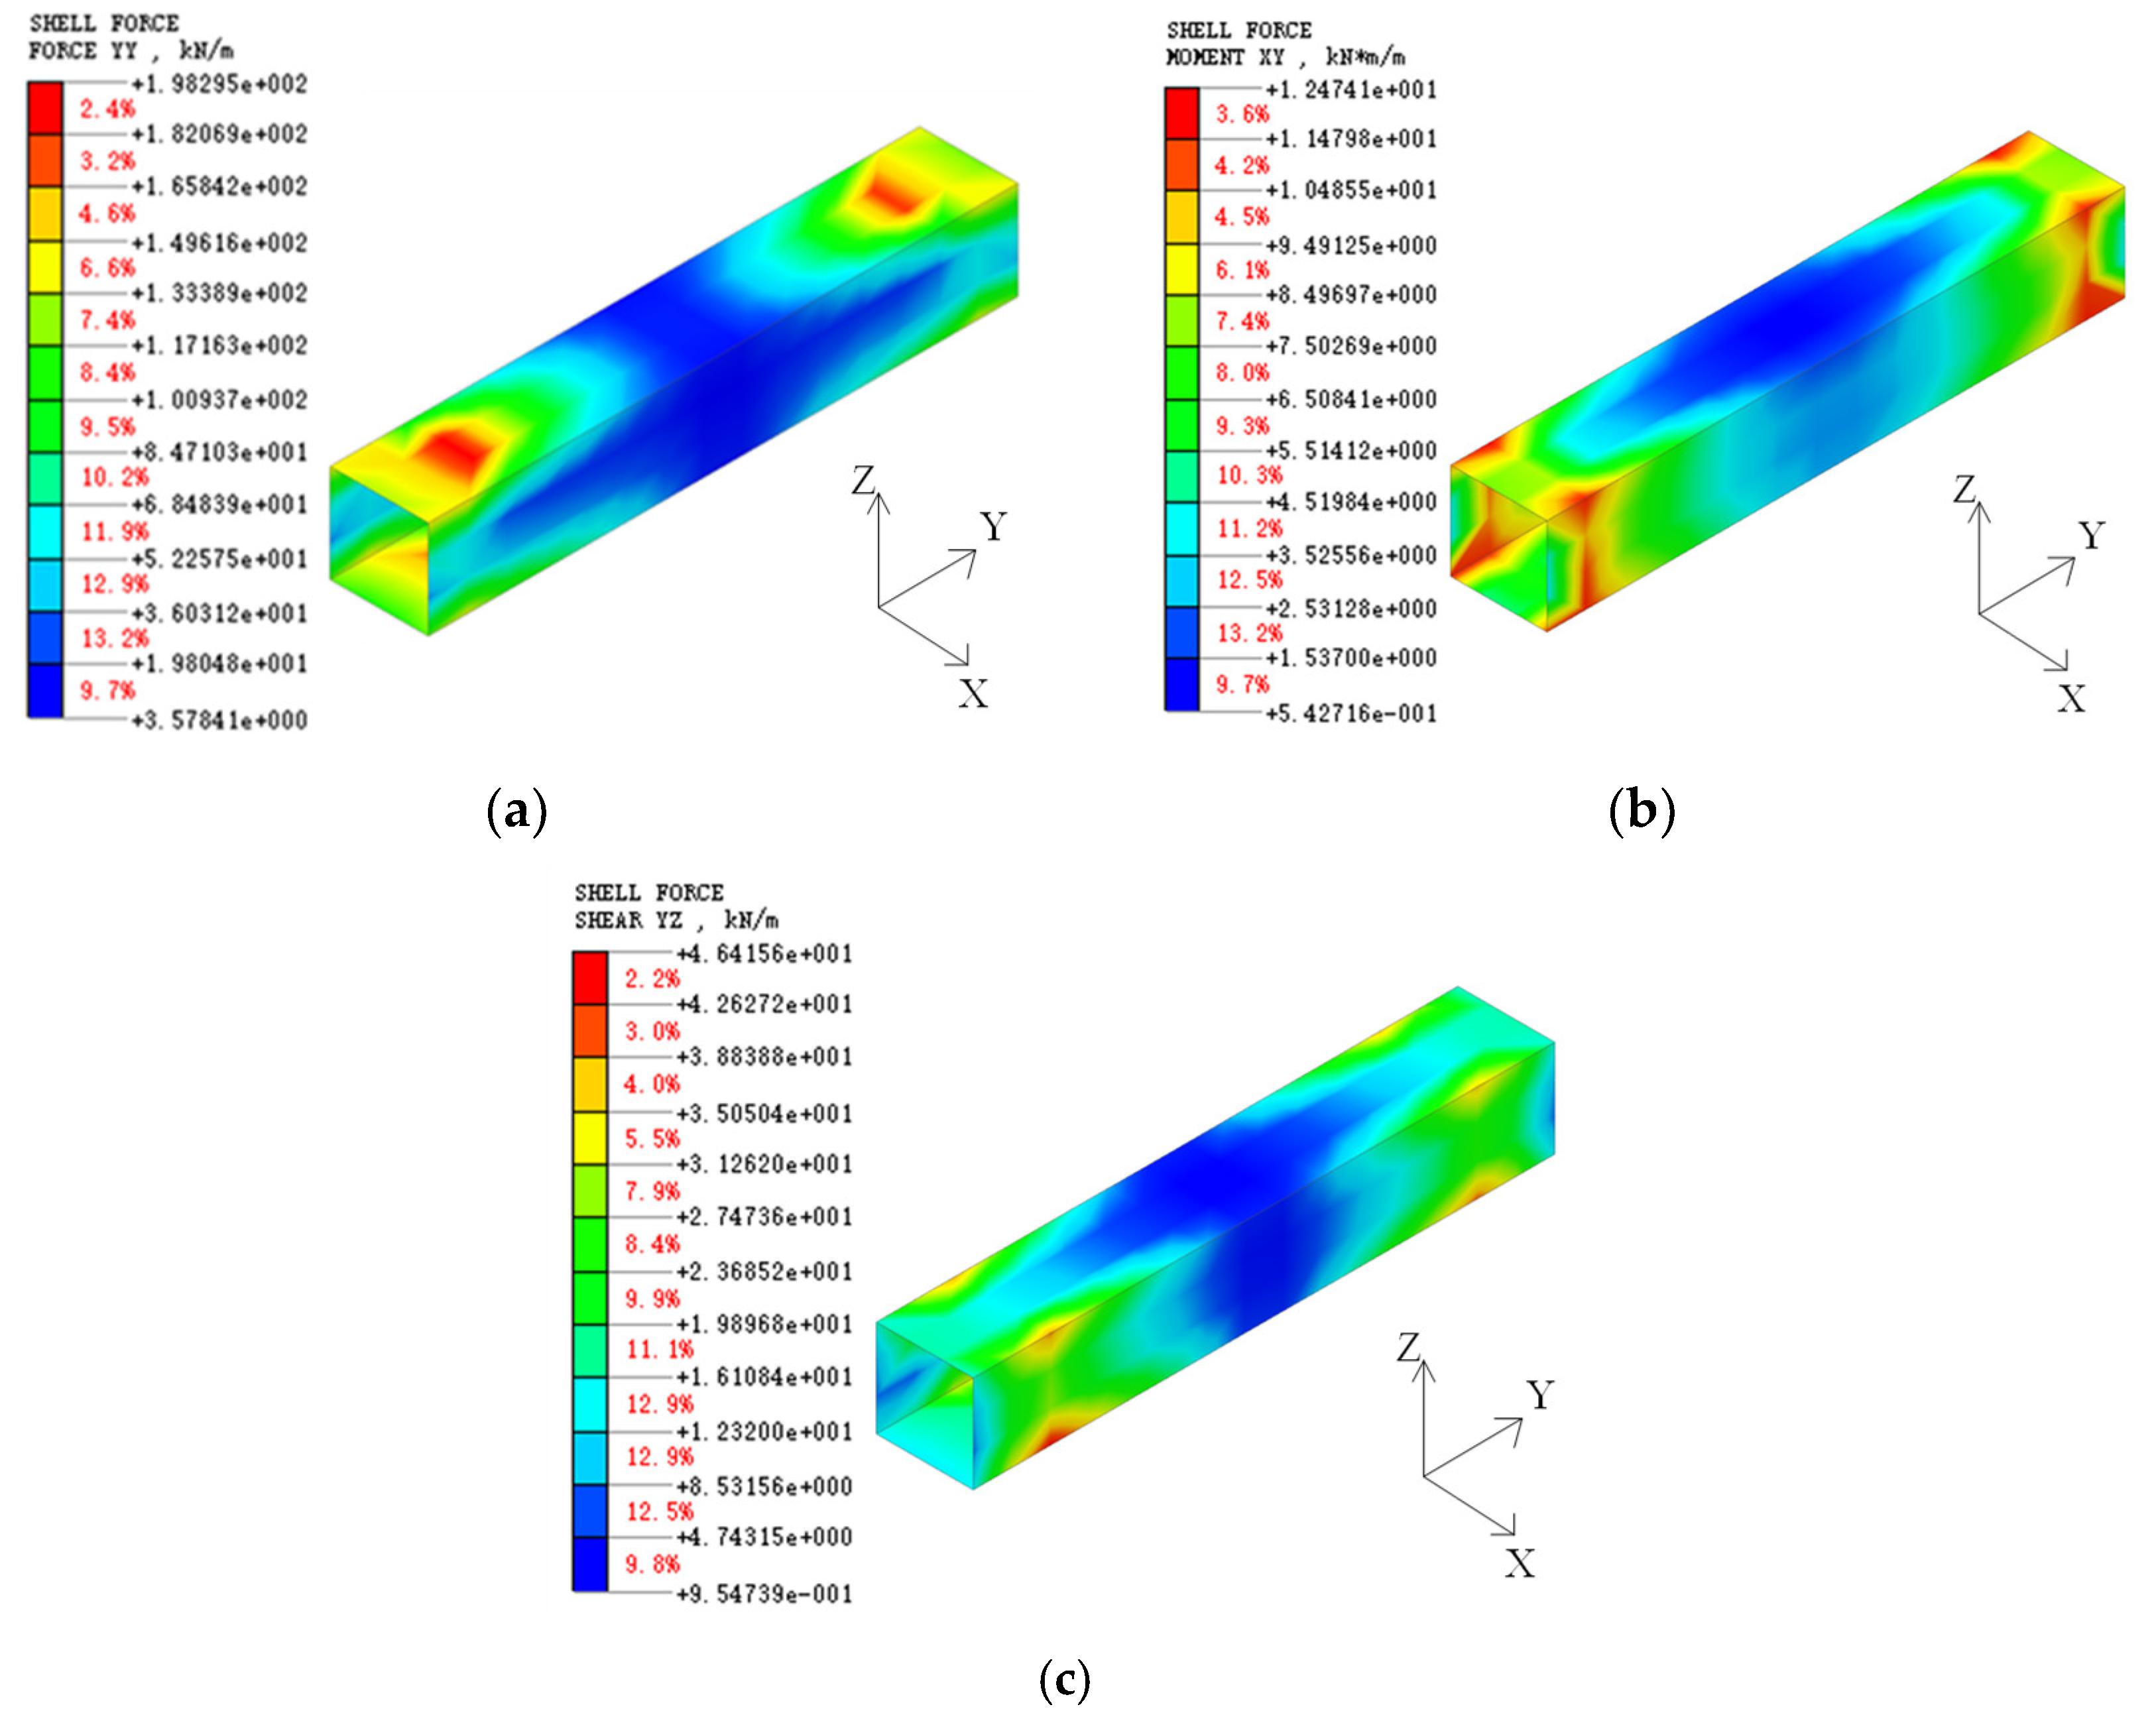
- (3)
- The shear force, bending moment, and axial force diagrams of the rectangular tunnel are obtained by numerical modelling. The maximum bending moment and axial force appear at the corner of the rectangular tunnel, and the axial force appears at the top of the rectangular tunnel. Therefore, in the design of seismic structure, it can be considered to add armpits in the four corners of rectangular tunnel, and strengthen the construction design of the weak positions, which can effectively improve the seismic effect.
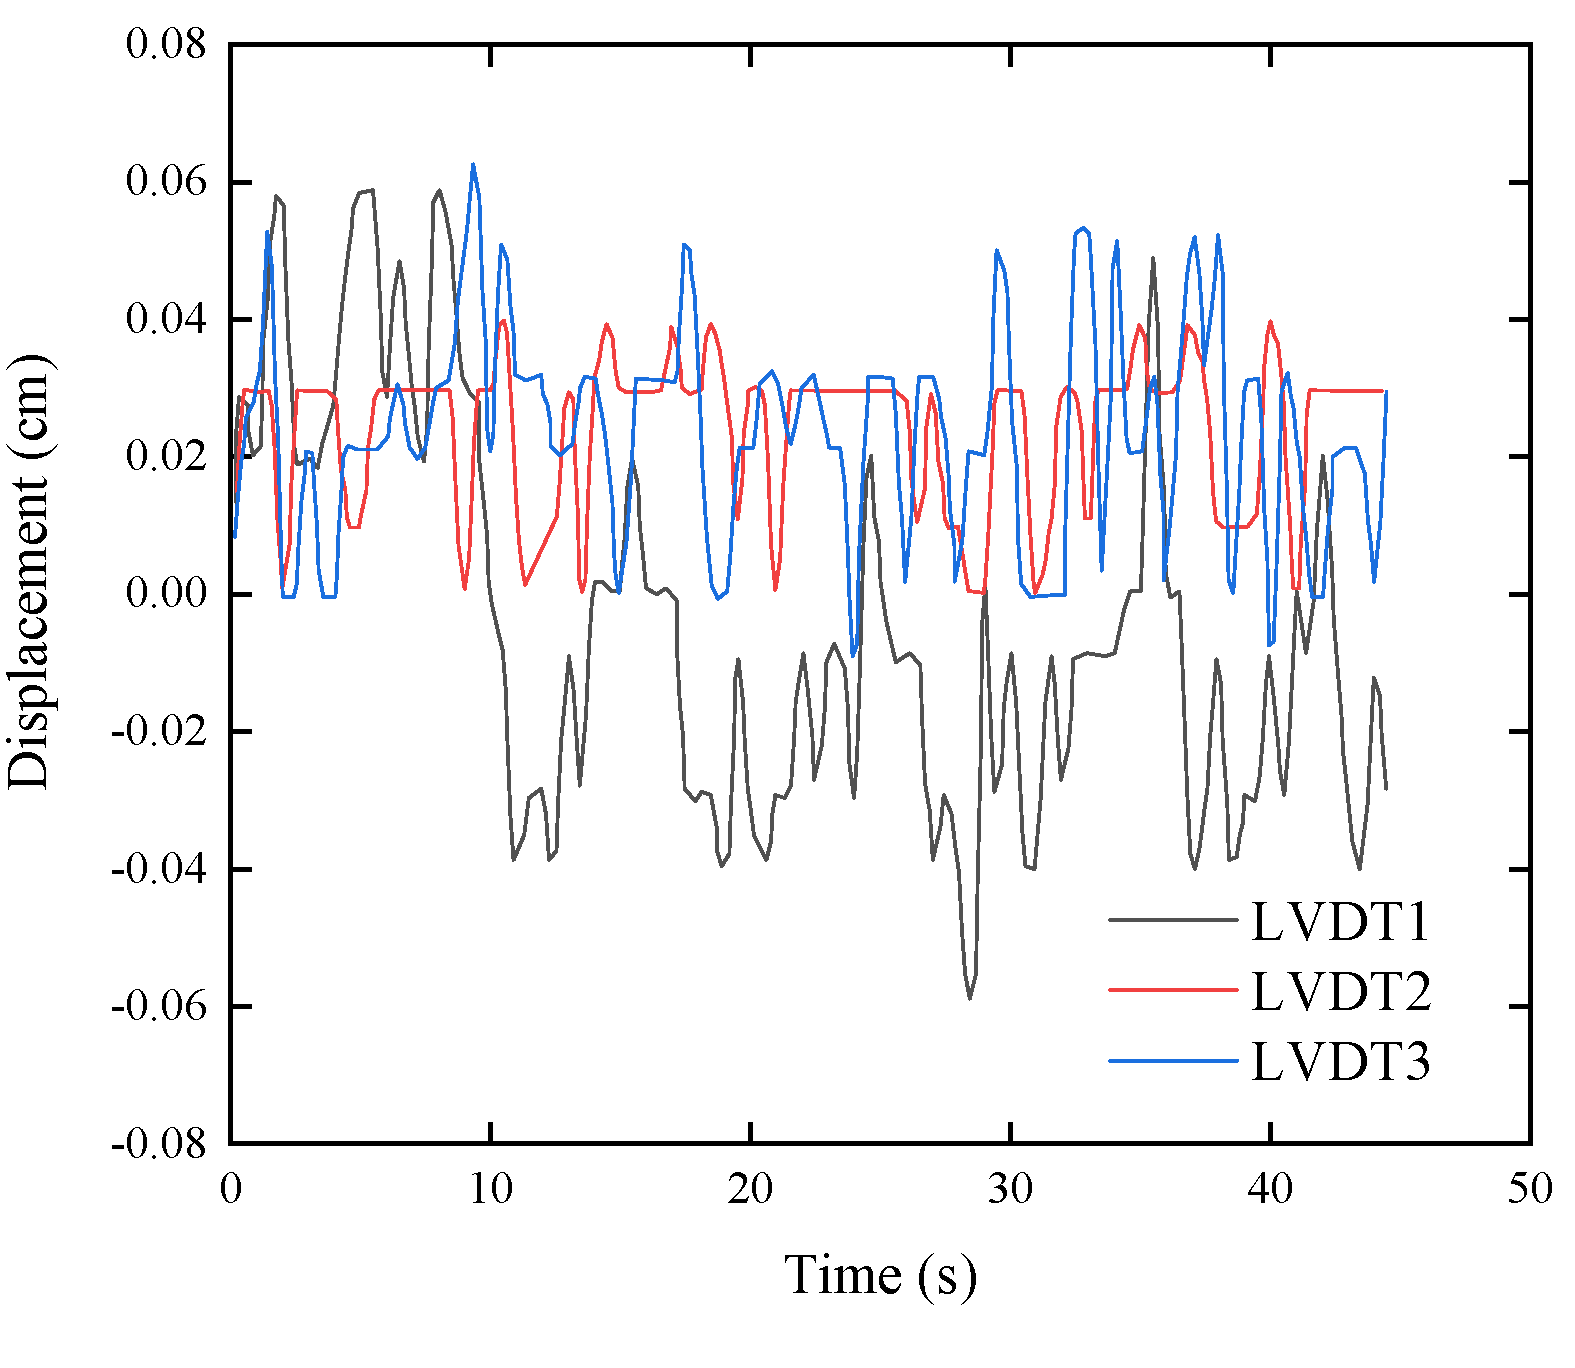
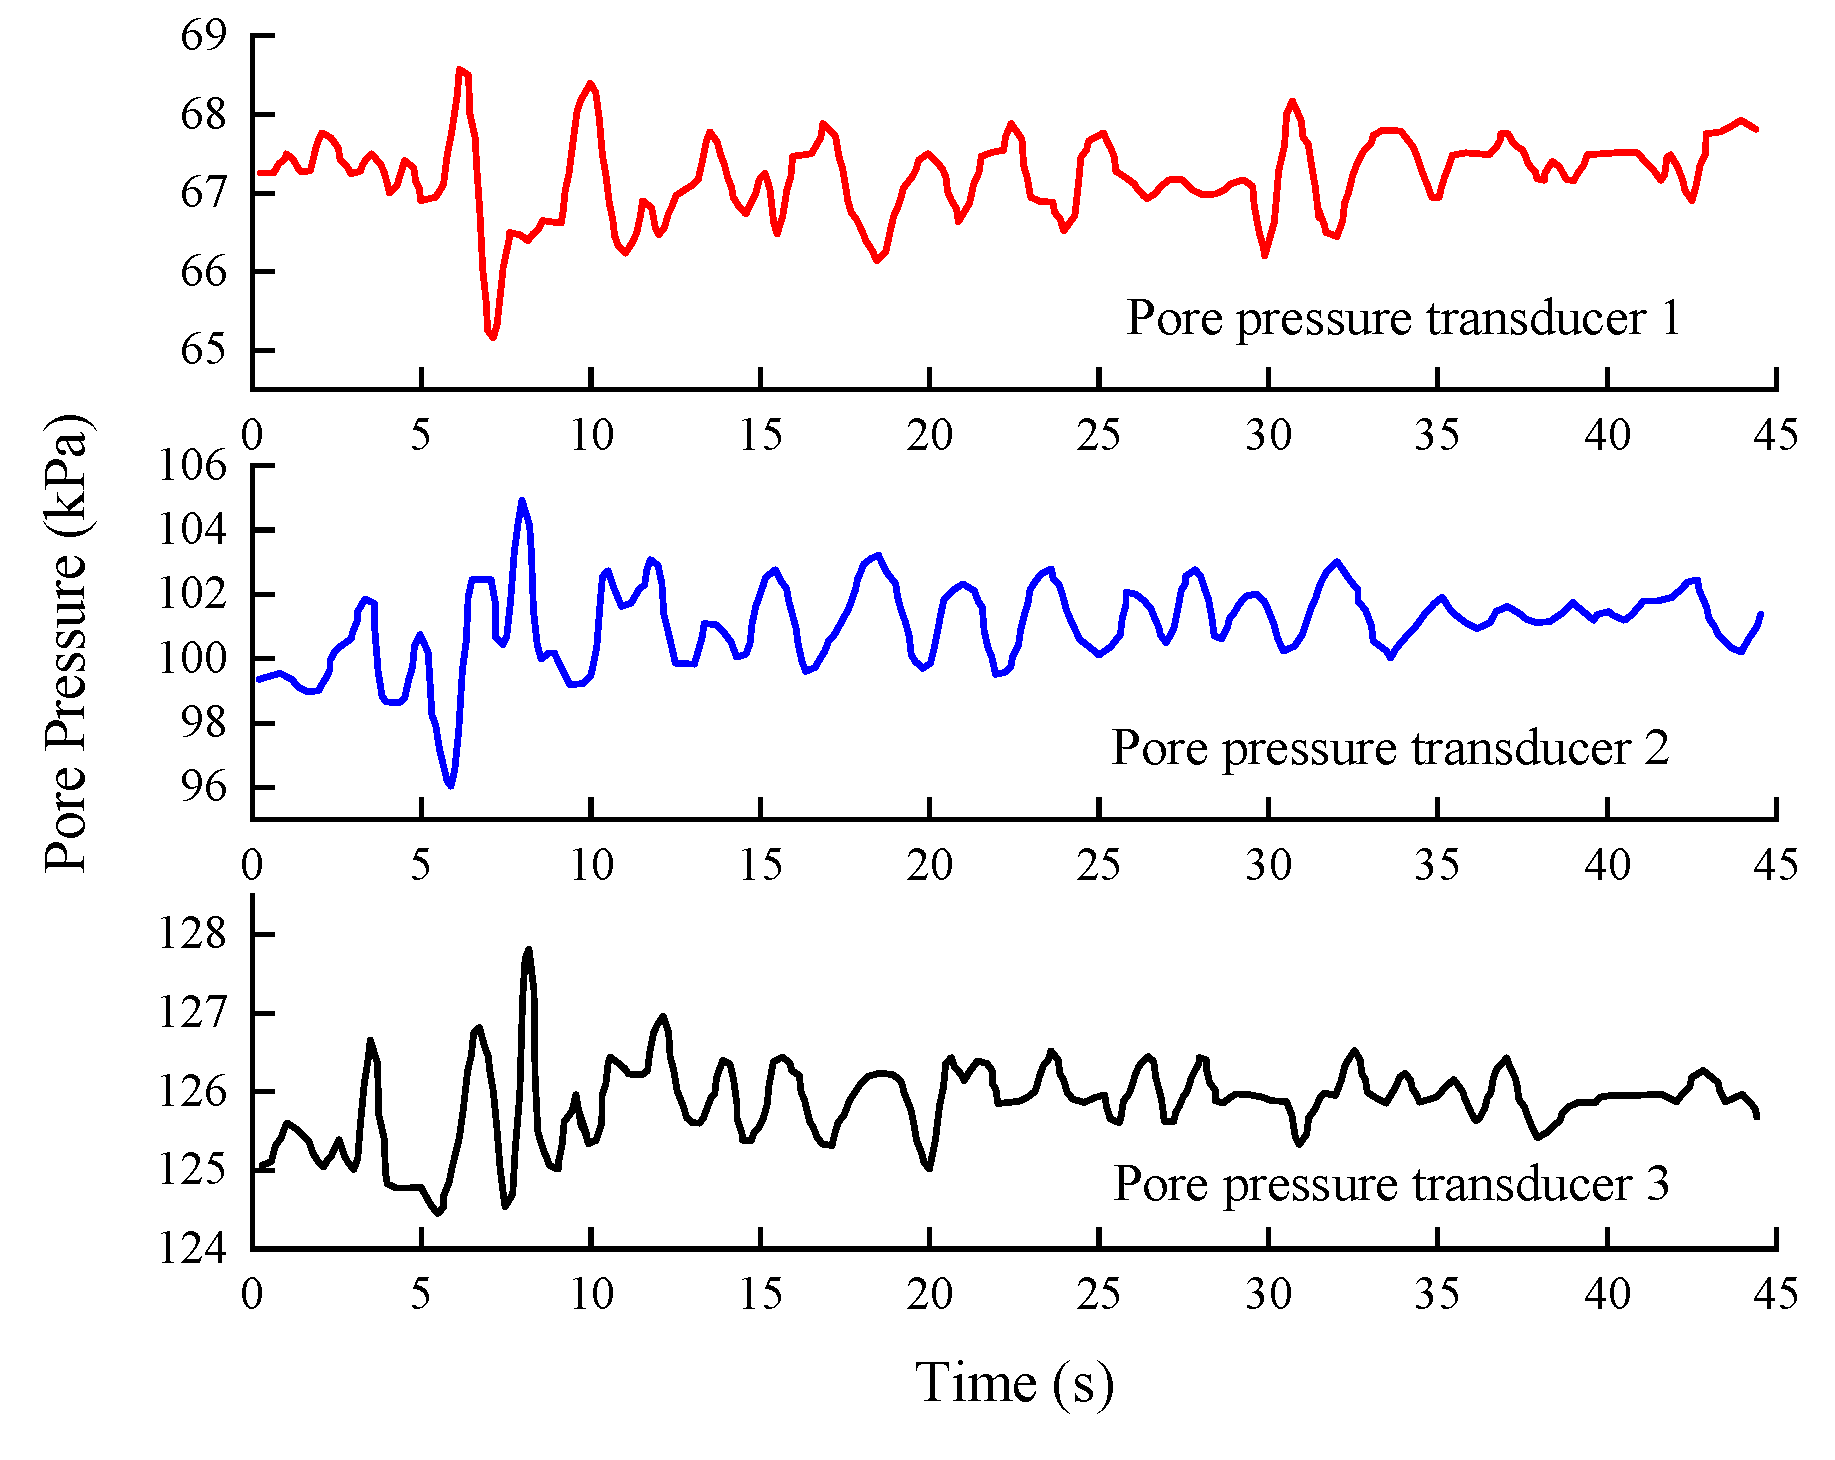
- (4)
- Regarding the studied cohesive soil foundation with tunnel, a large lateral displacement occurred in the surface soil and a little lateral displacement occurred in the soil below the surface soil during the earthquake. Moreover, the initial pore pressure increases from top to bottom. The pore pressure reduction in the middle soil is the largest compared with the other soil layers. The existence of tunnels weakens the liquefaction potential of the surrounding soil.
Author Contributions
Funding
Conflicts of Interest
References
- Hamada, M.; Isoyama, R.; Wakamatsu, K. Liquefaction-induced ground displacement and its related damage to lifeline facilities. Soils Found. 1996, 36, 81–97. [Google Scholar] [CrossRef]
- Chou, H.S.; Yang, C.Y.; Hsieh, B.J.; Chang, S.S. A study of liquefaction related damages on shield tunnels. Tunn. Undergr. Space Technol. 2001, 16, 185–193. [Google Scholar] [CrossRef]
- Wang, W.; Wang, T.; Su, J.; Lin, C.; Seng, C.; Huang, T. Assessment of damage in mountain tunnels due to the Taiwan Chi-Chi Earthquake. Tunn. Undergr. Space Technol. 2001, 16, 133–150. [Google Scholar] [CrossRef]
- Dashti, S.; Hashash, Y.; Gillis, K.; Musgrove, M.; Walker, M. Development of dynamic centrifuge models of underground structures near tall buildings. Soil Dyn. Earthq. Eng. 2016, 86, 89–105. [Google Scholar] [CrossRef] [Green Version]
- Wang, J.N. Seismic Design of Tunnels: A Simple State-of-the-Art Design Approach; Parsons Brinckerhoff Inc.: New York, NY, USA, 1993. [Google Scholar]
- Hashash, Y.M.; Hook, J.J.; Schmidt, B.; Yao, J.I.-C. Seismic design and analysis of underground structures. Tunn. Undergr. Space Technol. 2001, 16, 247–293. [Google Scholar] [CrossRef]
- Hashash, Y.M.; Park, D.; Yao, J.I.-C. Ovaling deformations of circular tunnels under seismic loading, an update on seismic design and analysis of underground structures. Tunn. Undergr. Space Technol. 2005, 20, 435–441. [Google Scholar] [CrossRef]
- Huo, H.; Bobet, A.; Fernández, G.; Ramírez, J. Load transfer mechanisms between underground structure and surrounding ground: Evaluation of the failure of the Daikai Station. J. Geotech. Geoenviron. Eng. 2005, 131, 1522–1533. [Google Scholar] [CrossRef]
- Bobet, A.; Fernandez, G.; Huo, H.; Ramirez, J. A practical iterative procedure to estimate seismic-induced deformations of shallow rectangular structures. Can. Geotech. J. 2008, 45, 923–938. [Google Scholar] [CrossRef]
- Anastasopoulos, I.; Gerolymos, N.; Drosos, V.; Georgarakos, T.; Kourkoulis, R.; Gazetas, G. Behaviour of deep immersed tunnel under combined normal fault rupture deformation and subsequent seismic shaking. Bull. Earthq. Eng. 2008, 6, 213–239. [Google Scholar] [CrossRef]
- Kontoe, S.; Zdravković, L.; Potts, D.; Menkiti, C. On the relative merits of simple and advanced constitutive models in dynamic analysis of tunnels. Géotechnique 2011, 61, 815–829. [Google Scholar] [CrossRef] [Green Version]
- Bilotta, E.; Lanzano, G.; Madabhushi, S.P.G.; Silvestri, F. A numerical Round Robin on tunnels under seismic actions. Acta Geotech. 2014, 9, 563–579. [Google Scholar] [CrossRef]
- Tsinidis, G. Response characteristics of rectangular tunnels in soft soil subjected to transversal ground shaking. Tunn. Undergr. Space Technol. 2017, 62, 1–22. [Google Scholar] [CrossRef]
- Patil, M.; Choudhury, D.; Ranjith, P.; Zhao, J. Behavior of shallow tunnel in soft soil under seismic conditions. Tunn. Undergr. Space Technol. 2018, 82, 30–38. [Google Scholar] [CrossRef]
- Cilingir, U.; Madabhushi, S.P.G. Effect of depth on seismic response of circular tunnels. Can. Geotech. J. 2011, 48, 117–127. [Google Scholar] [CrossRef]
- Cilingir, U.; Madabhushi, S.P.G. Effect of depth on the seismic response of square tunnels. Soils Found. 2011, 51, 449–457. [Google Scholar] [CrossRef] [Green Version]
- Lanzano, G.; Bilotta, E.; Russo, G.; Silvestri, F.; Madabhushi, S.P.G. Centrifuge modeling of seismic loading on tunnels in sand. Geotech. Test. J. 2012, 35, 854–869. [Google Scholar] [CrossRef]
- Tsinidis, G.; Pitilakis, K.; Madabhushi, G.; Heron, C. Dynamic response of flexible square tunnels: Centrifuge testing and validation of existing design methodologies. Geotechnique 2015, 65, 401–417. [Google Scholar] [CrossRef] [Green Version]
- Moghadam, M.R.; Baziar, M.H. Seismic ground motion amplification pattern induced by a subway tunnel: Shaking table testing and numerical simulation. Soil Dyn. Earthq. Eng. 2016, 83, 81–97. [Google Scholar] [CrossRef]
- Penzien, J.; Wu, C.L. Stresses in linings of bored tunnels. Earthq. Eng. Struct. Dyn. 2015, 27, 283–300. [Google Scholar] [CrossRef]
- Penzien, J. Seismically induced racking of tunnel linings. Earthq. Eng. Struct. Dyn. 2000, 29, 683–691. [Google Scholar] [CrossRef]
- Huo, H.; Bobet, A.; Fernández, G.; Ramírez, J. Analytical solution for deep rectangular structures subjected to far-field shear stresses. Tunn. Undergr. Space Technol. 2006, 21, 613–625. [Google Scholar] [CrossRef]
- Khan, F.Z.; Ahmad, M.E.; Ahmad, N. Shake table testing of confined adobe masonry structures. Earthq. Struct. 2021, 20, 149–160. [Google Scholar] [CrossRef]
- Rossi, M.; Calderini, C.; Roselli, I.; Mongelli, M.; de Canio, G.; Lagomarsino, S. Seismic analysis of a masonry cross vault through shaking table tests: The case study of the Dey Mosque in Algiers. Earthq. Struct. 2020, 18, 57–72. [Google Scholar] [CrossRef]
- Rizwan, M.; Ahmad, N.; Khan, A.N. Seismic performance of RC frame having low strength concrete: Experimental and numerical studies. Earthq. Struct. 2019, 17, 75–89. [Google Scholar] [CrossRef]
- Ling, H.I.; Mohri, Y.; Kawabata, T.; Liu, H.; Burke, C.; Sun, L. Centrifugal Modeling of Seismic Behavior of Large-Diameter Pipe in Liquefiable Soil. J. Geotech. Geoenviron. Eng. 2003, 129, 1092–1101. [Google Scholar] [CrossRef]
- Yang, D.; Naesgaard, E.; Byrne, P.M.; Adalier, K.; Abdoun, T. Numerical model verification and calibration of George Massey Tunnel using centrifuge models. Can. Geotech. J. 2004, 41, 921–942. [Google Scholar] [CrossRef] [Green Version]
- Nakajima, S.; Abe, K.; Shinoda, M.; Nakamura, S.; Nakamura, H.; Chigira, K. Dynamic centrifuge model tests and material point method analysis of the impact force of a sliding soil mass caused by earthquake-induced slope failure. Soils Found. 2019, 59, 1813–1829. [Google Scholar] [CrossRef]
- Nakajima, S.; Abe, K.; Shinoda, M.; Nakamura, S.; Nakamura, H. Experimental study on impact force due to collision of rockfall and sliding soil mass caused by seismic slope failure. Landslides 2020, 18, 195–216. [Google Scholar] [CrossRef]
- Enomoto, T.; Sasaki, T. Seismic behaviour of reinforced embankments in dynamic centrifuge model tests. Soils Grounds 2018, 58, 212–227. [Google Scholar] [CrossRef]
- Enomoto, T.; Sasaki, T. Several factors affecting seismic behaviour of embankments in dynamic centrifuge model tests. Soils Grounds 2015, 55, 813–828. [Google Scholar] [CrossRef] [Green Version]
- Park, H.-J.; Kim, D.-S. Evaluation of seismic behaviour of Cheomseongdae using dynamic centrifuge model test. Earthq. Eng. Struct. Dyn. 2015, 44, 695–711. [Google Scholar] [CrossRef]
- Yang, J.; Yang, M.; Chen, H. Influence of pile spacing on seismic response of piled raft in soft clay: Centrifuge modeling. Earthq. Eng. Eng. Vib. 2019, 18, 719–733. [Google Scholar] [CrossRef]
- Xu, C.; Zhang, Z.; Li, Y.; Du, X. Validation of a numerical model based on dynamic centrifuge tests and studies on the earthquake damage mechanism of underground frame structures. Tunn. Undergr. Space Technol. 2020, 104, 103538. [Google Scholar] [CrossRef]
- Liu, X.; Chen, H.; Liu, K.; He, C. Model test and stress distribution law of unsymmetrical loading tunnel in bedding rock mass. Arab. J. Geosci. 2017, 10, 184. [Google Scholar] [CrossRef]
- Polycarpou, P.C.; Petros, K. Numerical investigation of potential mitigation measures for poundings of seismically isolated buildings. Earthq. Struct. 2011, 2, 1–24. [Google Scholar] [CrossRef]
- Ouyang, Z.; Cui, J.; Li, Y.; Yuan, D. Shaking table test research on tunnel structures with different stiffness in liquefied soil layer. Mod. Tunn. Technol. 2018, 55, 10. [Google Scholar]
- Chen, S.; Tang, B.; Zhuang, H.; Wang, J.; Li, X.; Zhao, K. Experimental investigation of the seismic response of shallow-buried subway station in liquefied soil. Soil Dyn. Earthq. Eng. 2020, 136, 106153. [Google Scholar]
- Bao, X.; Xia, Z.; Ye, G.; Fu, Y.; Su, D. Numerical analysis on the seismic behavior of a large metro subway tunnel in liquefiable ground. Tunn. Undergr. Space Technol. 2017, 66, 91–106. [Google Scholar] [CrossRef]
- Liu, H.; Huang, M. Centrifugal shaking table test of seismic response of rectangular tunnels with different depths. Rock Mech. Eng. 2013, 2013, 3404–3412. [Google Scholar] [CrossRef]
- Zhou, H.; Xu, H.; Yang, P.; Zheng, G.; Liu, X.; Zhang, W.; Zhao, J.; Yu, X. Centrifuge and numerical modelling of the seismic response of tunnels in two-layered soils. Tunn. Undergr. Space Technol. 2021, 113, 103980. [Google Scholar] [CrossRef]
- Chen, J.; Jiang, L.; Li, J.; Shi, X. Numerical simulation of shaking table test on utility tunnel under non-uniform earthquake excitation. Tunn. Undergr. Space Technol. 2012, 30, 205–216. [Google Scholar] [CrossRef]
- Baziar, M.H.; Moghadam, M.R.; Choo, Y.W.; Kim, D.-S. Tunnel flexibility effect on the ground surface acceleration response. Earthq. Eng. Eng. Vib. 2016, 15, 457–476. [Google Scholar] [CrossRef]
- Chian, S.C.; Tokimatsu, K.; Madabhushi, S.P.G. Soil liquefaction–induced uplift of underground structures: Physical and numerical modeling. J. Geotech. Geoenviron. Eng. 2014, 140, 04014057. [Google Scholar] [CrossRef] [Green Version]
- Baziar, M.H.; Moghadam, M.R.; Kim, D.-S.; Choo, Y.W. Effect of underground tunnel on the ground surface acceleration. Tunn. Undergr. Space Technol. 2014, 44, 10–22. [Google Scholar] [CrossRef]
- Wang, C.; Lai, Y.; Yu, F.; Li, S. Estimating the freezing-thawing hysteresis of chloride saline soils based on the phase transition theory. Appl. Therm. Eng. 2018, 135, 22–33. [Google Scholar] [CrossRef]


| Model Parameters | Cohesive Soil | Concrete |
|---|---|---|
| Poisson’s ratio | 0.33 | 0.17 |
| Friction angle (°) | 19.2 | |
| Cohesion (kPa) | 31 | |
| Elastic modulus (kPa) | 1 × 10⁵ | 3.5 × 10⁷ |
| Density (kg/m3) | 0.73 | |
| Poriness | 0.4 | |
| Permeability quotient (cm/s) | 1 × 10⁻⁷ |
Publisher’s Note: MDPI stays neutral with regard to jurisdictional claims in published maps and institutional affiliations. |
© 2022 by the authors. Licensee MDPI, Basel, Switzerland. This article is an open access article distributed under the terms and conditions of the Creative Commons Attribution (CC BY) license (https://creativecommons.org/licenses/by/4.0/).
Share and Cite
Chen, Z.; Bian, M. Dynamic Centrifuge Test and Numerical Modelling of the Seismic Response of the Tunnel in Cohesive Soil Foundation. Buildings 2022, 12, 337. https://doi.org/10.3390/buildings12030337
Chen Z, Bian M. Dynamic Centrifuge Test and Numerical Modelling of the Seismic Response of the Tunnel in Cohesive Soil Foundation. Buildings. 2022; 12(3):337. https://doi.org/10.3390/buildings12030337
Chicago/Turabian StyleChen, Zhengfa, and Minghui Bian. 2022. "Dynamic Centrifuge Test and Numerical Modelling of the Seismic Response of the Tunnel in Cohesive Soil Foundation" Buildings 12, no. 3: 337. https://doi.org/10.3390/buildings12030337