Case Report

Monitoring and Calculation Study in Mediterranean Residential Spaces: Thermal Performance Comparison for the Winter Season

by
Bruno Oliveira Santana
1,*,
Jefferson Torres-Quezada
2,
Helena Coch
3 and
Antonio Isalgue
3
1
Department of Environment and Infrastructure, Federal University of Bahia, Salvador 40170-110, Brazil
2
Engineering, Industry and Construction Unit, Catholic University of Cuenca, Cuenca 010102, Ecuador
3
Architecture, Energy and Environment, School of Architecture, Polytechnic University of Catalonia, 08028 Barcelona, Spain
*
Author to whom correspondence should be addressed.
Buildings 2022, 12(3), 325; https://doi.org/10.3390/buildings12030325
Submission received: 7 January 2022 / Revised: 23 February 2022 / Accepted: 25 February 2022 / Published: 9 March 2022

Abstract

:
In cold regions, the reduction in envelope thermal transmittance is often the dominant parameter in ensuring thermal comfort in buildings. However, countries in warmer climates have also adopted this same strategy, often neglecting other parameters that are more influential in their respective climate regions that can achieve thermal comfort. This study focuses on passive building strategies to ensure a building’s thermal comfort conditions in Mediterranean climates in the winter. This monitoring study compares two dwellings during the winter in Barcelona, Spain, in order to analyze the impact of not only the envelope’s thermal properties on indoor temperature, but also the role of other factors such as outdoor temperature and solar gains. The dwellings were built in different decades, each following distinct building technical codes, diverse construction techniques, and building materials. The methodology used in this study is based on thermal measurements, meteorological data, and spreadsheet calculations. Comparing these results with the recent updates in Spain’s technical code and other studies, the investigation demonstrates that to achieve a suitable indoor thermal temperature in a passive way, especially in Mediterranean climates, incorporating other factors such as the combination of thermal inertia and solar gains can be more effective than a strategy mainly focused on reducing thermal transmittance. This analysis demonstrates that a building’s thermal performance does not mainly depend on envelope thermal transmittance, but rather a complex system involving a set of variables such as thermal inertia as well as solar gains, based on parameters such as building orientation and urban context.

1. Introduction

In order to reduce the effects of climate change and global warming caused by energy consumption, building regulations around the world have focused on strategies to reduce energy demand [1]. When building energy performance is discussed, the thermal insulation approach is often first cited, especially in cold regions [2] where the building’s losses play a relevant role on heating demand. According to several studies, one of the most important thermal parameters for energy conservation in buildings is reducing envelope thermal transmittance using materials with a high level of insulation [3,4]. Thus, some research has concentrated on determining the optimal thermal insulation thickness in different climates [5,6]. Likewise, other studies have pointed out the importance of insulate materials on economical and energy savings [7,8]. The importance of this strategy has also been highlighted in the energy optimization of traditional buildings [9]. Due to the fact that the study of building energy performance started in cold regions, and is still mainly concentrated there, building energy regulations in several countries with different climates have adopted the same parameters established for these colder climates [10,11].
In Spain, for instance, the latest Technical Building Code (CTE) standard was published in 2006, updating the former building parameters. Regarding thermal issues, this 2006 code presents parameters related to the envelope’s thermal transmittance (thermal insulation), air permeability, and the building’s energy demand, taking into consideration Spain’s different climate zones. In regard to thermal transmittance (U-value) in Barcelona, the 2006 code established a maximum value for external walls of 0.7 W/m2·K [12]. From 1999 to 2006, the regulations allowed a maximum thermal transmittance of 1.5 W/m2·K [13]. From 1979 to 1996, the maximum value of 1.9 W/m2·K was established by the Building Basic Norm (NBE-CT-79) [14].
Nevertheless, there are more building features involved in this concern, such as solar gains, thermal mass, and ventilation [15]. The importance of these other features depends mainly on the climate where the building will be constructed.
Regarding material properties and their association with climate issues, some studies point out the relationship between thermal resistance and thermal mass with outdoor temperature [16]. On one hand, thermal insulation is the most important building feature in regions where there are large differences between indoor and outdoor temperatures. On the other hand, thermal mass allows more stable indoor temperatures, especially in cases with high daily outdoor oscillation [17]. In that regard, Deng et al. and Pearlmutter et al. [18,19] highlighted the relevance of high thermal mass envelope incorporating external insulation in order to reduce energy demand for heating and cooling in cold and Mediterranean regions, respectively.
In regard to the role of thermal mass and indoor temperature, Mingozzi et al. [20] supported through dynamic simulations the importance of thermal mass in Mediterranean climates (Pieve di Cento, Italy) in reducing thermal discomfort in winter, and especially in summer. This study addressed a comparative analysis of two buildings with heavy and light thermal mass, with insulated envelopes lower than 0.4 W/m2·K. Likewise, Suárez et al. [21] analysed a recent retrofit in a multi-storey residential building located in Córdoba, Spain (37° N). The measurements were carried out in 68 social housing units with varying orientations (northeast, south, southwest). The premise of the rehabilitations included the following: reducing the wall’s thermal transmittance (0.33 W/m2·K), accumulation of energy through the wall’s thermal inertia, and improving the window’s thermal insulation (3.80 W/m2·K). The increase in thermal inertia and the reduction in building losses promotes more stable temperatures. Furthermore, the results showed a significant reduction in the overall energy demand (38.16%), especially for heating demand (45%). However, the measurements also showed that the indoor temperature of the northeast-facing units still remained below the thermal comfort parameter.
Looking for a building envelope strategy that promoted adequate indoor temperature without using any kind of active system on cities of Iberian Peninsula, Curado et al. [22] analysed which U-value was more feasible to achieve this goal. They argued that the majority of population of low-income neighbourhoods in Portugal lived without heating and cooling. As their case study, the authors used a social housing unit in Porto that was renovated in 2011. This renovation included the thermal transmittance reduction of the roof and windows to 0.45 W/m2·K and 2.8 W/m2·K, respectively, but maintained the wall’s thermal transmittance at 1.3 W/m2·K. The investigation’s results showed that external walls with U-value 1.3 W/m2·K enabled adequate indoor temperature most of the time, during both winter and summer in the cities of Lisbon, Faro, and Seville. However, in the other cities (Porto, Bragança, Madrid, Barcelona and Bilbao), this insulation level was not sufficient to provide suitable thermal conditions. Furthermore, in these cases, the thermal transmittance reduction did not improve the indoor thermal conditions in winter, which requires the use of a heating system.
It is important to highlight that Curado et al. [22] did not focus on different levels of solar radiation between these cities or the possibility in achieving suitable indoor temperatures by increasing solar gains where possible. In this regard, Fernandes et al. [23] emphasized the passive design solutions incorporated by vernacular buildings from the north of Portugal in order to deal with cold, wintery conditions, such as the thatched roof for its insulating properties and south-facing balconies to take advantage of solar radiation.
Apart from the vernacular buildings, other studies addressed the importance of orientation and solar gains [24]. For instance, Yong et al. [25] investigated which passive building design factors should be optimized to minimize building energy loads in eight climate zones of the United States. Using simulation tools, the authors highlight the impact of SHGC (Solar Heat Gain Coefficient) which directly affects the heat gain from insolation, thereby lowering the heating load. This effect becomes more evident in climate zones characterized by high values of solar radiation. For this reason, the investigation classified the building envelope factors into three groups, in order of relevance: Group 1, with the building parameter that controls solar radiation into the building; Group 2, with factors that control the temperature difference between the indoor and outdoor environments (window, wall insulation, and air leakage); and Group 3, with factors that affect the building energy loads by varying the effective building area for the solar radiation and the heat conduction through the envelope (window–wall ratio, floor area, ceiling height, etc).
In summary, a low thermal transmittance has been the main factor focused on reducing building losses, and thus energy demand. In this context, the updated building regulation in Spain was adopted as the main strategy to enhance the building thermal performance through the reduction in maximum values of thermal transmittance. However, other studies have revealed the importance of contrasting the building’s envelope efficiency with the climate issues of each site. Additionally, despite the fact that other studies recognized the importance of high thermal mass, they only analyzed this parameter based on an insulated envelope. In relation to climate, despite the intense solar radiation in the Mediterranean region, some investigations analyzed building envelope’s properties in association with only outdoor temperatures.
Consequently, all these studies highlighted the effectiveness of low thermal transmittance as a sustainable strategy, specifically from the point of view of reducing energy demand. Nevertheless, few considered the impact of the strategies within a non-heated space to ensure comfort conditions without the use of active air-conditioning systems.
Within this context, this study focuses on passive building strategies to ensure building’s thermal comfort conditions and the efficient use of heating systems in Mediterranean climates in the winter season. For that matter, this investigation analysed the impact of the envelope’s thermal properties, outdoor temperature, and solar gains on the indoor temperature and heating demand. The main reason in evaluating these two parameters was to highlight which building’s thermal properties should be enhanced to promote suitable indoor temperatures, in order to minimize the use of a heating system.

2. Materials and Methods

In order to achieve the purpose of this investigation, a thermal comparison was performed between two dwellings in winter. These dwellings were located in Barcelona, Spain. They were built in different periods in accordance with their distinct technical codes.
The comparison of thermal performance was carried out on site by means of measurements using relevant thermodynamic equations. The measurements were carried out in the winter of 2017. The parameter considered in evaluating the building thermal performance was the indoor air temperature (Ti). The CTE 2006’s standards established an indoor air temperature between 20 °C and 25 °C as the comfort zone of a building. A space with a temperature above or below this range needed the use of cooling or heating active systems, respectively. This range of temperature was considered to evaluate the indoor thermal performance of the dwellings analyzed. These dwellings were different in several aspects. Therefore, it is necessary to describe in detail their urban contexts and building characteristics.

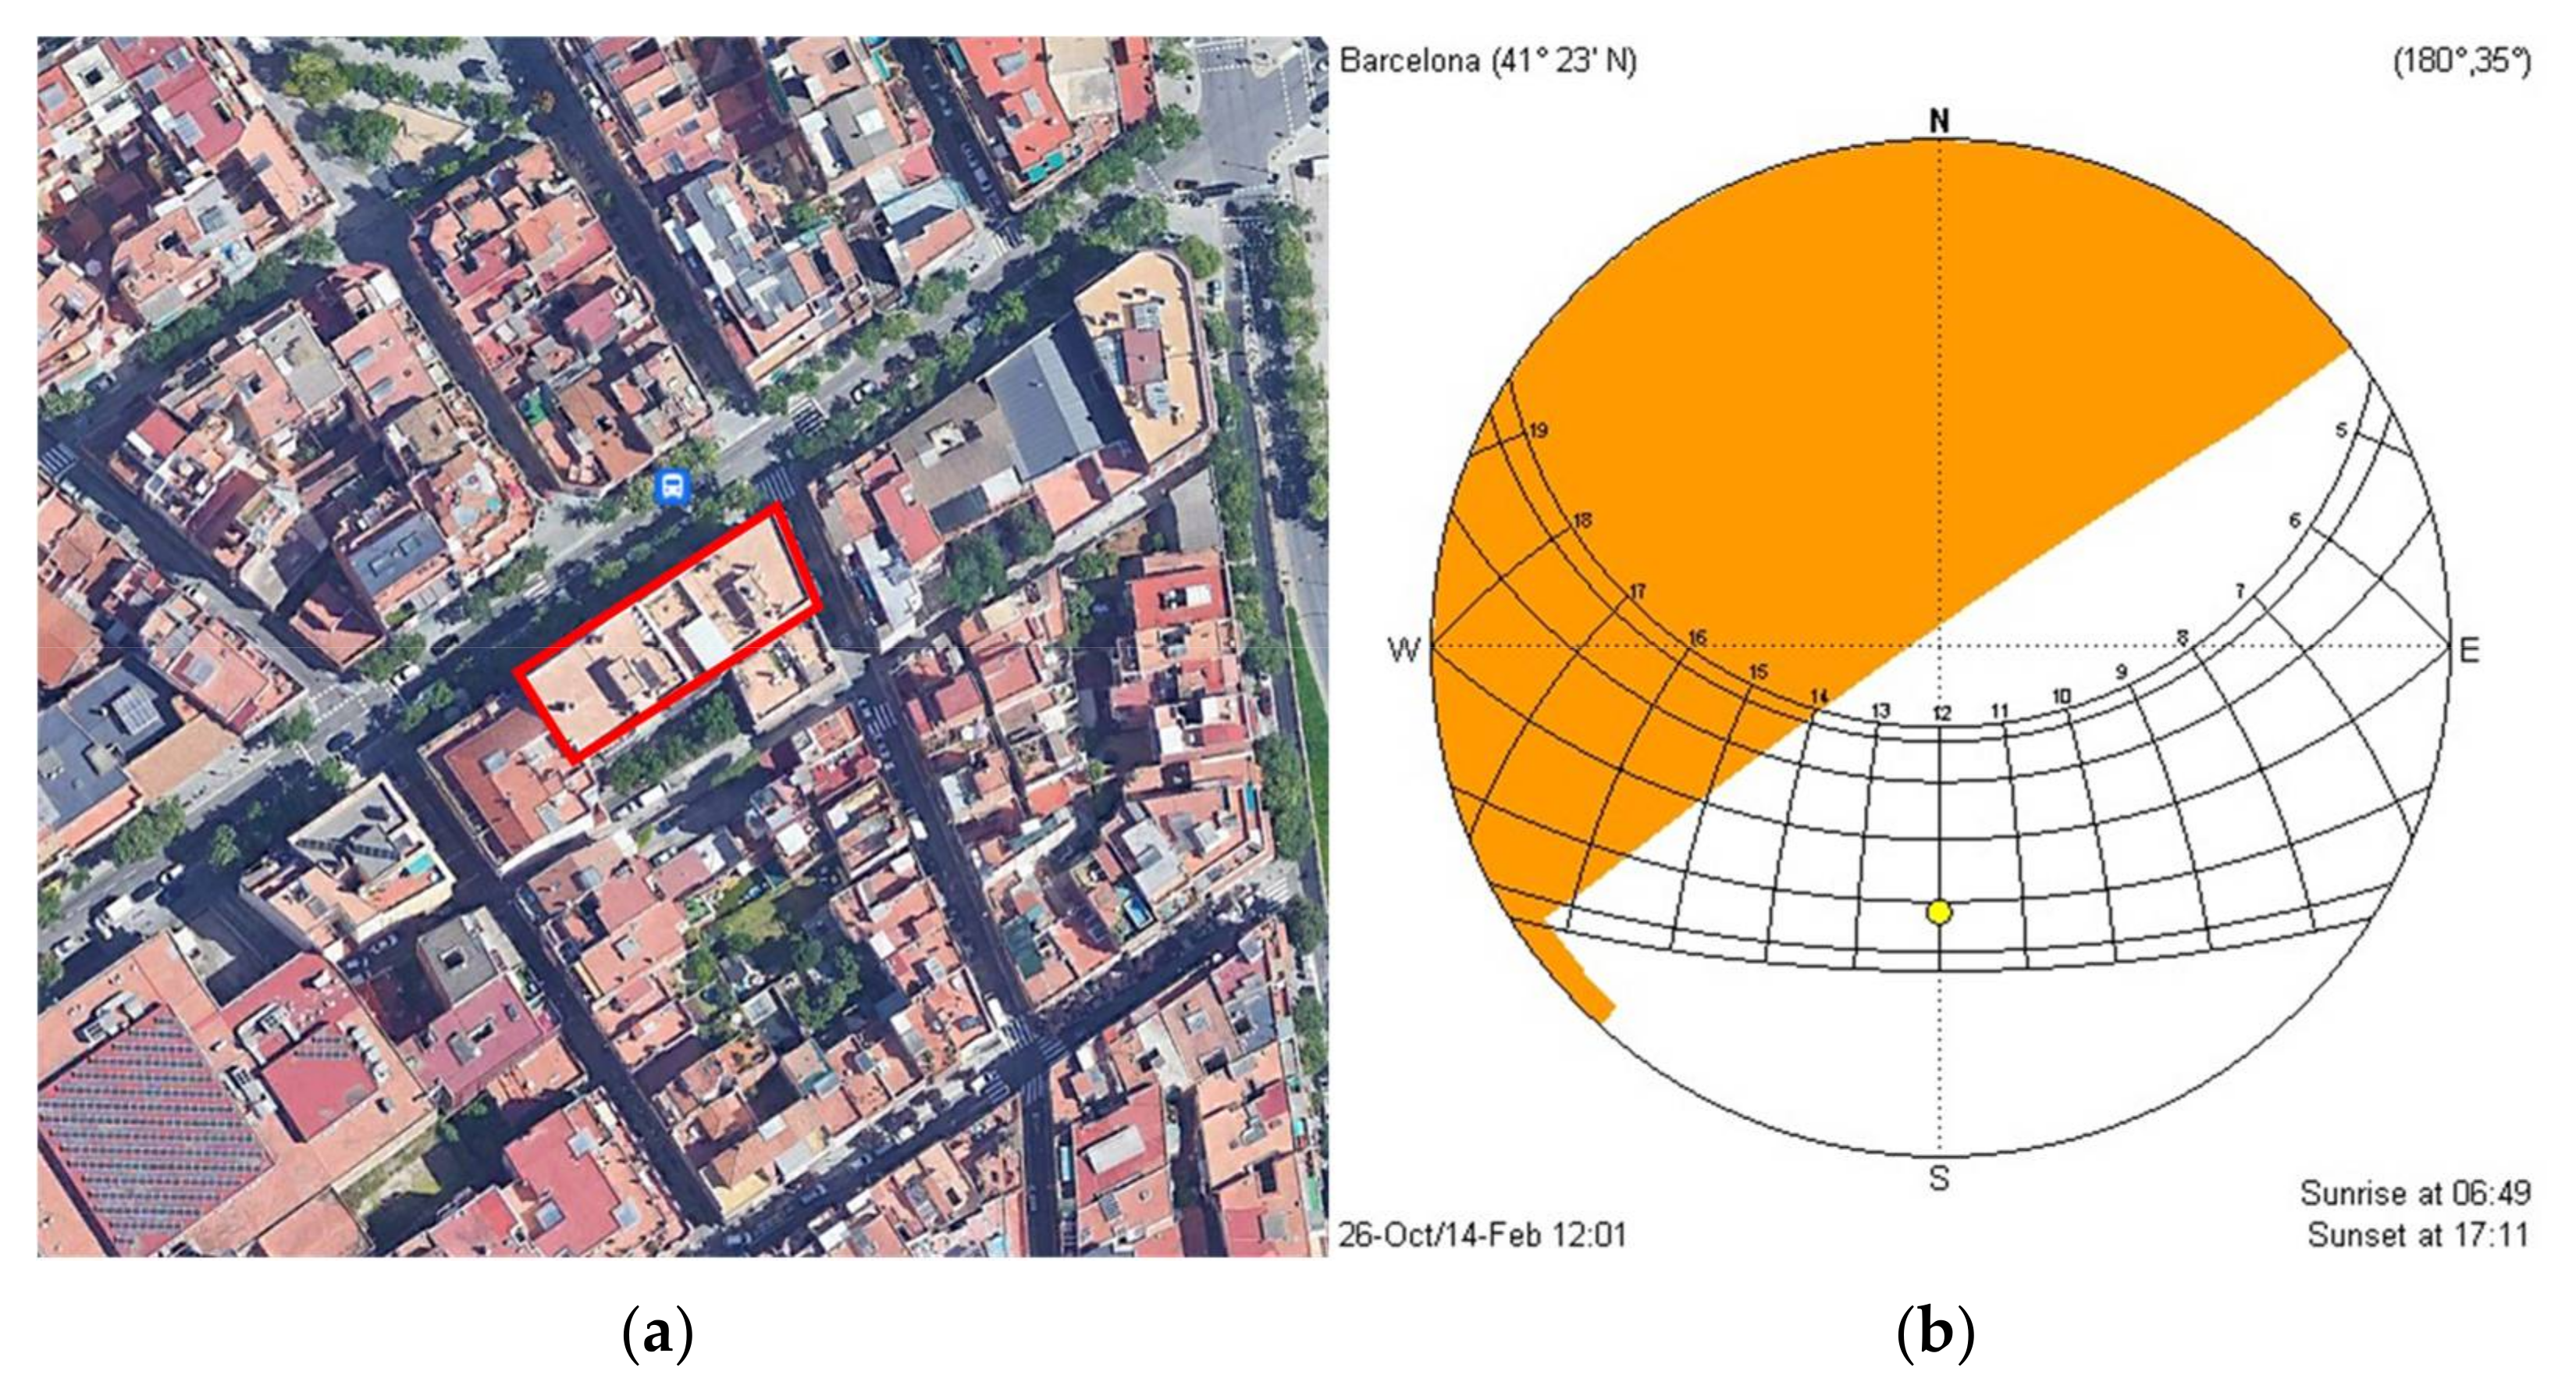
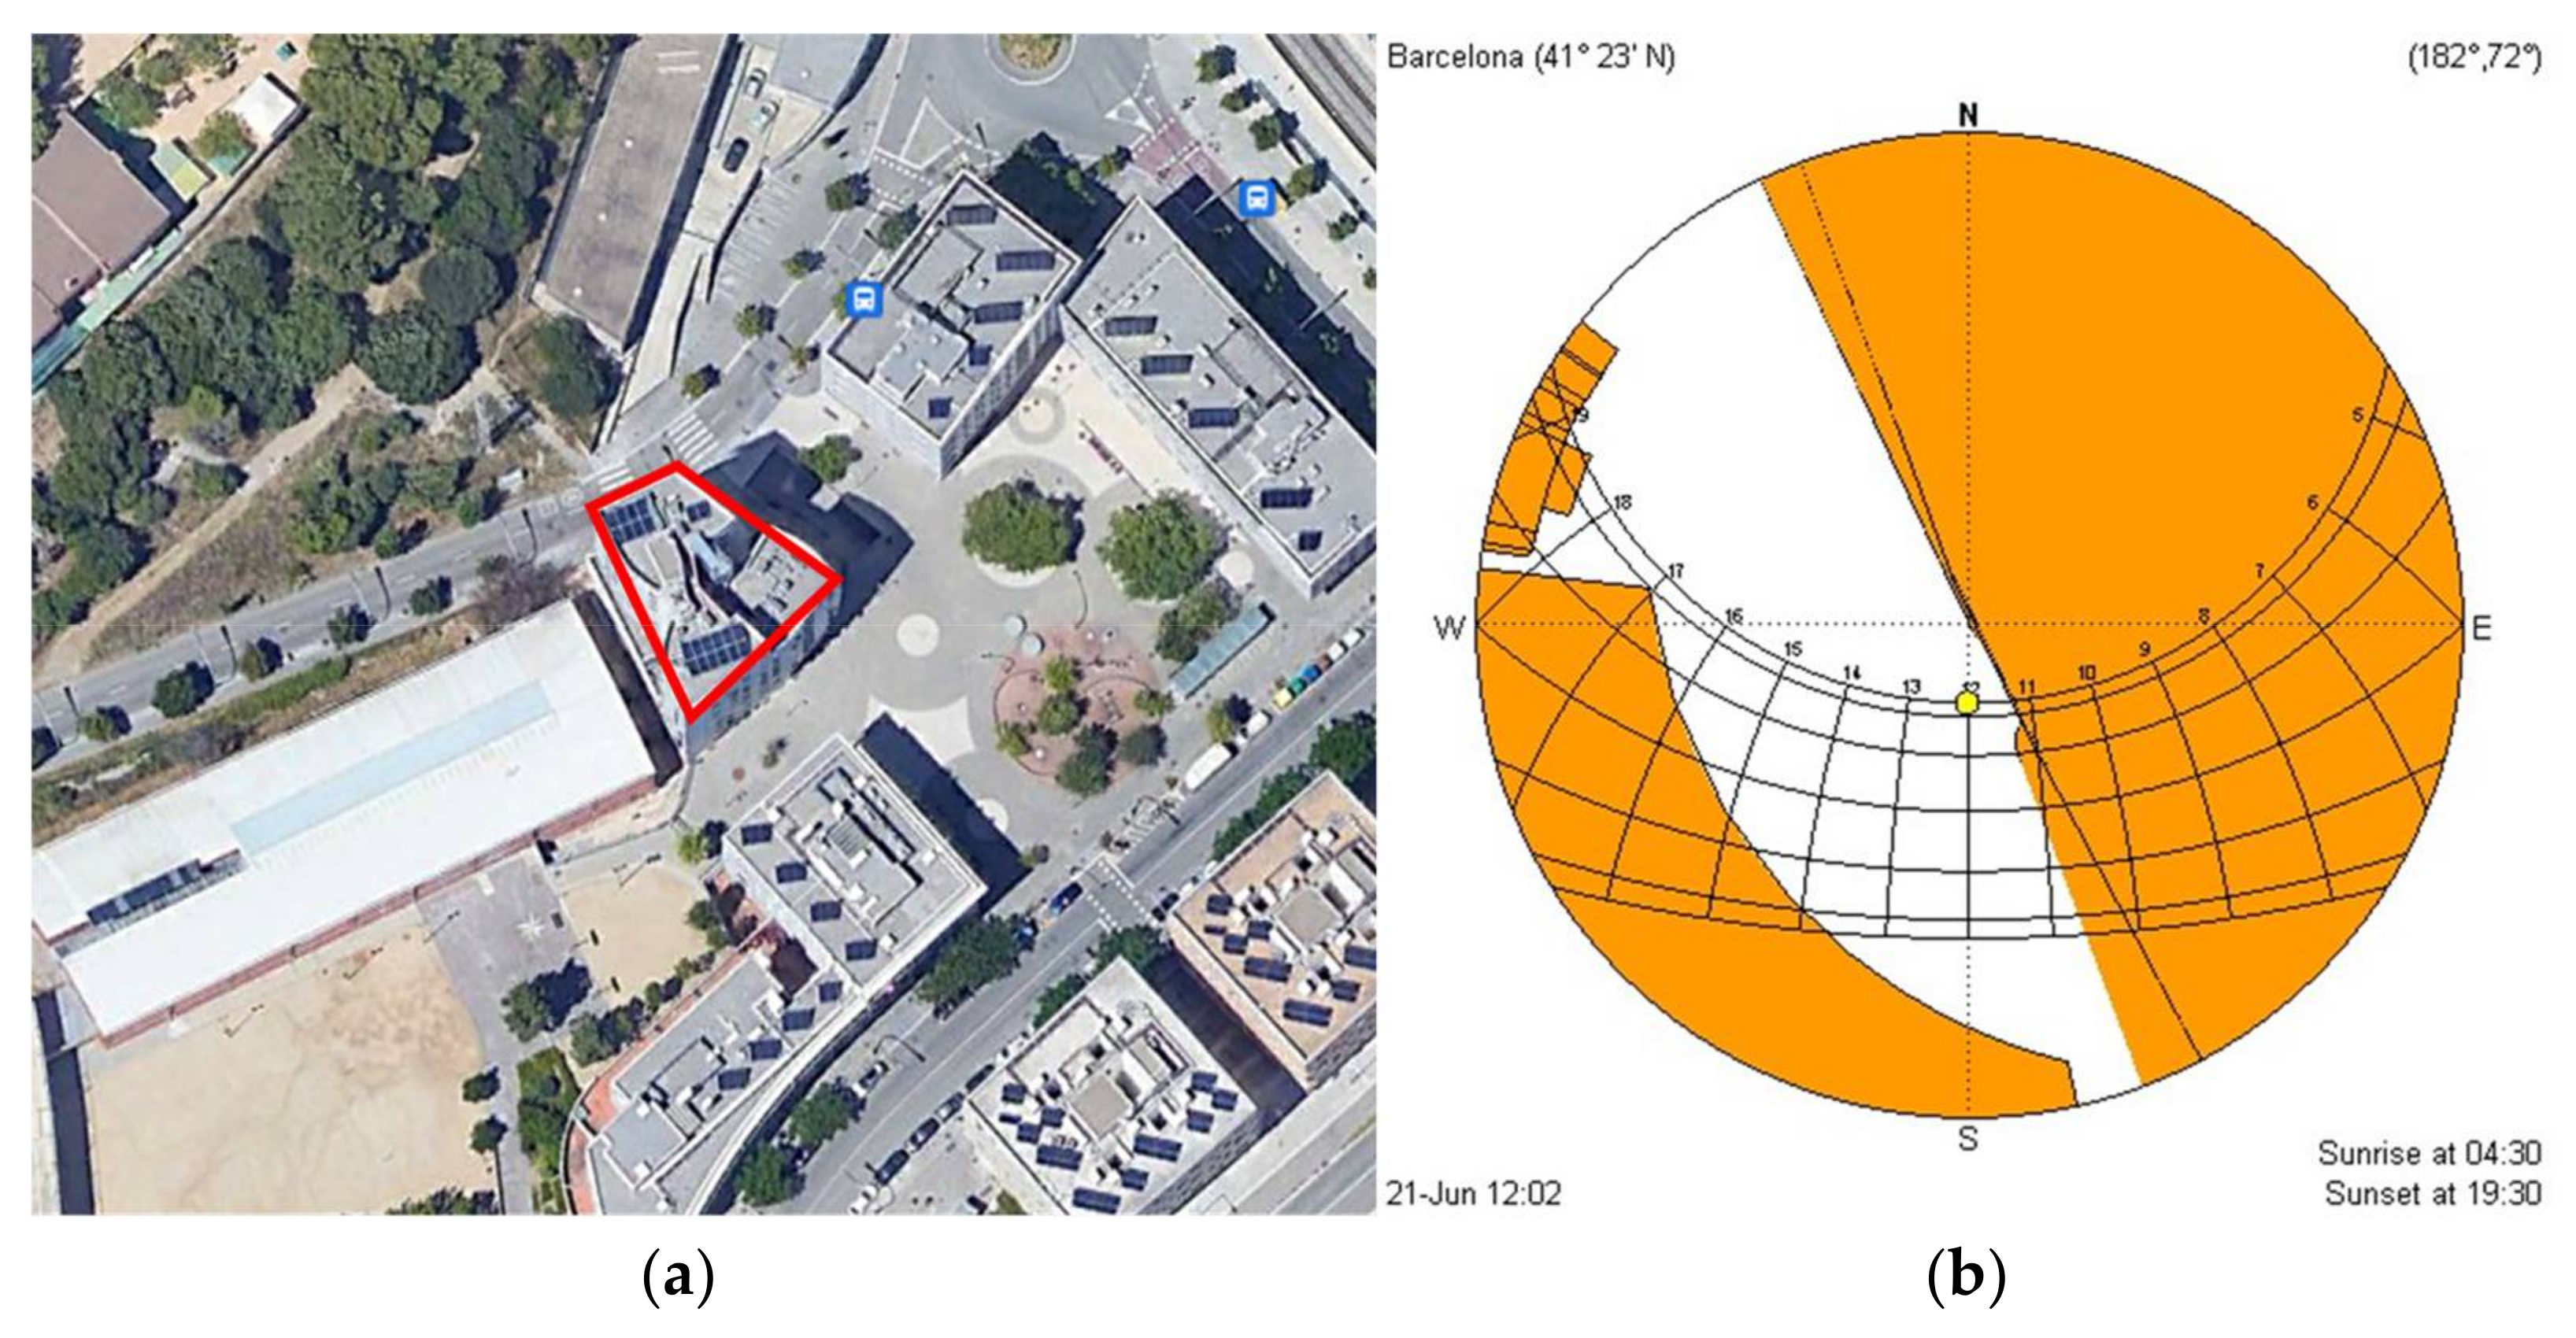
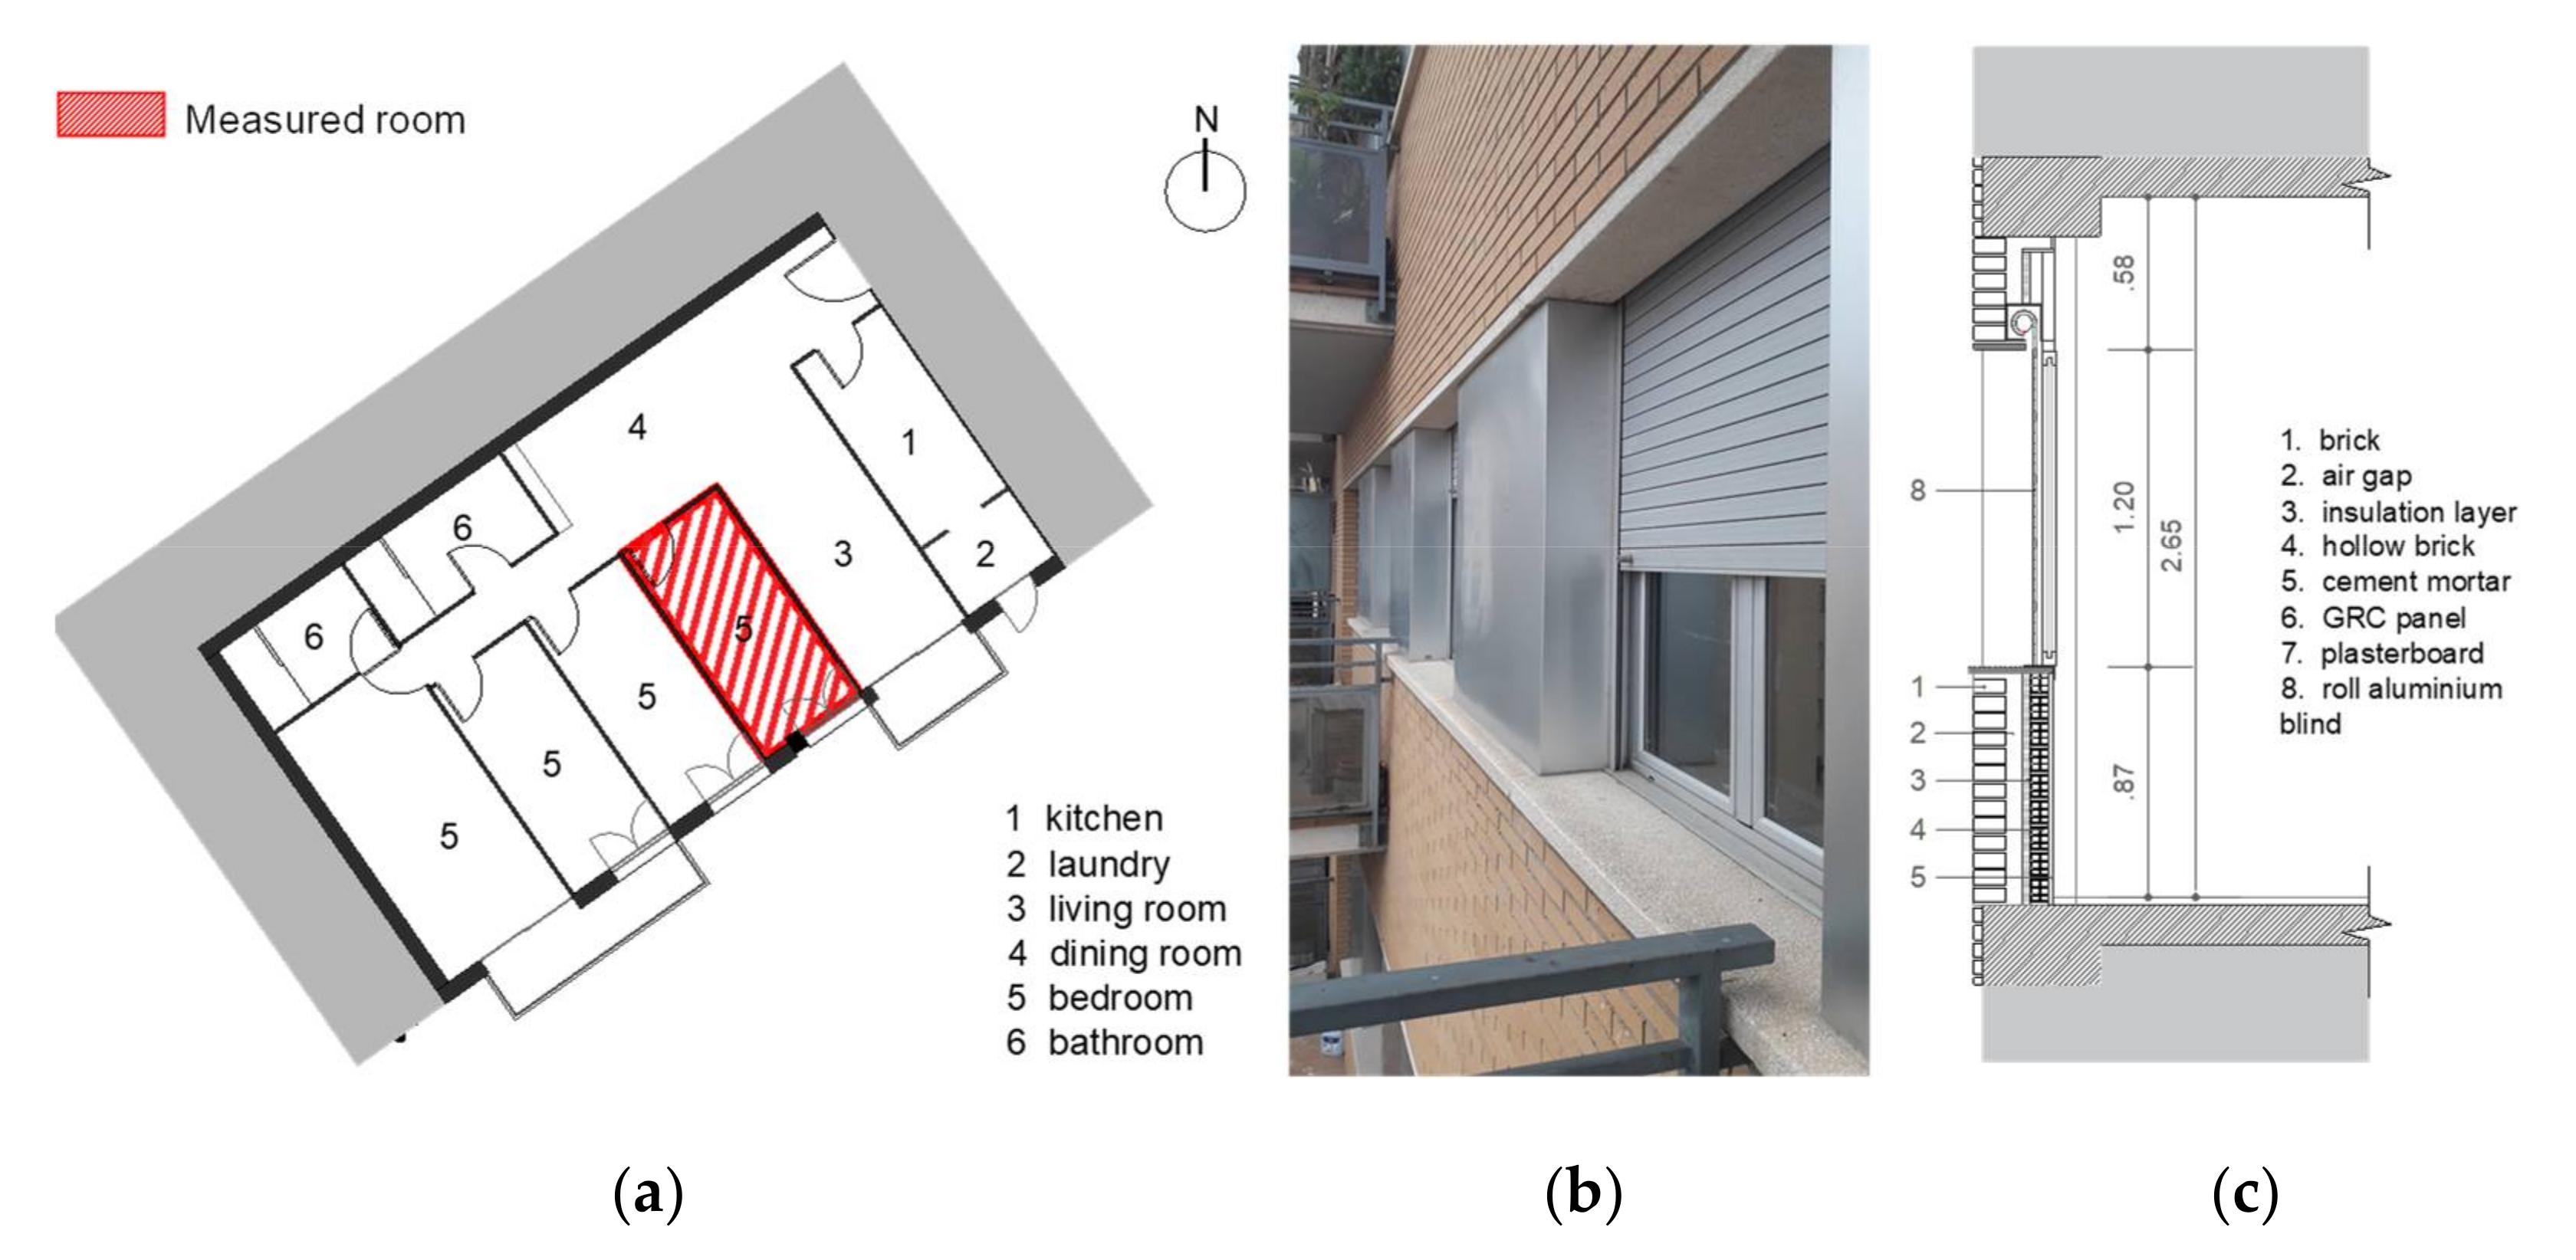
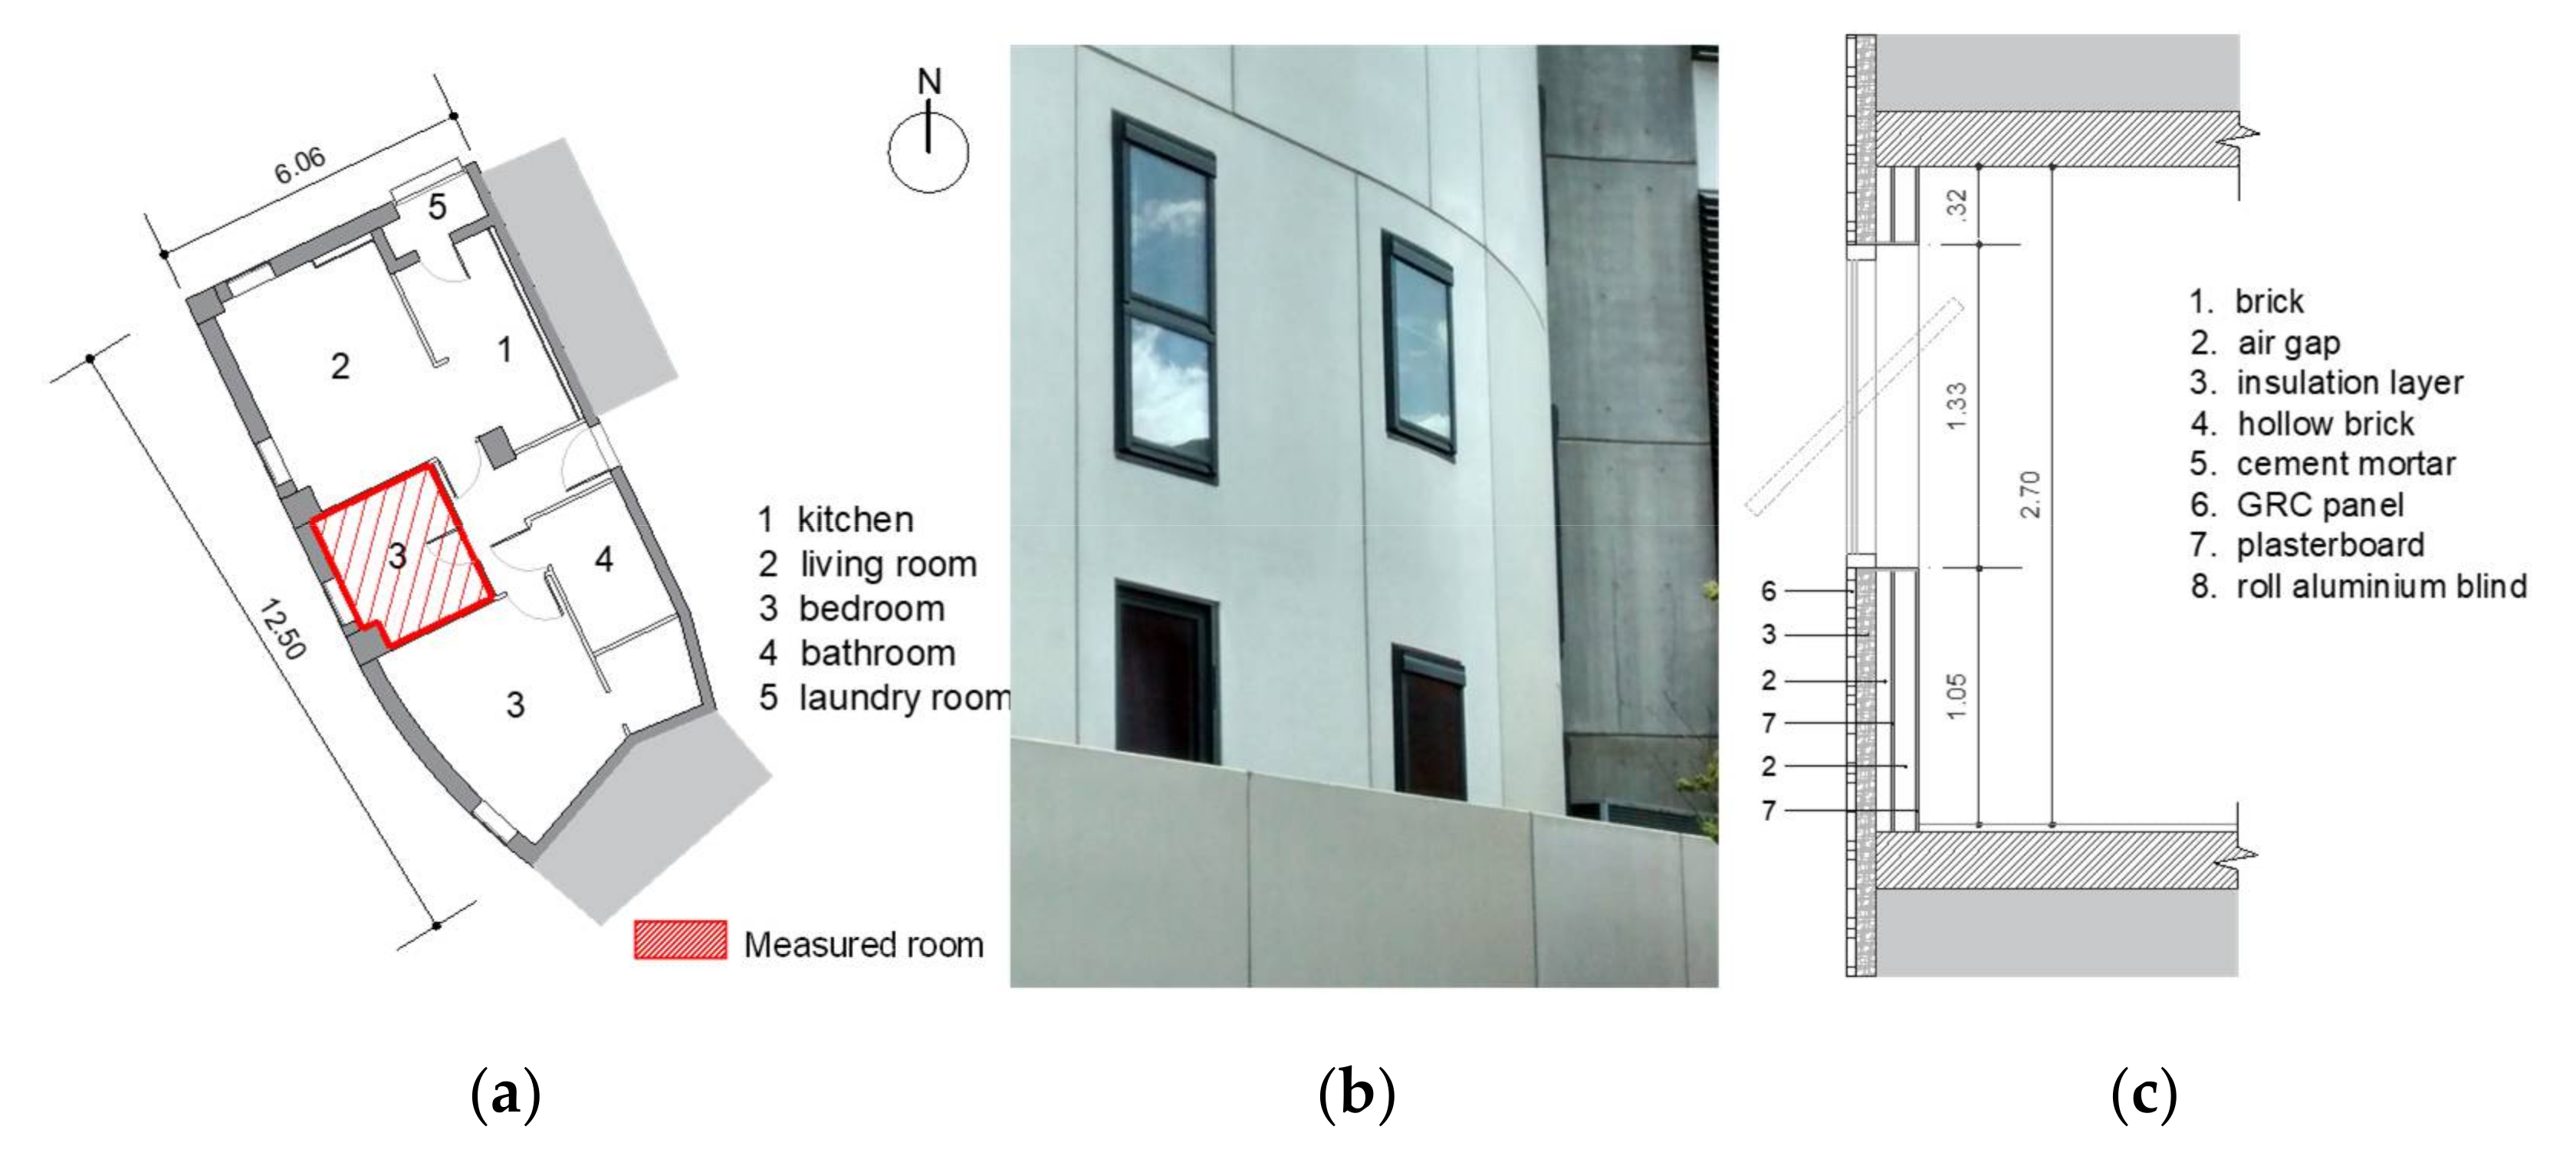
2.1. Description of the Case Studies

The two dwellings considered were located in different districts of Barcelona: El Carmel and Torre Baró. Although located in the same city, they had different microclimates based on their respective orientation, urban context, and altitude. The dwelling located in El Carmel, referred to as Dw1, lay on a slope oriented southeast. This district is characterized by a semi-dense urban context and a higher altitude than the center of Barcelona, 125 masl (Figure 1). The room’s façade was oriented 145° N and had no external obstructions for solar radiation. This dwelling´s orientation promoted solar gains during most of the day in winter, when solar gains are necessary to achieve higher indoor temperatures, while protecting the indoor environment from solar gains during summer afternoons. The dwelling located in Torre Baró, referred to as Dw2, lay on a slope oriented southwest. It had an urban context widely dispersed and located at a height of 42 masl (Figure 2). The room’s façade was oriented 245° N and had some external obstructions for solar radiation, especially during winter. In this case, the dwelling´s orientation allowed solar gains between 11:00 and 14:00 in winter, and between 11:00 and 19:00 in summer. The highest solar gains therefore occurred in summer when the outdoor temperatures were above the thermal parameters of comfort.
Dw1 was an apartment on the fourth floor of a five-story residential building with a floor area of 115 m2. It was built in 2002 according to the 1999 Technical Building Code parameters [13], including the 1.5 W/m2·K thermal transmittance maximum value for the external walls. This apartment had six rooms (living room, kitchen, four bedrooms) occupied by four people. One of these bedrooms was the space that was analyzed, highlighted in Figure 3. It had a floor area of 10 m2, a height of 2.65 m, and an exterior wall area of 5.78 m2. It was made of two layers of brick with an air cavity and a layer of insulation in the middle for a total thickness of 0.30 m. This wall had a window area of 1.58 m2 (27.3% of façade) made of aluminum frames and two glass panels separated by an air cavity. Furthermore, this window had aluminum roller blinds installed on the outside. The interior walls were made of 0.06 m thick, hollow bricks. The room was generally occupied by just one person and used as a space for sleeping from Monday to Friday and for sleeping and studying on Saturday and Sunday. The heating system was not used in any space in the apartment during this winter.
Dw2 was an apartment on the second floor of a ten-story residential building with a floor area of 76 m2. It was built in 2014 according to the 2006 Technical Building Code standards [12], including the 0.7 W/m2·K thermal transmittance maximum value for the external walls. The apartment had six rooms (living room, kitchen, bathroom, two bedrooms and laundry room) occupied by three people. One of the two bedrooms was unoccupied and it was in this unoccupied bedroom where the measurements were taken (Figure 4). It had a floor area of 6.66 m2 and a height of 2.70 m. The area of the exterior wall was 7.67 m2. It was composed by various layers: prefabricated panels of glass fiber-reinforced concrete (GRC panel), insulation layer, air cavity, and plasterboard. It had a total thickness of 0.35 m. This wall had a window area of 1.2 m2 (15.6% of the façade) made of wood frame and three glass panels separated by an argon gap of 14 mm (3 + 3 + 14 + 4). It had interior blinds which allowed for solar gains even when the occupant shut them. The interior walls were made of double-panel plasterboard with an air cavity in the middle and a thickness of 0.09 m. Industrialized construction processes were selected in order to achieve a faster and cheaper building due to the high price of labor [26]. This space was used for studying, especially during weekends. The heating system was used in the other bedroom, which shared a wall with the bedroom analyzed, during the period of the experiment between 20:00 and 22:00.
All the construction characteristics detailed in this section were obtained by a technical inspection on both dwellings. Furthermore, the legal technical documents for Dw2’s building construction stored at the municipal archive [26] were also used as a source.
Table 1 summarizes the building characteristics of both dwellings: thermal transmittance value of the exterior wall (W/m2·K), building volumetric heat capacity (J/K·m3), and window–wall ratio (WWR).

2.2. Monitoring Measurements

The measured parameter in the experimental work was the indoor air temperature (Ti), which was the reference parameter used to evaluate these two dwellings. In addition, the data of the outdoor air temperature (To) and the solar radiation (SR) were collected in specific meteorological stations listed below. The collection of these two climate parameters was used to give a perspective on the outdoor conditions of these two dwellings and principally to use them as reliable input data in the thermal calculations. All these measurements were carried out during two periods in the 2017 winter season: 27 January to 8 February, and 11–21 February. In the second period, the two spaces analyzed were unoccupied and all electrical appliances were off. Furthermore, in the case of Dw1, all rooms were unoccupied.
The measurements of the indoor air temperature of these dwellings were gathered by two data logger thermometers Testo 174H, one for each space. They collected data in 5 min intervals. In regard to outdoor air temperature (To), due to the different site conditions of these two dwellings (orientation, urban context and altitude), which probably modified their microclimates, the nearest weather station to each location was used. Dw1’s data came from weather station ID: IBARCELO240-Carrer dels Cortada, located 300 m from this building, at longitude 2°08′55″ E, latitude 41°25′29″ N, and altitude 128 masl [27]. Dw2’s data came from weather station ID: IMONTCAD4-Carrer de Sant Feliu de Codines, located 600 m from this building, at longitude 2°10′29″ E, latitude 41°27′23″ N, and altitude 136 masl [28]. Outdoor temperatures for both cases were collected in 30 min intervals. Finally, since these two meteorological stations did not record solar radiation values, this parameter was taken from a different station. The closest weather station to these two analyzed sectors with a record of solar radiation and similar cloud cover values was the Meteo Cat_Badalona Museu, located at longitude 2°14′51″ E, latitude 41°27′09″ N, and altitude 42 masl [29], which collected the data in 5 min intervals. In addition, to compare the data collected and show the variation of solar radiation in different places of the city, information from another meteorological station [30] was gathered.

2.3. Thermal Calculations

Thermal calculations were made in order to evaluate the influence of each dwelling’s building characteristic on their thermal performance.
The calculations focused on the mean indoor temperature (see Equation (1)), and its daily variability in the winter (see Equation (2)). This equation refers to a stationary method, which has been validated in different previous works to evaluate buildings’ thermal performances [31,32,33]. All the heat fluxes considered in these equations were correlated with the volume of space analyzed (Vh).
Equation (1) was used to calculate the mean indoor air temperature analyzed:
T i = T o + I + D G t + G v
where:
Ti: mean indoor temperature (°C)
To: mean outdoor temperature (°C)
I: solar gains by windows (W/m3)
D: internal gains (W/m3)
Gt: building transmission loss coefficient (W/°C∙m3)
Gv: building ventilation loss coefficient (W/°C∙m3)
Equation (2) obtains the variability of indoor air temperature with respect to mean value of (1):
T i = T o + I + D G t + G v I + D G t + G v × 1 e t G ´ / M
where:
ΔTi: variation of indoor temperature (°C)
ΔTo: variation of outdoor temperature (°C)
I′, D′, Gt′, Gv′: values of these fluxes in the night period considered
e: Euler’s number
t: time of the variation (night period = 16 h = 57,600 s)
M: building volumetric heat capacity (J/K∙m3)
The building volumetric heat capacity (M) was obtained by Equation (3):
M = V i × ρ i × c e i × C t V h  
where:
Vh: volume of interior materials (m3)
ρi: material’s density (kg/m3)
cei: heat capacity (J/°C∙Kg)
Ct: time factor (day-night = 0.6)
Vh: volume of the space analyzed (m3)
The outdoor air temperature (To and ΔTo) of each dwelling was configured according to the data collected from meteorological stations.
For solar gains by the windows, the amount of solar radiation and sky condition for each day of the period were analyzed first. Based on this evaluation, simulations with HeliodonTM_2.6-1 [34] and Heliodon Plus software [35] were carried out in order to calculate both the direct and diffuse component of the solar radiation in each window’s vertical plane.
The internal gains (D and D’) for both dwellings were configured to 0 W/°C·m3, since both rooms were unoccupied in the second period of measurements.
The building transmission loss coefficients (Gt and Gt′) only considered the thermal transmission through the exterior wall for each dwelling. The rest of the walls of the space analyzed were assumed as adiabatic transmission. In the case of Dw1, this assumption was based on the fact that its adjacent rooms were also unoccupied and had nearly the same building characteristics as well as similar window-to-wall ratio. In the case of Dw2, the rest of the rooms were occupied but not climatized. Thus, the gains corresponded only to the use of two people which meant a little higher temperature compared to the analyzed room. Consequently, in both dwellings, the adjacent rooms could have had different temperatures than the analyzed rooms, but this difference would be minimal. Therefore, the heat losses through interior walls were negligible, and in the case of Dw2 it probably represented minimal heat gain.
The building ventilation loss coefficients (Gv and Gv′) were set as 1.05 and 0.97 ACH to Dw1 and Dw2, respectively. This value was obtained from the study by Feijó-Muñoz et al. [36], which provided the infiltrations of different types of facades in multi-family buildings in Spain, obtained through in situ measurements at a pressure of 50 Pa. This value was converted to air change/hour under normal pressure through the equation used by Echari-Irribarren et al. [37]. The facades chosen corresponded to F.05 and F.10.
All the thermal characteristics (Vi, ρi, cei, Vh) were configured according to the constructive properties of each dwelling, obtained from government archives and technical codes [12,13,26].
The results obtained from these calculations were compared and validated with the measurements. Once these results were validated, Formulas (1) and (2) were used to assess the influence of each parameter—outdoor temperature (To), solar gains by windows (I) and the building volumetric heat capacity (M)—on the indoor thermal performance of these dwellings.
Finally, to give an additional perspective on the variable impacts considered, the energy for climatization was calculated with the use of Equation (4):
Q = Q l T s T i V h   ×   24 h
where:
Q: demand of climatization (Wh/m3)
Ql: transmission and ventilation losses (W/°C)
Top: set temperature (°C): 20 °C according to [12]
Ti: daily average of measured and calculated indoor temperature (°C)
Vh: volume of the space analyzed (m3)
It is necessary to clarify that the demand was correlated with the volume of space analyzed (Vh) and the calculations were made with the daily average values.

3. Results and Discussions

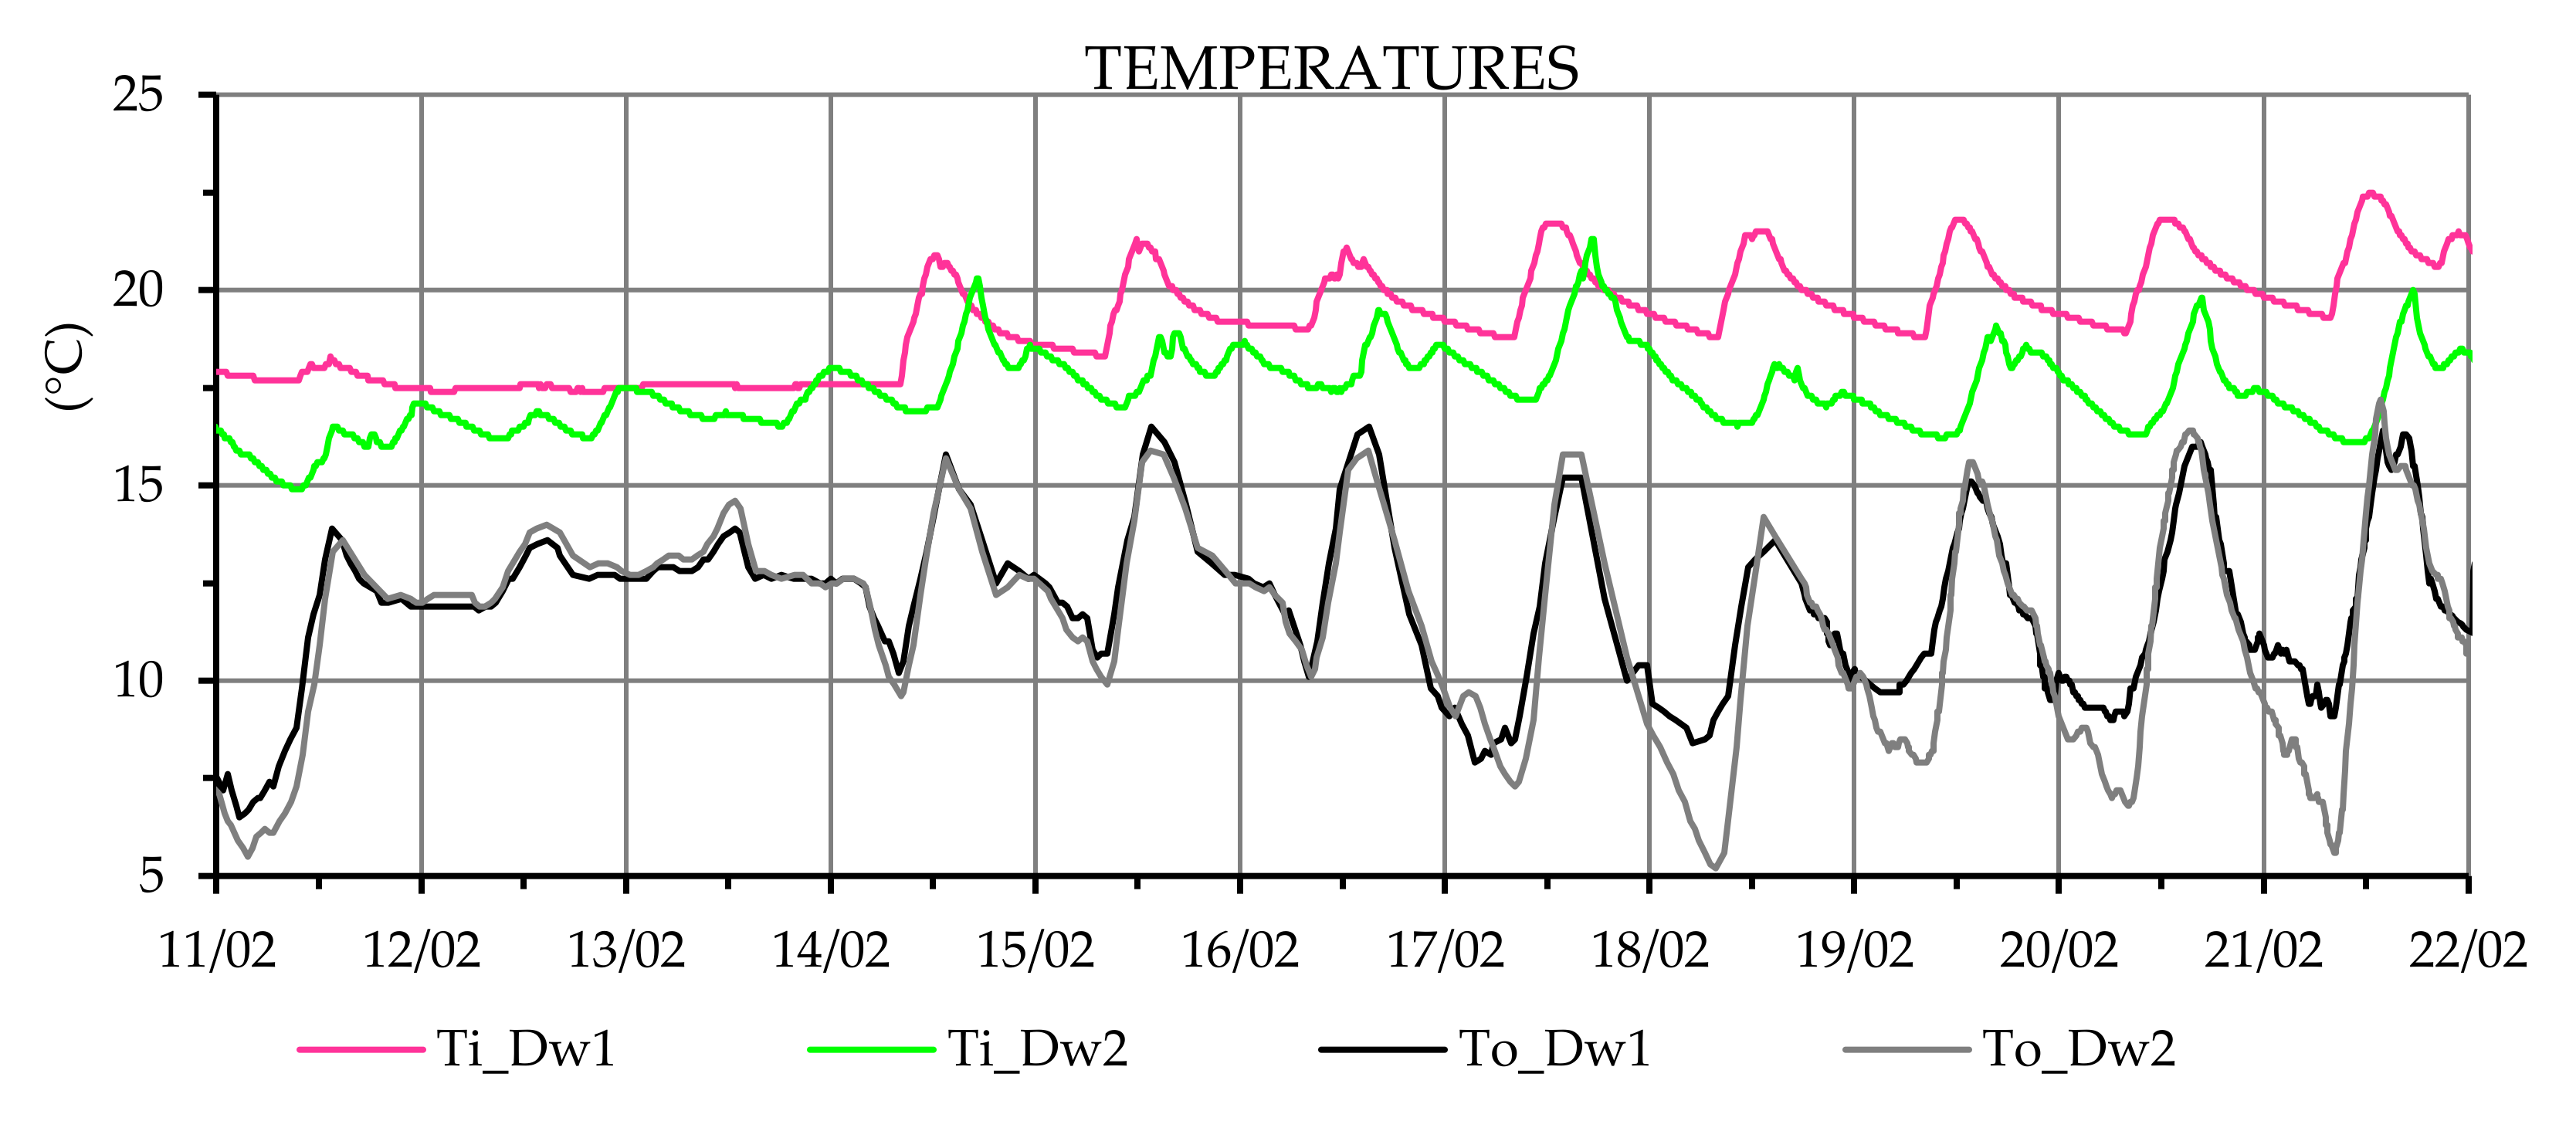
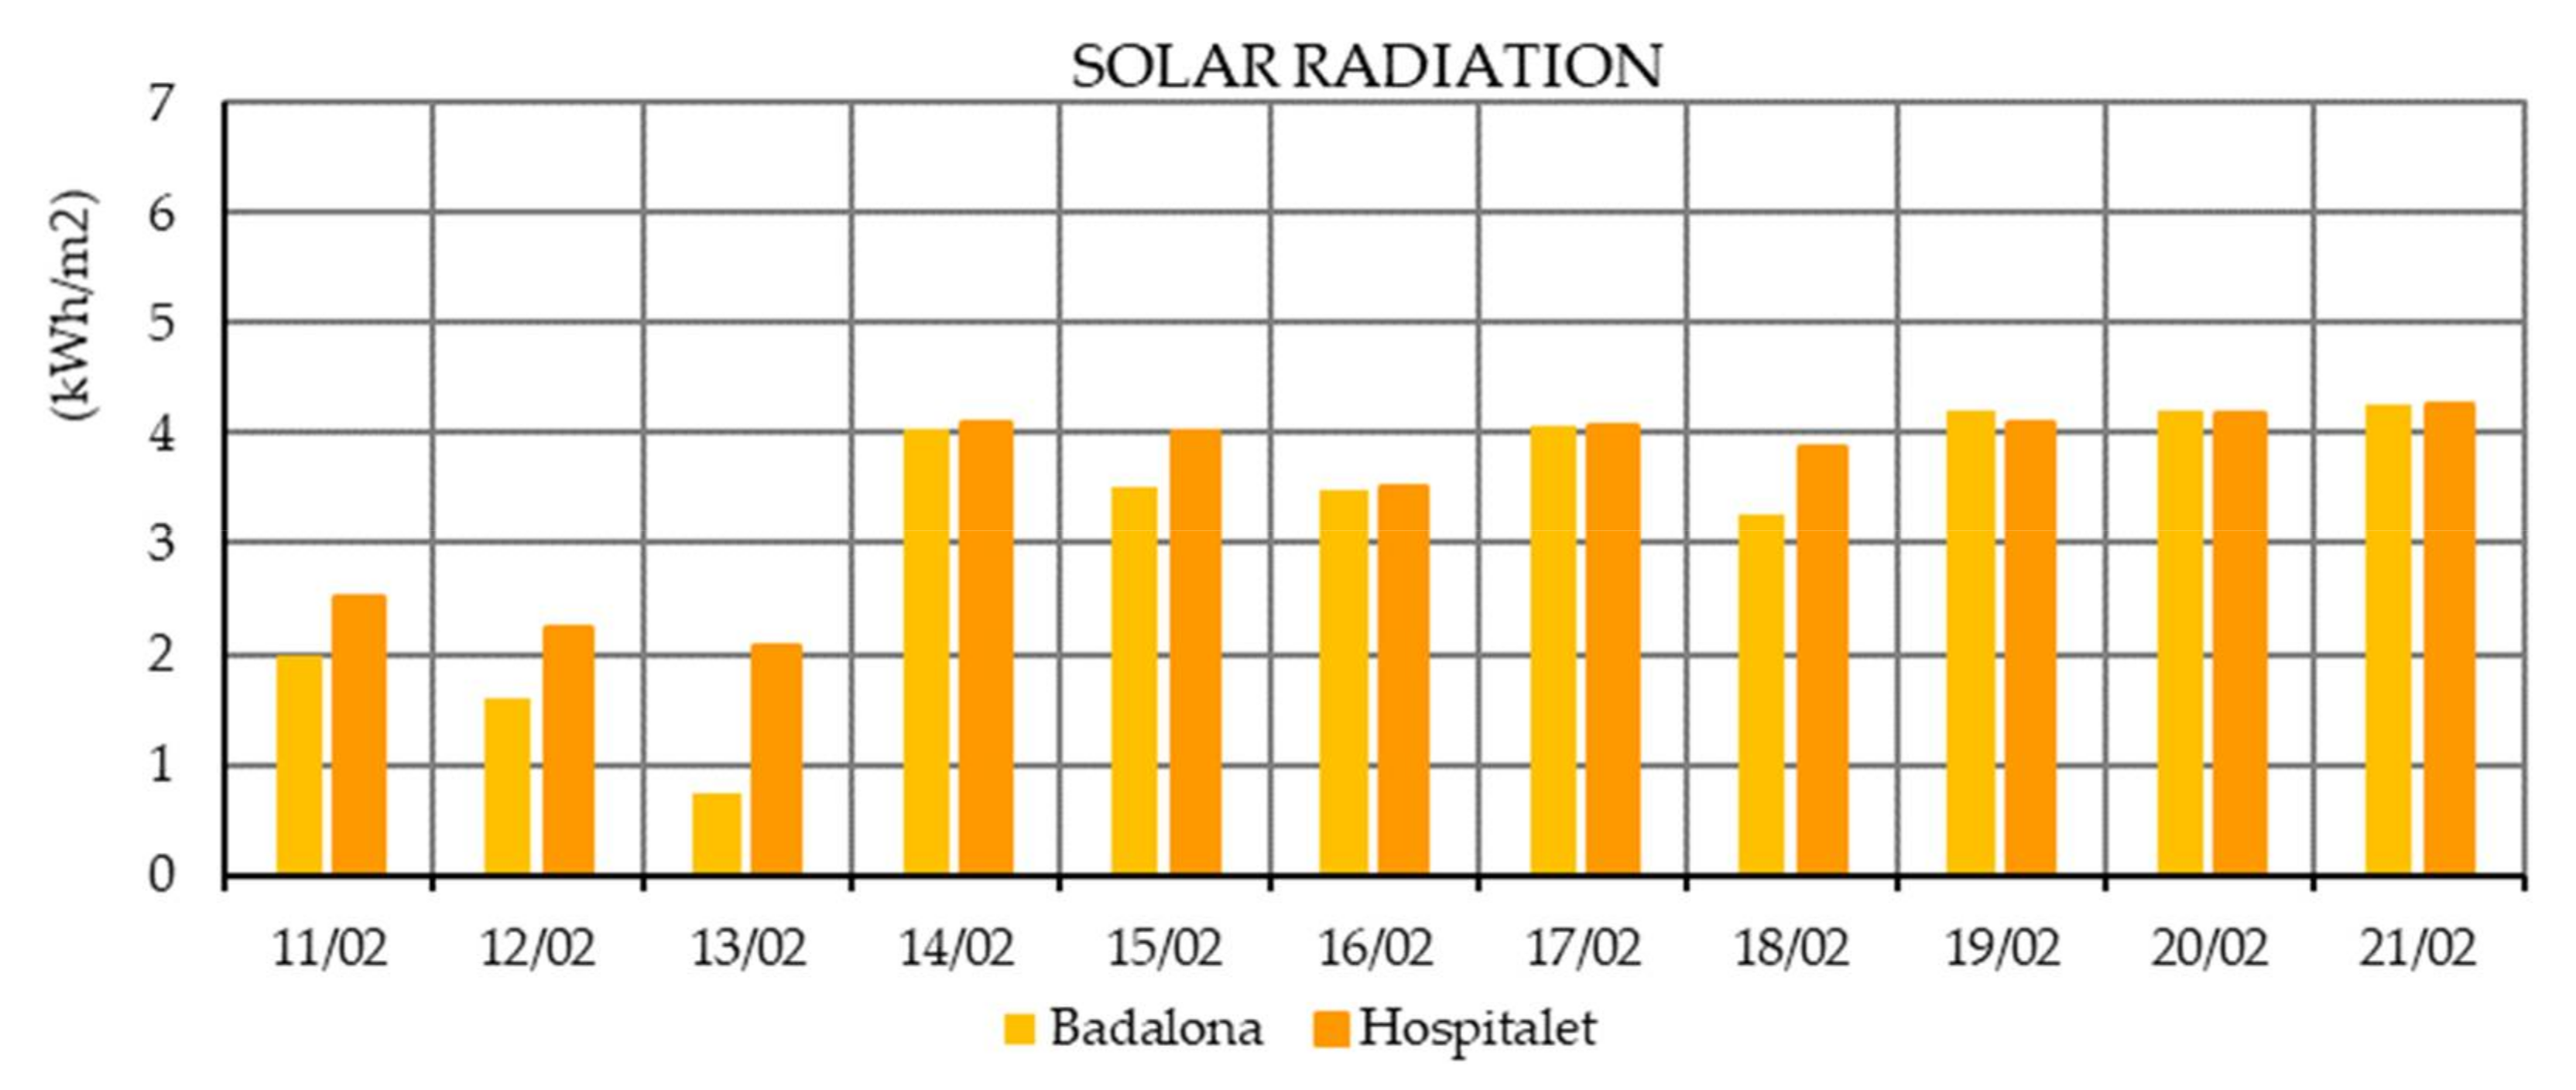
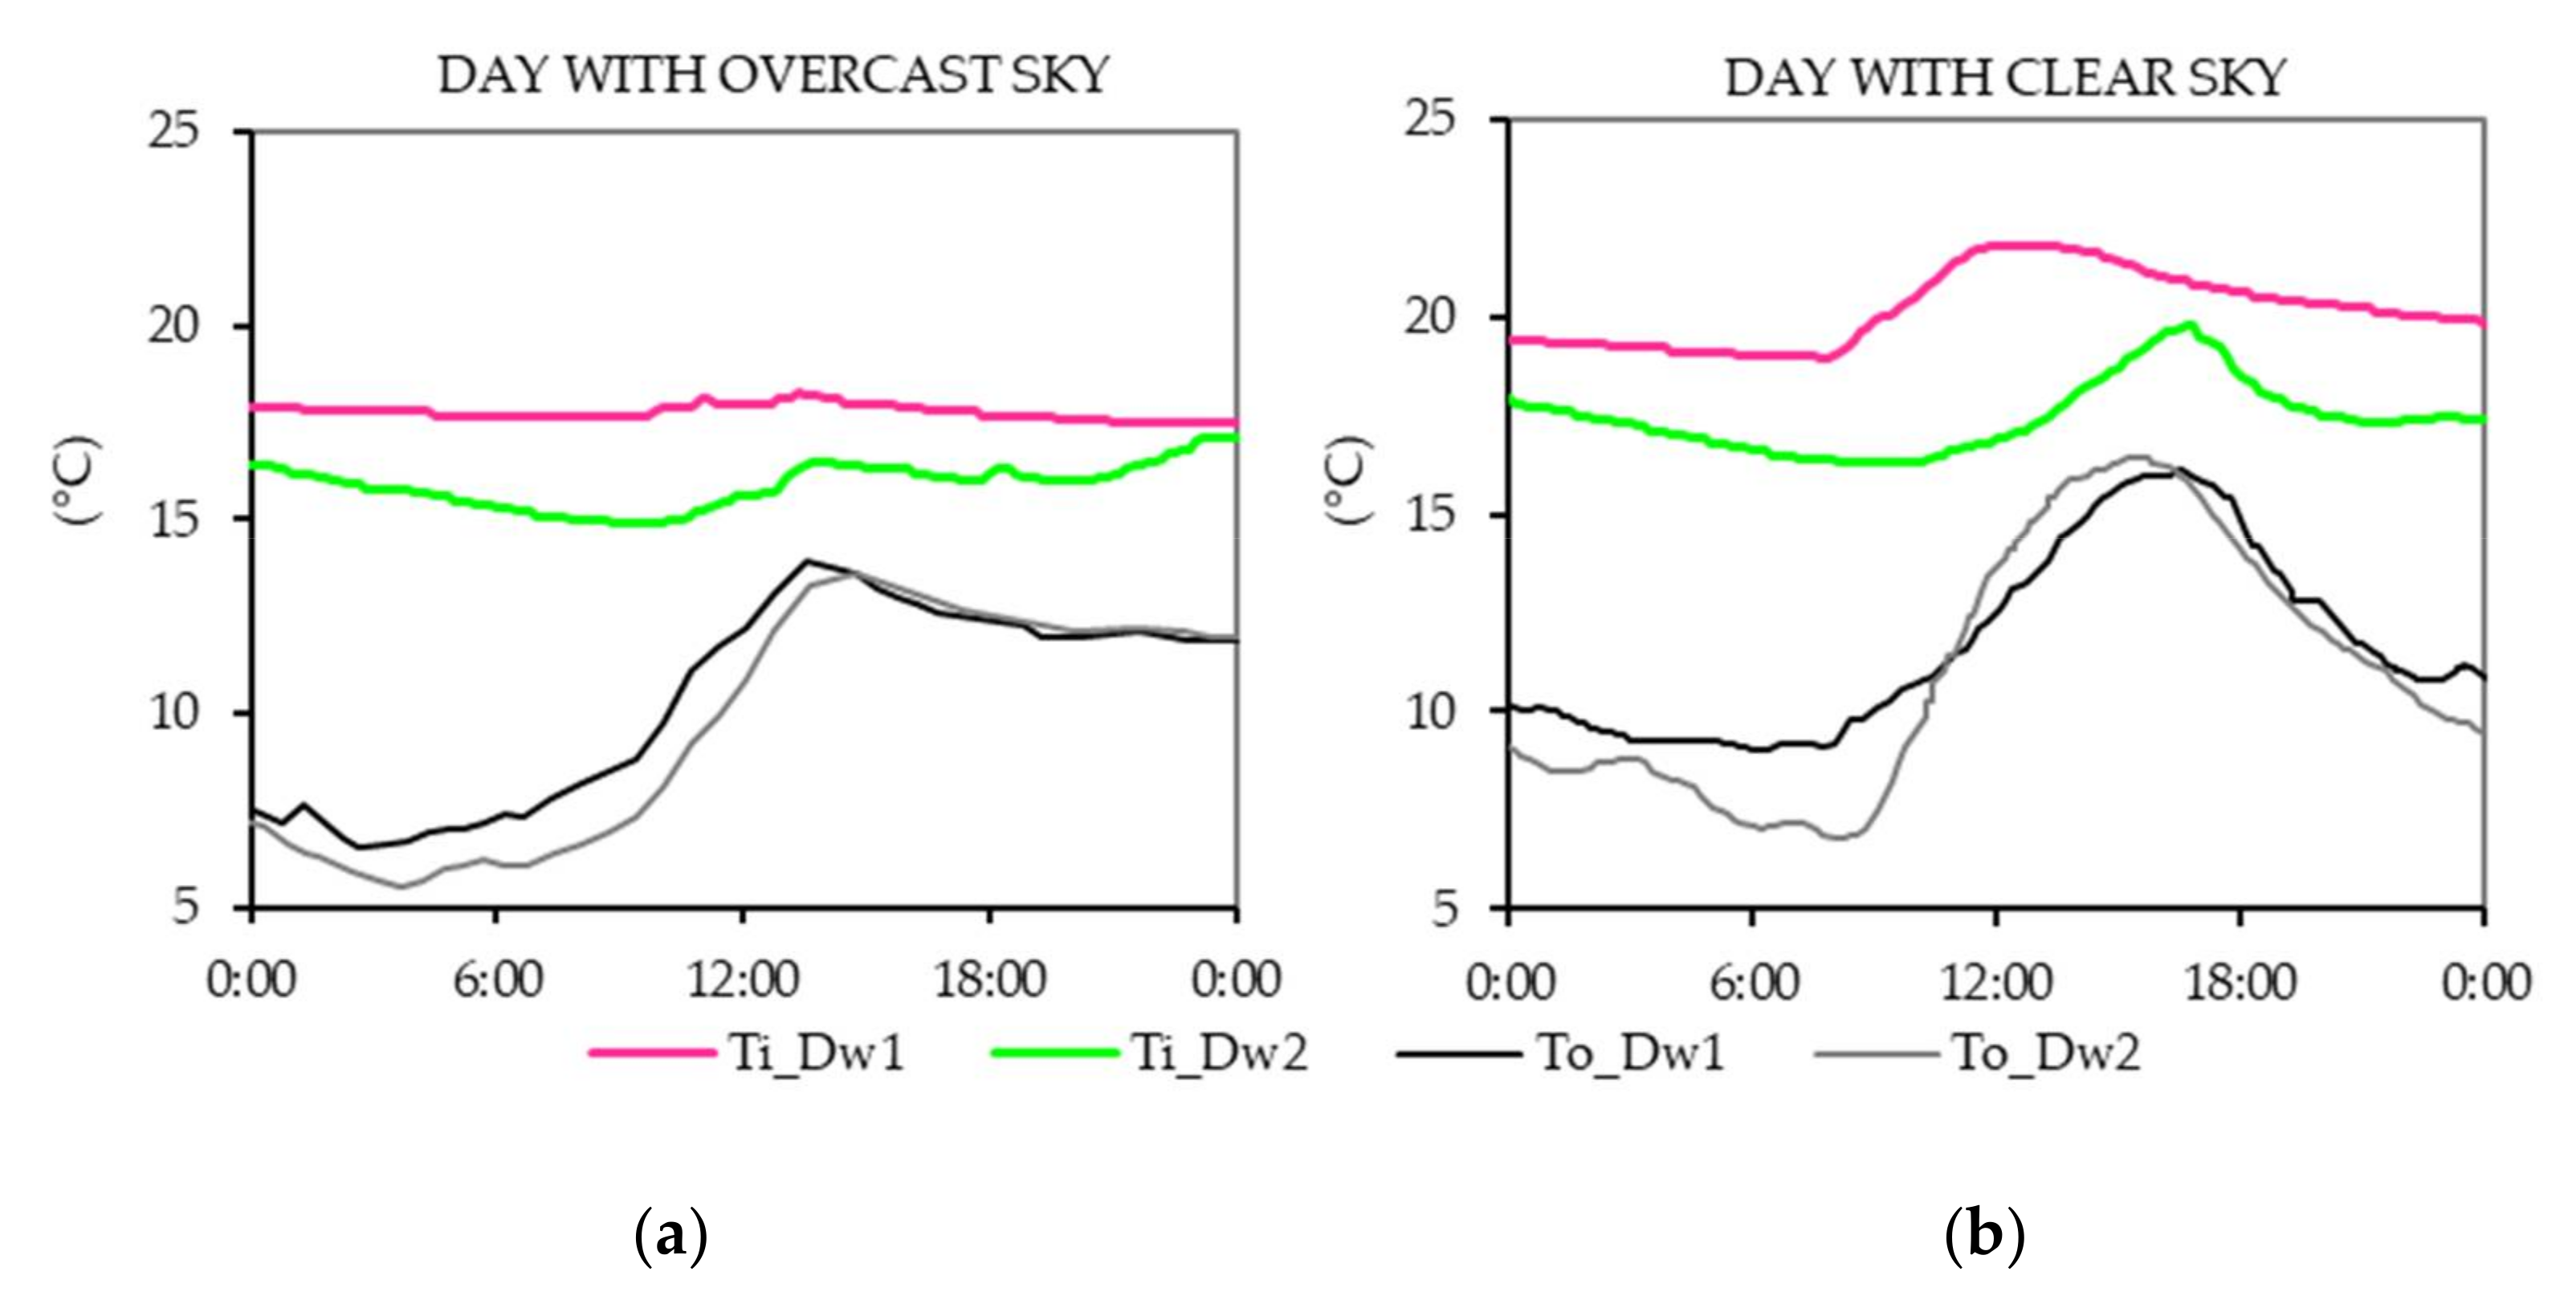
3.1. Monitoring Results

The following results correspond to the second period of measurements, from 11–21 February. In this period both rooms were unoccupied, so the interior ambient conditions were more comparable (see Figure 5 and Figure 6).
Figure 5 shows the outdoor and indoor air temperature data of both dwellings. Figure 6 shows the daily solar radiation in the measured days, taken from two different meteorological stations. The variation of this value between these two sources in the analyzed period was around 12%.
In regard to the outdoor temperature, the collected data showed that each dwelling had a specific microclimate, despite being in the same city. Figure 5 shows that outdoor air temperature (To) was different at each site. Dw2’s outdoor temperature (To_Dw2) showed lower values than Dw1’s outdoor temperature (To_Dw1), especially in nocturnal periods. In regard to the daily average outdoor temperature, Dw2 had lower outdoor air temperatures than Dw1 in both periods (overcast days and clear sky days). During the first period, To_Dw1 was 10 °C and To_Dw2 was 9 °C, while in the second period this was 12 °C for To_Dw1 and 11.5 °C for To_Dw2.
According to these results, the indoor temperatures of both dwellings presented two periods with different behaviors. The first period, from 11–13 February, presented lower indoor temperatures, which corresponded to overcast days, and thus lower amounts of solar radiation. The second period, from 14–21 February, registered higher indoor temperatures, which corresponded to clear sky days with a higher daily solar radiation.
In the first period, Dw1 interior conditions reached a maximum temperature of 18.5 °C and a minimal of 17.5 °C, while Dw2 had a maximum temperature of 17.5 °C and a minimal of 14.5 °C. The indoor average temperature in this period was 18 °C for Dw1 and 16.8 °C for Dw2.
In the second period, Dw1 reached a maximum of 23 °C and a minimal around 18.5 °C, while Dw2 presented 20.5 °C and 16 °C, respectively. The average temperature was 20 °C for Dw1 and 17.8 °C for Dw2.
These results showed that Dw1, despite having a lower thermal resistance, had higher indoor temperatures than Dw2 during the entire time of measurements, with a few exceptions. Besides the difference in thermal transmittance, these dwellings also showed differences that impacted their thermal performance: location; orientation, which is directly correlated with the solar gains by windows (I); and building volumetric heat capacity (M).
Regarding the effect of solar radiation on both dwellings, the solar gain simulations highlighted the impact of the different orientation on the solar gains through the windows of each dwelling and, consequently, on the indoor thermal performance. Since Dw1 had a more southern orientation than Dw2, its solar gains were higher than Dw2. Moreover, Dw1 had no obstructions. Lastly, the technical inspection realized in each dwelling revealed that Dw1’s building volumetric heat capacity (M) was higher than Dw2: 712.12 kJ/K·m3 vs. 562.56 kJ/K·m3. Thus, Dw1’s solar gains promoted higher indoor temperatures than Dw2, and Dw1’s thermal mass also allowed higher indoor temperatures at night than Dw2 because of the heat stored during the day and released at night.
In order to carry out a deeper analysis of these three factors, one day in each period was assessed: 11 February (day with overcast sky conditions) and 20 February (day with clear sky conditions). Figure 7 shows the indoor and outdoor temperatures for both dwellings on each of these days. Figure 8 displays the total daily solar gains provided by the window of each façade’s dwelling. These last values were calculated by HeliodonTM_2.6-1 [34] and Heliodon Plus software [35], which account for direct and diffuse radiation from the vertical plan in both sky conditions.
Relative to 11 February results (overcast day), To_Dw1 oscillation was 1 °C and Dw2’s was 1.6 °C. Dw1’s solar gains were 1.75 kWh/day, and Dw2’s were 1.5 kWh/day. With respect to the interior conditions, Ti_Dw1 oscillated only 0.1 °C, while Dw2’s oscillation was 1.6 °C. Furthermore, the daily average of Ti_Dw1 was 17.7 °C and Ti_Dw2 was 16.7 °C.
In regard to the 20 February results (clear sky conditions), To_Dw1 daily oscillation was 7 °C and Dw2’s was 9.5 °C. The Dw1’s solar gains reached 3.2 kWh/day and Dw2’s just 2.2 kWh/day. With respect to the interior conditions, Ti_Dw1 showed a daily oscillation of 2.9 °C and Ti_Dw2’s was 3.5 °C. Furthermore, the daily average of Ti_Dw1 reached 20.5 °C while Ti_Dw2 was 17.4 °C. According to these results, Dw2 had a lower indoor temperature and a wider daily oscillation than Dw1 on both analyzed days.
Although Dw2 was built with more modern materials and a very strict thermal transmittance coefficient (0.6 W/m2∙K), these characteristics were not sufficient to reach indoor temperatures close to or above 20 °C on any of the analyzed days.
On the clear sky day, the higher Dw1’s solar gains and outdoor temperature contributed to an increase in Dw1’s indoor temperature above 20 °C, while Dw2’s orientation and urban context were not so advantageous. On the overcast day, when solar gains and the outdoor temperature were very similar in both dwellings, Ti_Dw2 kept lower values than Ti_Dw1. On these days, the envelope’s thermal property that made the difference was Dw1’s volumetric heat capacity (M), flattening out the heat flow fluctuations and avoiding lower indoor temperatures.
In regard to the heating load of each dwelling, both on the overcast day and the clear sky day (Figure 9), Dw2’s energy use was higher than Dw1. On the clear sky day, Dw1 did not need to turn on the heating system, while Dw2 spent 27 Wh/m3 to reach 20 °C. On the overcast day, both dwellings used the heating system and Dw1 also achieved better results: 39 Wh/m3 against 57 Wh/m3 spent in Dw2.
Somewhat paradoxically, despite Dw1 being an older building and having a higher thermal transmission than Dw2, Dw1 had a more balanced thermal performance in the winter, not just on indoor temperature but also on energy consumption. Dw1 showed a suitable configuration between the climatic issues with its building’s design. It had a larger amount of solar radiation largely due to its more southern orientation and its building volumetric heat capacity was sufficient to keep these gains during the day. Thus, Dw1 reached a mean indoor temperature close to or above 20 °C, conversely to Dw2.
Therefore, in this climate, thermal comfort conditions and a reduction in the energy demand of a building could not be achieved with just higher thermal insulation. Solar gains, outdoor temperature, and volumetric heat capacity are highlighted in this study as additional key parameters to ensure an average indoor temperature close to or higher than that established by CTE standards (20 °C), enabling low to no heating demand.

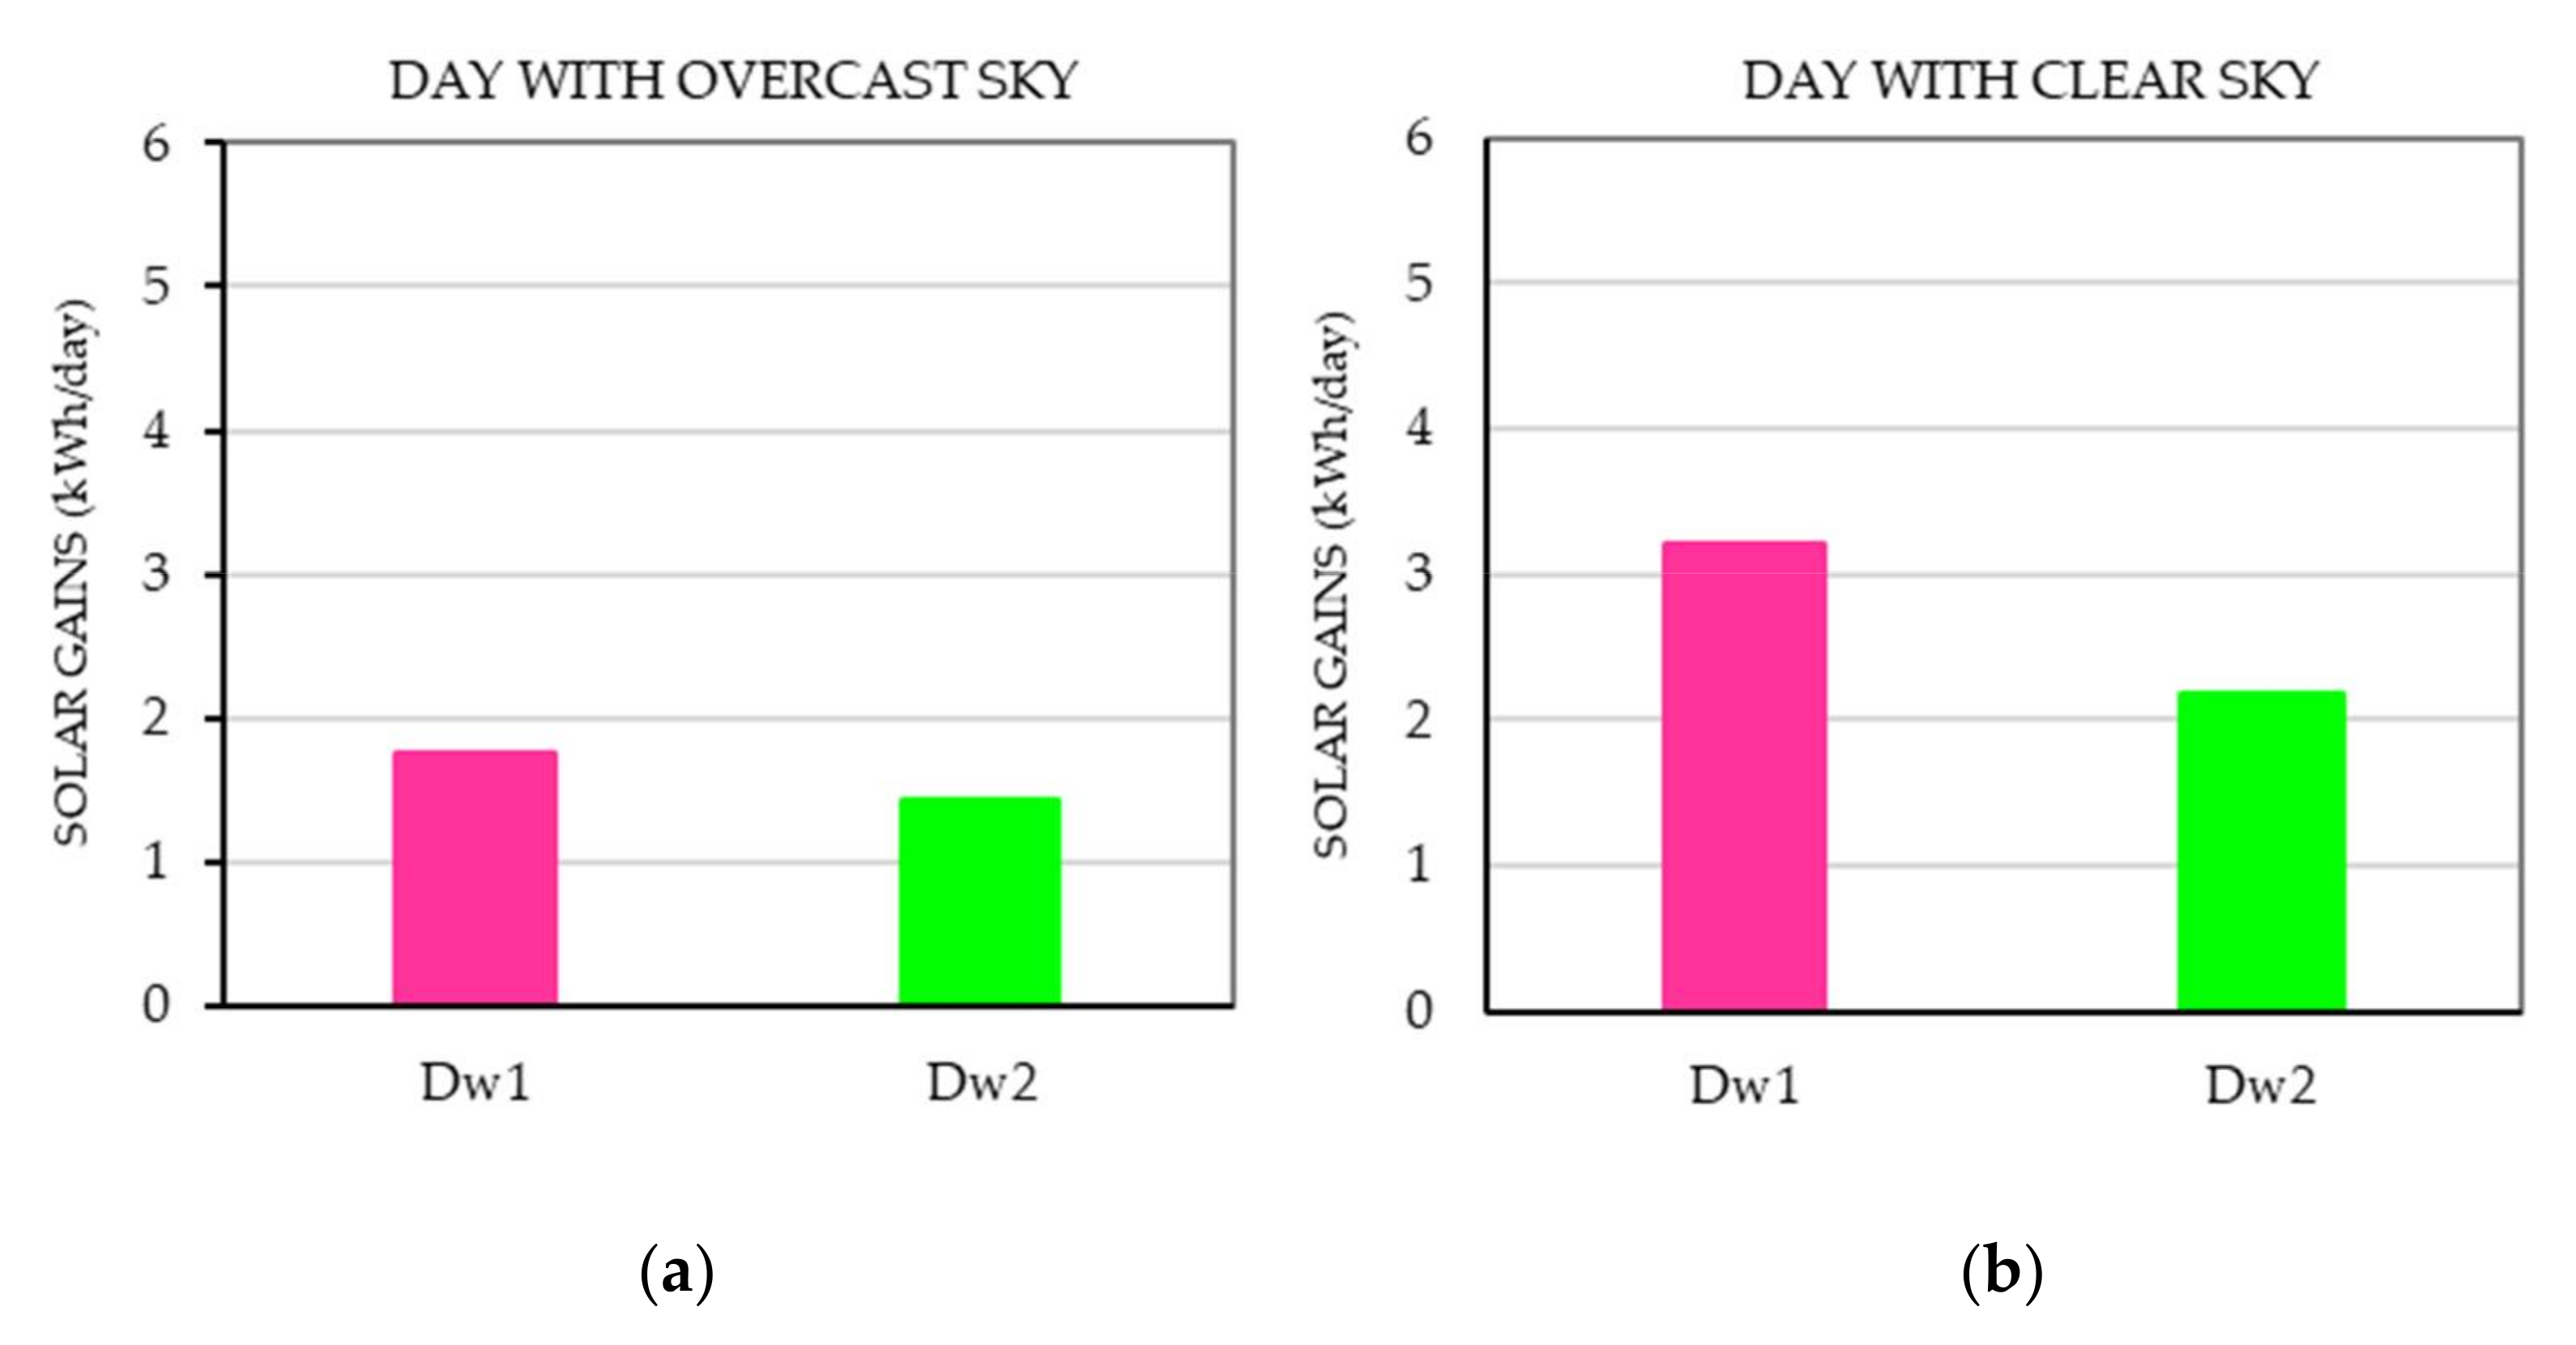
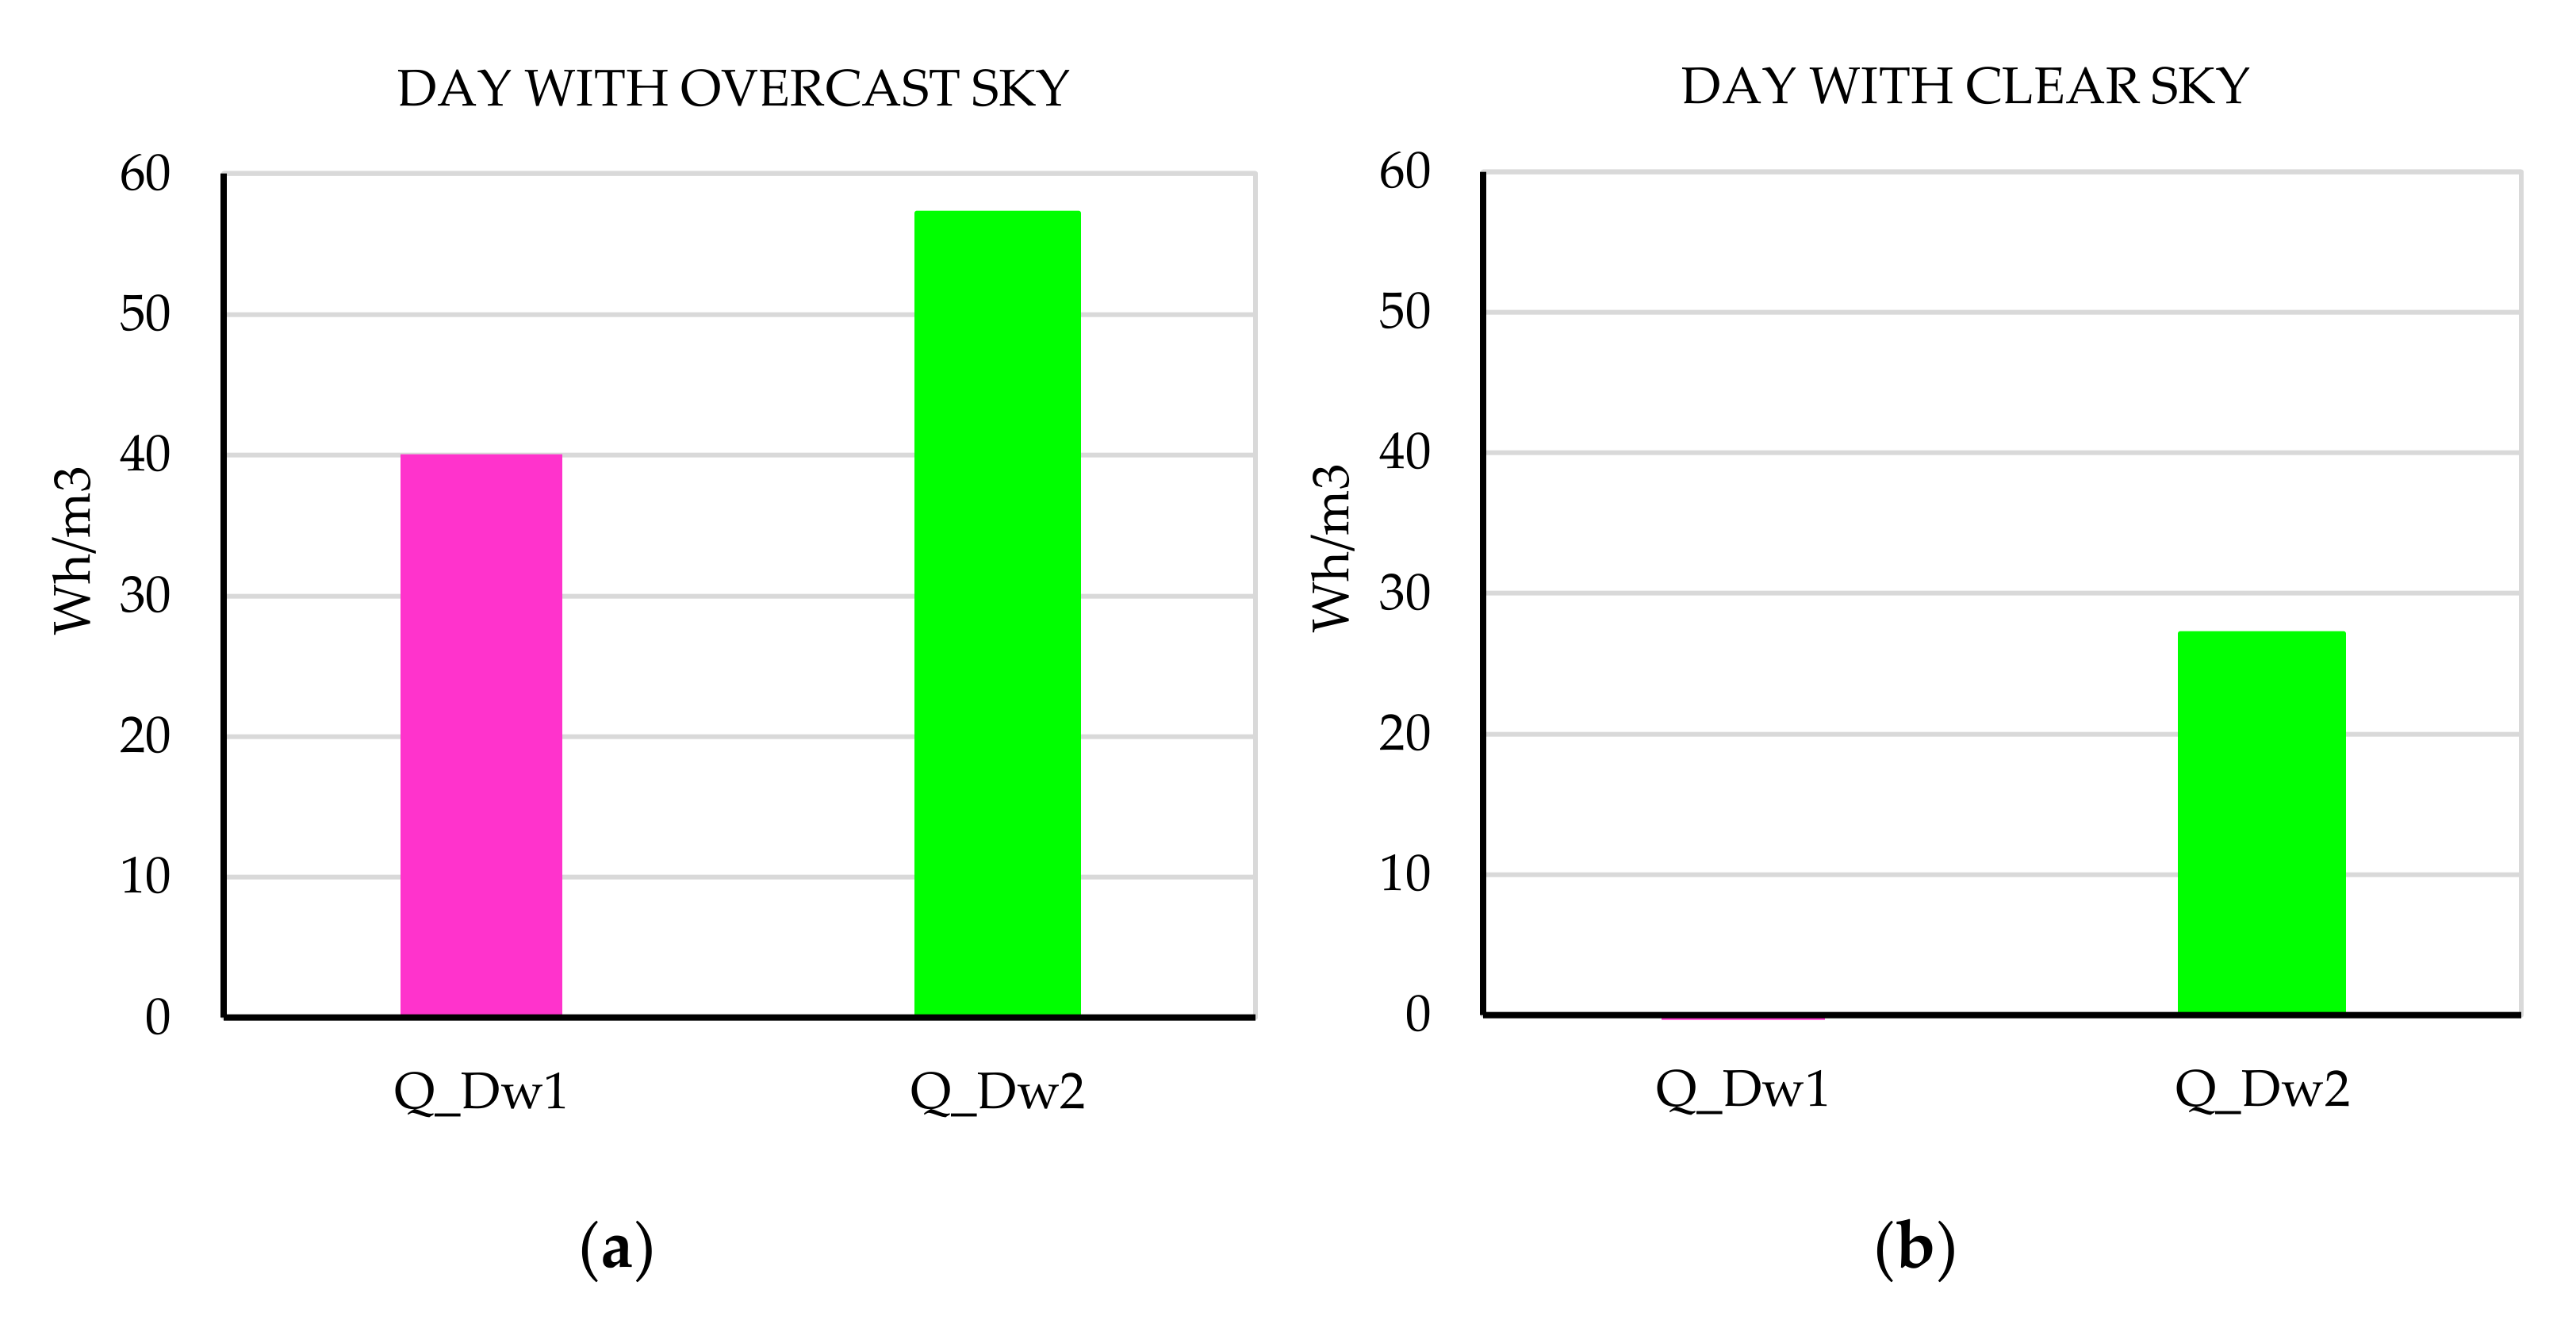
3.2. Calculation Results

With the purpose to assess the influence of the solar gains, outdoor air temperature, and the volumetric heat capacity of indoor temperature and heating loads of each space, several calculations were made using the formulas indicated in the Thermal Calculations section.
First, the calculation results were validated with the measurement data, since the purpose was to evaluate the constructive properties of each dwelling.
Figure 10 shows the daily average value and the variability of the indoor temperature measured (Ti_meas) and calculated (Ti_calc) for Dw1 and Dw2, as well as the outdoor air temperature (To) of each micro-climate. According to this figure, the calculations presented a high correlation to the measurements, both in their average and daily variability indoor temperature.
Once the calculations were validated, this method was used to assess the influence of outdoor air temperature (To), solar gains (I), and building volumetric heat capacity (M) on indoor air temperature and heating demand. Since Dw1’s performance achieved higher air temperature, these calculations were based on its features to carry out a theoretical Dw2’s performance. For this reason, these variables for Dw2 were changed to the same value as Dw1.
Figure 11 shows the calculated indoor air temperature for Dw1 and Dw2 according to the real conditions (Ti_Dw1; Ti_Dw2) and the three different configurations for Dw2, based on Dw1’s data: Dw1’s outdoor air temperature (Ti_Dw2 (same To)), Dw1’s solar gains by windows (Ti_Dw2 (same I)), and Dw1’s building volumetric heat capacity (Ti_Dw2 (same M)).
The configuration with the same outdoor temperature showed that Dw2’s mean indoor temperature (Tii_Dw2 (same Too)) increased 1.3 °C with respect to the real conditions (Ti_Dw2), from 17.1 °C to 18.4 °C. The variability decreased 0.3 °C, from 1.7 °C to 1.4 °C. However, the maximum temperature still remained below 20 °C.
The calculation with the same building volumetric heat capacity showed that Dw2’s mean indoor temperature (Ti_Dw2 (same M)) kept the same temperature than in real conditions (Ti_Dw2), 17.1 °C. However, the variability reached a smaller value, 1.0 °C. The maximum temperature again remained below 20 °C.
The last comparison, with the same solar gains by windows, demonstrated that Dw2’s mean temperature (Ti_Dw2 (same I)) increased 5.7 °C with respect to the real conditions (Ti_Dw2), from 17.1 °C to 22.8 °C. The variability increased to 2.0 °C. In this case, the indoor temperatures were above 20 °C.
According to these results, the three settings highlighted an enhancement in the performance of Dw2’s interior conditions, some in average temperature and others in variability. The increment in the outdoor temperature (To) showed a rise of 1.3 °C in Dw2’s interior temperature, and a slight reduction in its variability. The increase in the building volumetric heat capacity (M) represented only a reduction in Dw2’s variability. Finally, the increment in solar gains (I) presented the highest impact on the increase in Dw2’s interior temperature (5.7 °C).
Figure 12 shows the calculated heating demand for Dw1 and Dw2 according to the real conditions (Q_Dw1; Q_Dw2) and the three different configurations for Dw2, based on Dw1’s data: Dw1’s outdoor air temperature (Q_Dw2 (same To)), Dw1’s solar gains by windows (Q_ Dw2 (Same I)), and Dw1’s building volumetric heat capacity (Q_ Dw2 (same M)).
The configuration with the same outdoor temperature showed a slight decrease in heating demand, from 27 Wh/m3 to 23 Wh/m3, representing 18.5% of energy savings. The configuration with the same building volumetric heat capacity presented the same heating load. However, it is important to highlight that this calculation only takes into account the mean temperature. As previously stated, the increase in thermal inertia decreased the indoor temperature’s oscillation, and probably decreased the energy demand. For a deeper analysis of energy demand and the thermal inertia of buildings, other calculations or simulations tools can be used in further investigations.
The last comparison, with the same solar gains by windows, demonstrated that Dw2 reached the same result of Dw1’s heating demand: zero energy demand. As the solar gains increased the indoor temperature, achieving higher values than 20 °C, it is possible to occupy this dwelling and not switch on the heating system.
As stated before, the best enhancement in the performance of Dw2 occurred with the increment in solar gains (I). These results highlight the relevance of climate issues and the necessary adaptation of a building’s thermal characteristics to further promote a reduction in energy consumption.

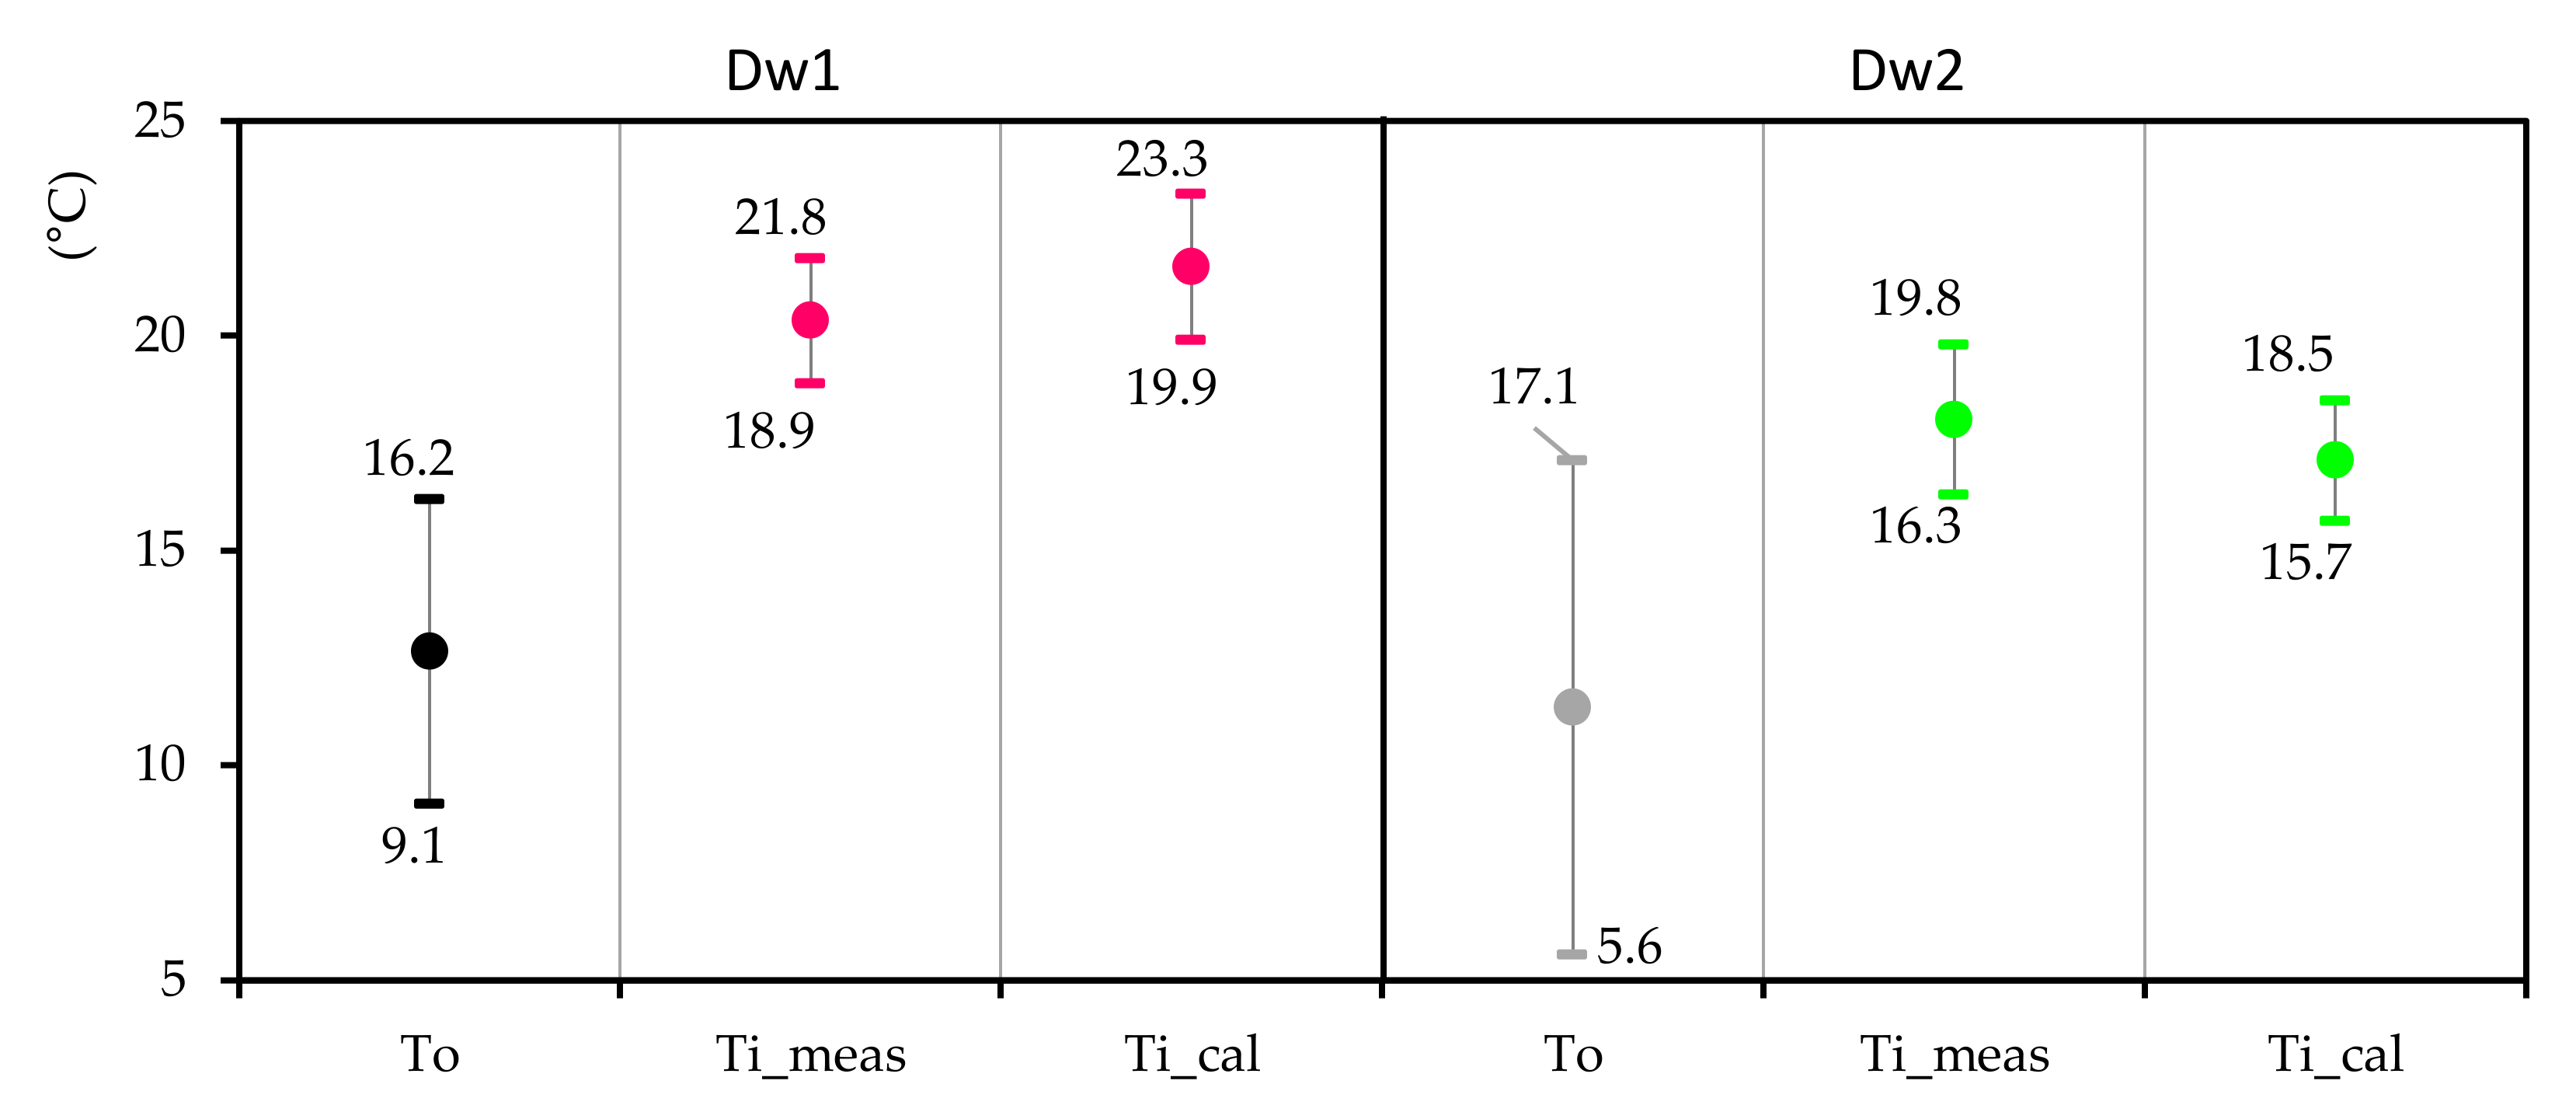
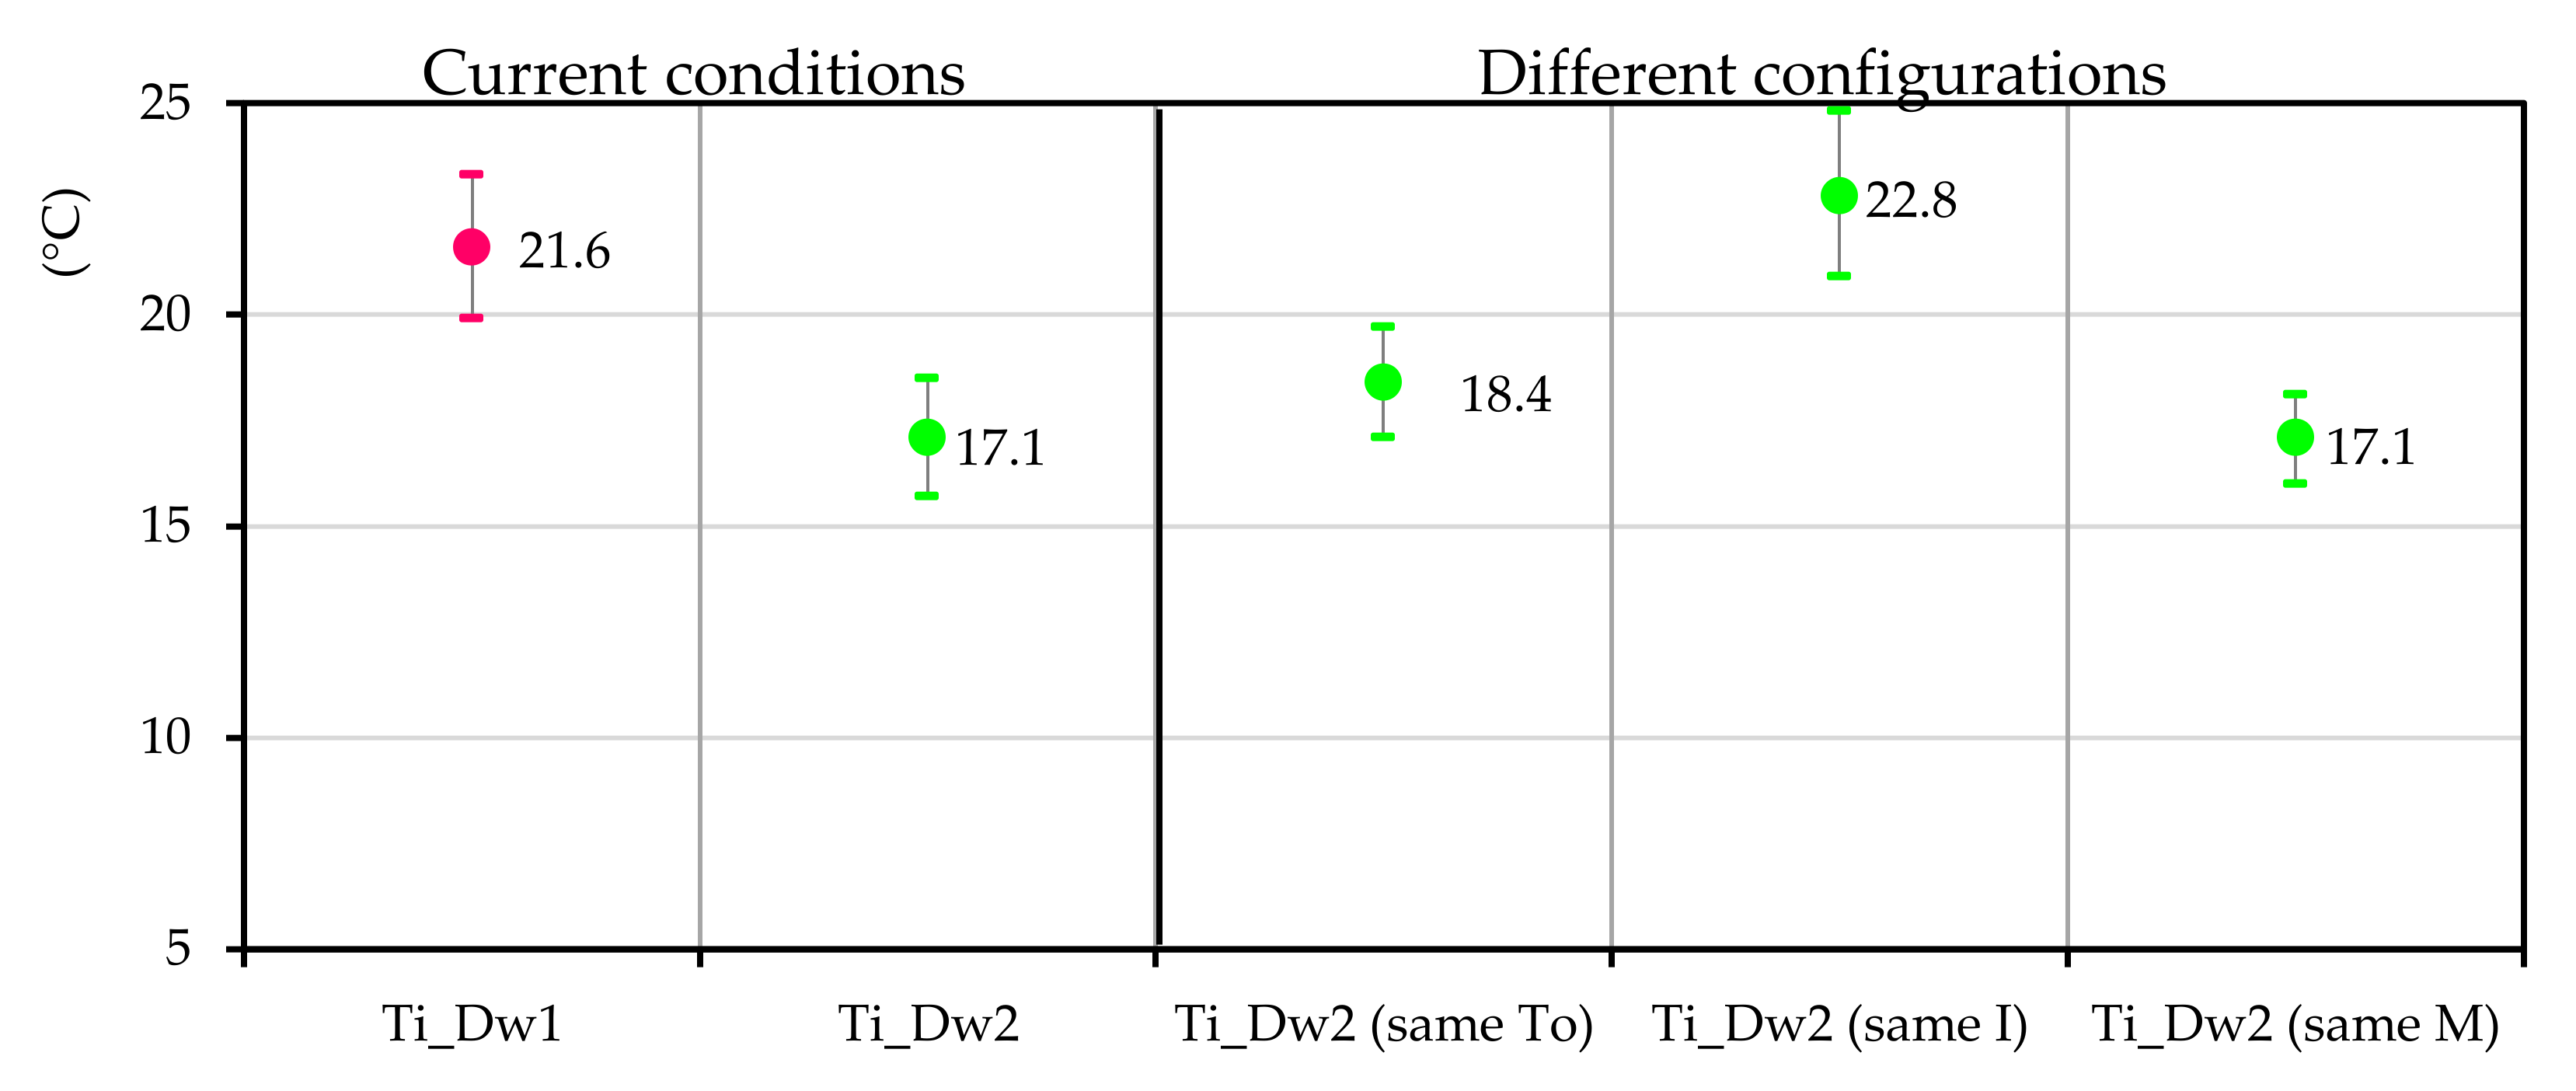
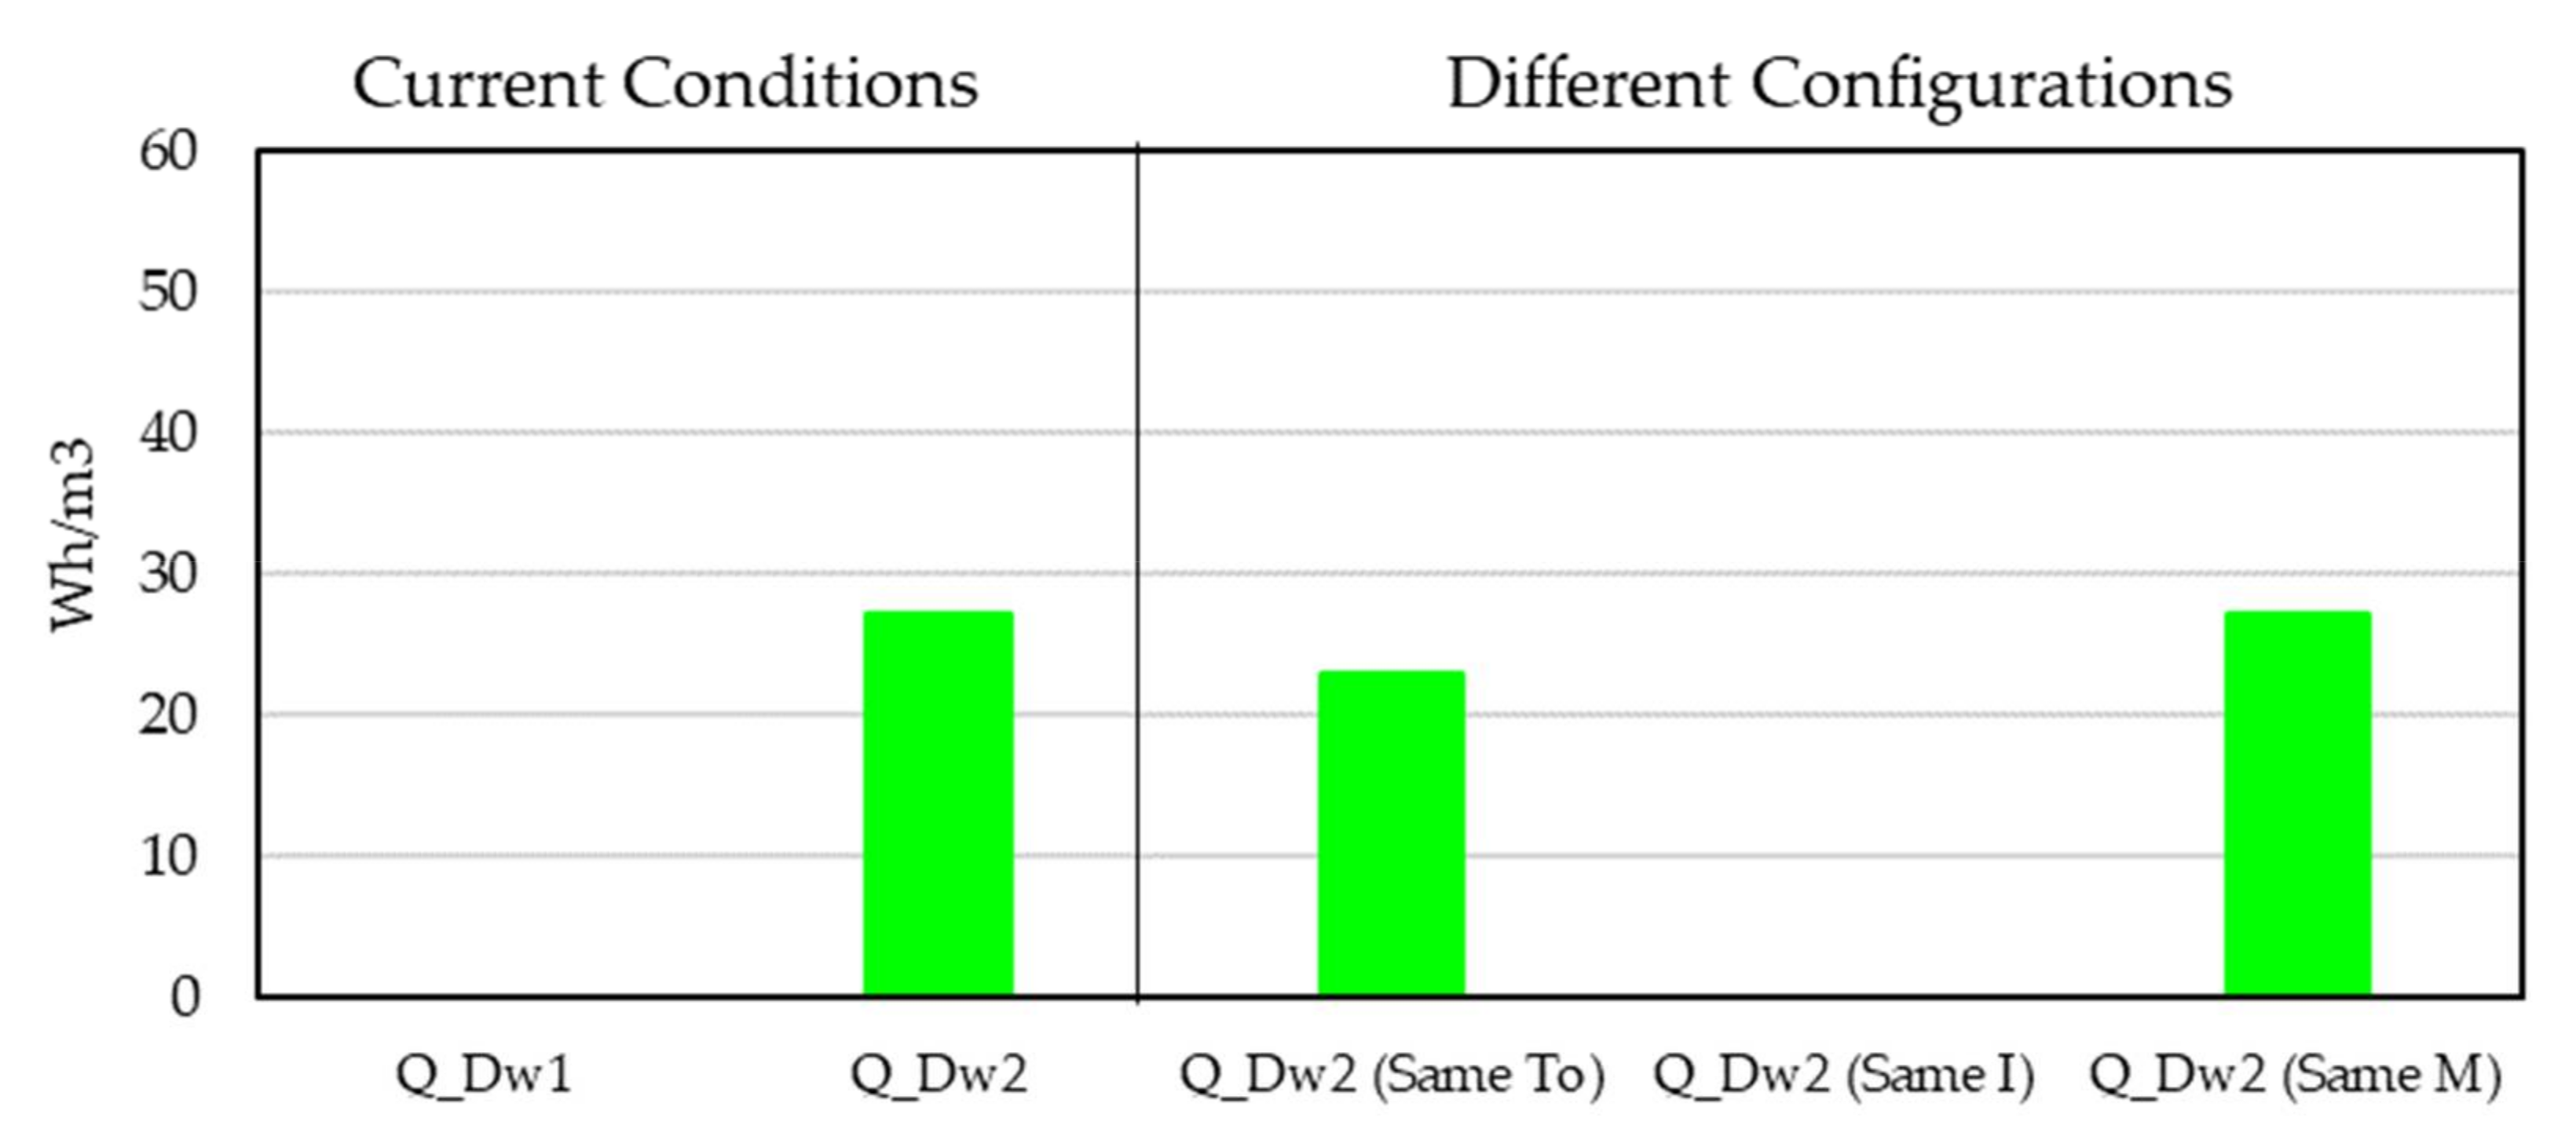
3.3. Comparison Results

According to Curado et al. [22], in Mediterranean cities such as Madrid or Barcelona the use of insulation and heating systems is mandatory to ensure comfort in residential buildings. However, this study supports that the use of insulation in Barcelona depends on orientation and solar gains. In this study, a dwelling (Dw1) with high solar gains and high thermal mass, yet with an uninsulated envelope, achieved an indoor average temperature above 20 °C in the winter season. Conversely, a dwelling (Dw2) with a highly insulated envelope, yet with low solar gains, presented an indoor temperature below 17.8 °C. Likewise, the results shown in Dw1 were very similar to those shown in Mingozzi et al. [20]. Both buildings showed an indoor temperature between 18.5 °C and 21.5 °C, approximately, in a day with clear sky conditions. However, Dw1 had a higher thermal transmittance than the building analyzed in the other study: 1.2 W/m2·K and 0.4 W/m2·K, respectively. Furthermore, in addition to the research of Yong et al. [25], this present study highlights the importance of solar gains in enhancing the indoor thermal performance of a dwelling over the use of insulating materials.

4. Conclusions

This study addresses the use of passive building strategies on non-heated spaces in Mediterranean climates in the winter season. Specifically, the investigation analyzed the impact of thermal transmittance, thermal mass, outdoor temperature, and solar gains on a building’s thermal conditions.
Throughout the analysis, the building thermal performance demonstrated that it does not mainly depend on the envelope thermal transmittance, but rather a complex system involving a set of variables. This study reveals that a suitable configuration between climatic issues and building design—solar gains, thermal insulation, and building volumetric heat capacity—is sufficient to achieve an average indoor air temperature above 20 °C even without internal gains, both on clear sky and overcast days.
The solar gains by windows were the most influential determinant on the building’s thermal performance, even more so than the building characteristics. According to the measurements and calculations, this research reveals that a dwelling with low solar gains is not enough to sustain suitable indoor air temperatures. However, depending on the amount of the solar gains, the designers may choose appropriate thermal requirements for the building envelope.
Therefore, it is important to highlight the role played by the building technical code. In this case, Spain made major changes in technical parameters, such as reducing the U-value, in an attempt to achieve better performance in buildings. This update avoids the thermal losses produced by interior gains and/or heat systems for the outdoor environment. However, in Mediterranean climates where solar gains are possible in winter, the thermal insulation approach may not be the most important parameter for achieving ideal indoor conditions.
Consequently, this study contributes to the debate of the sustainable strategies approach and building technical code updates in certain cities such as Barcelona. Indeed, one of the most effective strategies to reduce heating demand is low thermal transmittance. However, taking into account the passive house concept, this study indicates that updating codes must address a wider approach on building design strategies. These strategies or codes should consider the increase in solar gains and not only the reduction in heat losses by transmission or ventilation. This approach can ensure indoor thermal comfort without active climatization systems in winter, especially in climates with high solar radiation and moderate temperatures, such as in Mediterranean regions.

Author Contributions

Conceptualization: J.T.-Q., B.O.S., H.C. and A.I.; Measurements/Data collection: J.T.-Q. and B.O.S.; Investigation: J.T.-Q., B.O.S.; Methodology: J.T.-Q., B.O.S. and A.I.; Writing—Original Draft Preparation: J.T.-Q. and B.O.S.; Writing—Review & Editing: A.I., J.T.-Q., B.O.S.; Supervision: H.C. All authors have read and agreed to the published version of the manuscript.

Funding

This research received no external funding.

Acknowledgments

Work supported by Catholic University of Cuenca project code: DAMA-215543, Federal University of Bahia. HC + AP acknowledges the Spanish Ministry of Economy, project code: BIA2016-77675-R and PID2020-116036RB-I00.

Conflicts of Interest

The authors declare no conflict of interest.

References

  1. Thonipara, A.; Runst, P.; Ochsner, C.; Bizer, K. Energy efficiency of residential buildings in the European Union—An exploratory analysis of cross-country consumption patterns. Energy Policy 2019, 129, 1156–1167. [Google Scholar] [CrossRef] [Green Version]
  2. Allard, I.; Nair, G.; Olofsson, T. Energy performance criteria for residential buildings: A comparison of Finnish, Norwegian, Swedish, and Russian building codes. Energy Build. 2021, 250, 111276. [Google Scholar] [CrossRef]
  3. Aditya, L.; Mahlia, T.M.I.; Rismanchi, B.; Ng, H.M.; Hasan, M.H.; Metselaar, H.S.C.; Muraza, O.; Aditya, H. A review on insulation materials for energy conservation in buildings. Renew. Sustain. Energy Rev. 2017, 73, 1352–1365. [Google Scholar] [CrossRef]
  4. Gullbrekken, L.; Grynning, S.; Gaarder, J. Thermal Performance of Insulated Constructions—Experimental Studies. Buildings 2019, 9, 49. [Google Scholar] [CrossRef] [Green Version]
  5. Huang, H.; Zhou, Y.; Huang, R.; Wu, H.; Sun, Y.; Huang, G.; Xu, T. Optimum insulation thicknesses and energy conservation of building thermal insulation materials in Chinese zone of humid subtropical climate. Sustain. Cities Soc. 2019, 52, 101840. [Google Scholar] [CrossRef]
  6. D’Agostino, D.; de’Rossi, F.; Marigliano, M.; Marino, C.; Minichello, F. Evaluation of the optimal thermal insulation thickness for an office building in different climates by means of the basic and modified “cost-optimal” methodology. J. Build. Eng. 2019, 24, 100743. [Google Scholar] [CrossRef]
  7. Cabeza, L.F.; Castell, A.; Medrano, M.; Martorell, I.; Pérez, G.; Fernández, I. Experimental study on the performance of insulation materials in Mediterranean construction. Energy Build. 2010, 42, 630–636. [Google Scholar] [CrossRef]
  8. Kaynakli, O. A review of the economical and optimum thermal insulation thickness for building applications. Renew. Sustain. Energy Rev. 2012, 16, 415–425. [Google Scholar] [CrossRef]
  9. Dervishi, S.; Pashako, F.; Dushaj, X.; Dervishi, I. Energy performance optimization of traditional housing in Mediterranean climate. J. Build. Eng. 2022, 45, 103423. [Google Scholar] [CrossRef]
  10. Noailly, J. Improving the energy efficiency of buildings: The impact of environmental policy on technological innovation. Energy Econ. 2012, 34, 795–806. [Google Scholar] [CrossRef] [Green Version]
  11. Mingozzi, A.; Bottiglioni, S. Bioclimatic architecture: The case study of the sustainable residential settlement in Pieve di Cento. In Proceedings of the 2nd PALENC Conference and 28th AIVC Conference on Building Low Energy Cooling and Advanced Ventilation Technologies in the 21st Century, Crete Island, Greece, 27–29 September 2007; pp. 669–673. [Google Scholar]
  12. Código Técnico de la Edificación (CTE). Documento Básico de Ahorro de Energía (DB-HE); Gobierno de España: Madrid, Spain, 2006.
  13. Ley de Ordenación de la Edificación (LOE). Ley de Ordenación de la Edificación de España; Gobierno de España: Madrid, Spain, 1999.
  14. Ministerio de Obras Públicas y Urbanismo (MOPU). Norma Básica de la Edificación, NBE-CT-79; Gobierno de España: Madrid, Spain, 1979.
  15. Pajek, L.; Kosir, M. Strategy for achieving long-term energy efficiency of European single-family buildings through passive climate adaptation. Appl. Energy 2021, 297, 117116. [Google Scholar] [CrossRef]
  16. Olgyay, V.; Lyndon, D.; Reynolds, J. Design with Climate: Bioclimatic Approach to Architectural Regionalism; Princeton University Press: Princeton, NJ, USA, 1963. [Google Scholar]
  17. Szokolay, S. Introduction to Architectural Science: The Basis of Sustainable Design; Elsevier/Architectural Press: Oxford, UK, 2008. [Google Scholar]
  18. Deng, J.; Yao, R.; Yu, W.; Zhang, Q.; Li, B. Effectiveness of the thermal mass of external walls on residential buildings for part-time part-space heating and cooling using the state-space method. Energy Build. 2019, 190, 155–171. [Google Scholar] [CrossRef] [Green Version]
  19. Pearlmutter, D.; Meir, I. Assessing the Climatic Implications of Lightweight Housing in a Peripheral Arid Region. Build. Environ. 1995, 30, 441–451. [Google Scholar] [CrossRef]
  20. Mingozzi, A.; Bottiglioni, S.; Medola, M. Passive cooling of a bioclimatic building in the continental climate of the Padan Plain: Analysing the role of thermal mass with dynamic simulations. Int. J. Sustain. Energy 2009, 28, 141–156. [Google Scholar] [CrossRef]
  21. Suárez, R.; Fernández-Agüera, J. Retrofitting of Energy Habitability in Social Housing: A Case Study in a Mediterranean Climate. Buildings 2011, 1, 4–15. [Google Scholar] [CrossRef]
  22. Curado, A.; Freitas, V.P. Influence of thermal insulation of facades on the performance of retrofitted social housing buildings in Southern European countries. Sustain. Cities Soc. 2019, 48, 101534. [Google Scholar] [CrossRef]
  23. Fernandes, J.; Pimenta, C.; Mateus, R.; Silva, S.; Bragança, L. Contribution of Portuguese vernacular building strategies to indoor thermal comfort and occupants’ perception. Buildings 2015, 5, 1242–1264. [Google Scholar] [CrossRef] [Green Version]
  24. Suárez, F.; Fragoso, J. Estrategias pasivas de optimización energética de la vivienda social en clima mediterráneo. Inf. Constr. 2016, 68, e136. [Google Scholar] [CrossRef]
  25. Yong, S.; Kim, J.H.; Gim, Y.; Kim, J.; Cho, J.; Hong, H.; Baik, Y.J.; Koo, J. Impacts of building envelope design factors upon energy loads and their optimization in US standard climate zones using experimental design. Energy Build. 2017, 141, 1–15. [Google Scholar] [CrossRef]
  26. Archivo Municipal Districto de Nou Barris (AMDNB). Projecte as Built Edifici D’habitatges a l’illa A, dins del Pla de Millora Urbana del Sector 1, de Torre Baró; AMDNB OMA: Barcelona, Spain, 2007; 08-2007-LM-05222; 08-2009-LM-35082. [Google Scholar]
  27. Weather Company LLC. Estación Meteorológica Ibarcelo240 (Carrer dels Cortada). 2014. Available online: https://www.wunderground.com/personal-weather-station/dashboard?ID=IBARCELO240#history/s20170810/e20170810/mdaily (accessed on 24 April 2017).
  28. Weather Company LLC. Estación Meteorológica Imontcad4 (Carrer de Sant Feliu de Codines). 2014. Available online: https://www.wunderground.com/personal-weather-station/dashboard?ID=IMONTCAD4#history/s20170902/e20170909/mweek (accessed on 24 April 2017).
  29. Meteo.cat|Servei Meteorologic de Catalunya. Estació Automàtica Badalona—Museu. 2022. Available online: https://www.meteo.cat/observacions/xema/dades?codi=WU&dia=2017-02-21T00:00Z (accessed on 5 February 2022).
  30. Weather Company LLC. Estación Meteorológica Ilhospit35 (bitNap—Poligono Pedrosa—Gran Via Sur). 2014. Available online: https://www.wunderground.com/dashboard/pws/ILHOSPIT35#history (accessed on 24 April 2017).
  31. Onwuka, O. Energy heat balance for buildings—A review analysis. Int. J. Sci. Technol. Res. 2013, 2, 142–148. [Google Scholar]
  32. Palme, M.; Isalgué, A.; Coch, H.; Serra, R. Robust design: A way to control energy use from the human behaviour in architectural spaces. In Proceedings of the PLEA 2006, Geneva, Switzerland, 6–8 September 2006; pp. 632–639. [Google Scholar]
  33. Palme, M.; Isalgué, A.; Coch, H.; Serra, R. Energy Consumption and Robustness of buildings. In Proceedings of the Centre Europe towards Sustainable buildings-CESB10, Prague, Czech Republic, 30 June–2 July 2012; pp. 1–12. [Google Scholar]
  34. Beckers, B.; Masset, L. HeliodonTM_2.6-1 Software. 2003. Available online: www.heliodon.net (accessed on 27 September 2017).
  35. Nahon, R.; Muñoz, D.; Beckers, B. Heliodon Plus. 2016. Available online: www.heliodon.net (accessed on 27 September 2017).
  36. Feijó-Muñoz, J.; González-Lezcano, R.; Poza-Casado, I.; Padilla-Marco, M.; Meiss, A. Airtightness of residential buildings in the Continental area of Spain. Build. Environ. 2019, 148, 299–308. [Google Scholar] [CrossRef]
  37. Echari-Iribarren, V.; Sotos-Solano, C.; Espinosa-Fernández, A.; Prado-Govea, R. The Passivhaus standard in the Spanish Mediterranean: Evaluation of a house’s thermal behaviour of enclosures and airtightness. Sustainability 2019, 11, 3732. [Google Scholar] [CrossRef] [Green Version]
Figure 1. El Carmel district, (a) Dw1’s position and (b) the stereographic view from Dw1’s window.
Buildings 12 00325 g001
Figure 2. Torre Baró district, (a) Dw2’s position and (b) the stereographic view from Dw2’s window.
Buildings 12 00325 g002
Figure 3. (a) Dw1’s plan; (b) Dw1’s façade’s picture; (c) Dw1’s façade section and its materials.
Buildings 12 00325 g003
Figure 4. (a) Dw2’s plan; (b) Dw2’s façade’s picture; (c) Dw2’s façade section and its materials.
Buildings 12 00325 g004
Figure 5. Dw1 and Dw2 indoor and outdoor air temperature.
Buildings 12 00325 g005
Figure 6. Daily solar radiation at Barcelona from two meteorological station.
Buildings 12 00325 g006
Figure 7. Dw1 and Dw2 outdoor and indoor temperatures, (a) in overcast day, and (b) clear sky day.
Buildings 12 00325 g007
Figure 8. Dw1 (magenta) and Dw2 (green) solar gains by windows, (a) overcast day, and (b) clear sky day.
Buildings 12 00325 g008
Figure 9. Dw1 (magenta) and Dw2 (green) heating load, (a) overcast day, and (b) clear sky day.
Buildings 12 00325 g009
Figure 10. Average and daily variability of outdoor (To) and indoor temperature measured (Ti_meas) and calculated (Ti_calc) of Dw1 (magenta) and Dw2 (green), at 20 Feb (clear sky day).
Buildings 12 00325 g010
Figure 11. The calculated indoor temperature of Dw1 (magenta) and Dw2 (green) according to the current conditions (Ti_Dw1 and Ti_Dw2), and Dw2’s indoor temperature calculated with Dw1’s outdoor temperature (Ti_Dw2 (same To)), with Dw1’s solar gains by windows (Ti_Dw2 (same I)), and with Dw1’s building volumetric heat capacity (Ti_Dw2 (same M)).
Buildings 12 00325 g011
Figure 12. The calculated heating demand of Dw1 (magenta) and Dw2 (green) according to the current energy use (Q_Dw1 and Q_Dw2), and Dw2’s heating demand calculated with Dw1’s outdoor temperature (Q_(Same To)), with Dw1’s solar gains by windows (Q_Dw2 (same I)), and with Dw1’s building volumetric heat capacity (Q_Dw2 (same M)).
Buildings 12 00325 g012
Table 1. Dwelling’s buildings characteristics. Own elaboration based on data from [17].
DwellingU (W/m2∙K)M (kJ/K∙m3)WWR (%)
Dw1 (Carmel)1.20712.1227.30
Dw2 (Torre Baró)0.60562.5615.60
Publisher’s Note: MDPI stays neutral with regard to jurisdictional claims in published maps and institutional affiliations.

